Interactions among patch area, forest structure and water fluxes in a fog-inundated forest ecosystem in semi-arid Chile Olga Barbosa* ,1,2,3 , Pablo A. Marquet 2,3,4 , Leonardo D. Bacigalupe 5 , Duncan A. Christie 6 , Ek del-Val 7 , Alvaro G. Gutierrez 8 , Clive G. Jones 9 , Kathleen C. Weathers 9 and Juan J. Armesto 2,3,9 1 Instituto de Geociencias, Facultad de Ciencias, Universidad Austral de Chile, Valdivia, Chile; 2 Institute of Ecology & Biodiversity (IEB), Santiago, Chile; 3 Center for Advanced Studies in Ecology & Biodiversity (CASEB), Pontificia Universidad Cato´lica de Chile, Santiago, Chile; 4 The Santa Fe Institute, Santa Fe, New Mexico 87501, USA; 5 Instituto de Ecologı´a y Evolucio´n, Universidad Austral de Chile,Valdivia, Chile; 6 Laboratorio de Dendrocronologı´a y Ecologı´a de Bosques, Facultad de Ciencias Forestales y Recursos Naturales, Universidad Austral de Chile, Valdivia, Chile; 7 Centro de Investigaciones en Ecosistemas,Universidad Nacional Auto´noma deMe´xico, Campus Morelia, Michoaca´n, Me´xico; 8 Department of Ecological Modelling, Helmholtz Centre for Environmental Research – UFZ, Permoser Strabe 15, 04318 Leipzig, Germany; and 9 Cary Institute of Ecosystem Studies, Box AB, Millbrook, New York 12545 0128, USA Summary 1. The area or size of an ecosystem affects the acquisition, storage and redistribution of energy and matter. Patch size reduction due to natural or anthropogenic habitat loss will not only modify species distribution and patch structure but also affect the ecosystem processes that are, in part, responsible for patch persistence. 2. In a fog-dependent forest ecosystem, trees and their architectures play essential roles in captur- ing and redistributing water from collection surfaces. In this paper, we address the question of how forest patch size and structure interact to determine fog water inputs and storage in a fog-inundated, coastal ecosystem in semi-arid Chile (30ŶS). 3. Six forest patches ranging in area from 0 2 to 36 ha on a coastal mountaintop of Fray Jorge National Park were characterized using 0 1 ha plots laid down at the centre of each forest patch. In each patch, we assessed tree basal area as a measure of forest structure, recorded daily air tem- perature and humidity, measured water influx from stemflow and throughfall (water that has passed through the forest canopy). Soil and litter gravimetric water contents were used as a mea- sure of storage. 4. Total tree basal area per hectare was positively related to patch area, despite some variation at the species level. Mean and maximum air temperatures inside the patches were inversely related to patch size, with maximum temperatures differing by 2 ŶC on average. Annual fog water cap- ture by trees within forest patches (net throughfall) was estimated in 296 1 mm after rain flux (about 122 mm) was subtracted. Throughfall volume and patch area were uncorrelated, but stemflow volume, soil and litter water contents scaled positively with patch area, showing a func- tional link between water interception and ecosystem retention. 5. Our study shows that ecosystem area in this mosaic of fog-dependent temperate forest patches can modify water fluxes and storage capacity of the ecosystem. This finding has important conse- quences for fragmented landscapes, where large continuous forests are fragmented into smaller patches, affecting not only the persistence of species but also the continuity of critical ecosystem processes. Key-words: patch size, fog, ecosystem function, water cycle, temperate forest, habitat fragmen- tation *Correspondence author. E-mail: [email protected] ȑ 2010 The Authors. Journal compilation ȑ 2010 British Ecological Society Functional Ecology 2010, 24, 909–917 doi: 10.1111/j.1365-2435.2010.01697.x

Welcome message from author
This document is posted to help you gain knowledge. Please leave a comment to let me know what you think about it! Share it to your friends and learn new things together.
Transcript
Interactions among patch area, forest structure and
water fluxes in a fog-inundated forest ecosystem in
semi-arid Chile
Olga Barbosa*,1,2,3, Pablo A. Marquet2,3,4, Leonardo D. Bacigalupe5, Duncan A. Christie6,
Ek del-Val7, Alvaro G. Gutierrez8, Clive G. Jones9, Kathleen C. Weathers9 and
Juan J. Armesto2,3,9
1Instituto de Geociencias, Facultad de Ciencias, Universidad Austral de Chile, Valdivia, Chile; 2Institute of Ecology &
Biodiversity (IEB), Santiago, Chile; 3Center for Advanced Studies in Ecology & Biodiversity (CASEB), Pontificia
Universidad Catolica de Chile, Santiago, Chile; 4The Santa Fe Institute, Santa Fe, New Mexico 87501, USA; 5Instituto de
Ecologıa y Evolucion, Universidad Austral de Chile, Valdivia, Chile; 6Laboratorio de Dendrocronologıa y Ecologıa de
Bosques, Facultad de Ciencias Forestales y Recursos Naturales, Universidad Austral de Chile, Valdivia, Chile; 7Centro
de Investigaciones en Ecosistemas, Universidad Nacional Autonoma de Mexico, Campus Morelia, Michoacan, Mexico;8Department of Ecological Modelling, Helmholtz Centre for Environmental Research – UFZ, Permoser Strabe 15, 04318
Leipzig, Germany; and 9Cary Institute of Ecosystem Studies, Box AB, Millbrook, New York 12545 0128, USA
Summary
1. The area or size of an ecosystem affects the acquisition, storage and redistribution of energy
and matter. Patch size reduction due to natural or anthropogenic habitat loss will not only
modify species distribution and patch structure but also affect the ecosystem processes that are,
in part, responsible for patch persistence.
2. In a fog-dependent forest ecosystem, trees and their architectures play essential roles in captur-
ing and redistributing water from collection surfaces. In this paper, we address the question
of how forest patch size and structure interact to determine fog water inputs and storage in a
fog-inundated, coastal ecosystem in semi-arid Chile (30�S).3. Six forest patches ranging in area from 0Æ2 to 36 ha on a coastal mountaintop of Fray Jorge
National Park were characterized using 0Æ1 ha plots laid down at the centre of each forest patch.
In each patch, we assessed tree basal area as a measure of forest structure, recorded daily air tem-
perature and humidity, measured water influx from stemflow and throughfall (water that has
passed through the forest canopy). Soil and litter gravimetric water contents were used as a mea-
sure of storage.
4. Total tree basal area per hectare was positively related to patch area, despite some variation at
the species level. Mean and maximum air temperatures inside the patches were inversely related
to patch size, with maximum temperatures differing by 2 �C on average. Annual fog water cap-
ture by trees within forest patches (net throughfall) was estimated in 296Æ1 mm after rain flux
(about 122 mm) was subtracted. Throughfall volume and patch area were uncorrelated, but
stemflow volume, soil and litter water contents scaled positively with patch area, showing a func-
tional link between water interception and ecosystem retention.
5. Our study shows that ecosystem area in this mosaic of fog-dependent temperate forest patches
can modify water fluxes and storage capacity of the ecosystem. This finding has important conse-
quences for fragmented landscapes, where large continuous forests are fragmented into smaller
patches, affecting not only the persistence of species but also the continuity of critical ecosystem
processes.
Key-words: patch size, fog, ecosystem function, water cycle, temperate forest, habitat fragmen-
tation
*Correspondence author. E-mail: [email protected]
� 2010 The Authors. Journal compilation � 2010 British Ecological Society
Functional Ecology 2010, 24, 909–917 doi: 10.1111/j.1365-2435.2010.01697.x
Introduction
It is well known that the size of a biological system affects
its rates of acquisition, storage and redistribution of energy
and matter (e.g. West, Brown & Enquist 1997). At the eco-
system level, changes in area can affect ecosystem functions
such as nutrient acquisition (Polis, Anderson & Holt 1997)
and redistribution (Spencer & Warren 1996), microbial
activity and decomposition rates (Wardle et al. 1997). How-
ever, only a handful of studies have addressed the conse-
quences of the generalized decline of ecosystem area
resulting from natural or anthropogenic processes on eco-
system functions (Wardle et al. 1997; Weathers, Cadenasso
& Pickett 2001; Ewing et al. 2009; Ponette-Gonzalez,
Weathers & Curran 2009). For instance, forest clearing,
road building, farming and urban expansion have led to
major alterations to hydrological and nutrient cycles in rem-
nant forest patches (Lovett, Weathers & Sobcak 2000; Diaz,
Bigelow & Armesto 2007), to the point of altering regional
and global climate and causing water and soil pollution
problems (Chase et al. 2000; Webb et al. 2006).
Shrub and tree species have significant influences on the
hydrological cycle, mainly through the regulation of hydro-
logical inputs, outputs and redistribution within ecosystems
(Dawson 1998; Oliveira et al. 2005; Bradshaw et al. 2007).
This is achieved at two levels. First, shrub and tree canopies
intercept rain and fog, hence determining how much water
reaches the ground and infiltrates to deep soil layers (Ewing
et al. 2009). Secondly, trees and shrubs return water to the
atmosphere through evapotranspiration from exchange sur-
faces, which is one of the main predictors of ecosystem
productivity (Chapin, Matson &Mooney 2002). In addition,
while the forest canopy intercepts a substantial portion of
total precipitation, the remaining fraction is conducted to the
soil via throughfall and stemflow (Hutley et al. 1997; Ponette-
Gonzalez, Weathers & Curran 2009). Given the importance
of plants for maintaining ecosystem water balance, the
massive loss of tree biomass and canopy leaf area as a conse-
quence of a reduction in ecosystem area, through habitat
fragmentation, can lead to important alterations in the hydro-
logical cycle (Weathers 1999; Bradshaw et al. 2007; Diaz,
Bigelow&Armesto 2007).
In Mediterranean-climate and semi-arid regions, coastal
fogs are a significant source of moisture, especially during
dry summers and extended droughts. In these ecosystems,
water from fog deposition may account for 28–66% of the
total water used by woody species (Dawson 1998; Corbin
et al. 2005). In these cases, plant architecture can substan-
tially enhance water influx to a forested watershed by cap-
turing and channelling fog and rain to the soil (Hutley et al.
1997; Ponette-Gonzalez, Weathers & Curran 2009). Accord-
ingly, changes in forest structure (e.g. leaf area, vertical
stratification, branching patterns, crown biomass) could sig-
nificantly alter water inputs, especially from passing clouds
and fog (Weathers et al. 2006). Moreover, such changes can
affect other ecosystem functions, as rain and fog may deliver
essential nutrients from the atmosphere to the soil and
plants, having a direct impact on other biogeochemical cycles
(Weathers & Likens 1997; Weathers et al. 2000; Perakis &
Hedin 2002).
A striking example of a fog-inundated ecosystem occurs in
semi-arid Chile (30�S), where regionally dominant xerophytic
vegetation receives a mean annual rainfall of only 147 mm
(Lopez-Cortes & Lopez 2004). Here, fog inputs are essential
to the persistence on coastal mountaintops of a mosaic of rain
forest patches surrounded by dry shrublands (del-Val et al.
2006; Gutierrez et al. 2008). These fog-dependent rain forest
outliers are strongly dominated by the evergreen broad-
leaved tree Aextoxicon punctatum (del-Val et al. 2006), the
only member of the endemic family Aextoxicaceae. Floristi-
cally these rain forest patches are markedly similar to Valdi-
vian rain forests (0Æ2 Jaccard Index, Villagran et al. 2004)
located more than 1000 km south, in areas receiving more
than 2000 mmof rain per year.
Here we evaluated how forest patch size in this fog-depen-
dent forest mosaic can influence patch structure (measured as
tree basal area per hectare), thereby altering ecosystem water
capture and storage. In particular, we assessed four key eco-
system components in six forest patches of different areas: (i)
tree basal area as a proxy of crown size and fog intercepting
surfaces; (ii), stemflow and throughfall water inputs, as well
as overall fog water inputs outside forest patches; (iii) soil and
litter gravimetric water contents as a measure of ecosystem
water storage; and (iv) microclimatic variables such as air
temperature and relative humidity. Given that ecosystem size
affects overall tree biomass (Echeverrıa et al. 2007) and tree
biomass affects hydrological vectors and microclimate, our
working hypothesis is that water influx and storage will scale
with patch size, in relation to tree basal area.
Materials and methods
S T U D Y S I T E
Our study was conducted in Fray Jorge National Park (FJNP,
30�40¢S, 71�30¢W), where the northernmost patches of Chilean tem-
perate rain forests occur on a fog-inundated coastal terrace from 450
to 660 m elevation. A mosaic of 370 rain forest patches, ranging in
size from 0Æ1 to 36 ha, interspersed within a matrix of xerophytic
shrubland (Fig. 1), is presumably the legacy of past silvo-agricultural
use (CONAF 1992) and wetter periods during the Pleistocene (Villag-
ran et al. 2004; del-Val et al. 2006). These rain forest patches are iso-
lated by about 1000 km from their main range in south-central Chile.
The regional climate is Mediterranean-arid (Di Castri & Hajek
1976). The mean annual temperature recorded at 150 m elevation
is 13Æ6 �C with a mean annual rainfall of 147 mm (years 1983–
2003; data from Fray Jorge LTSER weather station and Lopez-
Cortes & Lopez 2004), falling predominantly (>95%) in winter
(June–August). There is substantial inter-annual variability in rain-
fall (CV = 81%) with wetter periods every 3–5 years, associated
with positive phases of ENSO and drier ones associated with nega-
tive phases (Montecinos & Aceituno 2003; Lopez-Cortes & Lopez
2004). Fog is a nearly permanent feature of the landscape above
400 m elevation, especially during spring and summer months
� 2010 The Authors. Journal compilation � 2010 British Ecological Society, Functional Ecology, 24, 909–917
910 O. Barbosa et al.
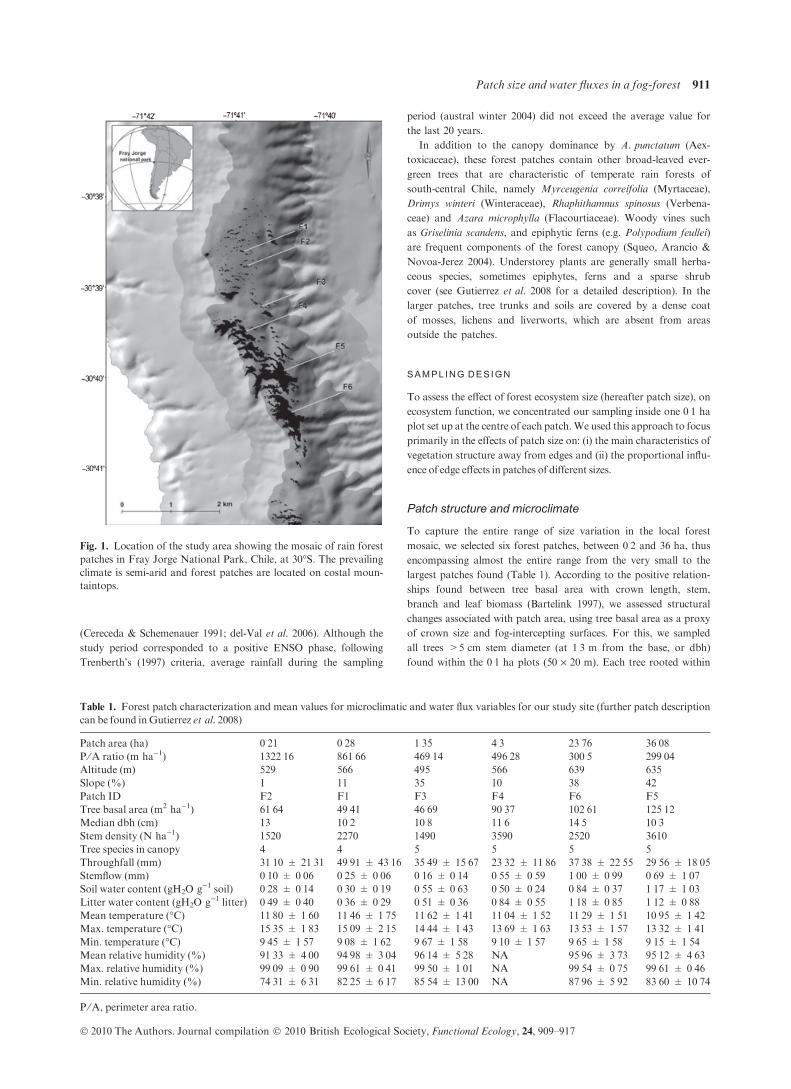
(Cereceda & Schemenauer 1991; del-Val et al. 2006). Although the
study period corresponded to a positive ENSO phase, following
Trenberth’s (1997) criteria, average rainfall during the sampling
period (austral winter 2004) did not exceed the average value for
the last 20 years.
In addition to the canopy dominance by A. punctatum (Aex-
toxicaceae), these forest patches contain other broad-leaved ever-
green trees that are characteristic of temperate rain forests of
south-central Chile, namely Myrceugenia correifolia (Myrtaceae),
Drimys winteri (Winteraceae), Rhaphithamnus spinosus (Verbena-
ceae) and Azara microphylla (Flacourtiaceae). Woody vines such
as Griselinia scandens, and epiphytic ferns (e.g. Polypodium feullei)
are frequent components of the forest canopy (Squeo, Arancio &
Novoa-Jerez 2004). Understorey plants are generally small herba-
ceous species, sometimes epiphytes, ferns and a sparse shrub
cover (see Gutierrez et al. 2008 for a detailed description). In the
larger patches, tree trunks and soils are covered by a dense coat
of mosses, lichens and liverworts, which are absent from areas
outside the patches.
S A M PL I N G D E S I G N
To assess the effect of forest ecosystem size (hereafter patch size), on
ecosystem function, we concentrated our sampling inside one 0Æ1 ha
plot set up at the centre of each patch.We used this approach to focus
primarily in the effects of patch size on: (i) the main characteristics of
vegetation structure away from edges and (ii) the proportional influ-
ence of edge effects in patches of different sizes.
Patch structure and microclimate
To capture the entire range of size variation in the local forest
mosaic, we selected six forest patches, between 0Æ2 and 36 ha, thus
encompassing almost the entire range from the very small to the
largest patches found (Table 1). According to the positive relation-
ships found between tree basal area with crown length, stem,
branch and leaf biomass (Bartelink 1997), we assessed structural
changes associated with patch area, using tree basal area as a proxy
of crown size and fog-intercepting surfaces. For this, we sampled
all trees >5 cm stem diameter (at 1Æ3 m from the base, or dbh)
found within the 0Æ1 ha plots (50 · 20 m). Each tree rooted within
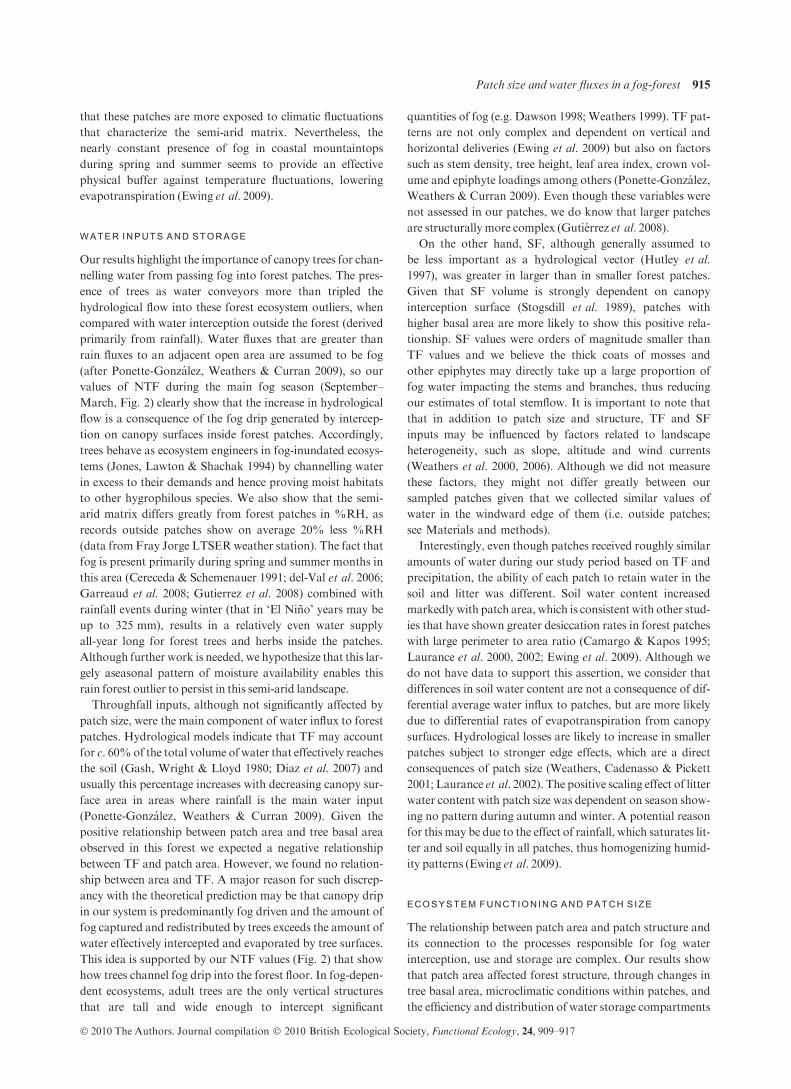
Fig. 1. Location of the study area showing the mosaic of rain forest
patches in Fray Jorge National Park, Chile, at 30�S. The prevailingclimate is semi-arid and forest patches are located on costal moun-
taintops.
Table 1. Forest patch characterization and mean values for microclimatic and water flux variables for our study site (further patch description
can be found inGutierrez et al. 2008)
Patch area (ha) 0Æ21 0Æ28 1Æ35 4Æ3 23Æ76 36Æ08P ⁄A ratio (m ha)1) 1322Æ16 861Æ66 469Æ14 496Æ28 300Æ5 299Æ04Altitude (m) 529 566 495 566 639 635
Slope (%) 1 11 35 10 38 42
Patch ID F2 F1 F3 F4 F6 F5
Tree basal area (m2 ha)1) 61Æ64 49Æ41 46Æ69 90Æ37 102Æ61 125Æ12Median dbh (cm) 13 10Æ2 10Æ8 11Æ6 14Æ5 10Æ3Stem density (N ha)1) 1520 2270 1490 3590 2520 3610
Tree species in canopy 4 4 5 5 5 5
Throughfall (mm) 31Æ10 ± 21Æ31 49Æ91 ± 43Æ16 35Æ49 ± 15Æ67 23Æ32 ± 11Æ86 37Æ38 ± 22Æ55 29Æ56 ± 18Æ05Stemflow (mm) 0Æ10 ± 0Æ06 0Æ25 ± 0Æ06 0Æ16 ± 0Æ14 0Æ55 ± 0Æ59 1Æ00 ± 0Æ99 0Æ69 ± 1Æ07Soil water content (gH2O g)1 soil) 0Æ28 ± 0Æ14 0Æ30 ± 0Æ19 0Æ55 ± 0Æ63 0Æ50 ± 0Æ24 0Æ84 ± 0Æ37 1Æ17 ± 1Æ03Litter water content (gH2O g)1 litter) 0Æ49 ± 0Æ40 0Æ36 ± 0Æ29 0Æ51 ± 0Æ36 0Æ84 ± 0Æ55 1Æ18 ± 0Æ85 1Æ12 ± 0Æ88Mean temperature (�C) 11Æ80 ± 1Æ60 11Æ46 ± 1Æ75 11Æ62 ± 1Æ41 11Æ04 ± 1Æ52 11Æ29 ± 1Æ51 10Æ95 ± 1Æ42Max. temperature (�C) 15Æ35 ± 1Æ83 15Æ09 ± 2Æ15 14Æ44 ± 1Æ43 13Æ69 ± 1Æ63 13Æ53 ± 1Æ57 13Æ32 ± 1Æ41Min. temperature (�C) 9Æ45 ± 1Æ57 9Æ08 ± 1Æ62 9Æ67 ± 1Æ58 9Æ10 ± 1Æ57 9Æ65 ± 1Æ58 9Æ15 ± 1Æ54Mean relative humidity (%) 91Æ33 ± 4Æ00 94Æ98 ± 3Æ04 96Æ14 ± 5Æ28 NA 95Æ96 ± 3Æ73 95Æ12 ± 4Æ63Max. relative humidity (%) 99Æ09 ± 0Æ90 99Æ61 ± 0Æ41 99Æ50 ± 1Æ01 NA 99Æ54 ± 0Æ75 99Æ61 ± 0Æ46Min. relative humidity (%) 74Æ31 ± 6Æ31 82Æ25 ± 6Æ17 85Æ54 ± 13Æ00 NA 87Æ96 ± 5Æ92 83Æ60 ± 10Æ74
P ⁄A, perimeter area ratio.
� 2010 The Authors. Journal compilation � 2010 British Ecological Society, Functional Ecology, 24, 909–917
Patch size and water fluxes in a fog-forest 911
the plot was identified to species and basal area per patch was cal-
culated by adding the basal areas calculated for all individual trees
in the plot.
Air temperature (�C) and relative air humidity (%RH) were
recorded every 15 min and monthly averaged from September 2003
to August 2005, using one data logger (HOBO Pro RH ⁄Temp; Onset
Computer Corporation), per patch. Each sensor was attached to the
trunk of a tree (A. punctatum) at 1Æ5 m above the ground to represent
the conditions of the interior of the patch.
Water fluxes
We measured water influx via canopy drip (throughfall, TF) and
stemflow (SF) using six collectors per patch. All measurements
were made within the 0Æ1 ha central plot in each patch, using six
PVC funnels of 22 cm diameter connected to 10–20 L drums. Fun-
nels were placed 1 m above the ground and directly below the
crown of randomly selected A. punctatum trees with a dbh >25 cm
and an emergent position in the forest canopy. Monthly, water
drip volume was recovered from TF collectors (Stogsdill et al.
1989; Diaz, Bigelow & Armesto 2007) in each forest patch. The
water volume (litres per TF collector per month) was converted to
millimetres of precipitation equivalents (mm) by dividing the water
volume collected by the area of the upper opening of the funnel
(0Æ038 m2). SF was measured by attaching rubber collars around
the bark of the same six focal trees. Water running down the main
stem of each tree was collected in a 15-L high-density, polyethyl-
ene-lidded storage bucket. Every month we recovered water from
each SF collector. The volume of water collected (litres per SF col-
lector per month) was converted to mm by dividing it by the crown
area (m2) of each tree, estimated using the formula of an ellipse.
SF and TF volumes were collected on the last day of each month
from September 2003 to August 2005, and more frequently when
rain events occurred. We calculated net throughfall (NTF) from
fog interception as: NTF = TF ) R, where TF is throughfall and
R is rainfall. TF values recorded during the rainy season
(May–August) are considered to be rain, and during the rest of the
year (September–February) TF in excess of bulk collections (NTF)
is exclusively the product of canopy drip from fog (Ewing et al.
2009).
Water inputs from fog (and rain) outside forest patches were
estimated using passive fog collectors (hereafter fog collectors) on a
subset of four forest patches. Fog collectors were placed in the
windward edge of patches F1, F2, F3 and F5, 3 meters from the
edge, and away from tree crowns to exclude dripping (after del-Val
et al. 2006). Water volume was converted to mm by dividing the
volume collected by the fog collector’s capturing-surface area (see
description in Del-Val et al. 2006). When fog was sparse or not
present (primarily between May and August), the volume of water
collected was converted to mm by dividing the volume collected by
the fog collector’s funnel area (excluding the mesh designed to col-
lect horizontally driven droplets) in order to calculate the input of
rain. Water volume from fog collectors in the windward edge of
patches did not differ between locations (linear regression,
P = 0Æ263), indicating that these sampled forest patches sit in a
similar fog regime and that any relation between water influx and
patch size is not a product of patch location.
During the first year of our study, soil and litter water content
was determined gravimetrically every season following methods in
Robertson et al. (1999). For soil, six random samples of the first
20 cm (horizons O and A) were taken from the central plot in
each forest patch using PVC plastic cores of 15 cm length ·4Æ5 cm diameter, taken in sealed polyethylene bags and oven
dried (70 �C) in the laboratory until constant weight was
achieved. Litter water content was estimated for five random
samples of fresh litter taken from the centre of each plot and
processed as with soil samples. Soil and litter water content were
determined as the mass difference between fresh and dry samples
(divided by dry weight) and used as a measure of water storage
in the ecosystem.
S T A T I S T I C AL A N A L YS E S
Forest structure and microclimate
To characterize the relationship between forest patch area and forest
structure we used linear regressions, with patch area (hectares) as
the independent predictor of total tree basal area (m2 ha)1) per plot.
We evaluated patch size–basal area relationships for the three most
abundant tree species in the patches, A. punctatum, M. correifolia
and D. winteri. Basal area was analysed at the species level and the
patch level (all tree species pooled) and data were log10 transformed
to fulfil normality assumptions.
We calculated mean, maximum and minimum monthly air tem-
peratures (�C) within forest patches, as well as mean, maximum
and minimum monthly relative air humidity (%RH). For %RH we
excluded patch F4 (4Æ3 ha) due to repeated failures in the sensor
during our study period. The effects of area and season on micro-
climatic variables were analysed using linear models (ANCOVA)
averaging both years, as there were no significant differences
between years. Only minimum adequate models (Crawley 2002) are
presented.
Water fluxes
Water input vectors and ecosystem storage values (TF, SF, soil and
litter water content) were analysed using a linear mixed modelling
approach to evaluate the effect of area while taking into account the
nested structure of our sampling design (i.e. six samples per forest
patch). We started with a saturated specified structure for the model,
adding the fixed effects of as many covariates as possible
(i.e. area · season) and we evaluated whether or not to keep the inter-
action in the model (West, Welch & Galecki 2007). Since at present
the best way to calculate the appropriate number of degrees of free-
dom in mixed models is unclear, hypothesis testing for fixed effects
was carried out in two different ways (Baayen 2008). First, we used
Likelihood Ratio Tests (LRT) of nested models based on Maximum
Likelihood estimation. The asymptotic null distribution of the test is
a chi-square with degrees of freedom equal to the difference in the
number of parameters between the two models (West, Welch &Gale-
cki 2007). Secondly, we used a Markov chain Monte Carlo (MCMC)
sampling, where each MCMC sample contains one number for each
of the parameters in the model (Baayen 2008). We created 10 000
samples from which we obtained the posterior distribution of the
parameters. From these distributions P-values and 95% highest pos-
terior density intervals were estimated. In all cases results from LRT
did not differ fromMCMC, and thus we present the former. All vari-
ables were log10 transformed to meet normality assumptions. Note
that we decided not to evaluate the effect of the perimeter ⁄ area ratio,in addition to the direct effect of area, as both variables were – as
expected – highly correlated (rP = )0Æ95, P < 0Æ001; Quinn &
Keough 2002). We performed all the statistical analyses using R
(RDevelopment Core Team, 2008).
� 2010 The Authors. Journal compilation � 2010 British Ecological Society, Functional Ecology, 24, 909–917
912 O. Barbosa et al.
Results
P A T C H A R E A , F O R E S T S T R U C T U R E A N D
M I C R O C L I M AT E
Forest structure, defined by total basal area, differed signifi-
cantly among the forest patches sampled (Table 1). Total
basal area scaled positively with patch area (R2 = 0Æ75,b = 0Æ16 ± 0Æ04 SE, t(4) = 3Æ521, P = 0Æ024) and values
ranged from 46Æ7 m2 ha)1 in smaller patches up to
125 m2 ha)1 in larger ones. The scaling relationship differed
among the main tree species. For the dominant tree species in
all patches, A. punctatum, total basal area showed a positive
but nonsignificant trend with patch area (P = 0Æ113). ForM.
correifolia, the second most frequent species, especially in
small patches, basal area scaled negatively with patch area
(R2 = 0Æ85, b = )0Æ87 ± 0Æ16 SE, t(4) = 5Æ372,P = 0Æ005). Finally, D. winteri, which was only present in
patches larger than 4 ha, basal area showed a significant posi-
tive relationship with patch size (R2 = 0Æ88, b = 1Æ2 ± 0Æ22SE, t(4) = 5Æ399,P = 0Æ005).Regardless of size, differences in mean air temperatures
between forest patches and the surrounding semi-arid
matrix averaged 2Æ3 �C, with a maximum of 3Æ6 �C cooler in
forest patches during summer. Mean air temperature inside
patches (Table 1; see Fig. S1 in Supporting Information)
was significantly affected by patch area (b = )0Æ294 ± 0Æ09SE, F1,19 = 10Æ49, P = 0Æ004) and season (F3,19 = 53Æ60,P < 0Æ001). Forest patch area affected maximum air
temperature, with differences of 2 �C between the largest
and smallest patch sampled. This effect was dependent on
season, although in all cases the relationship was negative,
with larger patches having lower maximum air temperatures
(area · season: F3,16 = 4Æ46, P = 0Æ019). Minimum air
temperature inside patches (Table 1) was not affected by
patch area (F1,19 = 0Æ07, P = 0Æ799) but it was affected by
season (F3,19 = 73Æ71, P < 0Æ001). All air temperature vari-
ables (mean, maximum and minimum) differed between sea-
sons (Table 1), but interestingly spring temperature was
always the lowest.
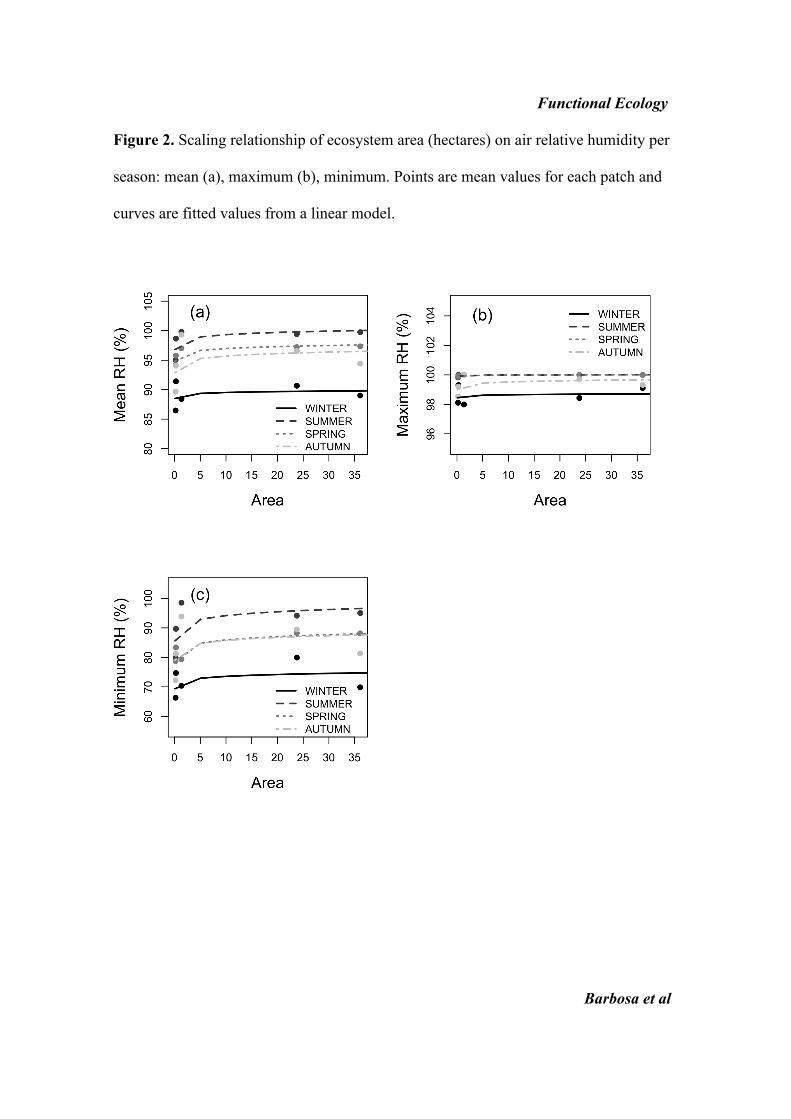
Mean values of%RH (Table 1; see Fig. S2) were positively
(but marginally) affected by forest patch area
(b = 1Æ060 ± 0Æ51 SE, F1,15 = 4Æ32, P = 0Æ055) and season
(F3,15 = 17Æ16, P < 0Æ001). Maximum %RH values were
not affected by area (F1,15 = 1Æ33, P = 0Æ268) but they wereaffected by season (F3,15 = 12Æ93, P < 0Æ001). Minimum
%RH values were affected by area (b = 3Æ36 ± 1Æ34 SE,
F1,15 = 6Æ25, P = 0Æ025) and season (F3,15 = 9Æ79,P < 0Æ001). Differences in %RH between small and large
forest patches were about 10%. For the air humidity vari-
ables, summer and spring were the wetter seasons.
W A T E R F L U X E S
Rainfall recorded during our study period (September 2003–
August 2005) averaged 122Æ9 ± 21Æ4 mm. Total water influx
to forest patches (TF + SF, including both precipitation and
fog capture; Table 1) was 480 and 357 mm respectively dur-
ing the first and second year of the study, averaging 419 mm
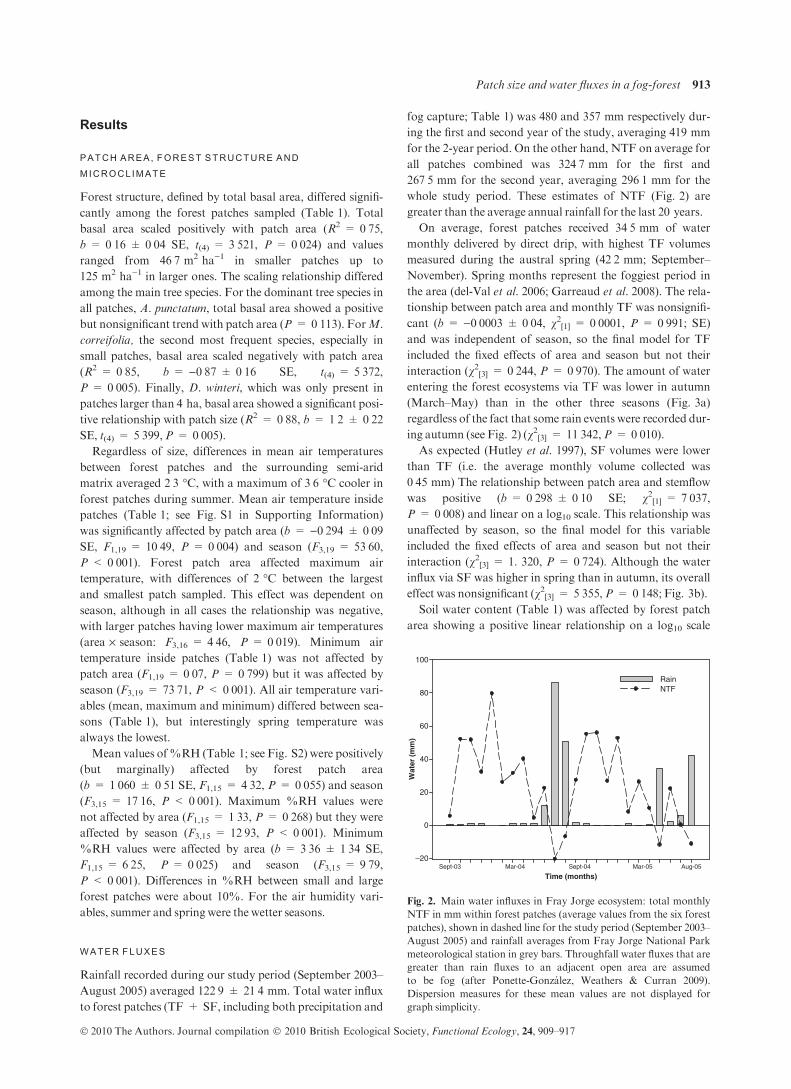
for the 2-year period. On the other hand, NTF on average for
all patches combined was 324Æ7 mm for the first and
267Æ5 mm for the second year, averaging 296Æ1 mm for the
whole study period. These estimates of NTF (Fig. 2) are
greater than the average annual rainfall for the last 20 years.
On average, forest patches received 34Æ5 mm of water
monthly delivered by direct drip, with highest TF volumes
measured during the austral spring (42Æ2 mm; September–
November). Spring months represent the foggiest period in
the area (del-Val et al. 2006; Garreaud et al. 2008). The rela-
tionship between patch area and monthly TF was nonsignifi-
cant (b = )0Æ0003 ± 0Æ04, v2[1] = 0Æ0001, P = 0Æ991; SE)and was independent of season, so the final model for TF
included the fixed effects of area and season but not their
interaction (v2[3] = 0Æ244, P = 0Æ970). The amount of water
entering the forest ecosystems via TF was lower in autumn
(March–May) than in the other three seasons (Fig. 3a)
regardless of the fact that some rain events were recorded dur-
ing autumn (see Fig. 2) (v2[3] = 11Æ342,P = 0Æ010).As expected (Hutley et al. 1997), SF volumes were lower
than TF (i.e. the average monthly volume collected was
0Æ45 mm) The relationship between patch area and stemflow
was positive (b = 0Æ298 ± 0Æ10 SE; v2[1] = 7Æ037,P = 0Æ008) and linear on a log10 scale. This relationship was
unaffected by season, so the final model for this variable
included the fixed effects of area and season but not their
interaction (v2[3] = 1. 320, P = 0Æ724). Although the water
influx via SF was higher in spring than in autumn, its overall
effect was nonsignificant (v2[3] = 5Æ355,P = 0Æ148; Fig. 3b).Soil water content (Table 1) was affected by forest patch
area showing a positive linear relationship on a log10 scale
Time (months)
Wat
er (
mm
)
–20
0
20
40
60
80
100
Rain NTF
Sept-03 Mar-04 Sept-04 Mar-05 Aug-05
Fig. 2. Main water influxes in Fray Jorge ecosystem: total monthly
NTF in mm within forest patches (average values from the six forest
patches), shown in dashed line for the study period (September 2003–
August 2005) and rainfall averages from Fray Jorge National Park
meteorological station in grey bars. Throughfall water fluxes that are
greater than rain fluxes to an adjacent open area are assumed
to be fog (after Ponette-Gonzalez, Weathers & Curran 2009).
Dispersion measures for these mean values are not displayed for
graph simplicity.
� 2010 The Authors. Journal compilation � 2010 British Ecological Society, Functional Ecology, 24, 909–917
Patch size and water fluxes in a fog-forest 913
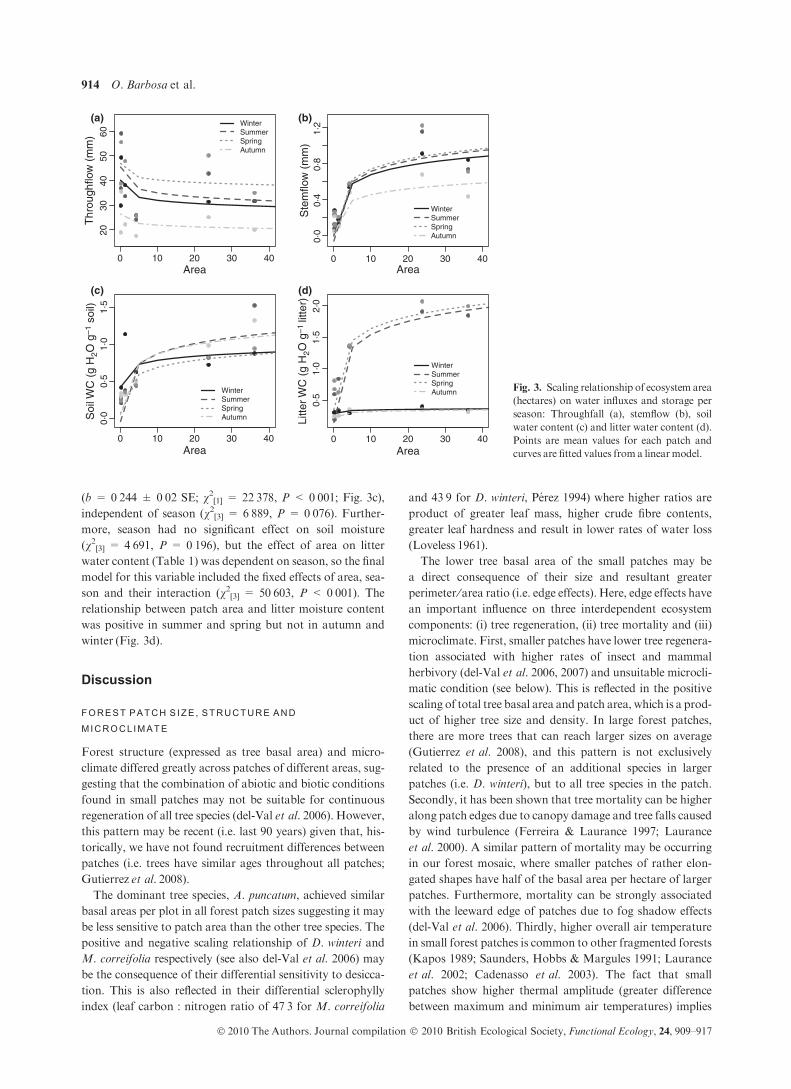
(b = 0Æ244 ± 0Æ02 SE; v2[1] = 22Æ378, P < 0Æ001; Fig. 3c),independent of season (v2[3] = 6Æ889, P = 0Æ076). Further-more, season had no significant effect on soil moisture
(v2[3] = 4Æ691, P = 0Æ196), but the effect of area on litter
water content (Table 1) was dependent on season, so the final
model for this variable included the fixed effects of area, sea-
son and their interaction (v2[3] = 50Æ603, P < 0Æ001). Therelationship between patch area and litter moisture content
was positive in summer and spring but not in autumn and
winter (Fig. 3d).
Discussion
F O R E S T P A T C H S I Z E , ST R U C T U R E AN D
M I C R O C L I M AT E
Forest structure (expressed as tree basal area) and micro-
climate differed greatly across patches of different areas, sug-
gesting that the combination of abiotic and biotic conditions
found in small patches may not be suitable for continuous
regeneration of all tree species (del-Val et al. 2006). However,
this pattern may be recent (i.e. last 90 years) given that, his-
torically, we have not found recruitment differences between
patches (i.e. trees have similar ages throughout all patches;
Gutierrez et al. 2008).
The dominant tree species, A. puncatum, achieved similar
basal areas per plot in all forest patch sizes suggesting it may
be less sensitive to patch area than the other tree species. The
positive and negative scaling relationship of D. winteri and
M. correifolia respectively (see also del-Val et al. 2006) may
be the consequence of their differential sensitivity to desicca-
tion. This is also reflected in their differential sclerophylly
index (leaf carbon : nitrogen ratio of 47Æ3 for M. correifolia
and 43Æ9 for D. winteri, Perez 1994) where higher ratios are
product of greater leaf mass, higher crude fibre contents,
greater leaf hardness and result in lower rates of water loss
(Loveless 1961).
The lower tree basal area of the small patches may be
a direct consequence of their size and resultant greater
perimeter ⁄ area ratio (i.e. edge effects). Here, edge effects have
an important influence on three interdependent ecosystem
components: (i) tree regeneration, (ii) tree mortality and (iii)
microclimate. First, smaller patches have lower tree regenera-
tion associated with higher rates of insect and mammal
herbivory (del-Val et al. 2006, 2007) and unsuitable microcli-
matic condition (see below). This is reflected in the positive
scaling of total tree basal area and patch area, which is a prod-
uct of higher tree size and density. In large forest patches,
there are more trees that can reach larger sizes on average
(Gutierrez et al. 2008), and this pattern is not exclusively
related to the presence of an additional species in larger
patches (i.e. D. winteri), but to all tree species in the patch.
Secondly, it has been shown that tree mortality can be higher
along patch edges due to canopy damage and tree falls caused
by wind turbulence (Ferreira & Laurance 1997; Laurance
et al. 2000). A similar pattern of mortality may be occurring
in our forest mosaic, where smaller patches of rather elon-
gated shapes have half of the basal area per hectare of larger
patches. Furthermore, mortality can be strongly associated
with the leeward edge of patches due to fog shadow effects
(del-Val et al. 2006). Thirdly, higher overall air temperature
in small forest patches is common to other fragmented forests
(Kapos 1989; Saunders, Hobbs & Margules 1991; Laurance
et al. 2002; Cadenasso et al. 2003). The fact that small
patches show higher thermal amplitude (greater difference
between maximum and minimum air temperatures) implies
0 10 20 30 40
2030
4050
60
(a) (b)
(c) (d)
Area
Thr
ough
flow
(m
m)
WinterSummerSpringAutumn
0 10 20 30 40
0·0
0·4
0·8
1·2
Area
Ste
mflo
w (
mm
)
WinterSummerSpringAutumn
0 10 20 30 40
0·0
0·5
1·0
1·5
Area
Soi
l WC
(g
H2O
g–1
soi
l)
WinterSummerSpringAutumn
0 10 20 30 40
0·5
1·0
1·5
2·0
Area
Litte
r WC
(g
H2O
g–1
litte
r)
WinterSummerSpringAutumn Fig. 3. Scaling relationship of ecosystem area
(hectares) on water influxes and storage per
season: Throughfall (a), stemflow (b), soil
water content (c) and litter water content (d).
Points are mean values for each patch and
curves are fitted values from a linearmodel.
� 2010 The Authors. Journal compilation � 2010 British Ecological Society, Functional Ecology, 24, 909–917
914 O. Barbosa et al.
that these patches are more exposed to climatic fluctuations
that characterize the semi-arid matrix. Nevertheless, the
nearly constant presence of fog in coastal mountaintops
during spring and summer seems to provide an effective
physical buffer against temperature fluctuations, lowering
evapotranspiration (Ewing et al. 2009).
W A T E R I N P U T S A N D S T O R A GE
Our results highlight the importance of canopy trees for chan-
nelling water from passing fog into forest patches. The pres-
ence of trees as water conveyors more than tripled the
hydrological flow into these forest ecosystem outliers, when
compared with water interception outside the forest (derived
primarily from rainfall). Water fluxes that are greater than
rain fluxes to an adjacent open area are assumed to be fog
(after Ponette-Gonzalez, Weathers & Curran 2009), so our
values of NTF during the main fog season (September–
March, Fig. 2) clearly show that the increase in hydrological
flow is a consequence of the fog drip generated by intercep-
tion on canopy surfaces inside forest patches. Accordingly,
trees behave as ecosystem engineers in fog-inundated ecosys-
tems (Jones, Lawton & Shachak 1994) by channelling water
in excess to their demands and hence proving moist habitats
to other hygrophilous species. We also show that the semi-
arid matrix differs greatly from forest patches in %RH, as
records outside patches show on average 20% less %RH
(data from Fray Jorge LTSERweather station). The fact that
fog is present primarily during spring and summer months in
this area (Cereceda & Schemenauer 1991; del-Val et al. 2006;
Garreaud et al. 2008; Gutierrez et al. 2008) combined with
rainfall events during winter (that in ‘El Nino’ years may be
up to 325 mm), results in a relatively even water supply
all-year long for forest trees and herbs inside the patches.
Although further work is needed, we hypothesize that this lar-
gely aseasonal pattern of moisture availability enables this
rain forest outlier to persist in this semi-arid landscape.
Throughfall inputs, although not significantly affected by
patch size, were the main component of water influx to forest
patches. Hydrological models indicate that TF may account
for c. 60%of the total volume of water that effectively reaches
the soil (Gash, Wright & Lloyd 1980; Diaz et al. 2007) and
usually this percentage increases with decreasing canopy sur-
face area in areas where rainfall is the main water input
(Ponette-Gonzalez, Weathers & Curran 2009). Given the
positive relationship between patch area and tree basal area
observed in this forest we expected a negative relationship
between TF and patch area. However, we found no relation-
ship between area and TF. A major reason for such discrep-
ancy with the theoretical prediction may be that canopy drip
in our system is predominantly fog driven and the amount of
fog captured and redistributed by trees exceeds the amount of
water effectively intercepted and evaporated by tree surfaces.
This idea is supported by our NTF values (Fig. 2) that show
how trees channel fog drip into the forest floor. In fog-depen-
dent ecosystems, adult trees are the only vertical structures
that are tall and wide enough to intercept significant
quantities of fog (e.g. Dawson 1998; Weathers 1999). TF pat-
terns are not only complex and dependent on vertical and
horizontal deliveries (Ewing et al. 2009) but also on factors
such as stem density, tree height, leaf area index, crown vol-
ume and epiphyte loadings among others (Ponette-Gonzalez,
Weathers & Curran 2009). Even though these variables were
not assessed in our patches, we do know that larger patches
are structurally more complex (Gutierrez et al. 2008).
On the other hand, SF, although generally assumed to
be less important as a hydrological vector (Hutley et al.
1997), was greater in larger than in smaller forest patches.
Given that SF volume is strongly dependent on canopy
interception surface (Stogsdill et al. 1989), patches with
higher basal area are more likely to show this positive rela-
tionship. SF values were orders of magnitude smaller than
TF values and we believe the thick coats of mosses and
other epiphytes may directly take up a large proportion of
fog water impacting the stems and branches, thus reducing
our estimates of total stemflow. It is important to note that
that in addition to patch size and structure, TF and SF
inputs may be influenced by factors related to landscape
heterogeneity, such as slope, altitude and wind currents
(Weathers et al. 2000, 2006). Although we did not measure
these factors, they might not differ greatly between our
sampled patches given that we collected similar values of
water in the windward edge of them (i.e. outside patches;
see Materials and methods).
Interestingly, even though patches received roughly similar
amounts of water during our study period based on TF and
precipitation, the ability of each patch to retain water in the
soil and litter was different. Soil water content increased
markedly with patch area, which is consistent with other stud-
ies that have shown greater desiccation rates in forest patches
with large perimeter to area ratio (Camargo & Kapos 1995;
Laurance et al. 2000, 2002; Ewing et al. 2009). Although we
do not have data to support this assertion, we consider that
differences in soil water content are not a consequence of dif-
ferential average water influx to patches, but are more likely
due to differential rates of evapotranspiration from canopy
surfaces. Hydrological losses are likely to increase in smaller
patches subject to stronger edge effects, which are a direct
consequences of patch size (Weathers, Cadenasso & Pickett
2001; Laurance et al. 2002). The positive scaling effect of litter
water content with patch size was dependent on season show-
ing no pattern during autumn and winter. A potential reason
for this may be due to the effect of rainfall, which saturates lit-
ter and soil equally in all patches, thus homogenizing humid-
ity patterns (Ewing et al. 2009).
E C O S Y S T E M F U N C T I O N I N G A N D P A T C H S I Z E
The relationship between patch area and patch structure and
its connection to the processes responsible for fog water
interception, use and storage are complex. Our results show
that patch area affected forest structure, through changes in
tree basal area, microclimatic conditions within patches, and
the efficiency and distribution of water storage compartments
� 2010 The Authors. Journal compilation � 2010 British Ecological Society, Functional Ecology, 24, 909–917
Patch size and water fluxes in a fog-forest 915
(e.g. soil, litter). As shown in Fig. 3a,b functions involving
water capture and storage tend to stabilize after patch size has
reached 5 ha. According to studies of landscape structure in
Fray Jorge National Park (Necochea 2008), we know that for
nearly 470 patch units identified, the mean patch size is only
0Æ36 ha with a median of 0Æ04 ha. This suggests that many
forest patches in this area may be well under the minimal
conditions to sustain ecosystem functions related to hydro-
logical balance, imposing serious constraints for potential
management practices. Unfortunately, our small sample size
(i.e. only six patches) together with the great variation in size
our patches have (i.e. patches were specifically chosen to
capture the entire range of size variation in this forest, and
thus we did not sample enough in the 2–10 ha range),
prevents us from drawing definitive conclusions.
Several studies have shown that land use change, forest
clearing, replacement of diverse vegetation by monocultures,
and the proliferation of forests edges can seriously affect
water inputs and cycling within ecosystems (Weathers et al.
2000, 2006; Weathers, Cadenasso & Pickett 2001; Diaz et al.
2004); however, this is one of the first quantitative demonstra-
tion of how forest patch size affects the magnitude of hydro-
logical vectors in a strongly fog-dependent ecosystem. In a
similar manner as island area affects major ecosystem
processes (Polis, Anderson & Holt 1997; Wardle et al. 1997),
here we show that patch area in this mosaic of temperate
forest patches within a semi-arid matrix can significantly
modify water fluxes and water storage capacity of the
ecosystem. This finding has meaningful consequences for
the functioning of ecosystems, where large continuous
forests have been fragmented into smaller patches, affecting
not only the persistence of species but also through changes
in structure effect the continuity of critical ecosystem
processes.
Acknowledgements
O. Barbosa was supported by a doctoral fellowship from the A. W. Mellon
Foundation. Research was supported by FONDAP – FONDECYT 1501-0001
(CASEB) and many of the co-authors by a workshop grant from the National
Science Foundation.We thank CONAF for permission to work at FJNP. Juan
Monardez is specially thanked for field assistance. We also thank A. Abarzua,
D. Fernandez, J.P. Francois, J. Valdez, J.M. Valenzuela, T. Catalan, N. Davis
and D. Gho for help in the field, and F. Matus, C. Tejo, D. Manuschevich and
J. Larco for laboratory assistance. We thank F. Diaz, A. Beckerman, C. Fox
and two anonymous reviewers for comments that greatly improved our manu-
script. This is a contribution to the research programs of the Cary Institute of
Ecosystem Studies, Fundacion Senda Darwin and the Chilean Long-Term
Socio-Ecological Research Network (LTSER). Preparation of the paper was
funded by The Institute of Ecology and Biodiversity, Millennium Scientific
Initiative, grant P05-002 and PFB-23.
References
Baayen, R.H. (2008) Analyzing Linguistic Data: A Practical Introduction to
Statistics. CambridgeUniversity Press, Cambridge, UK.
Bartelink, H.H. (1997) Allometric relationships for biomass and leaf area of
beech (Fagus sylvaticaL).Annals of Forest Science, 54, 39–50.
Bradshaw, C.J.A., Sodhi, N.S., Peh, K.S.H. & Brook, B.W. (2007) Global
evidence that deforestation amplifies flood risk and severity in the developing
world.Global Change Biology, 13, 2379–2395.
Cadenasso, M.L., Pickett, S.T.A., Weathers, K.C. & Jones, C.G. (2003) A
framework for a theory of boundaries.BioScience, 53, 750–758.
Camargo, J.L.C. &Kapos, V. (1995) Complex edge effects on soil moisture and
microclimate in Central Amazonian forest. Journal of Tropical Ecology, 11,
205–211.
Cereceda, P. & Schemenauer, R.S. (1991) The occurrence of fog in Chile. Jour-
nal of AppliedMeteorology, 30, 1097–1105.
Chapin, F.S., Matson, P.A. & Mooney, H.A. (2002) Terrestrial water and
energy balance.Principles of Terrestrial EcosystemEcology (eds F.S. Chapin,
P.A.Matson&H.A.Mooney), pp. 71–96, Springer Verlag, NewYork.
Chase, T.N., Pielke, R.A., Kittel, T.G.F., Nemani, R.R. & Running, S.W.
(2000) Simulated impacts of historical land cover changes on global climate
in northern winter.Climate Dynamics, 16, 93–105.
CONAF(1992)DocumentodeTrabajoNo. 161.PlandeManejoParqueNacional
Fray Jorge. Programa Patrimonio Silvestre, Conaf IVRegion de Coquimbo,
Coquimbo,Chile.
Corbin, J.D., Thomsen, M.A., Dawson, T.E. & D’Antonio, C.M. (2005)
Summer water use by California coastal prairie grasses: fog, drought, and
community composition.Oecologia, 145, 511–521.
Crawley, M.J. (2002). Statistical Computing: An Introduction to Data Analysis
Using S-Plus. JohnWiley& Sons, Chichester, UK.
Dawson, T.E. (1998) Fog in the California redwood forest: ecosystem inputs
and use by plants.Oecologia, 117, 476–485.
del-Val, E., Armesto, J.J., Barbosa, O., Christie, D.A., Gutierrez, A.G.,
Marquet, P.A., Jones, C.G. & Weathers, K.C. (2006) Rain forest islands in
the Chilean semiarid region: fog-dependency, ecosystem persistence and tree
regeneration.Ecosystems, 9, 598–608.
del-Val, E., Armesto, J.J., Barbosa, O. & Marquet, P.A. (2007) Effects of her-
bivory and patch size on tree seedling survivorship in a fog-dependent
coastal rainforest in semiarid Chile.Oecologia, 153, 625–632.
Di Castri, F. & Hajek, E.R. (1976) Bioclimatologıa de Chile, Vicerrectorıa
Academica, UniversidadCatolica d Chile, Santiago.
Diaz, M.F., Bigelow, S. & Armesto, J.J. (2007) Alteration of the hydrologic
cycle due to forest clearing and its consequences for rainforest succession.
Forest Ecology andManagement, 244, 32–40.
Echeverrıa, C., Newton, A.C., Lara, A., Benayas, J.M.R. & Coomes, D.A.
(2007) Impacts of forest fragmentation on species composition and forest
structure in the temperate landscape of southern Chile. Global Ecology and
Biogeography, 16, 426–439.
Ewing, H.A., Weathers, K.C., Templer, P.H., Dawson, T.E., Firestone,
M.K., Elliott, A.M. & Boukili, V.K.S. (2009) Fog water and ecosystem
function: heterogeneity in a California redwood forest. Ecosystems, 12,
417–433.
Ferreira, L.V. & Laurance, W.F. (1997) Effects of forest fragmentation on
mortality and damage of selected trees in central Amazonia. Conservation
Biology, 11, 797–801.
Garreaud, R., Barichivich, J., Christie, D.A. &Maldonado, A. (2008) Interan-
nual variability of the coastal fog at Fray Jorge relict forests in semiarid
Chile. Journal of Geophysical Research, 113(G04011), 1–16.
Gash, J.H.C., Wright, I.R. & Lloyd, C.R. (1980) Comparative estimates of
interception loss from three coniferous forests in Great Britain. Journal of
Hydrology, 48, 89–105.
Gutierrez, A.G., Barbosa, O., Christie, D.A., del-Val, E., Ewing, H.A., Jones,
C.G., Marquet, P.A., Weathers, K.C. & Armesto, J.J. (2008) Regeneration
patterns and persistence of the fog-dependent Fray Jorge forest in semiarid
Chile during the past two centuries.Global Change Biology, 14, 161–176.
Hutley, L.B., Doley, D., Yates, D.J. & Boonsaner, A. (1997) Water balance of
an Australian subtropical rainforest at altitude: the ecological and physio-
logical significance of intercepted cloud and fog water. Australian Journal of
Botany, 45, 311–329.
Jones, C.G., Lawton, J.H. & Shachak, M. (1994) Organisms as ecosystem
engineers.Oikos, 69, 373–386.
Kapos, V. (1989) Effects of isolation on the water status of forest patches in the
BrazilianAmazon. Journal of Tropical Ecology, 5, 173–185.
Laurance, W.F., Delamonica, P., Laurance, S.G., Vasconcelos, H.L. &
Lovejoy, T.E. (2000) Rainforest fragmentation kills big trees. Nature, 404,
836.
Laurance, W.F., Lovejoy, T.E., Vasconcelos, H.L., Bruna, E.M., Didham,
R.K., Stouffer, P.C., Gascon, C., Bierregaard, R.O., Laurance, S.G. &
Sampaio, E. (2002) Ecosystem decay of Amazonian forest fragments: a
22-year investigation.Conservation Biology, 16, 605–618.
Lopez-Cortes, F. & Lopez, D. (2004) Antecedentes bioclimaticos del Parque
Nacional Bosque Fray Jorge. Historia Natural del Parque Nacional Bosque
Fray Jorge (eds F.A. Squeo, J.R. Gutierrez & I.R. Hernandez), pp. 45–60,
Universidad de La Serena, La Serena, Chile.
� 2010 The Authors. Journal compilation � 2010 British Ecological Society, Functional Ecology, 24, 909–917
916 O. Barbosa et al.

Loveless, A.R. (1961) A nutritional interpretation of sclerophylly based on dif-
ferences in the chemical composition of sclerophyllous and mesophytic
leaves.Annals of Botany, 24, 168–176.
Lovett, G.E., Weathers, K.C. & Sobcak, W.V. (2000) Nitrogen saturation and
retention in forested watershed of the Catskill Mountains, New York.
Ecological Applications, 10, 73–84.
Montecinos, A. & Aceituno, P. (2003) Seasonality of the ENSO-related rainfall
variability in central Chile and associated circulation anomalies. Journal of
Climate, 16, 281–296.
Necochea, P. (2008) Estructura de paisaje de los bosques relictos de Neblina del
Parque Nacional Fray Jorge, IV region. Memoria de titulo, Universidad
Catolica de Chile, Santiago de Chile, Chile.
Oliveira,R.S.,Dawson,T.E., Burgess, S.S.O.&Nepstad,D.C. (2005)Hydraulic
redistribution in threeAmazonian trees.Oecologia,145, 354–363.
Perakis, S.S. & Hedin, L.O. (2002) Nitrogen loss from unpolluted South
American forests mainly via dissolved organic compounds. Nature, 415,
416–419.
Perez, C.A. (1994) Indexes of sclerophylly in relation to the chemical-quality of
litter, and to the potential mineralization of nitrogen in the surface soils of
olivillo (Aextoxicon punctatum) forests in Chile. Revista Chilena de Historia
Natural, 67, 101–109.
Polis, G.A., Anderson, W.B. & Holt, R.D. (1997) Toward an integration of
landscape and food web ecology: the dynamics of spatially subsidized food
webs.Annual Review of Ecology and Systematics, 28, 289–316.
Ponette-Gonzalez, A., Weathers, K.C. & Curran, L.M.. (2009) Water inputs
across a tropical montane landscape in Veracruz, Mexico: synergistic effects
of land cover, rain and fog seasonality, and interannual precipitation
variability.Global Change Biology, 16, 946–963.
Quinn, G.P. &Keough,M.J. (2002)Experimental Design and Data Analysis for
Biologists. CambridgeUniversity Press, Cambridge, UK.
R Development Core Team (2008) R: A Language and Environment for
Statistical Computing. R Foundation for Statistical Computing, Vienna,
Austria.
Robertson, G.P., Wedin, D., Groffman, P.M., Blair, J.M., Holland, E.A.,
Nadelhoffer, K.J. & Harris, D. (1999) Soil carbon and nitrogen availability:
nitrogen mineralization, nitrification, and soil respiration potentials. Stan-
dardMethods for Long Term Ecological Research (eds G.P. Robertson, D.C.
Coleman, C.S. Bledsoe & P. Sollins), pp. 258–271, Oxford University Press,
NewYork.
Saunders, D.A., Hobbs, R.J. & Margules, C.R. (1991) Biological conse-
quences of ecosystem fragmentation: a review. Conservation Biology, 5,
18–32.
Spencer, M. & Warren, P.H. (1996) The effect of habitat size and produc-
tivity on food web structure in small aquatic microcosms. Oikos, 75, 419–
430.
Squeo, F.A., Arancio, G. & Novoa-Jerez, J. (2004) Heterogeneidad y diversi-
dad florıstica del Bosque de Fray Jorge. Historia Natural del Parque
Nacional Bosque Fray Jorge (eds F.A. Squeo, J.R. Gutierrez & I.R. Her-
nandez), pp. 173–185, Ediciones Universidad de La Serena, La Serena,
Chile.
Stogsdill, W.R., Wittwer, R.F., Hennessey, T.C. & Dougherty, P.M. (1989)
Relationship between throughfall and stand density in a Pinus taeda planta-
tion.Forest Ecology andManagement, 29, 105–113.
Trenberth, K.E. (1997) The definition of El Nino. Bulletin of the American
Meteorological Society, 78, 2771–2777.
Villagran, C., Armesto, J.J., Hinojosa, F., Cuvertino, J., Perez, C. & Medina,
C. (2004) El enigmatico origen del bosque relicto de Fray Jorge. Historia
Natural del Parque Nacional Bosque Fray Jorge. (eds F.A. Squeo, J.R.
Gutierrez & I.R. Hernandez), pp. 173–185. Ediciones Universidad de La
Serena, La Serena, Chile.
Wardle, D.A., Zackrisson, O., Hornberg, G. & Gallet, C. (1997) The influence
of island area on ecosystem properties. Science, 2777, 1296–1299.
Weathers, K.C. (1999) The importance of cloud and fog to the maintenance of
ecosystems.Trends in Evolution and Ecology, 14, 214–215.
Weathers, K.C., Cadenasso, M.L. & Pickett, S.T.A. (2001) Forest edges as
nutrient and pollutant concentrators: potential synergisms between frag-
mentation, forest canopies, and the atmosphere. Conservation Biology, 15,
1506–1514.
Weathers, K.C. & Likens, G.E. (1997) Clouds in southern Chile an important
source of nitrogen to nitrogen-limited ecosystem? Environmental Science and
Technology, 31, 210–213.
Weathers, K.C., Lovett, G.M., Likens, G.E. & Caraco, N.F.M. (2000) Cloud-
water inputs of nitrogen to forest ecosystems in southern Chile: forms,
fluxes, and sources.Ecosystems, 3, 590–595.
Weathers, K.C., Simkin, S.M., Lovett, G.M. &Lindberg, S.E. (2006) Empirical
modeling of atmospheric deposition in mountainous landscapes. Ecological
Applications, 16, 1590–1607.
Webb, T.J., Gaston, K.J., Hannah, L. & Woodward, F.I. (2006) Coincident
scales of forest feedback on climate and conservation in a diversity hot spot.
Proceedings of The Royal Society B-Biological Sciences, 273, 757–776.
West, G.B., Brown, J.H. & Enquist, B.J. (1997) A general model for the origin
of allometric scaling laws in biology.Science, 276, 122–126.
West, B.T., Welch, K.B. & Galecki, A.T. (2007) LinearMixed Models: A Prac-
tical Guide Using Statistical Software. Chapman&Hall ⁄ CRC,NewYork.
Received 10August 2009; accepted 3 February 2010
Handling Editor: JimDalling
Supporting Information
Additional supporting information may be found in the online ver-
sion of this article.
Figure S1. Scaling relationship of ecosystem area and mean, mini-
mum andmaximum air temperature.
Figure S2. Scaling relationship of ecosystem area and mean, mini-
mum andmaximum relative humidity.
As a service to our authors and readers, this journal provides support-
ing information supplied by the authors. Such materials may be re-
organized for online delivery, but are not copy-edited or typeset.
Technical support issues arising from supporting information (other
thanmissing files) should be addressed to the authors.
� 2010 The Authors. Journal compilation � 2010 British Ecological Society, Functional Ecology, 24, 909–917
Patch size and water fluxes in a fog-forest 917
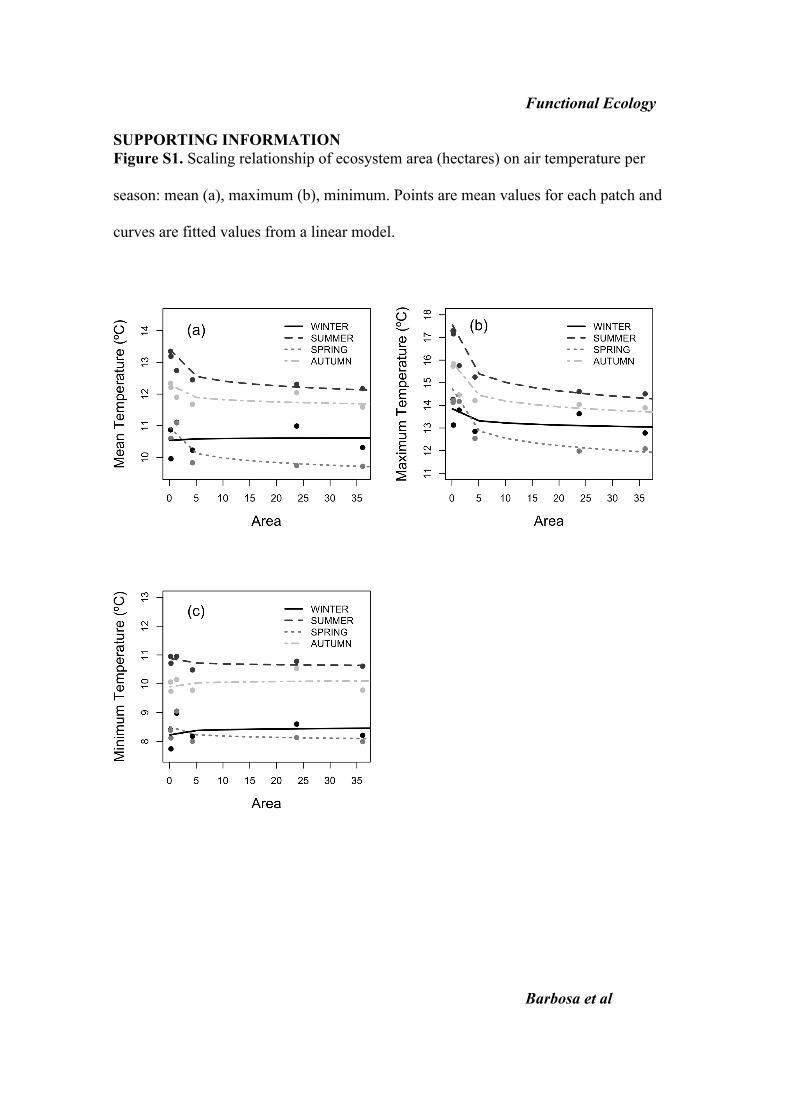
Functional Ecology SUPPORTING INFORMATION Figure S1. Scaling relationship of ecosystem area (hectares) on air temperature per
season: mean (a), maximum (b), minimum. Points are mean values for each patch and
curves are fitted values from a linear model.
Barbosa et al
Functional Ecology
Figure 2. Scaling relationship of ecosystem area (hectares) on air relative humidity per
season: mean (a), maximum (b), minimum. Points are mean values for each patch and
curves are fitted values from a linear model.
Barbosa et al
Related Documents