2010 ANNUAL REPORT CEF (Proprietary) Limited (Registration number 1976/001441/07) Annual Report for the year ended 31 March 2010 PAGE 1

Welcome message from author
This document is posted to help you gain knowledge. Please leave a comment to let me know what you think about it! Share it to your friends and learn new things together.
Transcript
2010 ANNUAL REPORTCEF (Proprietary) Limited
(Registration number 1976/001441/07)
Annual Report for the year ended 31 March 2010
PAGE 1

PAGE 2 CEF (PTY) LTD ANNUAL REPORT 2010

PAGE 3
Key toabbreviations
AEMFC African Exploration Mining and Finance Corporation (Proprietary) Limited BBL Barrel (equal 159 litres) BEE Black Economic Empowerment CCE Cape Cleaner Energy Solutions (Proprietary) Limited CDM Clean Development Mechanism CEF CEF (Proprietary) Limited CEF ACT Central Energy Fund (Act no 38 of 1977) as amended CER Carbon Emission Reduction CFL Compact Florence Lighting CIGS Copperindium (gallium) Deselenide DoE Department of Energy DST Department of Science and Technology DWP Darling Wind Power EDC Energy Development Corporation (a division of CEF (Proprietary) Limited) EEA Energy Efficiency Agency EIA Environmental Impact Assessment EUETS European Emission Trading Scheme GAAP Generally Accepted Accounting Practice GEF Global Environment Facility GTL Gas to Liquid IP Illuminating Paraffin IPE International Petroleum Exchange JST Johanna Solar Technology LNG Liquefied Natural Gas LSF Low Smoke Fuels MPRDA Mineral and Petroleum Resources Development Act, 2002 (Act 28 of 2002) NPA National Ports Authority Nymex New York Mercantile Exchange OPCSA Oil Pollution Control South Africa (Association incorporated under Section 21) PASA South African Agency for Promotion of Petroleum Exploration and Exploitation (Proprietary) LimitedPDD Project Design Document MW Megawatt NMBM Nelson Mandela Bay Metro PFMA Public Finance Management Act (Act No 1 of 1999) as amended PPE Property, plant and equipment PV Photovoltaic PetroSA The Petroleum Oil and Gas Corporation of South Africa (Proprietary) Limited RENAC Renewables Energy Academy Rompco Republic of Mozambique Investment Company (Proprietary) Limited SAMSA South African Maritime Safety Authority SANERI South African National Energy Research Institute (Proprietary) Limited SAPIA South African Petroleum Industry Association SARS South African Revenue Services SASDA South African Supplier Development Agency SFF SFF Association (Association incorporated under Section 21) SWH Solar Water Heaters Simex Singapore Monetary Exchange TFST Thin Film Solar Technology TNPA Transnet National Ports Authority UNDP United Nations Development Programme UTT Upstream Training Trust VAT Value Added Tax VLCC Very Large Crude Carrier iGAS The South African Gas Development Company (Proprietary) Limited

PAGE 4 CEF (PTY) LTD ANNUAL REPORT 2010
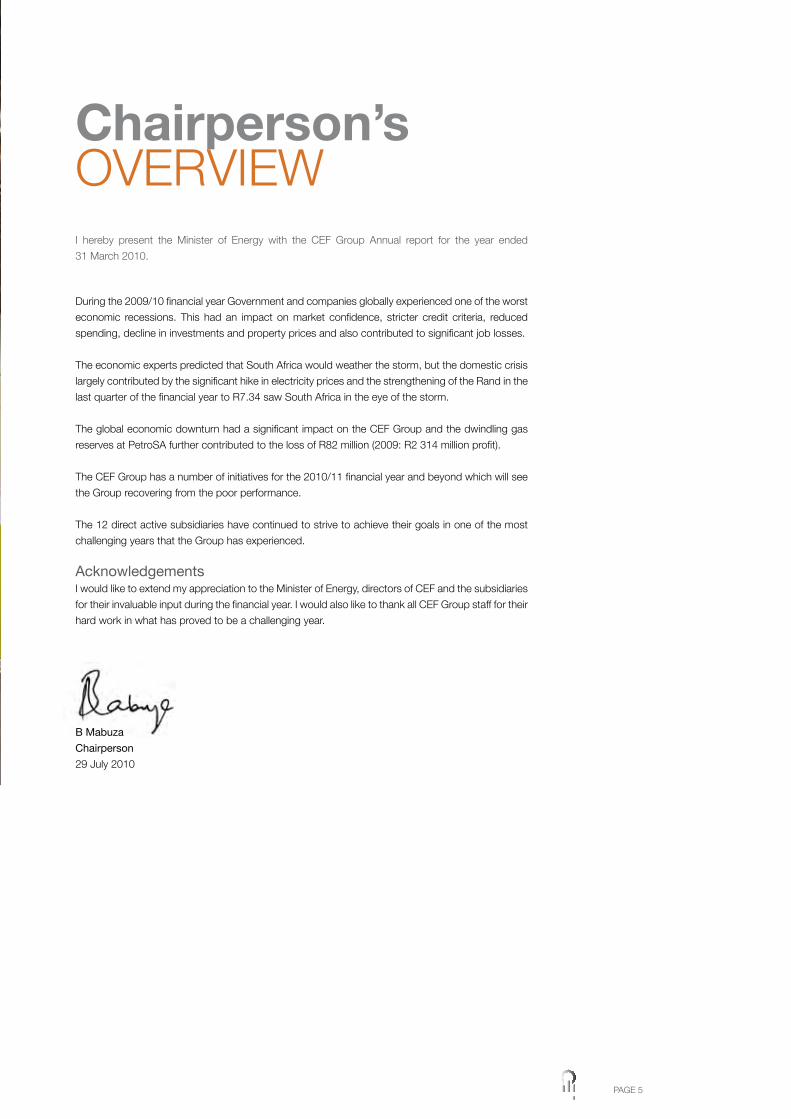
Chairperson’sOVERVIEW
During the 2009/10 financial year Government and companies globally experienced one of the worst
economic recessions. This had an impact on market confidence, stricter credit criteria, reduced
spending, decline in investments and property prices and also contributed to significant job losses.
The economic experts predicted that South Africa would weather the storm, but the domestic crisis
largely contributed by the significant hike in electricity prices and the strengthening of the Rand in the
last quarter of the financial year to R7.34 saw South Africa in the eye of the storm.
The global economic downturn had a significant impact on the CEF Group and the dwindling gas
reserves at PetroSA further contributed to the loss of R82 million (2009: R2 314 million profit).
The CEF Group has a number of initiatives for the 2010/11 financial year and beyond which will see
the Group recovering from the poor performance.
The 12 direct active subsidiaries have continued to strive to achieve their goals in one of the most
challenging years that the Group has experienced.
AcknowledgementsI would like to extend my appreciation to the Minister of Energy, directors of CEF and the subsidiaries
for their invaluable input during the financial year. I would also like to thank all CEF Group staff for their
hard work in what has proved to be a challenging year.
B Mabuza
Chairperson
29 July 2010
I hereby present the Minister of Energy with the CEF Group Annual report for the year ended
31 March 2010.
PAGE 5
CEF (PTY) LTD ANNUAL REPORT 2010PAGE 6
PAGE 7
This report should be read in conjunction with the annual financial statements presented on pages 32 to 136. The purpose of this review is to provide additional insight into the financial performance of CEF (Proprietary) Limited and the Group in the context of the environment in which we operate.
OverviewThe Group’s performance was negatively impacted by the global economic downturn which resulted
in the CEF Group making a loss of R82 million (2009: R2 314 million). The performance of the CEF
Group was largely influenced by the stronger Rand, oil price fluctuation and the decrease in interest
rates.
However, intense focus on cash flow and working capital management resulted in cash generated
from operations decreasing by 6% and ensured that we reduced debt levels and strengthened the
Group balance sheet.
Operational OverviewCEF and its operating subsidiaries
PetroSAThe company achieved a net loss of R356 million (2009: R1 965 million profit) for the year under
review. Sales revenues were particularly low at R8 090 million (2009: R12 117 million) and are
attributed to the high oil prices which averaged at USD68.78 per barrel versus the previous year’s
USD83.87.
Overall company operating costs (R9 960 million) decreased by 17% on the previous year
(2009: R12 065 million). This was mainly due to the decreased cost of feedstock purchases as a
result of the lower oil prices and the stronger rand.
The company recorded a pre-tax loss of R762 million for continuing operations, which reflects a
decrease on the prior year profit of R1 528 million. Brass Exploration Unlimited has been classified
as a discontinuing operation and reflects a profit of R57 million (2009: R437 million) net of taxation.
The company balance sheet remains strong with total assets of R23 385 million
(2009: R23 716 million). A cash balance of R10 027 million (2009: R11 315 million) versus a long
term loan of nil (2009: R24 million) reflects the Group’s strong net cash position.
iGasThe South African Gas Development Company (Proprietary) Limited (iGas) continues to fulfil its
mandate as per a Ministerial Directive. iGas performed well during the year under review.
The company’s profit for the year amounted to R54 million (2009: R26 million). Dividends of
R90 million (2009: R75 million) were declared by Rompco in favour of iGas.
CEO’sREPORT
PAGE 8 CEF (PTY) LTD ANNUAL REPORT 2010
Petroleum Agency SAThe Petroleum Agency SA continuing to focus on its regulatory, promotional and data management
functions.
During the financial year Petroleum Agency SA’s bid round for off shore acreage on the East and
West coast of South Africa was successful and resulted in the receipt of one bid application for each
of the two areas offered.
Petroleum Agency SA reported a net profit of R8 million (2009: R63 million).
SFFSFF’s performance for the year under review was exceptional as the company achieved a profit of
R203 million (2009: R162 million). The performance of the company can be largely attributed to:
• A number of storage contracts were concluded during the year; and
• Milnerton facilities became operational during the financial year which attracted interest in the
storage space.
PetroSA managed the storage facilities in Saldanha and Cape Town (Milnerton) on behalf of SFF up
until 31 March 2010. During the financial year a decision was taken for SFF to terminate its service
level agreement with PetroSA and as of 1 April 2010 all SFF operations will managed directly by SFF.
African Exploration Mining and Finance Corporation (Proprietary) Limited (AEMFC)AEMFC set to achieve a number of strategic initiatives with the aim of achieving long term
sustainability as well as responding to the shareholders aspiration of building a state owned mining
company. During the financial year AEMFC has made progress in building in – house drilling capacity
which forms the backbone of its exploration activities and it is anticipated to become operational in
the 2010/11 financial year.
African Exploration recorded a loss of R14 million (2009: R10 million).
Oil Pollution Control South Africa (OPCSA)OPCSA continues to manage oil pollution prevention and control activities in Saldanha Bay, Cape
Town and Ogies and provides clean up services in the event of an oil pollution incident.
The company’s net profit for the year amounted to R8 million (2009: R0.1 million).
South African National Energy Research Institute (SANERI)SANERI has five main research and human capital development programmes being:
1. The SANERI Bursary Programme
2. The SANERI Energy Research Programme
3. The Hub and Spokes Programme
4. The Chairs of Energy Research Programme
5. The Green Transport Programme
No new students were supported in the 2009/10 financial year due to financial constraints.
During the financial year SANERI established the Centre for Carbon Capture and Storage.
The establishment of the Centre is aimed at reducing South Africa’s greenhouse gas emissions. The
Centre is a private/international/public partnership financed from local industry, SANERI, Government
PAGE 9
CEO’s REPORT
and international sources. A Charter has been signed by several parties who have pledged their
support to the research and development that will be conducted by the Centre for the next
four years.
SANERI further established the Green Transport Centre which is situated in Midrand. The objectives
behind the establishment of this centre include:
1. Being an agent of change and pioneering introduction of alternative fuels into the South African
transport sector.
2. Being a one stop facility for:
• Information sharing related to alternative fuels involving technology vendors, vehicle
manufacturers, researchers and policy developers
• The public to get first hand experience of the use of alternatives, see refuelling, experience
and “feel” driving, understand operation and learn about the benefits.
3. Facilitation of partnerships
4. Providing access to reliable data
5. Facilitating access to local funders/international donors/funders.
The company reported a net profit for the year of R5 million (2009: R8 million). This is mainly as a
result of SANERI being funded by government grants received through the Department of Science
and Technology.
Carbon companiesCEF Carbon SA (Pty) Ltd acts as an agent in delivering and marketing carbon credits from CDM
projects undertaken by other CEF subsidiaries as well as third parties.
Carbon Stream Africa has been created to be a specialist entity focused on the development of
Project Design Documents (PPDs), which are prescriptive documents required as part of the formal
UN approval processes for CDM projects.
The principal purpose of Carbon SA is to support both sellers and buyers of carbon credits in
Southern Africa through the delivery of a full range of project development and transaction services,
including equity investment and financing (via CEF (Pty) Ltd) in exchange for (a share of) the resulting
carbon credits.
CEF Carbon SA (Proprietary) Ltd reported a net loss for the year of R7 million (2009: R0 million) and
Carbon Stream (Proprietary) Ltd the company made a loss of R0.3 million during its first year of its
operation as it is funded mainly through the Norwegian grants.
ETAThe nature of business is to invest in renewable energy projects and conduct business in the
renewable energy sector and related sectors of the economy and to successfully implement the
projects already contracted in NMBM. CEF has invested R18 million in ETA Energy (Pty) Ltd over the
past three years to ensure the rights to the projects in the NMBM, and to develop the projects.
The mitigation of climate change and the establishment of alternative energy sources is a critical
element in the development of our modern society. CEF through interventions like these has
undertaken to make a significant contribution towards ensuring a sustainable future for both man
and the environment.
PAGE 10 CEF (PTY) LTD ANNUAL REPORT 2010
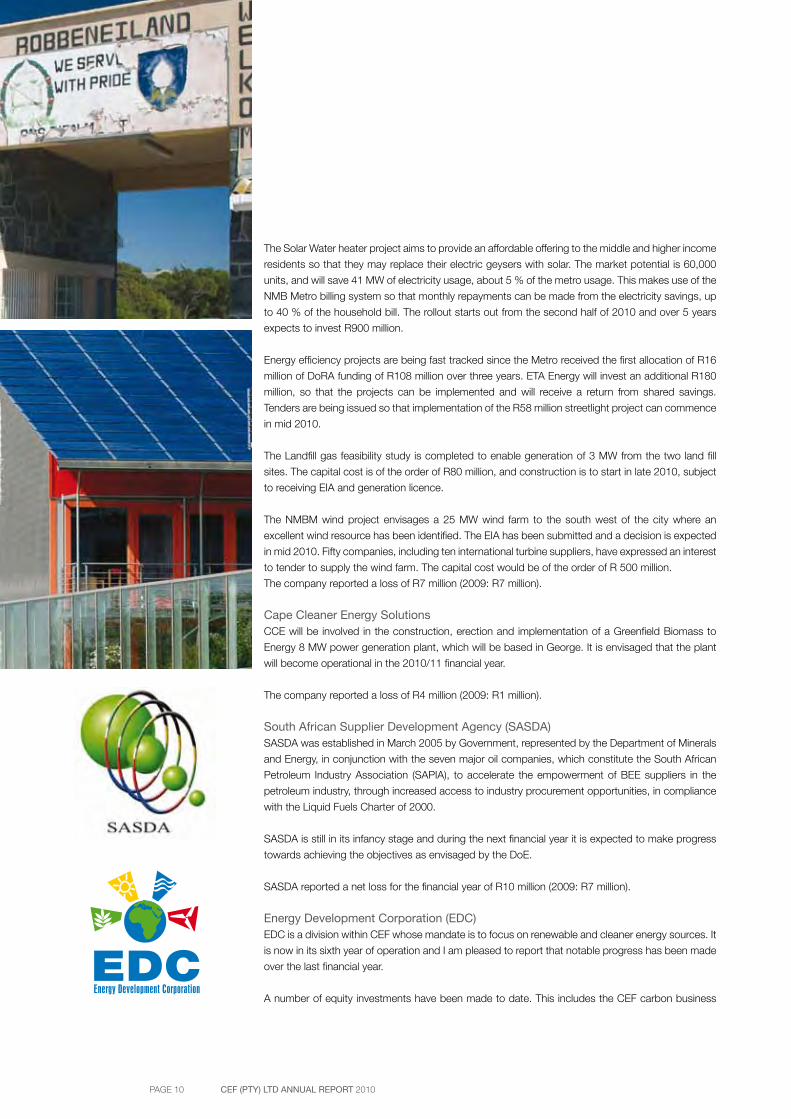
The Solar Water heater project aims to provide an affordable offering to the middle and higher income
residents so that they may replace their electric geysers with solar. The market potential is 60,000
units, and will save 41 MW of electricity usage, about 5 % of the metro usage. This makes use of the
NMB Metro billing system so that monthly repayments can be made from the electricity savings, up
to 40 % of the household bill. The rollout starts out from the second half of 2010 and over 5 years
expects to invest R900 million.
Energy efficiency projects are being fast tracked since the Metro received the first allocation of R16
million of DoRA funding of R108 million over three years. ETA Energy will invest an additional R180
million, so that the projects can be implemented and will receive a return from shared savings.
Tenders are being issued so that implementation of the R58 million streetlight project can commence
in mid 2010.
The Landfill gas feasibility study is completed to enable generation of 3 MW from the two land fill
sites. The capital cost is of the order of R80 million, and construction is to start in late 2010, subject
to receiving EIA and generation licence.
The NMBM wind project envisages a 25 MW wind farm to the south west of the city where an
excellent wind resource has been identified. The EIA has been submitted and a decision is expected
in mid 2010. Fifty companies, including ten international turbine suppliers, have expressed an interest
to tender to supply the wind farm. The capital cost would be of the order of R 500 million.
The company reported a loss of R7 million (2009: R7 million).
Cape Cleaner Energy SolutionsCCE will be involved in the construction, erection and implementation of a Greenfield Biomass to
Energy 8 MW power generation plant, which will be based in George. It is envisaged that the plant
will become operational in the 2010/11 financial year.
The company reported a loss of R4 million (2009: R1 million).
South African Supplier Development Agency (SASDA)SASDA was established in March 2005 by Government, represented by the Department of Minerals
and Energy, in conjunction with the seven major oil companies, which constitute the South African
Petroleum Industry Association (SAPIA), to accelerate the empowerment of BEE suppliers in the
petroleum industry, through increased access to industry procurement opportunities, in compliance
with the Liquid Fuels Charter of 2000.
SASDA is still in its infancy stage and during the next financial year it is expected to make progress
towards achieving the objectives as envisaged by the DoE.
SASDA reported a net loss for the financial year of R10 million (2009: R7 million).
Energy Development Corporation (EDC)EDC is a division within CEF whose mandate is to focus on renewable and cleaner energy sources. It
is now in its sixth year of operation and I am pleased to report that notable progress has been made
over the last financial year.
A number of equity investments have been made to date. This includes the CEF carbon business

PAGE 11
CEO’s REPORT
based in London, the Greenstream Joint Venture, the Phillips Manufacturing Joint Venture for
compact florescent lamps, the Cradock bio ethanol project, the biomass clean energy project, the
Thin Film Solar Technology, JST German investment plant and the Nelson Mandela Bay renewable
energy projects.
I would like to make special mention of the following projects as an indication of the efforts made to
fulfil the mandate issued to the Energy Development Corporation:
1.1 Landfill Gas to power projects
We have a number of landfill gas sites under development with the City of Cape Town, Emfuleni, City
of Johannesburg and Buffalo City. This is a high value carbon asset given that we are using methane
for power generation.
1.2 Bio Fuels
Following the approval of the bio fuels strategy in December 2007, we have made the investment in
the Cradock ethanol project. This is a 90 million litre capacity plant using sugar beet as the feedstock.
Together with our joint venture partners, we have reconfigured our approach to bio fuels investments.
We have continued our bankable studies for the Hoedspruit and Makatini projects.
1.3 Darling Wind Farm projects
I previously reported that this demonstration project was commissioned and we continue to record
a number of lessons on wind production challenges in South Africa. The green power generated is
being sold as a tradeable green certificate by the City of Cape Town.
It is hoped that the demonstration status of the project will encourage other private sector
developments in the wind sector.
1.4 Methcap SPV1 PetroSA Gas Extraction for Electricity
This waste gas to electricity project at the PetroSA refinery was commissioned in October 2007 and
the plant is fully functional supplying about 1% of the refinery needs.
1.5 Johanna Solar
I previously acknowledged the efforts of the team, linked to the University of Johannesburg in
developing the production plant that produced PV panels at a quarter of the cost of the current
technology. The team developed an industrial method of producing copper indium (gallium) Diselenide
(CIGS) panels as opposed to the silicon based technologies that are currently used.
CEF made a strategic investment into this sector and remains the senior investor for the South African
operations. Unfortunately, the commercial scale plant failed to achieve the required efficiencies and
the technology choice is being reviewed.
1.6.Basa Njengo Magogo
The Minister of Energy has directed that the Governments’ Basa Njengo Magogo programme
be adopted by EDC to enhance the clean coal use and management initiatives. Over 100 000
demonstrations have been done to-date within the main townships around the greater Johannesburg
area.
PAGE 12 CEF (PTY) LTD ANNUAL REPORT 2010
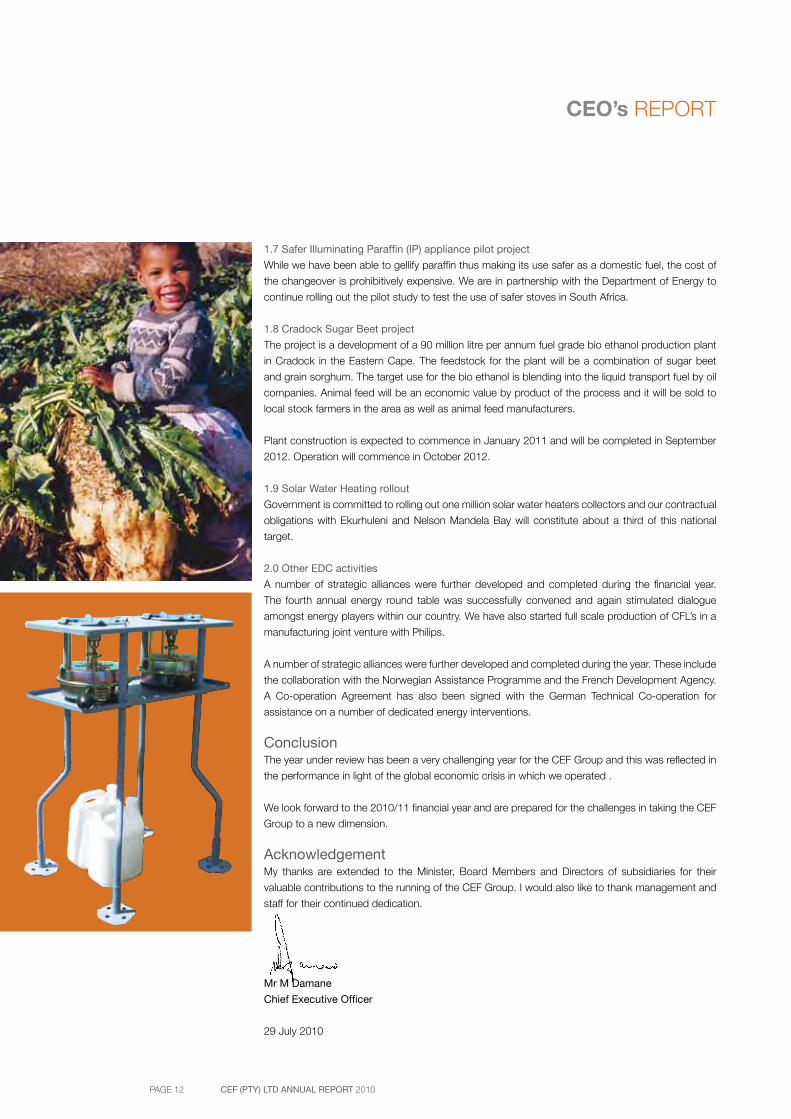
1.7 Safer Illuminating Paraffin (IP) appliance pilot project
While we have been able to gellify paraffin thus making its use safer as a domestic fuel, the cost of
the changeover is prohibitively expensive. We are in partnership with the Department of Energy to
continue rolling out the pilot study to test the use of safer stoves in South Africa.
1.8 Cradock Sugar Beet project
The project is a development of a 90 million litre per annum fuel grade bio ethanol production plant
in Cradock in the Eastern Cape. The feedstock for the plant will be a combination of sugar beet
and grain sorghum. The target use for the bio ethanol is blending into the liquid transport fuel by oil
companies. Animal feed will be an economic value by product of the process and it will be sold to
local stock farmers in the area as well as animal feed manufacturers.
Plant construction is expected to commence in January 2011 and will be completed in September
2012. Operation will commence in October 2012.
1.9 Solar Water Heating rollout
Government is committed to rolling out one million solar water heaters collectors and our contractual
obligations with Ekurhuleni and Nelson Mandela Bay will constitute about a third of this national
target.
2.0 Other EDC activities
A number of strategic alliances were further developed and completed during the financial year.
The fourth annual energy round table was successfully convened and again stimulated dialogue
amongst energy players within our country. We have also started full scale production of CFL’s in a
manufacturing joint venture with Philips.
A number of strategic alliances were further developed and completed during the year. These include
the collaboration with the Norwegian Assistance Programme and the French Development Agency.
A Co-operation Agreement has also been signed with the German Technical Co-operation for
assistance on a number of dedicated energy interventions.
ConclusionThe year under review has been a very challenging year for the CEF Group and this was reflected in
the performance in light of the global economic crisis in which we operated .
We look forward to the 2010/11 financial year and are prepared for the challenges in taking the CEF
Group to a new dimension.
AcknowledgementMy thanks are extended to the Minister, Board Members and Directors of subsidiaries for their
valuable contributions to the running of the CEF Group. I would also like to thank management and
staff for their continued dedication.
Mr M Damane
Chief Executive Officer
29 July 2010
CEO’s REPORT

PAGE 13

PAGE 14 CEF (PTY) LTD ANNUAL REPORT 2010
Board ofDirectors
1. Ms B Mabuza
Chairperson,
Non-executive Director
BA, MBA
2. Mr MB Damane
Executive Director
BSc, MBA, CIS, Quality Advisor
3. Ms N Magubane
Non-executive Director
BSc Electrical Engineering, MBA
4. Adv L Makatini
Non-executive Director
LLM (International Law)
5. Dr P Molefe
Non-executive Director
Diplomas in leadership from Pennsylvania
and Harvard Universities, Honorary Doctorate
from the University of the North West
6. Ms T Ramuedzisi (alternate)
Non-executive Director
BSc (Hon), MBA
7. Mr J Rocha
Non-executive Director
8. Dr Z Rustomjee
Non-executive Director
PhD Economics
9. Mr Y Tenza
Non-executive Director
BCom (Hon), MBA, CPA
1. 2.
3. 4.
5. 6. 7.
8. 9.
The directors are responsible for the maintenance of adequate accounting records and the preparation and integrity of the annual financial statements and related information. The external auditors are responsible for reporting on the fair presentation of the annual financial statements.
The annual financial statements are prepared in accordance with South African Statements of Generally Accepted Accounting Practice and the Companies Act of South Africa, 1973 as amended. These annual financial statements are based upon appropriate accounting policies consistently applied and supported by reasonable and prudent judgments and estimates.
The directors are also responsible for the Group’s system of internal control. These controls are designed to provide reasonable, but not absolute, assurance as to the reliability of the Group annual financial statements and to adequately safeguard, verify and maintain accountability of assets and to prevent and detect misstatements and losses.
The directors acknowledge their responsibilities as stated above and have established internal controls and risk management systems that maintain a strong control environment. These systems are designed to provide reasonable, but not absolute, assurance against material misstatements and losses. Based on information and explanations received from management, and the internal auditors on the maintenance of the internal controls, the directors are of the opinion that proper accounting records have been maintained and that reliance can be placed on the financial information used for these annual financial statements.
Nothing has come to the attention of the directors to indicate that any material breakdown in the functioning of these controls, procedures and systems has occurred during the year under review. The going concern basis has been adopted in preparing the annual financial statements. The directors have no reason to believe that the Group will not be a going concern in the foreseeable future, based on forecasts and available cash resources. The viability of the Group is supported by the annual financial statements.
The annual financial statements have been audited by the Auditor-General of South Africa who was given unrestricted access to all financial records and related data, including minutes of all meetings of shareholders, the Board of directors, committees of the Board, and management. The directors believe that all representations made to the independent auditors during their audit were valid and appropriate. The Auditor-General of South Africa audit report is attached.
In the opinion of the directors based on information available to-date, the annual financial statements fairly present the financial position of CEF (Proprietary) Limited at 31 March 2010, and the results of its operations and cash flow information for the year under review.
The annual financial statements set out on pages 32 to 136, for the year ended 31 March 2010, which have been prepared on the going concern basis, were approved by the Board of directors in terms of Section 51(1) (f) of the Public Finance Management Act on 29 July 2010 and were signed on its behalf by:
Ms B Mabuza Mr M DamaneChairperson Executive DirectorSandton29 July 2010
Directors’ Responsibilitiesand Approval
PAGE 15PAGE 15
Board ofDirectors
1. Introduction
2. ComplianceThe Board of directors believe that companies within the Group endorse the principles as set out
in the Protocol on Corporate Governance, and where applicable, the King Report on Corporate
Governance for South Africa 2009 (King III) and have endeavoured to comply with the principles
incorporated in the Code of Corporate Practices and Conduct.
The Group has a formalised system of corporate governance as set out below.
3. GoverningbodiesBoardofdirectorsSeparate Boards of directors for the holding company and each of the operating subsidiaries are
appointed.
The Board of directors of CEF consists of seven Non–executive Directors and one Executive Director.
At least four Board meetings are held during a year. The framework for the payment of directors’
remuneration is approved by the Minister of Energy.
The Group has a unitary Board structure made up of a majority of Non–executive Directors,
appointed by the shareholder. The Board of directors meets at least once every quarter, and
executive managers attend by invitation. The Board charges executive management with regard to
the day-to-day running of the business, with the Board addressing a range of key issues to ensure
that it retains the strategic direction of, and proper control over the Group. The Non–executive
Directors are appointed on a three year cycle unless otherwise stated and reappointment dependent
on the renewal process. The offices of the Chairperson and Chief Executive Officer are separated.
In accordance with the Public Finance Management Act (Act No 1 of 1999) the Board is the
accounting authority of CEF. In keeping with the recommendations of the King Report, the Board
adopted a Board charter which sets out the role of the Board as follows.
The Board’s primary responsibilities include the appointment of the Chief Executive Officer,
determining the company’s objectives and values and giving strategic direction to the company,
taking effective and appropriate steps to ensure that key risk areas and key performance
indicators of the company’s business are identified, monitoring the performance of the
company against agreed objectives, advising on significant financial matters and reviewing
the performance of executive management against defined objectives and applicable industry
standards, as well as:
• Approving key policies, investments, risk management and relevant transactions that
exceed Managements’ levels of authority;
• Reviewing and approving the company’s strategy, objectives, and plans;
• Considering and approving annual financial statements and submissions to the
shareholder;
• Ensuring adherence to good corporate governance and ethics;
• Monitoring and directing line performance; and
• Reviewing effectiveness of controls.
Statement on CorporateGovernance
CEF (PTY) LTD ANNUAL REPORT 2010PAGE 16

PAGE 17
Statement on CorporateGovernance
CompanySecretaryThe Company Secretary provides the Board of directors with guidance and advice on matters of
business ethics and good governance, as well as on the nature and extent of their duties and
responsibilities and how such duties and responsibilities should be properly discharged.
Each of the directors has unrestricted access to the advice and services of the Company Secretary,
company information, and are entitled to seek independent professional advice, at the company’s
expense in pursuance of their duties as director.
BoardcommitteesThe Board established several committees in order to assist it in the discharge of its duties. Each
committee operates within the defined terms of reference and is chaired by a Non-executive Director.
BoardauditandriskmanagementcommitteeThe Board audit and risk management committee consist of Non-executive Members appointed by
the Board of directors. Each committee in the Group has an agreed terms of reference as approved
by its Board of directors. The report of the CEF Board audit and risk management committee is
included in the Group annual financial statements.
This Board audit and risk management committee meets at least four times per year and is chaired
by an independent Non-executive Director who is not the chairperson of the Board. The Auditor-
General of South Africa and Chief Audit Executive have unrestricted access to the committee.
Appropriate Executive Managers, including those responsible for finance, Chief Executive Officers
and Chief Audit Executive attend these meetings by invitation.
The committee reviews the adequacy and effectiveness of internal controls of the Group with special
reference to the findings of both internal and external auditors. Other areas covered include the
review of important accounting and control issues, material pending litigation, specific disclosures
in the annual financial statements, and a review of the performance of the Internal Audit Function.
BoardhumanresourcescommitteeThis committee consists of Non-executive Directors and is chaired by the Chairperson of the Board.
The committee reviews and recommends annual staff remuneration increases, terms and conditions
of employment, the payment of incentives and bonuses, general fringe benefits, remuneration
policies and the appointment of senior staff.
ChiefExecutiveOfficerThe Chief Executive Officer of the holding company and those of the operating subsidiaries are
appointed by the Board of directors of each company. They are held accountable for implementing
the strategies of the Board of directors and managing the business of the respective companies in
accordance with the approved corporate plan and budget.
4. InternalauditInternal Audit Function in terms of a charter that is approved by the Board of directors through
the Board audit and risk management committee. The Internal Audit Charter defines the purpose,
authority and responsibility of the Internal Audit Function.
PAGE 18 CEF (PTY) LTD ANNUAL REPORT 2010
The Internal Audit Function carries out its work in terms of an approved internal audit work plan.
The work plan is based on the risk framework of the company. The Chief Audit Executive has full
access to the chairpersons of the Boards of directors and the chairpersons of the Board audit and
risk management committees. The primary responsibility objective of the Internal Audit Function is
to the Board, its committees, or both, in discharging its governance responsibilities and to perform
the following functions:
• Evaluating the company’s governance processes including ethics;
• Performing an objective assessment of the effectiveness of risk management and internal
control framework;
• Systematically analysing and evaluating business processes and associated controls; and
• Providing a source of information, as appropriate, regarding instances of fraud, corruption,
unethical behaviour and irregularities.
The Internal Audit Function adheres to the Institute of Internal Auditors’ standards for Professional
Practice of Internal Auditing and Code of Ethics. The Chief Audit Executive developed and maintained
a quality assurance and improvement programme. The internal audit function is subjected to an
external quality review at least every five years, the last review was conducted during 2007 and the
evaluation result was “general conformance”, which is the highest level of conformance.
5. ManagementreportingComprehensive management reporting disciplines are in place, which include the preparation of an
annual corporate plan and budget approved by the Board of directors. Monthly and quarterly results
are reported against the approved budget to the executive committee and the Board of directors
respectively for review.
There are comprehensive management reporting disciplines in place, which include the preparation
of annual budgets by all divisions and reporting thereon on a quarterly basis. The budget and
capital expenditure are reviewed and approved by the Board. Quarterly performance results and the
financial status of the company and Group are reported against approved targets. Profit projections
and forecasted cash flows are updated quarterly, while working capital and borrowing levels are
monitored on an ongoing basis.
Executive management meets on a regular basis to consider day to day issues pertaining to the
business of the Group.
CodeofEthicsEntities within the Group have Codes of Ethics which require employees to observe the highest
ethical standards thereby ensuring that business practices are conducted in a manner which is
beyond reproach.
Directors and employees are required to maintain the highest ethical standards, ensuring that business
practices are conducted in a manner which, in all reasonable circumstances, are beyond reproach.
The Code of Ethics also articulates conduct with respect to conflicts of interest, confidentiality, fair
dealing, etc.
PAGE 19
Statement on Corporate Governance
CEF has contracted the services of an independent hotline service providing for the confidential
reporting of fraud and other inappropriate behaviour. Employee breaches are dealt with in accordance
with the disciplinary policy. In addition directors are required to annually declare their interests in
contracts as well as directorships in other companies in accordance with the Companies Act.
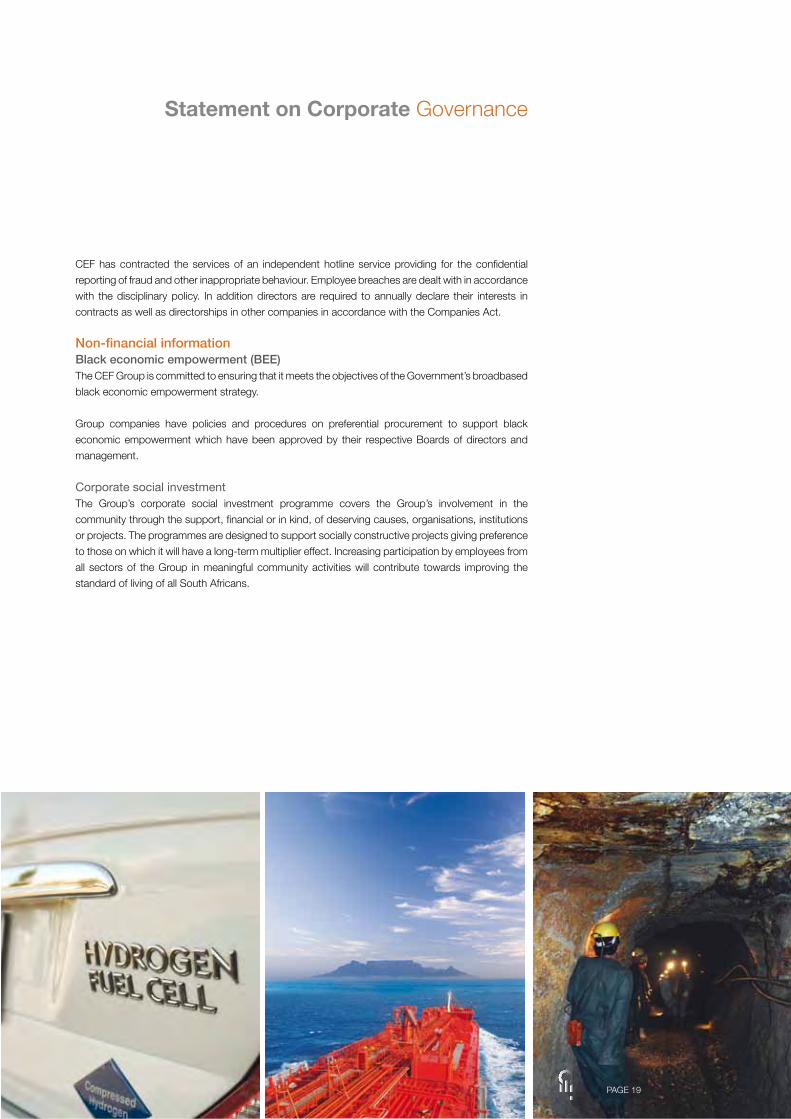
Non-financialinformationBlackeconomicempowerment(BEE)The CEF Group is committed to ensuring that it meets the objectives of the Government’s broadbased
black economic empowerment strategy.
Group companies have policies and procedures on preferential procurement to support black
economic empowerment which have been approved by their respective Boards of directors and
management.
Corporate social investmentThe Group’s corporate social investment programme covers the Group’s involvement in the
community through the support, financial or in kind, of deserving causes, organisations, institutions
or projects. The programmes are designed to support socially constructive projects giving preference
to those on which it will have a long-term multiplier effect. Increasing participation by employees from
all sectors of the Group in meaningful community activities will contribute towards improving the
standard of living of all South Africans.

CEF (PTY) LTD ANNUAL REPORT 2010PAGE 20
PAGE 21
REPORTONTHECONSOLIDATEDFINANCIALSTATEMENTS
IntroductionI have audited the accompanying consolidated financial statements and financial statements of CEF,
which comprise the consolidated and separate statement of financial position as at 31 March 2010,
and the consolidated and separate statement of financial performance, statement of changes in
equity and statement of cash flows for the year then ended, a summary of significant accounting
policies and other explanatory information and the accounting authority’s report as set out on pages
32 to 136.
Accounting Authority’s responsibility for the consolidated financialstatementsThe accounting authority is responsible for the preparation and fair presentation of these financial
statements in accordance with South African Statements of Generally Accepted Accounting
Practice (SA Statements of GAAP) and in the manner required by the Public Finance Management
Act, 1999 (Act No. 1 of 1999) (PFMA) and the Companies Act of South Africa. This responsibility
includes: designing, implementing and maintaining internal control relevant to the preparation and fair
presentation of financial statements that are free from material misstatement, whether due to fraud or
error; selecting and applying appropriate accounting policies; and making accounting estimates that
are reasonable in the circumstances.
Auditor-General’sresponsibilityAs required by section 188 of the Constitution of the Republic of South Africa, 1996 and section 4 of
the Public Audit Act of South Africa, 2004 (Act No. 25 of 2004) (PAA), section 300 of the Companies
Act of South Africa and section 1 E (3) of the Central Energy Fund Act, 1977 (Act No. 38 of 1977)
as amended, my responsibility is to express an opinion on these financial statements based on my
audit.
I conducted my audit in accordance with International Standards on Auditing and General
Notice 1570 of 2009 issued in Government Gazette 32758 of 27 November 2009. Those standards
require that I comply with ethical requirements and plan and perform the audit to obtain reasonable
assurance about whether the financial statements are free from material misstatement.
An audit involves performing procedures to obtain audit evidence about the amounts and disclosures
in the financial statements. The procedures selected depend on the auditor’s judgement, including
the assessment of the risks of material misstatement of the financial statements, whether due to
fraud or error. In making those risk assessments, the auditor considers internal control relevant
to the entity’s preparation and fair presentation of the financial statements in order to design audit
procedures that are appropriate in the circumstances, but not for the purpose of expressing an
opinion on the effectiveness of the entity’s internal control. An audit also includes evaluating the
appropriateness of accounting policies used and the reasonableness of accounting estimates made
by management, as well as evaluating the overall presentation of the financial statements.
REPORT OF THE AUDITOR-GENERAL TO PARLIAMENTON THE FINANCIAL STATEMENTS OF CEF(PROPRIETARY) LIMITED (CEF) FOR THE YEAR ENDED31MARCH2010
Report of the Independent Auditors
PAGE 22 CEF (PTY) LTD ANNUAL REPORT 2010
I believe that the audit evidence I have obtained is sufficient and appropriate to provide a basis for
my audit opinion.
OpinionIn my opinion, these financial statements present fairly, in a” material respects, the consolidated and
separate financial position of CEF at 31 March 2010 and its consolidated and separate financial
performance and its consolidated and separate cash flows for the year then ended, in accordance
with the SA Statements of GAAP and in the manner required by the PFMA and the Companies Act
of South Africa.
EmphasisofmatterI draw attention to the matters below. My opinion is not modified in respect of these matters:
Restatement of corresponding figures As disclosed in note 41 to the financial statements, the
corresponding figures for 31 March 2009 have been restated as a result of an error discovered
during 2010 in the financial statements of CEF at, and for the year ended, 31 March 2009.
FruitlessandwastefulexpenditureAs disclosed in note 42 to the financial statements, fruitless and wasteful expenditure to the amount
of R24.45 million was incurred.
IrregularExpenditureAs disclosed in note 42 to the financial statements, irregular expenditure to the amount of R0.682
million was incurred, as a result of the contravention of the authorised delegations of authority.
Additional matters I draw attention to the matter below. My opinion is not modified in respect of this
matter:
UnauditedsupplementaryschedulesThe supplementary information, set out on pages 138 to 141 respectively, does not form part of the
financial statements and is presented as additional information. I have not audited this schedule and
accordingly I do not express an opinion thereon.
REPORTONOTHERLEGALANDREGULATORYREQUIREMENTSIn terms of the PAA of South Africa and General notice 1570 of 2009, issued in Government Gazette
No. 32758 of 27 November 2009 I include below my findings on the report on predetermined
objectives, in compliance with the PFMA, the Companies Act of South Africa and financial
management (internal control).
Findings
Predeterminedobjectives
Usefulnessofreportedperformanceinformation
The following criteria were used to assess the usefulness of the planned and reported performance:
• Consistency: Has the entity reported on its performance with regard to its objectives,
indicators and targets in its approved corporate plan, i.e. are the objectives, indicators and
targets consistent between planning and reporting documents?

PAGE 23
Report of the Independent Auditors
• Relevance: Is there a clear and logical link between the objectives, outcomes, outputs,
indicators and performance targets?
• Measurability: Are objectives made measurable by means of indicators and targets? Are
indicators well defined and verifiable, and are targets specific, measurable, and time
bound?
The following audit findings relate to the above criteria:
Reported information not consistent with planned objectives, indicators and targets
The company has not reported on its performance against predetermined objectives/indicators/
targets which is consistent with the approved corporate plan.
INTERNALCONTROLI considered internal control relevant to my audit of the financial statements and the report on
predetermined objectives and compliance with the PFMA and the Companies Act of South Africa,
but not for the purposes of expressing an opinion on the effectiveness of internal control. The matters
reported below are limited to the deficiencies identified during the audit.
• Financial and performance management
Pertinent information is not identified and captured in a form and time frame to support
financial and performance management.
Requested information was not available and supplied without any significant delay.
OTHERREPORTS
Investigations in progress
• An investigation is being conducted to probe transgressions of the company’s code of
conduct. The investigation was still ongoing at the reporting date.
Pretoria
31 July 2010

PAGE 24 CEF (PTY) LTD ANNUAL REPORT 2010
The Board audit and risk management committee has adopted appropriate formal terms of reference, which have been confirmed by the Board, and has performed its responsibilities as set out in the terms of reference.
1. Responsibilities In performing its responsibilities the Board audit and risk management committee has reviewed the
following:
• The effectiveness of the internal control systems;
• The effectiveness of the internal audit function;
• The risk areas of the Group’s operations to be covered in the scope of the internal and
external audits;
• The adequacy, reliability and accuracy of financial information provided to management
and other users of such information;
• The accounting and auditing concerns identified as a result of the internal or external
audits;
• The Group’s compliance with applicable legal and regulatory provisions;
• The activities of the internal audit function, including its annual work programme,
coordination with the external auditors, the reports of significant investigations and the
responses of management to specific recommendations;
• The independence and objectivity of the external auditors;
• The scope and results of the external audit function, its cost-effectiveness, and
• The adequacy of insurance cover.
The Board audit and risk management committee is also responsible for:
• Reporting to the Minister of Energy and the Auditor-General of South Africa where a
report implicates any member(s) of the accounting authority in fraud, corruption or gross
negligence;
• Communicating any concerns it deems necessary to the Minister of Energy and the
Auditor-General of South Africa;
• Confirmation and approval of the internal audit department’s charter and internal audit
work plan;
• Encouraging communication between members of the Board, senior executive
management, the internal audit department and the Auditor-General of South Africa;
• Conducting investigations within its terms of reference; and
• Concurring with the appointment and dismissal of the Chief Audit Executive of the
Internal Audit Function.
Report of theBoard Audit and RiskManagement Committee
PAGE 25
PAGE 26 CEF (PTY) LTD ANNUAL REPORT 2010
2. InternalcontrolsystemThe Board audit and risk management committee is satisfied that internal controls and systems
have been put in place and that these controls have functioned effectively during the period
under review. The Board audit and risk management committee considers the Group’s internal
controls and systems appropriate in all material respects to:
• Reduce the Group’s risks to an acceptable level;
• Meet the business objectives of the Group;
• Ensure the Group’s assets are adequately safeguarded; and
• Ensure that the transactions undertaken are recorded in the Group’s records.
3. AnnualfinancialstatementsThe Board audit and risk management committee is of the opinion based on the information and
explanations given by management and the Internal Audit Function and discussions with the Auditor-
General of South Africa on the result of their audits, that the internal accounting controls are adequate
to ensure that the financial records may be relied upon for preparing the annual financial statements,
and accountability for assets and liabilities is maintained.
Nothing significant has come to the attention of the Board audit and risk management committee to
indicate that any material breakdown in the functioning of these controls, procedures and systems
has occurred during the period under review.
The Board audit and risk management committee has evaluated the annual financial statements of
CEF (Proprietary) Limited and the CEF Group for the period ended 31 March 2010 and, based on
the information provided to the Board audit and risk management committee, considers that they
comply, in all material respects, with the requirements of the Companies Act of South Africa, No.
61 of 1973, as amended, and the Public Finance Management Act, No. 1 of 1999, as amended,
and South African Statements of Generally Accepted Accounting Practice. The Board audit and risk
management committee has therefore, at their meeting held on 27 July 2010, recommended the
adoption of the annual financial statements by the Board of directors.
Mr Y Tenza
Chairperson
27 July 2010
Mr R Boqo
Executive Member
27 July 2010
Report of the Board Audit and Risk Committee

PAGE 27
PAGE 28 CEF (PTY) LTD ANNUAL REPORT 2010
In my capacity as company secretary, I hereby confirm, except where otherwise mentioned in the
annual financial statements, that for the year ended 31 March 2010 the company has lodged with
the Registrar of Companies all such returns as are required of a company in terms of this act and that
all such returns are to the best of my knowledge and belief, correct and up to date.
Mr A Haffejee
29 July 2010
Statement fromCompany Secretary
PAGE 29
PAGE 30 CEF (PTY) LTD ANNUAL REPORT 2010
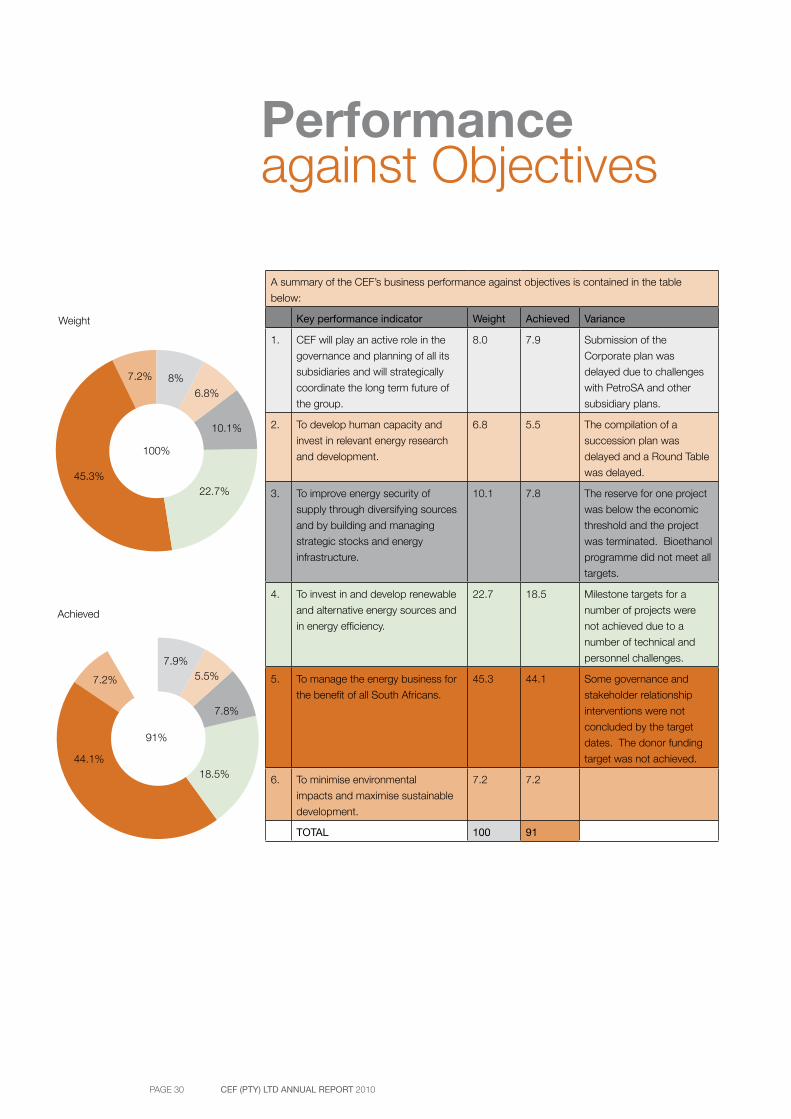
A summary of the CEF’s business performance against objectives is contained in the table
below:
Key performance indicator Weight Achieved Variance
1. CEF will play an active role in the
governance and planning of all its
subsidiaries and will strategically
coordinate the long term future of
the group.
8.0 7.9 Submission of the
Corporate plan was
delayed due to challenges
with PetroSA and other
subsidiary plans.
2. To develop human capacity and
invest in relevant energy research
and development.
6.8 5.5 The compilation of a
succession plan was
delayed and a Round Table
was delayed.
3. To improve energy security of
supply through diversifying sources
and by building and managing
strategic stocks and energy
infrastructure.
10.1 7.8 The reserve for one project
was below the economic
threshold and the project
was terminated. Bioethanol
programme did not meet all
targets.
4. To invest in and develop renewable
and alternative energy sources and
in energy efficiency.
22.7 18.5 Milestone targets for a
number of projects were
not achieved due to a
number of technical and
personnel challenges.
5. To manage the energy business for
the benefit of all South Africans.
45.3 44.1 Some governance and
stakeholder relationship
interventions were not
concluded by the target
dates. The donor funding
target was not achieved.
6. To minimise environmental
impacts and maximise sustainable
development.
7.2 7.2
TOTAL 100 91
Performanceagainst Objectives
Weight
Achieved
100%
91%
8%6.8%
10.1%
22.7%45.3%
7.2%
7.9%5.5%
7.8%
18.5%44.1%
7.2%

PAGE 31
PAGE 32 CEF (PTY) LTD ANNUAL REPORT 2010
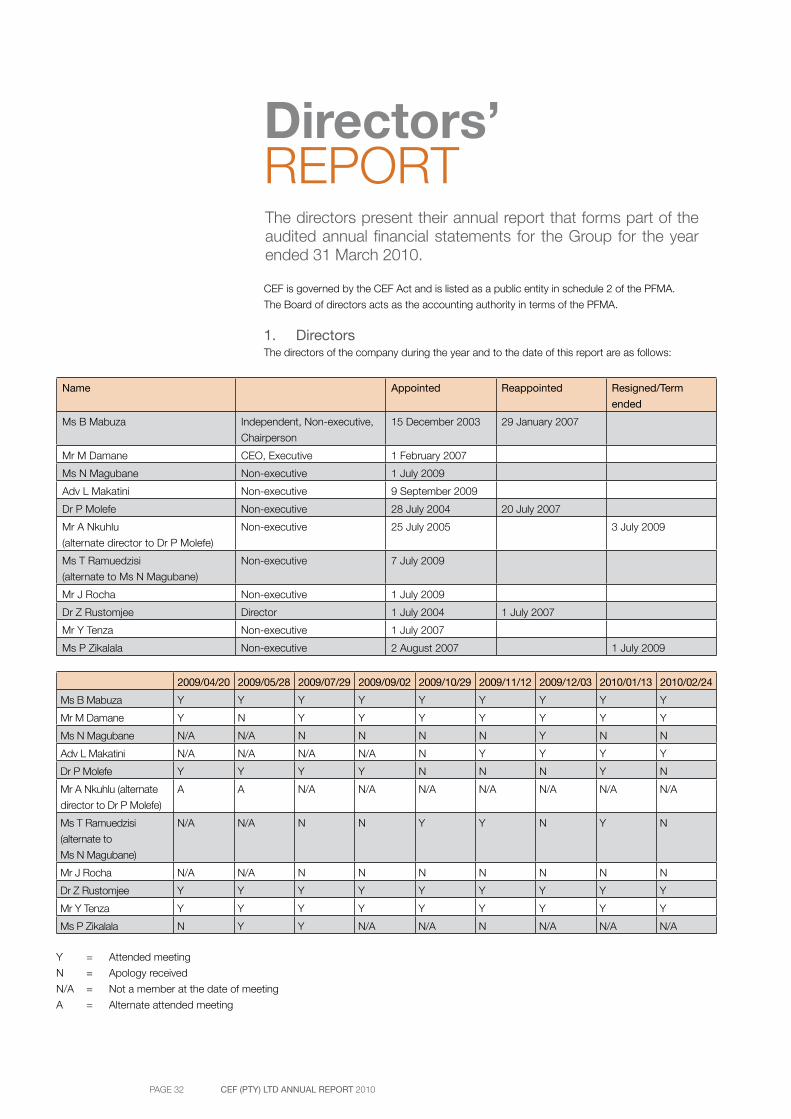
Directors’REPORT
CEF is governed by the CEF Act and is listed as a public entity in schedule 2 of the PFMA.
The Board of directors acts as the accounting authority in terms of the PFMA.
1. DirectorsThe directors of the company during the year and to the date of this report are as follows:
Name Appointed Reappointed Resigned/Term
ended
Ms B Mabuza Independent, Non-executive,
Chairperson
15 December 2003 29 January 2007
Mr M Damane CEO, Executive 1 February 2007
Ms N Magubane Non-executive 1 July 2009
Adv L Makatini Non-executive 9 September 2009
Dr P Molefe Non-executive 28 July 2004 20 July 2007
Mr A Nkuhlu
(alternate director to Dr P Molefe)
Non-executive 25 July 2005 3 July 2009
Ms T Ramuedzisi
(alternate to Ms N Magubane)
Non-executive 7 July 2009
Mr J Rocha Non-executive 1 July 2009
Dr Z Rustomjee Director 1 July 2004 1 July 2007
Mr Y Tenza Non-executive 1 July 2007
Ms P Zikalala Non-executive 2 August 2007 1 July 2009
2009/04/20 2009/05/28 2009/07/29 2009/09/02 2009/10/29 2009/11/12 2009/12/03 2010/01/13 2010/02/24
Ms B Mabuza Y Y Y Y Y Y Y Y Y
Mr M Damane Y N Y Y Y Y Y Y Y
Ms N Magubane N/A N/A N N N N Y N N
Adv L Makatini N/A N/A N/A N/A N Y Y Y Y
Dr P Molefe Y Y Y Y N N N Y N
Mr A Nkuhlu (alternate
director to Dr P Molefe)
A A N/A N/A N/A N/A N/A N/A N/A
Ms T Ramuedzisi
(alternate to
Ms N Magubane)
N/A N/A N N Y Y N Y N
Mr J Rocha N/A N/A N N N N N N N
Dr Z Rustomjee Y Y Y Y Y Y Y Y Y
Mr Y Tenza Y Y Y Y Y Y Y Y Y
Ms P Zikalala N Y Y N/A N/A N N/A N/A N/A
Y = Attended meeting
N = Apology received
N/A = Not a member at the date of meeting
A = Alternate attended meeting
The directors present their annual report that forms part of the audited annual financial statements for the Group for the year ended 31 March 2010.
PAGE 33
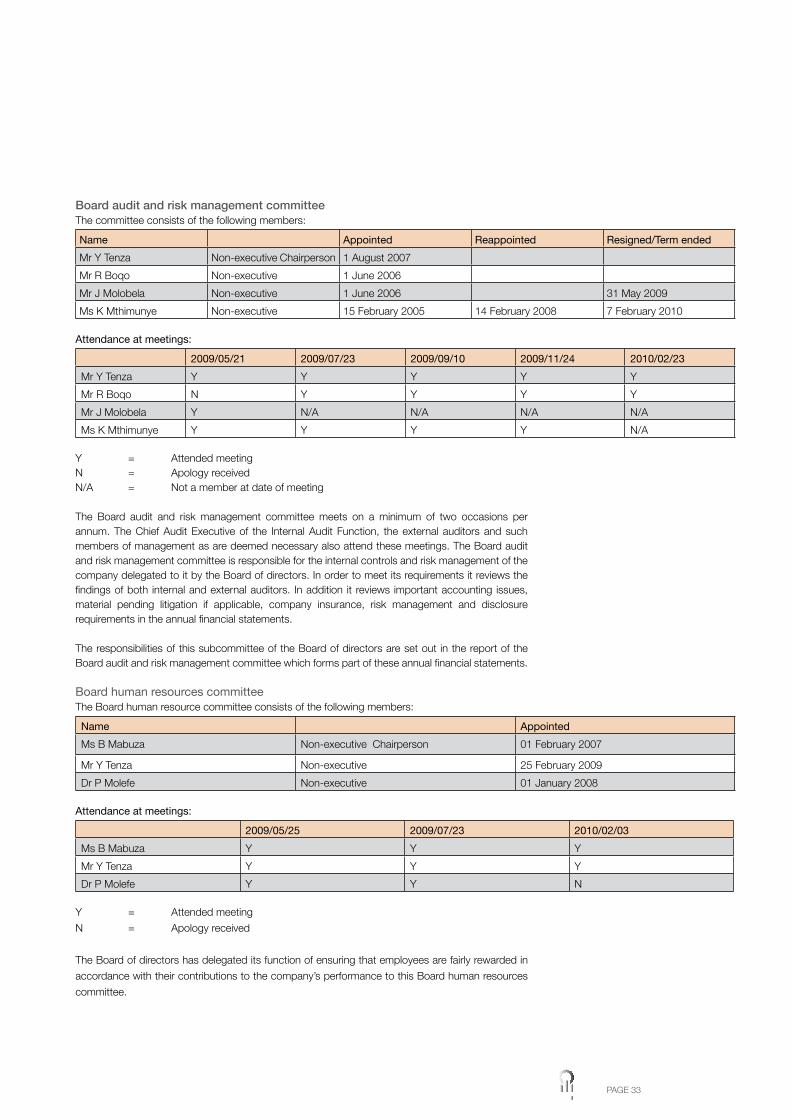
BoardauditandriskmanagementcommitteeThe committee consists of the following members:
Name Appointed Reappointed Resigned/Term ended
Mr Y Tenza Non-executive Chairperson 1 August 2007
Mr R Boqo Non-executive 1 June 2006
Mr J Molobela Non-executive 1 June 2006 31 May 2009
Ms K Mthimunye Non-executive 15 February 2005 14 February 2008 7 February 2010
Attendance at meetings:
2009/05/21 2009/07/23 2009/09/10 2009/11/24 2010/02/23
Mr Y Tenza Y Y Y Y Y
Mr R Boqo N Y Y Y Y
Mr J Molobela Y N/A N/A N/A N/A
Ms K Mthimunye Y Y Y Y N/A
Y = Attended meetingN = Apology receivedN/A = Not a member at date of meeting
The Board audit and risk management committee meets on a minimum of two occasions per annum. The Chief Audit Executive of the Internal Audit Function, the external auditors and such members of management as are deemed necessary also attend these meetings. The Board audit and risk management committee is responsible for the internal controls and risk management of the company delegated to it by the Board of directors. In order to meet its requirements it reviews the findings of both internal and external auditors. In addition it reviews important accounting issues, material pending litigation if applicable, company insurance, risk management and disclosure requirements in the annual financial statements.
The responsibilities of this subcommittee of the Board of directors are set out in the report of the Board audit and risk management committee which forms part of these annual financial statements.
Board human resources committeeThe Board human resource committee consists of the following members:
Name Appointed
Ms B Mabuza Non-executive Chairperson 01 February 2007
Mr Y Tenza Non-executive 25 February 2009
Dr P Molefe Non-executive 01 January 2008 Attendance at meetings:
2009/05/25 2009/07/23 2010/02/03
Ms B Mabuza Y Y Y
Mr Y Tenza Y Y Y
Dr P Molefe Y Y N
Y = Attended meeting
N = Apology received
The Board of directors has delegated its function of ensuring that employees are fairly rewarded in
accordance with their contributions to the company’s performance to this Board human resources
committee.

PAGE 34 CEF (PTY) LTD ANNUAL REPORT 2010
2. SecretaryThe secretary of the company is Mr A Haffejee and the business and postal addresses are as follows:
Business address Postal addressBlock C, Upper Grayston Office Park PO Box 786141152 Ann Crescent SandtonStrathavon 2146Sandton2199
3. Corporate strategyCEF has continued with the development of its strategy in terms of the mandate issued to it in the form of a Ministerial Directive dated December 2003. The company focuses on the development of renewable and alternative energy technologies. These activities are largely driven through the EDC division of CEF which has a split commercial and developmental focus.
All entities in the Group review their corporate strategy on an annual basis and enter into shareholders compacts with their holding company. Performance against these compacts is monitored throughout the year.
4. Nature of business
Principal activities of the companyThe principal activity of CEF in terms of the Central Energy Fund Act, is to give effect to the objectives of the Central Energy Fund which, to quote the Act, are to finance and promote:• The acquisition of coal, the exploitation of coal deposits, the manufacture of liquid fuel, oil and
other products from coal, the marketing of the said products and any matter connected with the said acquisition, exploitation, manufacture and marketing;
• The acquisition, generation, manufacture, marketing or distribution of any other forms of energy and research connected therewith; and
• Any other object for which the fund may be applied, and which has been designated or approved by the said Minister with the concurrence of the Minister of Finance.
5. Review of financial position
Analysis and review of results and financial positionThe Group realised a net loss of R82 million (2009: R2 314 million profit) for the year under review. Sales revenues were particularly low at R8 559 million (2009: R12 337 million) and are attributed to the high oil prices which averaged USD68.78 per barrel versus the previous year’s USD83.87.
Overall Group operating costs and cost of sale (R10 553 million) decreased by 15% from the previous year (2009: R12 474 million). This was mainly due to the increased cost of feedstock purchases as a result of the high oil prices and the stronger rand.
The Group recorded a pretax loss of R431 million, which reflects a decrease on the prior year profit of R1 906 million. Brass Exploration Unlimited has been classified as a discontinuing operation and reflects a profit of R57 million (2009: R436 million) net of taxation.
The Group balance sheet remains strong with total assets of R32 791 million (2009: R32 377 million).
PAGE 35
DIRECTORS’ REPORT
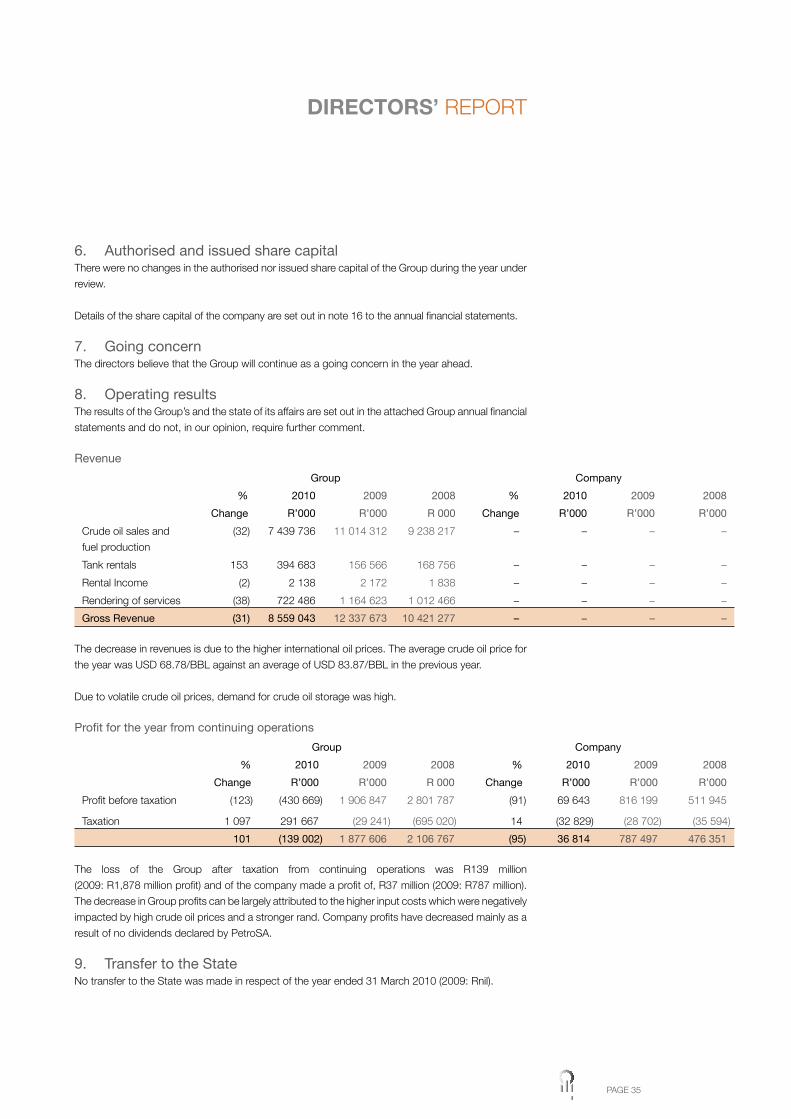
6. Authorised and issued share capitalThere were no changes in the authorised nor issued share capital of the Group during the year under
review.
Details of the share capital of the company are set out in note 16 to the annual financial statements.
7. Going concernThe directors believe that the Group will continue as a going concern in the year ahead.
8. Operating resultsThe results of the Group’s and the state of its affairs are set out in the attached Group annual financial
statements and do not, in our opinion, require further comment.
Revenue
Group Company
% 2010 2009 2008 % 2010 2009 2008
Change R’000 R’000 R 000 Change R’000 R’000 R’000
Crude oil sales and
fuel production
(32) 7 439 736 11 014 312 9 238 217 – – – –
Tank rentals 153 394 683 156 566 168 756 – – – –
Rental Income (2) 2 138 2 172 1 838 – – – –
Rendering of services (38) 722 486 1 164 623 1 012 466 – – – –
Gross Revenue (31) 8 559 043 12 337 673 10 421 277 – – – –
The decrease in revenues is due to the higher international oil prices. The average crude oil price for
the year was USD 68.78/BBL against an average of USD 83.87/BBL in the previous year.
Due to volatile crude oil prices, demand for crude oil storage was high.
Profit for the year from continuing operations
Group Company
% 2010 2009 2008 % 2010 2009 2008
Change R’000 R’000 R 000 Change R’000 R’000 R’000
Profit before taxation (123) (430 669) 1 906 847 2 801 787 (91) 69 643 816 199 511 945
Taxation 1 097 291 667 (29 241) (695 020) 14 (32 829) (28 702) (35 594)
101 (139 002) 1 877 606 2 106 767 (95) 36 814 787 497 476 351
The loss of the Group after taxation from continuing operations was R139 million
(2009: R1,878 million profit) and of the company made a profit of, R37 million (2009: R787 million).
The decrease in Group profits can be largely attributed to the higher input costs which were negatively
impacted by high crude oil prices and a stronger rand. Company profits have decreased mainly as a
result of no dividends declared by PetroSA.
9. Transfer to the StateNo transfer to the State was made in respect of the year ended 31 March 2010 (2009: Rnil).
PAGE 36 CEF (PTY) LTD ANNUAL REPORT 2010
10. Materiality and significant frameworkA materiality and significance framework has been developed for reporting losses through criminal
conduct and irregular, fruitless and wasteful expenditure, as well as for significant transactions
envisaged per section 54(2) of the PFMA that requires ministerial approval. The framework was
finalised after consultation with the external auditors and has been formally approved by the Board.
11. Post balance sheet eventsOn 12 November 2009, SFF Board passed a resolution to terminate its service level agreement with
PetroSA. As of 1 April 2010 all SFF operations will revert to SFF.
The directors are not aware of any other matters or circumstances arising since the end of the
financial year, not otherwise dealt with in the financial statements which significantly affect the
financial position of the company or the results of the operations.
12. Other activities administered by CEF
Equalisation FundThis statutory fund is regulated by Ministerial Directives issued by the Minister of Energy in concurrence
with the Minister of Finance as laid down by the CEF Act. The company provides administrative and
accounting services to the Fund.
Mine Health and Safety CouncilCEF manages some of the cash resources of the Council.
The South African Petroleum Sector Policy Research and Capacity Development Phase II Fund (Norad Fund)CEF manages the surplus cash and carries out the administration and accounting function of the
Fund. This function is in the process of being handed over to the DoE. It is anticipated that this will
be completed during the next financial year.
13. ShareholderThe company is controlled by the Department of Energy. All shares are held by the State and are not
transferable. This shareholding is in terms of the Central Energy Fund Act.
14. Litigations
CEFEmployee disputeCEF has a potential litigation arising from contractual disputes.
Solar Water Heaters ContractCEF instituted an arbitration process relating to a contractor disputed with one of the service
providers. The arbitration was set for 20 May 2010 but the legal representative for the service
provider requested a postponement for a date still to be set .
ETAETA has a potential litigation by one of its contractors and the company’s legal advisor does not
foresee any potential losses being incurred.
PAGE 37
SFFProperty rentalsLegal action has been taken by SFF against a client for breach of a contract for non – payment of
their property rent. The client has absconded and no longer occupies the premises. A provision
amounting to R156 000 has been made in respect of bad debts. However, SFF will continue to seek
legal restitution in this matter.
Property developmentPetroSA/SFF had instituted an application to the high court for the review and an order setting aside
the decision made by the City of Cape Town Municipality in approving certain sub – divisions as well
as an interdict against the developer for the development of the proposed estate. The reason for
the application is to prevent the developer from developing the portion of the land which falls in the
“separation distance” directly adjacent to the Milnerton tank farm.
SFF is confident that the case will be ruled in their favour, and therefore do not anticipate any present
and future liabilities, other than legal fees. However, SFF continues to seek legal recourse against the
application by the property developers, as a prudent measure to prohibit any future environmental
claims which may arise should the development encroach beyond the prescribed buffer zone.
African Exploration Mining and Finance Corporation (Pty) LtdThe dispute relates to an exchange agreement concluded between a mining company and SFF
Association (a subsidiary of CEF) prior to the existence of the MPRD Act and Royalty Act . AEMFC
as a mining subsidiary company of CEF is responsible for the lodging of the Declaratory Order with
the High Court.
Another mining company lodged an application with the High Court seeking to nullify the converted
old order prospecting right that was granted to AEMFC on the grounds that they also have a valid
prospecting right on the same area as well as mining rights on some of the farm portions on the
same area under dispute. AEMFC has opposed this application and has in turn filed for a counter
motion.
The annual report set out on pages 32 to 136, which have been prepared on the going concern
basis, were approved by the Board of directors on 29 July 2010 and were signed on its behalf by:
Ms B Mabuza Mr M Damane
Chairperson Executive Director
Sandton
29 July 2010
DIRECTORS’ REPORT
PAGE 38 CEF (PTY) LTD ANNUAL REPORT 2010
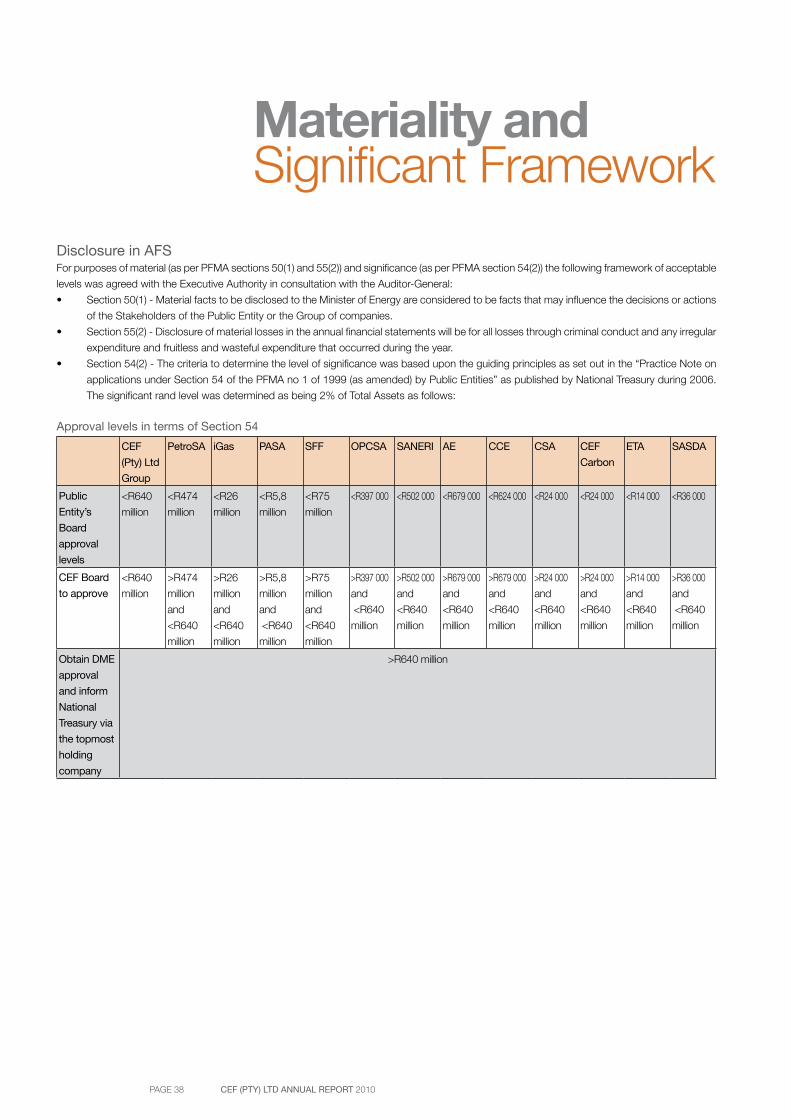
Disclosure in AFSFor purposes of material (as per PFMA sections 50(1) and 55(2)) and significance (as per PFMA section 54(2)) the following framework of acceptable
levels was agreed with the Executive Authority in consultation with the Auditor-General:
• Section 50(1) - Material facts to be disclosed to the Minister of Energy are considered to be facts that may influence the decisions or actions
of the Stakeholders of the Public Entity or the Group of companies.
• Section 55(2) - Disclosure of material losses in the annual financial statements will be for all losses through criminal conduct and any irregular
expenditure and fruitless and wasteful expenditure that occurred during the year.
• Section 54(2) - The criteria to determine the level of significance was based upon the guiding principles as set out in the “Practice Note on
applications under Section 54 of the PFMA no 1 of 1999 (as amended) by Public Entities” as published by National Treasury during 2006.
The significant rand level was determined as being 2% of Total Assets as follows:
Approval levels in terms of Section 54
CEF
(Pty) Ltd
Group
PetroSA iGas PASA SFF OPCSA SANERI AE CCE CSA CEF
Carbon
ETA SASDA
Public
Entity’s
Board
approval
levels
<R640
million
<R474
million
<R26
million
<R5,8
million
<R75
million
<R397 000 <R502 000 <R679 000 <R624 000 <R24 000 <R24 000 <R14 000 <R36 000
CEF Board
to approve
<R640
million
>R474
million
and
<R640
million
>R26
million
and
<R640
million
>R5,8
million
and
<R640
million
>R75
million
and
<R640
million
>R397 000
and
<R640
million
>R502 000
and
<R640
million
>R679 000
and
<R640
million
>R679 000
and
<R640
million
>R24 000
and
<R640
million
>R24 000
and
<R640
million
>R14 000
and
<R640
million
>R36 000
and
<R640
million
Obtain DME
approval
and inform
National
Treasury via
the topmost
holding
company
>R640 million
Materiality andSignificant Framework
PAGE 39
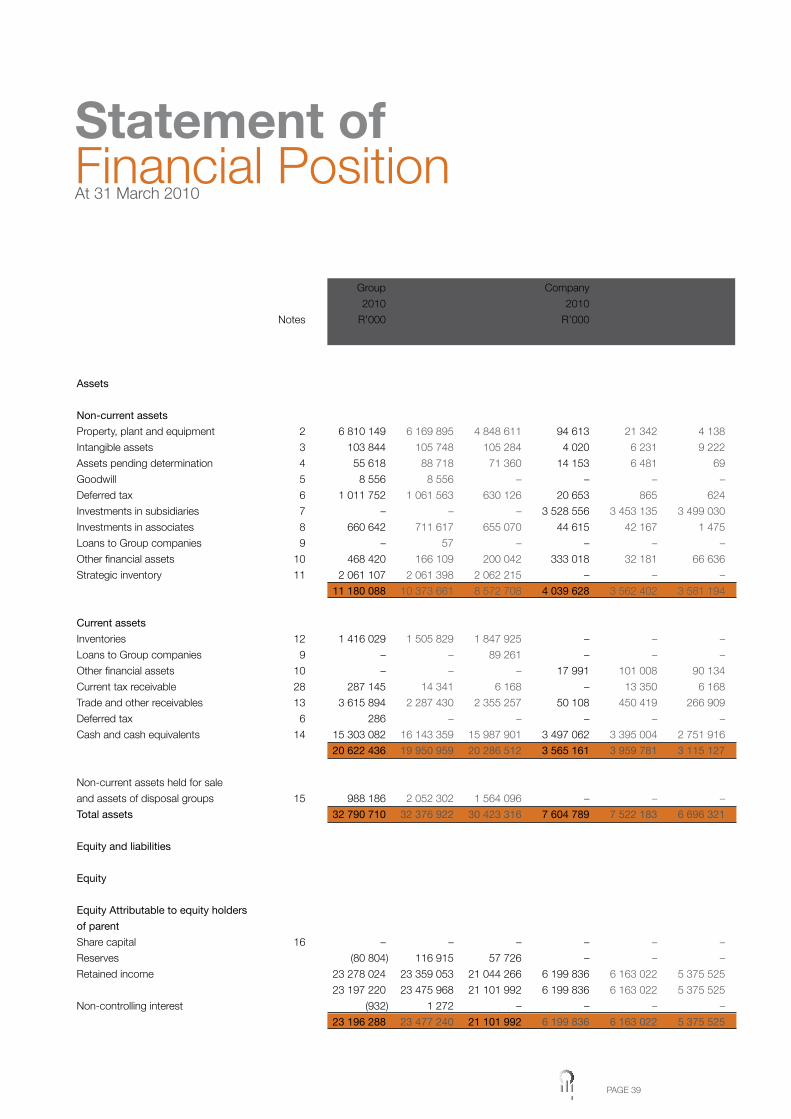
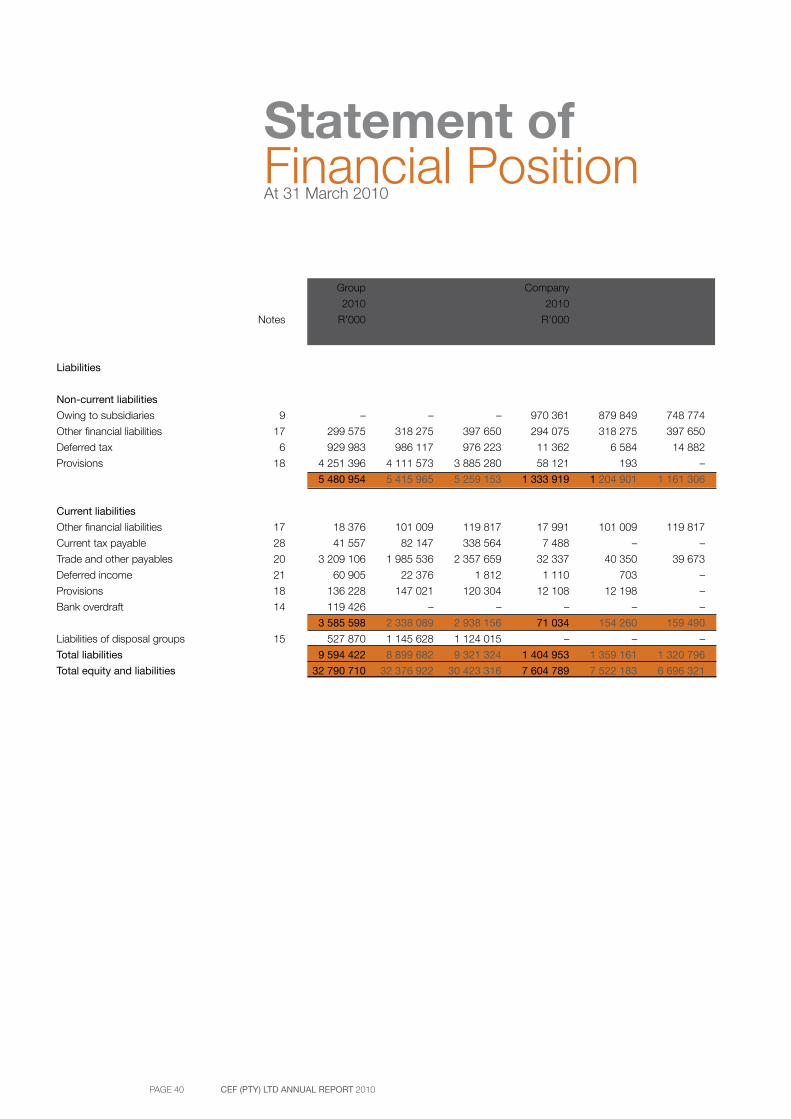
At 31 March 2010
Statement ofFinancial Position
Group Group Group Company Company Company
2010 2009 2008 2010 2009 2008
Notes R’000 R’000 R’000 R’000 R’000 R’000
Restated Restated Restated
Assets
Non-current assets Property, plant and equipment 2 6 810 149 6 169 895 4 848 611 94 613 21 342 4 138
Intangible assets 3 103 844 105 748 105 284 4 020 6 231 9 222
Assets pending determination 4 55 618 88 718 71 360 14 153 6 481 69
Goodwill 5 8 556 8 556 – – – –
Deferred tax 6 1 011 752 1 061 563 630 126 20 653 865 624
Investments in subsidiaries 7 – – – 3 528 556 3 453 135 3 499 030
Investments in associates 8 660 642 711 617 655 070 44 615 42 167 1 475
Loans to Group companies 9 – 57 – – – –
Other financial assets 10 468 420 166 109 200 042 333 018 32 181 66 636
Strategic inventory 11 2 061 107 2 061 398 2 062 215 – – –
11 180 088 10 373 661 8 572 708 4 039 628 3 562 402 3 581 194
Current assets
Inventories 12 1 416 029 1 505 829 1 847 925 – – –
Loans to Group companies 9 – – 89 261 – – –
Other financial assets 10 – – – 17 991 101 008 90 134
Current tax receivable 28 287 145 14 341 6 168 – 13 350 6 168
Trade and other receivables 13 3 615 894 2 287 430 2 355 257 50 108 450 419 266 909
Deferred tax 6 286 – – – – –
Cash and cash equivalents 14 15 303 082 16 143 359 15 987 901 3 497 062 3 395 004 2 751 916
20 622 436 19 950 959 20 286 512 3 565 161 3 959 781 3 115 127
Non-current assets held for sale
and assets of disposal groups 15 988 186 2 052 302 1 564 096 – – –
Total assets 32 790 710 32 376 922 30 423 316 7 604 789 7 522 183 6 696 321
Equity and liabilities
Equity
Equity Attributable to equity holders
of parent
Share capital 16 – – – – – –
Reserves (80 804) 116 915 57 726 – – –
Retained income 23 278 024 23 359 053 21 044 266 6 199 836 6 163 022 5 375 525
23 197 220 23 475 968 21 101 992 6 199 836 6 163 022 5 375 525
Non-controlling interest (932) 1 272 – – – –
23 196 288 23 477 240 21 101 992 6 199 836 6 163 022 5 375 525
PAGE 40 CEF (PTY) LTD ANNUAL REPORT 2010
At 31 March 2010
Statement ofFinancial Position
Group Group Group Company Company Company
2010 2009 2008 2010 2009 2008
Notes R’000 R’000 R’000 R’000 R’000 R’000
Restated Restated Restated
Liabilities
Non-current liabilities
Owing to subsidiaries 9 – – – 970 361 879 849 748 774
Other financial liabilities 17 299 575 318 275 397 650 294 075 318 275 397 650
Deferred tax 6 929 983 986 117 976 223 11 362 6 584 14 882
Provisions 18 4 251 396 4 111 573 3 885 280 58 121 193 –
5 480 954 5 415 965 5 259 153 1 333 919 1 204 901 1 161 306
Current liabilities
Other financial liabilities 17 18 376 101 009 119 817 17 991 101 009 119 817
Current tax payable 28 41 557 82 147 338 564 7 488 – –
Trade and other payables 20 3 209 106 1 985 536 2 357 659 32 337 40 350 39 673
Deferred income 21 60 905 22 376 1 812 1 110 703 –
Provisions 18 136 228 147 021 120 304 12 108 12 198 –
Bank overdraft 14 119 426 – – – – –
3 585 598 2 338 089 2 938 156 71 034 154 260 159 490
Liabilities of disposal groups 15 527 870 1 145 628 1 124 015 – – –
Total liabilities 9 594 422 8 899 682 9 321 324 1 404 953 1 359 161 1 320 796
Total equity and liabilities 32 790 710 32 376 922 30 423 316 7 604 789 7 522 183 6 696 321
PAGE 41
Group Group Group Company Company Company
2010 2009 2008 2010 2009 2008
Notes R’000 R’000 R’000 R’000 R’000 R’000
Restated Restated Restated
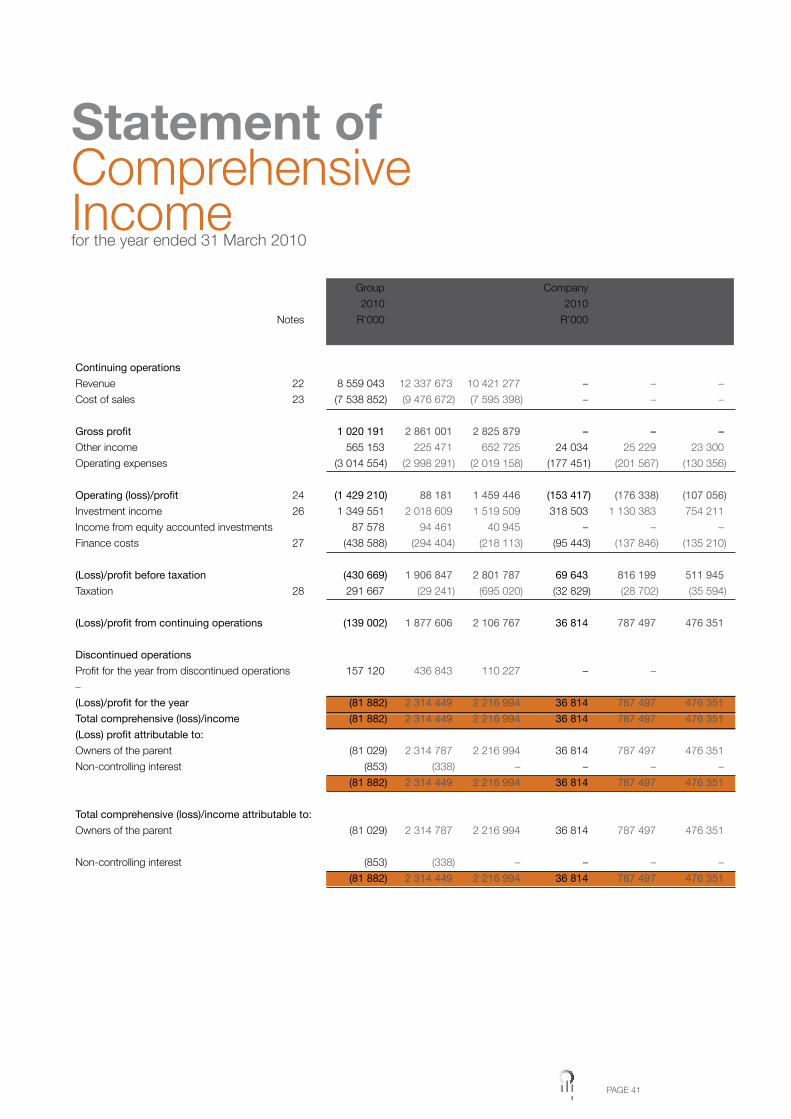
Continuing operations
Revenue 22 8 559 043 12 337 673 10 421 277 – – –
Cost of sales 23 (7 538 852) (9 476 672) (7 595 398) – – –
Gross profit 1 020 191 2 861 001 2 825 879 – – –
Other income 565 153 225 471 652 725 24 034 25 229 23 300
Operating expenses (3 014 554) (2 998 291) (2 019 158) (177 451) (201 567) (130 356)
Operating (loss)/profit 24 (1 429 210) 88 181 1 459 446 (153 417) (176 338) (107 056)
Investment income 26 1 349 551 2 018 609 1 519 509 318 503 1 130 383 754 211
Income from equity accounted investments 87 578 94 461 40 945 – – –
Finance costs 27 (438 588) (294 404) (218 113) (95 443) (137 846) (135 210)
(Loss)/profit before taxation (430 669) 1 906 847 2 801 787 69 643 816 199 511 945
Taxation 28 291 667 (29 241) (695 020) (32 829) (28 702) (35 594)
(Loss)/profit from continuing operations (139 002) 1 877 606 2 106 767 36 814 787 497 476 351
Discontinued operations
Profit for the year from discontinued operations 157 120 436 843 110 227 – –
–
(Loss)/profit for the year (81 882) 2 314 449 2 216 994 36 814 787 497 476 351
Total comprehensive (loss)/income (81 882) 2 314 449 2 216 994 36 814 787 497 476 351
(Loss) profit attributable to:
Owners of the parent (81 029) 2 314 787 2 216 994 36 814 787 497 476 351
Non-controlling interest (853) (338) – – – –
(81 882) 2 314 449 2 216 994 36 814 787 497 476 351
Total comprehensive (loss)/income attributable to:
Owners of the parent (81 029) 2 314 787 2 216 994 36 814 787 497 476 351
Non-controlling interest (853) (338) – – – –
(81 882) 2 314 449 2 216 994 36 814 787 497 476 351
for the year ended 31 March 2010
Statement ofComprehensive Income
PAGE 42 CEF (PTY) LTD ANNUAL REPORT 2010
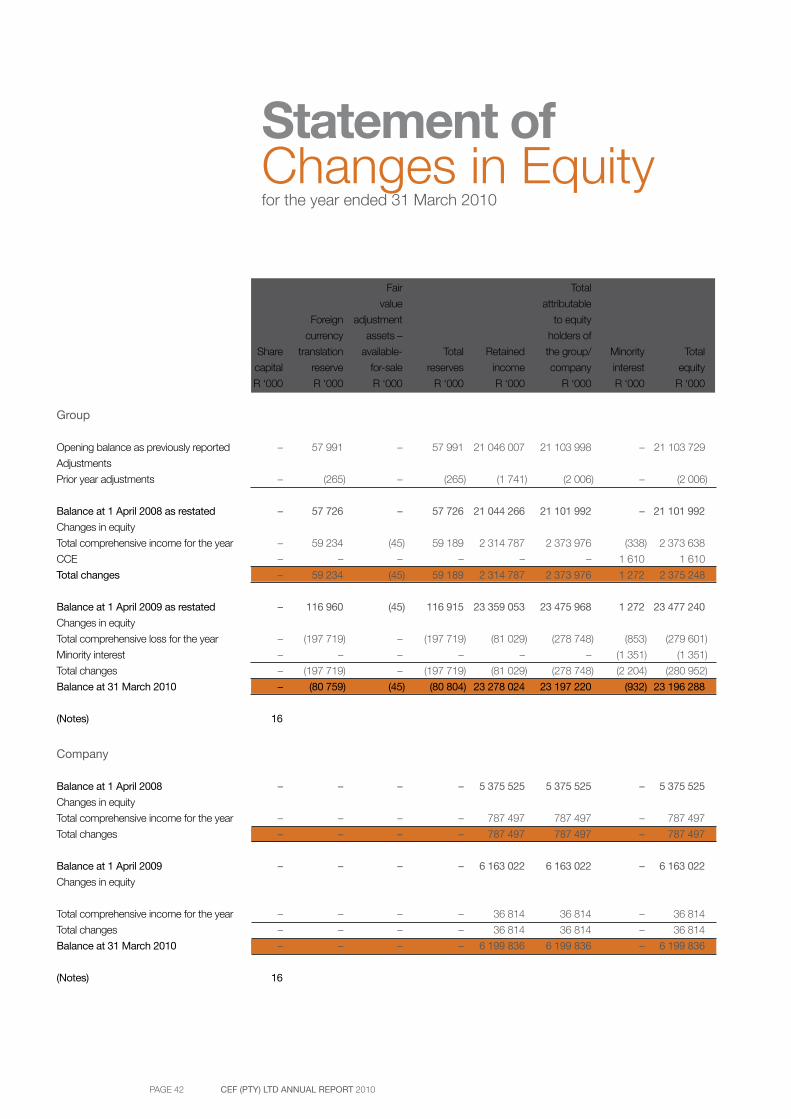
Statement ofChanges in Equityfor the year ended 31 March 2010
Fair Total
value attributable
Foreign adjustment to equity
currency assets – holders of
Share translation available- Total Retained the group/ Minority Total
capital reserve for-sale reserves income company interest equity
R ‘000 R ‘000 R ‘000 R ‘000 R ‘000 R ‘000 R ‘000 R ‘000
Group
Opening balance as previously reported – 57 991 – 57 991 21 046 007 21 103 998 – 21 103 729
Adjustments
Prior year adjustments – (265) – (265) (1 741) (2 006) – (2 006)
Balance at 1 April 2008 as restated – 57 726 – 57 726 21 044 266 21 101 992 – 21 101 992
Changes in equity
Total comprehensive income for the year – 59 234 (45) 59 189 2 314 787 2 373 976 (338) 2 373 638
CCE – – – – – – 1 610 1 610
Total changes – 59 234 (45) 59 189 2 314 787 2 373 976 1 272 2 375 248
Balance at 1 April 2009 as restated – 116 960 (45) 116 915 23 359 053 23 475 968 1 272 23 477 240
Changes in equity
Total comprehensive loss for the year – (197 719) – (197 719) (81 029) (278 748) (853) (279 601)
Minority interest – – – – – – (1 351) (1 351)
Total changes – (197 719) – (197 719) (81 029) (278 748) (2 204) (280 952)
Balance at 31 March 2010 – (80 759) (45) (80 804) 23 278 024 23 197 220 (932) 23 196 288
(Notes) 16
Company
Balance at 1 April 2008 – – – – 5 375 525 5 375 525 – 5 375 525
Changes in equity
Total comprehensive income for the year – – – – 787 497 787 497 – 787 497
Total changes – – – – 787 497 787 497 – 787 497
Balance at 1 April 2009 – – – – 6 163 022 6 163 022 – 6 163 022
Changes in equity
Total comprehensive income for the year – – – – 36 814 36 814 – 36 814
Total changes – – – – 36 814 36 814 – 36 814
Balance at 31 March 2010 – – – – 6 199 836 6 199 836 – 6 199 836
(Notes) 16
PAGE 43
Group Group Group Company Company Company
2010 2009 2008 2010 2009 2008
Notes R’000 R’000 R’000 R’000 R’000 R’000
Restated Restated Restated
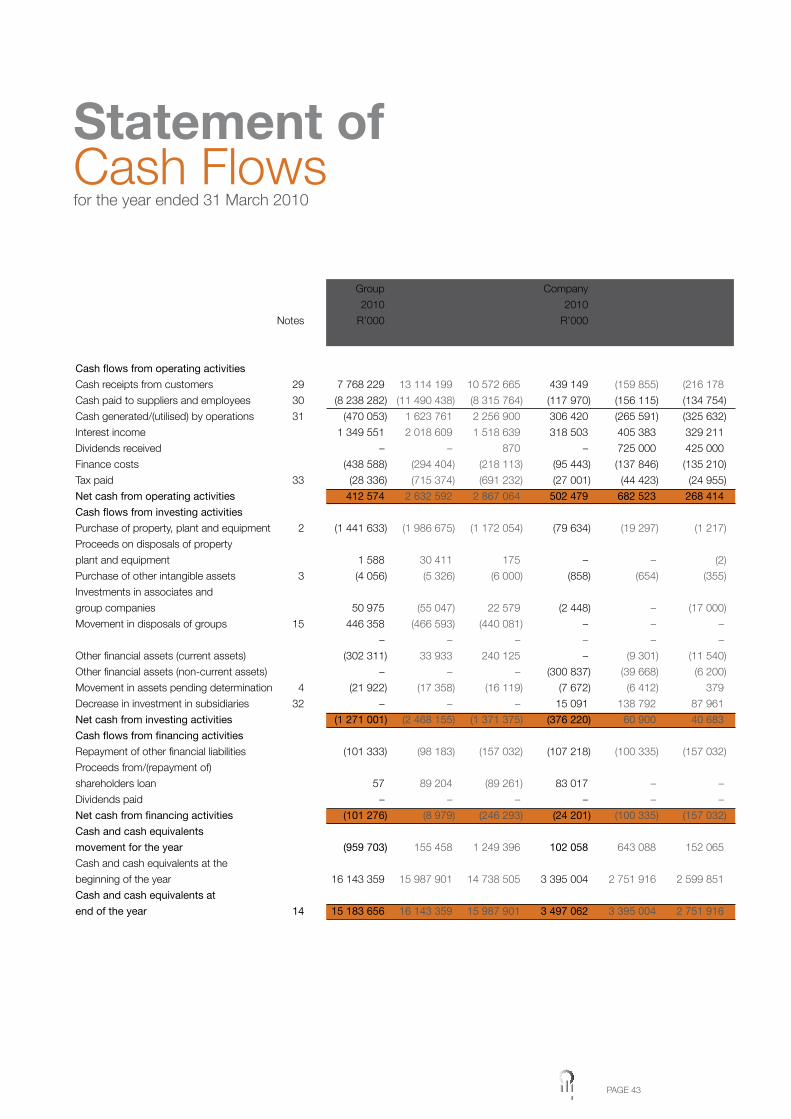
Cash flows from operating activities
Cash receipts from customers 29 7 768 229 13 114 199 10 572 665 439 149 (159 855) (216 178
Cash paid to suppliers and employees 30 (8 238 282) (11 490 438) (8 315 764) (117 970) (156 115) (134 754)
Cash generated/(utilised) by operations 31 (470 053) 1 623 761 2 256 900 306 420 (265 591) (325 632)
Interest income 1 349 551 2 018 609 1 518 639 318 503 405 383 329 211
Dividends received – – 870 – 725 000 425 000
Finance costs (438 588) (294 404) (218 113) (95 443) (137 846) (135 210)
Tax paid 33 (28 336) (715 374) (691 232) (27 001) (44 423) (24 955)
Net cash from operating activities 412 574 2 632 592 2 867 064 502 479 682 523 268 414
Cash flows from investing activities
Purchase of property, plant and equipment 2 (1 441 633) (1 986 675) (1 172 054) (79 634) (19 297) (1 217)
Proceeds on disposals of property
plant and equipment 1 588 30 411 175 – – (2)
Purchase of other intangible assets 3 (4 056) (5 326) (6 000) (858) (654) (355)
Investments in associates and
group companies 50 975 (55 047) 22 579 (2 448) – (17 000)
Movement in disposals of groups 15 446 358 (466 593) (440 081) – – –
– – – – – –
Other financial assets (current assets) (302 311) 33 933 240 125 – (9 301) (11 540)
Other financial assets (non-current assets) – – – (300 837) (39 668) (6 200)
Movement in assets pending determination 4 (21 922) (17 358) (16 119) (7 672) (6 412) 379
Decrease in investment in subsidiaries 32 – – – 15 091 138 792 87 961
Net cash from investing activities (1 271 001) (2 468 155) (1 371 375) (376 220) 60 900 40 683
Cash flows from financing activities
Repayment of other financial liabilities (101 333) (98 183) (157 032) (107 218) (100 335) (157 032)
Proceeds from/(repayment of)
shareholders loan 57 89 204 (89 261) 83 017 – –
Dividends paid – – – – – –
Net cash from financing activities (101 276) (8 979) (246 293) (24 201) (100 335) (157 032)
Cash and cash equivalents
movement for the year (959 703) 155 458 1 249 396 102 058 643 088 152 065
Cash and cash equivalents at the
beginning of the year 16 143 359 15 987 901 14 738 505 3 395 004 2 751 916 2 599 851
Cash and cash equivalents at
end of the year 14 15 183 656 16 143 359 15 987 901 3 497 062 3 395 004 2 751 916
for the year ended 31 March 2010
Statement ofCash Flows
PAGE 44 CEF (PTY) LTD ANNUAL REPORT 2010
AccountingPolicies
1. Presentation of annual financial statementsThe following are the principal accounting policies of the Group which are, in all material respects, consistent with those of the previous year, except
as otherwise indicated:
1.1 Basis of preparationThe financial statements are prepared under the historical cost basis, except where otherwise specified.
The Group annual financial statements are prepared in accordance with South African Statements of Generally Accepted Accounting Practice; the
Companies Act of South Africa and the Corporate Laws Amendment Act.
These annual financial statements are presented in South African Rands. Rounding is to the nearest Rand in thousands.
Assets and liabilities or income and expenditure will not be offset, unless it is required or permitted by a standard.
1.2 Basis of consolidationThe consolidated financial statements incorporate the annual financial statements of the entity and enterprises controlled by the entity at 31 March
each year.
Control is achieved where the entity has the power to govern the financial and operating policies of an investee enterprise so as to obtain benefits
from its activities.
On acquisition, the assets and liabilities of the relevant subsidiaries are measured at their fair values at the effective date of acquisition.
The results of subsidiaries, associates and joint ventures acquired or disposed of during the year are included in the consolidated statement of
comprehensive income from the effective date of acquisition or up to the effective date of disposal, as appropriate.
Where necessary, adjustments are made to the annual financial statements of subsidiaries to bring the accounting policies used in line with the
Group accounting policies.
All significant inter entity transactions, unrealised profit and losses and balances between Group enterprises are eliminated on consolidation.
The most recent audited annual financial statements of associates, joint ventures and subsidiaries are used where available, which are all within
three months of the year end of the Group. Adjustments are made to the financial results for material transactions and events in the intervening
period. Losses in excess of the Group’s interest are not recognised unless there is a binding obligation to contribute to the losses.
Company financial statementsInvestments in subsidiaries, associates and joint ventures in the financial statements presented by the company are recognised at cost, except
where there is a permanent decline in the value in which case they are written down to fair value.
Consolidated financial statements
Business combinationsSubsidiaries are entities controlled by the holding company. The consolidated financial statements incorporate the assets, liabilities, income,
expenses and cash flows of the company and all entities controlled by the company as if they are a single economic entity.
PAGE 45
Acquisitions of subsidiaries and businesses are accounted for using the purchase method. The cost of the business combination is measured as
the aggregate of the fair values (at the date of exchange) of assets given, liabilities incurred or assumed and equity instruments issued by the Group
in exchange for control of the acquiree, plus any costs directly attributable to the business combination. The acquire’s identifiable assets, liabilities
and contingent liabilities that meet the conditions for recognition under IFRS 3 (AC 140): Business Combinations are recognised at their fair values
at the acquisition date, except for non-current assets (or disposal groups) that are classified as held for sale in accordance with IFRS 5 (AC 142):
Non-current Assets Held for Sale and Discontinued Operations, which are recognised and measured at fair value less costs to sell.
Goodwill arising on acquisition is recognised as an asset and initially measured at cost, being the excess of the cost of the business combination
over the Group’s interest in the new fair value of the identifiable assets, liabilities and contingent liabilities recognised. If, after reassessment,
the Group’s interest in the net fair value of the acquire’s identifiable assets, liabilities and contingent liabilities exceeds the cost of the business
combination, the excess is recognised immediately in profit or loss.
Interest in associatesAn associate is an enterprise in which the Group has significant influence, through participation in the financial and operating policy decisions of
the investee, but not control.
The results and assets and liabilities of associates are incorporated in the financial statements by using the equity method of accounting, except
when the investment is classified as held for sale, in which case it is accounted for in accordance with IFRS 5 (AC 142): Non-current Assets Held
for Sale and Discontinued Operations. Under the equity method, investments in associates are carried in the consolidated balance sheet at cost
as adjusted for post-acquisition changes in the Group’s share of the net assets of the associate, less any impairment in the value of individual
investments. Losses of an associate in excess of the Group’s interest in that associate (which includes any long-term interests that, in substance,
form part of the Group’s net investment in associate) are recognised only to the extent that the Group has incurred legal or constructive obligations
or made payments on behalf of the associate.
Any excess of the cost of acquisition over the Group’s share of the net fair value of the identifiable assets, liabilities and contingent liabilities of the
associate recognised at the date of acquisition is recognised as goodwill. The goodwill is included within the carrying amount of the investment
and is assessed for impairment as part of that investment. Any excess of the Group’s share of the net fair value of the identifiable assets, liabilities
and contingent liabilities over the cost of acquisition, after reassessment, is recognised immediately in profit or loss.
Interest in joint venturesA joint venture is a contractual agreement between two or more parties to undertake an economic activity, which is under joint control that is
when the strategic financial and operating policy decisions relating to the activities of the joint venture require the unanimous consent of the parties
sharing control.
Where a Group entity undertakes its activities under joint venture arrangements directly, the Group’s share of jointly controlled assets and any
liabilities incurred jointly with other ventures are recognised in the financial statements of the relevant entity and classified according to their nature.
Liabilities and expenses incurred directly in respect of interests in jointly controlled assets are accounted for on an accrual basis. Income from the
sale or use of the Group’s share of the output of jointly controlled assets, and its share of joint venture expenses, are recognised when it is probable
that the economic benefits associated with the transactions will flow to/from the Group and their amount can be measured reliably.
Joint venture arrangements that involve the establishment of a separate entity in which each venture has an interest are referred to as jointly
controlled entities. The Group reports its interests in jointly controlled entities using proportionate consolidation, except when the investment is
classified as held for sale, in which case it is accounted for in accordance with IFRS 5 (AC 142): Non-current Assets Held for Sale and Discontinued
Operations. The Group’s share of the assets, liabilities, income and expenses of jointly controlled entities are combined with the equivalent items
in the consolidated financial statements on a line-by-line basis.
PAGE 46 CEF (PTY) LTD ANNUAL REPORT 2010
Any goodwill arising on the acquisition of the Group’s interest in a jointly controlled entity is accounted for in accordance with the Group’s
accounting policy for goodwill arising on the acquisition of a subsidiary.
All significant intercompany transactions and balances between Group entities are eliminated on proportionate consolidation to the extent of the
Group’s interest in the joint venture.
1.3 Translation of foreign currenciesTransactionsForeign currency transactions are recognised, initially in Rand by applying the foreign currency amount to the exchange rate between the Rand and
the foreign currency at the date of the transaction, and is restated at each reporting date by using the ruling exchange rate at that date.
Balance SheetAt each balance sheet date:
• Foreign currency monetary items are measured using the 11H00 rate;
• Non-monetary items, which are carried in terms of historical cost denominated in a foreign currency, are reported using the exchange rate
at the date of the transaction, and
• Non-monetary items which are carried at fair value denominated in a foreign currency are reported using the exchange rates that existed
when the values were determined.
Exchange differencesExchange differences arising on the settlement of monetary items or on reporting a company’s monetary items at rates different from those at
which they were initially recorded during the period, or reported in previous annual financial statements, are recognised as income or expenses
in the period in which they arise. Exchange differences are capitalised where they relate to the purchase or construction of property, plant and
equipment.
Foreign entitiesIn translating the financial statements of a foreign entity for incorporation in the Group financial statements, the following is applied:
• The assets and liabilities, both monetary and non-monetary, of the foreign entity are translated at the closing exchange rate at the financial
year end date.
• Income and expense items of the foreign entity are translated at the weighted average rates of exchange for the year.
• All resulting exchange differences are taken directly to the foreign currency translation reserve which is classified as a non-distributable
reserve. On disposal the related amount in this reserve will be recognised in profit or loss.
1.4 Post-balance sheet eventsRecognised amounts in the annual financial statements are adjusted to reflect events arising after the balance sheet date that provide evidence
of conditions that existed at the balance sheet date. Events after the balance sheet that are indicative of conditions that arose after the balance
sheet date are dealt with by way of a note.
1.5 Comparative figuresComparative figures are restated in the event of a change in accounting policy or prior period error.
1.6 Property, plant and equipmentProperty, plant and equipment represent tangible items that are held for use in the production or supply of goods or services, for rental to others,
or for administrative purposes and are expected to be used during more than one period.
PAGE 47
1.6 Property, plant and equipment (continued)Carrying amountsAll property, plant and equipment are stated at cost less accumulated depreciation and accumulated impairment losses.
CostCost includes all costs directly attributable to bringing the assets to the working condition for their intended use. Improvements are capitalised.
Maintenance, repairs and renewals which neither materially add to the value of assets nor appreciably prolong their useful lives are charged against
income.
Finance costs directly associated with the construction or acquisition of major assets are capitalised at interest rates relating to loans specifically
raised for that purpose, or at the average borrowing rate where the general pool of borrowings is utilised.
DerecognitionThe carrying amount of an item of property, plant and equipment is derecognised on disposal.
Gains or losses on disposal of property, plant and equipment are determined by reference to their carrying amount. On disposal of revalued assets,
amounts in the revaluation reserve relating to that asset are transferred to retained earnings.
The gain or losses arising from derecognition of an item of property, plant and equipment is included in profit or loss. Gains on disposal will not be
classified as revenue.
DepreciationDepreciation is charged so as to write off the depreciable amount of the assets, other than land, over their estimated useful lives to estimated
residual values, using the straight line method or other acceptable method to write off the cost of each asset that reflects the pattern in which the
asset’s future economic benefits are expected to be consumed by the entity.
Where significant parts of an item have different useful lives to the item itself, these parts are depreciated over their estimated useful lives.
The following methods and rates are used during the year to depreciate property, plant and equipment to estimated residual values:
Item Average useful life
Land Not depreciated
Buildings 40 years
Production assets Units of production
Plant, equipment and exploration 3-8 years
Furniture, fittings and communication equipment 2-10 years
Motor vehicles 4-5 years
Computer equipment 3-6 years
Mainframe software 3-14 years
Oil pollution equipment 5-20 years
An exception is made for Production assets and Restoration costs where the units of production method is used to calculate depreciation.
Reference to the supplementary reserves disclosure can be made for more information on the reserves used. Improvements to leased premises
are written off over the period of the lease.
The methods of depreciation, useful lives and residual values are reviewed annually.
ACCOUNTING’ POLICIES
PAGE 48 CEF (PTY) LTD ANNUAL REPORT 2010
1.6 Property, plant and equipment (continued)Production assets (oil and gas fields)Oil and gas production assets are the aggregated exploration and evaluation tangible assets, and development expenditure associated with the
production of proved reserves.
Subsequent expenditure which enhances or extends the performance of oil and gas production assets beyond their original specifications is
recognised as capital expenditure and added to the original cost of the asset.
Production assets are depreciated over their expected useful lives. This applies from the date production commences, on a unit of production
basis, which is the ratio of oil and gas production in the period to the estimated quantities of proved and probable reserves at the end of the period
plus the production in the period, on a field-by-field basis. Units of production rates are based on the proved and probable developed reserves,
which are oil, gas and other mineral reserves estimated to be recoverable from existing facilities using current operating methods.
Where there has been a change in economic conditions that indicates a possible impairment in a discovery field, the recoverability of the net book
value relating to that field is assessed by comparison with the estimated discounted future cash flows based on management’s expectations of
future oil and gas prices and future costs. Where there is evidence of economic interdependency between fields, such as common infrastructure,
the fields are grouped as a single cash generating unit for impairment purposes.
Any impairment identified is charged to the Statement of Comprehensive Income as additional depreciation. Where conditions giving rise to
impairment subsequently reverse, the effect of the impairment charge is also reversed as a credit to the Statement of Comprehensive Income, net
of any depreciation that would have been charged since the impairment.
Restoration costsCost of property, plant and equipment also includes the estimated costs of dismantling and removing the assets and site rehabilitation costs.
Estimated decommissioning and restoration costs are based on current requirements, technology and price levels. Provision is made for all net
estimated abandonment costs as soon as an obligation to rehabilitate the area exists, based on the present value of the future estimated costs.
These costs are deferred and are depreciated over the useful life of the assets to which they relate using the unit of production method based on
the same reserve quantities as are used for the calculation of depletion of oil and gas production assets.
The amount recognised is the estimated cost of restoration, discounted to its net present value, and is reassessed each year in accordance
with local conditions and requirements. Changes in the estimated timing of decommissioning or decommissioning cost estimates are dealt with
prospectively by recording an adjustment to the provision, and a corresponding adjustment to property, plant and equipment. The unwinding of
the discount on the restoration provision is included as a finance cost.
1.7 Exploration; evaluation and development of oil and gas wellsThe “successful efforts” principle is used to account for oil and gas exploration and evaluation activities.
Pre-licensing costThese are costs incurred prior to the acquisition of a legal right to explore for oil and gas. They may include speculative seismic data and
subsequent geological and geophysical analysis of this data, but may not be exclusive to such costs. If such analysis suggests the presence of
reserves, then the costs are capitalised to an identified structure (field or reservoir). However, if the analysis is not definitive then these costs are
expensed in the year they are incurred.
PAGE 49
1.7 Exploration, evaluation and development of oil and gas wellsExploration and evaluation costsAll costs relating to the acquisition of licenses, exploration and evaluation of a well, field or exploration area are initially capitalised. Directly
attributable administration costs and interest payable are capitalised insofar as they relate to specific development activities.
These costs are then written off as exploration costs in the Statement of Comprehensive Income unless commercial reserves have been established
or the determination process has not been completed and there are no indications of impairment.
Assets pending determinationExploratory wells that discover potentially commercial reserves are capitalised pending a decision to further develop or a firm plan to develop has
been approved. These wells may remain capitalised for three years. If no such plan or development exists or information is obtained that raises
doubt about the economic or operating viability then these costs will be recognised in the profit or loss of that year. If a plan or intention to further
develop these wells or fields exists, the costs are transferred to development costs.
Development costsCosts of development wells, platforms, well equipment and attendant production facilities are capitalised. The cost of production facilities capitalised
includes finance costs incurred until the production facility is completed and ready for the start of the production phase. All development wells are
not depreciated until production starts and then they are depreciated on the Units of Production method calculated using the estimated proved
reserves.
Dry wellsGeological and geophysical costs, as well as all other costs relating to dry exploratory wells costs are recognised in the profit and loss in the year
they are incurred.
1.8 Intangible assetsAn intangible asset is an identifiable non-monetary asset without physical substance.
Intangible assets are initially recognised at cost if acquired separately or internally generated or at fair value if acquired as part of a business
combination. If assessed as having an indefinite useful life, the intangible asset is not amortised but tested for impairment annually and impaired if
necessary. If assessed as having a finite useful life, it is amortised over its useful life using a straight line basis and tested for impairment if there is
an indication that it may be impaired.
Research costs are recognised in profit or loss when incurredDevelopment costs are capitalised only if they result in an asset that can be identified, it is probable that the asset will generate future economic
benefits and the development cost can be reliably measured. Otherwise it is recognised in profit or loss.
Computer software 2 – 10 years
1.9 Impairment of non-financial assetsAt each balance sheet date, the Group reviews the carrying amounts of its tangible and intangible assets to determine whether there is any
indication that those assets may be impaired. If such indication exists, the recoverable amount of the asset is estimated in order to determine the
extent of the impairment loss (if any). Where it is not possible to estimate the recoverable amount for an individual asset, the recoverable amount
is determined for the cash generating unit to which the asset belongs. Value in use is estimated taking into account future cash flows, forecast
market conditions and the expected lives of the assets.
ACCOUNTING’ POLICIES
PAGE 50 CEF (PTY) LTD ANNUAL REPORT 2010
1.9 Impairment of non-financial assets (continued)If the recoverable amount of an asset (or cash generating unit) is estimated to be less than its carrying amount, its carrying amount is reduced to
the higher of its recoverable amount and zero. Impairment losses are recognised in profit or loss. Subsequent to the recognition of the impairment
loss, the depreciation or amortisation charge for the asset is adjusted to allocate its remaining carrying value, less any residual value, over its
remaining useful life.
If an impairment loss is subsequently reversed, the carrying amount of the asset (or cash generating unit) is increased to the revised estimate of
its recoverable amount but limited to the carrying amount that would have been determined had an impairment loss not been recognised in prior
years. A reversal of an impairment loss is recognised in profit or loss.
1.10 LeasesFinance leases are recognised as assets and liabilities at the lower of the fair value of the assets and the present value of the minimum lease
payments at the date of the acquisition. Finance costs represent the difference between the total leasing commitments and the fair value of the
assets acquired. Finance costs are charged to the profit and loss over the term of the lease at the interest rates applicable to the lease on the
remaining balance of the obligations.
Rentals payable under operating leases are recognised in profit or loss on a straight line basis over the term of the relevant lease where significant
or another basis if more representative of the time pattern of the user’s benefit.
When an operating lease is terminated before the lease period has expired, any payment required to be made to the lessor by way of penalty is
recognised as an expense in the period in which termination takes place.
Contingent rentals are recognised in profit or loss as they accrue.
1.11 InventoriesTrading inventoryFinished and intermediate inventory is measured at the lower of cost and net realisable value according to the weighted average method. Cost
includes production expenditure, depreciation and a proportion of triennial turnaround expenses and replacement of catalysts, as well as transport
and handling costs. No account is taken of the value of raw materials and work in progress prior to it reaching intermediate storage tanks. Provision
is made for obsolete, slow moving and defective inventories.
Spares, catalysts and chemicalThese inventories are measured at the lower of cost on a weighted average cost basis and net realisable value less appropriate provision for
obsolescence in arriving at the net realisable value.
1.12 Financial instrumentsRecognitionFinancial assets and financial liabilities are recognised on the Group and company’s balance sheet when the Group and company becomes a party
to the contractual provisions of the instrument.
Financial assets and liabilities as a result of firm commitments are only recognised when one of the parties has performed under the contract.
Financial instruments recognised on the balance sheet include cash and cash equivalents, trade receivables, investments, trade payables and
borrowings.
PAGE 51
1.12 Financial instruments (continued)MeasurementFinancial assets and liabilities are initially measured at fair value, plus transaction costs. However transaction costs of financial assets and liabilities
classified as fair value through profit or loss are expensed. Subsequent measurement will depend on the classification of the financial instrument
as detailed below.
Financial assetsThe Group’s principal financial assets are investments and loans receivable, accounts receivable and cash and cash equivalents.
InvestmentsThe following categories of investments are measured at subsequent reporting dates at amortised cost by using the effective interest rate
method:
• Loans and receivables originated by the Group with fixed maturities;
• Held-to-maturity investments;
• An investment that does not have a quoted market price in an active market and whose fair value cannot be measured reliably using an
appropriate valuation model.
Loans and receivables with no fixed maturity period and other investments not covered above are classified as fair value through profit and loss
on initial recognition. Fair value for this purpose, is market value if listed or a value derived by using an appropriate valuation model, if unlisted.
Trade and other receivablesTrade and other receivables are classified as loans and receivables and are subsequently measured at amortised cost, less an allowance for
any uncollectable amounts. An estimate for impairment is made when objective evidence is available that indicates the collection of any amount
outstanding is no longer probable. Bad debts are written off when identified.
Cash and cash equivalentsCash and cash equivalents comprise cash at bank and on hand and instruments which are readily convertible to known amounts of cash and are
subject to an insignificant risk of change in value.
Financial liabilitiesThe Group’s principal financial liabilities are interest bearing borrowings, accounts payable and bank overdraft.
All financial liabilities are measured at amortised cost, comprising original debt less principal payments and amortisations, except for financial
liabilities held for trading; borrowings with no fixed maturity period and are classified as fair value through profit and loss on initial recognition and
derivative liabilities, which are subsequently measured at fair value. A change in fair value is recognised in profit or loss.
Derivative financial instrumentsDerivative financial instruments, principally interest rate swap contracts and forward foreign exchange contracts, are used by the company in its
management of financial risks.
Derivative financial instruments are initially measured at fair value on the contract date, and are remeasured to fair value at subsequent reporting
dates.
Payments and receipts under interest rate swap contracts are recognised in the statement of comprehensive income on a basis consistent with
the corresponding fluctuations in the interest payment on floating rate financial liabilities.
ACCOUNTING’ POLICIES
PAGE 52 CEF (PTY) LTD ANNUAL REPORT 2010
1.12 Financial instruments (continued)The carrying amounts of interest rate swaps, which comprise net interest receivables and payables accrued are included in assets and liabilities
respectively.
Gains and losses on subsequent measurementAll gains and losses arising from a change in fair value of or on disposal of held for trading financial assets are recognised in profit or loss.
Gains and losses arising from a change in the fair value of available for sale financial assets are recognised in equity, until the investment is disposed
of or is determined to be impaired, at which time the gain or loss is included in the profit or loss for the period.
Gains and losses arising from cash flow hedges are recognised in profit or loss.
In relation to fair value hedges, which meet the conditions for hedge accounting, the portion of the gain or loss on a hedging instrument that is
determined to be an effective hedge is recognised directly in equity and the ineffective portion is recognised in profit and loss.
If a hedged firm commitment or forecasted transaction results in the recognition of an asset or a liability, then the associated gains or losses
recognised in equity are adjusted against the initial measurement of the asset or liability. For all other cash flow hedges, amounts recognised in
equity are included in profit or loss in the same period during which the commitment or forecasted transaction affects profit or loss.
DerecognitionA financial asset or part thereof is derecognised when the Group realises the contractual rights to the benefits specified in the contract, the rights
expire, the Group surrenders those rights or otherwise loses control of the contractual rights that comprise the financial asset. On derecognition,
the difference between the carrying amount of the financial asset and the sum of the proceeds receivable and any prior adjustment to reflect the
fair value of the asset that had been reported in equity is included in net profit or loss for the period.
A financial liability or a part thereof is derecognised when the obligation specified in the contract is discharged, cancelled, or expires. On
derecognition, the difference between the carrying amount of the financial liability, including related unamortised costs, and the amount paid for it
is included in net profit or loss for the period.
Fair value considerationsThe fair values at which financial instruments are carried at the balance sheet date have been determined using available market prices. Where
market prices are not available, fair values have been calculated by discounting expected future cash flows at prevailing interest rates. The fair
values have been estimated using available market information and appropriate valuation methodologies, but are not necessarily indicative of the
amounts that the Group could realise in the normal course of business. The carrying amounts of financial assets and financial liabilities with a
maturity of less than one year are assumed to approximate their fair values due to the short term trading cycle of these items.
OffsettingFinancial assets and financial liabilities are offset if there is an intention to either net the asset and liability or to realise the asset and settle the liability
simultaneously and a legally enforceable right to set off exists.
PAGE 53
1.13 Post-employment benefit costsDefined contribution costsContributions to a defined contribution plan in respect of service in a particular period are recognised as an expense in that period.
Defined benefit costsCurrent service costs in respect of defined benefit plans are recognised as an expense in the current period.
Past service costs, experience adjustments, the effects of changes in actuarial assumptions and the effects of plan amendments in respect of
existing employees in a defined benefit plan are recognised in profit or loss systematically over the remaining work lives of those employees (except
in the case of shorter plan amendments where the use of a shorter time period is necessary to reflect the economic benefits by the enterprise).
The effects of plan amendments in respect of retired employees in a benefit plan are measured as the present value of the effect of the amended
benefits, and are recognised as an expense or as income in the period in which the plan amendment is made.
The cost of providing retirement benefits under a defined benefit plan is determined using a projected unit credit valuation method. Actuarial gains
and losses are recognised as income or expense in profit or loss immediately.
The Group operates both defined contribution and defined benefit plans, the assets of which are held in separate trustee administered funds. The
plans are funded by payments from the Group and employees, taking account of the recommendations of independent qualified actuaries. For
defined benefit plans the defined benefit obligation, the related current service cost, and where applicable, the past service costs are determined
by using the projected unit credit method.
Other post-employment obligationsPost-employment health care benefits are provided to retirees. The entitlement to post retirement health care benefits is based on the employees
remaining in service up to retirement age. The expected costs of these benefits are accrued over the period of employment, using an accounting
methodology similar to that for defined benefit pension plans. Valuations of these obligations are carried out annually by independent qualified
actuaries.
1.14 ProvisionsProvisions represent liabilities of uncertain timing or amounts.Provisions are recognised when a present legal or constructive obligation exists, as a result of past events, for which it is probable that an outflow
of economic benefits will be required to settle the obligation, and a reliable estimate can be made for the amount of the obligation. Provisions are
measured at the expenditure required to settle the present obligation. Where the effect of discounting is material, provisions are measured at their
present value using a pretax discount rate that reflects the current market assessment of the time value of money and the risks for which future
cash flow estimates have not been adjusted.
Provision for the cost of environmental and other remedial work such as reclamation costs, close down and restoration costs is made when such
expenditure is probable and the cost can be estimated with a reasonable range of possible outcomes.
1.15 Revenue recognitionRevenue is recognised when it is probable that future economic benefits will flow to the enterprise and these benefits can be measured reliably.
The measurement is at the fair value received or receivable net of VAT, cash discounts, rebates and settlement discounts.
Revenue from the rendering of services is measured using the stage of completion method based on the services performed to date as a
percentage of the total services to be performed. Revenue from the rendering of services is recognised when the amount of the revenue, the
related costs and the stage of completion can be measured reliably and when it is probable that the debtor will pay for the services.
ACCOUNTING’ POLICIES
PAGE 54 CEF (PTY) LTD ANNUAL REPORT 2010
Revenue from the sale of goods is recognised when the significant risks and rewards of ownership of the goods are transferred, when delivery has
been made and title has passed, when the amount of the revenue and the related costs can be reliably measured and when it is probable that the
debtor will pay for the goods.
1.16 Cost of salesWhen inventories are sold, the carrying amount is recognised as part of cost of sales. Any write-down of inventories to net realisable value and
all losses of inventories or reversals of previous writedowns or losses are recognised in cost of sales in the period the write-down, loss or reversal
occurs.
1.17 Income from investmentsInterest income is accrued on a time basis by reference to the principal outstanding and at the interest rate applicable.
Dividend income from investments is recognised when the shareholders’ right to receive payment has been established.
1.18 TaxationCurrent tax assets and liabilitiesThe charge for current tax is based on the results for the year as adjusted for income that is exempt and expenses that are not deductible using
tax rates that are applicable to the taxable income.
Deferred tax is recognised for all temporary differences, unless specifically exempt, at the tax rates that have been enacted or substantially enacted
at the balance sheet date.
Certain income earned from the State is exempt from tax.
Deferred tax assetsA deferred tax asset is only recognised to the extent that it is probable that taxable profits will be available against which deductible temporary
differences can be utilised, unless specifically exempt. It is measured at the tax rates that have been enacted or substantially enacted at balance
sheet date.
Deferred tax liabilityA deferred tax liability is recognised for taxable temporary differences, unless specifically exempt, at the tax rates that have been enacted or
substantially enacted at the balance sheet date.
Deferred tax arising on investments in subsidiaries, associates and joint ventures is recognised except where the Group is able to control the
reversal of the temporary difference and it is probable that the temporary difference will not reverse in the foreseeable future.
1.19 Finance costsBorrowing costs directly attributable to the acquisition, construction or production of qualifying assets are added to the cost of those assets,
until the assets are substantially ready for their intended use or sale. Qualifying assets are assets that necessarily take a substantial period to get
ready for their intended use or sale. Investment income earned on the temporary investment of specific borrowings pending their expenditure on
qualifying assets is deducted from the cost of those assets.
Other borrowing costs are recognised as an expense in the period in which they are incurred.
PAGE 55
1.20 Government grantsGovernment grants are recognised as income over the periods necessary to match them with the related costs that they are intended to
compensate.
1.21 Discontinued operationsThe results of discontinued operations are presented separately in the income statement and the assets associated with these operations are
included with non-current assets held for sale in the balance sheet.
They are stated at the lower of carrying amount and fair value less costs to sell if their carrying amount is to be recovered principally through a sale
transaction rather than through continuing use.
1.22 Irregular and fruitless and wasteful expenditure Irregular expenditure means expenditure incurred in contravention of, or not in accordance with, a requirement of any applicable legislation,
including the PFMA.
Fruitless and wasteful expenditure means expenditure that was made in vain and would have been avoided had reasonable care been exercised.
All irregular and fruitless and wasteful expenditure is charged against income in the period in which it is incurred.
1.23 Adoption of South African Accounting StandardsThe Group has adopted the following new and amended IFRSs as of 1 January 2009:1. IFRS 5 (amendment), Measurement of non-current assets (or disposal groups) classified as held-for-sale
The amendment is part of the IASB’s annual improvements project published in April 2009. The amendment provides clarification that
IFRS 5 specifies the disclosures required in respect of non-current assets (or disposal groups) classified as held for sale or discontinued
operations. It also clarifies that the general requirement of IAS 1 still apply, particularly paragraph 15 (to achieve fair presentation) and
paragraph 125 sources of estimation uncertainty of IAS 1.
2. IFRS 7 Financial instruments – Disclosures (amendment) – effective 1 January 2009
The amendment requires enhanced disclosures about fair value measurement and liquidity risk. In particular, the amendment requires
disclosure of fair value measurements by level of a fair value measurement hierarchy. As the change in accounting policy only results in
additional disclosures, there is no impact on earnings per share.
3. IAS 1 (revised). Presentation of financial statements – effective 1 January 2009
The revised standard prohibits the presentation of items of income and expenses (that is, non-owner changes in equity) in the statement
of changes in equity, requiring non-owner changes in equity to be presented separately from owner changes in equity in a statement of
comprehensive income. As a result the Group presents in the consolidated statement of changes in equity all owner changes in equity,
whereas all non-owner changes in equity are presented in the consolidated statement of comprehensive income. Comparative information
has been represented so that it also is in conformity with the revised standard. As the change in accounting policy only impacts presentation
aspects, there is no impact on earnings per share.
The following standards and amendments to existing standards have been published and are mandatory for the Group’s accounting periods
beginning on or after 1 January 2010 or later periods, but the Group has not adopted them earlier.
1. IAS 27 (revised), Consolidated and separate financial statements – effective from 1 July 2009
The revised standard requires the effects of all transactions with non-controlling interests to be recorded in equity if there is no change in
control and these transactions will no longer result in goodwill or gains and losses. The standard also specifies the accounting when control
is lost. Any remaining interest in the entity is remeasured to fair value, and a gain or loss is recognised in profit or loss. The Group will apply
IAS 27 (revised) prospectively to transactions with non-controlling interests from 1 January 2010.
ACCOUNTING’ POLICIES
PAGE 56 CEF (PTY) LTD ANNUAL REPORT 2010
1.23 Adoption of South African Accounting Standards (continued)2. IFRS 3 (revised), Business combinations – effective from 1 July 2009
The revised standard continues to apply the acquisition method to business combinations, with some significant changes. For example,
all payments to purchase a business are to be recorded at fair value at the acquisition date, with contingent payments classified as
debt subsequently remeasured through the income statement. There is a choice on an acquisition-by-acquisition basis to measure the
non-controlling interest in the acquiree at fair vale or at the non-controlling interest’s proportionate share of the acquiree’s net assets.
All acquisition related costs should be expensed. The Group will apply IFRS 3 (revised) prospectively to all business combinations from
1 April 2010.
3. IAS 38 (amendment), Intangible Assets
The amendment is part of the IASB’s annual improvements project published in April 2009 and the Group and company will apply
IAS 38 (amendment) from the date IFRS 3 (revised) is adopted. The amendment clarifies guidance in measuring the fair value of an intangible
asset acquired in a business combination and it permits the grouping of intangible assets as a single asset if each asset has similar useful
economic lives. The amendment will not result in a material impact on the Group or company’s financial statements.
1.24 Key assumptions made by management in applying accounting policiesGoing concernManagement considers key financial metrics and loan covenant compliance in its approved medium-term budgets, together with its existing term
facilities, to conclude that the going concern assumption used in the compiling of its annual financial statements, is relevant.
Environmental and decommissioning provisionProvision is made for environmental and decommissioning costs where either a legal or constructive obligation is recognised as a result of past
events. Estimates are made in determining the present obligation of environmental and decommissioning provisions, which include the actual
estimate, the discount rate used and the expected date of closure of mining activities in determining the present value of environmental and
decommissioning provisions. Estimates are based upon costs that are regularly reviewed, by internal and external experts, and adjusted as
appropriate for new circumstances.
Other provisionsFor other provisions, estimates are made of legal or constructive obligations resulting in the raising of provisions, and the expected date of probable
outflow of economic benefits to assess whether the provision should be discounted.
Impairments and impairment reversalsImpairment tests are performed when there is an indication of impairment of assets or a reversal of previous impairments of assets. Management
therefore has implemented certain impairment indicators and these include movements in exchange rates, commodity prices and the economic
environment its businesses operate in. Estimates are made in determining the recoverable amount of assets which include the estimation of cash
flows and discount rates used. In estimating the cash flows, management base cash flow projections on reasonable and supportable assumptions
that represent managements’ best estimate of the range of economic conditions that will exist over the remaining useful life of the assets, based
on publicly available information. The discount rates used are pretax rates that reflect the current market assessment of the time value of money
and the risks specific to the assets for which the future cash flow estimates have not been adjusted.
Contingent liabilitiesManagement considers the existence of possible obligations which may arise from legal action as well as the possible non-compliance of the
requirements of completion guarantees and other guarantees provided. The estimation of the amount disclosed is based on the expected possible
outflow of economic benefits should there be a present obligation.
PAGE 57
1.24 Key assumptions made by management in applying accounting policies (continued)Evaluation of the useful life of assetsOn an annual basis, management evaluate the useful life of all assets. In carrying out this exercise, experience of asset’s historical performance
and the medium-term business plan are taken into consideration.
Critical accounting estimates and judgementsIn preparing the annual financial statements in terms of SA GAAP, the Group’s management is required to make certain estimates and assumptions
that may materially affect reported amounts of assets and liabilities at the date of the annual financial statements and the reported amounts of
revenues and expenses during the reported period and the related disclosures. As these estimates and assumptions concern future events, due
to the inherent uncertainty involved in this process, the actual results often vary from the estimates. These estimates and judgements are based
on historical experience, current and expected future economic conditions and other factors, including expectations of the future events that are
believed to be reasonable under the circumstances.
1.25 Related partiesThe services received or rendered from or to related parties arise mainly from service transactions, including management fees for services
performed on behalf of the company.
The receivables from related parties arise mainly from service transactions and are due one month after the date of services. The receivables are
unsecured in nature and bear no interest. There are no provisions held against receivables from related parties.
The payables to related parties arise mainly from service transactions, including management fees and are due one month after the date of
purchase. The payables bear no interest.
The loans to or from related parties arise from loan agreements entered into for the year under review. These loans are subordinate by CEF (Pty)
Ltd.
Key management includes directors (executive and nonexecutive), members of the Board audit and risk management committee and members
of the Executive Committee.
ACCOUNTING’ POLICIES

PAGE 58 CEF (PTY) LTD ANNUAL REPORT 2010

PAGE 59
Notes to the AnnualFinancial StatementFor the year ended 31 March 2010
Figures in Rand thousand
2. Property, plant and equipment
2010 2009 2008
Cost/ Accumulated Carrying Cost/ Accumulated Carrying Cost/ Accumulated Carrying
valuation depreciation value valuation depreciation value valuation depreciation value
Group
Buildings 117 452 (8 137) 109 315 41 195 (4 131) 37 064 19 671 (4 007) 15 664
Plant and machinery 18 813 173 (15 572 342) 3 240 831 18 476 224 (15 100 184) 3 376 040 18 238 345 (14 907 191) 3 331 154
Furniture and fixtures 597 883 (362 738) 235 145 551 432 (287 877) 263 555 452 864 (212 749) 240 115
Motor vehicles 9 090 (4 067) 5 023 5 397 (3 802) 1 595 4 544 (3 287) 1 257
Computer equipment 12 097 (8 850) 3 247 9 911 (7 204) 2 707 8 218 (4 901) 3 317
Mainframe software 1 859 (1 505) 354 1 859 (1 360) 499 1 859 (1 211) 648
Shutdown costs 461 705 (153 902) 307 803 365 486 (365 486) – 371 218 (239 629) 131 589
Development assets 2 889 525 – 2 889 525 2 408 997 – 2 408 997 812 239 – 812 239
Restoration expenditure 601 029 (582 123) 18 906 637 122 (557 684) 79 438 793 789 (481 161) 312 628
Total 23 503 813 (16 693 664) 6 810 149 22 497 623 (16 327 728) 6 169 895 20 702 747 (15 854 136) 4 848 611
Company
Buildings 93 181 (3 882) 89 299 16 962 – 16 962 – – –
Furniture and fixtures 7 176 (3 381) 3 795 5 231 (2 181) 3 050 5 813 (3 172) 2 641
Motor vehicles 873 (519) 354 873 (333) 540 676 (178) 498
Computer equipment 4 119 (2 954) 1 165 3 612 (2 822) 790 3 192 (2 193) 999
Total 105 349 (10 736) 94 613 26 678 (5 336) 21 342 9 681 (5 543) 4 138

PAGE 60 CEF (PTY) LTD ANNUAL REPORT 2010
Notes to the AnnualFinancial StatementFor the year ended 31 March 2010
Figures in Rand thousand
2. Property, plant and equipment (continued)
Reconciliation of property, plant and equipment – Group – 2010
Foreign Other
Opening exchange changes, Depre-
balance Additions Disposals Transfers movements movements ciation Total
Buildings 37 064 76 494 – (275) – – (3 968) 109 315
Plant and machinery 3 376 040 33 375 – 304 477 – – (473 061) 3 240 831
Furniture and fixtures 263 555 54 800 (1 100) – (13) – (82 097) 235 145
Motor vehicles 1 595 823 (56) – – – 2 661 5 023
Computer equipment 2 707 2 511 (177) – – – (1 794) 3 247
Mainframe software 499 – – – – – (145) 354
Shutdown costs – 22 – 461 705 – – (153 924) 307 803
Development assets 2 408 997 1 245 353 – (764 825) – – – 2 889 525
Restoration expenditure 79 438 28 255 – – – (43 021) (45 766) 18 906
6 169 895 1 441 633 (1 333) 1 082 (13) (43 021) (758 094) 6 810 149
Reconciliation of property, plant and equipment – Group – 2009
Other
Opening changes Depre-
balance Additions Disposals Transfers movements ciation Total
Buildings 15 664 21 524 – – – (124) 37 064
Plant and machinery 3 331 154 7 037 (24 030) 254 430 – (192 551) 3 376 040
Furniture and fixtures 240 115 104 436 (403) (338) – (80 255) 263 555
Motor vehicles 1 257 1 048 (217) – – (493) 1 595
Computer equipment 3 317 1 442 (29) – – (2 023) 2 707
Mainframe software 648 – – – – (149) 499
Shutdown cost 131 589 – (5 732) – – (125 857) –
Development assets 812 239 1 851 188 – (254 430) – – 2 408 997
Restoration expenditure 312 628 – – – (198 574) (34 616) 79 438
4 848 611 1 986 675 (30 411) (338) (198 574) (436 068) 6 169 895
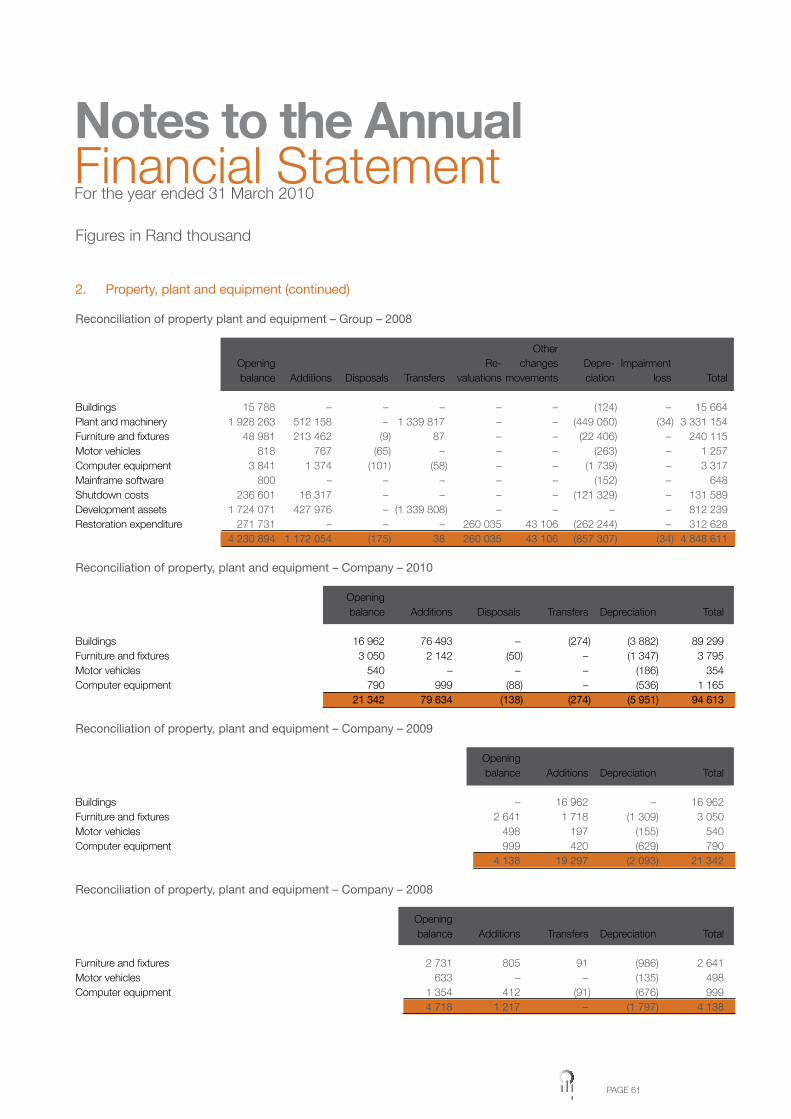
PAGE 61
Figures in Rand thousand
2. Property, plant and equipment (continued)
Reconciliation of property plant and equipment – Group – 2008
Other Opening Re- changes Depre- Impairment balance Additions Disposals Transfers valuations movements ciation loss Total
Buildings 15 788 – – – – – (124) – 15 664Plant and machinery 1 928 263 512 158 – 1 339 817 – – (449 050) (34) 3 331 154Furniture and fixtures 48 981 213 462 (9) 87 – – (22 406) – 240 115Motor vehicles 818 767 (65) – – – (263) – 1 257Computer equipment 3 841 1 374 (101) (58) – – (1 739) – 3 317Mainframe software 800 – – – – – (152) – 648Shutdown costs 236 601 16 317 – – – – (121 329) – 131 589Development assets 1 724 071 427 976 – (1 339 808) – – – – 812 239Restoration expenditure 271 731 – – – 260 035 43 106 (262 244) – 312 628 4 230 894 1 172 054 (175) 38 260 035 43 106 (857 307) (34) 4 848 611
Reconciliation of property, plant and equipment – Company – 2010
Opening balance Additions Disposals Transfers Depreciation Total
Buildings 16 962 76 493 – (274) (3 882) 89 299Furniture and fixtures 3 050 2 142 (50) – (1 347) 3 795Motor vehicles 540 – – – (186) 354Computer equipment 790 999 (88) – (536) 1 165 21 342 79 634 (138) (274) (5 951) 94 613
Reconciliation of property, plant and equipment – Company – 2009
Opening balance Additions Depreciation Total
Buildings – 16 962 – 16 962Furniture and fixtures 2 641 1 718 (1 309) 3 050Motor vehicles 498 197 (155) 540Computer equipment 999 420 (629) 790 4 138 19 297 (2 093) 21 342
Reconciliation of property, plant and equipment – Company – 2008
Opening balance Additions Transfers Depreciation Total
Furniture and fixtures 2 731 805 91 (986) 2 641Motor vehicles 633 – – (135) 498Computer equipment 1 354 412 (91) (676) 999 4 718 1 217 – (1 797) 4 138
Notes to the AnnualFinancial StatementFor the year ended 31 March 2010

PAGE 62 CEF (PTY) LTD ANNUAL REPORT 2010
Notes to the AnnualFinancial StatementFor the year ended 31 March 2010
2. Property, plant and equipment (continued)
A register containing the information required by paragraph 22(3) of Schedule 4 of the Companies Act is available for inspection at the registered
office of the company.
Registers of land and buildings are available at the registered offices of those subsidiaries that own land and buildings. The register for SFF is
unable to be completed in full as required by the Companies Act of South Africa No. 26 of 1973. The cost price of the individual properties cannot
be ascertained due to a lack of historical information. In addition all the land paid for by SFF, and reflected in these accounts is registered in the
name of the State. SFF merely manages these properties on behalf of the State.
PetroSARestoration expenditure relates to the provision for restoration costs and is amortised on a units-of-production basis over the expected useful
life of the reserves. The Minerals Act of 1991 requires that amounts for abandonment be set aside as prescribed in the Act. The restoration fund
requirement has been met through the issue of a guarantee by CEF (Proprietary) Limited.
Oil Pollution Control South AfricaThe buildings of the company at Saldanha Bay are built on land owned by the National Ports Authority (Plan 10128/00/0217) which is leased to
Oil Pollution Control South Africa in terms of a 99 year lease.
SFF AssociationThe production assets at Saldanha have the engineering life of 40 years of which 11 years is remaining. Milnerton and Ogies tanks are fully impaired.
The directors of the company evaluated the estimated useful life of the fixed assets as at 31 March 2010 to ensure that the fixed assets were fairly
stated at year end.
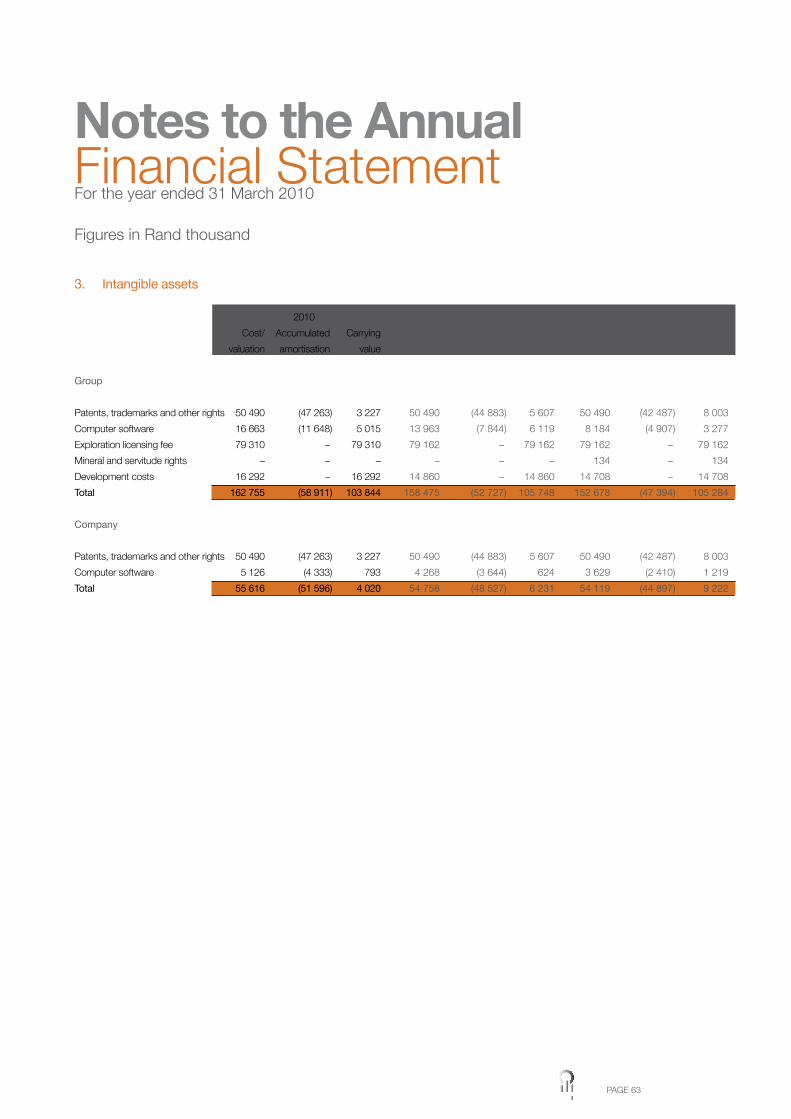
PAGE 63
Figures in Rand thousand
3. Intangible assets
2010 2009 2008
Cost/ Accumulated Carrying Cost/ Accumulated Carrying Cost/ Accumulated Carrying
valuation amortisation value valuation amortisation value valuation amortisation value
Group
Patents, trademarks and other rights 50 490 (47 263) 3 227 50 490 (44 883) 5 607 50 490 (42 487) 8 003
Computer software 16 663 (11 648) 5 015 13 963 (7 844) 6 119 8 184 (4 907) 3 277
Exploration licensing fee 79 310 – 79 310 79 162 – 79 162 79 162 – 79 162
Mineral and servitude rights – – – – – – 134 – 134
Development costs 16 292 – 16 292 14 860 – 14 860 14 708 – 14 708
Total 162 755 (58 911) 103 844 158 475 (52 727) 105 748 152 678 (47 394) 105 284
Company
Patents, trademarks and other rights 50 490 (47 263) 3 227 50 490 (44 883) 5 607 50 490 (42 487) 8 003
Computer software 5 126 (4 333) 793 4 268 (3 644) 624 3 629 (2 410) 1 219
Total 55 616 (51 596) 4 020 54 758 (48 527) 6 231 54 119 (44 897) 9 222
Notes to the AnnualFinancial StatementFor the year ended 31 March 2010
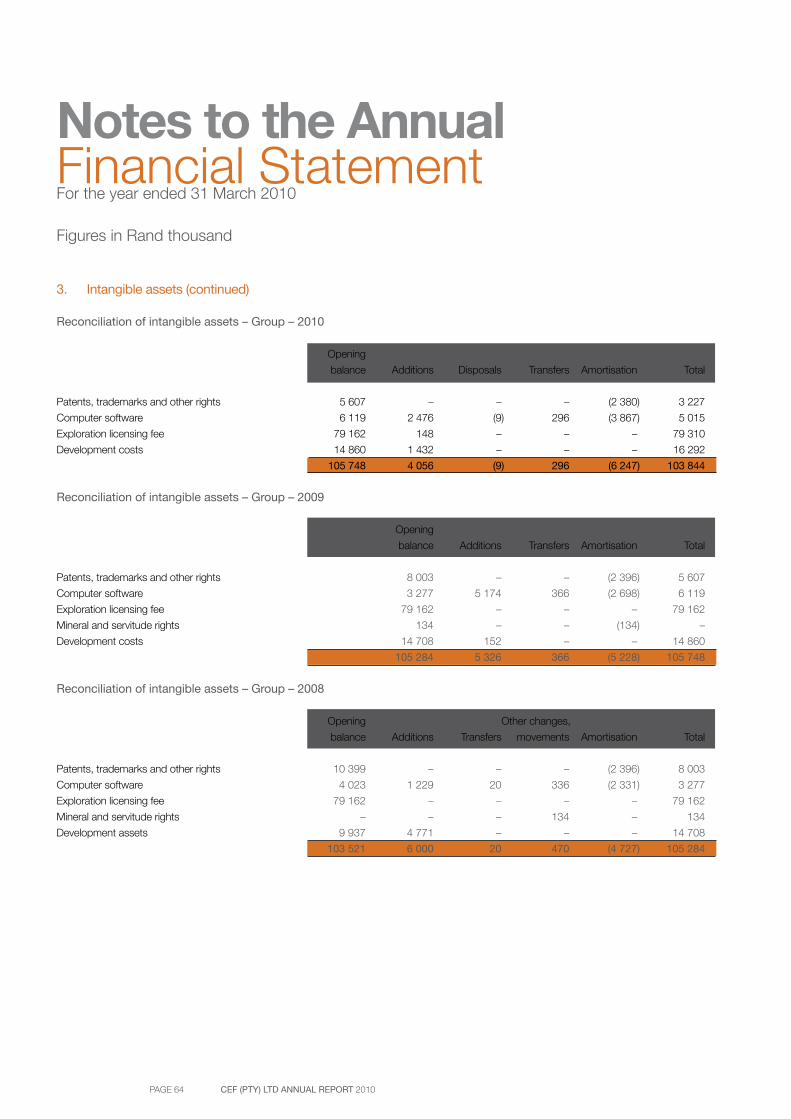
PAGE 64 CEF (PTY) LTD ANNUAL REPORT 2010
Notes to the AnnualFinancial StatementFor the year ended 31 March 2010
3. Intangible assets (continued)
Reconciliation of intangible assets – Group – 2010
Opening
balance Additions Disposals Transfers Amortisation Total
Patents, trademarks and other rights 5 607 – – – (2 380) 3 227
Computer software 6 119 2 476 (9) 296 (3 867) 5 015
Exploration licensing fee 79 162 148 – – – 79 310
Development costs 14 860 1 432 – – – 16 292
105 748 4 056 (9) 296 (6 247) 103 844
Reconciliation of intangible assets – Group – 2009
Opening
balance Additions Transfers Amortisation Total
Patents, trademarks and other rights 8 003 – – (2 396) 5 607
Computer software 3 277 5 174 366 (2 698) 6 119
Exploration licensing fee 79 162 – – – 79 162
Mineral and servitude rights 134 – – (134) –
Development costs 14 708 152 – – 14 860
105 284 5 326 366 (5 228) 105 748
Reconciliation of intangible assets – Group – 2008
Opening Other changes,
balance Additions Transfers movements Amortisation Total
Patents, trademarks and other rights 10 399 – – – (2 396) 8 003
Computer software 4 023 1 229 20 336 (2 331) 3 277
Exploration licensing fee 79 162 – – – – 79 162
Mineral and servitude rights – – – 134 – 134
Development assets 9 937 4 771 – – – 14 708
103 521 6 000 20 470 (4 727) 105 284
Figures in Rand thousand
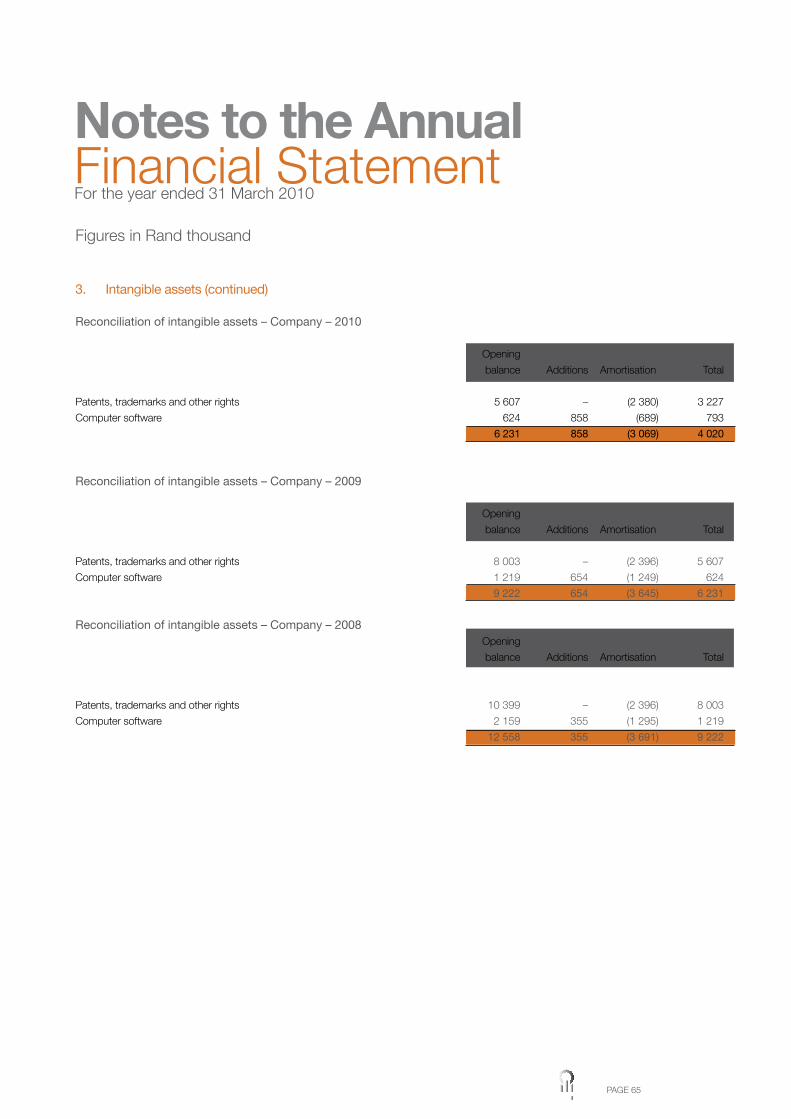
PAGE 65
Figures in Rand thousand
3. Intangible assets (continued)
Reconciliation of intangible assets – Company – 2010
Opening
balance Additions Amortisation Total
Patents, trademarks and other rights 5 607 – (2 380) 3 227
Computer software 624 858 (689) 793
6 231 858 (3 069) 4 020
Reconciliation of intangible assets – Company – 2009
Opening
balance Additions Amortisation Total
Patents, trademarks and other rights 8 003 – (2 396) 5 607
Computer software 1 219 654 (1 249) 624
9 222 654 (3 645) 6 231
Reconciliation of intangible assets – Company – 2008 Opening
balance Additions Amortisation Total
Patents, trademarks and other rights 10 399 – (2 396) 8 003
Computer software 2 159 355 (1 295) 1 219
12 558 355 (3 691) 9 222
Notes to the AnnualFinancial StatementFor the year ended 31 March 2010
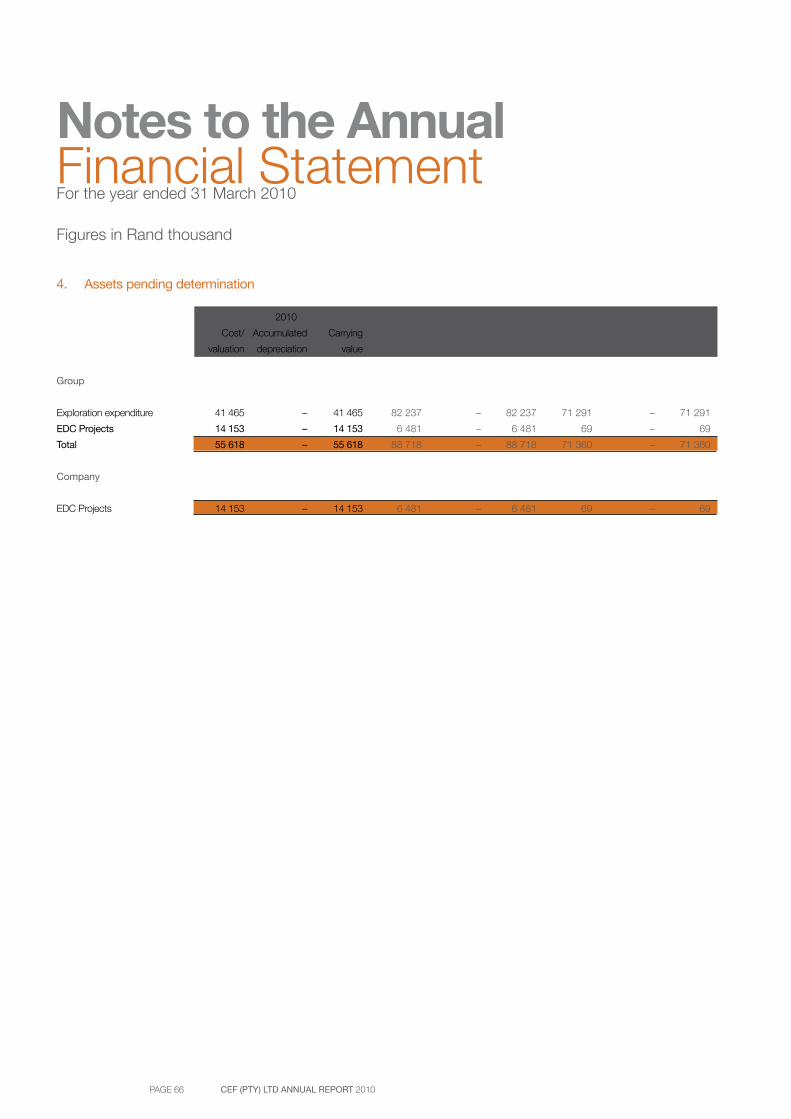
PAGE 66 CEF (PTY) LTD ANNUAL REPORT 2010
Notes to the AnnualFinancial StatementFor the year ended 31 March 2010
Figures in Rand thousand
4. Assets pending determination
2010 2009 2008
Cost/ Accumulated Carrying Cost/ Accumulated Carrying Cost/ Accumulated Carrying
valuation depreciation value valuation depreciation value valuation depreciation value
Group
Exploration expenditure 41 465 – 41 465 82 237 – 82 237 71 291 – 71 291
EDC Projects 14 153 – 14 153 6 481 – 6 481 69 – 69
Total 55 618 – 55 618 88 718 – 88 718 71 360 – 71 360
Company
EDC Projects 14 153 – 14 153 6 481 – 6 481 69 – 69
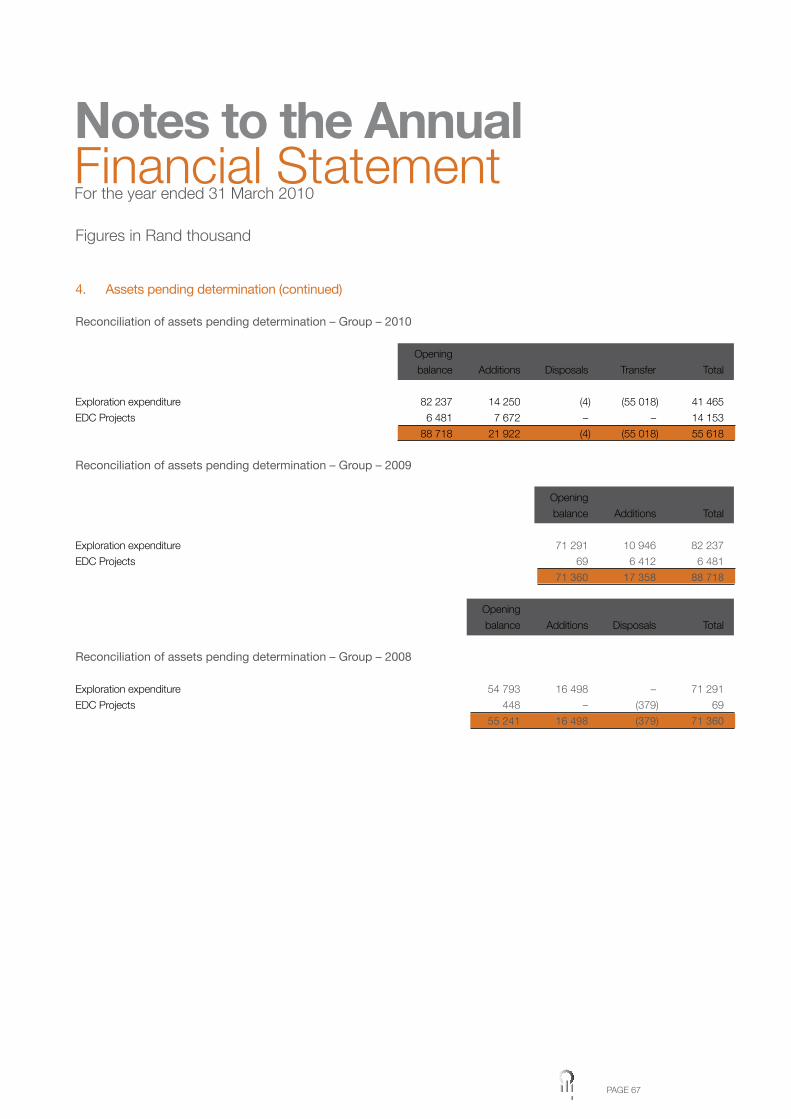
PAGE 67
Figures in Rand thousand
4. Assets pending determination (continued)
Reconciliation of assets pending determination – Group – 2010
Opening
balance Additions Disposals Transfer Total
Exploration expenditure 82 237 14 250 (4) (55 018) 41 465
EDC Projects 6 481 7 672 – – 14 153
88 718 21 922 (4) (55 018) 55 618
Reconciliation of assets pending determination – Group – 2009
Opening
balance Additions Total
Exploration expenditure 71 291 10 946 82 237
EDC Projects 69 6 412 6 481
71 360 17 358 88 718
Opening
balance Additions Disposals Total
Reconciliation of assets pending determination – Group – 2008
Exploration expenditure 54 793 16 498 – 71 291
EDC Projects 448 – (379) 69
55 241 16 498 (379) 71 360
Notes to the AnnualFinancial StatementFor the year ended 31 March 2010
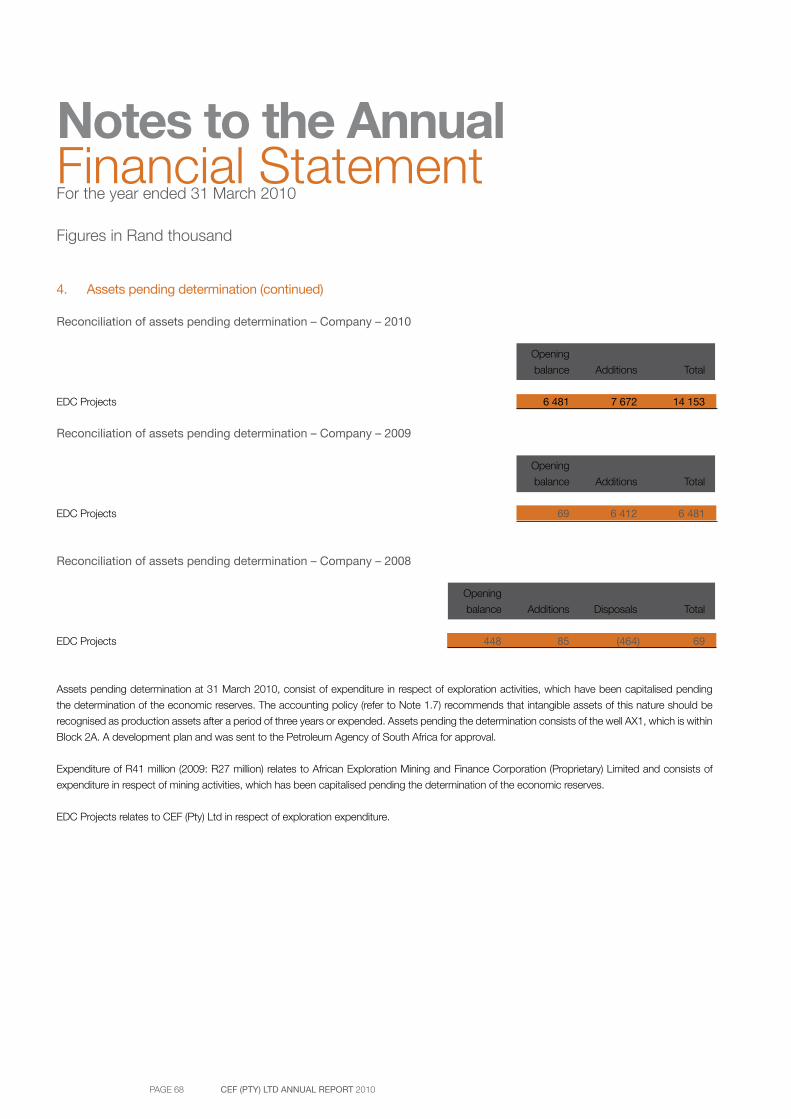
PAGE 68 CEF (PTY) LTD ANNUAL REPORT 2010
Notes to the AnnualFinancial StatementFor the year ended 31 March 2010
Figures in Rand thousand
4. Assets pending determination (continued)
Reconciliation of assets pending determination – Company – 2010
Opening
balance Additions Total
EDC Projects 6 481 7 672 14 153
Reconciliation of assets pending determination – Company – 2009
Opening
balance Additions Total
EDC Projects 69 6 412 6 481
Reconciliation of assets pending determination – Company – 2008
Opening
balance Additions Disposals Total
EDC Projects 448 85 (464) 69
Assets pending determination at 31 March 2010, consist of expenditure in respect of exploration activities, which have been capitalised pending
the determination of the economic reserves. The accounting policy (refer to Note 1.7) recommends that intangible assets of this nature should be
recognised as production assets after a period of three years or expended. Assets pending the determination consists of the well AX1, which is within
Block 2A. A development plan and was sent to the Petroleum Agency of South Africa for approval.
Expenditure of R41 million (2009: R27 million) relates to African Exploration Mining and Finance Corporation (Proprietary) Limited and consists of
expenditure in respect of mining activities, which has been capitalised pending the determination of the economic reserves.
EDC Projects relates to CEF (Pty) Ltd in respect of exploration expenditure.
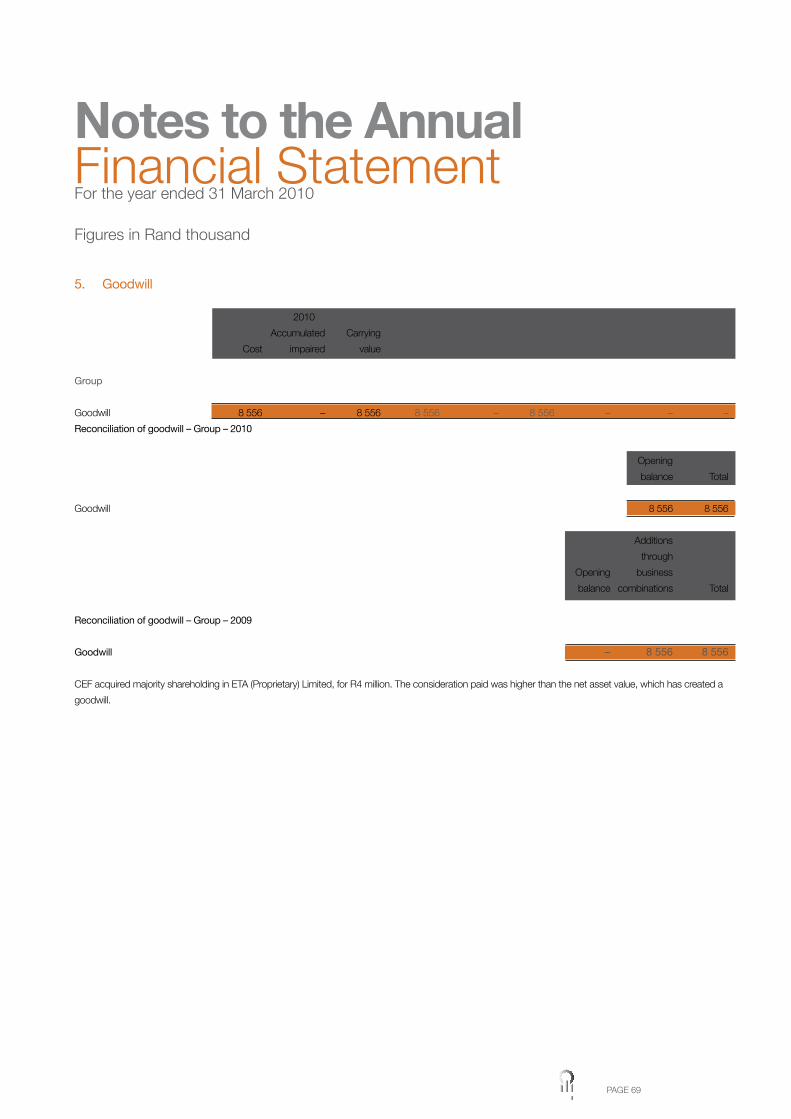
PAGE 69
Figures in Rand thousand
5. Goodwill
2010 2009 2008
Accumulated Carrying Accumulated Carrying Accumulated Carrying
Cost impaired value Cost impairment value Cost impairment value
Group
Goodwill 8 556 – 8 556 8 556 – 8 556 – – –
Reconciliation of goodwill – Group – 2010
Opening
balance Total
Goodwill 8 556 8 556
Additions
through
Opening business
balance combinations Total
Reconciliation of goodwill – Group – 2009
Goodwill – 8 556 8 556
CEF acquired majority shareholding in ETA (Proprietary) Limited, for R4 million. The consideration paid was higher than the net asset value, which has created a
goodwill.
Notes to the AnnualFinancial StatementFor the year ended 31 March 2010
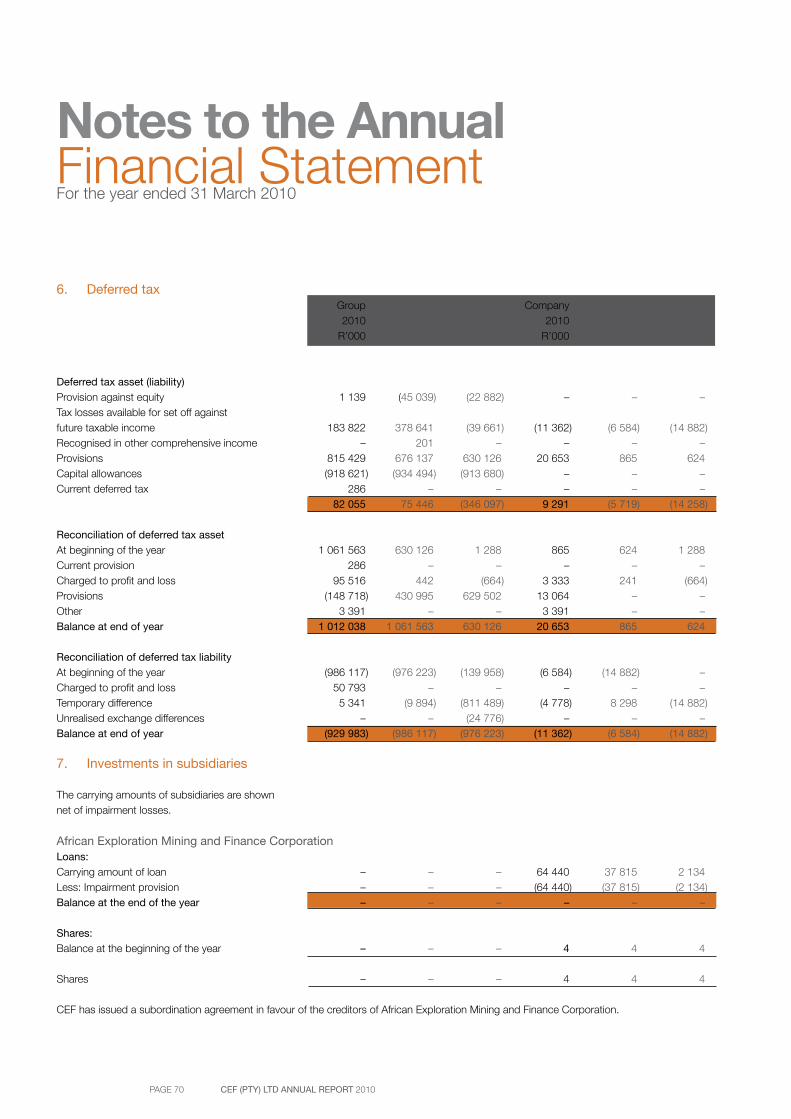
PAGE 70 CEF (PTY) LTD ANNUAL REPORT 2010
Notes to the AnnualFinancial StatementFor the year ended 31 March 2010
6. Deferred tax Group Group Group Company Company Company 2010 2009 2008 2010 2009 2008 R’000 R’000 R’000 R’000 R’000 R’000
Deferred tax asset (liability) Provision against equity 1 139 (45 039) (22 882) – – –Tax losses available for set off against future taxable income 183 822 378 641 (39 661) (11 362) (6 584) (14 882)Recognised in other comprehensive income – 201 – – – –Provisions 815 429 676 137 630 126 20 653 865 624Capital allowances (918 621) (934 494) (913 680) – – –Current deferred tax 286 – – – – – 82 055 75 446 (346 097) 9 291 (5 719) (14 258)
Reconciliation of deferred tax assetAt beginning of the year 1 061 563 630 126 1 288 865 624 1 288Current provision 286 – – – – –Charged to profit and loss 95 516 442 (664) 3 333 241 (664)Provisions (148 718) 430 995 629 502 13 064 – –Other 3 391 – – 3 391 – –Balance at end of year 1 012 038 1 061 563 630 126 20 653 865 624
Reconciliation of deferred tax liabilityAt beginning of the year (986 117) (976 223) (139 958) (6 584) (14 882) –Charged to profit and loss 50 793 – – – – –Temporary difference 5 341 (9 894) (811 489) (4 778) 8 298 (14 882)Unrealised exchange differences – – (24 776) – – –Balance at end of year (929 983) (986 117) (976 223) (11 362) (6 584) (14 882)
7. Investments in subsidiaries
The carrying amounts of subsidiaries are shown net of impairment losses.
African Exploration Mining and Finance Corporation Loans: Carrying amount of loan – – – 64 440 37 815 2 134Less: Impairment provision – – – (64 440) (37 815) (2 134)Balance at the end of the year – – – – – –
Shares: Balance at the beginning of the year – – – 4 4 4
Shares – – – 4 4 4
CEF has issued a subordination agreement in favour of the creditors of African Exploration Mining and Finance Corporation.
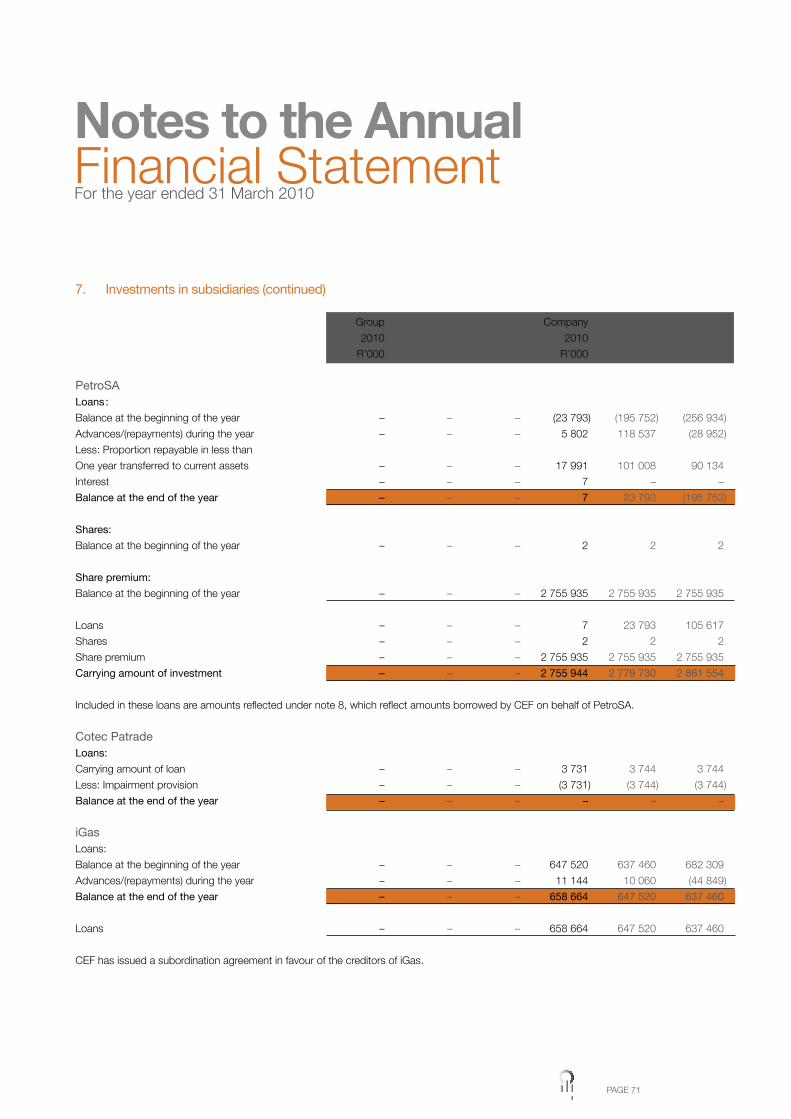
PAGE 71
7. Investments in subsidiaries (continued)
Group Group Group Company Company Company
2010 2009 2008 2010 2009 2008
R’000 R’000 R’000 R’000 R’000 R’000
PetroSA Loans :
Balance at the beginning of the year – – – (23 793) (195 752) (256 934)
Advances/(repayments) during the year – – – 5 802 118 537 (28 952)
Less: Proportion repayable in less than
One year transferred to current assets – – – 17 991 101 008 90 134
Interest – – – 7 – –
Balance at the end of the year – – – 7 23 793 (195 752)
Shares:
Balance at the beginning of the year – – – 2 2 2
Share premium:
Balance at the beginning of the year – – – 2 755 935 2 755 935 2 755 935
Loans – – – 7 23 793 105 617
Shares – – – 2 2 2
Share premium – – – 2 755 935 2 755 935 2 755 935
Carrying amount of investment – – – 2 755 944 2 779 730 2 861 554
Included in these loans are amounts reflected under note 8, which reflect amounts borrowed by CEF on behalf of PetroSA.
Cotec Patrade Loans:
Carrying amount of loan – – – 3 731 3 744 3 744
Less: Impairment provision – – – (3 731) (3 744) (3 744)
Balance at the end of the year – – – – – –
iGas Loans:
Balance at the beginning of the year – – – 647 520 637 460 682 309
Advances/(repayments) during the year – – – 11 144 10 060 (44 849)
Balance at the end of the year – – – 658 664 647 520 637 460
Loans – – – 658 664 647 520 637 460
CEF has issued a subordination agreement in favour of the creditors of iGas.
Notes to the AnnualFinancial StatementFor the year ended 31 March 2010

PAGE 72 CEF (PTY) LTD ANNUAL REPORT 2010
Notes to the AnnualFinancial StatementFor the year ended 31 March 2010
7. Investments in subsidiaries (continued)
Group Group Group Company Company Company
2010 2009 2008 2010 2009 2008
R’000 R’000 R’000 R’000 R’000 R’000
OPCSA Loans:
Carrying amount of loan – – – 12 594 21 870 15 703
Advances (repayments) during the year – – – 3 779 (1 587) 6 167
Less: Impairment provision – – – – (12 594) (21 870)
Balance at the end of the year – – – 16 373 7 689 –
Loans – – – 16 373 7 689 –
CEF has issued a subordination agreement in
favour of the creditors of OPCSA
SFF Loans:
Advances/(repayments) during the year – – – – 8 11
Shares:
Balance at the beginning of the year – – – 1 1 1
Loans – – – – 8 11
Shares – – – 1 1 1
Carrying amount of investment – – – 1 9 12
CCE Loans:
Advances during the year – – – 38 099 – –
CCE Equity contributions:
Balance at the beginning of the year – – – 14 183 – –
Equity contributions – – – 19 817 14 183 –
Balance at the end of the year – – – 34 000 14 183 –
Loans – – – 38 099 – –
Equity contributions – – – 34 000 14 183 –
Carrying amount of investment – – – 72 099 14 183 –
CEF has issued a subordination agreement in favour of the creditors of CCE.
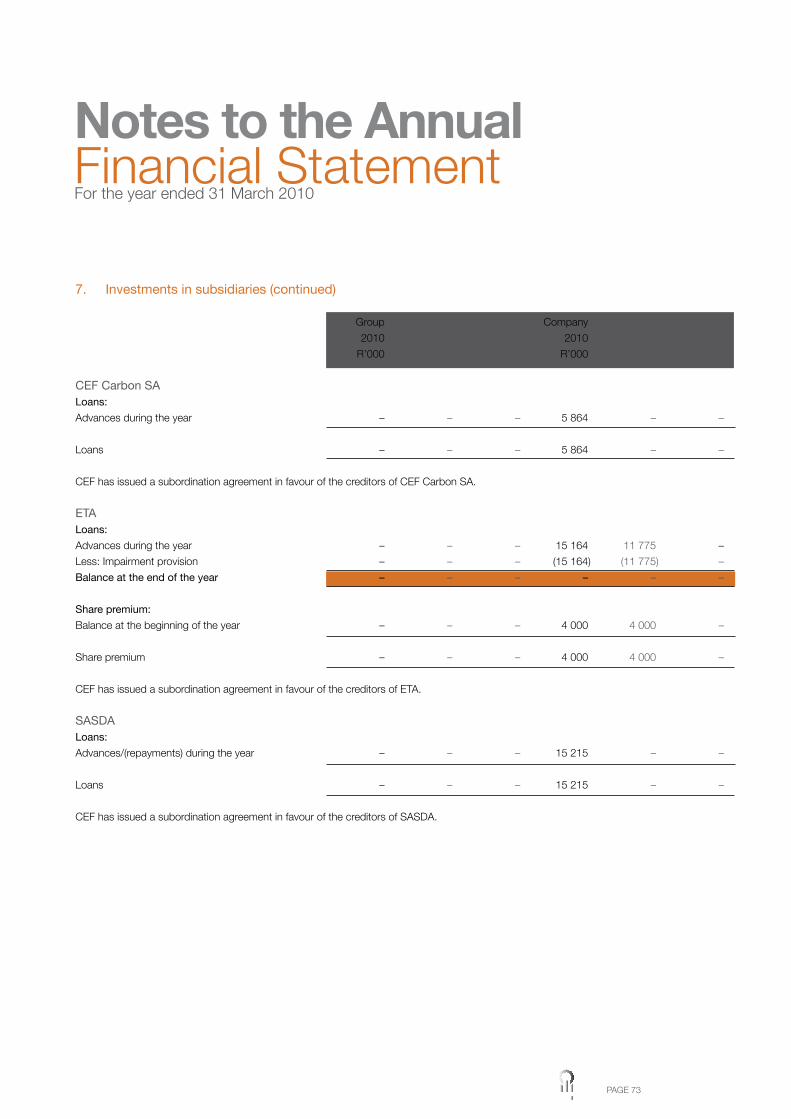
PAGE 73
7. Investments in subsidiaries (continued)
Group Group Group Company Company Company
2010 2009 2008 2010 2009 2008
R’000 R’000 R’000 R’000 R’000 R’000
CEF Carbon SA Loans:
Advances during the year – – – 5 864 – –
Loans – – – 5 864 – –
CEF has issued a subordination agreement in favour of the creditors of CEF Carbon SA.
ETA Loans:
Advances during the year – – – 15 164 11 775 –
Less: Impairment provision – – – (15 164) (11 775) –
Balance at the end of the year – – – – – –
Share premium:
Balance at the beginning of the year – – – 4 000 4 000 –
Share premium – – – 4 000 4 000 –
CEF has issued a subordination agreement in favour of the creditors of ETA.
SASDA Loans:
Advances/(repayments) during the year – – – 15 215 – –
Loans – – – 15 215 – –
CEF has issued a subordination agreement in favour of the creditors of SASDA.
Notes to the AnnualFinancial StatementFor the year ended 31 March 2010
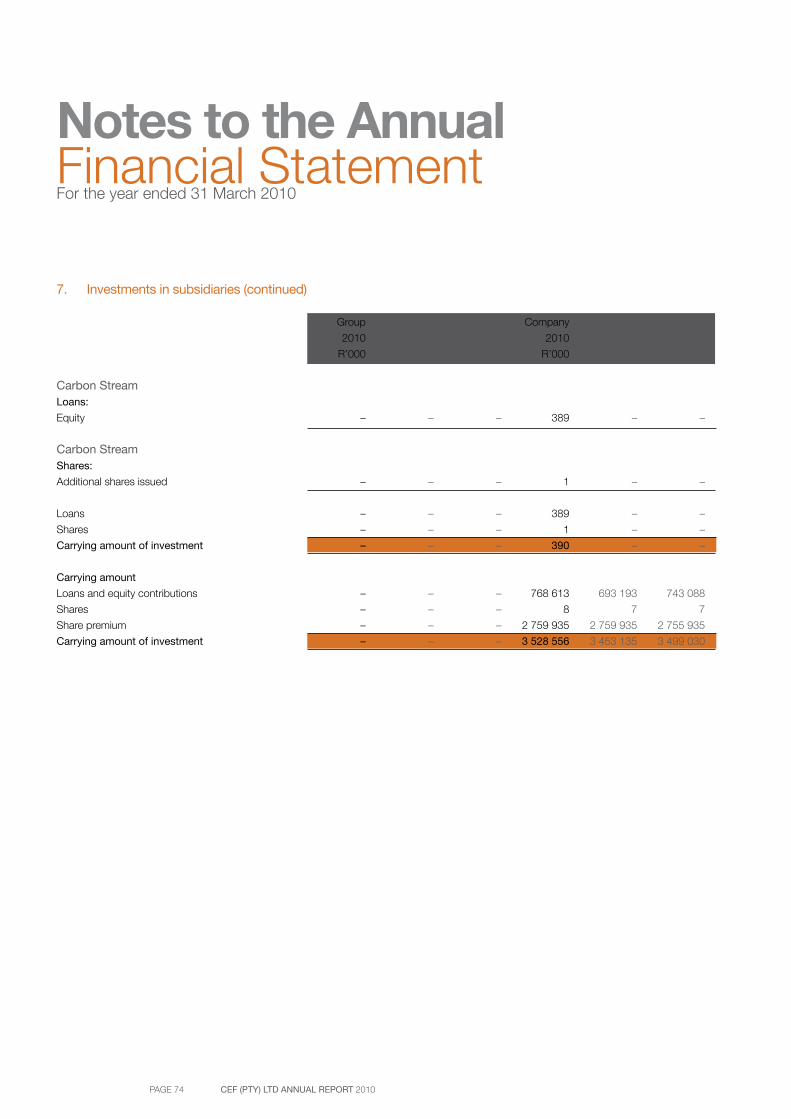
PAGE 74 CEF (PTY) LTD ANNUAL REPORT 2010
Notes to the AnnualFinancial StatementFor the year ended 31 March 2010
7. Investments in subsidiaries (continued)
Group Group Group Company Company Company
2010 2009 2008 2010 2009 2008
R’000 R’000 R’000 R’000 R’000 R’000
Carbon Stream Loans:
Equity – – – 389 – –
Carbon StreamShares:
Additional shares issued – – – 1 – –
Loans – – – 389 – –
Shares – – – 1 – –
Carrying amount of investment – – – 390 – –
Carrying amount
Loans and equity contributions – – – 768 613 693 193 743 088
Shares – – – 8 7 7
Share premium – – – 2 759 935 2 759 935 2 755 935
Carrying amount of investment – – – 3 528 556 3 453 135 3 499 030
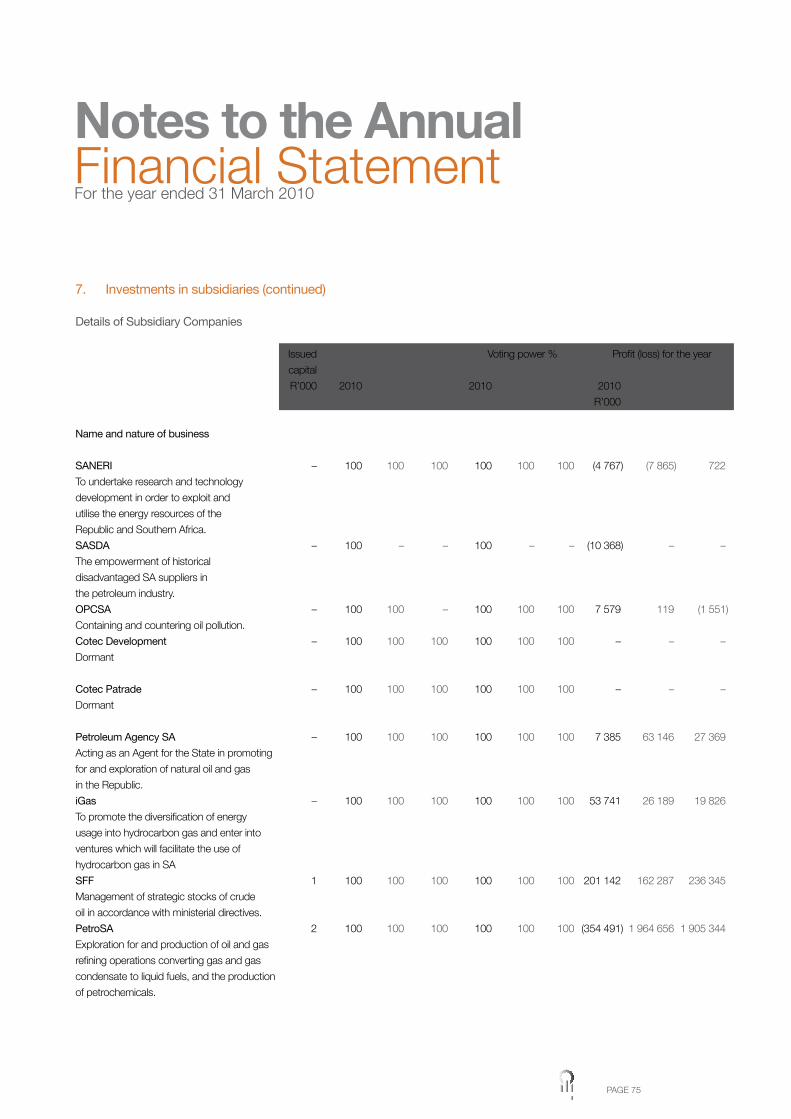
PAGE 75
7. Investments in subsidiaries (continued)
Details of Subsidiary Companies
Issued % Voting power % Profit (loss) for the year
capital held
R’000 2010 2009 2008 2010 2009 2008 2010 2009 2008
R’000 R’000 R’000
Name and nature of business
SANERI – 100 100 100 100 100 100 (4 767) (7 865) 722
To undertake research and technology
development in order to exploit and
utilise the energy resources of the
Republic and Southern Africa.
SASDA – 100 – – 100 – – (10 368) – –
The empowerment of historical
disadvantaged SA suppliers in
the petroleum industry.
OPCSA – 100 100 – 100 100 100 7 579 119 (1 551)
Containing and countering oil pollution.
Cotec Development – 100 100 100 100 100 100 – – –
Dormant
Cotec Patrade – 100 100 100 100 100 100 – – –
Dormant
Petroleum Agency SA – 100 100 100 100 100 100 7 385 63 146 27 369
Acting as an Agent for the State in promoting
for and exploration of natural oil and gas
in the Republic.
iGas – 100 100 100 100 100 100 53 741 26 189 19 826
To promote the diversification of energy
usage into hydrocarbon gas and enter into
ventures which will facilitate the use of
hydrocarbon gas in SA
SFF 1 100 100 100 100 100 100 201 142 162 287 236 345
Management of strategic stocks of crude
oil in accordance with ministerial directives.
PetroSA 2 100 100 100 100 100 100 (354 491) 1 964 656 1 905 344
Exploration for and production of oil and gas
refining operations converting gas and gas
condensate to liquid fuels, and the production
of petrochemicals.
Notes to the AnnualFinancial StatementFor the year ended 31 March 2010
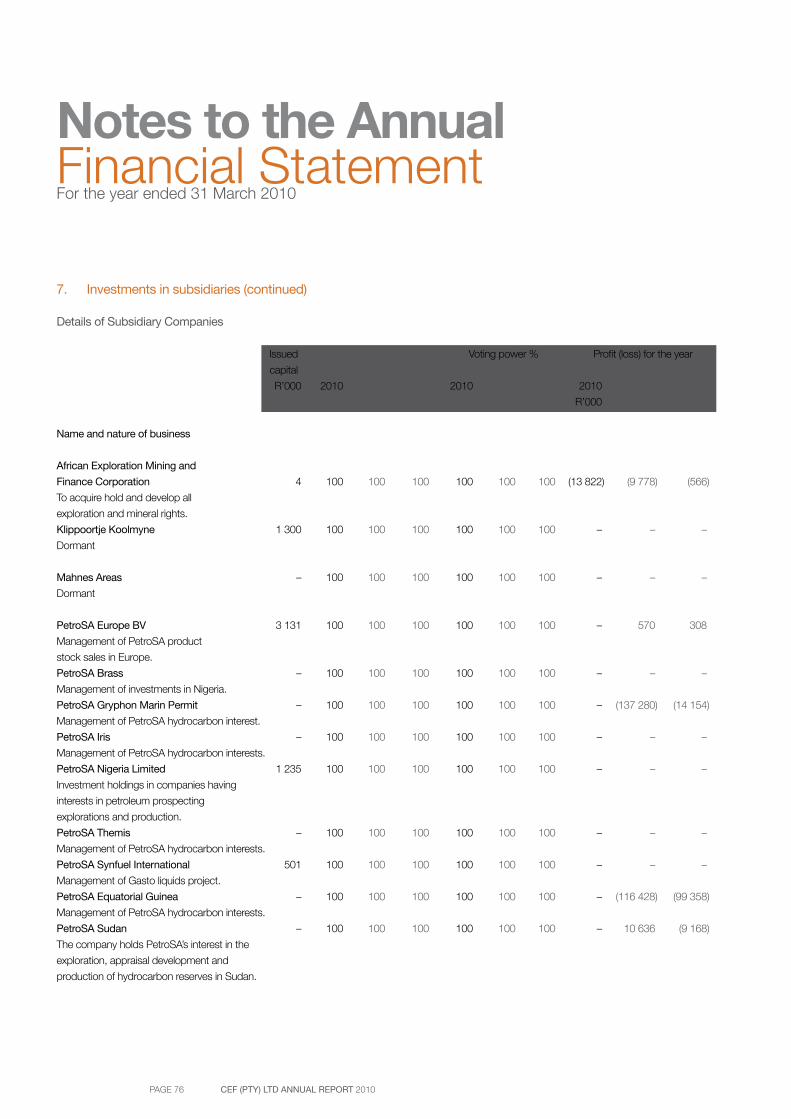
PAGE 76 CEF (PTY) LTD ANNUAL REPORT 2010
Notes to the AnnualFinancial StatementFor the year ended 31 March 2010
7. Investments in subsidiaries (continued)
Details of Subsidiary Companies
Issued % Voting power % Profit (loss) for the year
capital held
R’000 2010 2009 2008 2010 2009 2008 2010 2009 2008
R’000 R’000 R’000
Name and nature of business
African Exploration Mining and
Finance Corporation 4 100 100 100 100 100 100 (13 822) (9 778) (566)
To acquire hold and develop all
exploration and mineral rights.
Klippoortje Koolmyne 1 300 100 100 100 100 100 100 – – –
Dormant
Mahnes Areas – 100 100 100 100 100 100 – – –
Dormant
PetroSA Europe BV 3 131 100 100 100 100 100 100 – 570 308
Management of PetroSA product
stock sales in Europe.
PetroSA Brass – 100 100 100 100 100 100 – – –
Management of investments in Nigeria.
PetroSA Gryphon Marin Permit – 100 100 100 100 100 100 – (137 280) (14 154)
Management of PetroSA hydrocarbon interest.
PetroSA Iris – 100 100 100 100 100 100 – – –
Management of PetroSA hydrocarbon interests.
PetroSA Nigeria Limited 1 235 100 100 100 100 100 100 – – –
Investment holdings in companies having
interests in petroleum prospecting
explorations and production.
PetroSA Themis – 100 100 100 100 100 100 – – –
Management of PetroSA hydrocarbon interests.
PetroSA Synfuel International 501 100 100 100 100 100 100 – – –
Management of Gasto liquids project.
PetroSA Equatorial Guinea – 100 100 100 100 100 100 – (116 428) (99 358)
Management of PetroSA hydrocarbon interests.
PetroSA Sudan – 100 100 100 100 100 100 – 10 636 (9 168)
The company holds PetroSA’s interest in the
exploration, appraisal development and
production of hydrocarbon reserves in Sudan.
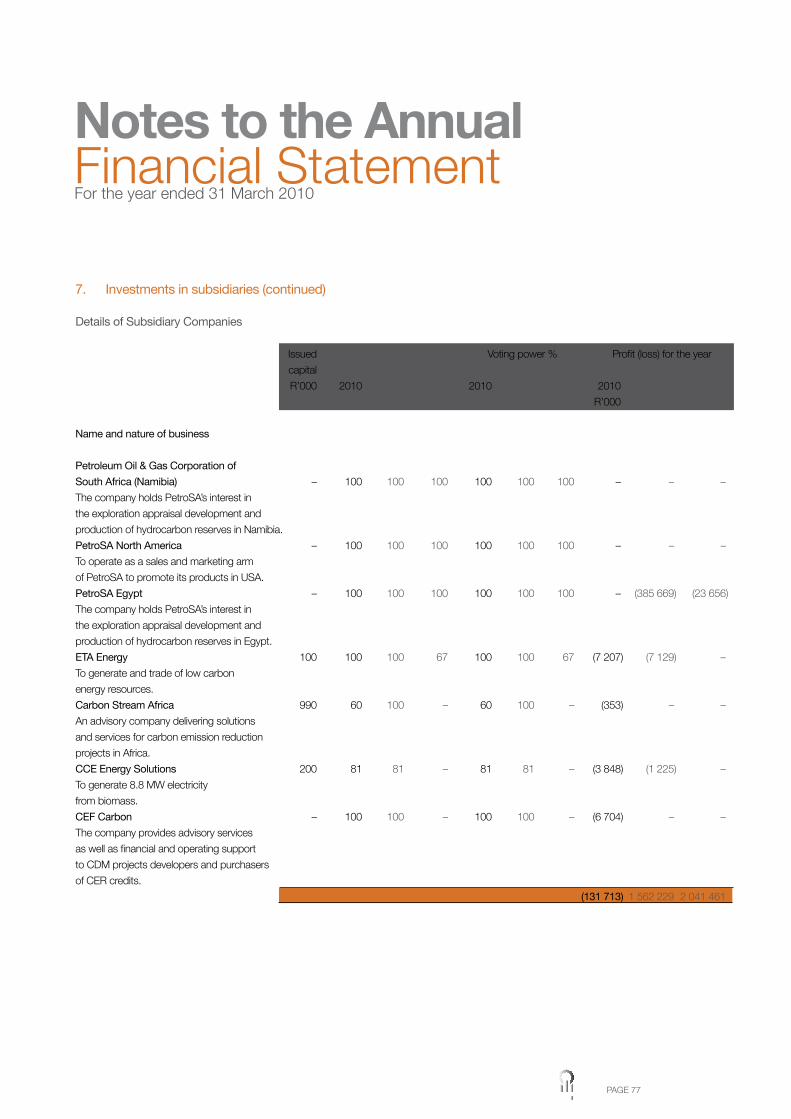
PAGE 77
7. Investments in subsidiaries (continued)
Details of Subsidiary Companies
Issued % Voting power % Profit (loss) for the year
capital held
R’000 2010 2009 2008 2010 2009 2008 2010 2009 2008
R’000 R’000 R’000
Name and nature of business
Petroleum Oil & Gas Corporation of
South Africa (Namibia) – 100 100 100 100 100 100 – – –
The company holds PetroSA’s interest in
the exploration appraisal development and
production of hydrocarbon reserves in Namibia.
PetroSA North America – 100 100 100 100 100 100 – – –
To operate as a sales and marketing arm
of PetroSA to promote its products in USA.
PetroSA Egypt – 100 100 100 100 100 100 – (385 669) (23 656)
The company holds PetroSA’s interest in
the exploration appraisal development and
production of hydrocarbon reserves in Egypt.
ETA Energy 100 100 100 67 100 100 67 (7 207) (7 129) –
To generate and trade of low carbon
energy resources.
Carbon Stream Africa 990 60 100 – 60 100 – (353) – –
An advisory company delivering solutions
and services for carbon emission reduction
projects in Africa.
CCE Energy Solutions 200 81 81 – 81 81 – (3 848) (1 225) –
To generate 8.8 MW electricity
from biomass.
CEF Carbon – 100 100 – 100 100 – (6 704) – –
The company provides advisory services
as well as financial and operating support
to CDM projects developers and purchasers
of CER credits.
(131 713) 1 562 229 2 041 461
Notes to the AnnualFinancial StatementFor the year ended 31 March 2010
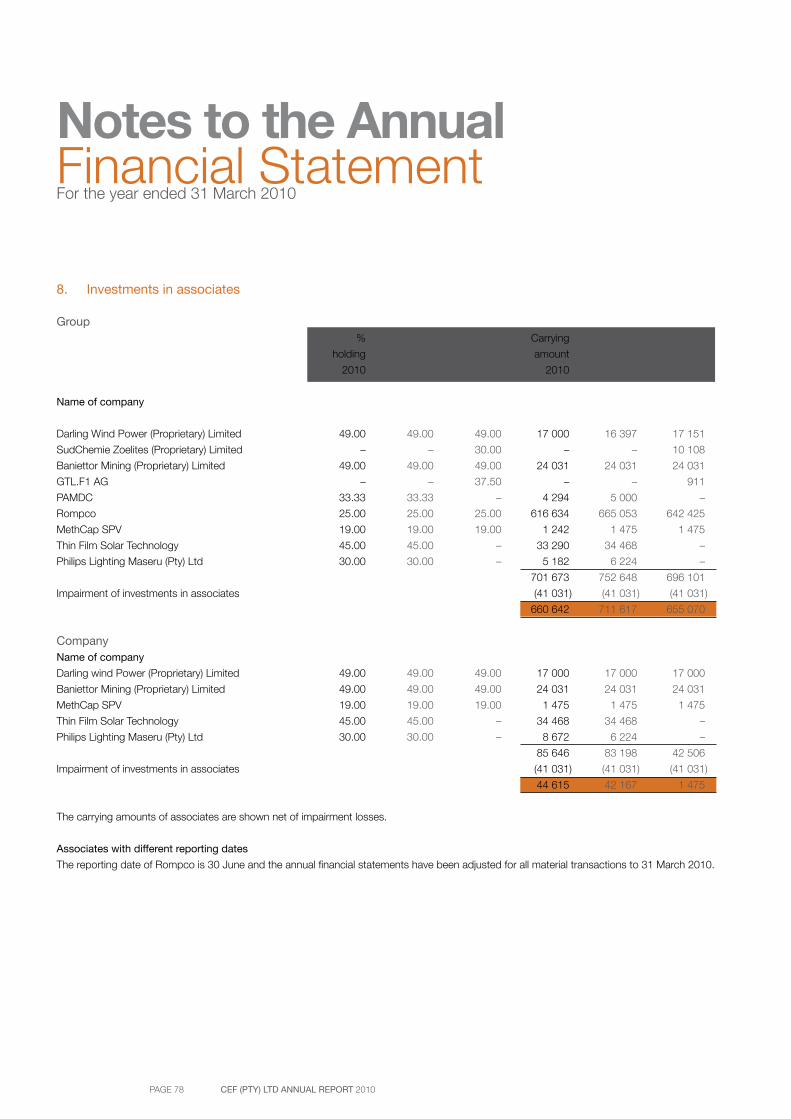
PAGE 78 CEF (PTY) LTD ANNUAL REPORT 2010
Notes to the AnnualFinancial StatementFor the year ended 31 March 2010
8. Investments in associates
Group % % % Carrying Carrying Carrying
holding holding holding amount amount amount
2010 2009 2008 2010 2009 2008
Name of company
Darling Wind Power (Proprietary) Limited 49.00 49.00 49.00 17 000 16 397 17 151
SudChemie Zoelites (Proprietary) Limited – – 30.00 – – 10 108
Baniettor Mining (Proprietary) Limited 49.00 49.00 49.00 24 031 24 031 24 031
GTL.F1 AG – – 37.50 – – 911
PAMDC 33.33 33.33 – 4 294 5 000 –
Rompco 25.00 25.00 25.00 616 634 665 053 642 425
MethCap SPV 19.00 19.00 19.00 1 242 1 475 1 475
Thin Film Solar Technology 45.00 45.00 – 33 290 34 468 –
Philips Lighting Maseru (Pty) Ltd 30.00 30.00 – 5 182 6 224 –
701 673 752 648 696 101
Impairment of investments in associates (41 031) (41 031) (41 031)
660 642 711 617 655 070
CompanyName of company
Darling wind Power (Proprietary) Limited 49.00 49.00 49.00 17 000 17 000 17 000
Baniettor Mining (Proprietary) Limited 49.00 49.00 49.00 24 031 24 031 24 031
MethCap SPV 19.00 19.00 19.00 1 475 1 475 1 475
Thin Film Solar Technology 45.00 45.00 – 34 468 34 468 –
Philips Lighting Maseru (Pty) Ltd 30.00 30.00 – 8 672 6 224 –
85 646 83 198 42 506
Impairment of investments in associates (41 031) (41 031) (41 031)
44 615 42 167 1 475
The carrying amounts of associates are shown net of impairment losses.
Associates with different reporting dates
The reporting date of Rompco is 30 June and the annual financial statements have been adjusted for all material transactions to 31 March 2010.

PAGE 79
8. Investments in associates (continued)
Group Group Group Company Company Company
2010 2009 2008 2010 2009 2008
R’000 R’000 R’000 R’000 R’000 R’000
Darling Wind Power (Proprietary) Limited
Assets
Non-current 65 644 73 072 – – – –
Current 518 2 923 – – – –
66 162 75 995 – – – –
Equity and liabilities
Equity and reserves (13 978) (4 040) – – – –
Non-current liabilities 70 450 70 839 – – – –
Current liabilities 9 690 9 196 – – – –
66 162 75 995 – – – –
Revenue 2 181 2 251 – – – –
Loss (9 941) (6 475) – – – –
The company’s year end is 31 March.
Baniettor Mining (Proprietary) Limited
Assets
Non-current 2 200 2 200 – – – –
Current 2 731 156 – – – –
4 931 2 356 – – – –
Equity and liabilities
Equity and reserves (44 691) (44 959) – – – –
Current liabilities 49 622 47 315 – – – –
4 931 2 356 – – – –
Revenue 130 137 – – – –
Profit 268 252 – – – –
The company’s year end is 30 June.
Notes to the AnnualFinancial StatementFor the year ended 31 March 2010
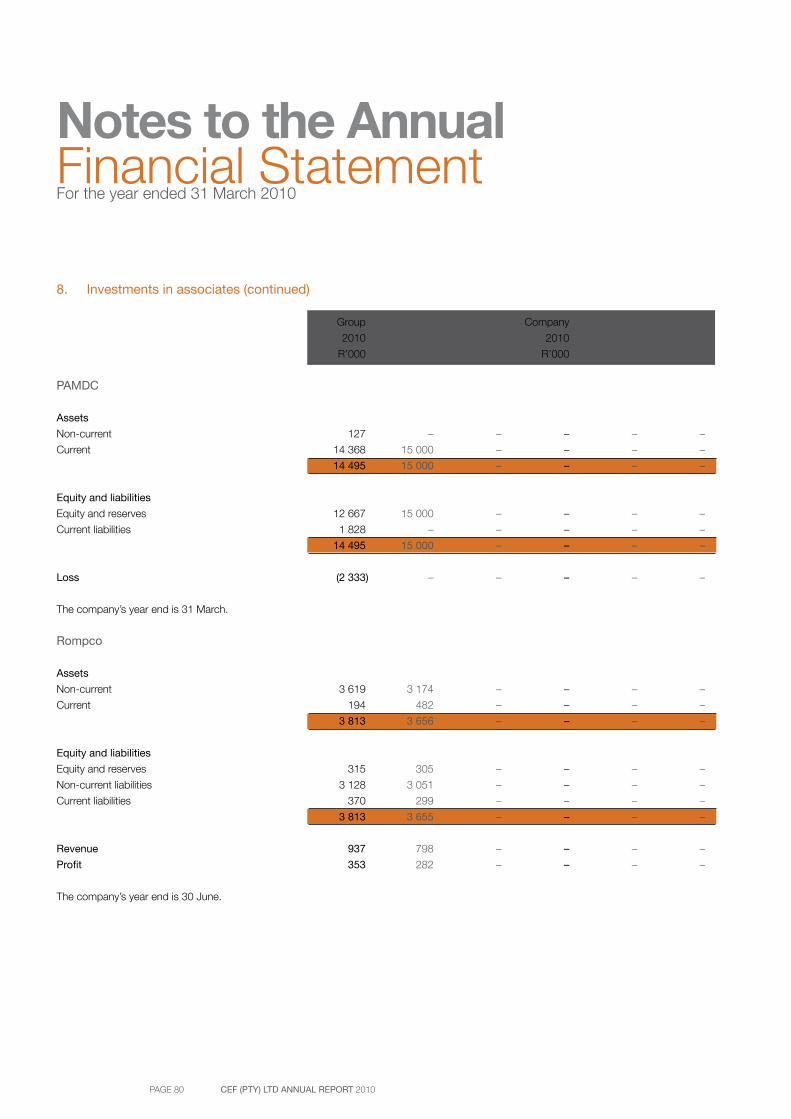
PAGE 80 CEF (PTY) LTD ANNUAL REPORT 2010
Notes to the AnnualFinancial StatementFor the year ended 31 March 2010
8. Investments in associates (continued)
Group Group Group Company Company Company
2010 2009 2008 2010 2009 2008
R’000 R’000 R’000 R’000 R’000 R’000
PAMDC
Assets
Non-current 127 – – – – –
Current 14 368 15 000 – – – –
14 495 15 000 – – – –
Equity and liabilities
Equity and reserves 12 667 15 000 – – – –
Current liabilities 1 828 – – – – –
14 495 15 000 – – – –
Loss (2 333) – – – – –
The company’s year end is 31 March.
Rompco
Assets
Non-current 3 619 3 174 – – – –
Current 194 482 – – – –
3 813 3 656 – – – –
Equity and liabilities
Equity and reserves 315 305 – – – –
Non-current liabilities 3 128 3 051 – – – –
Current liabilities 370 299 – – – –
3 813 3 655 – – – –
Revenue 937 798 – – – –
Profit 353 282 – – – –
The company’s year end is 30 June.
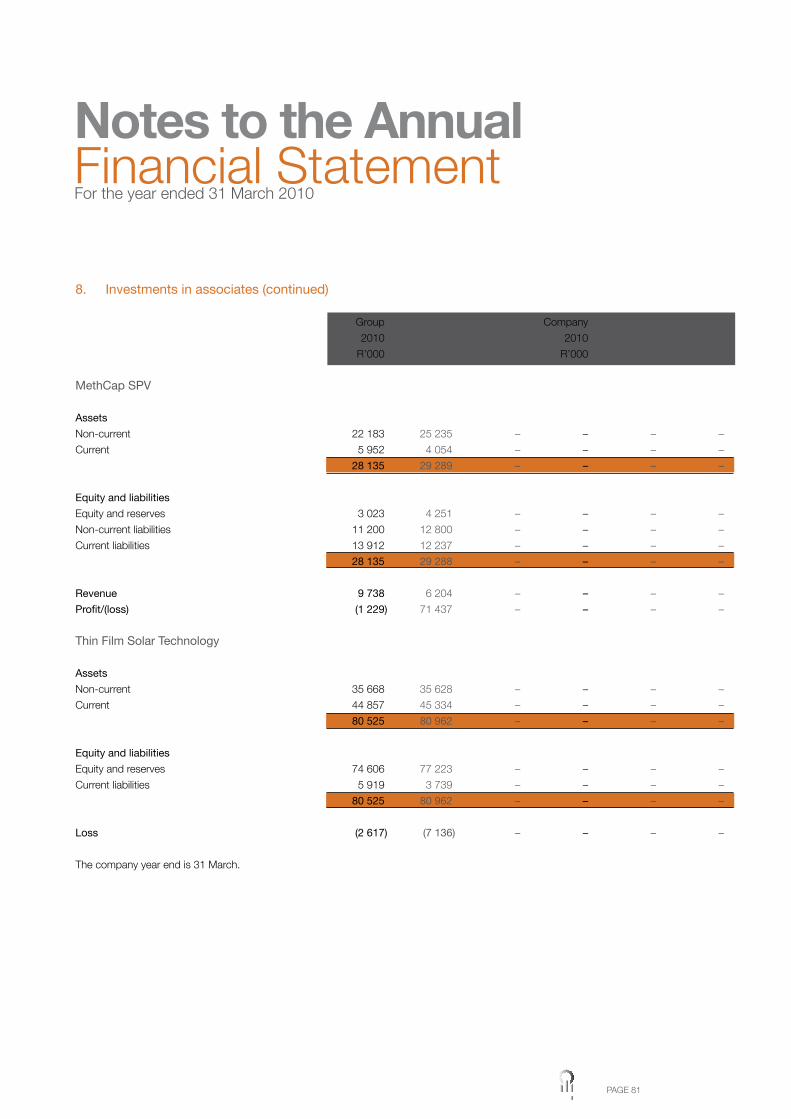
PAGE 81
8. Investments in associates (continued)
Group Group Group Company Company Company
2010 2009 2008 2010 2009 2008
R’000 R’000 R’000 R’000 R’000 R’000
MethCap SPV
Assets
Non-current 22 183 25 235 – – – –
Current 5 952 4 054 – – – –
28 135 29 289 – – – –
Equity and liabilities
Equity and reserves 3 023 4 251 – – – –
Non-current liabilities 11 200 12 800 – – – –
Current liabilities 13 912 12 237 – – – –
28 135 29 288 – – – –
Revenue 9 738 6 204 – – – –
Profit/(loss) (1 229) 71 437 – – – –
Thin Film Solar Technology
Assets
Non-current 35 668 35 628 – – – –
Current 44 857 45 334 – – – –
80 525 80 962 – – – –
Equity and liabilities
Equity and reserves 74 606 77 223 – – – –
Current liabilities 5 919 3 739 – – – –
80 525 80 962 – – – –
Loss (2 617) (7 136) – – – –
The company year end is 31 March.
Notes to the AnnualFinancial StatementFor the year ended 31 March 2010
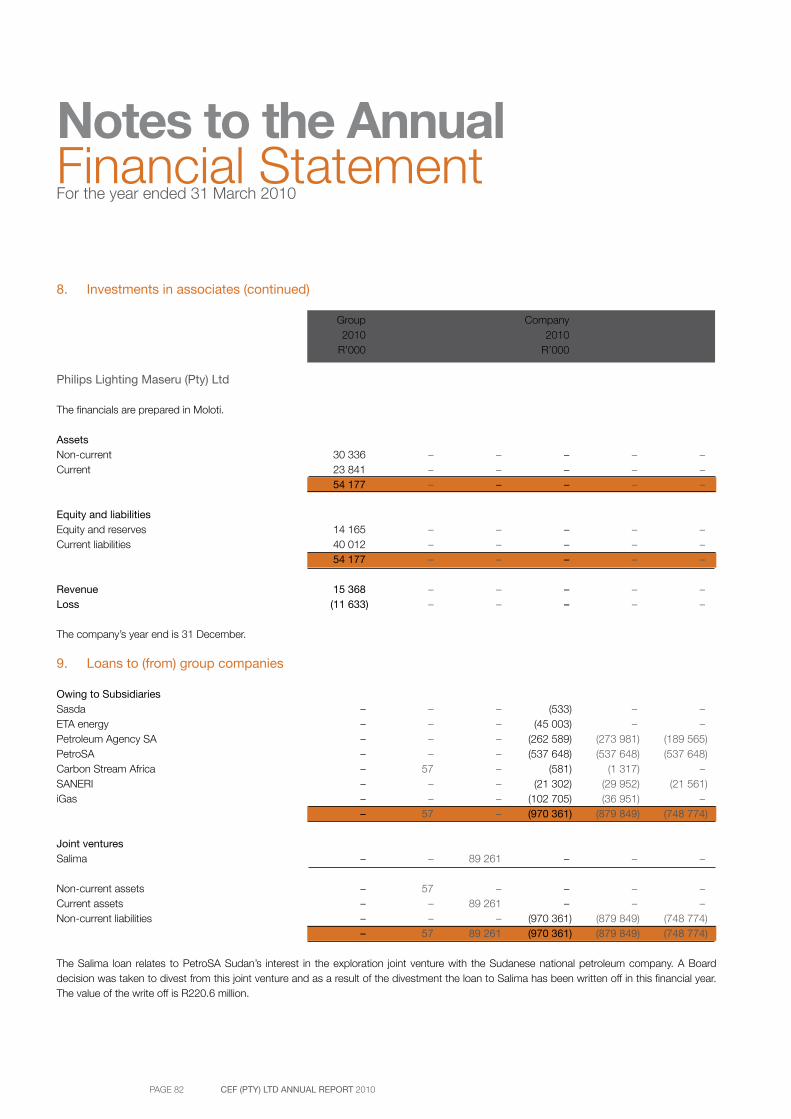
PAGE 82 CEF (PTY) LTD ANNUAL REPORT 2010
Notes to the AnnualFinancial StatementFor the year ended 31 March 2010
8. Investments in associates (continued) Group Group Group Company Company Company 2010 2009 2008 2010 2009 2008 R’000 R’000 R’000 R’000 R’000 R’000
Philips Lighting Maseru (Pty) Ltd
The financials are prepared in Moloti.
Assets Non-current 30 336 – – – – –Current 23 841 – – – – – 54 177 – – – – –
Equity and liabilities Equity and reserves 14 165 – – – – –Current liabilities 40 012 – – – – – 54 177 – – – – –
Revenue 15 368 – – – – –Loss (11 633) – – – – –
The company’s year end is 31 December.
9. Loans to (from) group companies
Owing to SubsidiariesSasda – – – (533) – –ETA energy – – – (45 003) – –Petroleum Agency SA – – – (262 589) (273 981) (189 565)PetroSA – – – (537 648) (537 648) (537 648)Carbon Stream Africa – 57 – (581) (1 317) –SANERI – – – (21 302) (29 952) (21 561)iGas – – – (102 705) (36 951) – – 57 – (970 361) (879 849) (748 774)
Joint venturesSalima – – 89 261 – – –
Non-current assets – 57 – – – –Current assets – – 89 261 – – –Non-current liabilities – – – (970 361) (879 849) (748 774) – 57 89 261 (970 361) (879 849) (748 774)
The Salima loan relates to PetroSA Sudan’s interest in the exploration joint venture with the Sudanese national petroleum company. A Board decision was taken to divest from this joint venture and as a result of the divestment the loan to Salima has been written off in this financial year. The value of the write off is R220.6 million.
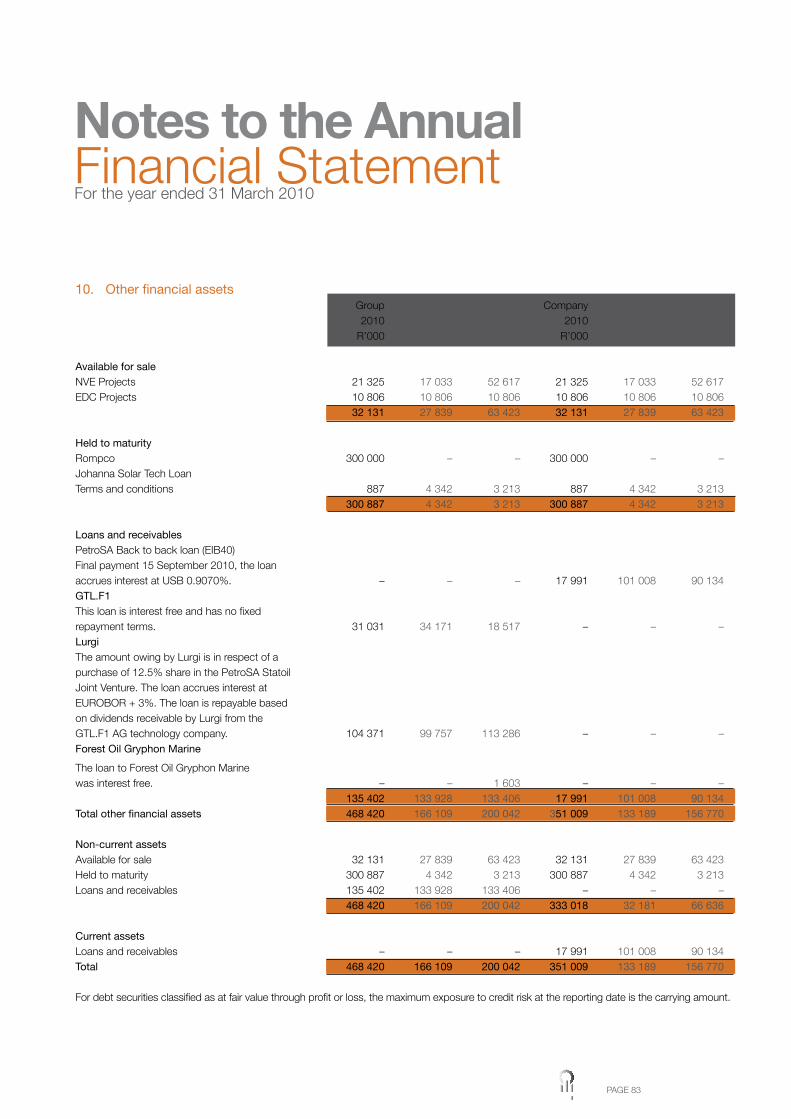
PAGE 83
10. Other financial assets Group Group Group Company Company Company 2010 2009 2008 2010 2009 2008 R’000 R’000 R’000 R’000 R’000 R’000
Available for sale NVE Projects 21 325 17 033 52 617 21 325 17 033 52 617EDC Projects 10 806 10 806 10 806 10 806 10 806 10 806 32 131 27 839 63 423 32 131 27 839 63 423
Held to maturity Rompco 300 000 – – 300 000 – –Johanna Solar Tech Loan Terms and conditions 887 4 342 3 213 887 4 342 3 213 300 887 4 342 3 213 300 887 4 342 3 213
Loans and receivables PetroSA Back to back loan (EIB40) Final payment 15 September 2010, the loan accrues interest at USB 0.9070%. – – – 17 991 101 008 90 134GTL.F1 This loan is interest free and has no fixed repayment terms. 31 031 34 171 18 517 – – –Lurgi The amount owing by Lurgi is in respect of a purchase of 12.5% share in the PetroSA Statoil Joint Venture. The loan accrues interest at EUROBOR + 3%. The loan is repayable based on dividends receivable by Lurgi from the GTL.F1 AG technology company. 104 371 99 757 113 286 – – –Forest Oil Gryphon Marine
The loan to Forest Oil Gryphon Marine was interest free. – – 1 603 – – – 135 402 133 928 133 406 17 991 101 008 90 134 Total other financial assets 468 420 166 109 200 042 351 009 133 189 156 770
Non-current assets Available for sale 32 131 27 839 63 423 32 131 27 839 63 423Held to maturity 300 887 4 342 3 213 300 887 4 342 3 213Loans and receivables 135 402 133 928 133 406 – – – 468 420 166 109 200 042 333 018 32 181 66 636
Current assets Loans and receivables – – – 17 991 101 008 90 134Total 468 420 166 109 200 042 351 009 133 189 156 770
For debt securities classified as at fair value through profit or loss, the maximum exposure to credit risk at the reporting date is the carrying amount.
Notes to the AnnualFinancial StatementFor the year ended 31 March 2010
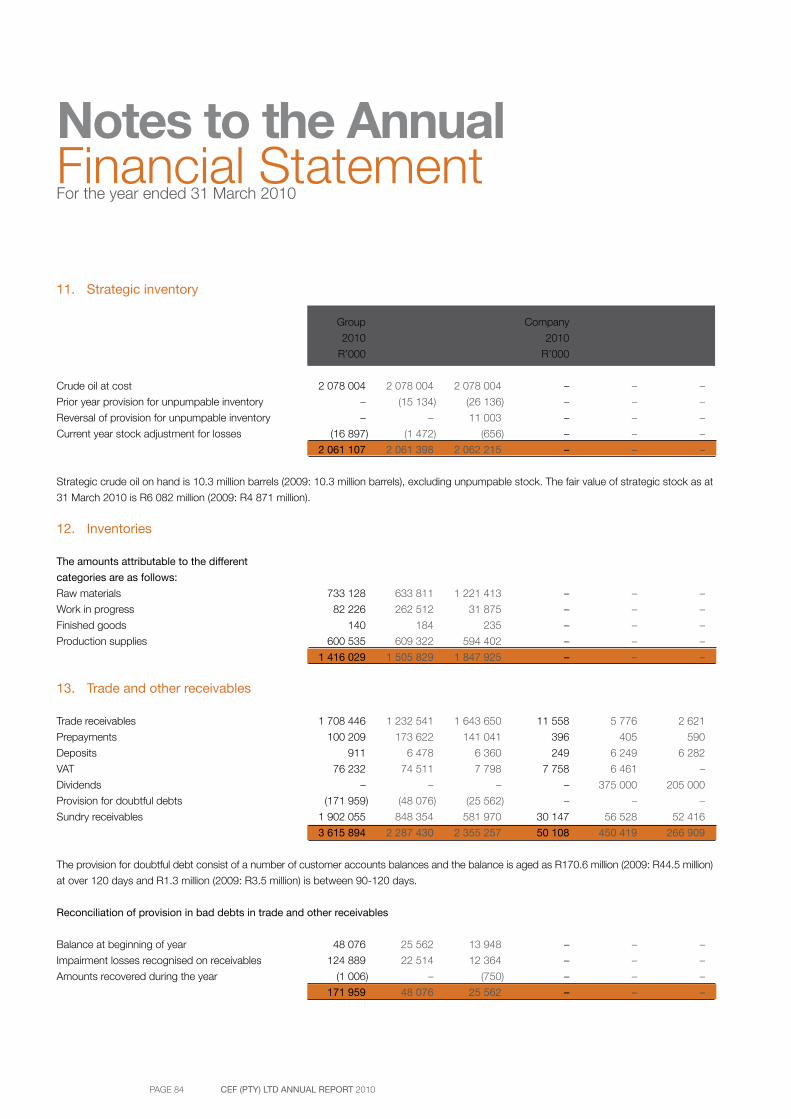
PAGE 84 CEF (PTY) LTD ANNUAL REPORT 2010
Notes to the AnnualFinancial StatementFor the year ended 31 March 2010
11. Strategic inventory
Group Group Group Company Company Company
2010 2009 2008 2010 2009 2008
R’000 R’000 R’000 R’000 R’000 R’000
Crude oil at cost 2 078 004 2 078 004 2 078 004 – – –
Prior year provision for unpumpable inventory – (15 134) (26 136) – – –
Reversal of provision for unpumpable inventory – – 11 003 – – –
Current year stock adjustment for losses (16 897) (1 472) (656) – – –
2 061 107 2 061 398 2 062 215 – – –
Strategic crude oil on hand is 10.3 million barrels (2009: 10.3 million barrels), excluding unpumpable stock. The fair value of strategic stock as at
31 March 2010 is R6 082 million (2009: R4 871 million).
12. Inventories
The amounts attributable to the different
categories are as follows:
Raw materials 733 128 633 811 1 221 413 – – –
Work in progress 82 226 262 512 31 875 – – –
Finished goods 140 184 235 – – –
Production supplies 600 535 609 322 594 402 – – –
1 416 029 1 505 829 1 847 925 – – –
13. Trade and other receivables
Trade receivables 1 708 446 1 232 541 1 643 650 11 558 5 776 2 621
Prepayments 100 209 173 622 141 041 396 405 590
Deposits 911 6 478 6 360 249 6 249 6 282
VAT 76 232 74 511 7 798 7 758 6 461 –
Dividends – – – – 375 000 205 000
Provision for doubtful debts (171 959) (48 076) (25 562) – – –
Sundry receivables 1 902 055 848 354 581 970 30 147 56 528 52 416
3 615 894 2 287 430 2 355 257 50 108 450 419 266 909
The provision for doubtful debt consist of a number of customer accounts balances and the balance is aged as R170.6 million (2009: R44.5 million)
at over 120 days and R1.3 million (2009: R3.5 million) is between 90-120 days.
Reconciliation of provision in bad debts in trade and other receivables
Balance at beginning of year 48 076 25 562 13 948 – – –
Impairment losses recognised on receivables 124 889 22 514 12 364 – – –
Amounts recovered during the year (1 006) – (750) – – –
171 959 48 076 25 562 – – –
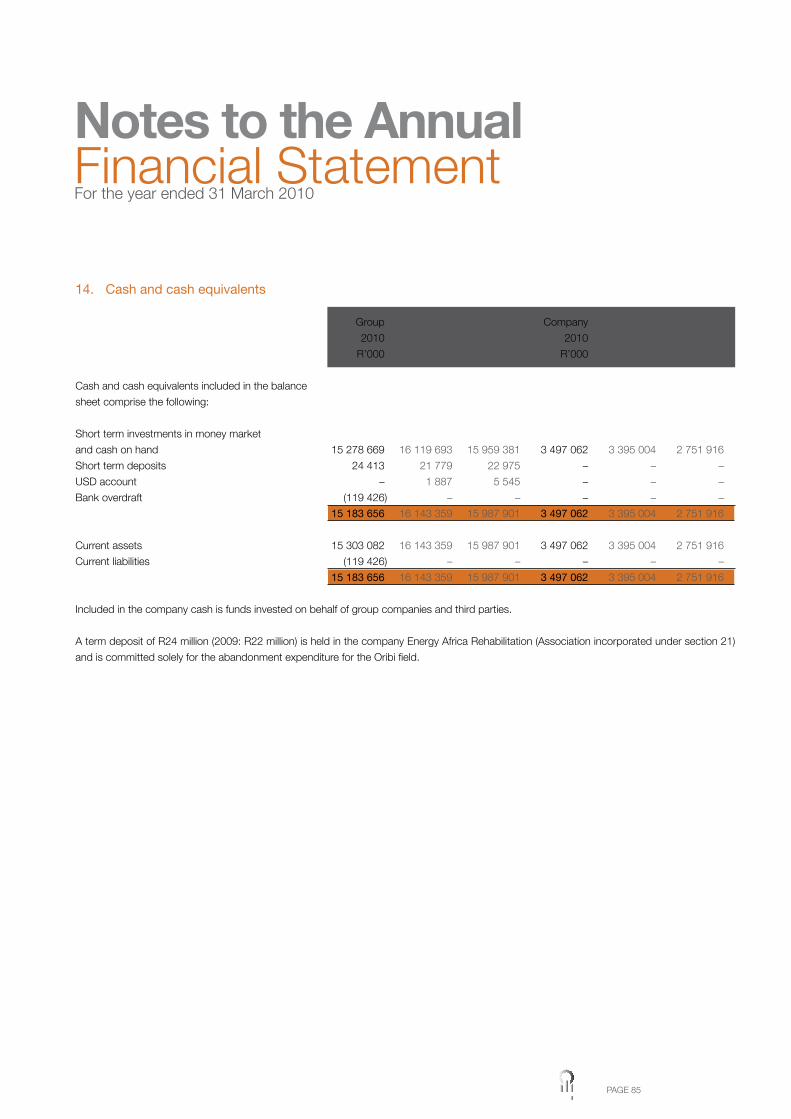
PAGE 85
14. Cash and cash equivalents
Group Group Group Company Company Company
2010 2009 2008 2010 2009 2008
R’000 R’000 R’000 R’000 R’000 R’000
Cash and cash equivalents included in the balance
sheet comprise the following:
Short term investments in money market
and cash on hand 15 278 669 16 119 693 15 959 381 3 497 062 3 395 004 2 751 916
Short term deposits 24 413 21 779 22 975 – – –
USD account – 1 887 5 545 – – –
Bank overdraft (119 426) – – – – –
15 183 656 16 143 359 15 987 901 3 497 062 3 395 004 2 751 916
Current assets 15 303 082 16 143 359 15 987 901 3 497 062 3 395 004 2 751 916
Current liabilities (119 426) – – – – –
15 183 656 16 143 359 15 987 901 3 497 062 3 395 004 2 751 916
Included in the company cash is funds invested on behalf of group companies and third parties.
A term deposit of R24 million (2009: R22 million) is held in the company Energy Africa Rehabilitation (Association incorporated under section 21)
and is committed solely for the abandonment expenditure for the Oribi field.
Notes to the AnnualFinancial StatementFor the year ended 31 March 2010
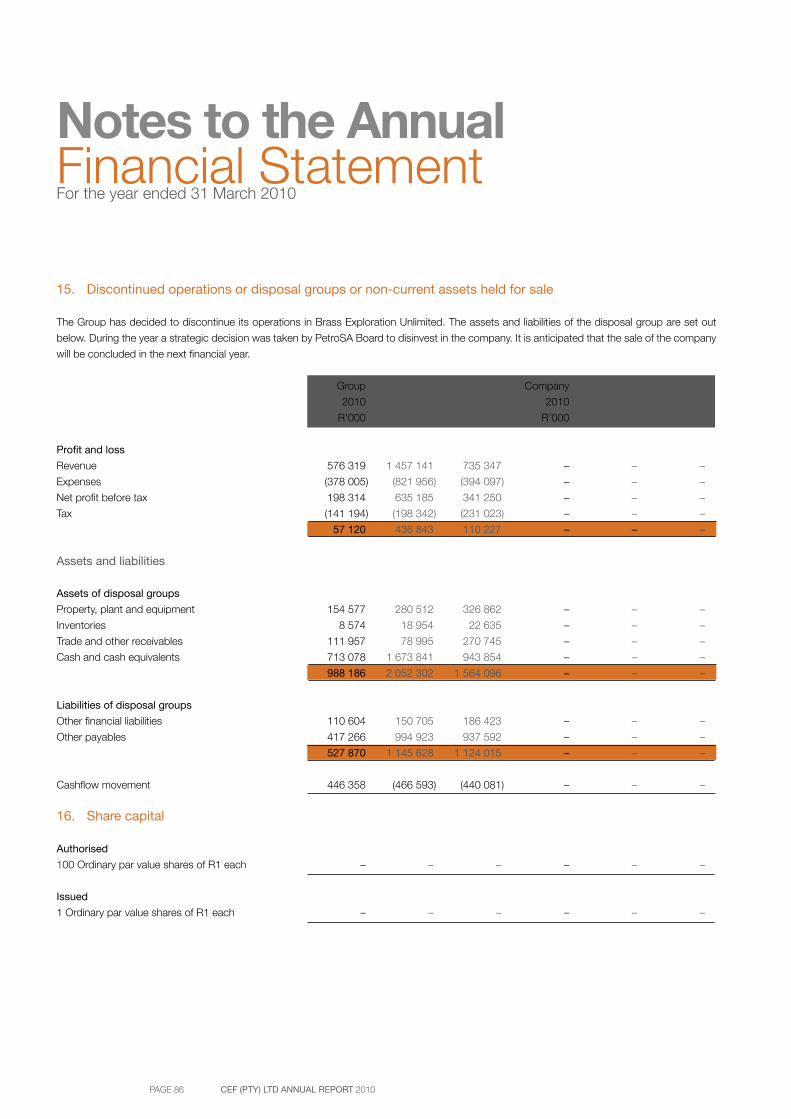
PAGE 86 CEF (PTY) LTD ANNUAL REPORT 2010
Notes to the AnnualFinancial StatementFor the year ended 31 March 2010
15. Discontinued operations or disposal groups or non-current assets held for sale
The Group has decided to discontinue its operations in Brass Exploration Unlimited. The assets and liabilities of the disposal group are set out
below. During the year a strategic decision was taken by PetroSA Board to disinvest in the company. It is anticipated that the sale of the company
will be concluded in the next financial year.
Group Group Group Company Company Company
2010 2009 2008 2010 2009 2008
R’000 R’000 R’000 R’000 R’000 R’000
Profit and loss
Revenue 576 319 1 457 141 735 347 – – –
Expenses (378 005) (821 956) (394 097) – – –
Net profit before tax 198 314 635 185 341 250 – – –
Tax (141 194) (198 342) (231 023) – – –
57 120 436 843 110 227 – – –
Assets and liabilities
Assets of disposal groups
Property, plant and equipment 154 577 280 512 326 862 – – –
Inventories 8 574 18 954 22 635 – – –
Trade and other receivables 111 957 78 995 270 745 – – –
Cash and cash equivalents 713 078 1 673 841 943 854 – – –
988 186 2 052 302 1 564 096 – – –
Liabilities of disposal groups
Other financial liabilities 110 604 150 705 186 423 – – –
Other payables 417 266 994 923 937 592 – – –
527 870 1 145 628 1 124 015 – – –
Cashflow movement 446 358 (466 593) (440 081) – – –
16. Share capital
Authorised
100 Ordinary par value shares of R1 each – – – – – –
Issued
1 Ordinary par value shares of R1 each – – – – – –
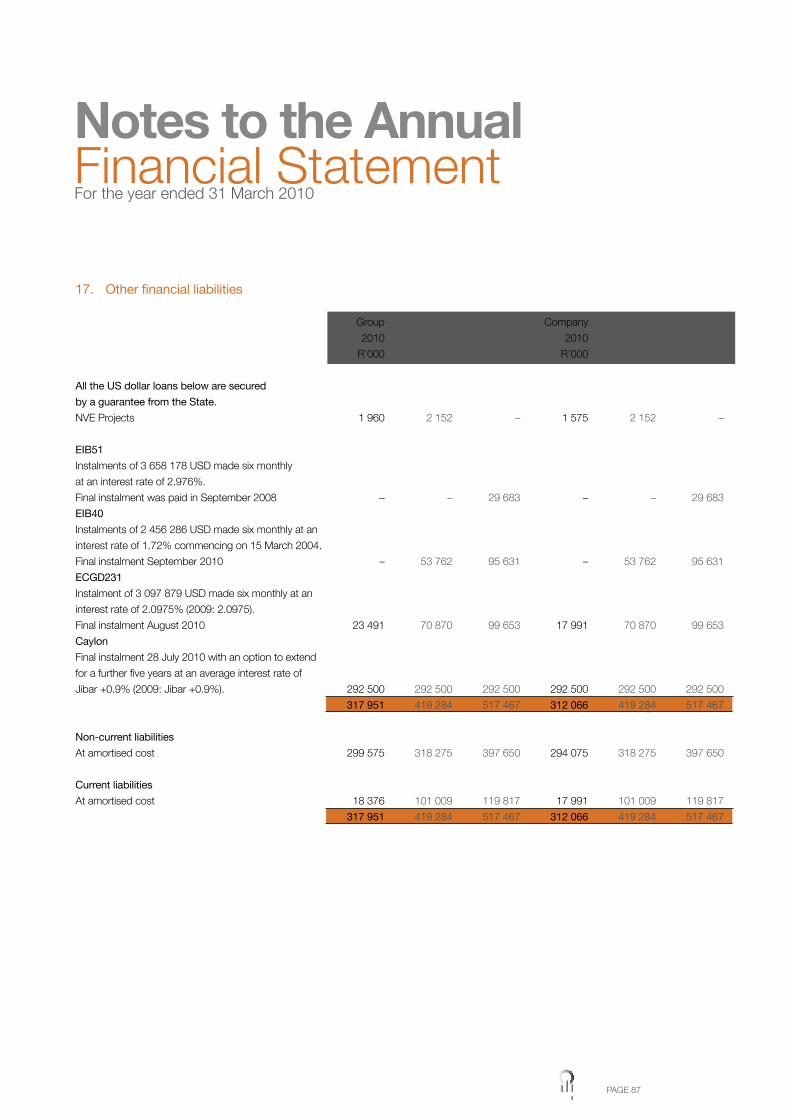
PAGE 87
17. Other financial liabilities
Group Group Group Company Company Company
2010 2009 2008 2010 2009 2008
R’000 R’000 R’000 R’000 R’000 R’000
All the US dollar loans below are secured
by a guarantee from the State.
NVE Projects 1 960 2 152 – 1 575 2 152 –
EIB51
Instalments of 3 658 178 USD made six monthly
at an interest rate of 2.976%.
Final instalment was paid in September 2008 – – 29 683 – – 29 683
EIB40
Instalments of 2 456 286 USD made six monthly at an
interest rate of 1.72% commencing on 15 March 2004.
Final instalment September 2010 – 53 762 95 631 – 53 762 95 631
ECGD231
Instalment of 3 097 879 USD made six monthly at an
interest rate of 2.0975% (2009: 2.0975).
Final instalment August 2010 23 491 70 870 99 653 17 991 70 870 99 653
Caylon
Final instalment 28 July 2010 with an option to extend
for a further five years at an average interest rate of
Jibar +0.9% (2009: Jibar +0.9%). 292 500 292 500 292 500 292 500 292 500 292 500
317 951 419 284 517 467 312 066 419 284 517 467
Non-current liabilities
At amortised cost 299 575 318 275 397 650 294 075 318 275 397 650
Current liabilities
At amortised cost 18 376 101 009 119 817 17 991 101 009 119 817
317 951 419 284 517 467 312 066 419 284 517 467
Notes to the AnnualFinancial StatementFor the year ended 31 March 2010
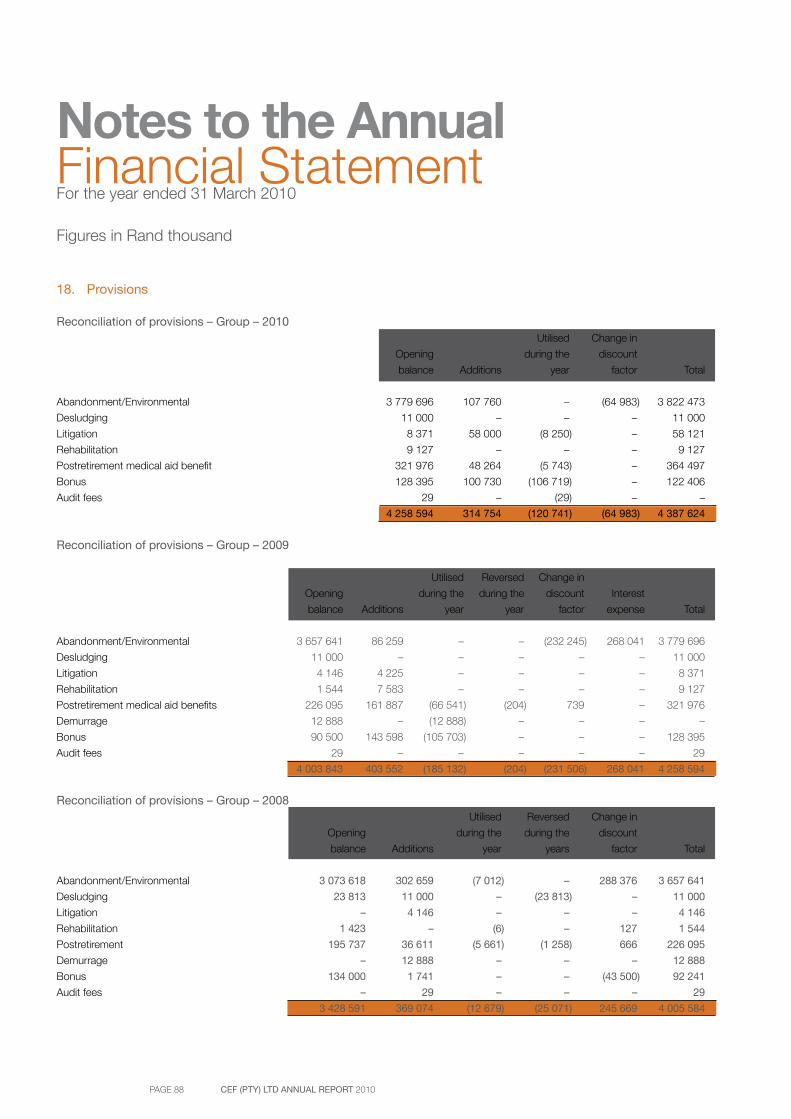
PAGE 88 CEF (PTY) LTD ANNUAL REPORT 2010
Notes to the AnnualFinancial StatementFor the year ended 31 March 2010
Figures in Rand thousand
18. Provisions
Reconciliation of provisions – Group – 2010 Utilised Change in
Opening during the discount
balance Additions year factor Total
Abandonment/Environmental 3 779 696 107 760 – (64 983) 3 822 473
Desludging 11 000 – – – 11 000
Litigation 8 371 58 000 (8 250) – 58 121
Rehabilitation 9 127 – – – 9 127
Postretirement medical aid benefit 321 976 48 264 (5 743) – 364 497
Bonus 128 395 100 730 (106 719) – 122 406
Audit fees 29 – (29) – –
4 258 594 314 754 (120 741) (64 983) 4 387 624
Reconciliation of provisions – Group – 2009
Utilised Reversed Change in
Opening during the during the discount Interest
balance Additions year year factor expense Total
Abandonment/Environmental 3 657 641 86 259 – – (232 245) 268 041 3 779 696
Desludging 11 000 – – – – – 11 000
Litigation 4 146 4 225 – – – – 8 371
Rehabilitation 1 544 7 583 – – – – 9 127
Postretirement medical aid benefits 226 095 161 887 (66 541) (204) 739 – 321 976
Demurrage 12 888 – (12 888) – – – –
Bonus 90 500 143 598 (105 703) – – – 128 395
Audit fees 29 – – – – – 29
4 003 843 403 552 (185 132) (204) (231 506) 268 041 4 258 594
Reconciliation of provisions – Group – 2008 Utilised Reversed Change in
Opening during the during the discount
balance Additions year years factor Total
Abandonment/Environmental 3 073 618 302 659 (7 012) – 288 376 3 657 641
Desludging 23 813 11 000 – (23 813) – 11 000
Litigation – 4 146 – – – 4 146
Rehabilitation 1 423 – (6) – 127 1 544
Postretirement 195 737 36 611 (5 661) (1 258) 666 226 095
Demurrage – 12 888 – – – 12 888
Bonus 134 000 1 741 – – (43 500) 92 241
Audit fees – 29 – – – 29
3 428 591 369 074 (12 679) (25 071) 245 669 4 005 584
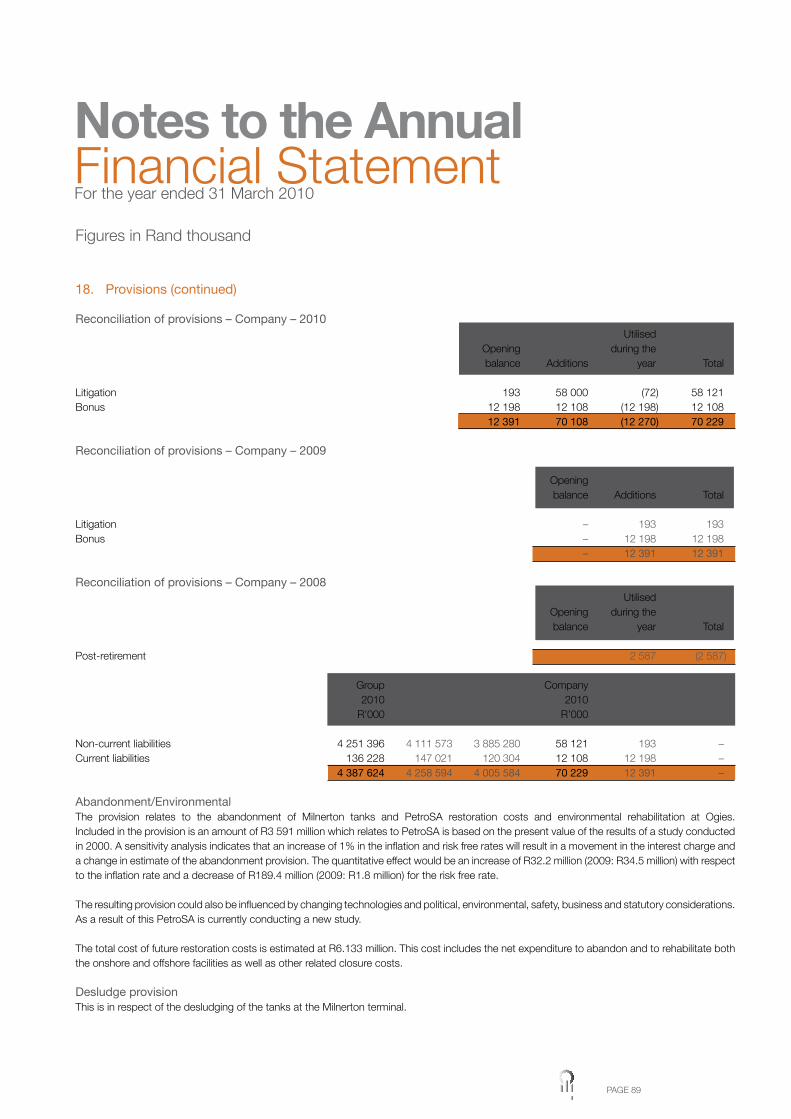
PAGE 89
Figures in Rand thousand
18. Provisions (continued)
Reconciliation of provisions – Company – 2010 Utilised Opening during the balance Additions year Total
Litigation 193 58 000 (72) 58 121Bonus 12 198 12 108 (12 198) 12 108 12 391 70 108 (12 270) 70 229
Reconciliation of provisions – Company – 2009 Opening balance Additions Total
Litigation – 193 193Bonus – 12 198 12 198 – 12 391 12 391
Reconciliation of provisions – Company – 2008 Utilised Opening during the balance year Total
Post-retirement 2 587 (2 587)
Group Group Group Company Company Company 2010 2009 2008 2010 2009 2008 R’000 R’000 R’000 R’000 R’000 R’000
Non-current liabilities 4 251 396 4 111 573 3 885 280 58 121 193 –Current liabilities 136 228 147 021 120 304 12 108 12 198 – 4 387 624 4 258 594 4 005 584 70 229 12 391 –
Abandonment/EnvironmentalThe provision relates to the abandonment of Milnerton tanks and PetroSA restoration costs and environmental rehabilitation at Ogies.Included in the provision is an amount of R3 591 million which relates to PetroSA is based on the present value of the results of a study conducted in 2000. A sensitivity analysis indicates that an increase of 1% in the inflation and risk free rates will result in a movement in the interest charge and a change in estimate of the abandonment provision. The quantitative effect would be an increase of R32.2 million (2009: R34.5 million) with respect to the inflation rate and a decrease of R189.4 million (2009: R1.8 million) for the risk free rate.
The resulting provision could also be influenced by changing technologies and political, environmental, safety, business and statutory considerations. As a result of this PetroSA is currently conducting a new study.
The total cost of future restoration costs is estimated at R6.133 million. This cost includes the net expenditure to abandon and to rehabilitate both the onshore and offshore facilities as well as other related closure costs.
Desludge provisionThis is in respect of the desludging of the tanks at the Milnerton terminal.
Notes to the AnnualFinancial StatementFor the year ended 31 March 2010
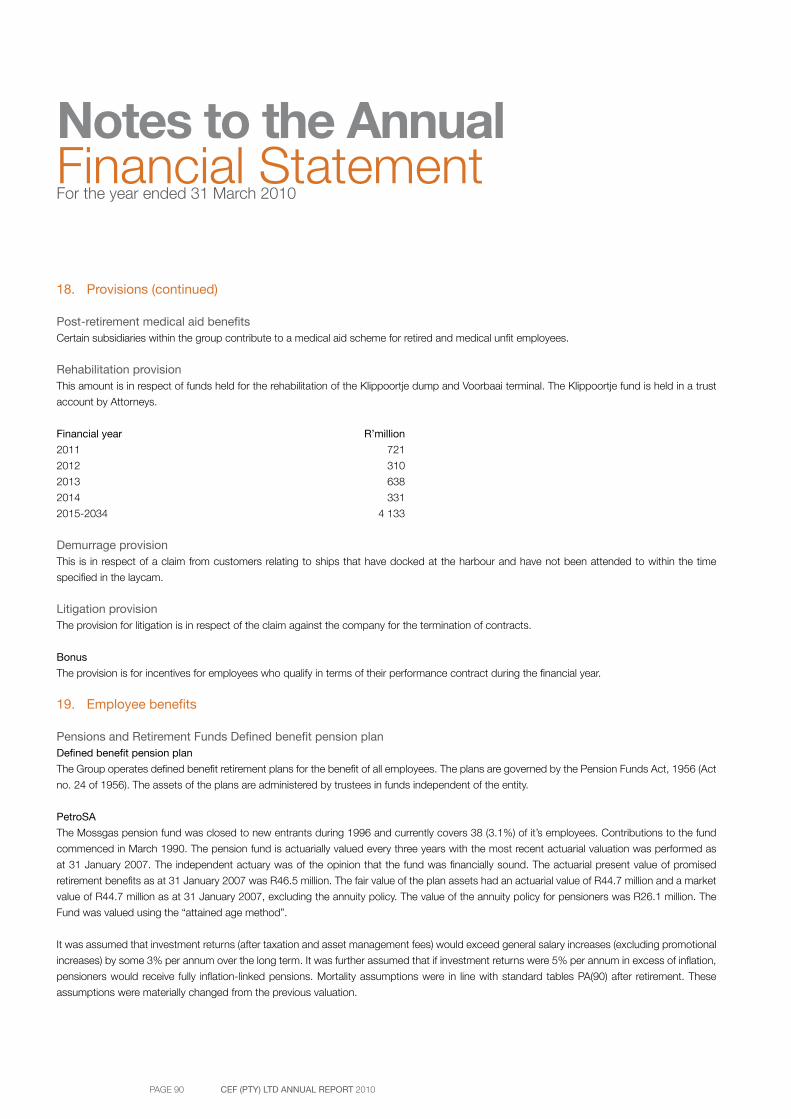
PAGE 90 CEF (PTY) LTD ANNUAL REPORT 2010
Notes to the AnnualFinancial StatementFor the year ended 31 March 2010
18. Provisions (continued)
Post-retirement medical aid benefitsCertain subsidiaries within the group contribute to a medical aid scheme for retired and medical unfit employees.
Rehabilitation provisionThis amount is in respect of funds held for the rehabilitation of the Klippoortje dump and Voorbaai terminal. The Klippoortje fund is held in a trust
account by Attorneys.
Financial year R’million
2011 721
2012 310
2013 638
2014 331
2015-2034 4 133
Demurrage provisionThis is in respect of a claim from customers relating to ships that have docked at the harbour and have not been attended to within the time
specified in the laycam.
Litigation provisionThe provision for litigation is in respect of the claim against the company for the termination of contracts.
Bonus
The provision is for incentives for employees who qualify in terms of their performance contract during the financial year.
19. Employee benefits
Pensions and Retirement Funds Defined benefit pension planDefined benefit pension plan
The Group operates defined benefit retirement plans for the benefit of all employees. The plans are governed by the Pension Funds Act, 1956 (Act
no. 24 of 1956). The assets of the plans are administered by trustees in funds independent of the entity.
PetroSA
The Mossgas pension fund was closed to new entrants during 1996 and currently covers 38 (3.1%) of it’s employees. Contributions to the fund
commenced in March 1990. The pension fund is actuarially valued every three years with the most recent actuarial valuation was performed as
at 31 January 2007. The independent actuary was of the opinion that the fund was financially sound. The actuarial present value of promised
retirement benefits as at 31 January 2007 was R46.5 million. The fair value of the plan assets had an actuarial value of R44.7 million and a market
value of R44.7 million as at 31 January 2007, excluding the annuity policy. The value of the annuity policy for pensioners was R26.1 million. The
Fund was valued using the “attained age method”.
It was assumed that investment returns (after taxation and asset management fees) would exceed general salary increases (excluding promotional
increases) by some 3% per annum over the long term. It was further assumed that if investment returns were 5% per annum in excess of inflation,
pensioners would receive fully inflation-linked pensions. Mortality assumptions were in line with standard tables PA(90) after retirement. These
assumptions were materially changed from the previous valuation.
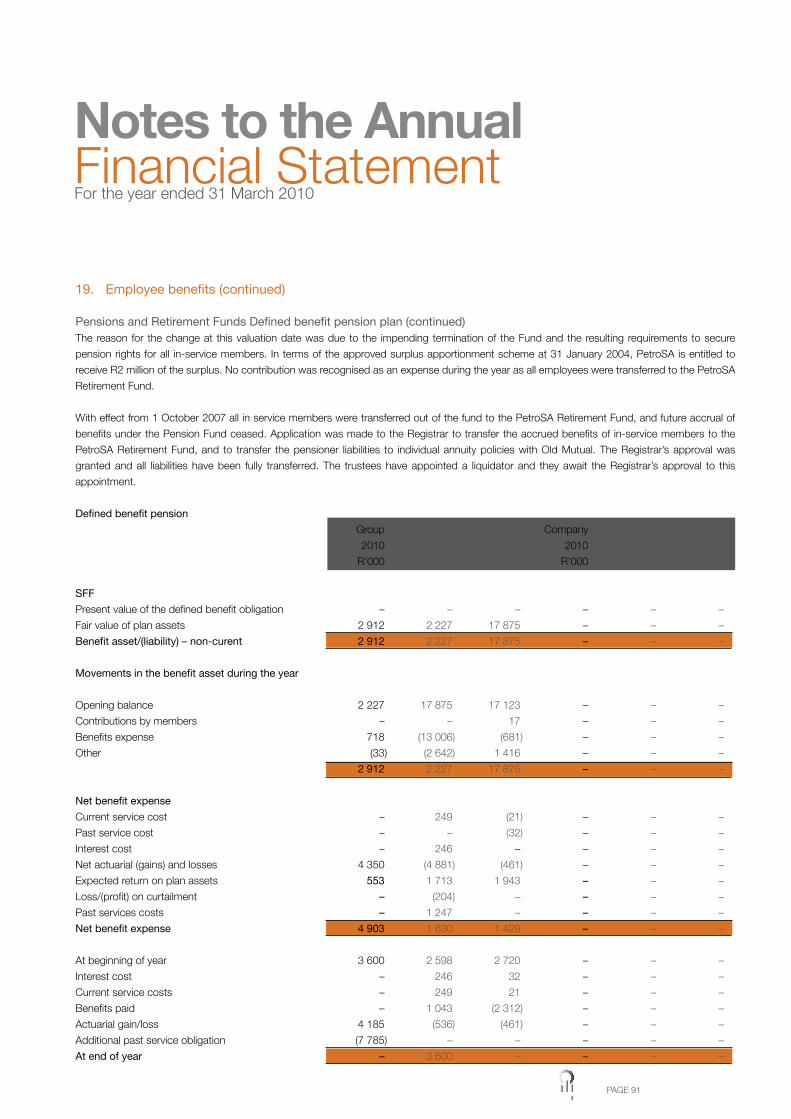
PAGE 91
19. Employee benefits (continued)
Pensions and Retirement Funds Defined benefit pension plan (continued)The reason for the change at this valuation date was due to the impending termination of the Fund and the resulting requirements to secure
pension rights for all in-service members. In terms of the approved surplus apportionment scheme at 31 January 2004, PetroSA is entitled to
receive R2 million of the surplus. No contribution was recognised as an expense during the year as all employees were transferred to the PetroSA
Retirement Fund.
With effect from 1 October 2007 all in service members were transferred out of the fund to the PetroSA Retirement Fund, and future accrual of
benefits under the Pension Fund ceased. Application was made to the Registrar to transfer the accrued benefits of in-service members to the
PetroSA Retirement Fund, and to transfer the pensioner liabilities to individual annuity policies with Old Mutual. The Registrar’s approval was
granted and all liabilities have been fully transferred. The trustees have appointed a liquidator and they await the Registrar’s approval to this
appointment.
Defined benefit pension
Group Group Group Company Company Company
2010 2009 2008 2010 2009 2008
R’000 R’000 R’000 R’000 R’000 R’000
SFF
Present value of the defined benefit obligation – – – – – –
Fair value of plan assets 2 912 2 227 17 875 – – –
Benefit asset/(liability) – non-curent 2 912 2 227 17 875 – – –
Movements in the benefit asset during the year
Opening balance 2 227 17 875 17 123 – – –
Contributions by members – – 17 – – –
Benefits expense 718 (13 006) (681) – – –
Other (33) (2 642) 1 416 – – –
2 912 2 227 17 875 – – –
Net benefit expense
Current service cost – 249 (21) – – –
Past service cost – – (32) – – –
Interest cost – 246 – – – –
Net actuarial (gains) and losses 4 350 (4 881) (461) – – –
Expected return on plan assets 553 1 713 1 943 – – –
Loss/(profit) on curtailment – (204) – – – –
Past services costs – 1 247 – – – –
Net benefit expense 4 903 1 630 1 429 – – –
At beginning of year 3 600 2 598 2 720 – – –
Interest cost – 246 32 – – –
Current service costs – 249 21 – – –
Benefits paid – 1 043 (2 312) – – –
Actuarial gain/loss 4 185 (536) (461) – – –
Additional past service obligation (7 785) – – – – –
At end of year – 3 600 – – – –
Notes to the AnnualFinancial StatementFor the year ended 31 March 2010
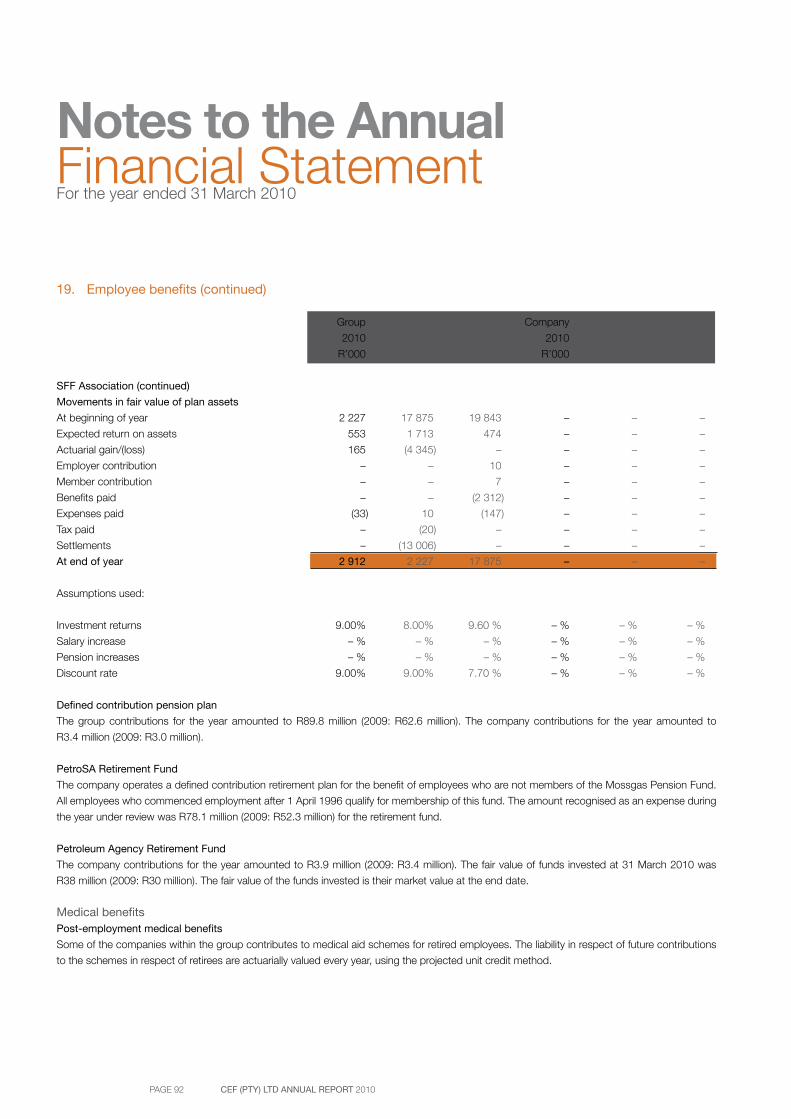
PAGE 92 CEF (PTY) LTD ANNUAL REPORT 2010
Notes to the AnnualFinancial StatementFor the year ended 31 March 2010
19. Employee benefits (continued)
Group Group Group Company Company Company
2010 2009 2008 2010 2009 2008
R’000 R’000 R’000 R’000 R’000 R’000
SFF Association (continued)
Movements in fair value of plan assets
At beginning of year 2 227 17 875 19 843 – – –
Expected return on assets 553 1 713 474 – – –
Actuarial gain/(loss) 165 (4 345) – – – –
Employer contribution – – 10 – – –
Member contribution – – 7 – – –
Benefits paid – – (2 312) – – –
Expenses paid (33) 10 (147) – – –
Tax paid – (20) – – – –
Settlements – (13 006) – – – –
At end of year 2 912 2 227 17 875 – – –
Assumptions used:
Investment returns 9.00% 8.00% 9.60 % – % – % – %
Salary increase – % – % – % – % – % – %
Pension increases – % – % – % – % – % – %
Discount rate 9.00% 9.00% 7.70 % – % – % – %
Defined contribution pension plan
The group contributions for the year amounted to R89.8 million (2009: R62.6 million). The company contributions for the year amounted to
R3.4 million (2009: R3.0 million).
PetroSA Retirement Fund
The company operates a defined contribution retirement plan for the benefit of employees who are not members of the Mossgas Pension Fund.
All employees who commenced employment after 1 April 1996 qualify for membership of this fund. The amount recognised as an expense during
the year under review was R78.1 million (2009: R52.3 million) for the retirement fund.
Petroleum Agency Retirement Fund
The company contributions for the year amounted to R3.9 million (2009: R3.4 million). The fair value of funds invested at 31 March 2010 was
R38 million (2009: R30 million). The fair value of the funds invested is their market value at the end date.
Medical benefitsPost-employment medical benefits
Some of the companies within the group contributes to medical aid schemes for retired employees. The liability in respect of future contributions
to the schemes in respect of retirees are actuarially valued every year, using the projected unit credit method.
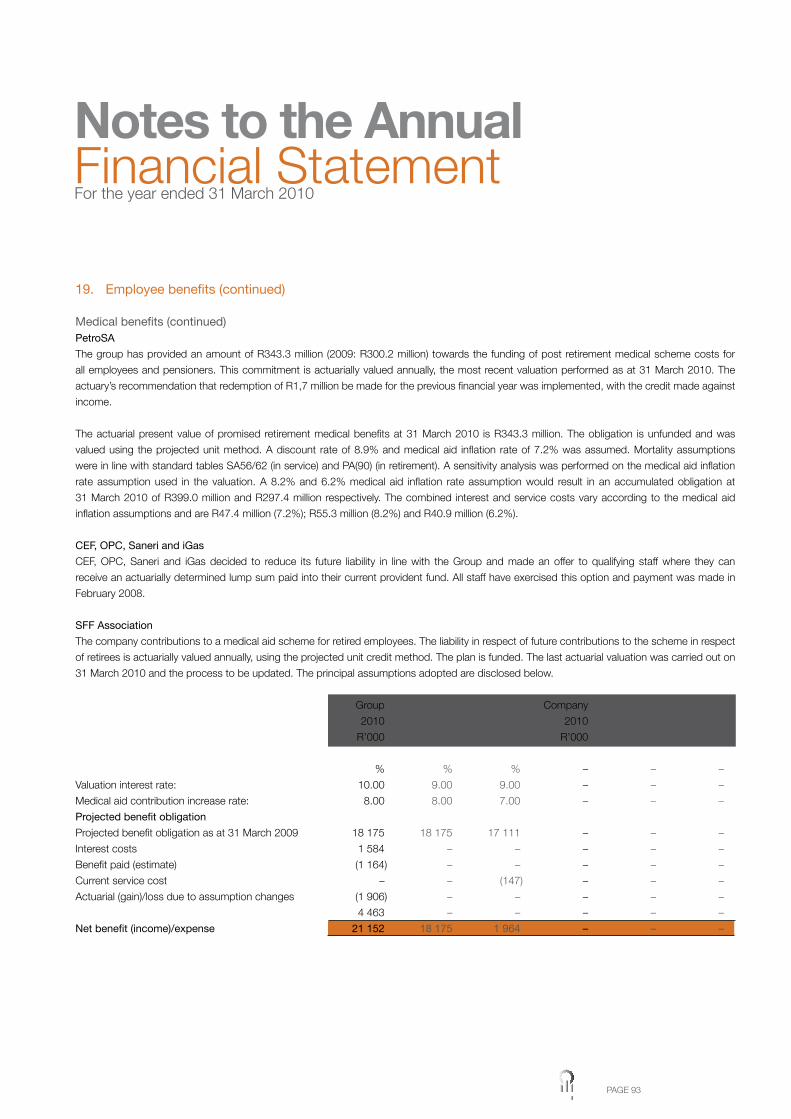
PAGE 93
19. Employee benefits (continued)
Medical benefits (continued)PetroSA
The group has provided an amount of R343.3 million (2009: R300.2 million) towards the funding of post retirement medical scheme costs for
all employees and pensioners. This commitment is actuarially valued annually, the most recent valuation performed as at 31 March 2010. The
actuary’s recommendation that redemption of R1,7 million be made for the previous financial year was implemented, with the credit made against
income.
The actuarial present value of promised retirement medical benefits at 31 March 2010 is R343.3 million. The obligation is unfunded and was
valued using the projected unit method. A discount rate of 8.9% and medical aid inflation rate of 7.2% was assumed. Mortality assumptions
were in line with standard tables SA56/62 (in service) and PA(90) (in retirement). A sensitivity analysis was performed on the medical aid inflation
rate assumption used in the valuation. A 8.2% and 6.2% medical aid inflation rate assumption would result in an accumulated obligation at
31 March 2010 of R399.0 million and R297.4 million respectively. The combined interest and service costs vary according to the medical aid
inflation assumptions and are R47.4 million (7.2%); R55.3 million (8.2%) and R40.9 million (6.2%).
CEF, OPC, Saneri and iGas
CEF, OPC, Saneri and iGas decided to reduce its future liability in line with the Group and made an offer to qualifying staff where they can
receive an actuarially determined lump sum paid into their current provident fund. All staff have exercised this option and payment was made in
February 2008.
SFF Association
The company contributions to a medical aid scheme for retired employees. The liability in respect of future contributions to the scheme in respect
of retirees is actuarially valued annually, using the projected unit credit method. The plan is funded. The last actuarial valuation was carried out on
31 March 2010 and the process to be updated. The principal assumptions adopted are disclosed below.
Group Group Group Company Company Company
2010 2009 2008 2010 2009 2008
R’000 R’000 R’000 R’000 R’000 R’000
% % % – – –
Valuation interest rate: 10.00 9.00 9.00 – – –
Medical aid contribution increase rate: 8.00 8.00 7.00 – – –
Projected benefit obligation
Projected benefit obligation as at 31 March 2009 18 175 18 175 17 111 – – –
Interest costs 1 584 – – – – –
Benefit paid (estimate) (1 164) – – – – –
Current service cost – – (147) – – –
Actuarial (gain)/loss due to assumption changes (1 906) – – – – –
4 463 – – – – –
Net benefit (income)/expense 21 152 18 175 1 964 – – –
Notes to the AnnualFinancial StatementFor the year ended 31 March 2010
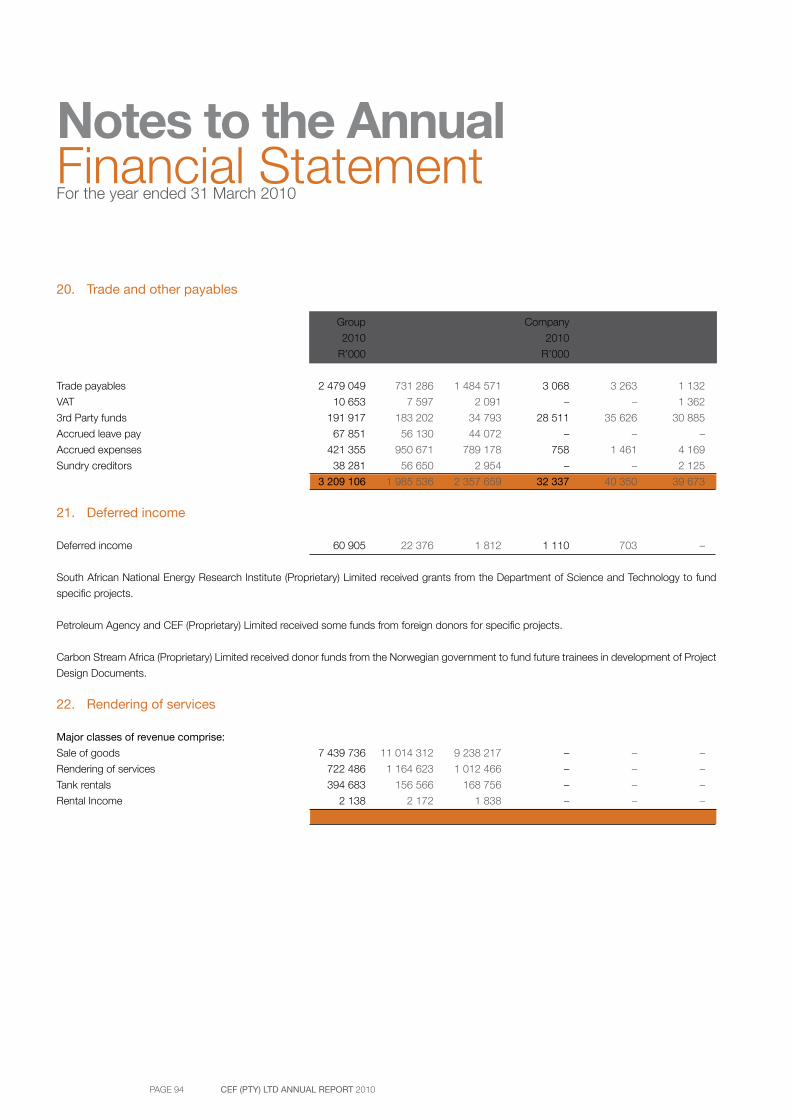
PAGE 94 CEF (PTY) LTD ANNUAL REPORT 2010
Notes to the AnnualFinancial StatementFor the year ended 31 March 2010
20. Trade and other payables
Group Group Group Company Company Company
2010 2009 2008 2010 2009 2008
R’000 R’000 R’000 R’000 R’000 R’000
Trade payables 2 479 049 731 286 1 484 571 3 068 3 263 1 132
VAT 10 653 7 597 2 091 – – 1 362
3rd Party funds 191 917 183 202 34 793 28 511 35 626 30 885
Accrued leave pay 67 851 56 130 44 072 – – –
Accrued expenses 421 355 950 671 789 178 758 1 461 4 169
Sundry creditors 38 281 56 650 2 954 – – 2 125
3 209 106 1 985 536 2 357 659 32 337 40 350 39 673
21. Deferred income
Deferred income 60 905 22 376 1 812 1 110 703 –
South African National Energy Research Institute (Proprietary) Limited received grants from the Department of Science and Technology to fund
specific projects.
Petroleum Agency and CEF (Proprietary) Limited received some funds from foreign donors for specific projects.
Carbon Stream Africa (Proprietary) Limited received donor funds from the Norwegian government to fund future trainees in development of Project
Design Documents.
22. Rendering of services
Major classes of revenue comprise:
Sale of goods 7 439 736 11 014 312 9 238 217 – – –
Rendering of services 722 486 1 164 623 1 012 466 – – –
Tank rentals 394 683 156 566 168 756 – – –
Rental Income 2 138 2 172 1 838 – – –
8 559 043 12 337 673 10 421 277 – – –
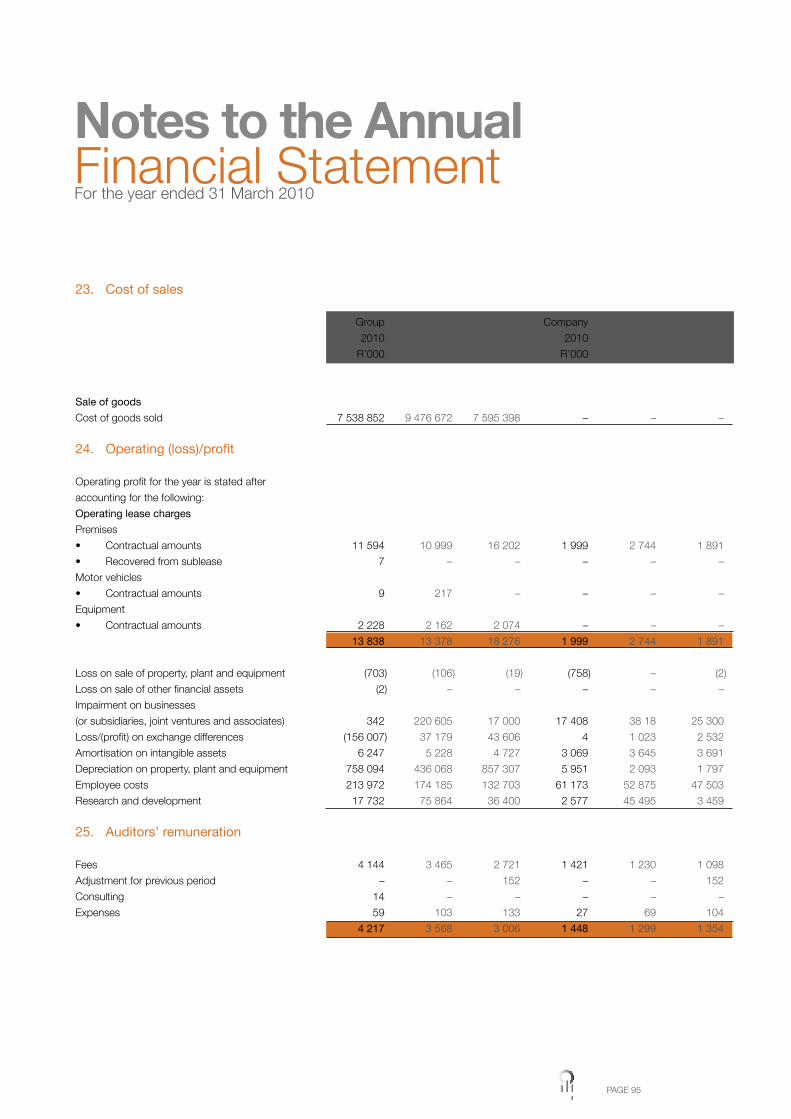
PAGE 95
23. Cost of sales
Group Group Group Company Company Company
2010 2009 2008 2010 2009 2008
R’000 R’000 R’000 R’000 R’000 R’000
Sale of goods
Cost of goods sold 7 538 852 9 476 672 7 595 398 – – –
24. Operating (loss)/profit
Operating profit for the year is stated after
accounting for the following:
Operating lease charges
Premises
• Contractual amounts 11 594 10 999 16 202 1 999 2 744 1 891
• Recovered from sublease 7 – – – – –
Motor vehicles
• Contractual amounts 9 217 – – – –
Equipment
• Contractual amounts 2 228 2 162 2 074 – – –
13 838 13 378 18 276 1 999 2 744 1 891
Loss on sale of property, plant and equipment (703) (106) (19) (758) – (2)
Loss on sale of other financial assets (2) – – – – –
Impairment on businesses
(or subsidiaries, joint ventures and associates) 342 220 605 17 000 17 408 38 18 25 300
Loss/(profit) on exchange differences (156 007) 37 179 43 606 4 1 023 2 532
Amortisation on intangible assets 6 247 5 228 4 727 3 069 3 645 3 691
Depreciation on property, plant and equipment 758 094 436 068 857 307 5 951 2 093 1 797
Employee costs 213 972 174 185 132 703 61 173 52 875 47 503
Research and development 17 732 75 864 36 400 2 577 45 495 3 459
25. Auditors’ remuneration
Fees 4 144 3 465 2 721 1 421 1 230 1 098
Adjustment for previous period – – 152 – – 152
Consulting 14 – – – – –
Expenses 59 103 133 27 69 104
4 217 3 568 3 006 1 448 1 299 1 354
Notes to the AnnualFinancial StatementFor the year ended 31 March 2010
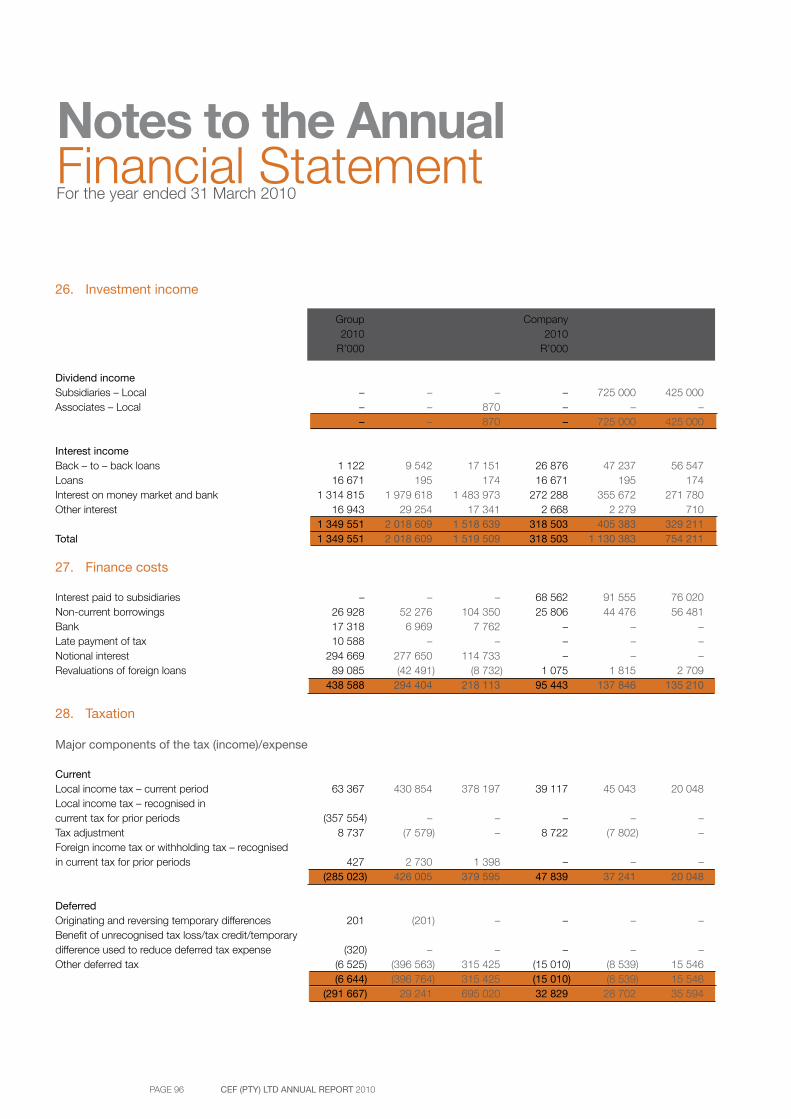
PAGE 96 CEF (PTY) LTD ANNUAL REPORT 2010
Notes to the AnnualFinancial StatementFor the year ended 31 March 2010
26. Investment income
Group Group Group Company Company Company 2010 2009 2008 2010 2009 2008 R’000 R’000 R’000 R’000 R’000 R’000
Dividend income Subsidiaries – Local – – – – 725 000 425 000Associates – Local – – 870 – – – – – 870 – 725 000 425 000
Interest income Back – to – back loans 1 122 9 542 17 151 26 876 47 237 56 547Loans 16 671 195 174 16 671 195 174Interest on money market and bank 1 314 815 1 979 618 1 483 973 272 288 355 672 271 780Other interest 16 943 29 254 17 341 2 668 2 279 710 1 349 551 2 018 609 1 518 639 318 503 405 383 329 211Total 1 349 551 2 018 609 1 519 509 318 503 1 130 383 754 211
27. Finance costs
Interest paid to subsidiaries – – – 68 562 91 555 76 020Non-current borrowings 26 928 52 276 104 350 25 806 44 476 56 481Bank 17 318 6 969 7 762 – – –Late payment of tax 10 588 – – – – –Notional interest 294 669 277 650 114 733 – – –Revaluations of foreign loans 89 085 (42 491) (8 732) 1 075 1 815 2 709 438 588 294 404 218 113 95 443 137 846 135 210
28. Taxation
Major components of the tax (income)/expense
Current Local income tax – current period 63 367 430 854 378 197 39 117 45 043 20 048Local income tax – recognised in current tax for prior periods (357 554) – – – – –Tax adjustment 8 737 (7 579) – 8 722 (7 802) –Foreign income tax or withholding tax – recognised in current tax for prior periods 427 2 730 1 398 – – – (285 023) 426 005 379 595 47 839 37 241 20 048
Deferred Originating and reversing temporary differences 201 (201) – – – –Benefit of unrecognised tax loss/tax credit/temporary difference used to reduce deferred tax expense (320) – – – – –Other deferred tax (6 525) (396 563) 315 425 (15 010) (8 539) 15 546 (6 644) (396 764) 315 425 (15 010) (8 539) 15 546 (291 667) 29 241 695 020 32 829 28 702 35 594
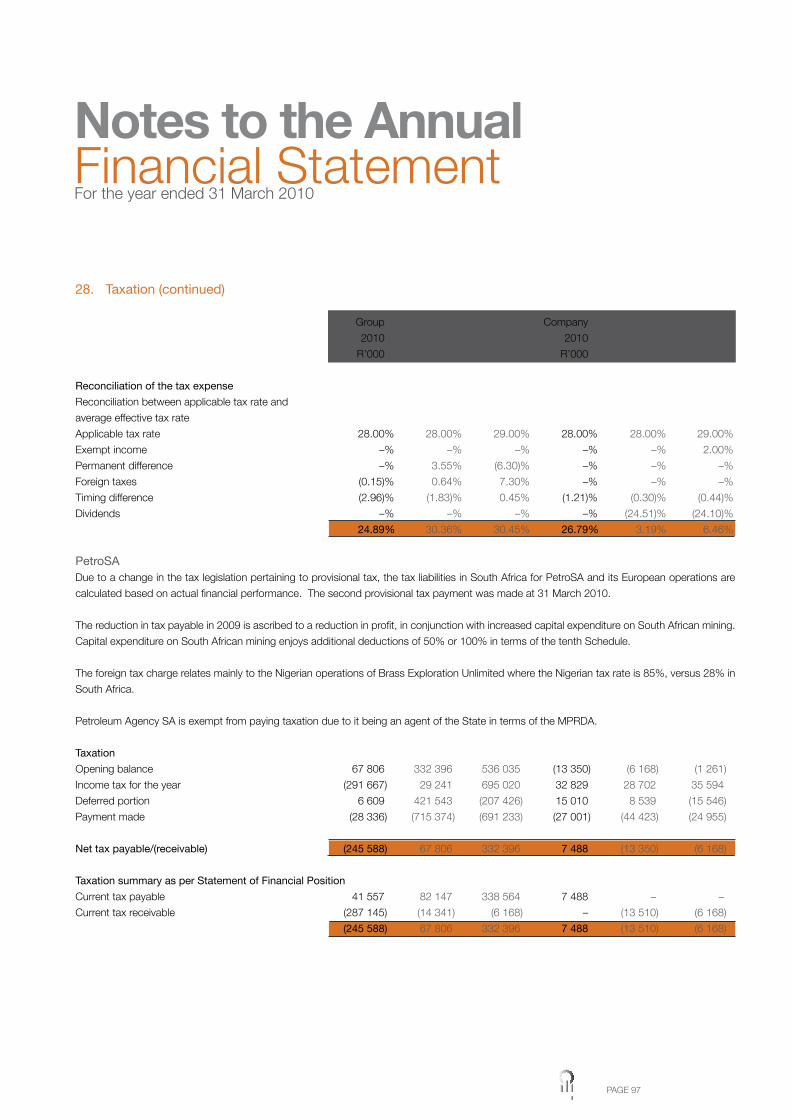
PAGE 97
28. Taxation (continued)
Group Group Group Company Company Company
2010 2009 2008 2010 2009 2008
R’000 R’000 R’000 R’000 R’000 R’000
Reconciliation of the tax expense
Reconciliation between applicable tax rate and
average effective tax rate
Applicable tax rate 28.00% 28.00% 29.00% 28.00% 28.00% 29.00%
Exempt income –% –% –% –% –% 2.00%
Permanent difference –% 3.55% (6.30)% –% –% –%
Foreign taxes (0.15)% 0.64% 7.30% –% –% –%
Timing difference (2.96)% (1.83)% 0.45% (1.21)% (0.30)% (0.44)%
Dividends –% –% –% –% (24.51)% (24.10)%
24.89% 30.36% 30.45% 26.79% 3.19% 6.46%
PetroSADue to a change in the tax legislation pertaining to provisional tax, the tax liabilities in South Africa for PetroSA and its European operations are
calculated based on actual financial performance. The second provisional tax payment was made at 31 March 2010.
The reduction in tax payable in 2009 is ascribed to a reduction in profit, in conjunction with increased capital expenditure on South African mining.
Capital expenditure on South African mining enjoys additional deductions of 50% or 100% in terms of the tenth Schedule.
The foreign tax charge relates mainly to the Nigerian operations of Brass Exploration Unlimited where the Nigerian tax rate is 85%, versus 28% in
South Africa.
Petroleum Agency SA is exempt from paying taxation due to it being an agent of the State in terms of the MPRDA.
Taxation
Opening balance 67 806 332 396 536 035 (13 350) (6 168) (1 261)
Income tax for the year (291 667) 29 241 695 020 32 829 28 702 35 594
Deferred portion 6 609 421 543 (207 426) 15 010 8 539 (15 546)
Payment made (28 336) (715 374) (691 233) (27 001) (44 423) (24 955)
Net tax payable/(receivable) (245 588) 67 806 332 396 7 488 (13 350) (6 168)
Taxation summary as per Statement of Financial Position
Current tax payable 41 557 82 147 338 564 7 488 – –
Current tax receivable (287 145) (14 341) (6 168) – (13 510) (6 168)
(245 588) 67 806 332 396 7 488 (13 510) (6 168)
Notes to the AnnualFinancial StatementFor the year ended 31 March 2010
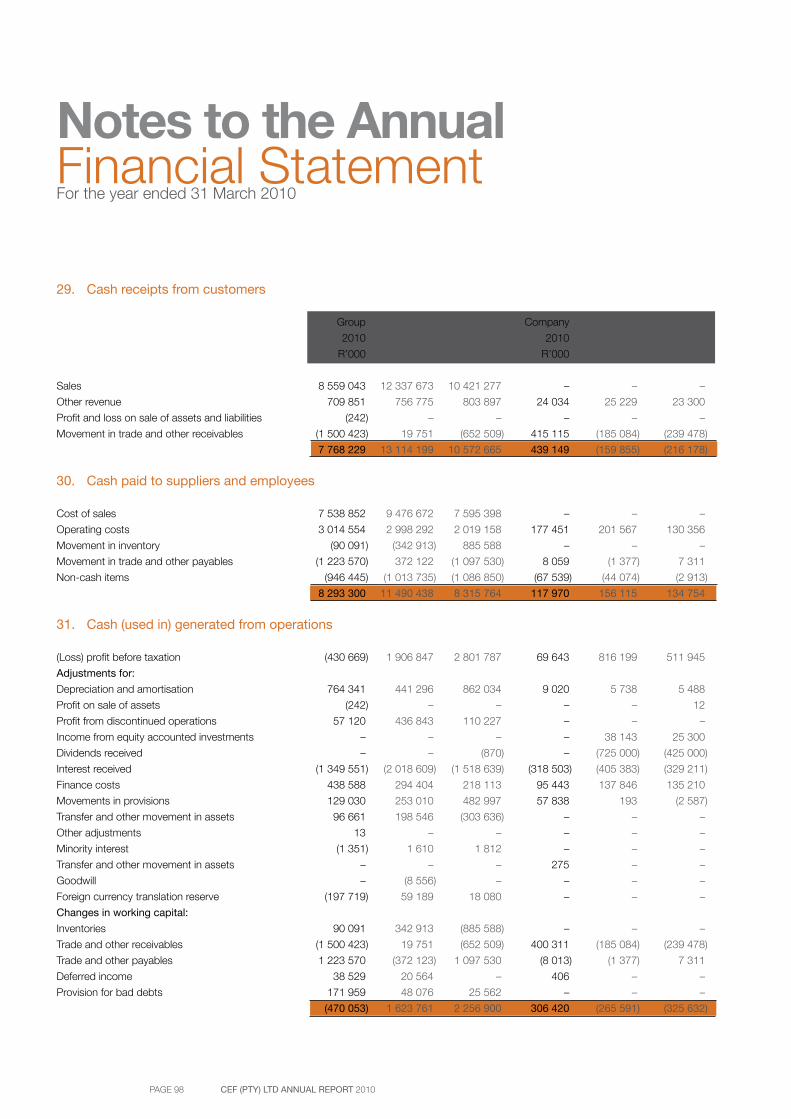
PAGE 98 CEF (PTY) LTD ANNUAL REPORT 2010
Notes to the AnnualFinancial StatementFor the year ended 31 March 2010
29. Cash receipts from customers
Group Group Group Company Company Company
2010 2009 2008 2010 2009 2008
R’000 R’000 R’000 R’000 R’000 R’000
Sales 8 559 043 12 337 673 10 421 277 – – –
Other revenue 709 851 756 775 803 897 24 034 25 229 23 300
Profit and loss on sale of assets and liabilities (242) – – – – –
Movement in trade and other receivables (1 500 423) 19 751 (652 509) 415 115 (185 084) (239 478)
7 768 229 13 114 199 10 572 665 439 149 (159 855) (216 178)
30. Cash paid to suppliers and employees
Cost of sales 7 538 852 9 476 672 7 595 398 – – –
Operating costs 3 014 554 2 998 292 2 019 158 177 451 201 567 130 356
Movement in inventory (90 091) (342 913) 885 588 – – –
Movement in trade and other payables (1 223 570) 372 122 (1 097 530) 8 059 (1 377) 7 311
Non-cash items (946 445) (1 013 735) (1 086 850) (67 539) (44 074) (2 913)
8 293 300 11 490 438 8 315 764 117 970 156 115 134 754
31. Cash (used in) generated from operations
(Loss) profit before taxation (430 669) 1 906 847 2 801 787 69 643 816 199 511 945
Adjustments for:
Depreciation and amortisation 764 341 441 296 862 034 9 020 5 738 5 488
Profit on sale of assets (242) – – – – 12
Profit from discontinued operations 57 120 436 843 110 227 – – –
Income from equity accounted investments – – – – 38 143 25 300
Dividends received – – (870) – (725 000) (425 000)
Interest received (1 349 551) (2 018 609) (1 518 639) (318 503) (405 383) (329 211)
Finance costs 438 588 294 404 218 113 95 443 137 846 135 210
Movements in provisions 129 030 253 010 482 997 57 838 193 (2 587)
Transfer and other movement in assets 96 661 198 546 (303 636) – – –
Other adjustments 13 – – – – –
Minority interest (1 351) 1 610 1 812 – – –
Transfer and other movement in assets – – – 275 – –
Goodwill – (8 556) – – – –
Foreign currency translation reserve (197 719) 59 189 18 080 – – –
Changes in working capital:
Inventories 90 091 342 913 (885 588) – – –
Trade and other receivables (1 500 423) 19 751 (652 509) 400 311 (185 084) (239 478)
Trade and other payables 1 223 570 (372 123) 1 097 530 (8 013) (1 377) 7 311
Deferred income 38 529 20 564 – 406 – –
Provision for bad debts 171 959 48 076 25 562 – – –
(470 053) 1 623 761 2 256 900 306 420 (265 591) (325 632)

PAGE 99
32. Increase in investment in subsidiaries and associates
Group Group Group Company Company Company
2010 2009 2008 2010 2009 2008
R’000 R’000 R’000 R’000 R’000 R’000
DWP
Provision against investment 17 000 17 000 17 000 17 000 17 000 17 000
Provision against loan (17 000) (17 000) (17 000) (17 000) (17 000) (17 000)
– – – – – –
OPCSA
Provision against investment – – – (12 594) (9 276) 6 166
African Exploration
Provision against investment – – – 26 625 35 681 2 134
Cotec Patrade (Pty) Ltd
Provision against investment – – – (13) – –
ETA Energy (Pty) Ltd
Provision against investment – – – 3 389 11 775 –
Net movement on investment in
subsidiaries and associates – – – 17 407 38 180 8 300
Opening carrying amount of loans
to group companies:
SANERI – – – (30 040) (21 561) (55 429)
Petroleum Agency SA – – – (273 981) (189 565) (174 775)
SFF – – – 8 11 –
PetroSA – – – (513 854) (432 029) (361 527)
iGas – – – 610 569 637 460 682 309
CCE – – – 14 183 – –
ETA – – – 11 775 – –
Carbon Stream – – – (1 317) – –
– – – (182 657) (5 684) 90 578
Notes to the AnnualFinancial StatementFor the year ended 31 March 2010
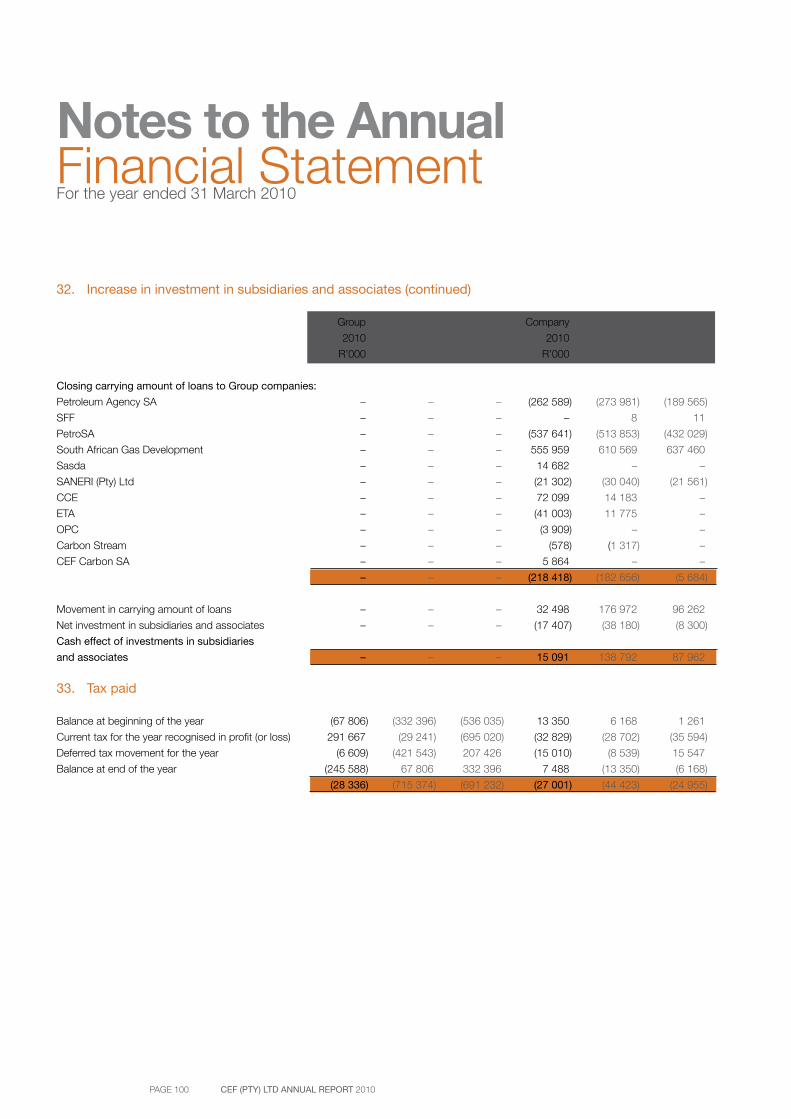
PAGE 100 CEF (PTY) LTD ANNUAL REPORT 2010
Notes to the AnnualFinancial StatementFor the year ended 31 March 2010
32. Increase in investment in subsidiaries and associates (continued)
Group Group Group Company Company Company
2010 2009 2008 2010 2009 2008
R’000 R’000 R’000 R’000 R’000 R’000
Closing carrying amount of loans to Group companies:
Petroleum Agency SA – – – (262 589) (273 981) (189 565)
SFF – – – – 8 11
PetroSA – – – (537 641) (513 853) (432 029)
South African Gas Development – – – 555 959 610 569 637 460
Sasda – – – 14 682 – –
SANERI (Pty) Ltd – – – (21 302) (30 040) (21 561)
CCE – – – 72 099 14 183 –
ETA – – – (41 003) 11 775 –
OPC – – – (3 909) – –
Carbon Stream – – – (578) (1 317) –
CEF Carbon SA – – – 5 864 – –
– – – (218 418) (182 656) (5 684)
Movement in carrying amount of loans – – – 32 498 176 972 96 262
Net investment in subsidiaries and associates – – – (17 407) (38 180) (8 300)
Cash effect of investments in subsidiaries
and associates – – – 15 091 138 792 87 962
33. Tax paid
Balance at beginning of the year (67 806) (332 396) (536 035) 13 350 6 168 1 261
Current tax for the year recognised in profit (or loss) 291 667 (29 241) (695 020) (32 829) (28 702) (35 594)
Deferred tax movement for the year (6 609) (421 543) 207 426 (15 010) (8 539) 15 547
Balance at end of the year (245 588) 67 806 332 396 7 488 (13 350) (6 168)
(28 336) (715 374) (691 232) (27 001) (44 423) (24 955)
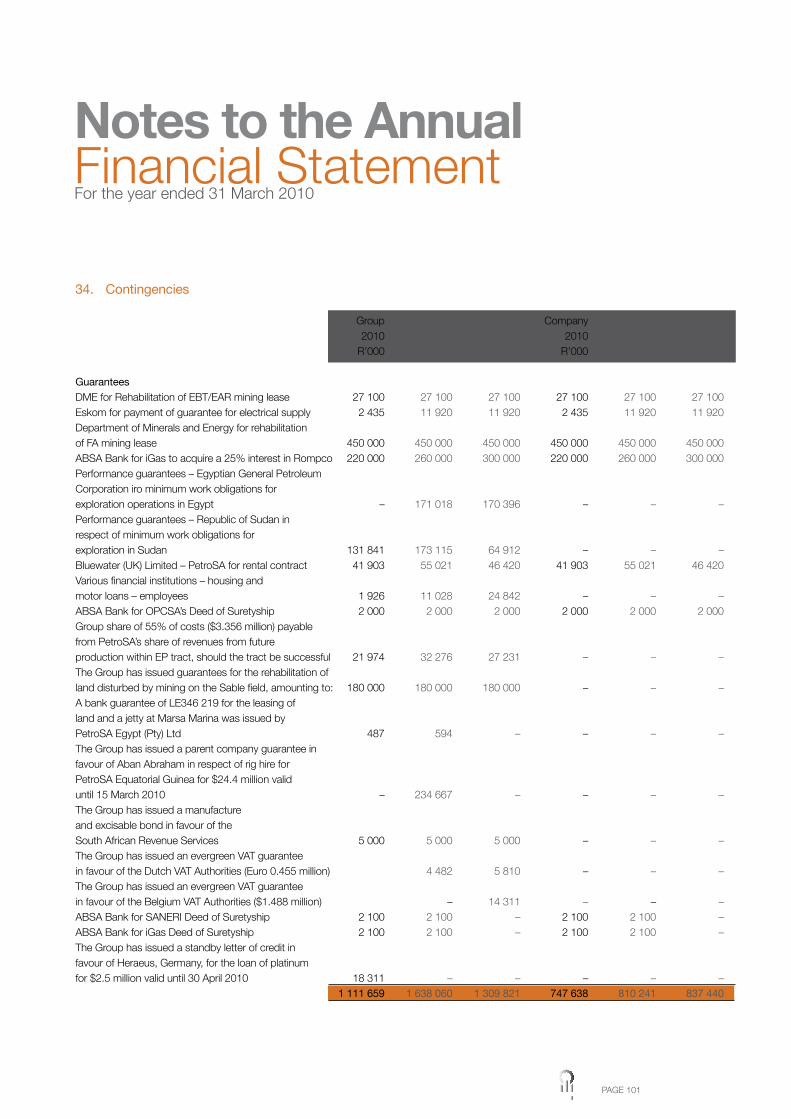
PAGE 101
34. Contingencies
Group Group Group Company Company Company 2010 2009 2008 2010 2009 2008 R’000 R’000 R’000 R’000 R’000 R’000
Guarantees DME for Rehabilitation of EBT/EAR mining lease 27 100 27 100 27 100 27 100 27 100 27 100Eskom for payment of guarantee for electrical supply 2 435 11 920 11 920 2 435 11 920 11 920Department of Minerals and Energy for rehabilitation of FA mining lease 450 000 450 000 450 000 450 000 450 000 450 000ABSA Bank for iGas to acquire a 25% interest in Rompco 220 000 260 000 300 000 220 000 260 000 300 000Performance guarantees – Egyptian General Petroleum Corporation iro minimum work obligations for exploration operations in Egypt – 171 018 170 396 – – –Performance guarantees – Republic of Sudan in respect of minimum work obligations for exploration in Sudan 131 841 173 115 64 912 – – –Bluewater (UK) Limited – PetroSA for rental contract 41 903 55 021 46 420 41 903 55 021 46 420Various financial institutions – housing and motor loans – employees 1 926 11 028 24 842 – – –ABSA Bank for OPCSA’s Deed of Suretyship 2 000 2 000 2 000 2 000 2 000 2 000Group share of 55% of costs ($3.356 million) payable from PetroSA’s share of revenues from future production within EP tract, should the tract be successful 21 974 32 276 27 231 – – –The Group has issued guarantees for the rehabilitation of land disturbed by mining on the Sable field, amounting to: 180 000 180 000 180 000 – – –A bank guarantee of LE346 219 for the leasing of land and a jetty at Marsa Marina was issued by PetroSA Egypt (Pty) Ltd 487 594 – – – –The Group has issued a parent company guarantee in favour of Aban Abraham in respect of rig hire for PetroSA Equatorial Guinea for $24.4 million valid until 15 March 2010 – 234 667 – – – –The Group has issued a manufactureand excisable bond in favour of theSouth African Revenue Services 5 000 5 000 5 000 – – –The Group has issued an evergreen VAT guarantee in favour of the Dutch VAT Authorities (Euro 0.455 million) 4 482 5 810 – – –The Group has issued an evergreen VAT guarantee in favour of the Belgium VAT Authorities ($1.488 million) – 14 311 – – –ABSA Bank for SANERI Deed of Suretyship 2 100 2 100 – 2 100 2 100 –ABSA Bank for iGas Deed of Suretyship 2 100 2 100 – 2 100 2 100 –The Group has issued a standby letter of credit in favour of Heraeus, Germany, for the loan of platinum for $2.5 million valid until 30 April 2010 18 311 – – – – – 1 111 659 1 638 060 1 309 821 747 638 810 241 837 440
Notes to the AnnualFinancial StatementFor the year ended 31 March 2010
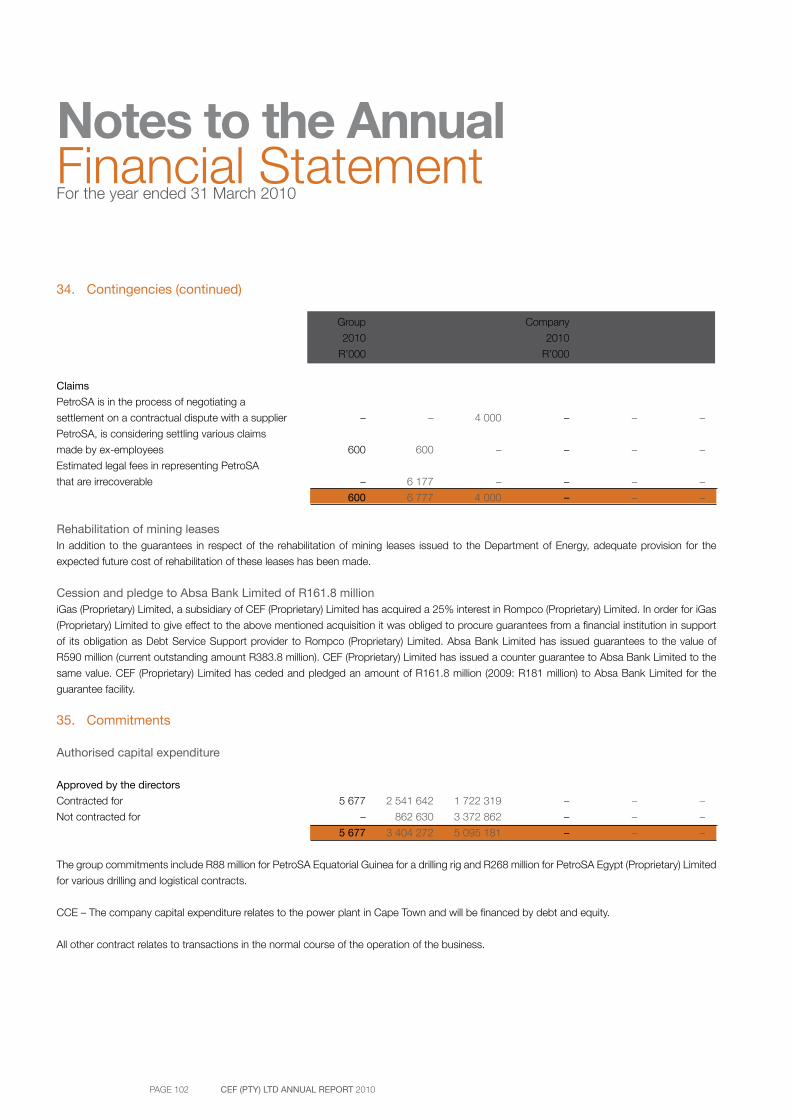
PAGE 102 CEF (PTY) LTD ANNUAL REPORT 2010
Notes to the AnnualFinancial StatementFor the year ended 31 March 2010
34. Contingencies (continued)
Group Group Group Company Company Company
2010 2009 2008 2010 2009 2008
R’000 R’000 R’000 R’000 R’000 R’000
Claims
PetroSA is in the process of negotiating a
settlement on a contractual dispute with a supplier – – 4 000 – – –
PetroSA, is considering settling various claims
made by ex-employees 600 600 – – – –
Estimated legal fees in representing PetroSA
that are irrecoverable – 6 177 – – – –
600 6 777 4 000 – – –
Rehabilitation of mining leasesIn addition to the guarantees in respect of the rehabilitation of mining leases issued to the Department of Energy, adequate provision for the
expected future cost of rehabilitation of these leases has been made.
Cession and pledge to Absa Bank Limited of R161.8 millioniGas (Proprietary) Limited, a subsidiary of CEF (Proprietary) Limited has acquired a 25% interest in Rompco (Proprietary) Limited. In order for iGas
(Proprietary) Limited to give effect to the above mentioned acquisition it was obliged to procure guarantees from a financial institution in support
of its obligation as Debt Service Support provider to Rompco (Proprietary) Limited. Absa Bank Limited has issued guarantees to the value of
R590 million (current outstanding amount R383.8 million). CEF (Proprietary) Limited has issued a counter guarantee to Absa Bank Limited to the
same value. CEF (Proprietary) Limited has ceded and pledged an amount of R161.8 million (2009: R181 million) to Absa Bank Limited for the
guarantee facility.
35. Commitments
Authorised capital expenditure
Approved by the directors
Contracted for 5 677 2 541 642 1 722 319 – – –
Not contracted for – 862 630 3 372 862 – – –
5 677 3 404 272 5 095 181 – – –
The group commitments include R88 million for PetroSA Equatorial Guinea for a drilling rig and R268 million for PetroSA Egypt (Proprietary) Limited
for various drilling and logistical contracts.
CCE – The company capital expenditure relates to the power plant in Cape Town and will be financed by debt and equity.
All other contract relates to transactions in the normal course of the operation of the business.
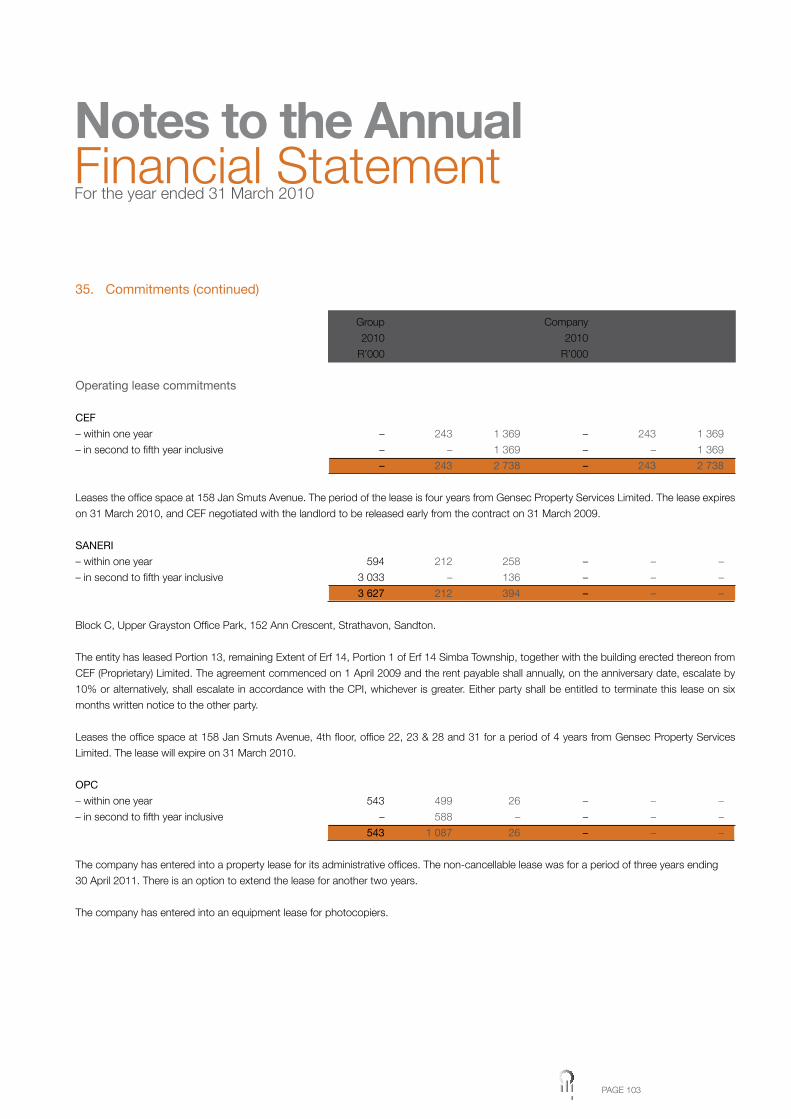
PAGE 103
35. Commitments (continued)
Group Group Group Company Company Company
2010 2009 2008 2010 2009 2008
R’000 R’000 R’000 R’000 R’000 R’000
Operating lease commitments
CEF
– within one year – 243 1 369 – 243 1 369
– in second to fifth year inclusive – – 1 369 – – 1 369
– 243 2 738 – 243 2 738
Leases the office space at 158 Jan Smuts Avenue. The period of the lease is four years from Gensec Property Services Limited. The lease expires
on 31 March 2010, and CEF negotiated with the landlord to be released early from the contract on 31 March 2009.
SANERI
– within one year 594 212 258 – – –
– in second to fifth year inclusive 3 033 – 136 – – –
3 627 212 394 – – –
Block C, Upper Grayston Office Park, 152 Ann Crescent, Strathavon, Sandton.
The entity has leased Portion 13, remaining Extent of Erf 14, Portion 1 of Erf 14 Simba Township, together with the building erected thereon from
CEF (Proprietary) Limited. The agreement commenced on 1 April 2009 and the rent payable shall annually, on the anniversary date, escalate by
10% or alternatively, shall escalate in accordance with the CPI, whichever is greater. Either party shall be entitled to terminate this lease on six
months written notice to the other party.
Leases the office space at 158 Jan Smuts Avenue, 4th floor, office 22, 23 & 28 and 31 for a period of 4 years from Gensec Property Services
Limited. The lease will expire on 31 March 2010.
OPC
– within one year 543 499 26 – – –
– in second to fifth year inclusive – 588 – – – –
543 1 087 26 – – –
The company has entered into a property lease for its administrative offices. The non-cancellable lease was for a period of three years ending
30 April 2011. There is an option to extend the lease for another two years.
The company has entered into an equipment lease for photocopiers.
Notes to the AnnualFinancial StatementFor the year ended 31 March 2010
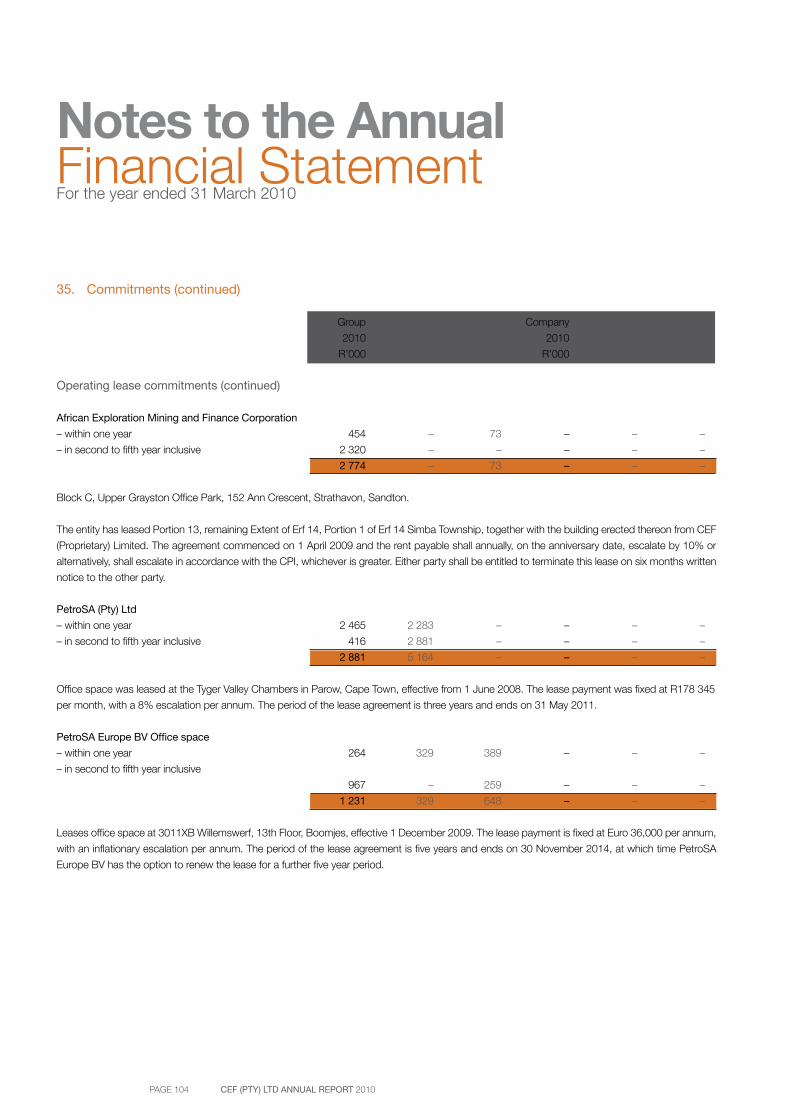
PAGE 104 CEF (PTY) LTD ANNUAL REPORT 2010
Notes to the AnnualFinancial StatementFor the year ended 31 March 2010
35. Commitments (continued)
Group Group Group Company Company Company
2010 2009 2008 2010 2009 2008
R’000 R’000 R’000 R’000 R’000 R’000
Operating lease commitments (continued)
African Exploration Mining and Finance Corporation
– within one year 454 – 73 – – –
– in second to fifth year inclusive 2 320 – – – – –
2 774 – 73 – – –
Block C, Upper Grayston Office Park, 152 Ann Crescent, Strathavon, Sandton.
The entity has leased Portion 13, remaining Extent of Erf 14, Portion 1 of Erf 14 Simba Township, together with the building erected thereon from CEF
(Proprietary) Limited. The agreement commenced on 1 April 2009 and the rent payable shall annually, on the anniversary date, escalate by 10% or
alternatively, shall escalate in accordance with the CPI, whichever is greater. Either party shall be entitled to terminate this lease on six months written
notice to the other party.
PetroSA (Pty) Ltd
– within one year 2 465 2 283 – – – –
– in second to fifth year inclusive 416 2 881 – – – –
2 881 5 164 – – – –
Office space was leased at the Tyger Valley Chambers in Parow, Cape Town, effective from 1 June 2008. The lease payment was fixed at R178 345
per month, with a 8% escalation per annum. The period of the lease agreement is three years and ends on 31 May 2011.
PetroSA Europe BV Office space
– within one year 264 329 389 – – –
– in second to fifth year inclusive
967 – 259 – – –
1 231 329 648 – – –
Leases office space at 3011XB Willemswerf, 13th Floor, Boomjes, effective 1 December 2009. The lease payment is fixed at Euro 36,000 per annum,
with an inflationary escalation per annum. The period of the lease agreement is five years and ends on 30 November 2014, at which time PetroSA
Europe BV has the option to renew the lease for a further five year period.

PAGE 105
35. Commitments (continued)
Group Group Group Company Company Company
2010 2009 2008 2010 2009 2008
R’000 R’000 R’000 R’000 R’000 R’000
Operating lease commitments (continued)
PetroSA Europe BV – motor vehicles
– within one year 242 425 335 – – –
– in second to fifth year inclusive 403 136 108 – – –
645 561 443 – – –
Leases motor vehicles on behalf of its employees. The standard contract period is 48 months. The effective start date was October 2006 and ends
November 2013.
PetroSA Europe BV – apartments
– within one year 727 129 101 – – –
– in second to fifth year inclusive 622 – – – – –
1 349 129 101 – – –
Leases apartments for its employees. The effective starting dates were 1 October and 1 August for a period of two years and ended 30 April 2012
and 31 October 2011. The rental is now on a month to month basis with a notice period of one month. The annual rental will be adjusted in line with
CPI all household series.
Equatorial Guinea
– within one year 614 776 941 – – –
– in second to fifth year inclusive – – 784 – – –
614 776 1 725 – – –
Leases office space in Malaba for a one year period, effective from 1 February 2008 to 31 January 2011. The lease payments are CFA 4 000 000
per month, and is paid in advance for a year.
Equatorial Guinea
– within one year 388 1 567 2 050 – – –
– in second to fifth year inclusive – 314 2 722 – – –
388 1 881 4 772 – – –
Leases staff accommodation for its employee, effective until 14 May 2010 and 31 August 2010, payable monthly in advance.
Notes to the AnnualFinancial StatementFor the year ended 31 March 2010
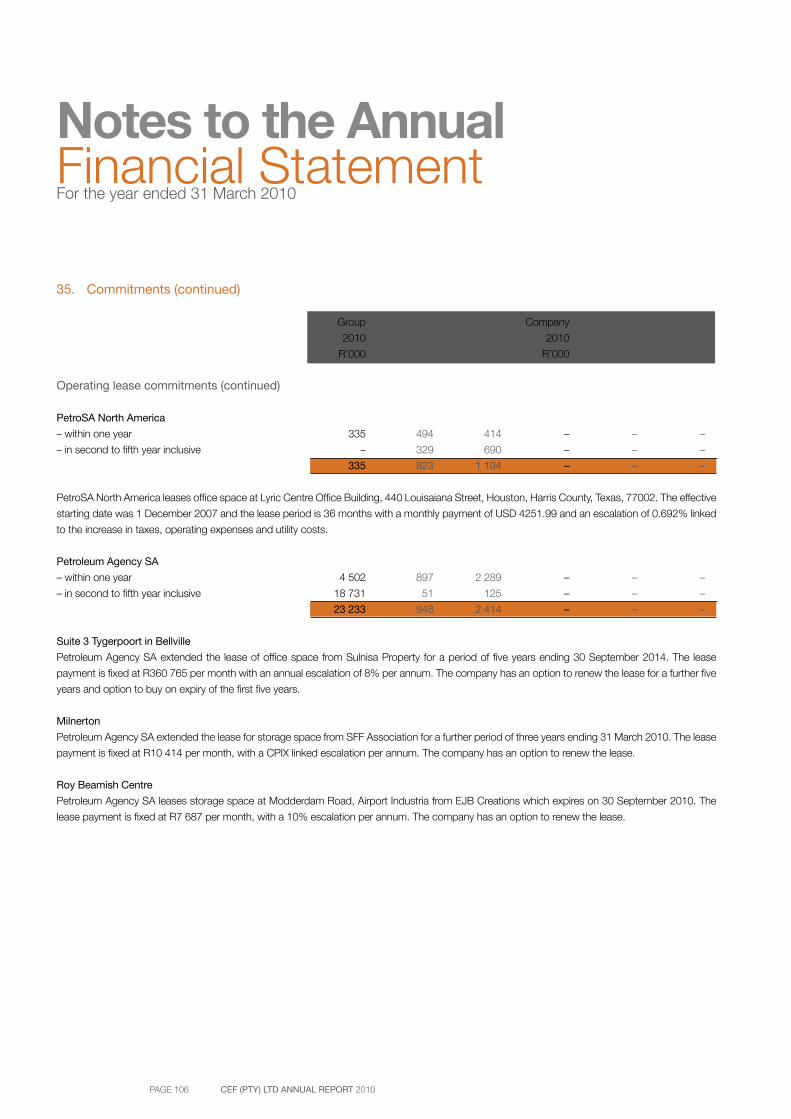
PAGE 106 CEF (PTY) LTD ANNUAL REPORT 2010
Notes to the AnnualFinancial StatementFor the year ended 31 March 2010
35. Commitments (continued)
Group Group Group Company Company Company
2010 2009 2008 2010 2009 2008
R’000 R’000 R’000 R’000 R’000 R’000
Operating lease commitments (continued)
PetroSA North America
– within one year 335 494 414 – – –
– in second to fifth year inclusive – 329 690 – – –
335 823 1 104 – – –
PetroSA North America leases office space at Lyric Centre Office Building, 440 Louisaiana Street, Houston, Harris County, Texas, 77002. The effective
starting date was 1 December 2007 and the lease period is 36 months with a monthly payment of USD 4251.99 and an escalation of 0.692% linked
to the increase in taxes, operating expenses and utility costs.
Petroleum Agency SA
– within one year 4 502 897 2 289 – – –
– in second to fifth year inclusive 18 731 51 125 – – –
23 233 948 2 414 – – –
Suite 3 Tygerpoort in Bellville
Petroleum Agency SA extended the lease of office space from Sulnisa Property for a period of five years ending 30 September 2014. The lease
payment is fixed at R360 765 per month with an annual escalation of 8% per annum. The company has an option to renew the lease for a further five
years and option to buy on expiry of the first five years.
Milnerton
Petroleum Agency SA extended the lease for storage space from SFF Association for a further period of three years ending 31 March 2010. The lease
payment is fixed at R10 414 per month, with a CPIX linked escalation per annum. The company has an option to renew the lease.
Roy Beamish Centre
Petroleum Agency SA leases storage space at Modderdam Road, Airport Industria from EJB Creations which expires on 30 September 2010. The
lease payment is fixed at R7 687 per month, with a 10% escalation per annum. The company has an option to renew the lease.
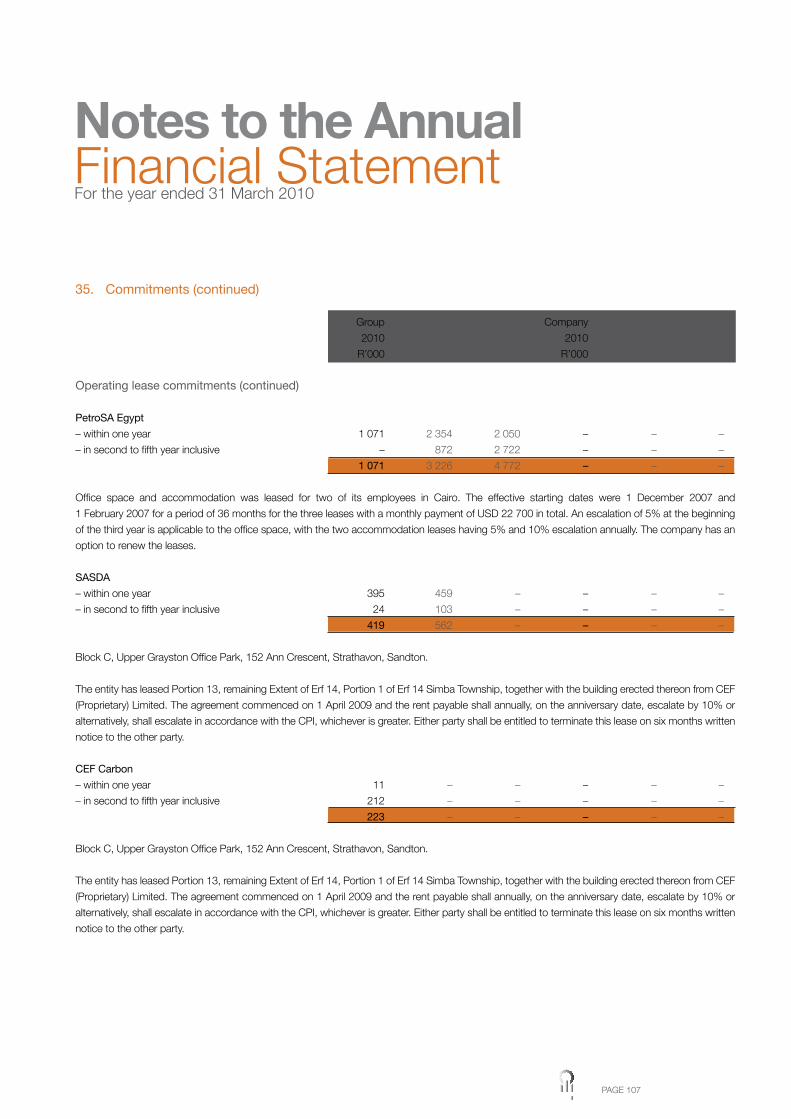
PAGE 107
35. Commitments (continued)
Group Group Group Company Company Company
2010 2009 2008 2010 2009 2008
R’000 R’000 R’000 R’000 R’000 R’000
Operating lease commitments (continued)
PetroSA Egypt
– within one year 1 071 2 354 2 050 – – –
– in second to fifth year inclusive – 872 2 722 – – –
1 071 3 226 4 772 – – –
Office space and accommodation was leased for two of its employees in Cairo. The effective starting dates were 1 December 2007 and
1 February 2007 for a period of 36 months for the three leases with a monthly payment of USD 22 700 in total. An escalation of 5% at the beginning
of the third year is applicable to the office space, with the two accommodation leases having 5% and 10% escalation annually. The company has an
option to renew the leases.
SASDA
– within one year 395 459 – – – –
– in second to fifth year inclusive 24 103 – – – –
419 562 – – – –
Block C, Upper Grayston Office Park, 152 Ann Crescent, Strathavon, Sandton.
The entity has leased Portion 13, remaining Extent of Erf 14, Portion 1 of Erf 14 Simba Township, together with the building erected thereon from CEF
(Proprietary) Limited. The agreement commenced on 1 April 2009 and the rent payable shall annually, on the anniversary date, escalate by 10% or
alternatively, shall escalate in accordance with the CPI, whichever is greater. Either party shall be entitled to terminate this lease on six months written
notice to the other party.
CEF Carbon
– within one year 11 – – – – –
– in second to fifth year inclusive 212 – – – – –
223 – – – – –
Block C, Upper Grayston Office Park, 152 Ann Crescent, Strathavon, Sandton.
The entity has leased Portion 13, remaining Extent of Erf 14, Portion 1 of Erf 14 Simba Township, together with the building erected thereon from CEF
(Proprietary) Limited. The agreement commenced on 1 April 2009 and the rent payable shall annually, on the anniversary date, escalate by 10% or
alternatively, shall escalate in accordance with the CPI, whichever is greater. Either party shall be entitled to terminate this lease on six months written
notice to the other party.
Notes to the AnnualFinancial StatementFor the year ended 31 March 2010
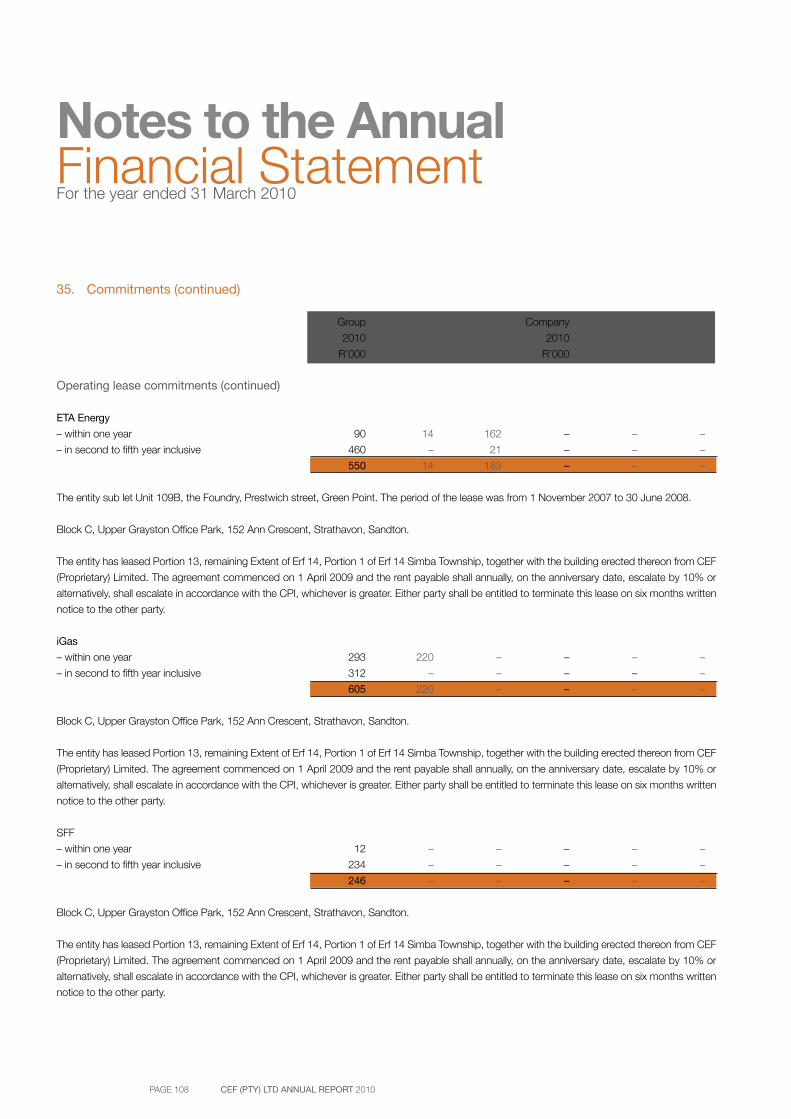
PAGE 108 CEF (PTY) LTD ANNUAL REPORT 2010
Notes to the AnnualFinancial StatementFor the year ended 31 March 2010
35. Commitments (continued)
Group Group Group Company Company Company
2010 2009 2008 2010 2009 2008
R’000 R’000 R’000 R’000 R’000 R’000
Operating lease commitments (continued)
ETA Energy
– within one year 90 14 162 – – –
– in second to fifth year inclusive 460 – 21 – – –
550 14 183 – – –
The entity sub let Unit 109B, the Foundry, Prestwich street, Green Point. The period of the lease was from 1 November 2007 to 30 June 2008.
Block C, Upper Grayston Office Park, 152 Ann Crescent, Strathavon, Sandton.
The entity has leased Portion 13, remaining Extent of Erf 14, Portion 1 of Erf 14 Simba Township, together with the building erected thereon from CEF
(Proprietary) Limited. The agreement commenced on 1 April 2009 and the rent payable shall annually, on the anniversary date, escalate by 10% or
alternatively, shall escalate in accordance with the CPI, whichever is greater. Either party shall be entitled to terminate this lease on six months written
notice to the other party.
iGas
– within one year 293 220 – – – –
– in second to fifth year inclusive 312 – – – – –
605 220 – – – –
Block C, Upper Grayston Office Park, 152 Ann Crescent, Strathavon, Sandton.
The entity has leased Portion 13, remaining Extent of Erf 14, Portion 1 of Erf 14 Simba Township, together with the building erected thereon from CEF
(Proprietary) Limited. The agreement commenced on 1 April 2009 and the rent payable shall annually, on the anniversary date, escalate by 10% or
alternatively, shall escalate in accordance with the CPI, whichever is greater. Either party shall be entitled to terminate this lease on six months written
notice to the other party.
SFF
– within one year 12 – – – – –
– in second to fifth year inclusive 234 – – – – –
246 – – – – –
Block C, Upper Grayston Office Park, 152 Ann Crescent, Strathavon, Sandton.
The entity has leased Portion 13, remaining Extent of Erf 14, Portion 1 of Erf 14 Simba Township, together with the building erected thereon from CEF
(Proprietary) Limited. The agreement commenced on 1 April 2009 and the rent payable shall annually, on the anniversary date, escalate by 10% or
alternatively, shall escalate in accordance with the CPI, whichever is greater. Either party shall be entitled to terminate this lease on six months written
notice to the other party.
PAGE 109
36. Financial instruments
Risk profileThe Group has a risk management and a treasury department in CEF (Proprietary) Limited and in PetroSA, that manages the financial risks relating to the Group’s operations. The Group’s liquidity, credit, foreign exchange, interest rate and crude oil price risks are monitored continually. Approved policies exist for managing these risks.
In the course of the Group’s business operations it is exposed to liquidity, credit, foreign exchange, interest rate and crude oil price risk. The risk management policy of the Group relating to each of these risks is discussed below.
Risk management objectives and policiesThe Group’s objective in using financial instruments is to reduce the uncertainty over future cash flows arising from movements in foreign exchange, interest rates and crude oil prices. Throughout the year under review it has been, and remains, the Group’s policy that no speculative trading in derivative financial instruments be undertaken.
Foreign currency managementThe Group is exposed to foreign currency fluctuations as it raises funding in the offshore financial markets, imports raw material and spares and furthermore exports finished product and crude oil. All local sales of finished products are sold on a foreign currency denominated basis.
The Group takes cover on foreign exchange transactions where there is a future currency exposure. The Group also makes use of a natural hedge situation to manage foreign currency exposure.
A sensitivity analysis was done for the net effect on revenue, cost of sales and expenses. The weakening or strengthening of the Rand/Dollar exchange rate by R1 based on actual revenue and cost will increase or decrease profits by R585.3 million (2009: R789.5 million) respectively.
Cross currency interest rate swapThe Group’s activities expose it to a variety of financial risks: market risk (including currency risk, fair value interest rate risk, cash flow interest rate risk and price risk), credit risk and liquidity risk.
The Group’s overall risk management program focuses on the unpredictability of financial markets and seeks to minimise potential adverse effects on the Group’s financial performance. The Group uses derivative financial instruments to hedge certain risk exposures. Risk management is carried out by a central treasury department (group treasury) under policies approved by the Board of directors. Group treasury identifies, evaluates and hedges financial risks in close cooperation with the Group’s operating units. The Board of directors provides written principles for overall risk management, as well as written policies covering specific areas, such as foreign exchange risk, interest rate risk, credit risk, use of derivative financial instruments and non-derivative financial instruments, and investment of excess liquidity.
As at 31 March 2010, the interest rate and foreign exchange derivative position relating to the cross currency interest rate swap was out-the-money to an amount of R1.1 million (2009: in-of-the money to an amount of R11.8 million).
Financial AssetsThe Group is mainly exposed to fluctuation in the USD LIBOR, EURIBOR AND ZAR interest rate. The Group measures its market risk exposure by running various sensitivity analyses including 10% favourable and adverse changes in the key variables. The sensitivity analyses include only outstanding foreign currency denominated monetary items and adjusts their translation at the period end for a 10% change in foreign currency rates.
As at 31 March 2010 a 10% strengthening in ZAR against the relevant currencies would have resulted in a decrease in foreign currency denominated assets of R152 million (2009: R131.6 million) and a 10% weakening in ZAR against the relevant currencies would have resulted in an increase in foreign currency denominated assets of R152 million (2009: R131.6 million).
Notes to the AnnualFinancial StatementFor the year ended 31 March 2010
PAGE 110 CEF (PTY) LTD ANNUAL REPORT 2010
Notes to the AnnualFinancial StatementFor the year ended 31 March 2010
36. Financial instruments (continued)
Financial LiabilitiesAs at 31 March 2010 a 10% strengthening in ZAR against the US Dollar would have resulted in a decrease in foreign currency denominated liabilities of R20.7 million (2009: R37.5 million) and a 10% weakening in ZAR against US Dollar would have resulted in an increase in foreign currency denominated liabilities of R20.7 million (2009: R37.5 million)
Currency riskThe Group undertakes certain transactions denominated in foreign currencies, hence exposures to exchange rate fluctuations arise. The Group manages this risk by entering into forward foreign exchange contracts.
Exchange rates used for conversion of foreign items were:
Closing rate: 2010 2009 2008USD 7.32450 9.6175 8.1141Euro 11.04319 12.7700 12.851Average: USD 7.81366 8.33012 7.1035Euro 11.04319 12.44463 10.07569
Forward foreign exchange contracts2010Total foreign currency Average forward exchange rate Maturity date Liabilities3389 USD 11.1007 Less than 3 months
2009Total foreign currency Average forward exchange rate Maturity date Liabilities 884.948 USD 9.6331 Less than 3 months3.156.178 USD 13.8639 3 6 Months61.101 GBP 9.7256 3 6 months634.193 GBP 13.7657 Less than 3 monthsAsset 1.890 GBP 13.7498 Less than 3 months
2008Total foreign currency Average forward exchange rate Maturity date Liabilities 9.481.024 USD 8.2171 3.6 months87.046.658 USD 16.1594 Less than 3 months866.175 GBP 8.1238 Less than 3 months
As at 31 March 2010, a 10% relative change in the USD to the ZAR would have impacted profit and loss for the year by R0 million (2009: R3.9 million; 2008: R72.1 million).
As at 31 March 2010, a 10% relative change in the GBP to the ZAR would have impacted profit and loss for the year by R0.004 million (2009: R0.96 million).
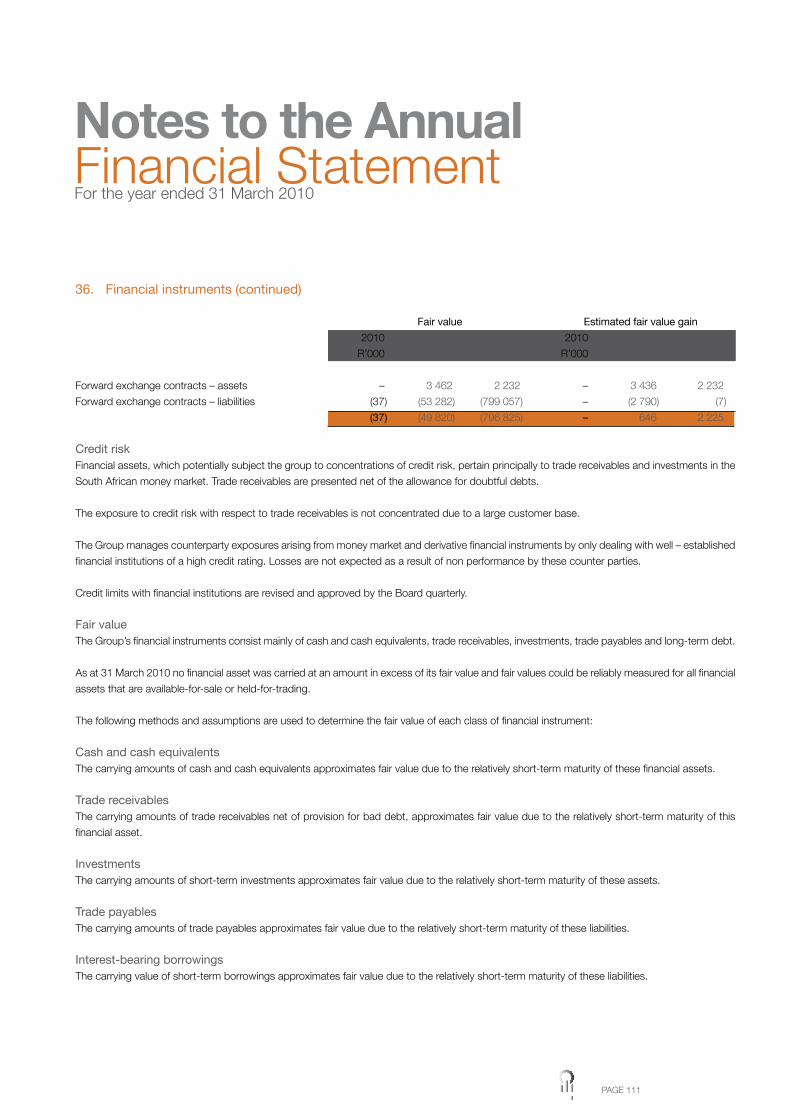
PAGE 111
36. Financial instruments (continued)
Fair value Estimated fair value gain
2010 2009 2008 2010 2009 2008
R’000 R’000 R’000 R’000 R’000 R’000
Forward exchange contracts – assets – 3 462 2 232 – 3 436 2 232
Forward exchange contracts – liabilities (37) (53 282) (799 057) – (2 790) (7)
(37) (49 820) (796 825) – 646 2 225
Credit riskFinancial assets, which potentially subject the group to concentrations of credit risk, pertain principally to trade receivables and investments in the
South African money market. Trade receivables are presented net of the allowance for doubtful debts.
The exposure to credit risk with respect to trade receivables is not concentrated due to a large customer base.
The Group manages counterparty exposures arising from money market and derivative financial instruments by only dealing with well – established
financial institutions of a high credit rating. Losses are not expected as a result of non performance by these counter parties.
Credit limits with financial institutions are revised and approved by the Board quarterly.
Fair valueThe Group’s financial instruments consist mainly of cash and cash equivalents, trade receivables, investments, trade payables and long-term debt.
As at 31 March 2010 no financial asset was carried at an amount in excess of its fair value and fair values could be reliably measured for all financial
assets that are available-for-sale or held-for-trading.
The following methods and assumptions are used to determine the fair value of each class of financial instrument:
Cash and cash equivalentsThe carrying amounts of cash and cash equivalents approximates fair value due to the relatively short-term maturity of these financial assets.
Trade receivablesThe carrying amounts of trade receivables net of provision for bad debt, approximates fair value due to the relatively short-term maturity of this
financial asset.
InvestmentsThe carrying amounts of short-term investments approximates fair value due to the relatively short-term maturity of these assets.
Trade payablesThe carrying amounts of trade payables approximates fair value due to the relatively short-term maturity of these liabilities.
Interest-bearing borrowingsThe carrying value of short-term borrowings approximates fair value due to the relatively short-term maturity of these liabilities.
Notes to the AnnualFinancial StatementFor the year ended 31 March 2010
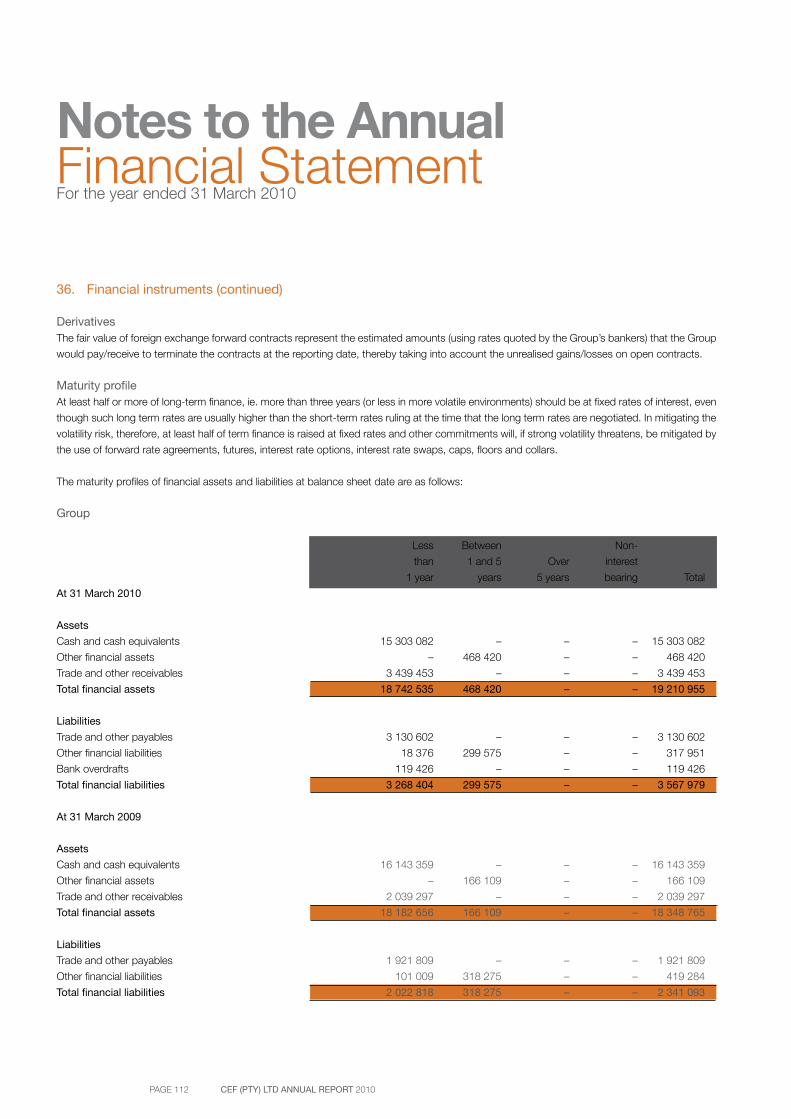
PAGE 112 CEF (PTY) LTD ANNUAL REPORT 2010
Notes to the AnnualFinancial StatementFor the year ended 31 March 2010
36. Financial instruments (continued)
DerivativesThe fair value of foreign exchange forward contracts represent the estimated amounts (using rates quoted by the Group’s bankers) that the Group
would pay/receive to terminate the contracts at the reporting date, thereby taking into account the unrealised gains/losses on open contracts.
Maturity profileAt least half or more of long-term finance, ie. more than three years (or less in more volatile environments) should be at fixed rates of interest, even
though such long term rates are usually higher than the short-term rates ruling at the time that the long term rates are negotiated. In mitigating the
volatility risk, therefore, at least half of term finance is raised at fixed rates and other commitments will, if strong volatility threatens, be mitigated by
the use of forward rate agreements, futures, interest rate options, interest rate swaps, caps, floors and collars.
The maturity profiles of financial assets and liabilities at balance sheet date are as follows:
Group
Less Between Non-
than 1 and 5 Over interest
1 year years 5 years bearing Total
At 31 March 2010
Assets
Cash and cash equivalents 15 303 082 – – – 15 303 082
Other financial assets – 468 420 – – 468 420
Trade and other receivables 3 439 453 – – – 3 439 453
Total financial assets 18 742 535 468 420 – – 19 210 955
Liabilities
Trade and other payables 3 130 602 – – – 3 130 602
Other financial liabilities 18 376 299 575 – – 317 951
Bank overdrafts 119 426 – – – 119 426
Total financial liabilities 3 268 404 299 575 – – 3 567 979
At 31 March 2009
Assets
Cash and cash equivalents 16 143 359 – – – 16 143 359
Other financial assets – 166 109 – – 166 109
Trade and other receivables 2 039 297 – – – 2 039 297
Total financial assets 18 182 656 166 109 – – 18 348 765
Liabilities
Trade and other payables 1 921 809 – – – 1 921 809
Other financial liabilities 101 009 318 275 – – 419 284
Total financial liabilities 2 022 818 318 275 – – 2 341 093
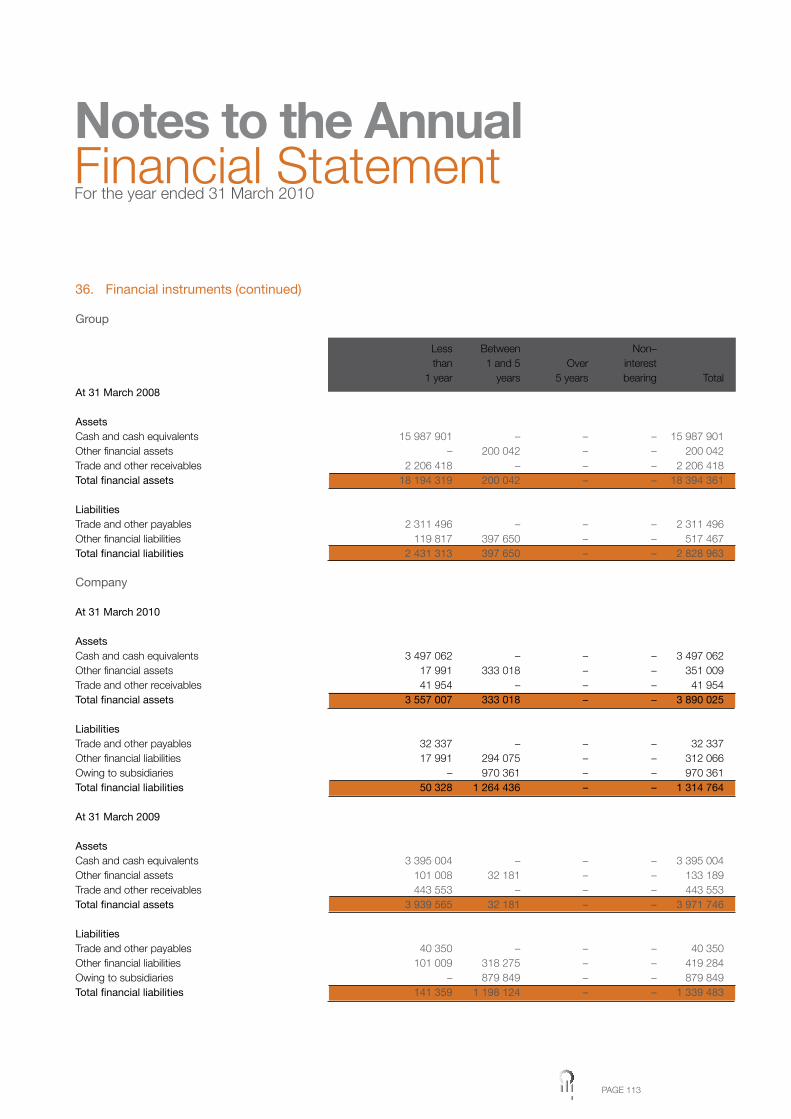
PAGE 113
36. Financial instruments (continued)
Group
Less Between Non– than 1 and 5 Over interest 1 year years 5 years bearing TotalAt 31 March 2008 AssetsCash and cash equivalents 15 987 901 – – – 15 987 901Other financial assets – 200 042 – – 200 042Trade and other receivables 2 206 418 – – – 2 206 418Total financial assets 18 194 319 200 042 – – 18 394 361
LiabilitiesTrade and other payables 2 311 496 – – – 2 311 496Other financial liabilities 119 817 397 650 – – 517 467Total financial liabilities 2 431 313 397 650 – – 2 828 963
Company
At 31 March 2010 AssetsCash and cash equivalents 3 497 062 – – – 3 497 062Other financial assets 17 991 333 018 – – 351 009Trade and other receivables 41 954 – – – 41 954Total financial assets 3 557 007 333 018 – – 3 890 025
LiabilitiesTrade and other payables 32 337 – – – 32 337Other financial liabilities 17 991 294 075 – – 312 066Owing to subsidiaries – 970 361 – – 970 361Total financial liabilities 50 328 1 264 436 – – 1 314 764
At 31 March 2009 AssetsCash and cash equivalents 3 395 004 – – – 3 395 004Other financial assets 101 008 32 181 – – 133 189Trade and other receivables 443 553 – – – 443 553Total financial assets 3 939 565 32 181 – – 3 971 746
LiabilitiesTrade and other payables 40 350 – – – 40 350Other financial liabilities 101 009 318 275 – – 419 284Owing to subsidiaries – 879 849 – – 879 849Total financial liabilities 141 359 1 198 124 – – 1 339 483
Notes to the AnnualFinancial StatementFor the year ended 31 March 2010
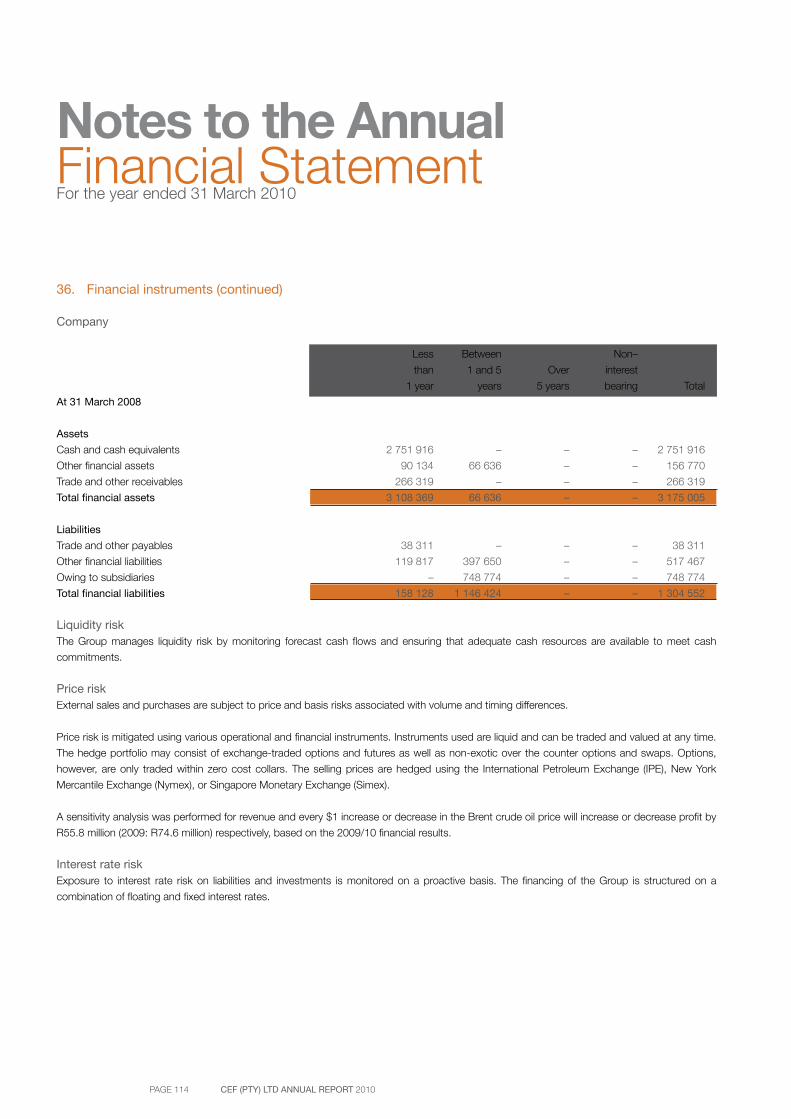
PAGE 114 CEF (PTY) LTD ANNUAL REPORT 2010
Notes to the AnnualFinancial StatementFor the year ended 31 March 2010
36. Financial instruments (continued)
Company
Less Between Non–
than 1 and 5 Over interest
1 year years 5 years bearing Total
At 31 March 2008
Assets
Cash and cash equivalents 2 751 916 – – – 2 751 916
Other financial assets 90 134 66 636 – – 156 770
Trade and other receivables 266 319 – – – 266 319
Total financial assets 3 108 369 66 636 – – 3 175 005
Liabilities
Trade and other payables 38 311 – – – 38 311
Other financial liabilities 119 817 397 650 – – 517 467
Owing to subsidiaries – 748 774 – – 748 774
Total financial liabilities 158 128 1 146 424 – – 1 304 552
Liquidity riskThe Group manages liquidity risk by monitoring forecast cash flows and ensuring that adequate cash resources are available to meet cash
commitments.
Price riskExternal sales and purchases are subject to price and basis risks associated with volume and timing differences.
Price risk is mitigated using various operational and financial instruments. Instruments used are liquid and can be traded and valued at any time.
The hedge portfolio may consist of exchange-traded options and futures as well as non-exotic over the counter options and swaps. Options,
however, are only traded within zero cost collars. The selling prices are hedged using the International Petroleum Exchange (IPE), New York
Mercantile Exchange (Nymex), or Singapore Monetary Exchange (Simex).
A sensitivity analysis was performed for revenue and every $1 increase or decrease in the Brent crude oil price will increase or decrease profit by
R55.8 million (2009: R74.6 million) respectively, based on the 2009/10 financial results.
Interest rate riskExposure to interest rate risk on liabilities and investments is monitored on a proactive basis. The financing of the Group is structured on a
combination of floating and fixed interest rates.
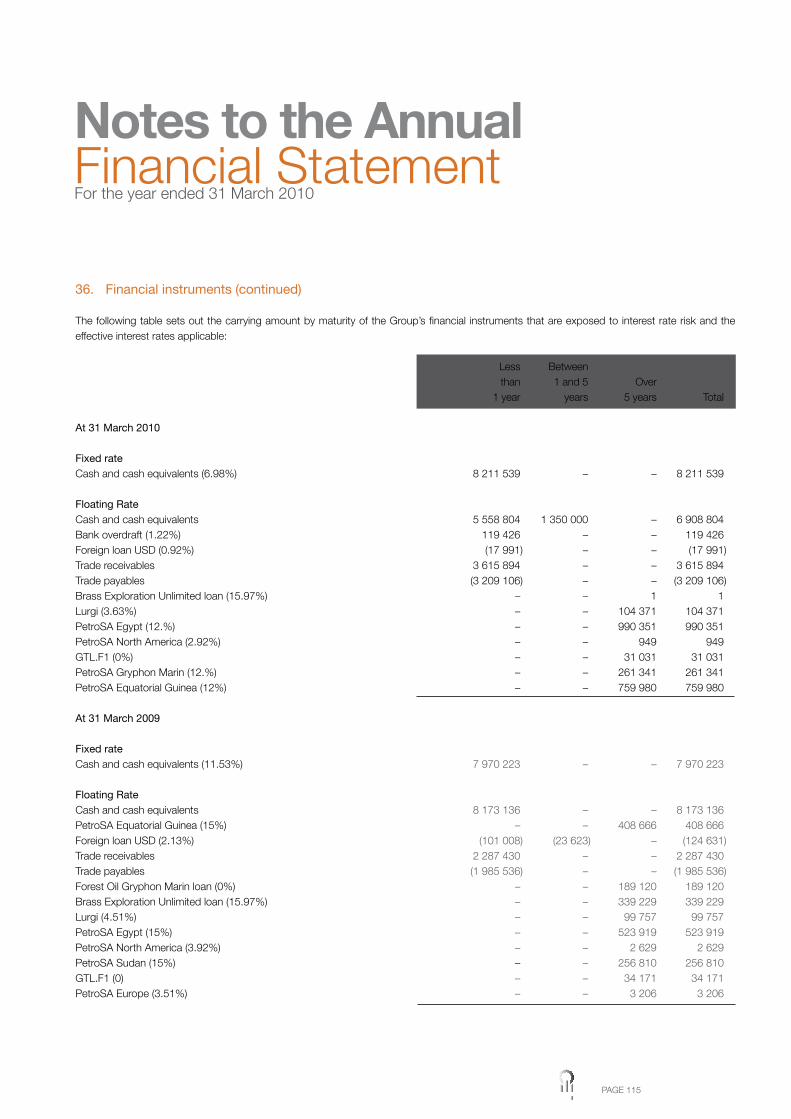
PAGE 115
36. Financial instruments (continued)
The following table sets out the carrying amount by maturity of the Group’s financial instruments that are exposed to interest rate risk and the effective interest rates applicable:
Less Between than 1 and 5 Over 1 year years 5 years Total
At 31 March 2010
Fixed rateCash and cash equivalents (6.98%) 8 211 539 – – 8 211 539
Floating RateCash and cash equivalents 5 558 804 1 350 000 – 6 908 804Bank overdraft (1.22%) 119 426 – – 119 426Foreign loan USD (0.92%) (17 991) – – (17 991)Trade receivables 3 615 894 – – 3 615 894Trade payables (3 209 106) – – (3 209 106)Brass Exploration Unlimited loan (15.97%) – – 1 1Lurgi (3.63%) – – 104 371 104 371PetroSA Egypt (12.%) – – 990 351 990 351PetroSA North America (2.92%) – – 949 949GTL.F1 (0%) – – 31 031 31 031PetroSA Gryphon Marin (12.%) – – 261 341 261 341PetroSA Equatorial Guinea (12%) – – 759 980 759 980
At 31 March 2009 Fixed rateCash and cash equivalents (11.53%) 7 970 223 – – 7 970 223
Floating RateCash and cash equivalents 8 173 136 – – 8 173 136PetroSA Equatorial Guinea (15%) – – 408 666 408 666Foreign loan USD (2.13%) (101 008) (23 623) – (124 631)Trade receivables 2 287 430 – – 2 287 430Trade payables (1 985 536) – – (1 985 536)Forest Oil Gryphon Marin loan (0%) – – 189 120 189 120Brass Exploration Unlimited loan (15.97%) – – 339 229 339 229Lurgi (4.51%) – – 99 757 99 757PetroSA Egypt (15%) – – 523 919 523 919PetroSA North America (3.92%) – – 2 629 2 629PetroSA Sudan (15%) – – 256 810 256 810GTL.F1 (0) – – 34 171 34 171PetroSA Europe (3.51%) – – 3 206 3 206
Notes to the AnnualFinancial StatementFor the year ended 31 March 2010
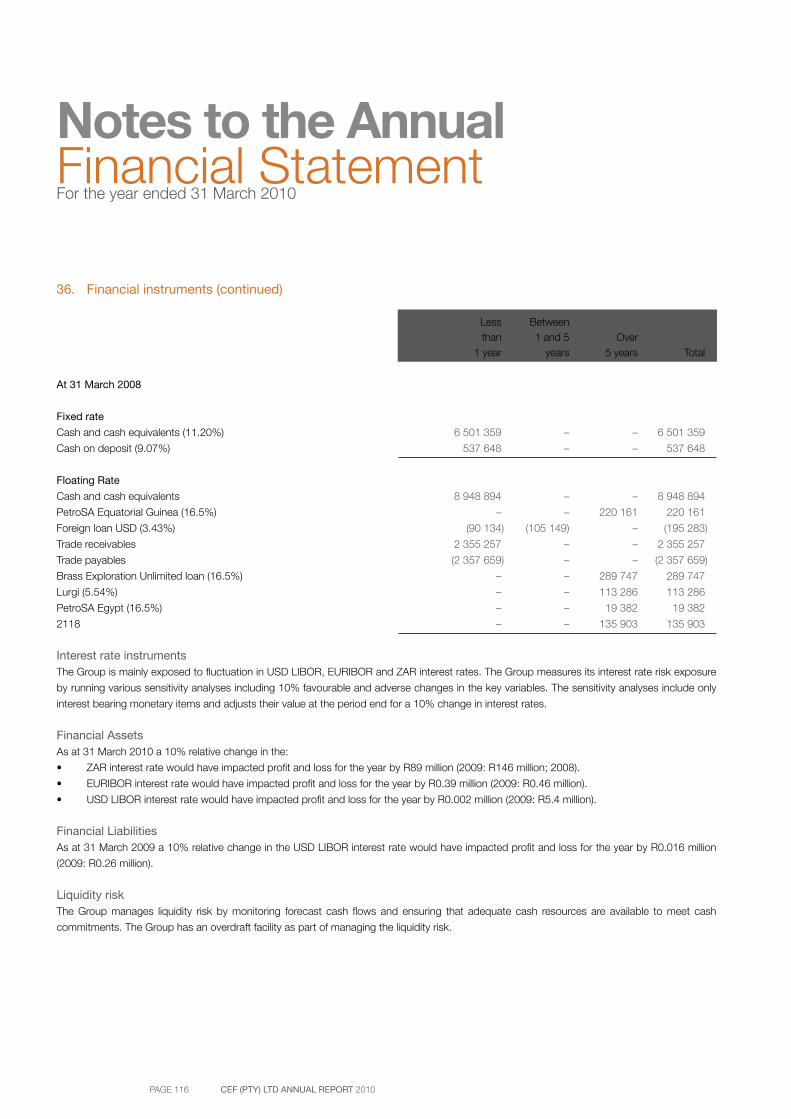
PAGE 116 CEF (PTY) LTD ANNUAL REPORT 2010
Notes to the AnnualFinancial StatementFor the year ended 31 March 2010
36. Financial instruments (continued)
Less Between than 1 and 5 Over 1 year years 5 years Total
At 31 March 2008
Fixed rate
Cash and cash equivalents (11.20%) 6 501 359 – – 6 501 359
Cash on deposit (9.07%) 537 648 – – 537 648
Floating Rate
Cash and cash equivalents 8 948 894 – – 8 948 894
PetroSA Equatorial Guinea (16.5%) – – 220 161 220 161
Foreign loan USD (3.43%) (90 134) (105 149) – (195 283)
Trade receivables 2 355 257 – – 2 355 257
Trade payables (2 357 659) – – (2 357 659)
Brass Exploration Unlimited loan (16.5%) – – 289 747 289 747
Lurgi (5.54%) – – 113 286 113 286
PetroSA Egypt (16.5%) – – 19 382 19 382
2118 – – 135 903 135 903
Interest rate instrumentsThe Group is mainly exposed to fluctuation in USD LIBOR, EURIBOR and ZAR interest rates. The Group measures its interest rate risk exposure
by running various sensitivity analyses including 10% favourable and adverse changes in the key variables. The sensitivity analyses include only
interest bearing monetary items and adjusts their value at the period end for a 10% change in interest rates.
Financial AssetsAs at 31 March 2010 a 10% relative change in the:
• ZAR interest rate would have impacted profit and loss for the year by R89 million (2009: R146 million; 2008).
• EURIBOR interest rate would have impacted profit and loss for the year by R0.39 million (2009: R0.46 million).
• USD LIBOR interest rate would have impacted profit and loss for the year by R0.002 million (2009: R5.4 million).
Financial LiabilitiesAs at 31 March 2009 a 10% relative change in the USD LIBOR interest rate would have impacted profit and loss for the year by R0.016 million
(2009: R0.26 million).
Liquidity riskThe Group manages liquidity risk by monitoring forecast cash flows and ensuring that adequate cash resources are available to meet cash
commitments. The Group has an overdraft facility as part of managing the liquidity risk.
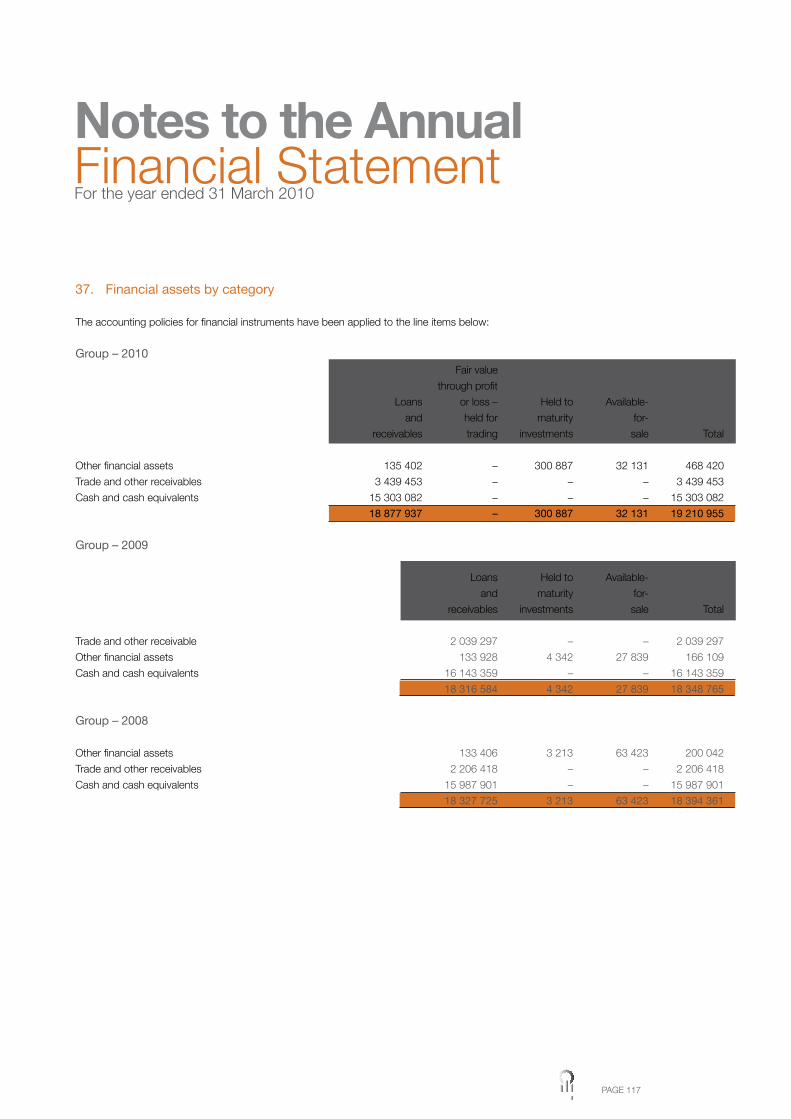
PAGE 117
37. Financial assets by category
The accounting policies for financial instruments have been applied to the line items below:
Group – 2010 Fair value
through profit
Loans or loss – Held to Available-
and held for maturity for-
receivables trading investments sale Total
Other financial assets 135 402 – 300 887 32 131 468 420
Trade and other receivables 3 439 453 – – – 3 439 453
Cash and cash equivalents 15 303 082 – – – 15 303 082
18 877 937 – 300 887 32 131 19 210 955
Group – 2009
Loans Held to Available-
and maturity for-
receivables investments sale Total
Trade and other receivable 2 039 297 – – 2 039 297
Other financial assets 133 928 4 342 27 839 166 109
Cash and cash equivalents 16 143 359 – – 16 143 359
18 316 584 4 342 27 839 18 348 765
Group – 2008
Other financial assets 133 406 3 213 63 423 200 042
Trade and other receivables 2 206 418 – – 2 206 418
Cash and cash equivalents 15 987 901 – – 15 987 901
18 327 725 3 213 63 423 18 394 361
Notes to the AnnualFinancial StatementFor the year ended 31 March 2010
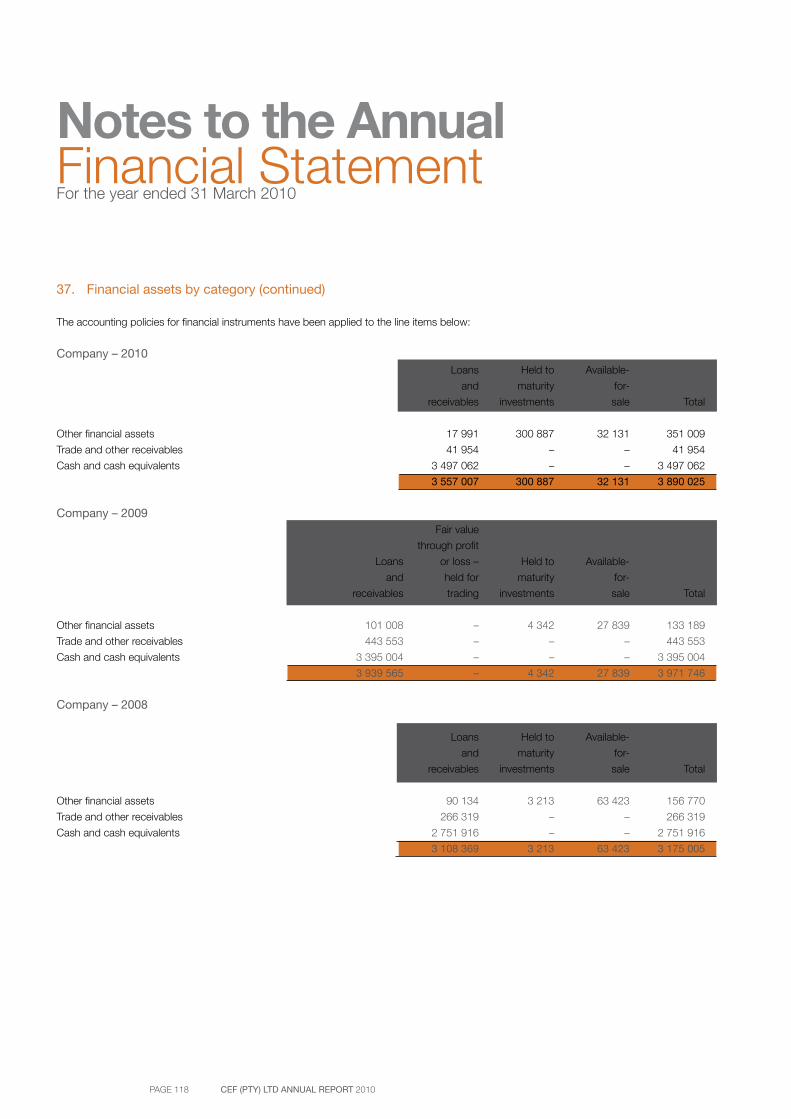
PAGE 118 CEF (PTY) LTD ANNUAL REPORT 2010
Notes to the AnnualFinancial StatementFor the year ended 31 March 2010
37. Financial assets by category (continued)
The accounting policies for financial instruments have been applied to the line items below:
Company – 2010 Loans Held to Available-
and maturity for-
receivables investments sale Total
Other financial assets 17 991 300 887 32 131 351 009
Trade and other receivables 41 954 – – 41 954
Cash and cash equivalents 3 497 062 – – 3 497 062
3 557 007 300 887 32 131 3 890 025
Company – 2009 Fair value
through profit
Loans or loss – Held to Available-
and held for maturity for-
receivables trading investments sale Total
Other financial assets 101 008 – 4 342 27 839 133 189
Trade and other receivables 443 553 – – – 443 553
Cash and cash equivalents 3 395 004 – – – 3 395 004
3 939 565 – 4 342 27 839 3 971 746
Company – 2008
Loans Held to Available-
and maturity for-
receivables investments sale Total
Other financial assets 90 134 3 213 63 423 156 770
Trade and other receivables 266 319 – – 266 319
Cash and cash equivalents 2 751 916 – – 2 751 916
3 108 369 3 213 63 423 3 175 005
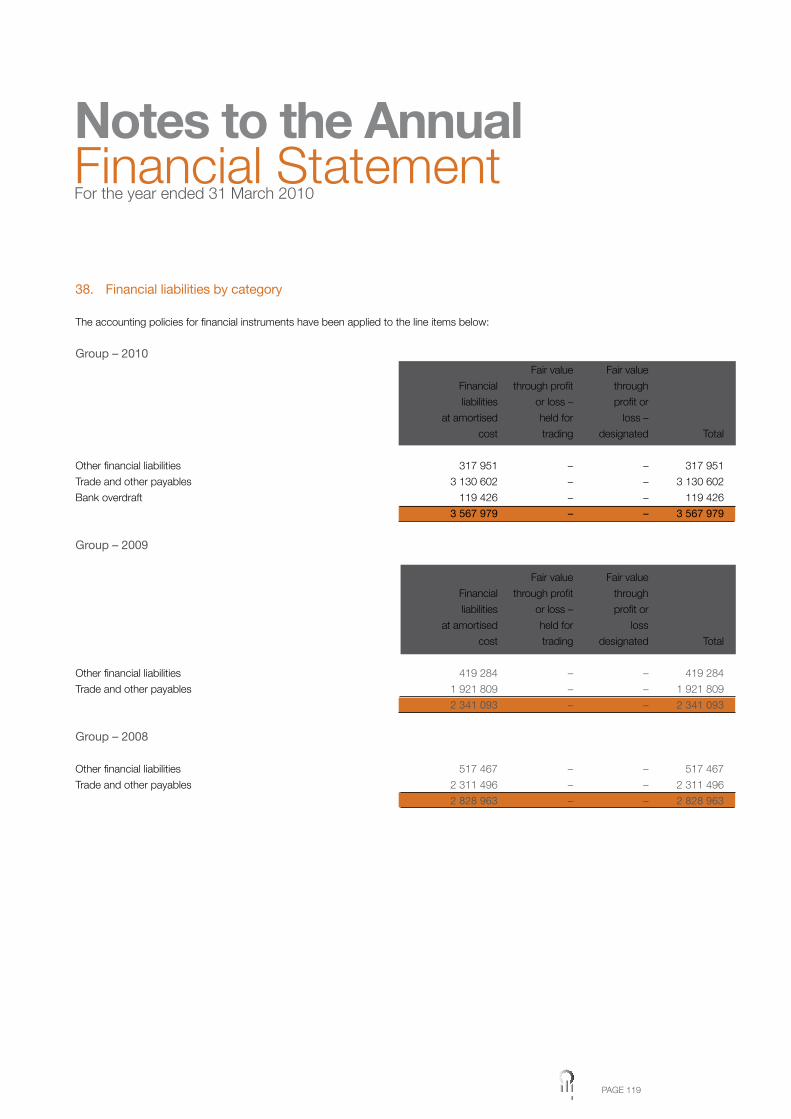
PAGE 119
38. Financial liabilities by category
The accounting policies for financial instruments have been applied to the line items below:
Group – 2010 Fair value Fair value
Financial through profit through
liabilities or loss – profit or
at amortised held for loss –
cost trading designated Total
Other financial liabilities 317 951 – – 317 951
Trade and other payables 3 130 602 – – 3 130 602
Bank overdraft 119 426 – – 119 426
3 567 979 – – 3 567 979
Group – 2009
Fair value Fair value
Financial through profit through
liabilities or loss – profit or
at amortised held for loss
cost trading designated Total
Other financial liabilities 419 284 – – 419 284
Trade and other payables 1 921 809 – – 1 921 809
2 341 093 – – 2 341 093
Group – 2008
Other financial liabilities 517 467 – – 517 467
Trade and other payables 2 311 496 – – 2 311 496
2 828 963 – – 2 828 963
Notes to the AnnualFinancial StatementFor the year ended 31 March 2010
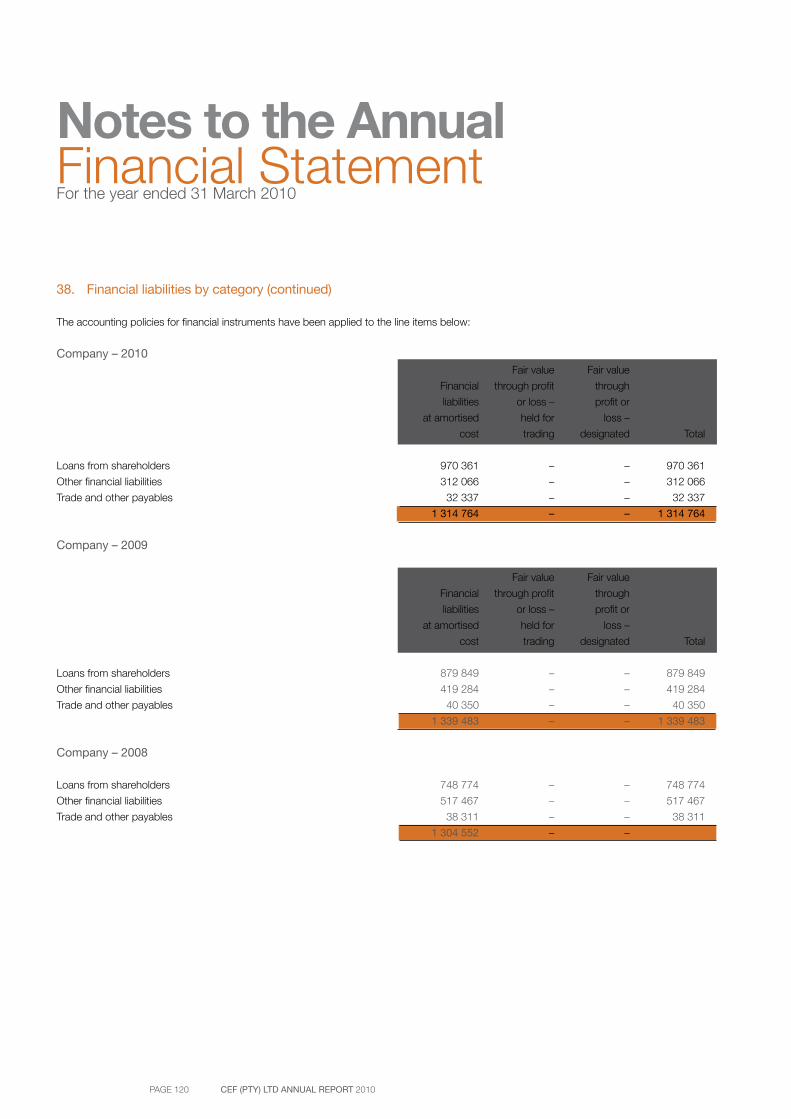
PAGE 120 CEF (PTY) LTD ANNUAL REPORT 2010
Notes to the AnnualFinancial StatementFor the year ended 31 March 2010
38. Financial liabilities by category (continued)
The accounting policies for financial instruments have been applied to the line items below:
Company – 2010 Fair value Fair value
Financial through profit through
liabilities or loss – profit or
at amortised held for loss –
cost trading designated Total
Loans from shareholders 970 361 – – 970 361
Other financial liabilities 312 066 – – 312 066
Trade and other payables 32 337 – – 32 337
1 314 764 – – 1 314 764
Company – 2009
Fair value Fair value
Financial through profit through
liabilities or loss – profit or
at amortised held for loss –
cost trading designated Total
Loans from shareholders 879 849 – – 879 849
Other financial liabilities 419 284 – – 419 284
Trade and other payables 40 350 – – 40 350
1 339 483 – – 1 339 483
Company – 2008
Loans from shareholders 748 774 – – 748 774
Other financial liabilities 517 467 – – 517 467
Trade and other payables 38 311 – – 38 311
1 304 552 – –
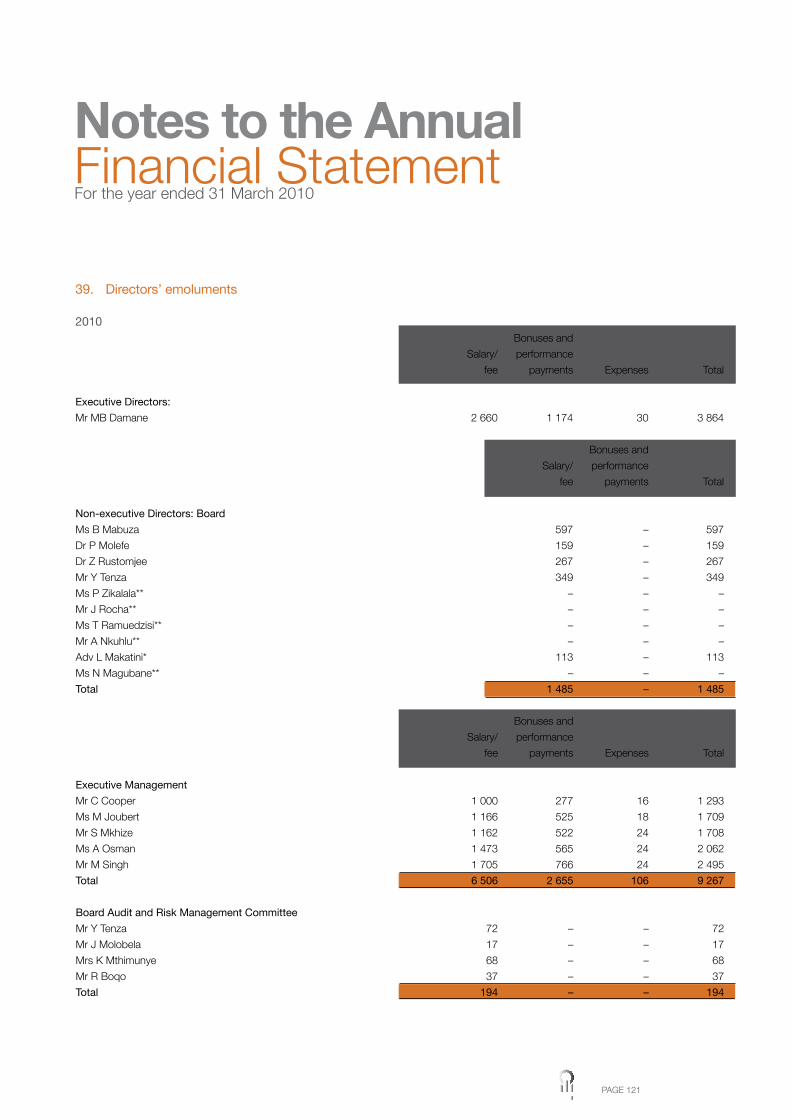
PAGE 121
39. Directors’ emoluments
2010 Bonuses and
Salary/ performance
fee payments Expenses Total
Executive Directors:
Mr MB Damane 2 660 1 174 30 3 864
Bonuses and
Salary/ performance
fee payments Total
Non-executive Directors: Board
Ms B Mabuza 597 – 597
Dr P Molefe 159 – 159
Dr Z Rustomjee 267 – 267
Mr Y Tenza 349 – 349
Ms P Zikalala** – – –
Mr J Rocha** – – –
Ms T Ramuedzisi** – – –
Mr A Nkuhlu** – – –
Adv L Makatini* 113 – 113
Ms N Magubane** – – –
Total 1 485 – 1 485
Bonuses and
Salary/ performance
fee payments Expenses Total
Executive Management
Mr C Cooper 1 000 277 16 1 293
Ms M Joubert 1 166 525 18 1 709
Mr S Mkhize 1 162 522 24 1 708
Ms A Osman 1 473 565 24 2 062
Mr M Singh 1 705 766 24 2 495
Total 6 506 2 655 106 9 267
Board Audit and Risk Management Committee
Mr Y Tenza 72 – – 72
Mr J Molobela 17 – – 17
Mrs K Mthimunye 68 – – 68
Mr R Boqo 37 – – 37
Total 194 – – 194
Notes to the AnnualFinancial StatementFor the year ended 31 March 2010

PAGE 122 CEF (PTY) LTD ANNUAL REPORT 2010
Notes to the AnnualFinancial StatementFor the year ended 31 March 2010
39. Directors’ emoluments (continued)
2009 Bonuses and
Salary/ performance
fee payments Expenses Total
Executive Directors:
Mr MB Damane 2 506 1 079 30 3 615
Executive Management
Ms M Joubert 1 077 481 18 1 576
Mr C Cooper* 707 – 11 718
MS A Osman 1 161 419 24 1 604
Mr M Singh 1 571 688 24 2 283
Mr S Mkhize 1 074 479 24 1 577
Total 5 590 2 067 101 7 758
Non-Executive Directors
Ms B Mabuza 459 – – 459
Mr N Gumede** – – – –
Mr A Nkuhlu** – – – –
Ms P Zikalala** – – – –
Dr P Molefe 108 – – 108
Dr Z Rustomjee 175 – – 175
Mr Y Tenza 164 – – 164
Total 906 – – 906
Board Audit and Risk Management Committee
Mr Y Tenza 71 – – 71
Mr R Boqo 44 – – 44
Mr J Molobela 49 – – 49
Ms K Mthimunye 55 – – 55
Total 219 – – 219
**Not employed for the full year.
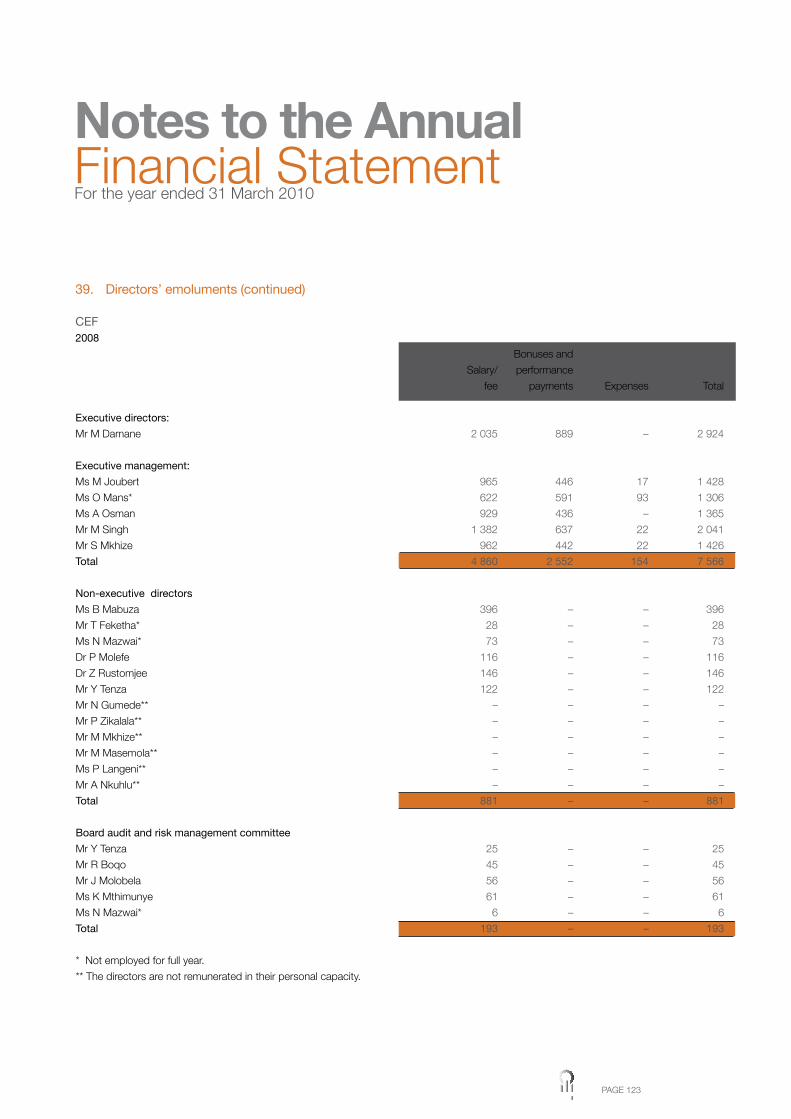
PAGE 123
39. Directors’ emoluments (continued)
CEF2008
Bonuses and
Salary/ performance
fee payments Expenses Total
Executive directors:
Mr M Damane 2 035 889 – 2 924
Executive management:
Ms M Joubert 965 446 17 1 428
Ms O Mans* 622 591 93 1 306
Ms A Osman 929 436 – 1 365
Mr M Singh 1 382 637 22 2 041
Mr S Mkhize 962 442 22 1 426
Total 4 860 2 552 154 7 566
Non-executive directors
Ms B Mabuza 396 – – 396
Mr T Feketha* 28 – – 28
Ms N Mazwai* 73 – – 73
Dr P Molefe 116 – – 116
Dr Z Rustomjee 146 – – 146
Mr Y Tenza 122 – – 122
Mr N Gumede** – – – –
Mr P Zikalala** – – – –
Mr M Mkhize** – – – –
Mr M Masemola** – – – –
Ms P Langeni** – – – –
Mr A Nkuhlu** – – – –
Total 881 – – 881
Board audit and risk management committee
Mr Y Tenza 25 – – 25
Mr R Boqo 45 – – 45
Mr J Molobela 56 – – 56
Ms K Mthimunye 61 – – 61
Ms N Mazwai* 6 – – 6
Total 193 – – 193
* Not employed for full year.
** The directors are not remunerated in their personal capacity.
Notes to the AnnualFinancial StatementFor the year ended 31 March 2010
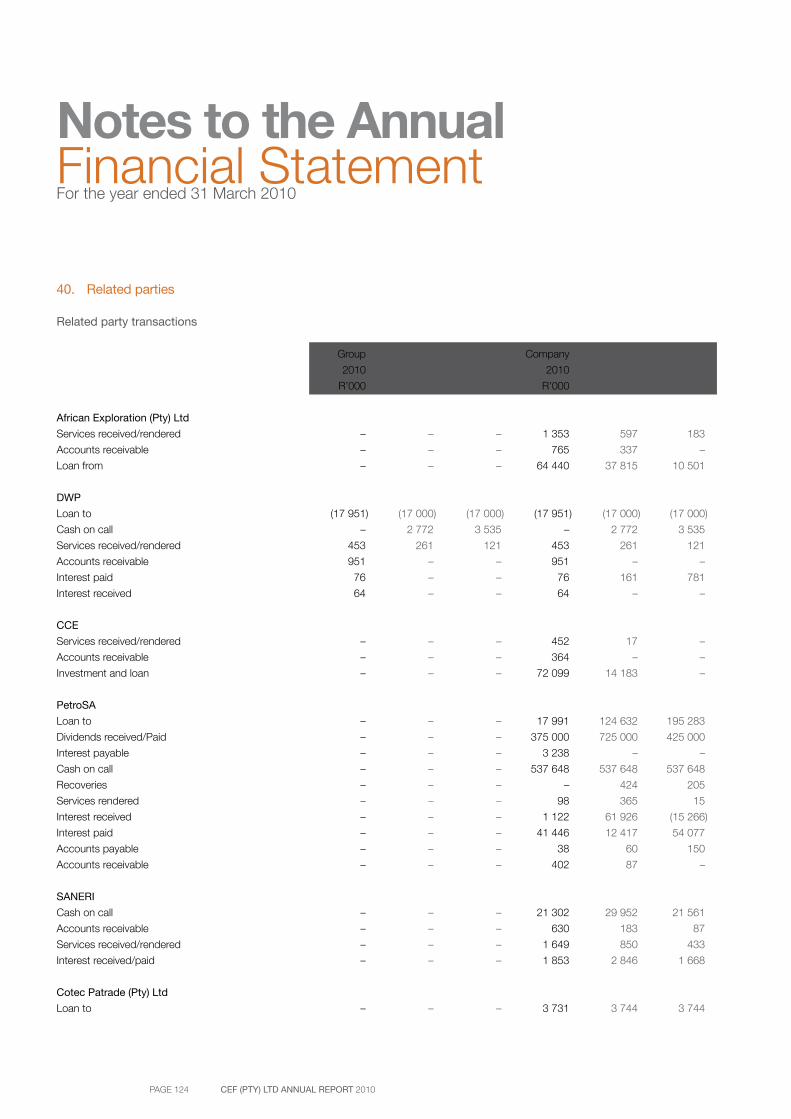
PAGE 124 CEF (PTY) LTD ANNUAL REPORT 2010
Notes to the AnnualFinancial StatementFor the year ended 31 March 2010
40. Related parties
Related party transactions
Group Group Group Company Company Company
2010 2009 2008 2010 2009 2008
R’000 R’000 R’000 R’000 R’000 R’000
African Exploration (Pty) Ltd
Services received/rendered – – – 1 353 597 183
Accounts receivable – – – 765 337 –
Loan from – – – 64 440 37 815 10 501
DWP
Loan to (17 951) (17 000) (17 000) (17 951) (17 000) (17 000)
Cash on call – 2 772 3 535 – 2 772 3 535
Services received/rendered 453 261 121 453 261 121
Accounts receivable 951 – – 951 – –
Interest paid 76 – – 76 161 781
Interest received 64 – – 64 – –
CCE
Services received/rendered – – – 452 17 –
Accounts receivable – – – 364 – –
Investment and loan – – – 72 099 14 183 –
PetroSA
Loan to – – – 17 991 124 632 195 283
Dividends received/Paid – – – 375 000 725 000 425 000
Interest payable – – – 3 238 – –
Cash on call – – – 537 648 537 648 537 648
Recoveries – – – – 424 205
Services rendered – – – 98 365 15
Interest received – – – 1 122 61 926 (15 266)
Interest paid – – – 41 446 12 417 54 077
Accounts payable – – – 38 60 150
Accounts receivable – – – 402 87 –
SANERI
Cash on call – – – 21 302 29 952 21 561
Accounts receivable – – – 630 183 87
Services received/rendered – – – 1 649 850 433
Interest received/paid – – – 1 853 2 846 1 668
Cotec Patrade (Pty) Ltd
Loan to – – – 3 731 3 744 3 744
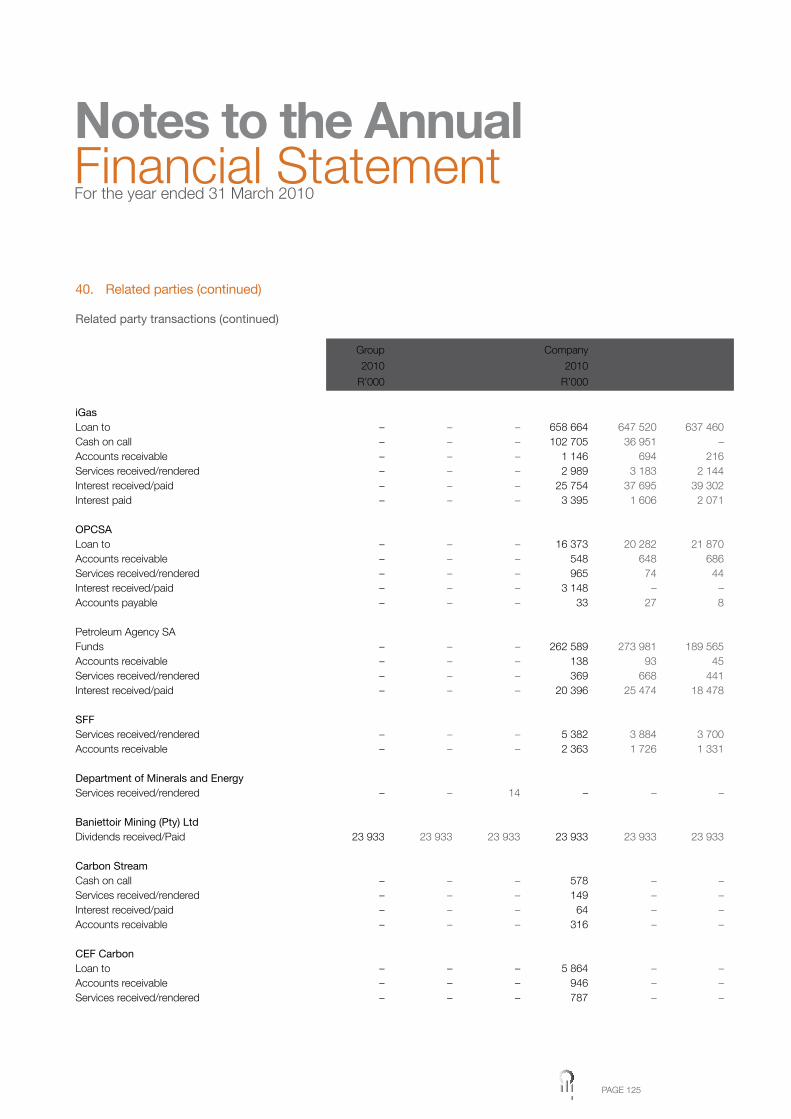
PAGE 125
40. Related parties (continued)
Related party transactions (continued)
Group Group Group Company Company Company
2010 2009 2008 2010 2009 2008
R’000 R’000 R’000 R’000 R’000 R’000
iGas Loan to – – – 658 664 647 520 637 460Cash on call – – – 102 705 36 951 –Accounts receivable – – – 1 146 694 216Services received/rendered – – – 2 989 3 183 2 144Interest received/paid – – – 25 754 37 695 39 302Interest paid – – – 3 395 1 606 2 071
OPCSA Loan to – – – 16 373 20 282 21 870Accounts receivable – – – 548 648 686Services received/rendered – – – 965 74 44Interest received/paid – – – 3 148 – –Accounts payable – – – 33 27 8
Petroleum Agency SA Funds – – – 262 589 273 981 189 565Accounts receivable – – – 138 93 45Services received/rendered – – – 369 668 441Interest received/paid – – – 20 396 25 474 18 478
SFF Services received/rendered – – – 5 382 3 884 3 700Accounts receivable – – – 2 363 1 726 1 331
Department of Minerals and Energy Services received/rendered – – 14 – – –
Baniettoir Mining (Pty) Ltd Dividends received/Paid 23 933 23 933 23 933 23 933 23 933 23 933
Carbon Stream Cash on call – – – 578 – –Services received/rendered – – – 149 – –Interest received/paid – – – 64 – –Accounts receivable – – – 316 – –
CEF Carbon Loan to – – – 5 864 – –Accounts receivable – – – 946 – –Services received/rendered – – – 787 – –
Notes to the AnnualFinancial StatementFor the year ended 31 March 2010
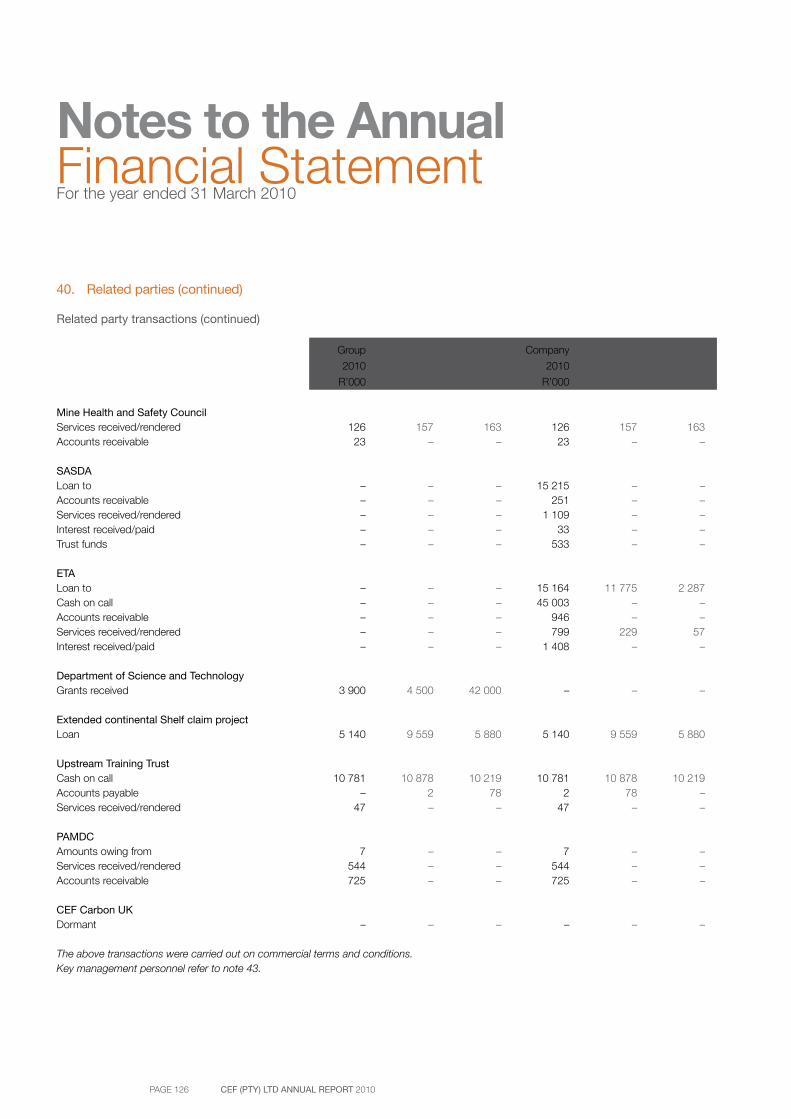
PAGE 126 CEF (PTY) LTD ANNUAL REPORT 2010
Notes to the AnnualFinancial StatementFor the year ended 31 March 2010
40. Related parties (continued)
Related party transactions (continued)
Group Group Group Company Company Company
2010 2009 2008 2010 2009 2008
R’000 R’000 R’000 R’000 R’000 R’000
Mine Health and Safety Council Services received/rendered 126 157 163 126 157 163Accounts receivable 23 – – 23 – –
SASDA Loan to – – – 15 215 – –Accounts receivable – – – 251 – –Services received/rendered – – – 1 109 – –Interest received/paid – – – 33 – –Trust funds – – – 533 – –
ETA Loan to – – – 15 164 11 775 2 287Cash on call – – – 45 003 – –Accounts receivable – – – 946 – –Services received/rendered – – – 799 229 57Interest received/paid – – – 1 408 – –
Department of Science and Technology Grants received 3 900 4 500 42 000 – – –
Extended continental Shelf claim project Loan 5 140 9 559 5 880 5 140 9 559 5 880
Upstream Training Trust Cash on call 10 781 10 878 10 219 10 781 10 878 10 219Accounts payable – 2 78 2 78 –Services received/rendered 47 – – 47 – –
PAMDC Amounts owing from 7 – – 7 – –Services received/rendered 544 – – 544 – –Accounts receivable 725 – – 725 – –
CEF Carbon UK Dormant – – – – – –
The above transactions were carried out on commercial terms and conditions.Key management personnel refer to note 43.
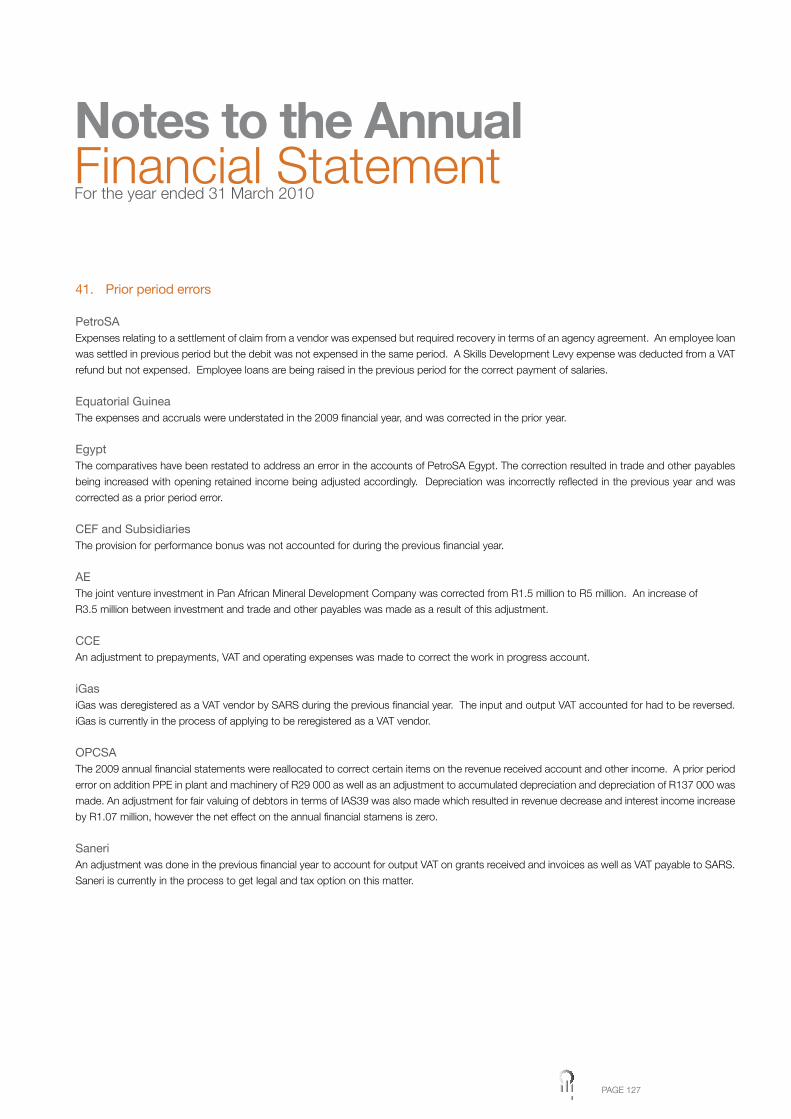
PAGE 127
41. Prior period errors
PetroSAExpenses relating to a settlement of claim from a vendor was expensed but required recovery in terms of an agency agreement. An employee loan
was settled in previous period but the debit was not expensed in the same period. A Skills Development Levy expense was deducted from a VAT
refund but not expensed. Employee loans are being raised in the previous period for the correct payment of salaries.
Equatorial GuineaThe expenses and accruals were understated in the 2009 financial year, and was corrected in the prior year.
Egypt The comparatives have been restated to address an error in the accounts of PetroSA Egypt. The correction resulted in trade and other payables
being increased with opening retained income being adjusted accordingly. Depreciation was incorrectly reflected in the previous year and was
corrected as a prior period error.
CEF and SubsidiariesThe provision for performance bonus was not accounted for during the previous financial year.
AEThe joint venture investment in Pan African Mineral Development Company was corrected from R1.5 million to R5 million. An increase of
R3.5 million between investment and trade and other payables was made as a result of this adjustment.
CCEAn adjustment to prepayments, VAT and operating expenses was made to correct the work in progress account.
iGasiGas was deregistered as a VAT vendor by SARS during the previous financial year. The input and output VAT accounted for had to be reversed.
iGas is currently in the process of applying to be reregistered as a VAT vendor.
OPCSAThe 2009 annual financial statements were reallocated to correct certain items on the revenue received account and other income. A prior period
error on addition PPE in plant and machinery of R29 000 as well as an adjustment to accumulated depreciation and depreciation of R137 000 was
made. An adjustment for fair valuing of debtors in terms of IAS39 was also made which resulted in revenue decrease and interest income increase
by R1.07 million, however the net effect on the annual financial stamens is zero.
SaneriAn adjustment was done in the previous financial year to account for output VAT on grants received and invoices as well as VAT payable to SARS.
Saneri is currently in the process to get legal and tax option on this matter.
Notes to the AnnualFinancial StatementFor the year ended 31 March 2010
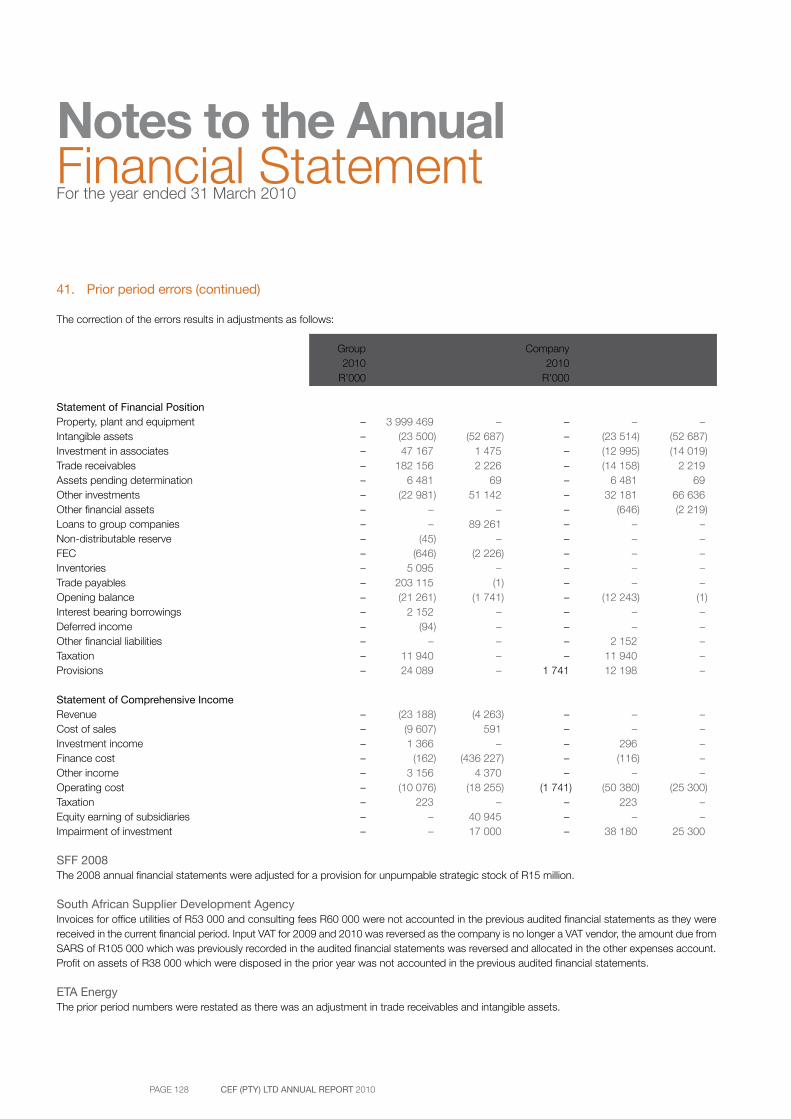
PAGE 128 CEF (PTY) LTD ANNUAL REPORT 2010
Notes to the AnnualFinancial StatementFor the year ended 31 March 2010
41. Prior period errors (continued)
The correction of the errors results in adjustments as follows:
Group Group Group Company Company Company 2010 2009 2008 2010 2009 2008 R’000 R’000 R’000 R’000 R’000 R’000
Statement of Financial Position Property, plant and equipment – 3 999 469 – – – –Intangible assets – (23 500) (52 687) – (23 514) (52 687)Investment in associates – 47 167 1 475 – (12 995) (14 019)Trade receivables – 182 156 2 226 – (14 158) 2 219Assets pending determination – 6 481 69 – 6 481 69Other investments – (22 981) 51 142 – 32 181 66 636Other financial assets – – – – (646) (2 219)Loans to group companies – – 89 261 – – –Non-distributable reserve – (45) – – – –FEC – (646) (2 226) – – –Inventories – 5 095 – – – –Trade payables – 203 115 (1) – – –Opening balance – (21 261) (1 741) – (12 243) (1)Interest bearing borrowings – 2 152 – – – –Deferred income – (94) – – – –Other financial liabilities – – – – 2 152 –Taxation – 11 940 – – 11 940 –Provisions – 24 089 – 1 741 12 198 –
Statement of Comprehensive Income Revenue – (23 188) (4 263) – – –Cost of sales – (9 607) 591 – – –Investment income – 1 366 – – 296 –Finance cost – (162) (436 227) – (116) –Other income – 3 156 4 370 – – –Operating cost – (10 076) (18 255) (1 741) (50 380) (25 300)Taxation – 223 – – 223 –Equity earning of subsidiaries – – 40 945 – – –Impairment of investment – – 17 000 – 38 180 25 300
SFF 2008The 2008 annual financial statements were adjusted for a provision for unpumpable strategic stock of R15 million.
South African Supplier Development Agency Invoices for office utilities of R53 000 and consulting fees R60 000 were not accounted in the previous audited financial statements as they were received in the current financial period. Input VAT for 2009 and 2010 was reversed as the company is no longer a VAT vendor, the amount due from SARS of R105 000 which was previously recorded in the audited financial statements was reversed and allocated in the other expenses account. Profit on assets of R38 000 which were disposed in the prior year was not accounted in the previous audited financial statements.
ETA Energy The prior period numbers were restated as there was an adjustment in trade receivables and intangible assets.
PAGE 129
42. Fruitless and wasteful expenditure
ESFF 2009SFF has incurred R9 million in 2009 interest as a result of late payments to Transnet National Ports Authority. Due to late payments, SFF earned interest on the cash held of R9.3 million, which result in a net gain of R0.3 million
SFF has incurred a R1.2 million penalty for the early termination of the EWMS contract. EWMS charged a further R760k for interest on the overdue account. The company has taken steps to recover the money from the entity that has been managing the operations of SFF, further the contract has not been renewed.
SFF 2010SFF has incurred R10.5 million interest as a result of SARS assessing SFF for tax in the 2006 financial year. SFF is a section 21 company and an agent of the state and therefore an objection will be lodged with SARS in the current year disputing the tax, penalty and interest.
PetroSA 2009During 2008/9 a loss of R4 000 was experienced in the petty cash office due to theft, and R194 000 was paid to the South African Receiver of Revenue for penalties and interest incurred. PetroSA also incurred a penalty for late payment of cargo due for the amount of R1 000 and interest for late payment of invoices of R904 000. A further R2.6 million was incurred for penalties and interest relating to cargo dues in terms of the provisions of the Service Level Agreement between SFF and PetroSA. A contract that was budgeted for was signed by an employee outside of his authorised limit of authority, and such was in contravention of company policy therefore irregular. The value of the contract was R600 000 and the contract was subsequently ratified by management.
PetroSA 2010During this financial year an expense for standing transport vehicles of R19 000 was paid to a customer. An amount of R2 000 was paid for a second airline ticket due to the flight being missed after checking. R1 000 was paid to the US Tax Authorities for penalties on late submission of the 2009 tax return and 2010 property tax return. Penalties of R279 000 were incurred and paid to the Equatorial Guinea Tax Authorities for the late submission for tax returns. A late customs clearance of a vessel resulted in a penalty of R20 000. Interest of R26 000 was incurred for the late payment of invoices. An amount of R13 million was paid to SARS in respect of interest on Value Added Tax. PetroSA earned interest on cash held of the same value of R10 million which resulted in a net loss of R2 million.
A senior manager entered into a contract for a hospitality suite at a prominent sporting event. She was not authorised to enter into such contract, therefore the cost is considered irregular expenditure. The value of the contract was R309 000 and the contract was subsequently ratified by management. Disciplinary hearing in progress.
CCECCE Solutions (Proprietary) Limited has incurred interest of R1.9 million (2009: R0.5 million) as a result of late payments to suppliers. The Board had requested a due diligence be performed on a contractor to obtain assurance regarding the value of the contract and verification of the assets in various locations. Further, CCE had to secure funding from the shareholders due to delays in reaching bankability and was not in a position to secure external funding as anticipated.
CEFCEF has incurred interest of R1 000 for late payments to suppliers; traffic fines of R1 000; a penalty for late submission of OPC Management report of R1 000 and foreign currency payment by a customer was incorrectly made to Petroleum Agency instead to PetroSA. The exchange rate difference resulted a loss of R110 000.
Controls have been put in place to prevent a reoccurrence of the above losses and staff have been penalised in their performance ratings which reduces the performance bonus paid to staff.
Notes to the AnnualFinancial StatementFor the year ended 31 March 2010
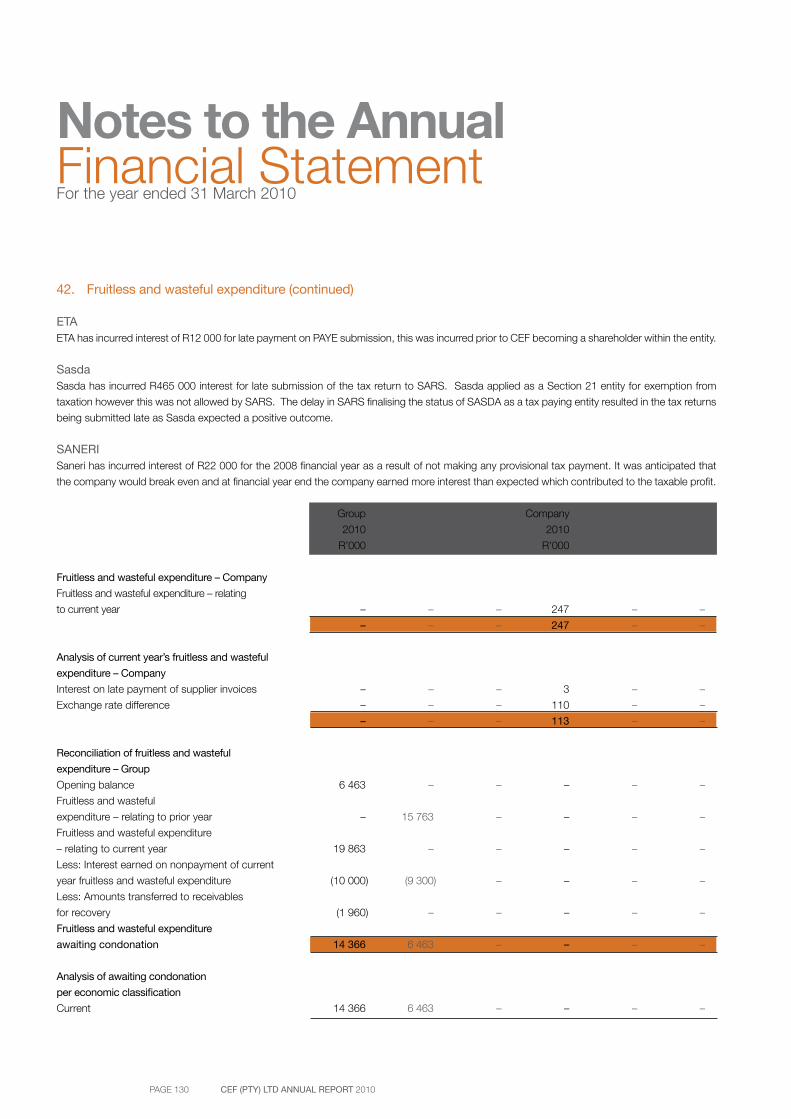
PAGE 130 CEF (PTY) LTD ANNUAL REPORT 2010
Notes to the AnnualFinancial StatementFor the year ended 31 March 2010
42. Fruitless and wasteful expenditure (continued)
ETAETA has incurred interest of R12 000 for late payment on PAYE submission, this was incurred prior to CEF becoming a shareholder within the entity.
SasdaSasda has incurred R465 000 interest for late submission of the tax return to SARS. Sasda applied as a Section 21 entity for exemption from
taxation however this was not allowed by SARS. The delay in SARS finalising the status of SASDA as a tax paying entity resulted in the tax returns
being submitted late as Sasda expected a positive outcome.
SANERISaneri has incurred interest of R22 000 for the 2008 financial year as a result of not making any provisional tax payment. It was anticipated that
the company would break even and at financial year end the company earned more interest than expected which contributed to the taxable profit.
Group Group Group Company Company Company
2010 2009 2008 2010 2009 2008
R’000 R’000 R’000 R’000 R’000 R’000
Fruitless and wasteful expenditure – Company
Fruitless and wasteful expenditure – relating
to current year – – – 247 – –
– – – 247 – –
Analysis of current year’s fruitless and wasteful
expenditure – Company
Interest on late payment of supplier invoices – – – 3 – –
Exchange rate difference – – – 110 – –
– – – 113 – –
Reconciliation of fruitless and wasteful
expenditure – Group
Opening balance 6 463 – – – – –
Fruitless and wasteful
expenditure – relating to prior year – 15 763 – – – –
Fruitless and wasteful expenditure
– relating to current year 19 863 – – – – –
Less: Interest earned on nonpayment of current
year fruitless and wasteful expenditure (10 000) (9 300) – – – –
Less: Amounts transferred to receivables
for recovery (1 960) – – – – –
Fruitless and wasteful expenditure
awaiting condonation 14 366 6 463 – – – –
Analysis of awaiting condonation
per economic classification
Current 14 366 6 463 – – – –
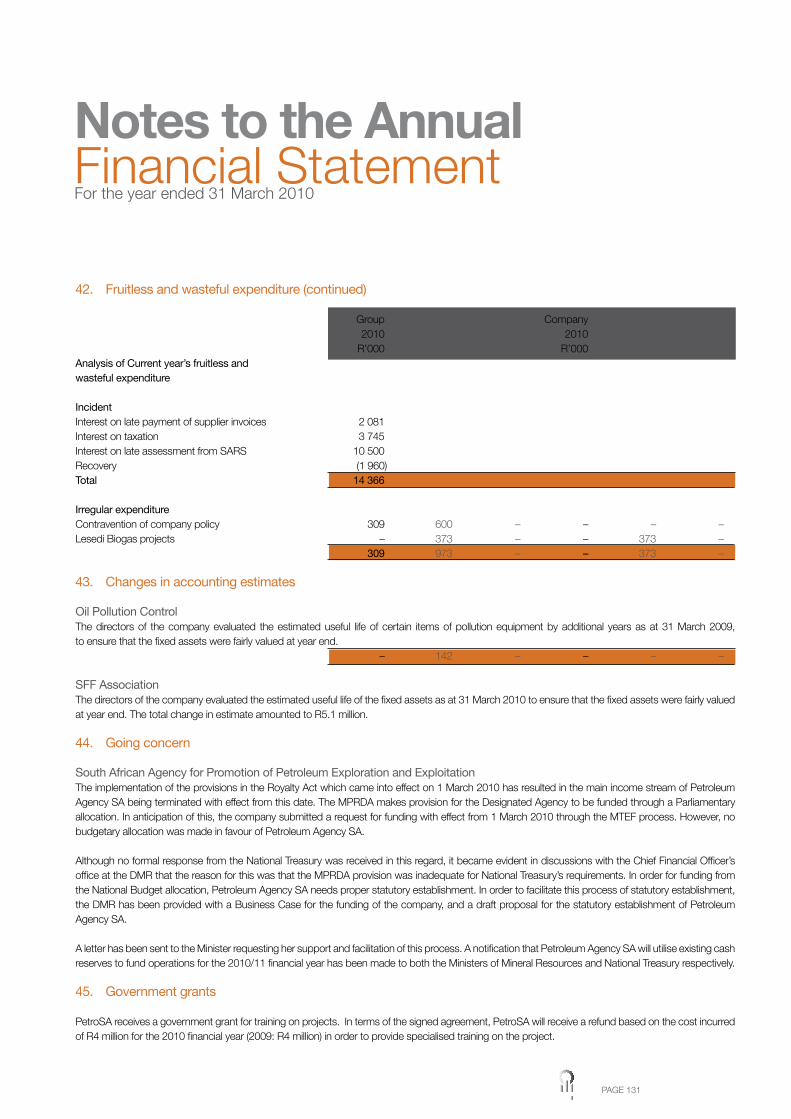
PAGE 131
42. Fruitless and wasteful expenditure (continued)
Group Group Group Company Company Company 2010 2009 2008 2010 2009 2008 R’000 R’000 R’000 R’000 R’000 R’000Analysis of Current year’s fruitless and wasteful expenditure
Incident Interest on late payment of supplier invoices 2 081Interest on taxation 3 745Interest on late assessment from SARS 10 500Recovery (1 960)Total 14 366
Irregular expenditure Contravention of company policy 309 600 – – – –Lesedi Biogas projects – 373 – – 373 – 309 973 – – 373 –
43. Changes in accounting estimates
Oil Pollution ControlThe directors of the company evaluated the estimated useful life of certain items of pollution equipment by additional years as at 31 March 2009, to ensure that the fixed assets were fairly valued at year end. – 142 – – – –
SFF AssociationThe directors of the company evaluated the estimated useful life of the fixed assets as at 31 March 2010 to ensure that the fixed assets were fairly valued at year end. The total change in estimate amounted to R5.1 million.
44. Going concern
South African Agency for Promotion of Petroleum Exploration and ExploitationThe implementation of the provisions in the Royalty Act which came into effect on 1 March 2010 has resulted in the main income stream of Petroleum Agency SA being terminated with effect from this date. The MPRDA makes provision for the Designated Agency to be funded through a Parliamentary allocation. In anticipation of this, the company submitted a request for funding with effect from 1 March 2010 through the MTEF process. However, no budgetary allocation was made in favour of Petroleum Agency SA.
Although no formal response from the National Treasury was received in this regard, it became evident in discussions with the Chief Financial Officer’s office at the DMR that the reason for this was that the MPRDA provision was inadequate for National Treasury’s requirements. In order for funding from the National Budget allocation, Petroleum Agency SA needs proper statutory establishment. In order to facilitate this process of statutory establishment, the DMR has been provided with a Business Case for the funding of the company, and a draft proposal for the statutory establishment of Petroleum Agency SA.
A letter has been sent to the Minister requesting her support and facilitation of this process. A notification that Petroleum Agency SA will utilise existing cash reserves to fund operations for the 2010/11 financial year has been made to both the Ministers of Mineral Resources and National Treasury respectively.
45. Government grants
PetroSA receives a government grant for training on projects. In terms of the signed agreement, PetroSA will receive a refund based on the cost incurred of R4 million for the 2010 financial year (2009: R4 million) in order to provide specialised training on the project.
Notes to the AnnualFinancial StatementFor the year ended 31 March 2010
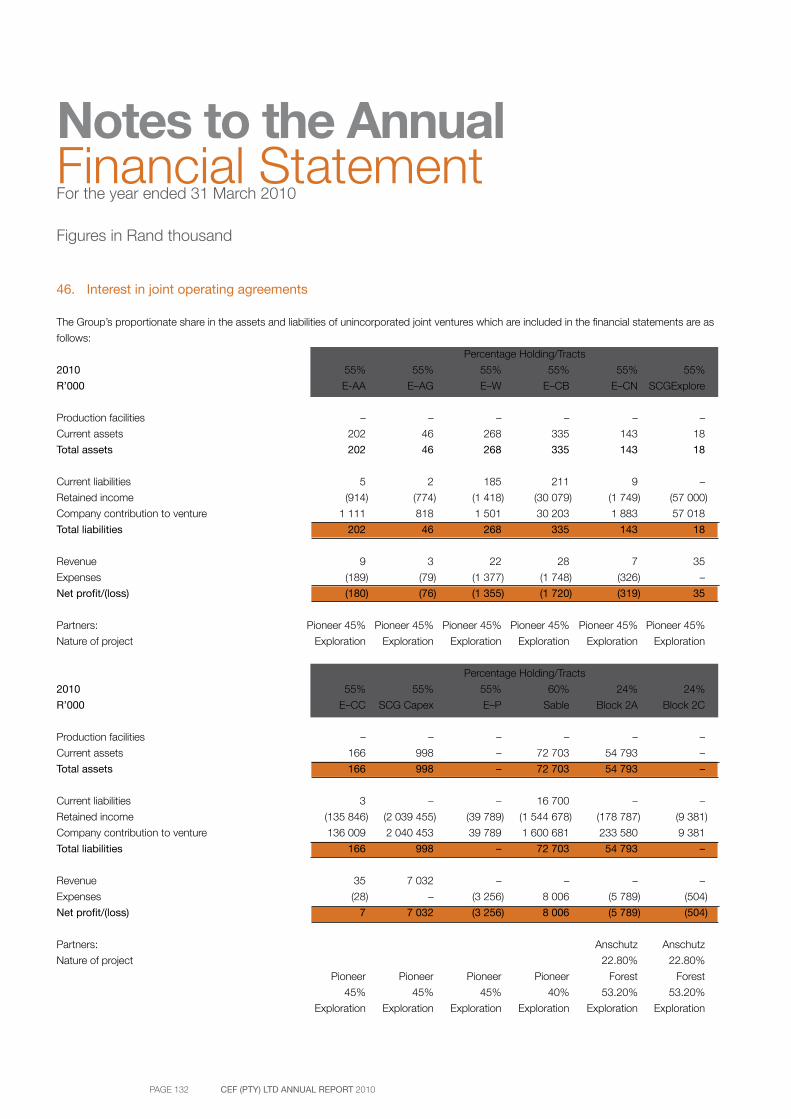
PAGE 132 CEF (PTY) LTD ANNUAL REPORT 2010
Notes to the AnnualFinancial StatementFor the year ended 31 March 2010
Figures in Rand thousand
46. Interest in joint operating agreements
The Group’s proportionate share in the assets and liabilities of unincorporated joint ventures which are included in the financial statements are as
follows:
Percentage Holding/Tracts
2010 55% 55% 55% 55% 55% 55%
R’000 E-AA E–AG E–W E–CB E–CN SCGExplore
Production facilities – – – – – –
Current assets 202 46 268 335 143 18
Total assets 202 46 268 335 143 18
Current liabilities 5 2 185 211 9 –
Retained income (914) (774) (1 418) (30 079) (1 749) (57 000)
Company contribution to venture 1 111 818 1 501 30 203 1 883 57 018
Total liabilities 202 46 268 335 143 18
Revenue 9 3 22 28 7 35
Expenses (189) (79) (1 377) (1 748) (326) –
Net profit/(loss) (180) (76) (1 355) (1 720) (319) 35
Partners: Pioneer 45% Pioneer 45% Pioneer 45% Pioneer 45% Pioneer 45% Pioneer 45%
Nature of project Exploration Exploration Exploration Exploration Exploration Exploration
Percentage Holding/Tracts
2010 55% 55% 55% 60% 24% 24%
R’000 E–CC SCG Capex E–P Sable Block 2A Block 2C
Production facilities – – – – – –
Current assets 166 998 – 72 703 54 793 –
Total assets 166 998 – 72 703 54 793 –
Current liabilities 3 – – 16 700 – –
Retained income (135 846) (2 039 455) (39 789) (1 544 678) (178 787) (9 381)
Company contribution to venture 136 009 2 040 453 39 789 1 600 681 233 580 9 381
Total liabilities 166 998 – 72 703 54 793 –
Revenue 35 7 032 – – – –
Expenses (28) – (3 256) 8 006 (5 789) (504)
Net profit/(loss) 7 7 032 (3 256) 8 006 (5 789) (504)
Partners: Anschutz Anschutz
Nature of project 22.80% 22.80%
Pioneer Pioneer Pioneer Pioneer Forest Forest
45% 45% 45% 40% 53.20% 53.20%
Exploration Exploration Exploration Exploration Exploration Exploration
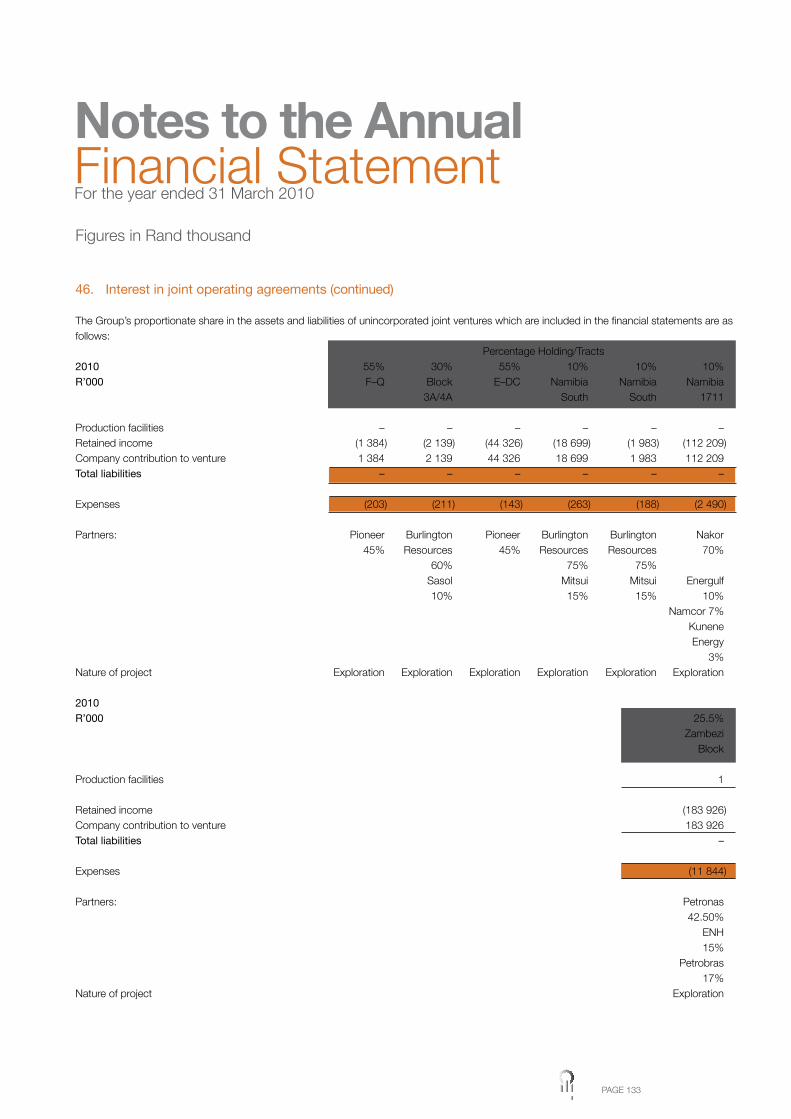
PAGE 133
Figures in Rand thousand
46. Interest in joint operating agreements (continued)
The Group’s proportionate share in the assets and liabilities of unincorporated joint ventures which are included in the financial statements are as follows: Percentage Holding/Tracts2010 55% 30% 55% 10% 10% 10%R’000 F–Q Block E–DC Namibia Namibia Namibia 3A/4A South South 1711
Production facilities – – – – – –Retained income (1 384) (2 139) (44 326) (18 699) (1 983) (112 209)Company contribution to venture 1 384 2 139 44 326 18 699 1 983 112 209Total liabilities – – – – – –
Expenses (203) (211) (143) (263) (188) (2 490)
Partners: Pioneer Burlington Pioneer Burlington Burlington Nakor 45% Resources 45% Resources Resources 70% 60% 75% 75% Sasol Mitsui Mitsui Energulf 10% 15% 15% 10% Namcor 7% Kunene Energy 3%Nature of project Exploration Exploration Exploration Exploration Exploration Exploration
2010R’000 25.5% Zambezi Block
Production facilities 1
Retained income (183 926)Company contribution to venture 183 926Total liabilities –
Expenses (11 844)
Partners: Petronas 42.50% ENH 15% Petrobras 17%Nature of project Exploration
Notes to the AnnualFinancial StatementFor the year ended 31 March 2010
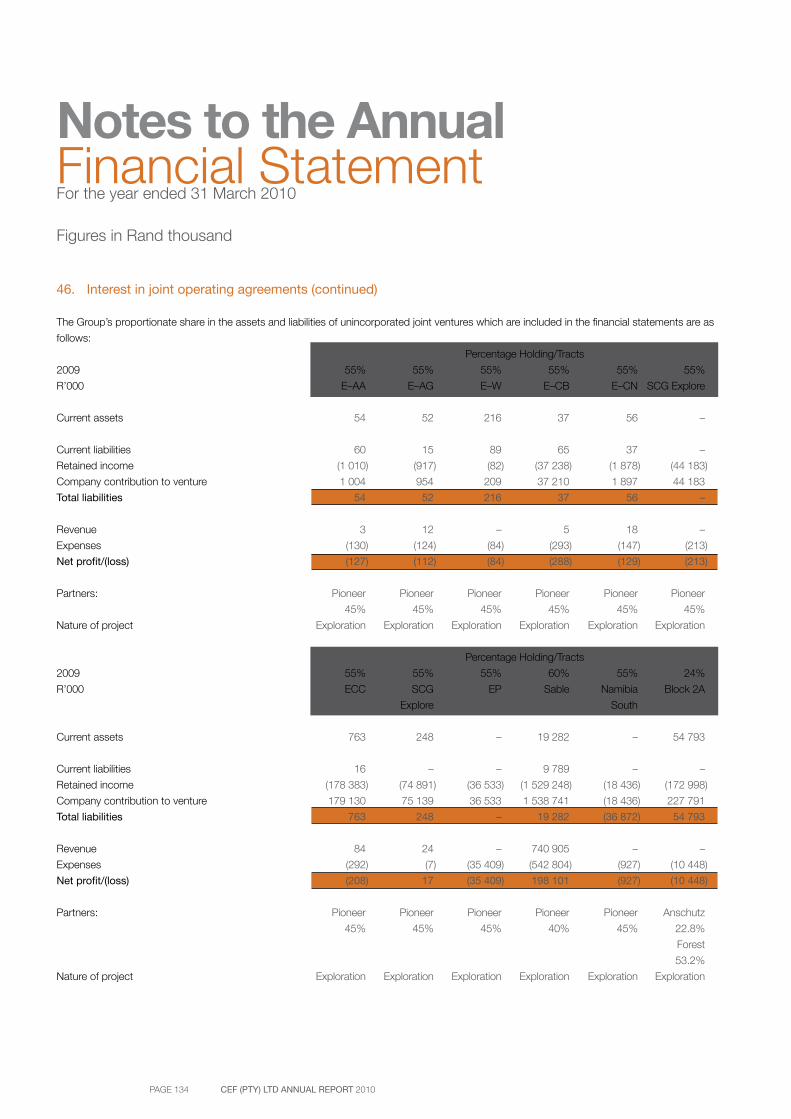
PAGE 134 CEF (PTY) LTD ANNUAL REPORT 2010
Notes to the AnnualFinancial StatementFor the year ended 31 March 2010
Figures in Rand thousand
46. Interest in joint operating agreements (continued)
The Group’s proportionate share in the assets and liabilities of unincorporated joint ventures which are included in the financial statements are as
follows:
Percentage Holding/Tracts
2009 55% 55% 55% 55% 55% 55%
R’000 E–AA E–AG E–W E–CB E–CN SCG Explore
Current assets 54 52 216 37 56 –
Current liabilities 60 15 89 65 37 –
Retained income (1 010) (917) (82) (37 238) (1 878) (44 183)
Company contribution to venture 1 004 954 209 37 210 1 897 44 183
Total liabilities 54 52 216 37 56 –
Revenue 3 12 – 5 18 –
Expenses (130) (124) (84) (293) (147) (213)
Net profit/(loss) (127) (112) (84) (288) (129) (213)
Partners: Pioneer Pioneer Pioneer Pioneer Pioneer Pioneer
45% 45% 45% 45% 45% 45%
Nature of project Exploration Exploration Exploration Exploration Exploration Exploration
Percentage Holding/Tracts
2009 55% 55% 55% 60% 55% 24%
R’000 ECC SCG EP Sable Namibia Block 2A
Explore South
Current assets 763 248 – 19 282 – 54 793
Current liabilities 16 – – 9 789 – –
Retained income (178 383) (74 891) (36 533) (1 529 248) (18 436) (172 998)
Company contribution to venture 179 130 75 139 36 533 1 538 741 (18 436) 227 791
Total liabilities 763 248 – 19 282 (36 872) 54 793
Revenue 84 24 – 740 905 – –
Expenses (292) (7) (35 409) (542 804) (927) (10 448)
Net profit/(loss) (208) 17 (35 409) 198 101 (927) (10 448)
Partners: Pioneer Pioneer Pioneer Pioneer Pioneer Anschutz
45% 45% 45% 40% 45% 22.8%
Forest
53.2%
Nature of project Exploration Exploration Exploration Exploration Exploration Exploration

PAGE 135
Figures in Rand thousand
46. Interest in joint operating agreements (continued)
The Group’s proportionate share in the assets and liabilities of unincorporated joint ventures which are included in the financial statements are as follows: Percentage Holding/Tracts2009 24% 10% 10% 30% 25% 10%R’000 Block 2C Namibia Namibia BLOCK ZAMBEZI F–Q North 1711 3A/4A
Current assets – – – – – –
Current liabilities – – – – – –Retained income (8 877) (1 795) (109 719) (1 928) (172 082) (1 181)Company contribution to venture 8 877 1 795 109 719 1 928 172 082 1 181Total liabilities – – – – – –
Revenue – – – – – –Expenses (6 537) (808) (26 035) (1 294) (51 913) (253)Net profit/(loss) (6 537) (808) (26 035) (1 294) (51 913) (253)
Partners: Anschutz Burlington Sintez BHP Petronas Pioneer 22.8% Resources 70% Billington 42.5% 45% 75% 60% Forest Mitsui Energulf Sasol PetroBras 53.2% 15% 10% 10% 17% Namcor 7% ENH 15% Kunene Energy %
Nature of project Exploration Exploration Exploration Exploration Exploration Exploration
2009 55%R’000 SCG Capex Production facilities 2 687 159Current assets 28 923Total Assets 2 716 082
Current liabilities 5 194Company contribution to venture 2 710 888Total liabilities 2 716 082
Revenue –Expenses –Net profit/(loss) –
Partners: Pioneer 45%Nature of project Production
Notes to the AnnualFinancial StatementFor the year ended 31 March 2010
PAGE 136 CEF (PTY) LTD ANNUAL REPORT 2010
Notes to the AnnualFinancial StatementFor the year ended 31 March 2010
46. Interest in joint operating agreements (continued)
Joint venture with Statoil ASAThe company has entered into a 37.5% joint venture with Statoil ASA, the Norwegian State Oil company, and Lurgi to develop GTLFisher
Tropsch technology and to explore and develop GTL opportunities in Iran and elsewhere. The PetroSA share of assets amounts to R325 million
(2009: R321 million) at year end.
Joint venture with PioneerPetroSA has a production sharing agreement with Pioneer for the South Coast Gas field production. The holding is 55:45 respectively.

PAGE 137
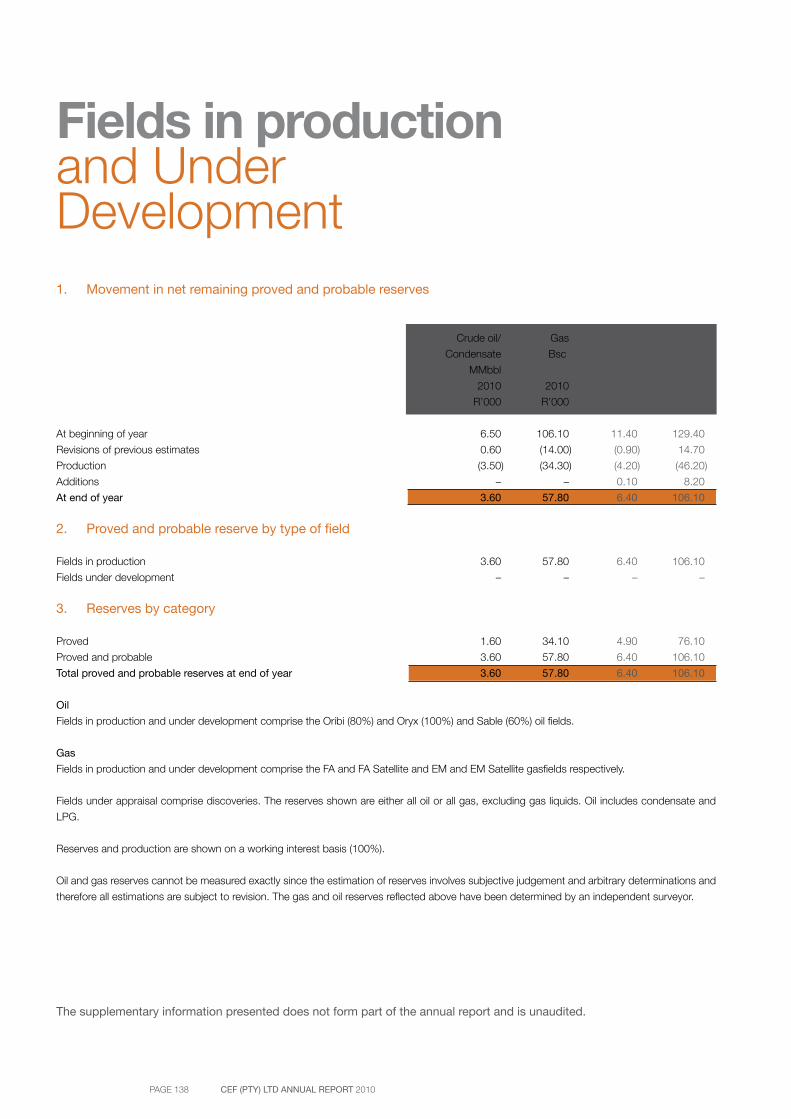
PAGE 138 CEF (PTY) LTD ANNUAL REPORT 2010
Fields in productionand UnderDevelopment1. Movement in net remaining proved and probable reserves
Crude oil/ Gas Crude/oil Gas
Condensate Bscf Condensate Bscf
MMbbl MMbbl
2010 2010 2009 2009
R’000 R’000 R’000 R’000
At beginning of year 6.50 106.10 11.40 129.40
Revisions of previous estimates 0.60 (14.00) (0.90) 14.70
Production (3.50) (34.30) (4.20) (46.20)
Additions – – 0.10 8.20
At end of year 3.60 57.80 6.40 106.10
2. Proved and probable reserve by type of field
Fields in production 3.60 57.80 6.40 106.10
Fields under development – – – –
3. Reserves by category
Proved 1.60 34.10 4.90 76.10
Proved and probable 3.60 57.80 6.40 106.10
Total proved and probable reserves at end of year 3.60 57.80 6.40 106.10
Oil
Fields in production and under development comprise the Oribi (80%) and Oryx (100%) and Sable (60%) oil fields.
Gas
Fields in production and under development comprise the FA and FA Satellite and EM and EM Satellite gasfields respectively.
Fields under appraisal comprise discoveries. The reserves shown are either all oil or all gas, excluding gas liquids. Oil includes condensate and
LPG.
Reserves and production are shown on a working interest basis (100%).
Oil and gas reserves cannot be measured exactly since the estimation of reserves involves subjective judgement and arbitrary determinations and
therefore all estimations are subject to revision. The gas and oil reserves reflected above have been determined by an independent surveyor.
The supplementary information presented does not form part of the annual report and is unaudited.
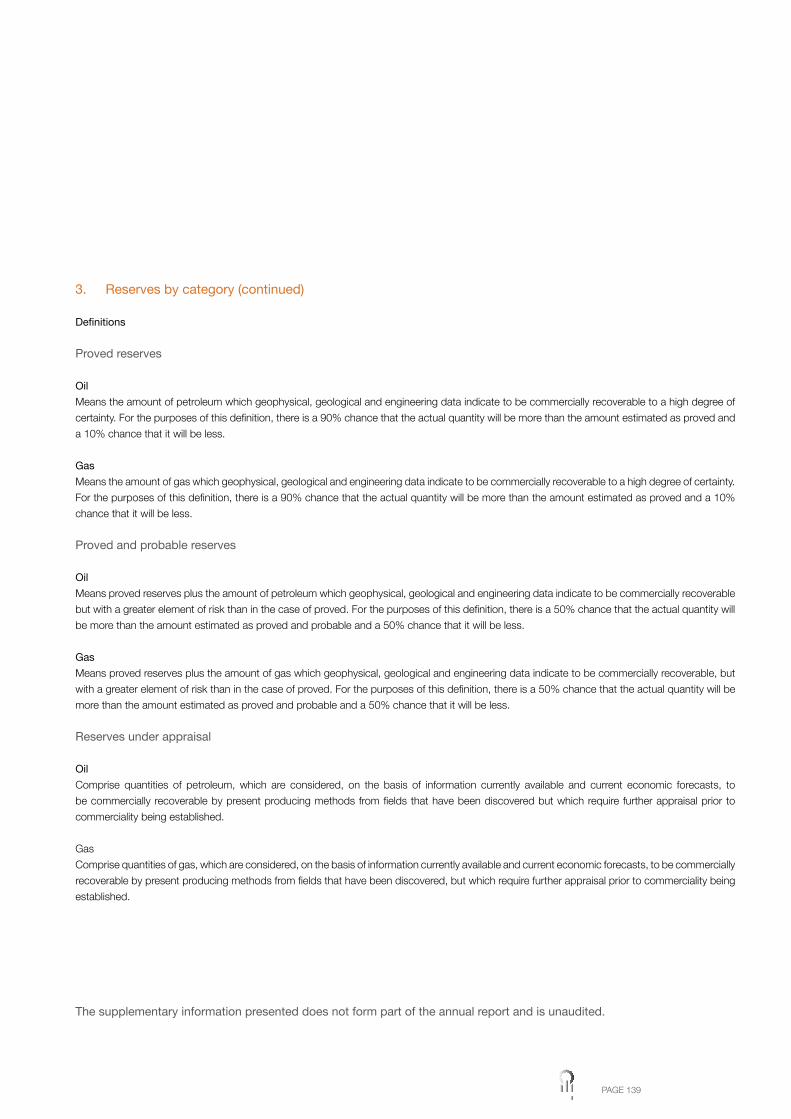
PAGE 139
3. Reserves by category (continued)
Definitions
Proved reserves
Oil
Means the amount of petroleum which geophysical, geological and engineering data indicate to be commercially recoverable to a high degree of
certainty. For the purposes of this definition, there is a 90% chance that the actual quantity will be more than the amount estimated as proved and
a 10% chance that it will be less.
Gas
Means the amount of gas which geophysical, geological and engineering data indicate to be commercially recoverable to a high degree of certainty.
For the purposes of this definition, there is a 90% chance that the actual quantity will be more than the amount estimated as proved and a 10%
chance that it will be less.
Proved and probable reserves
Oil
Means proved reserves plus the amount of petroleum which geophysical, geological and engineering data indicate to be commercially recoverable
but with a greater element of risk than in the case of proved. For the purposes of this definition, there is a 50% chance that the actual quantity will
be more than the amount estimated as proved and probable and a 50% chance that it will be less.
Gas
Means proved reserves plus the amount of gas which geophysical, geological and engineering data indicate to be commercially recoverable, but
with a greater element of risk than in the case of proved. For the purposes of this definition, there is a 50% chance that the actual quantity will be
more than the amount estimated as proved and probable and a 50% chance that it will be less.
Reserves under appraisal
Oil
Comprise quantities of petroleum, which are considered, on the basis of information currently available and current economic forecasts, to
be commercially recoverable by present producing methods from fields that have been discovered but which require further appraisal prior to
commerciality being established.
Gas
Comprise quantities of gas, which are considered, on the basis of information currently available and current economic forecasts, to be commercially
recoverable by present producing methods from fields that have been discovered, but which require further appraisal prior to commerciality being
established.
The supplementary information presented does not form part of the annual report and is unaudited.
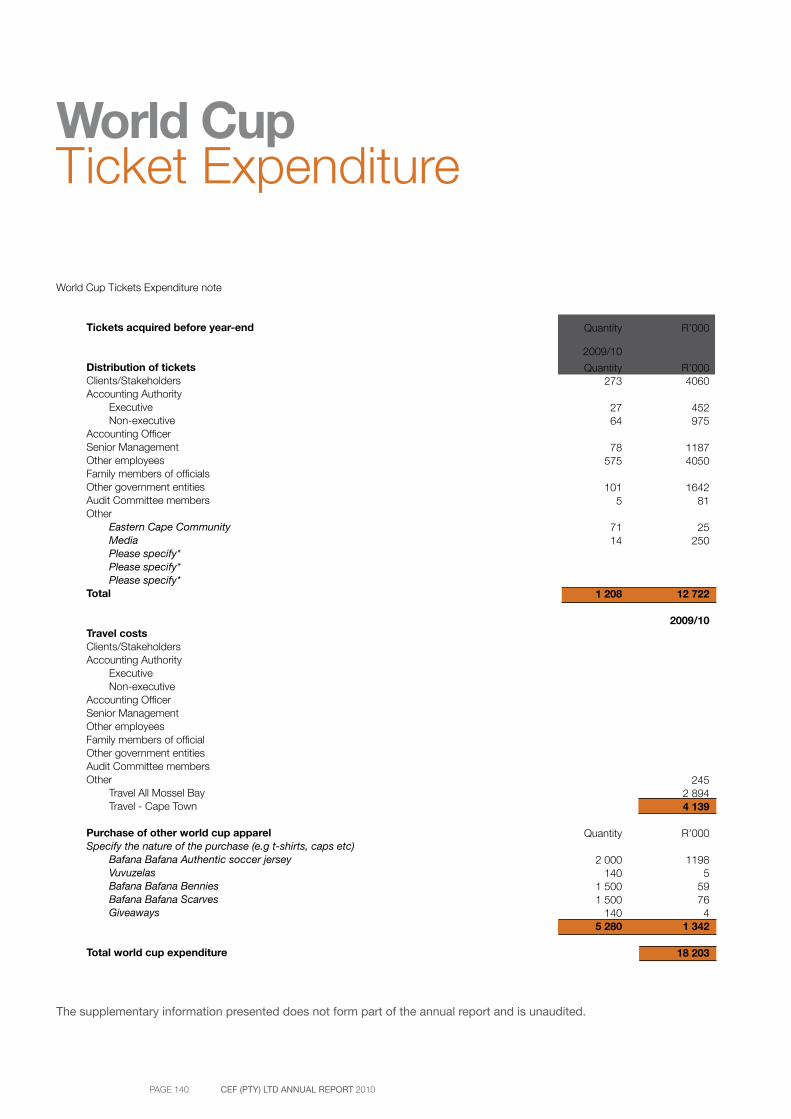
PAGE 140 CEF (PTY) LTD ANNUAL REPORT 2010
World CupTicket Expenditure
World Cup Tickets Expenditure note Tickets acquired before year-end
Distribution of tickets Clients/Stakeholders Accounting Authority Executive Non-executive Accounting Officer Senior Management Other employees Family members of officials Other government entities Audit Committee members Other Eastern Cape Community Media Please specify* Please specify* Please specify* Total
Travel costs Clients/Stakeholders Accounting Authority Executive Non-executive Accounting Officer Senior Management Other employees Family members of official Other government entities Audit Committee members Other Travel All Mossel Bay Travel - Cape Town
Purchase of other world cup apparel Specify the nature of the purchase (e.g t-shirts, caps etc) Bafana Bafana Authentic soccer jersey Vuvuzelas Bafana Bafana Bennies Bafana Bafana Scarves Giveaways
Total world cup expenditure
2009/10
Quantity R’000
Quantity273
2764
78575
1015
7114
1 208
Quantity
2 000140
1 5001 500
1405 280
R’0004060
452975
11874050
164281
25250
12 722
2009/10
2452 8944 139
R’000
11985
59764
1 342
18 203
The supplementary information presented does not form part of the annual report and is unaudited.
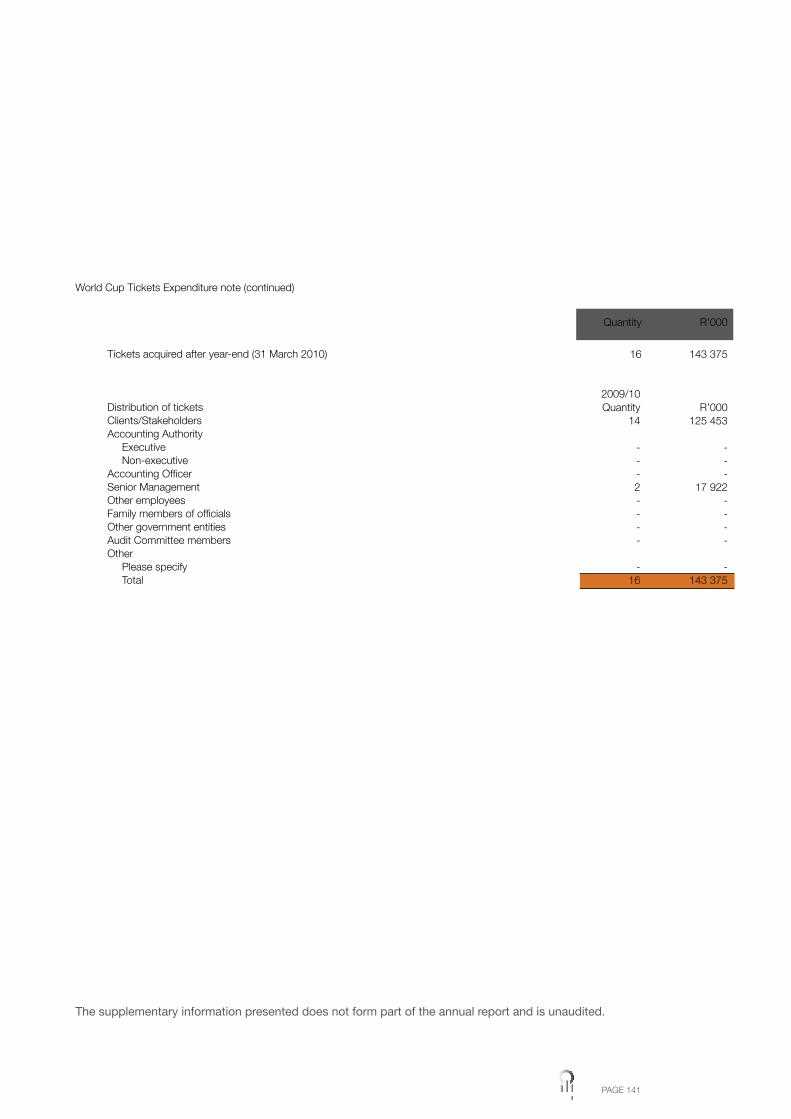
PAGE 141
World Cup Tickets Expenditure note (continued)
Tickets acquired after year-end (31 March 2010)
Distribution of tickets Clients/Stakeholders Accounting Authority Executive Non-executive Accounting Officer Senior Management Other employees Family members of officials Other government entities Audit Committee members Other Please specify Total
2009/10
Quantity
16
R’000
143 375
Quantity14
---2----
-16
R’000125 453
---
17 922----
-143 375
The supplementary information presented does not form part of the annual report and is unaudited.

PAGE 142 CEF (PTY) LTD ANNUAL REPORT 2010
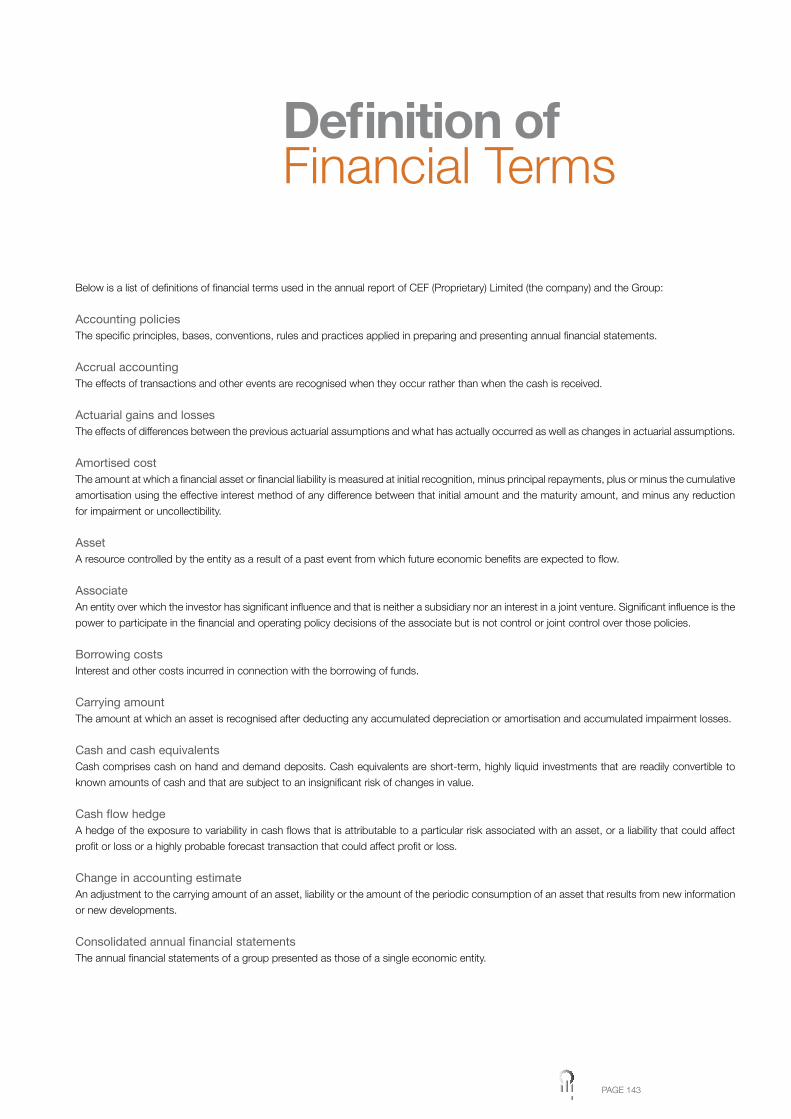
PAGE 143
Definition ofFinancial Terms
Below is a list of definitions of financial terms used in the annual report of CEF (Proprietary) Limited (the company) and the Group:
Accounting policiesThe specific principles, bases, conventions, rules and practices applied in preparing and presenting annual financial statements.
Accrual accountingThe effects of transactions and other events are recognised when they occur rather than when the cash is received.
Actuarial gains and lossesThe effects of differences between the previous actuarial assumptions and what has actually occurred as well as changes in actuarial assumptions.
Amortised costThe amount at which a financial asset or financial liability is measured at initial recognition, minus principal repayments, plus or minus the cumulative
amortisation using the effective interest method of any difference between that initial amount and the maturity amount, and minus any reduction
for impairment or uncollectibility.
AssetA resource controlled by the entity as a result of a past event from which future economic benefits are expected to flow.
AssociateAn entity over which the investor has significant influence and that is neither a subsidiary nor an interest in a joint venture. Significant influence is the
power to participate in the financial and operating policy decisions of the associate but is not control or joint control over those policies.
Borrowing costsInterest and other costs incurred in connection with the borrowing of funds.
Carrying amountThe amount at which an asset is recognised after deducting any accumulated depreciation or amortisation and accumulated impairment losses.
Cash and cash equivalentsCash comprises cash on hand and demand deposits. Cash equivalents are short-term, highly liquid investments that are readily convertible to
known amounts of cash and that are subject to an insignificant risk of changes in value.
Cash flow hedgeA hedge of the exposure to variability in cash flows that is attributable to a particular risk associated with an asset, or a liability that could affect
profit or loss or a highly probable forecast transaction that could affect profit or loss.
Change in accounting estimateAn adjustment to the carrying amount of an asset, liability or the amount of the periodic consumption of an asset that results from new information
or new developments.
Consolidated annual financial statementsThe annual financial statements of a group presented as those of a single economic entity.
PAGE 144 CEF (PTY) LTD ANNUAL REPORT 2010
Contingent assetA possible asset that arises from past events and whose existence will be confirmed only by the occurrence or nonoccurrence of one or more
uncertain future events not wholly within the control of the entity.
Contingent liabilityA possible obligation that arises from past events and whose existence will be confirmed only by the occurrence or nonoccurrence of one or more
uncertain future events not wholly within the control of the entity, or a present obligation that arises from past events but is not recognised because
it is not probable that an outflow of resources embodying economic benefits will be required to settle the obligation, or the amount of the obligation
cannot be measured with sufficient reliability.
Date of transactionThe date on which the transaction first qualifies for recognition in accordance with Generally Accepted Accounting Practice.
Depreciation (or amortisation)The systematic allocation of the depreciable amount of an asset over its useful life. The depreciable amount of an asset is the cost of an asset, or
other amount substituted for cost, less its residual value.
DerecognitionThe removal of a previously recognised asset or liability from the balance sheet.
DerivativeA financial instrument whose value changes in response to an underlying item, requires no initial or little net investment in relation to other types of
contracts that would be expected to have a similar response to changes in market factors and is settled at a future date.
DevelopmentThe application of research findings or other knowledge to a plan or design for the production of new or substantially improved materials, devices,
products, processes, systems or services before starting commercial production or use.
Discontinued operationA component that has either been disposed of or is classified as held for sale and represents a separate major line of business or geographical
area of operations, or is part of a single coordinated plan to dispose of a separate major line of business or geographical area of operation, or a
subsidiary acquired exclusively with a view to resale.
Employee benefitsAll forms of consideration (excluding share options granted to employees) given in exchange for services rendered by employees.
Equity instrumentA contract or certificate that evidences a residual interest in the total assets after deducting the total liabilities.
Equity methodA method in which the investment is initially recognised at cost and adjusted thereafter for the post-acquisition change in the share of net assets
of the investee. Profit or loss includes the share of the profit or loss of the investee.
ExpensesThe decreases in economic benefits in the form of outflows or depletions of assets or incurrence’s of liabilities that result in decreases in equity,
other than those relating to distributions to equity participants.

PAGE 145
Fair valueThe amount for which an asset could be exchanged or a liability settled, between knowledgeable and willing parties in an arm’s length transaction.
Fair value hedgeA hedge of exposure to changes in fair value of a recognised asset, liability or firm commitment.
Finance leaseA lease that transfers substantially all the risks and rewards incidental to ownership of an asset. Title may or may not eventually be transferred.
Financial asset or liability at fair value through profit or lossA financial asset or financial liability that is classified as held for trading or is designated as such on initial recognition other than investments in
equity instruments that do not have a quoted market price in an active market and whose fair value cannot be reliably measured.
Financial instrumentA contract that gives rise to a financial asset of one entity and a financial liability or equity instrument of another entity.
Financial riskThe risk of a possible future change in one or more of a specified interest rate, financial instrument price, commodity price, foreign exchange rate,
index of prices or rates, credit rating or credit index or other variable, provided in the case of a non-financial variable that the variable is not specific
to a party to the contract.
Firm commitmentA binding agreement for the exchange of a specified quantity of resources at a specified price on a specified future date or dates.
Forecast transactionAn uncommitted but anticipated future transaction.
Going concern basisThe assumption that the entity will continue in operation for the foreseeable future.
Gross investment in leaseThe aggregate of the minimum lease payments receivable by the lessor under a finance lease and any unguaranteed residual value accruing to
the lessor.
Hedged itemAn asset, liability, firm commitment, highly probable forecast transaction or net investment in a foreign operation that exposes the entity to risk of
changes in fair value or future cash flows and is designated as being hedged.
Hedging instrumentA designated derivative or non-derivative financial asset or non-derivative financial liability whose fair value or cash flows are expected to offset
changes in the fair value or cash flows of a designated hedged item.
Hedge effectivenessThe degree to which changes in the fair value or cash flows of the hedged item that are attributable to a hedged risk are offset by changes in the
fair value or cash flows of the hedging instrument.
DEFINITION OF FINANCIAL TERMS
PAGE 146 CEF (PTY) LTD ANNUAL REPORT 2010
Held for trading financial asset or financial liabilityOne that is acquired or incurred principally for the purpose of selling or repurchasing it in the near term or as part of a portfolio of identified financial
instruments that are managed together and for which there is evidence of a recent actual pattern of short-term profit-taking or a derivative (except
for a derivative that is a designated and effective hedging instrument).
Held-to-maturity investmentA non-derivative financial asset with fixed or determinable payments and fixed maturity where there is a positive intention and ability to hold it to
maturity.
ImmaterialIf individually or collectively it would not influence the economic decisions of the users of the annual financial statements.
Impairment lossThe amount by which the carrying amount of an asset or a cash-generating unit exceeds its recoverable amount.
ImpracticableApplying a requirement is impracticable when the entity cannot apply it after making every reasonable effort to do so.
IncomeIncrease in economic benefits in the form of inflows or enhancements of assets or decreases in liabilities that result in increases in equity, other than
those relating to contributions from equity participants.
Joint ventureA contractual arrangement whereby two or more parties undertake an economic activity that is subject to joint control.
Key management personnelThose persons having authority and responsibility for planning, directing and controlling the activities of the entity. In terms of this definition, the
members of the Board of directors of CEF (Proprietary) Limited qualify as key management personnel of the Group. In individual companies, the
Board of directors and executive management committees qualify.
Legal obligationAn obligation that derives from a contract, legislation or other operation of law.
LiabilityA present obligation of the entity arising from a past event, the settlement of which is expected to result in an outflow from the entity of resources
embodying economic benefits.
Loans and receivablesNon-derivative financial assets with fixed or determinable payments that are not quoted in an active market.
Minimum lease paymentsPayments over the lease term that the lessee is or can be required to make, excluding contingent rent, costs for services and taxes to be paid by
and reimbursed to the lessor including in the case of a lessee, any amounts guaranteed by the lessee or by a party related to the lessee or in the
case of a lessor, any residual value guaranteed to the lessor by the lessee, a party related to the lessee or a third party unrelated to the lessor that
is financially capable of discharging the obligations under the guarantee.
PAGE 147
Net assetsNet operating assets plus cash and cash equivalents.
Operating leaseAny lease other than a finance lease.
Owner-occupied propertyProperty held by the owner or by the lessee under a finance lease for use in the production or supply of goods or services or for administrative
purposes.
Past service costThe increase or decrease in the present value of the defined benefit obligation for employee service in prior periods resulting from the introduction
of, or changes to, post-employment benefits or other long-term employee benefits.
Post-employment benefitsEmployee benefits (other than termination benefits) that are payable after the completion of employment.
Post-employment benefit plansFormal or informal arrangements under which an entity provides post-employment benefits to employees. Defined contribution benefit plans are
where there are no legal or constructive obligations to pay further contributions if the fund does not hold sufficient assets to pay all employee
benefits relating to employee service in the current and prior periods. Defined benefit plans are post-employment benefit plans other than defined
contribution plans.
Presentation currencyThe currency in which the annual financial statements are presented.
Prior period errorAn omission from or misstatement in the annual financial statements for one or more prior periods arising from a failure to use, or misuse of, reliable
information that was available when annual financial statements for those periods were authorised for issue and could reasonably be expected to
have been obtained and taken into account in the preparation of those annual financial statements.
Prospective applicationApplying a new accounting policy to transactions, other events and conditions occurring after the date the policy changed or recognising the effect
of the change in an accounting estimate in the current and future periods.
Recoverable amountThe higher of an asset’s or cash-generating unit’s fair value less costs to sell and its value in use.
ResearchThe original and planned investigation undertaken with the prospect of gaining new scientific or technical knowledge and understanding.
Residual valueThe estimated amount which an entity would currently obtain from disposal of the asset, after deducting the estimated costs of disposal, if the
asset were already of the age and in the condition expected at the end of its useful life.
DEFINITION OF FINANCIAL TERMS
PAGE 148 CEF (PTY) LTD ANNUAL REPORT 2010
RestructuringA programme that is planned and controlled by management, and materially changes either the scope of a business undertaken by an entity or
the manner in which that business is conducted.
Retrospective applicationApplying a new accounting policy to transactions, other events and conditions as if that policy had always been applied.
Retrospective restatementCorrecting the recognition, measurement and disclosure of amounts as if a prior period error had never occurred.
Tax baseThe tax base of an asset is the amount that is deductible for tax purposes if the economic benefits from the asset are taxable or is the carrying
amount of the asset if the economic benefits are not taxable. The tax base of a liability is the carrying amount of the liability less the amount
deductible in respect of that liability in future periods. The tax base of revenue received in advance is the carrying amount less any amount of the
revenue that will not be taxed in future periods.
Temporary differencesThe differences between the carrying amount of an asset or liability and its tax base.
Transaction costsIncremental costs that are directly attributable to the acquisition, issue or disposal of a financial asset or financial liability, ie. those that would not
have been incurred if the entity had not acquired, issued or disposed of the financial instrument.
Useful lifeThe period over which an asset is expected to be available for use or the number of production or similar units expected to be obtained from the
asset.
DEFINITION OF FINANCIAL TERMS
CE
F (P
ty) L
td
201
0 A
nnua
l Rep
ort
VALUES Energy is a key driver of Africa’s economy and CEF’s vision is to be the leader in Africa in energy.
Country of incorporation and domicileSouth Africa
Nature of business and principal activities The financing and promotion of the acquisition
of, research into and exploitation of energy
related products and technology.
DirectorsMs B Mabuza
Mr M Damane
Ms N Magubane
Adv L Makatini
Dr P Molefe
Ms T Ramuedzisi (alternate)
Mr J Rocha
Dr Z Rustomjee
Mr Y Tenza
Registered officeBlock C, Upper Grayston Office Park
152 Ann Crescent
Strathavon
Sandton
2199
Business addressBlock C, Upper Grayston Office Park
152 Ann Crescent
Strathavon
Sandton
2199
Postal addressP O Box 786141
Sandton
2146
BankersABSA Bank Ltd
Sandton Branch
AuditorsAuditor-General of South Africa
Company SecretaryMr A Haffejee
Company registration no.1976/001441/07
CEF (Pty) Ltd
Postal AddressPO Box 786141
Sandton
2146
Physical AddressCEF House, Block C,
Upper Grayston Office Park,
152 Ann Crescent, Strathavon,
Sandton, 2031.
Johannesburg
South Africa
Tel: 010 201 4700
Fax: 010 201 4820
www.cefgroup.co.za
COMPANY INFORMATION
Related Documents