Defining great customer experience. Q409 Institutional Investor Presentation 1 Institutional Investor Presentation • Q4 2009 Forward Looking Statements Caution Regarding Forward-Looking Statements Bank of Montreal’s public communications often include written or oral forward-looking statements. Statements of this type are included in this document, and may be included in other filings with Canadian securities regulators or the U.S. Securities and Exchange Commission, or in other communications. All such statements are made pursuant to the safe harbour provisions of, and are intended to be forward-looking statements under, the United States Private Securities Litigation Reform Act of 1995 and any applicable Canadian securities legislation. Forward-looking statements may involve, but are not limited to, comments with respect to our objectives and priorities for 2009 and beyond, our strategies or future actions, our targets, expectations for our financial condition or share price, and the results of or outlook for our operations or for the Canadian and U.S. economies. By their nature, forward-looking statements require us to make assumptions and are subject to inherent risks and uncertainties. There is significant risk that predictions, forecasts, conclusions or projections will not prove to be accurate, that our assumptions may not be correct and that actual results may differ materially from such predictions, forecasts, conclusions or projections. We caution readers of this document not to place undue reliance on our forward-looking statements as a number of factors could cause actual future results, conditions, actions or events to differ materially from the targets, expectations, estimates or intentions expressed in the forward-looking statements. The future outcomes that relate to forward-looking statements may be influenced by many factors, including but not limited to: general economic and market conditions in the countries in which we operate; interest rate and currency value fluctuations; changes in monetary policy; the degree of competition in the geographic and business areas in which we operate; changes in laws; judicial or regulatory proceedings; the accuracy and completeness of the information we obtain with respect to our customers and counterparties; our ability to execute our strategic plans and to complete and integrate acquisitions; critical accounting estimates; operational and infrastructure risks; general political conditions; global capital market activities; the possible effects on our business of war or terrorist activities; disease or illness that impacts on local, national or international economies; disruptions to public infrastructure, such as transportation, communications, power or water supply; and technological changes. We caution that the foregoing list is not exhaustive of all possible factors. Other factors could adversely affect our results. For more information, please see the discussion on pages 30 and 31 of the BMO 2008 Annual Report, which outlines in detail certain key factors that may affect our future results. When relying on forward-looking statements to make decisions with respect to Bank of Montreal, investors and others should carefully consider these factors, as well as other uncertainties and potential events, and the inherent uncertainty of forward-looking statements. Bank of Montreal does not undertake to update any forward-looking statement, whether written or oral, that may be made, from time to time, by the organization or on its behalf, except as required by law. The forward-looking information contained in this document is presented for the purpose of assisting our shareholders in understanding our financial position as at and for the periods ended on the dates presented and our strategic priorities and objectives, and may not be appropriate for other purposes. Assumptions about the level of asset sales, expected asset sale prices, net funding cost, credit quality and risk of default and losses on default of the underlying assets of the structured investment vehicles were material factors we considered when establishing our expectations regarding the structured investment vehicles discussed in this document, including the amount to be drawn under the BMO liquidity facilities and the expectation that the first-loss protection provided by the subordinate capital notes will exceed future losses. Key assumptions included that assets would continue to be sold with a view to reducing the size of the structured investment vehicles, under various asset price scenarios, and that the level of defaults and losses will be consistent with the credit quality of the underlying assets and our current expectations regarding challenging market conditions continuing. Assumptions about the level of defaults and losses on defaults were material factors we considered when establishing our expectation of the future performance of the transactions that Apex Trust has entered into. Key assumptions included that the level of defaults and losses on defaults would be consistent with historical experience. Material factors that were taken into account when establishing our expectations of the future risk of credit losses in Apex Trust and risk of loss to BMO included industry diversification in the portfolio, initial credit quality by portfolio, the first-loss protection incorporated into the structure and the hedges that BMO has entered into. Assumptions about the performance of the Canadian and U.S. economies as well as overall market conditions and their combined effect on the bank’s business, including those described under the heading Economic Outlook in our Fourth Quarter 2009 Report to Shareholders, are material factors we consider when determining our strategic priorities, objectives and expectations for our business. In determining our expectations for economic growth, both broadly and in the financial services sector, we primarily consider historical economic data provided by the Canadian and U.S. governments and their agencies.

Welcome message from author
This document is posted to help you gain knowledge. Please leave a comment to let me know what you think about it! Share it to your friends and learn new things together.
Transcript
Defining great customer experience.Q409
Institutional Investor Presentation
1Institutional Investor Presentation • Q4 2009
Forward Looking StatementsCaution Regarding Forward-Looking Statements
Bank of Montreal’s public communications often include written or oral forward-looking statements. Statements of this type are included in this document, and may be included in other filings with Canadian securities regulators or the U.S. Securities and Exchange Commission, or in other communications. All such statements are made pursuant to the safe harbour provisions of, and are intended to be forward-looking statements under, the United States Private Securities Litigation Reform Act of 1995 and any applicable Canadian securities legislation. Forward-looking statements may involve, but are not limited to, comments with respect to our objectives and priorities for 2009 and beyond, our strategies or future actions, our targets, expectations for our financial condition or share price, and the results of or outlook for our operations or for the Canadian and U.S. economies.
By their nature, forward-looking statements require us to make assumptions and are subject to inherent risks and uncertainties. There is significant risk that predictions, forecasts, conclusions or projections will not prove to be accurate, that our assumptions may not be correct and that actual results may differ materially from such predictions, forecasts, conclusions or projections. We caution readers of this document not to place undue reliance on our forward-looking statements as a number of factors could cause actual future results, conditions, actions or events to differ materially from the targets, expectations, estimates or intentions expressed in the forward-looking statements.
The future outcomes that relate to forward-looking statements may be influenced by many factors, including but not limited to: general economic and market conditions in the countries in which we operate; interest rate and currency value fluctuations; changes in monetary policy; the degree of competition in the geographic and business areas in which we operate; changes in laws; judicial or regulatory proceedings; the accuracy and completeness of the information we obtain with respect to our customers and counterparties; our ability to execute our strategic plans and to complete and integrate acquisitions; critical accounting estimates; operational and infrastructure risks; general political conditions; global capital market activities; the possible effects on our business of war or terrorist activities; disease or illness that impacts on local, national or international economies; disruptions to public infrastructure, such as transportation, communications, power or water supply; and technological changes.
We caution that the foregoing list is not exhaustive of all possible factors. Other factors could adversely affect our results. For more information, please see the discussion on pages 30 and 31 of the BMO 2008 Annual Report, which outlines in detail certain key factors that may affect our future results. When relying on forward-looking statements to make decisions with respect to Bank of Montreal, investors and others should carefully consider these factors, as well as other uncertainties and potential events, and the inherent uncertainty of forward-looking statements. Bank of Montreal does not undertake to update any forward-looking statement, whether written or oral, that may be made, from time to time, by the organization or on its behalf, except as required by law. The forward-looking information contained in this document is presented for the purpose of assisting our shareholders in understanding our financial position as at and for the periods ended on the dates presented and our strategic priorities and objectives, and may not be appropriate for other purposes.
Assumptions about the level of asset sales, expected asset sale prices, net funding cost, credit quality and risk of default and losses on default of the underlying assets of the structured investment vehicles were material factors we considered when establishing our expectations regarding the structured investment vehicles discussed in this document, including the amount to be drawn under the BMO liquidity facilities and the expectation that the first-loss protection provided by the subordinate capital notes will exceed future losses. Key assumptions included that assets would continue to be sold with a view to reducing the size of the structured investment vehicles, under various asset price scenarios, and that the level of defaults and losses will be consistent with the credit quality of the underlying assets and our current expectations regarding challenging market conditions continuing.
Assumptions about the level of defaults and losses on defaults were material factors we considered when establishing our expectation of the future performance of the transactions that Apex Trust has entered into. Key assumptions included that the level of defaults and losses on defaults would be consistent with historical experience. Material factors that were taken into account when establishing our expectations of the future risk of credit losses in Apex Trust and risk of loss to BMO included industry diversification in the portfolio, initial credit quality by portfolio, the first-loss protection incorporated into the structure and the hedges that BMO has entered into.
Assumptions about the performance of the Canadian and U.S. economies as well as overall market conditions and their combined effect on the bank’s business, including those described under the heading Economic Outlook in our Fourth Quarter 2009 Report to Shareholders, are material factors we consider when determining our strategic priorities, objectives and expectations for our business. In determining our expectations for economic growth, both broadly and in the financial services sector, we primarily consider historical economic data provided by the Canadian and U.S. governments and their agencies.

2Institutional Investor Presentation • Q4 2009
Other Reporting MattersCaution Regarding Non-GAAP Measures
Bank of Montreal uses both GAAP and non-GAAP measures to assess performance. Readers are cautioned that earnings and other measures adjusted to a basis other than GAAP do not have standardized meanings under GAAP and are unlikely to be comparable to similar measures used by other companies.
Reconciliations of GAAP to non-GAAP measures as well as the rationale for their use can be found in Bank of Montreal’s Fourth Quarter 2009 Report to Shareholders and 2008 Annual Report to Shareholders all of which are available on our website at www.bmo.com/investorrelations.
Non-GAAP results or measures include: revenue presented on a taxable equivalent basis; amounts presented net of applicable taxes; cash earnings per share; cash operating leverage results; measures that use taxable equivalent basis (teb) amounts; cash-based profitability and operating ratios; net economic profit and results and measures that exclude items that are not considered reflective of ongoing operations. For example, core measures and results which exclude the impact of Visa litigation accruals, impaired loans and acquisition integration costs as well as results and measures presented on a basis that exclude the impact of capital market environment charges. Bank of Montreal provides supplemental information on combined business segments to facilitate comparisons to peers.
3Institutional Investor Presentation • Q4 2009
F2009 Average AssetsC$439 billion (US$3771 billion)
F2009 Net IncomeC$1.8 billion (US$1.51 billion)
F2009 Tier 1 Capital Ratio12.24%
# of Employees36,000
Bank of Montreal (BMO Financial Group)
4th largest bank in Canada measured by total assets as at October 31, 2009100% ownership of Chicago-based Harris Bank
1 Balances reported in Canadian dollars. F2009 average exchange rate: Cdn/U.S. $1.1648As at October 31, 2009 the exchange rate: Cdn/U.S. $1.0819
ListingsNYSE, TSX (Ticker: BMO)
Share Price Oct 31/09: NYSE – US$46.37
TSX – C$50.06
Market CapOct 31/09: C$28 billion (US$26 billion)
(Fiscal Year-end)

4Institutional Investor Presentation • Q4 2009
Reasons to Invest in BMOClear growth strategy
Consistent and focused North American growth strategyStrong Canadian and U.S. customer baseGrowing global presence to support our customersCommitment to our medium-term financial objectives
Strong financial positionBalanced approach to capital managementTier 1 Capital Ratio of 12.24% at October 31, 2009Tangible common equity to risk-weighted assets ratio of 9.21% at October 31, 2009Strong senior debt ratings
Proactive risk managementIndependent risk oversight across the enterpriseDisciplined credit risk management capabilities and processesGroup and individual performance assessments that reflect risk-adjusted returns and align with shareholder interests
Commitment to stakeholdersClear brand promise that delivers real benefit for customersEngaged employees committed to exceeding customers’ expectationsFinancial performance and consistent dividend payment track recordStrategic approach to corporate responsibility and sustainability
1.85
2.26
2.71 2.80 2.80
2005 2006 2007 2008 2009
Annual Dividend Declared (C$/share)
24.1
(5.8)
(27.9)
25.1
3.7
2005 2006 2007 2008 2009
Twelve Month Average Total Shareholder Return (%)
CAGR = 12.0%
5Institutional Investor Presentation • Q4 2009
2.80
0.660.74 0.82 0.88 0.94 1.00
1.121.20
1.341.59
1.85
2.26
2.712.80 2.80
2.51
2.512.51
2.30
1.951.72
1.45
1.151.060.96
0.53 0.59 0.63 0.71 0.74 0.84
95 96 97 98 99 00 01 02 03 04 05 06 07 08 09 10
Annual Dividends Declared Per Share (C$)
Annual Dividend
CAGR = 10.1%BMO 15-Year2
Target Payout Ratio
45% - 55%
BMOCanadian peer group average
1
1
1Estimate based on the assumption that current dividend level continues for the rest of the year2CAGR based on dividends declared 1995 - 2010
6Institutional Investor Presentation • Q4 2009
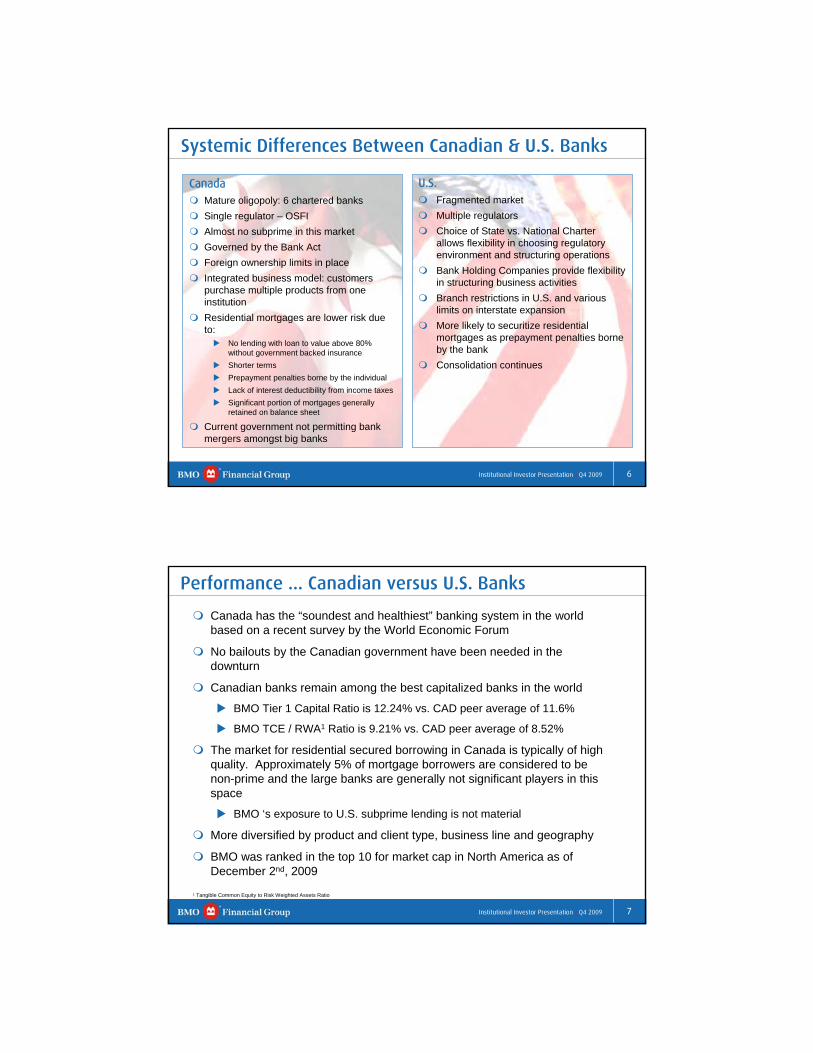
U.S.Fragmented marketMultiple regulators Choice of State vs. National Charter allows flexibility in choosing regulatory environment and structuring operationsBank Holding Companies provide flexibility in structuring business activitiesBranch restrictions in U.S. and various limits on interstate expansionMore likely to securitize residential mortgages as prepayment penalties borne by the bankConsolidation continues
CanadaMature oligopoly: 6 chartered banksSingle regulator – OSFIAlmost no subprime in this marketGoverned by the Bank ActForeign ownership limits in placeIntegrated business model: customers purchase multiple products from one institutionResidential mortgages are lower risk due to:
No lending with loan to value above 80% without government backed insuranceShorter termsPrepayment penalties borne by the individual Lack of interest deductibility from income taxesSignificant portion of mortgages generally retained on balance sheet
Current government not permitting bank mergers amongst big banks
Systemic Differences Between Canadian & U.S. Banks
7Institutional Investor Presentation • Q4 2009
Canada has the “soundest and healthiest” banking system in the world based on a recent survey by the World Economic Forum
No bailouts by the Canadian government have been needed in the downturn
Canadian banks remain among the best capitalized banks in the world
BMO Tier 1 Capital Ratio is 12.24% vs. CAD peer average of 11.6%
BMO TCE / RWA1 Ratio is 9.21% vs. CAD peer average of 8.52%
The market for residential secured borrowing in Canada is typically of high quality. Approximately 5% of mortgage borrowers are considered to be non-prime and the large banks are generally not significant players in this space
BMO ‘s exposure to U.S. subprime lending is not material
More diversified by product and client type, business line and geography
BMO was ranked in the top 10 for market cap in North America as of December 2nd, 2009
Performance ... Canadian versus U.S. Banks
1 Tangible Common Equity to Risk Weighted Assets Ratio

8Institutional Investor Presentation • Q4 2009
Canadians in Better Financial Shape
0.6
0.7
0.8
0.9
1.0
1.1
1.2
1995 1996 1998 2000 2002 2003 2005 2007 2009
3.6
4.0
4.4
4.8
5.2
5.6
6.0
1995 1996 1998 2000 2002 2003 2005 2007 200938
45
52
59
66
73
80
1995 1996 1998 2000 2002 2003 2005 2007 2009
Household Debt1
(ratio to personal income)
Canada
US
US
Canada
Tech. Stock Bubble
HousingBubble
Net Worth(ratio to personal income)
Canada
US
Homeowner Equity(% of real estate values)
1Household Debt = Mortgage and Consumer Credit Only
Source: Statistics Canada, US Federal Reserve, US Bureau of Economic Analysis*As of December 4, 2009
9Institutional Investor Presentation • Q4 2009
-40
-20
0
20
40
60
2000 2001 2002 2004 2005 2006 2008 2009
-20
-10
0
10
20
2000 2001 2002 2004 2005 2006 2008 2009
Sales
Prices
Housing Market Stabilizing … Turning UpExisting Homes (Y/Y % change; 3 month moving average)
The housing market seems to have found a floor in North America
The market in Canada has demonstrated resilience through the downturn
Month-over-month housing prices increasing in U.S. with Chicago growing faster than national average1
Canada
US
Canada
US1Case-Shiller: September 2009Source: Canadian Real Estate Association, National Association of Realtors
*As of December 4, 2009

10Institutional Investor Presentation • Q4 2009
Soft Recovery in a Low Interest Rate Environment
-8
-6
-4
-2
0
2
4
6
2005 2006 2007 2008 2009 2010 2011
0
1
2
3
4
5
6
2004 2005 2006 2007 2008 2009 2011
2.5
2.6
10
3.2-2.50.4US
3.6-2.50.4Canada
110908
Forecast
Canada
US
Real GPD(Q/Q % change: annualized rate)
Canadian Interest Rates(%: as of December 4, 2009)
Forecast
10-year Bond
Overnight Rate
3.26%
0.25%
A soft recovery and subdued inflation will support a low interest rate environment for an extended period
Recession Ending, Moderate Recovery Beginning
Source: Statistics Canada, US Bureau of Economic Analysis, Bank of Canada, US Federal Reserve*As of December 4, 2009
11Institutional Investor Presentation • Q4 2009
Economic Outlook
* Outlook as at December 4, 2009
Canada
The economy is turning up after a three-quarter recession, with modest growth in Q3 and an expected stronger performance in Q4. Record-low interest rates and unprecedented fiscal stimulus are fostering the recovery. We expect the expansion to gain traction in the year ahead.
The housing market continues to strengthen due to record-low mortgage rates and improving consumer confidence, and should remain healthy well into next year amid low interest rates.
Consumer spending is strengthening, and business investment has turned higher.
The Bank of Canada is expected to keep interest rates near zero until the middle of 2010 because of low inflation and relatively high unemployment.
The Canadian dollar is expected to strengthen towards parity with the U.S. dollar in 2010 as a result of firmer commodity prices and general weakness in the greenback.
U.S.
The economy is growing moderately after the worst recession in seven decades, supported by aggressive monetary policy and fiscal stimulus programs. The recovery is expected to continue in 2010, albeit at a subdued rate as consumers rebuild savings.
The housing market is recovering and prices are stabilizing after a three-year slump.
The Fed is expected to keep rates near zero until next fall to encourage a durable recovery.

12Institutional Investor Presentation • Q4 2009
Economy … Recession Over
Sources: BMO Economics, Haver Analytics
1Annual average*Forecasts as of December 4, 2009
EurozoneUnited StatesCanada
(10.4)(11.2)(3.2)(2.8)(3.7)(0.4)Budget Surplus / GDP
(3.0)(3.1)(4.9)(3.2)(2.9)0.5Current Account Balance / GDP
10.69.47.610.09.35.88.58.36.1Unemployment Rate
1.21.24.60.30.21.40.60.32.3Interest Rate (3mth Tbills)1
0.31.7(0.6)(0.2)2.70.13.0Private Consumption Growth
1.60.33.32.1(0.4)3.81.50.32.4Inflation
1.6(3.9)0.52.5(2.5)0.42.6(2.5)0.4GDP Growth
2010E2009E20082010E2009E20082010E2009E2008Economic Indicators (%)
13Institutional Investor Presentation • Q4 2009
How BMO is Differentiating to Drive Performance & Growth
Our Customer CultureStreamlining processes to ensure we deliver extraordinary value to our customers and take away complexity
Brand is compelling because it promises a differentiated experience
Excellence in PerformanceManaging our people, processes and assets across the enterprise for productivity
Our culture emphasizes results, customer focus, accountability and leadership development
Building Leadership in Risk Management Making investments in our risk management capabilities, assessing performance based on risk-adjusted returns to ensure that the risks we assume are being appropriately rewarded and are generating shareholder returns
Customer Pace Growth

14Institutional Investor Presentation • Q4 2009
1
BMO’s Strategic Priorities
Maximize earnings growth across all North American personal and commercial banking businesses, focusing on industry-leading customer experience and sales force productivity.
2Accelerate the growth in our wealth management business by providing our clients with exceptional advice, emphasizing retirement and financial planning.
3Deliver strong, stable returns in our capital markets businessby providing highly targeted solutions to our core clients, everywhere we compete, from a single integrated platform.
4 Grow our business in select global markets to meet our customers’ expanding needs.
5 Sustain a culture that focuses on customers, high performance and our people.
15Institutional Investor Presentation • Q4 2009
U.S. Growth Potential
Chicago is the hub of Midwest region
Population base of 60 million people, almost double that of Canada’s population
GDP of $2.6 trillion U.S.
Harris is a well known brand in the attractive U.S. Midwest market
Uniquely positioned between smaller community banks and larger network banks
New opportunities for organic growth due to the erosion of big network banks in the Midwest
Current market conditions may provide opportunities
Minnesota
Wisconsin
Michigan
OhioIndianaIllinois
Missouri
Iowa
16Institutional Investor Presentation • Q4 2009
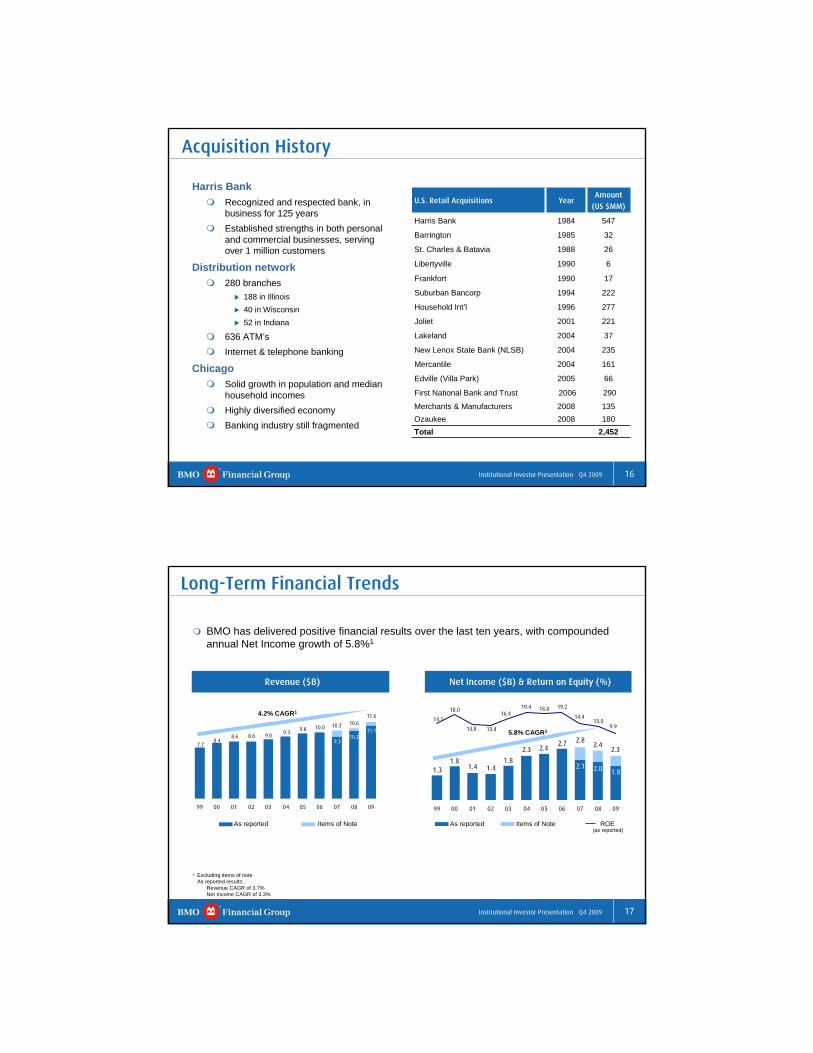
Acquisition History
U.S. Retail Acquisitions YearAmount
(US $MM)
Harris Bank 1984 547
Barrington 1985 32
St. Charles & Batavia 1988 26
Libertyville 1990 6
Frankfort 1990 17
Suburban Bancorp 1994 222
Household Int’l 1996 277
Joliet 2001 221
Lakeland 2004 37
New Lenox State Bank (NLSB) 2004 235
Mercantile 2004 161
Edville (Villa Park) 2005 66
First National Bank and Trust 2006 290
Merchants & Manufacturers 2008 135Ozaukee 2008 180Total 2,452
Harris BankRecognized and respected bank, in business for 125 yearsEstablished strengths in both personal and commercial businesses, serving over 1 million customers
Distribution network280 branches
188 in Illinois40 in Wisconsin52 in Indiana
636 ATM’sInternet & telephone banking
ChicagoSolid growth in population and median household incomesHighly diversified economyBanking industry still fragmented
17Institutional Investor Presentation • Q4 2009
As reported Items of Note
Long-Term Financial Trends
11.110.2
9.3
10.09.89.3
9.08.68.68.4
7.7
11.610.610.3
99 00 01 02 03 04 05 06 07 08 09
Revenue ($B) Net Income ($B) & Return on Equity (%)
BMO has delivered positive financial results over the last ten years, with compounded annual Net Income growth of 5.8%1
4.2% CAGR1
1.82.02.1
2.72.42.3
1.81.41.4
1.81.3
2.32.4
2.8
14.1
18.0
13.8 13.4
16.419.4 18.8 19.2
14.413.0
9.9
99 00 01 02 03 04 05 06 07 08 09
5.8% CAGR1
As reported Items of Note ROE(as reported)
1 Excluding items of noteAs reported results:
Revenue CAGR of 3.7%Net Income CAGR of 3.3%

18Institutional Investor Presentation • Q4 2009
2.402.66
2.131.98
1.79
2.77
2.402.26
2005 2006 2007 2008 2009
9.9
13.014.4
19.218.8 18.816.0
12.7
2005 2006 2007 2008 2009
Fiscal 2009 Financial Highlights
Net Income $1.8 billion, ROE 9.9% (as reported)
Excluding items of note1
Net Income $2.3 billion
ROE 12.7%
Results reflect strength and diversity of core business in challenging market ROE (%)
Net Income ($B)
1 Items of note include: F2007: Commodities losses, capital markets environment charges, increase to the general allowance, and
restructuring chargesF2008: Capital markets environment charges and increase to the general allowanceF2009: Capital markets environment charges, severance costs and increase to the general allowance
As reported Items of Note
19Institutional Investor Presentation • Q4 2009
PCG $2,012
17% P&C
$6,39654%
BMO CM $3,46629%
Operating Groups
Personal & Commercial Banking (P&C)Over 8 million customers across Canada & the U.S.Almost 1,200 branches in Canada & the U.S.Access to over 2,600 automated banking machines in Canada and the U.S.
Private Client Group (PCG)Full-service and direct investing, private banking, investment productsBMO Life Insurance
BMO Capital Markets (BMO CM)Bulge bracket firm in Canada, mid-market niche player in the U.S.Capital raising, M&A and restructuring advisory servicesIndustry leading research, sales and trading capability
F2009 Revenue by Operating Group (C$MM)
F2009 Net Income by Operating Group (C$MM)
P&C : $ 6,396PCG : $ 2,012CM : $ 3,987Corp : $ (810)
Total$11,874
BMO CM $1,06036%
P&C $1,501
51%
PCG $381, 13%
Total$2,942
Revenues Excluding Items of
Note ($MM)1
P&C : $1,501PCG : $ 381CM : $ 1,415Corp : $ (1,036)
Net Income Excluding Items of
Note ($MM)1
1 Items of note include capital markets environment charges in BMO CM, as well as a severance costs and increase to the general allowance in the corporate segment
* BMO employs a methodology for segmented reporting purposes whereby expected credit losses are charged to the operating groups quarterly based on their share of expected credit losses. The difference between quarterly charges based on expected losses and required quarterly provisions based on actual losses, as well as changes in the general allowance are charged (or credited) to Corporate Services.

20Institutional Investor Presentation • Q4 2009
Highlights of BMO in Canada F2009 Non-U.S. Operating Group Revenue (C$MM)Large, full service universal bank
BMO continues to rank 2nd in business banking market share for business loans $5MM and below
Strong performance in combined Personal & Commercial (P&C) / Private Client Group (PCG) businesses
BMO Capital Markets (BMO CM) Ranked Top Overall Equity Research Team in Canada for the 29th consecutive year
BMO InvestorLine was recognized as Canada’s best of the bank-owned brokerages by The Globe and Mail in 2009
F2009 Non-U.S. Operating Group Net Income (C$MM)
PCG $390, 17%
P&C $1,392
61%
BMO CM $50822%
Total$2,290
PCG $1,771
20%
P&C $5,263
60%BMO CM $1,70020%
Total$8,734
P&C : $ 5,263PCG : $ 1,771CM : $ 2,221Corp : $ (490)
P&C : $ 1,392PCG : $ 390CM : $ 863Corp : $ (318)
Revenues Excluding Items of
Note ($MM)1
Net Income Excluding Items of
Note ($MM)1
1 Items of note include capital markets environment charges in BMO CM, as well as a severance costs and increase to the general allowance in the corporate segment
* BMO employs a methodology for segmented reporting purposes whereby expected credit losses are charged to the operating groups quarterly based on their share of expected credit losses. The difference between quarterly charges based on expected losses and required quarterly provisions based on actual losses, as well as changes in the general allowance are charged (or credited) to Corporate Services.
21Institutional Investor Presentation • Q4 2009
Our Presence in the U.S. F2009 U.S. Operating
Group Revenue (US$MM)
F2009 U.S. Operating Group Net Income2 (US$MM)
Personal & Commercial (P&C)Brand image and reputationWell-positioned branch distribution and accessStrong sales management & marketing capabilitiesSuperior risk management capabilitiesStrong customer orientation and culture
PCG $208, 8%
P&C $97336%BMO CM
$1,50556%
Total$2,686
P&C $9417%
BMO CM $46483%
Total$558
P&C : $ 973PCG : $ 208CM : $ 1,505Corp : $ (265)
P&C : $ 94PCG : $ (7)CM : $ 464Corp : $ (611)
Net IncomeExcluding Items of Note ($US MM)1
Revenues Excluding Items of Note ($US MM)1
1 Items of note includes severance costs and increase to the general allowance in the corporate segment2 PCG had a net loss of US$7MM as reported for F2009* BMO employs a methodology for segmented reporting purposes whereby expected credit losses are charged to
the operating groups quarterly based on their share of expected credit losses. The difference between quarterly charges based on expected losses and required quarterly provisions based on actual losses, as well as changes in the general allowance are charged (or credited) to Corporate Services.
Private Client Group (PCG)Industry-recognized leadership in client serviceHigh retention, strong product offeringStrategic presence in select high-growth wealth management markets Harris distribution and brand
BMO Capital Markets (BMO CM)Attractive client base, strong long-term relationshipsPrimary focus on mid-marketFull service, integrated investment & corporate bankCross-border capabilitiesSector specialtiesTop-tier equity research capabilitiesStrong position in the municipal bond market

22Institutional Investor Presentation • Q4 2009
Strong fourth quarter results with 6% revenue growth and effective expense managementP&C Canada continues to deliver strong revenue growth of 8%, net income growth of 22% and improvement in competitive positionTier 1 capital ratio remains strong
F2009
Q4 09
12.24%$1,603MM1.3%9.9%$3.14$3.081,787MM
8.3%
Cash Operating Leverage
12.24%
Tier 1 Capital Ratio
(Basel II)
Net Income EPS Cash
EPS ROETotal PCL1
$647MM $1.11 $1.13 14.0% $386MM
Financial Highlights
Strengths
ChallengesContinued market environment pressures
1 F2009 includes a charge to the general allowance of $60MM in Q3 09
23Institutional Investor Presentation • Q4 2009
Well-Diversified Business
F2009 Revenue by Operating Group (C$MM)
Over 70% of revenues from retail businesses in Canada and the US (P&C and PCG)
Total 11,874MM
P&C (Personal & Commercial)54%
BMO CM (Investment Banking)29%
PCG (Wealth Management) 17%
Canada - Cards, 1,254
P&C US, 1,133
Canada - Personal &
Other,2,478
Canada - Commercial,
1,531
PCG, 2,012
Trading Products,
1,983
Inv & Corp Banking and
Other,1,483

24Institutional Investor Presentation • Q4 2009
Group PerformanceNet IncomeRevenue
1,787
(1,155)
1,060
381
1,501
109
1,392
F2009
9,349
(323)
1,969
2,162
5,541
908
4,633
F2007
10,205
(249)
2,440
2,146
5,868
990
4,878
F2008As Reported ($MM)
F2009 F09/F08B/(W)
F2007 F2008 F09/F08B/(W)
P&C Canada 5,263 8% 1,148 1,209 15%
P&C U.S. 1,133 14% 116 96 14%
Total P&C 6,396 9% 1,264 1,305 15%
PCG 2,012 (6)% 528 452 (16)%
BMO Capital Markets 3,466 42% 417 711 49%
Corporate Services (810) (+100)% (78) (490) (+100)%
Total Bank 11,064 8% 2,131 1,978 (10)%
Net IncomeRevenue
2,261
(1,036)
1,415
381
1,501
109
1,392
F2009
10,296
(323)
2,916
2,162
5,541
908
4,633
F2007
10,593
(249)
2,828
2,146
5,868
990
4,878
F2008Excl. Notable Items ($MM)
F2009 F09/F08B/(W)
F2007 F2008 F09/F08B/(W)
P&C Canada 5,263 8% 1,148 1,209 15%
P&C U.S. 1,133 14% 116 96 14%
Total P&C 6,396 9% 1,264 1,305 15%
PCG 2,012 (6)% 528 452 (16)%
BMO Capital Markets 3,987 41% 918 971 46%
Corporate Services (810) (+100)% 58 (324) (+100)%
Total Bank 11,585 9% 2,768 2,404 (6)%
* BMO employs a methodology for segmented reporting purposes whereby expected credit losses are charged to the operating groups quarterly based on their share of expected credit losses. The difference between quarterly charges based on expected losses and required quarterly provisions based on actual losses, as well as changes in the general allowance are charged (or credited) to Corporate Services.
25Institutional Investor Presentation • Q4 2009
Group Net Income
560
(150)
290
84
336
12
324
Q4 08
225
(369)
179
73
342
34
308
Q1 09As Reported ($MM)
Q2 09 Q3 09 Q4 09 Q/Q B/(W)
Y/Y B/(W)
P&C Canada 334 356 394 11% 22%
P&C U.S. 25 25 25 - +100%
Total P&C 359 381 419 10% 25%
PCG 78 120 110 (7)% 32%
BMO Capital Markets 249 343 289 (16)% (1)%
Corporate Services (328) (287) (171) 41% (14)%
Total Bank 358 557 647 16% 16%
nm – not meaningful
685
(52)
298
103
336
12
324
Q4 08
584
(369)
527
84
342
34
308
Q1 09Excluding Items of Note ($MM)
Q2 09 Q3 09 Q4 09 Q/Q B/(W)
Y/Y B/(W)
P&C Canada 334 356 394 11% 22%
P&C U.S. 25 25 25 - +100%
Total P&C 359 381 419 10% 25%
PCG 78 120 110 (7)% 7%
BMO Capital Markets 329 343 289 (16)% (3)%
Corporate Services (248) (248) (171) 31% nm
Total Bank 518 596 647 9% (6)%
* BMO employs a methodology for segmented reporting purposes whereby expected credit losses are charged to the operating groups quarterly based on their share of expected credit losses. The difference between quarterly charges based on expected losses and required quarterly provisions based on actual losses, as well as changes in the general allowance are charged (or credited) to Corporate Services.

26Institutional Investor Presentation • Q4 2009
0.43%
0.0
0.2
0.4
0.6
0.8
1.0
1.2
1.4
1.6
1.8
91 92 93 94 95 96 97 98 99 00 01 02 03 04 05 06 07 08 09
BMO Cdn Competitors Weighted Average
Historical Average (BMO)* Historical Cdn Competitors' Average
Credit Performance Measure
Specific PCL as a % of Average Net Loans and Acceptances
(excluding Reverse Repos)
0.85%
0.61%
Perc
ent
BMO’s Canadian competitors include: BNS, CM, NA, RY, TD Competitor average excludes the impact of TD’s sectoral provisions
* Historical avg.: 1991 to 2009
0.720.85F2009
0.610.43Historical avg.*
0.400.61F2008
Canadian CompetitorsBMO
High 1.69%Low 1.16%
High 1.24%Low 0.64%
0.72%
Historical Specific PCL average
27Institutional Investor Presentation • Q4 2009
Loan Portfolio Distribution
Commercial Mortgages Commercial Real Estate
Construction Retail Trade
Wholesale Trade Agriculture
Communications Manufacturing
Mining Oil & Gas
Transportation Utilities
Forest Products Service Industries
Financial Services Government
Other
Commercial and CorporateGross Loans and Acceptances by Industry ($B)
As at October 31, 2009
100%1701039121Total
20%34101311Corporate
26%44-935Commercial
54%92-1775Total Consumer
2%3--3Cards
27%46-1135Consumer Loans
25%43-637Residential Mortgage
Consumer
TotalOtherU.S.Canada($B)
Total Gross Loans and AcceptancesAs at October 31, 2009

28Institutional Investor Presentation • Q4 2009
1 Based on the riskiest 87 credits defaulting out of a total portfolio of 442 and using conservative recovery rates* As at October 31, 2009 unless noted otherwise
Senior ranked BMO liquidity facility provided to facilitate an orderly windup of each vehicle. It is well protected – has benefit of asset quality and significant subordinated capital beneath it. Links has $866MM (12% of asset B/V) subordinated capital (B/V); this percentage is higher for Parkland.
Strategy to sell assets in an “orderly” manner unchanged – actual sales slowed since last year given illiquid market conditions.
Asset quality remains strong – 91%/92% of Links assets (by market value) are investment grade by Moody’s/S&P; 51% rated Aa3 or better by Moody’s, 47% rated AA- or better by S&P. Parkland has a greater percentage of highly rated assets. Portfolio mix largely unchanged.
Senior Ranked Liquidity Facility stands at US$6.0BN (US$5.8BN funded), and €627MM (€597MM funded) for Links and Parkland respectively. Fair value of assets is US$5.5BN for Links and €631MM for Parkland.
Assuming no asset sales and that assets are repaid as anticipated the Liquidity Facility drawn amount is forecast to be US$5.2BN and €542MM as at 31/10/10 and US$1.3BN and €68MM by 31/10/13.
Fair value of assets impacted by market illiquidity; has exhibited some recovery over the quarter.
Sales and asset maturities generated B/V reductions of:
Links – US$442MM sales, US$277MM maturitiesParkland - €10MM sales, €11MM maturities
Credit Protection Vehicle & Structured Investment Vehicle Update
The vehicle has 12 tranches of diversified credit pools, each with first loss protection in place.
In Q3 and Q4 we put in place hedges that result in BMO’s residual risk of loss being modest:
During the third quarter we entered into a transaction that hedges the first $515MM of losses on our committed exposure under the senior funding facility.
During the fourth quarter we entered into a transaction that hedges our $815MM of exposure to the Notes.
Cumulative default rate would need to exceed ~18% for BMO to have realized loss given hedges.1
The likelihood of losses exceeding the level of protection provided by the hedges is considered remote given the level of first-loss protection on the tranches and the strength of the underlying credits with over 70% rated investment grade.
Significant first loss protection on all but two tranches (with hedges BMO has essentially no exposure to credit losses in these tranches).
The attachment point on the weakest tranche of $875MM is 3.2%; the second weakest tranche of $342MM has an attachment point of 10.4%. BMO’s effective ~$450MM exposure to these tranches is fully hedged. Approximately $8B in 7 tranches have attachment points between 13% and 15%; the remaining $12B in 3 tranches have attachment points greater than 23%.
Credit Protection VehicleRisk of realized loss is considered remote.
Structured Investment VehiclesBook Value of Subordinated Capital Notes exceeds future expected losses.
29Institutional Investor Presentation • Q4 2009
Liquidity and Funding Strategy
Additional Sources:Securitization: Mortgages (Canada Mortgage Bond participation and MBS) and Credit Card ABS ($3bn shelf)Canadian & US Senior (unsecured) deposits
Liquidity Ratio (%) Core Deposits (in billions)
31.929.1
33.1
27.226.526.0
2004 2005 2006 2007 2008 2009
73.4 72.3 73.3 75.9 85.8 95.4
23.4 22.6 22.4 25.1
32.827.7
2004 2005 2006 2007 2008 2009
Canadian $ US$ and other currency in US$
Programs: Current program size:EMTN Program: US$20bnCanadian MTN Program: $6bn Covered Bond Program: €7bnUS Program: US$6bn
BMO's has access to diversified funding sources, including:
BMO’s large base of core and customer deposits, along with our strong capital base, reduces reliance on wholesale funding.
Our wholesale funding principles seek to match the term of assets with the term of funding (e.g. to fund loans with longer term funds). In addition, we diversify our sources of funding by market, instrument and term.

30Institutional Investor Presentation • Q4 2009
Wholesale Capital MarketTerm Funding Composition
(Total $64.3B)
As at Oct 31, 2009
Tier 1 Capital
8%
US $ Senior Debt(Issued in Euro &
U.S. Markets)17%
Euro Covered Bond
2%
C$ Senior Debt16%
Diversified Wholesale Term Funding Mix
Tier 2 Capital
8%
Euro SeniorDebt5%
Wholesale Capital Market Term Funding Maturity Profile
(Total $64.3B)
As at Oct 31, 2009
0
2
4
6
8
10
12
14
16
2010 2011 2012 2013 2014 2015 2016 2017 2018 >2018
Term Debt Tier 1 Capital Tier 2 Capital Securitization
Issu
ance
CD
E ($
B)
C$ Mortgage & CreditCard Securitization
44%
Our wholesale funding principles seek to match the term of assets with the term of funding. Loans for example are largely funded with customer deposits and capital, with the difference provided by longer-term wholesale funding.BMO has a well diversified wholesale funding platform across markets, products, terms, currencies and maturities.BMO has largely prefunded its fiscal 2010 wholesale term-funding requirements. Our liquidity position remains sound as reflected by our cash and securities to total asset ratio and level of core deposits.
31Institutional Investor Presentation • Q4 2009
Corporate Governance
Comprehensive code of business conduct and ethics provides a framework for directors, officers and employees on the conduct and ethical decision-making integral to their work
Governance practices are consistent with, and in many cases exceed, requirements of the TSX and NYSE. The Bank is also in compliance with applicable rules adopted by the Canadian Securities Administrators (CSA) and the U.S. Securities and Exchange Commission (SEC) to give effect to the provisions of the Sarbanes-Oxley Act.
To ensure non-employee directors’ compensation is aligned with shareholder interests, at least 50% of the annual retainer must be paid in Common Shares of the Bank or Deferred Share Units
The Globe and Mail’s Board Games 2009 annual review of corporate governance practices ranked BMO 3rd overall among 180 Canadian reporting issuers

32Institutional Investor Presentation • Q4 2009
Recent Sustainability Initiatives
What is BMO doing?Integrating respect for the environment into our business growth strategies and practices by:
Implementing our Clear Blue Skies™ Initiative, which includes our BMO ECO5 Strategy, designed to manage the environmental impact of our operations.
Committing to achieve carbon neutrality for energy consumption and transportation emissions across our enterprise in 2010. By making operational improvements, retrofitting buildings, using technology to reduce travel and raising employee awareness we are working towards this goal.
Being a leader in reducing our non-renewable energy consumption. BMO purchases over 23,800 megawatt hours of emission-free electricity annually from Bullfrog Power, a green electricity retailer that markets energy from clean, renewable sources like wind power and low-impact water power.
Investing $10 million in the new Greening Canada Fund, which provides direct access to credits that offset greenhouse gas emissions.
Introducing two environmentally responsible investment funds; BMO Sustainable Climate Class and BMO Sustainable Opportunities Class.
33Institutional Investor Presentation • Q4 2009
Ongoing Stakeholder Engagement
BMO supports various international environmental initiatives:
Signatory to the United Nations’ UNEP Statement by Financial Institutions on the Environment & Sustainable Development, the Carbon Disclosure Project and The Equator Principles
External recognition for our sustainability efforts:Included in indices that recognize the sustainability performance of companies across economic, social and environmental dimensions (e.g. FTSE4Good Index, Dow Jones Sustainability North America Index and JantziSocial Index)Named as one of the highest scoring companies in the world and the only Canadian bank in the Global 500 Carbon Disclosure Leadership Index for 2009.

Defining great customer experience.Investor Relations Contact Information
E-mail: [email protected]/investorrelations
Fax: 416.867.3367
VIKI LAZARISSenior Vice President416.867.6656 [email protected]
STEVEN BONINDirector416.867.5452 [email protected]
ANDREW CHINSenior Manager416.867.7019 [email protected]
Related Documents