LUXURY HOME MARKET REPORT 2009 MONMOUTH COUNTY, NEW JERSEY PREPARED BY THOMAS MCCORMACK, SALES ASSOCIATE

2009 Monmouth County Luxury Home Market Report
Mar 14, 2016
Report on single-family home sales in Monmouth County NJ with a special emphasis on the luxury market. Includes sales by town, comparison with previous year's stats, top prices paid for watefront homes, new construction and more. Prepared by Thomas McCormack, Sales Associate, Resources Real Estate.
Welcome message from author
This document is posted to help you gain knowledge. Please leave a comment to let me know what you think about it! Share it to your friends and learn new things together.
Transcript

LUXURY HOME MARKET REPORT 2009
M O N M O U T H C O U N T Y , N E W J E R S E Y
PREPARED BY THOMAS MCCORMACK, SALES ASSOCIATE
2009 Luxury Home Market Report: Monmouth County © 2010 Thomas McCormack. All rights reserved. All data provided by Monmouth County Association of Realtors. Information is deemed reliable but not guaranteed.
2
2009 HOME MARKET REPORT: Monmouth County Overview
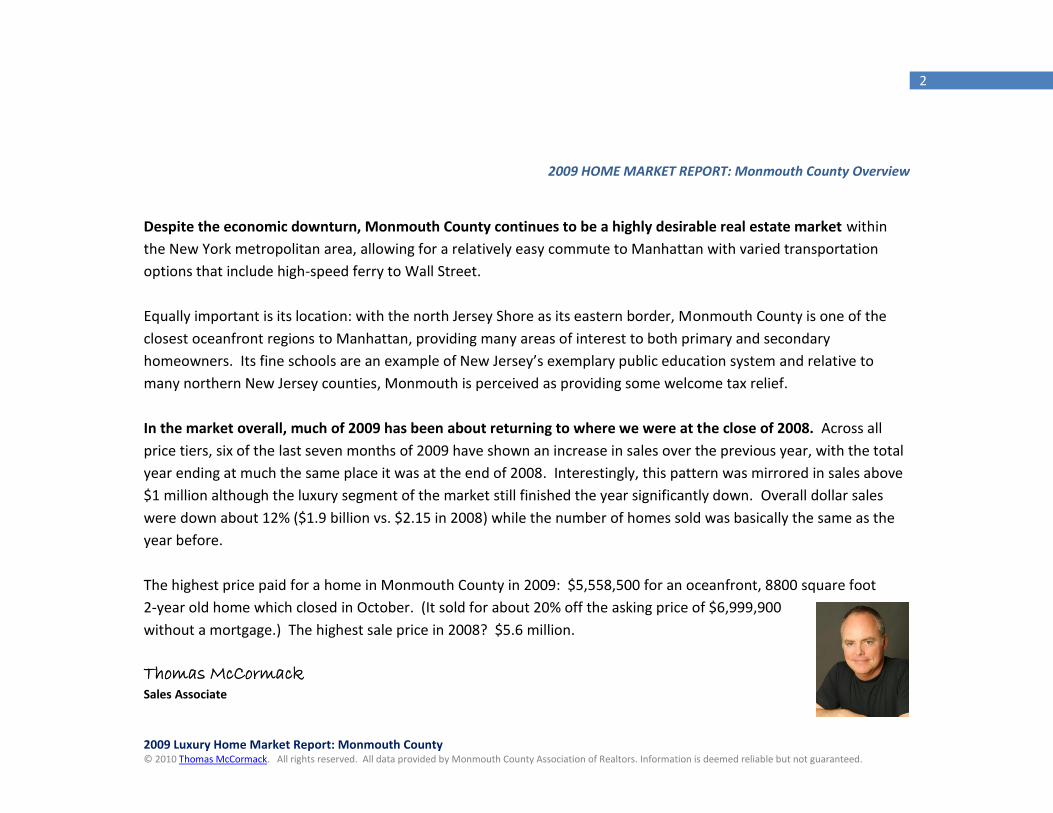
Despite the economic downturn, Monmouth County continues to be a highly desirable real estate market within
the New York metropolitan area, allowing for a relatively easy commute to Manhattan with varied transportation
options that include high-speed ferry to Wall Street.
Equally important is its location: with the north Jersey Shore as its eastern border, Monmouth County is one of the
closest oceanfront regions to Manhattan, providing many areas of interest to both primary and secondary
homeowners. Its fine schools are an example of New Jersey’s exemplary public education system and relative to
many northern New Jersey counties, Monmouth is perceived as providing some welcome tax relief.
In the market overall, much of 2009 has been about returning to where we were at the close of 2008. Across all
price tiers, six of the last seven months of 2009 have shown an increase in sales over the previous year, with the total
year ending at much the same place it was at the end of 2008. Interestingly, this pattern was mirrored in sales above
$1 million although the luxury segment of the market still finished the year significantly down. Overall dollar sales
were down about 12% ($1.9 billion vs. $2.15 in 2008) while the number of homes sold was basically the same as the
year before.
The highest price paid for a home in Monmouth County in 2009: $5,558,500 for an oceanfront, 8800 square foot
2-year old home which closed in October. (It sold for about 20% off the asking price of $6,999,900
without a mortgage.) The highest sale price in 2008? $5.6 million.
Thomas McCormack Sales Associate
2009 Luxury Home Market Report: Monmouth County © 2010 Thomas McCormack. All rights reserved. All data provided by Monmouth County Association of Realtors. Information is deemed reliable but not guaranteed.
3
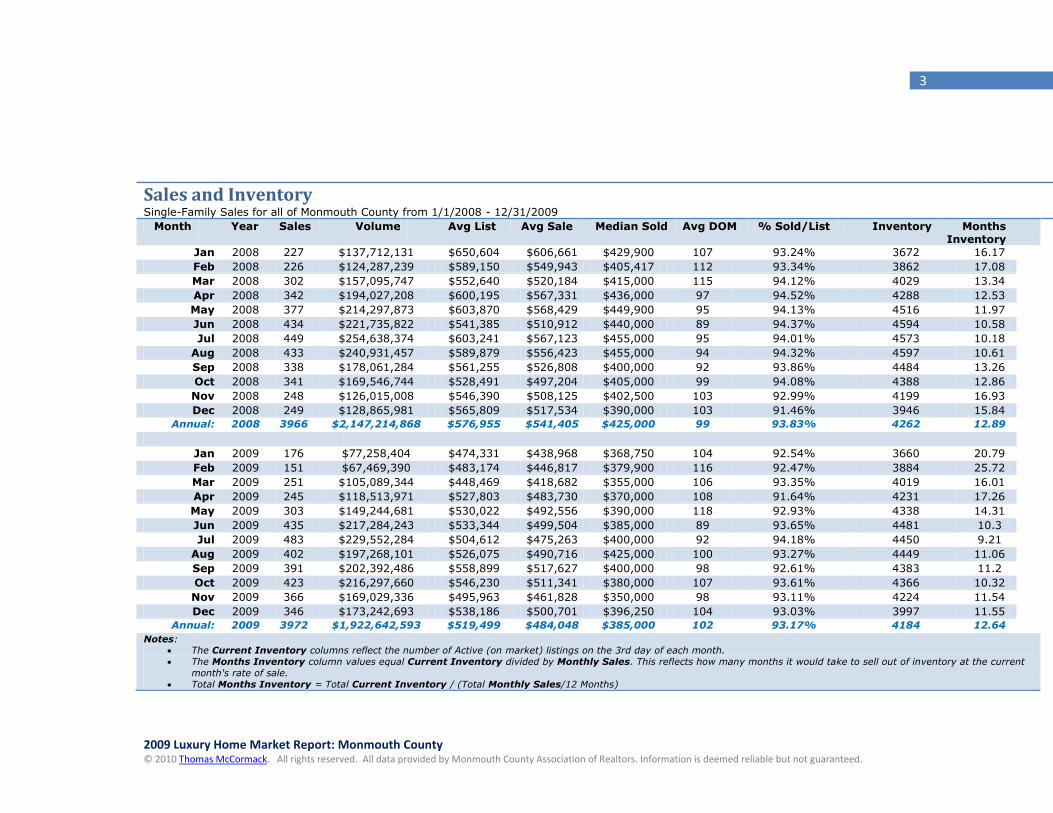
Sales and Inventory Single-Family Sales for all of Monmouth County from 1/1/2008 - 12/31/2009
Month Year Sales Volume Avg List Avg Sale Median Sold Avg DOM % Sold/List Inventory Months Inventory
Jan 2008 227 $137,712,131 $650,604 $606,661 $429,900 107 93.24% 3672 16.17
Feb 2008 226 $124,287,239 $589,150 $549,943 $405,417 112 93.34% 3862 17.08
Mar 2008 302 $157,095,747 $552,640 $520,184 $415,000 115 94.12% 4029 13.34
Apr 2008 342 $194,027,208 $600,195 $567,331 $436,000 97 94.52% 4288 12.53
May 2008 377 $214,297,873 $603,870 $568,429 $449,900 95 94.13% 4516 11.97
Jun 2008 434 $221,735,822 $541,385 $510,912 $440,000 89 94.37% 4594 10.58
Jul 2008 449 $254,638,374 $603,241 $567,123 $455,000 95 94.01% 4573 10.18
Aug 2008 433 $240,931,457 $589,879 $556,423 $455,000 94 94.32% 4597 10.61
Sep 2008 338 $178,061,284 $561,255 $526,808 $400,000 92 93.86% 4484 13.26
Oct 2008 341 $169,546,744 $528,491 $497,204 $405,000 99 94.08% 4388 12.86
Nov 2008 248 $126,015,008 $546,390 $508,125 $402,500 103 92.99% 4199 16.93
Dec 2008 249 $128,865,981 $565,809 $517,534 $390,000 103 91.46% 3946 15.84
Annual: 2008 3966 $2,147,214,868 $576,955 $541,405 $425,000 99 93.83% 4262 12.89
Jan 2009 176 $77,258,404 $474,331 $438,968 $368,750 104 92.54% 3660 20.79
Feb 2009 151 $67,469,390 $483,174 $446,817 $379,900 116 92.47% 3884 25.72
Mar 2009 251 $105,089,344 $448,469 $418,682 $355,000 106 93.35% 4019 16.01
Apr 2009 245 $118,513,971 $527,803 $483,730 $370,000 108 91.64% 4231 17.26
May 2009 303 $149,244,681 $530,022 $492,556 $390,000 118 92.93% 4338 14.31
Jun 2009 435 $217,284,243 $533,344 $499,504 $385,000 89 93.65% 4481 10.3
Jul 2009 483 $229,552,284 $504,612 $475,263 $400,000 92 94.18% 4450 9.21
Aug 2009 402 $197,268,101 $526,075 $490,716 $425,000 100 93.27% 4449 11.06
Sep 2009 391 $202,392,486 $558,899 $517,627 $400,000 98 92.61% 4383 11.2
Oct 2009 423 $216,297,660 $546,230 $511,341 $380,000 107 93.61% 4366 10.32
Nov 2009 366 $169,029,336 $495,963 $461,828 $350,000 98 93.11% 4224 11.54
Dec 2009 346 $173,242,693 $538,186 $500,701 $396,250 104 93.03% 3997 11.55
Annual: 2009 3972 $1,922,642,593 $519,499 $484,048 $385,000 102 93.17% 4184 12.64
Notes: The Current Inventory columns reflect the number of Active (on market) listings on the 3rd day of each month.
The Months Inventory column values equal Current Inventory divided by Monthly Sales. This reflects how many months it would take to sell out of inventory at the current
month's rate of sale.
Total Months Inventory = Total Current Inventory / (Total Monthly Sales/12 Months)

2009 Luxury Home Market Report: Monmouth County © 2010 Thomas McCormack. All rights reserved. All data provided by Monmouth County Association of Realtors. Information is deemed reliable but not guaranteed.
4
Unit Sales: 2009 vs 2008 percentage differential JAN FEB MAR APR MAY JUN JUL AUG SEP OCT NOV DEC TOTAL
2009 176 151 251 245 303 435 483 402 390 424 362 94 3716
2008 227 226 302 342 377 434 449 433 338 341 248 74 3791 % Change: -22.46% -33.18% -16.88% -28.36% -19.62% 0.23% 7.57% -7.15% 15.38% 24.34% 45.96% 27.02% -1.98%
0200400600
JAN FEB MAR APR MAY JUN JUL AUG SEP OCT NOV DEC
2009 176 151 251 245 303 435 483 402 391 423 366 346
2008 227 226 302 342 377 434 449 433 338 341 248 249
Unit Sales: 2009 vs 2008
The first half of the year reflected the mood of the overall economy with significant sales decreases relative to 2008, ending the period flat in June. Unit Sales were higher than the previous year during 6 of the last 7 months of 2009 ending the year at about 2% under the previous year.
2009 Luxury Home Market Report: Monmouth County © 2010 Thomas McCormack. All rights reserved. All data provided by Monmouth County Association of Realtors. Information is deemed reliable but not guaranteed.
5
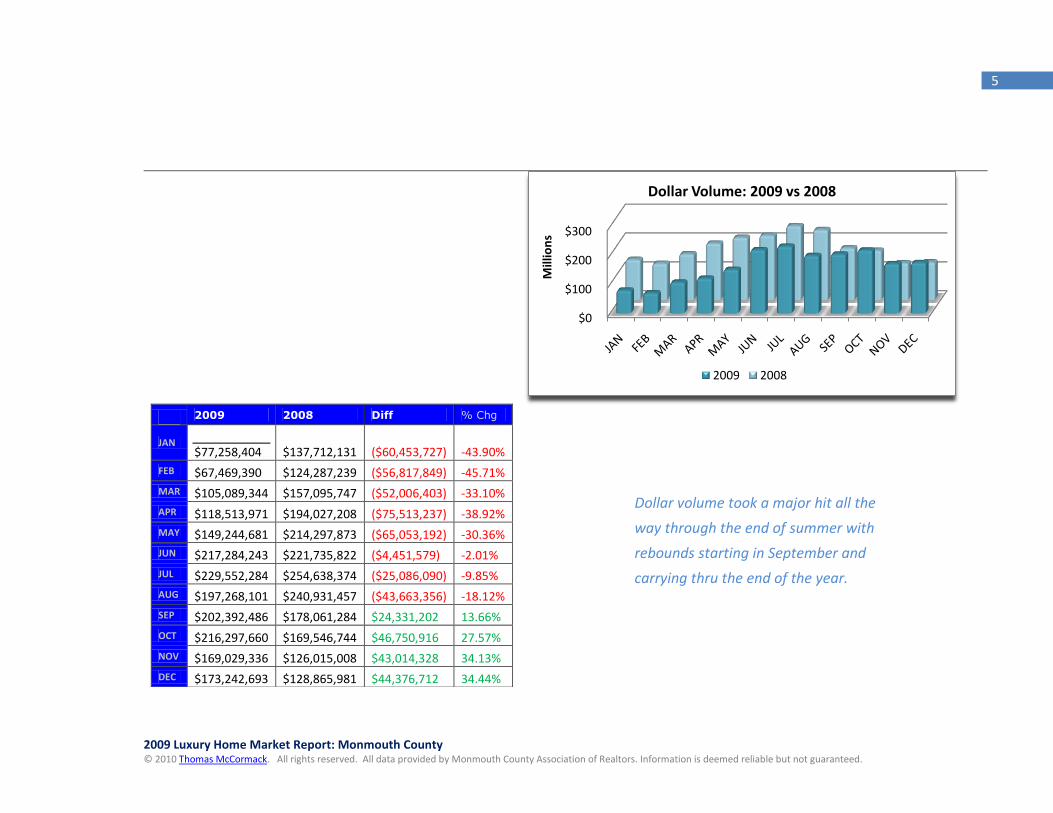
2009 2008 Diff % Chg
JAN
$77,258,404 $137,712,131 ($60,453,727) -43.90%
FEB $67,469,390 $124,287,239 ($56,817,849) -45.71%
MAR $105,089,344 $157,095,747 ($52,006,403) -33.10%
APR $118,513,971 $194,027,208 ($75,513,237) -38.92%
MAY $149,244,681 $214,297,873 ($65,053,192) -30.36%
JUN $217,284,243 $221,735,822 ($4,451,579) -2.01%
JUL $229,552,284 $254,638,374 ($25,086,090) -9.85%
AUG $197,268,101 $240,931,457 ($43,663,356) -18.12%
SEP $202,392,486 $178,061,284 $24,331,202 13.66%
OCT $216,297,660 $169,546,744 $46,750,916 27.57%
NOV $169,029,336 $126,015,008 $43,014,328 34.13%
DEC $173,242,693 $128,865,981 $44,376,712 34.44%
Dollar volume took a major hit all the
way through the end of summer with
rebounds starting in September and
carrying thru the end of the year.
$0
$100
$200
$300
Mill
ion
s
Dollar Volume: 2009 vs 2008
2009 2008
2009 Luxury Home Market Report: Monmouth County © 2010 Thomas McCormack. All rights reserved. All data provided by Monmouth County Association of Realtors. Information is deemed reliable but not guaranteed.
6
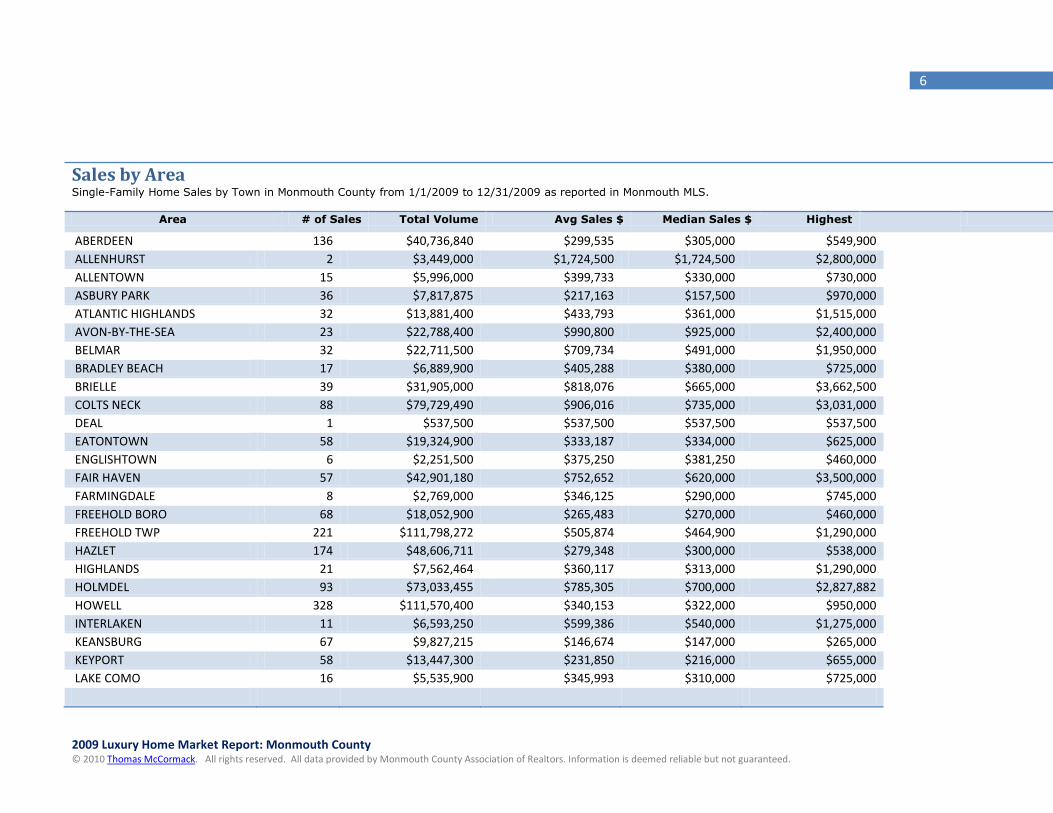
Sales by Area Single-Family Home Sales by Town in Monmouth County from 1/1/2009 to 12/31/2009 as reported in Monmouth MLS.
Area # of Sales Total Volume Avg Sales $ Median Sales $ Highest
ABERDEEN 136 $40,736,840 $299,535 $305,000 $549,900
ALLENHURST 2 $3,449,000 $1,724,500 $1,724,500 $2,800,000
ALLENTOWN 15 $5,996,000 $399,733 $330,000 $730,000
ASBURY PARK 36 $7,817,875 $217,163 $157,500 $970,000
ATLANTIC HIGHLANDS 32 $13,881,400 $433,793 $361,000 $1,515,000
AVON-BY-THE-SEA 23 $22,788,400 $990,800 $925,000 $2,400,000
BELMAR 32 $22,711,500 $709,734 $491,000 $1,950,000
BRADLEY BEACH 17 $6,889,900 $405,288 $380,000 $725,000
BRIELLE 39 $31,905,000 $818,076 $665,000 $3,662,500
COLTS NECK 88 $79,729,490 $906,016 $735,000 $3,031,000
DEAL 1 $537,500 $537,500 $537,500 $537,500
EATONTOWN 58 $19,324,900 $333,187 $334,000 $625,000
ENGLISHTOWN 6 $2,251,500 $375,250 $381,250 $460,000
FAIR HAVEN 57 $42,901,180 $752,652 $620,000 $3,500,000
FARMINGDALE 8 $2,769,000 $346,125 $290,000 $745,000
FREEHOLD BORO 68 $18,052,900 $265,483 $270,000 $460,000
FREEHOLD TWP 221 $111,798,272 $505,874 $464,900 $1,290,000
HAZLET 174 $48,606,711 $279,348 $300,000 $538,000
HIGHLANDS 21 $7,562,464 $360,117 $313,000 $1,290,000
HOLMDEL 93 $73,033,455 $785,305 $700,000 $2,827,882
HOWELL 328 $111,570,400 $340,153 $322,000 $950,000
INTERLAKEN 11 $6,593,250 $599,386 $540,000 $1,275,000
KEANSBURG 67 $9,827,215 $146,674 $147,000 $265,000
KEYPORT 58 $13,447,300 $231,850 $216,000 $655,000
LAKE COMO 16 $5,535,900 $345,993 $310,000 $725,000

2009 Luxury Home Market Report: Monmouth County © 2010 Thomas McCormack. All rights reserved. All data provided by Monmouth County Association of Realtors. Information is deemed reliable but not guaranteed.
7
Area # of Sales Total Volume Avg Sales $ Median Sales $ Highest
LITTLE SILVER 45 $27,105,500 $602,344 $540,000 $1,080,000
LOCH ARBOUR VILLAGE 3 $1,812,000 $604,000 $720,000 $765,000
LONG BRANCH 106 $29,281,537 $276,240 $254,000 $1,598,755
MANALAPAN 224 $117,240,450 $523,394 $487,000 $1,350,000
MANASQUAN 56 $37,312,027 $666,286 $605,000 $1,900,000
MARLBORO 265 $155,631,674 $587,289 $520,000 $2,500,000
MATAWAN 75 $24,286,933 $323,825 $325,000 $672,000
MIDDLETOWN 429 $178,033,725 $414,997 $375,000 $3,100,000
MILLSTONE 67 $38,804,086 $579,165 $585,000 $1,010,000
MONMOUTH BEACH 35 $27,612,404 $788,925 $700,000 $2,160,000
NEPTUNE CITY 21 $4,770,000 $227,142 $233,000 $355,000
NEPTUNE TWP 202 $67,833,800 $335,810 $290,000 $1,600,000
OCEAN 139 $56,263,150 $404,770 $360,500 $1,450,000
OCEANPORT 33 $13,698,900 $415,118 $370,000 $805,000
RED BANK 51 $18,090,660 $354,718 $325,000 $830,000
ROOSEVELT 6 $1,565,500 $260,916 $266,000 $415,000
RUMSON 70 $89,759,000 $1,282,271 $995,000 $3,850,000
SEA BRIGHT 11 $10,361,500 $941,954 $850,000 $2,865,000
SEA GIRT 26 $37,479,240 $1,441,509 $1,232,500 $3,3,25,000
SHREWSBURY BORO 34 $15,272,650 $449,195 $395,000 $1,100,000
SPRING LK HEIGHTS 19 $7,811,100 $411,110 $375,000 $665,000
SPRING LAKE 52 $89,320,936 $1,717,710 $1,413,500 $5,558,500
TINTON FALLS 93 $35,559,620 $382,361 $375,000 $885,000
UNION BEACH 61 $14,735,100 $241,559 $245,000 $399,900
UPPER FREEHOLD 41 $20,176,240 $492,103 $475,000 $1,100,000
WALL 158 $77,303,684 $489,263 $443,500 $1,275,000
WEST LONG BRANCH 43 $15,803,825 $367,530 $350,000 $720,000

2009 Luxury Home Market Report: Monmouth County © 2010 Thomas McCormack. All rights reserved. All data provided by Monmouth County Association of Realtors. Information is deemed reliable but not guaranteed.
8
Monmouth County Monthly Sales: 2009 vs. 2008 All Prices
JAN FEB MAR APR MAY JUN JUL AUG SEP OCT NOV DEC TOTAL 2009 176 151 251 245 303 435 483 402 391 423 366 346 3972 2008 227 226 302 342 377 434 449 433 338 341 248 249 3966
% Change: -22.47% -33.19% -16.89% -28.36% -19.63% 0.23% 7.57% -7.16% 15.68% 24.05% 47.58% 38.96% 0.15%
Monmouth County Monthly Sales: 2009 vs. 2008 Sold for more than $1,000,000
JAN FEB MAR APR MAY JUN JUL AUG SEP OCT NOV DEC TOTAL 2009 8 7 9 14 17 30 23 19 24 29 23 22 225 2008 23 15 19 32 33 15 35 29 23 19 16 18 277
% Change: -65.22% -53.33% -52.63% -56.25% -48.48% 100.00% -34.29% -34.48% 4.35% 52.63% 43.75% 22.22% -18.77%
Monmouth County Monthly Sales: 2009 vs. 2008 Sold between $1 - $2 million
JAN FEB MAR APR MAY JUN JUL AUG SEP OCT NOV DEC TOTAL 2009 8 7 8 10 12 22 21 16 17 22 18 18 179 2008 14 8 13 25 24 12 27 19 19 14 13 12 200
% Change: -42.86% -12.50% -38.46% -60.00% -50.00% 83.33% -22.22% -15.79% -10.53% 57.14% 38.46% 50.00% -10.50%
Monmouth County Monthly Sales: 2009 vs. 2008 Sold for more than $2,000,000
JAN FEB MAR APR MAY JUN JUL AUG SEP OCT NOV DEC TOTAL 2009 1 0 1 5 5 8 2 3 8 7 5 4 49 2008 9 7 6 7 9 3 8 10 5 5 3 6 78
% Change: -88.89% -100.00% -83.33% -28.57% -44.44% 166.67% -75.00% -70.00% 60.00% 40.00% 66.67% -33.33% -37.18%
2009 Luxury Home Market Report: Monmouth County © 2010 Thomas McCormack. All rights reserved. All data provided by Monmouth County Association of Realtors. Information is deemed reliable but not guaranteed.
9
LUXURY MARKET REVIEW
Typically, the term “luxury real estate” refers to the top 10% value-tier of a given market. For Monmouth County in
2008 this price point for homes that had sold started just under $850,000; in 2009 the top 10% mark fell closer to
$800,000. Despite this, given that several towns’ average sale price was well over $1 million (see “Sales by Area” in
this report) we’ve rounded the cut-off up to the $1 million mark with an additional focus on sales above $2 million.
While the county as a whole remained essentially flat with a less than 1% increase in annual unit sales above that of
2008, the “high-end” of the market ~ above the $1 million mark ~ experienced severe sales losses relative to the
year before. The first half of the year proved especially daunting when sales for the period were down 38%. The
second half of the year proved much more promising with sales increases in each of the last four months of the year
relative to 2008. As a whole, the luxury segment seemed to be showing some signs of a rebound: sales ended the
year at about 19% lower than the previous year, reducing the first half of the year’s loss by half.
In examining the segment of the market above $2 million we see a less promising year-end tally with sales 37%
down from 2008, but we also see a similar market improvement in the tail-end of the year, with 3 of the last 4 months
of the year showing significant gains over sales for the same period the year before. This segment of the market was
down 51% at the mid-year mark, so while progress was measured, it is certainly welcome and hopefully a sign of
improvement in 2010. Indeed, in January 2010 there were already 5 homes that closed over $2 million… already a big
increase over the same time last year.
If there are any trends to note among the highest price homes that sold last year, it’s the frequency of waterfront,
water view and new or newer construction. See charts for the top prices, top waterfront and new construction.

2009 Luxury Home Market Report: Monmouth County © 2010 Thomas McCormack. All rights reserved. All data provided by Monmouth County Association of Realtors. Information is deemed reliable but not guaranteed.
10
View all available homes listed above $2 million,
the highest-priced home currently available is $16,800,000.
View all available homes listed between $1 - $2 million.
13
13
6
4
2
2
1
1
1
1
1
1
Rumson
Spring Lake
Colts Neck
Marlboro
Middletown
Brielle
Allenhurst
Avon by the Sea
Fair Haven
Holmdel
Monmouth …
Sea Bright
2009 Sales by Town $2 million & above
13
12
11
10
9
8
5
4
4
4
3
3
2
2
2
2
1
1
1
1
1
1
Spring Lake
Colts Neck
Rumson
Marlboro
Holmdel
Sea Girt
Wall
Avon by the Sea
Brielle
Manasquan
Fair Haven
Middletown
Belmar
Monmouth Beach
Sea Bright
Upper Freehold
Atlantic Highlands
Highlands
Little Silver
Millstone
Neptune
Ocean
2009 Sales by Town between $1 - $2 mil

2009 Luxury Home Market Report: Monmouth County © 2010 Thomas McCormack. All rights reserved. All data provided by Monmouth County Association of Realtors. Information is deemed reliable but not guaranteed.
11
Luxury Top Ten 2009
Highest # of Sales $2 million & Above ~ All types Rumson 13
Spring Lake 13
Highest # of Sales Above $1 million ~ All types Rumson 33
Highest # of Sales Above $1 million ~ Waterfront Rumson 9
Highest # of Sales Above $1 million: New Construction Holmdel 5
Highest Sale Price Spring Lake $5,558,500
Highest Median Price Allenhurst $1,724,500
Highest Average Price Allenhurst $1,724,500
Towns with Median Sale Price Above $1 million Allenhurst $1,724,500
Sea Girt $1,232,500
Spring Lake $1,413,500
Towns with Average Sale Price Above $1 million Allenhurst $1,724,500
Rumson $1,282,271
Sea Girt $1,441,509
Spring Lake $1,717,710
2009 Luxury Home Market Report: Monmouth County © 2010 Thomas McCormack. All rights reserved. All data provided by Monmouth County Association of Realtors. Information is deemed reliable but not guaranteed.
12
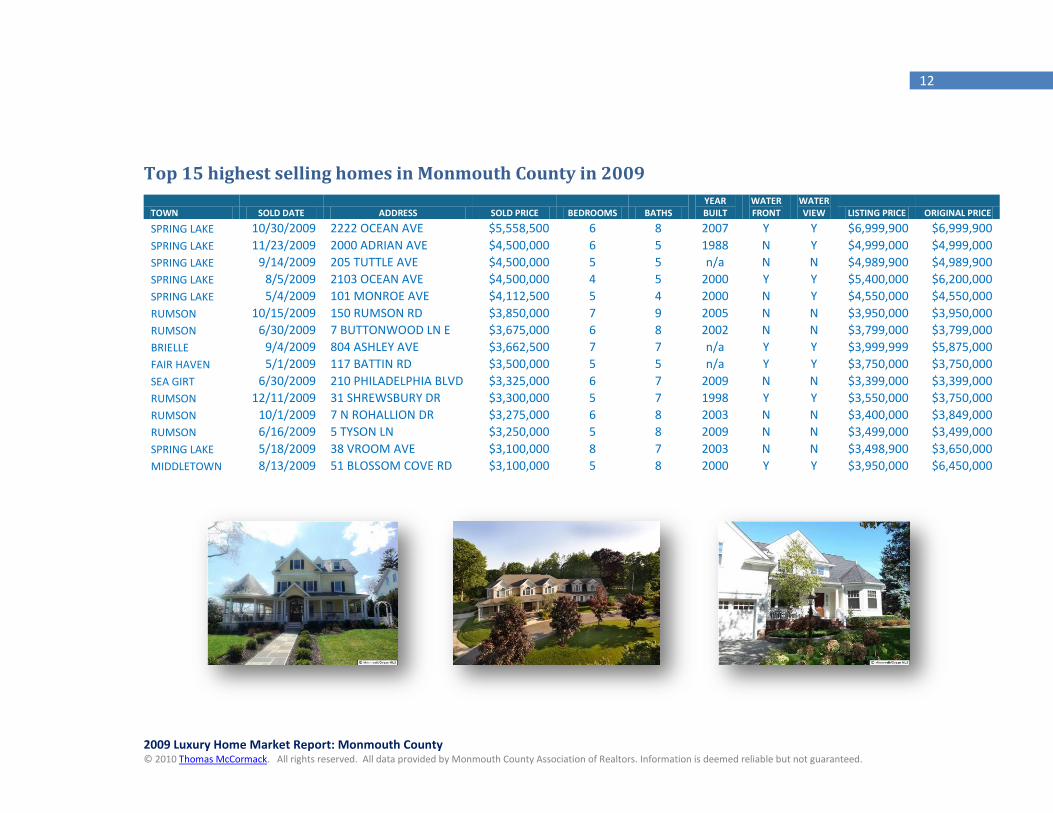
Top 15 highest selling homes in Monmouth County in 2009
TOWN SOLD DATE ADDRESS SOLD PRICE BEDROOMS BATHS YEAR BUILT
WATER FRONT
WATER VIEW LISTING PRICE ORIGINAL PRICE
SPRING LAKE 10/30/2009 2222 OCEAN AVE $5,558,500 6 8 2007 Y Y $6,999,900 $6,999,900
SPRING LAKE 11/23/2009 2000 ADRIAN AVE $4,500,000 6 5 1988 N Y $4,999,000 $4,999,000
SPRING LAKE 9/14/2009 205 TUTTLE AVE $4,500,000 5 5 n/a N N $4,989,900 $4,989,900
SPRING LAKE 8/5/2009 2103 OCEAN AVE $4,500,000 4 5 2000 Y Y $5,400,000 $6,200,000
SPRING LAKE 5/4/2009 101 MONROE AVE $4,112,500 5 4 2000 N Y $4,550,000 $4,550,000
RUMSON 10/15/2009 150 RUMSON RD $3,850,000 7 9 2005 N N $3,950,000 $3,950,000
RUMSON 6/30/2009 7 BUTTONWOOD LN E $3,675,000 6 8 2002 N N $3,799,000 $3,799,000
BRIELLE 9/4/2009 804 ASHLEY AVE $3,662,500 7 7 n/a Y Y $3,999,999 $5,875,000
FAIR HAVEN 5/1/2009 117 BATTIN RD $3,500,000 5 5 n/a Y Y $3,750,000 $3,750,000
SEA GIRT 6/30/2009 210 PHILADELPHIA BLVD $3,325,000 6 7 2009 N N $3,399,000 $3,399,000
RUMSON 12/11/2009 31 SHREWSBURY DR $3,300,000 5 7 1998 Y Y $3,550,000 $3,750,000
RUMSON 10/1/2009 7 N ROHALLION DR $3,275,000 6 8 2003 N N $3,400,000 $3,849,000
RUMSON 6/16/2009 5 TYSON LN $3,250,000 5 8 2009 N N $3,499,000 $3,499,000
SPRING LAKE 5/18/2009 38 VROOM AVE $3,100,000 8 7 2003 N N $3,498,900 $3,650,000
MIDDLETOWN 8/13/2009 51 BLOSSOM COVE RD $3,100,000 5 8 2000 Y Y $3,950,000 $6,450,000
2009 Luxury Home Market Report: Monmouth County © 2010 Thomas McCormack. All rights reserved. All data provided by Monmouth County Association of Realtors. Information is deemed reliable but not guaranteed.
13
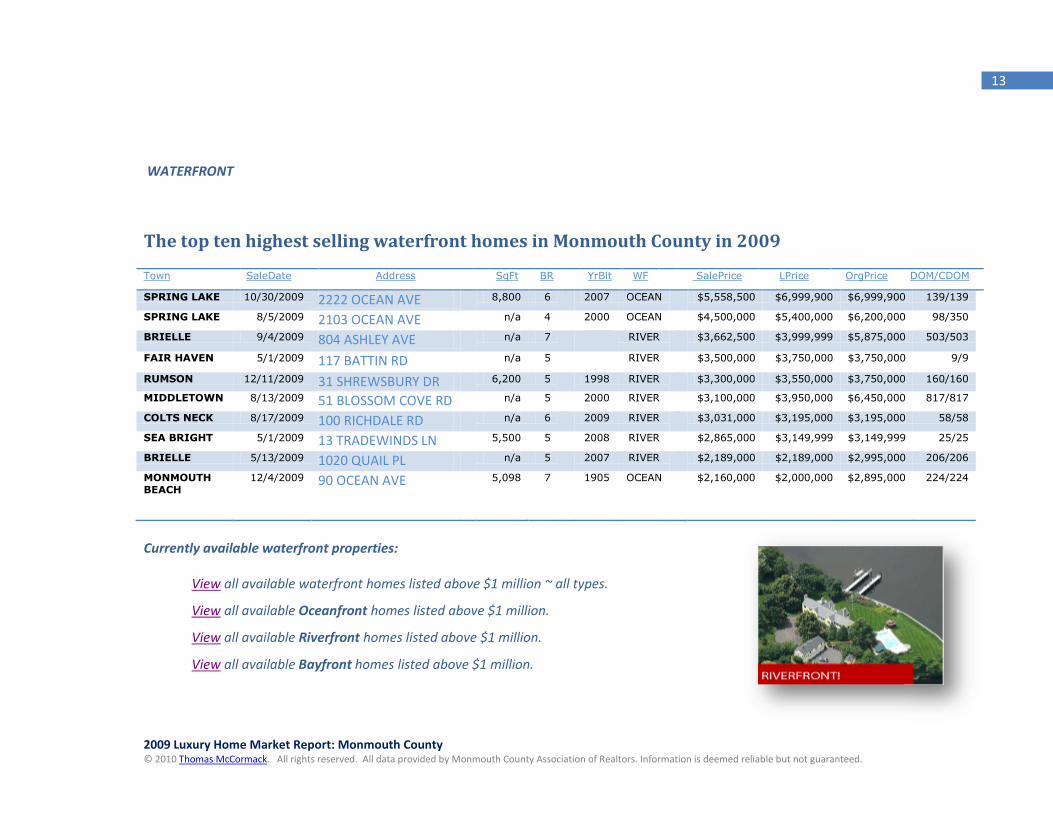
WATERFRONT
The top ten highest selling waterfront homes in Monmouth County in 2009
Town SaleDate Address SqFt BR YrBlt WF SalePrice LPrice OrgPrice DOM/CDOM
SPRING LAKE 10/30/2009 2222 OCEAN AVE
8,800 6 2007 OCEAN $5,558,500 $6,999,900 $6,999,900 139/139
SPRING LAKE 8/5/2009 2103 OCEAN AVE n/a 4 2000 OCEAN $4,500,000 $5,400,000 $6,200,000 98/350
BRIELLE 9/4/2009 804 ASHLEY AVE
n/a 7 RIVER $3,662,500 $3,999,999 $5,875,000 503/503
FAIR HAVEN 5/1/2009 117 BATTIN RD n/a 5 RIVER $3,500,000 $3,750,000 $3,750,000 9/9
RUMSON 12/11/2009 31 SHREWSBURY DR
6,200 5 1998 RIVER $3,300,000 $3,550,000 $3,750,000 160/160
MIDDLETOWN 8/13/2009 51 BLOSSOM COVE RD
n/a 5 2000 RIVER $3,100,000 $3,950,000 $6,450,000 817/817
COLTS NECK 8/17/2009 100 RICHDALE RD
n/a 6 2009 RIVER $3,031,000 $3,195,000 $3,195,000 58/58
SEA BRIGHT 5/1/2009 13 TRADEWINDS LN 5,500 5 2008 RIVER $2,865,000 $3,149,999 $3,149,999 25/25
BRIELLE 5/13/2009 1020 QUAIL PL n/a 5 2007 RIVER $2,189,000 $2,189,000 $2,995,000 206/206
MONMOUTH BEACH
12/4/2009 90 OCEAN AVE
5,098 7 1905 OCEAN $2,160,000 $2,000,000 $2,895,000 224/224
Currently available waterfront properties: View all available waterfront homes listed above $1 million ~ all types.
View all available Oceanfront homes listed above $1 million.
View all available Riverfront homes listed above $1 million.
View all available Bayfront homes listed above $1 million.
2009 Luxury Home Market Report: Monmouth County © 2010 Thomas McCormack. All rights reserved. All data provided by Monmouth County Association of Realtors. Information is deemed reliable but not guaranteed.
14
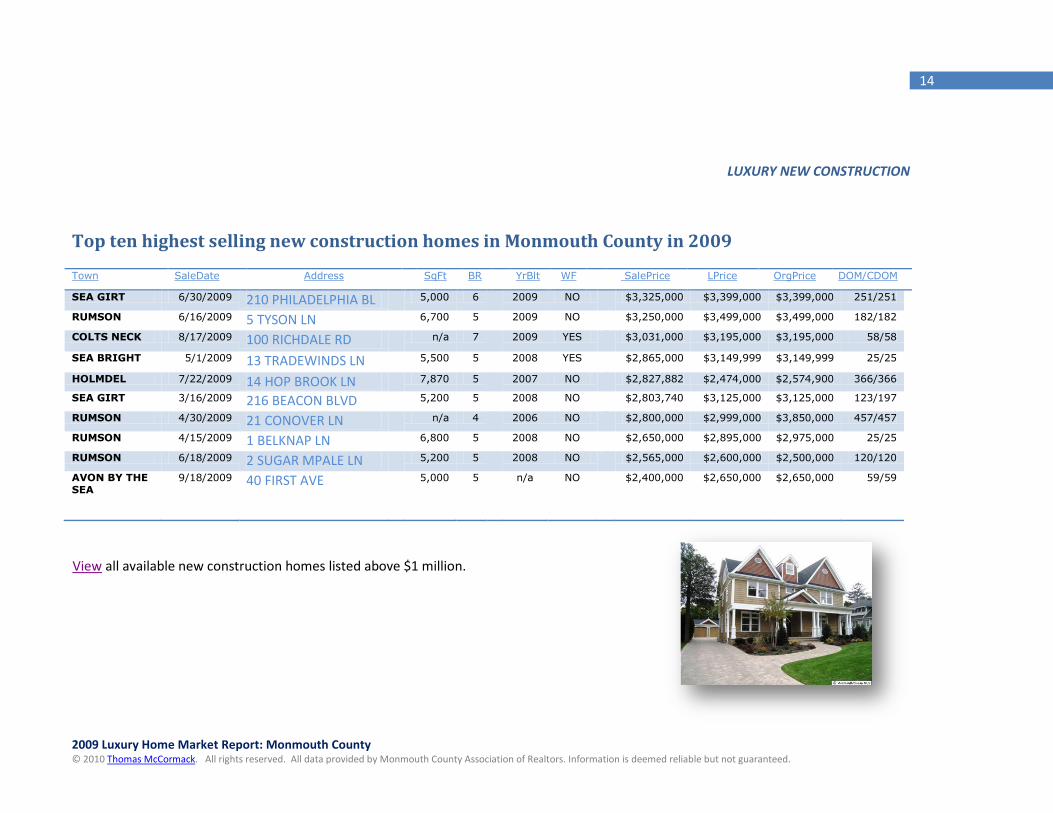
LUXURY NEW CONSTRUCTION
Top ten highest selling new construction homes in Monmouth County in 2009
Town SaleDate Address SqFt BR YrBlt WF SalePrice LPrice OrgPrice DOM/CDOM
SEA GIRT 6/30/2009 210 PHILADELPHIA BL 5,000 6 2009 NO $3,325,000 $3,399,000 $3,399,000 251/251
RUMSON 6/16/2009 5 TYSON LN 6,700 5 2009 NO $3,250,000 $3,499,000 $3,499,000 182/182
COLTS NECK 8/17/2009 100 RICHDALE RD
n/a 7 2009 YES $3,031,000 $3,195,000 $3,195,000 58/58
SEA BRIGHT 5/1/2009 13 TRADEWINDS LN 5,500 5 2008 YES $2,865,000 $3,149,999 $3,149,999 25/25
HOLMDEL 7/22/2009 14 HOP BROOK LN
7,870 5 2007 NO $2,827,882 $2,474,000 $2,574,900 366/366
SEA GIRT 3/16/2009 216 BEACON BLVD
5,200 5 2008 NO $2,803,740 $3,125,000 $3,125,000 123/197
RUMSON 4/30/2009 21 CONOVER LN
n/a 4 2006 NO $2,800,000 $2,999,000 $3,850,000 457/457
RUMSON 4/15/2009 1 BELKNAP LN 6,800 5 2008 NO $2,650,000 $2,895,000 $2,975,000 25/25
RUMSON 6/18/2009 2 SUGAR MPALE LN 5,200 5 2008 NO $2,565,000 $2,600,000 $2,500,000 120/120
AVON BY THE SEA
9/18/2009 40 FIRST AVE
5,000 5 n/a NO $2,400,000 $2,650,000 $2,650,000 59/59
View all available new construction homes listed above $1 million.
2009 Luxury Home Market Report: Monmouth County © 2010 Thomas McCormack. All rights reserved. All data provided by Monmouth County Association of Realtors. Information is deemed reliable but not guaranteed.
15
For an honest, ongoing discussion about life and living in Monmouth County visit
The Resourceful Realtor blog at www.ResourcefulRealtor.com.
For more information:
Thomas McCormack Resources Real Estate Sales Associate 112 East River Road 732-212-0440 x212 Rumson, NJ 07760 ThomasMcCormack.com ResourcesRealEstate.com ResourcefulRealtor.com [email protected]
All contents © 2010 Thomas McCormack. May not be excerpted or distributed without permission. Data provided by Monmouth County Association of Realtors for period 1/1/2009 – 12/31/2009. Sales data © 2010 Monmouth Association of Realtors.

2009 Luxury Home Market Report: Monmouth County © 2010 Thomas McCormack. All rights reserved. All data provided by Monmouth County Association of Realtors. Information is deemed reliable but not guaranteed.
16
Related Documents