2009 First half financials and strategy update September 2009

Welcome message from author
This document is posted to help you gain knowledge. Please leave a comment to let me know what you think about it! Share it to your friends and learn new things together.
Transcript

2009 First half financials
and strategy update
September 2009

2
• Recent market trends and the performance of Virbac
• 2009 first half consolidated financials
• Growth levers and 2009 outlook
Agenda

32,5%32,9%
Worlwide animal health market in 2008$ 19.2 billion
EUROPE
REST OF THE WORLD
NORTH AMERICA
4,6%30%
West
East
Source : Vetnosis3
4
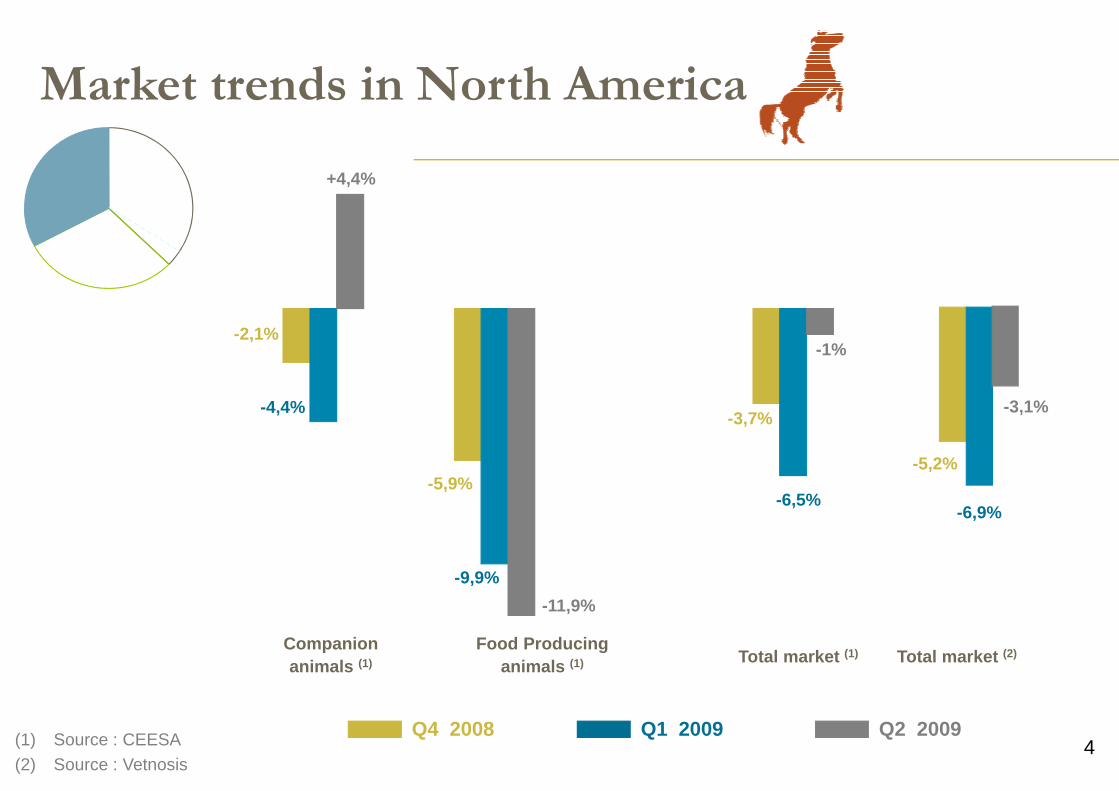
Market trends in North America
Companionanimals (1)
Food Producinganimals (1) Total market (1) Total market (2)
(1) Source : CEESA(2) Source : Vetnosis
Q4 2008 Q1 2009 Q2 2009
-2,1%
-5,9%
-3,7%-4,4%
-9,9%
-6,5%
+4,4%
-11,9%
-1%
-5,2%
-6,9%
-3,1%

5
Market trends in Europe
(1) Source : CEESA(2) Source : Vetnosis
Q4 2008 Q1 2009 Q2 2009
Companionanimals
Food Producinganimals
Total market
(1) (2) West Europe, in €
+1,7%
+8,1%
+1,8%
-1%
+2,5% +3,4%
Impact of blue tongue
-7,2%
-4%
+0,2%
+3,2%
+0,2%
-5,4%
6
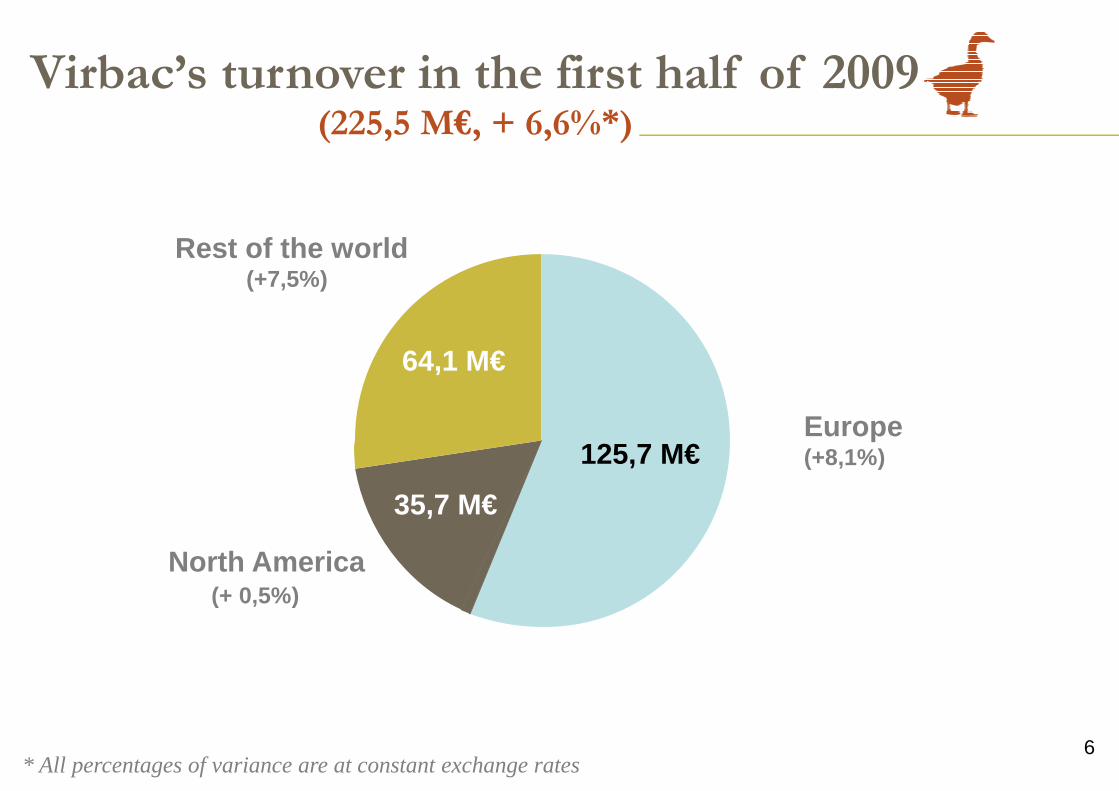
Virbac’s turnover in the first half of 2009(225,5 M€, + 6,6%*)
125,7 M€
35,7 M€
64,1 M€
North America(+ 0,5%)
Europe(+8,1%)
Rest of the world(+7,5%)
* All percentages of variance are at constant exchange rates
7
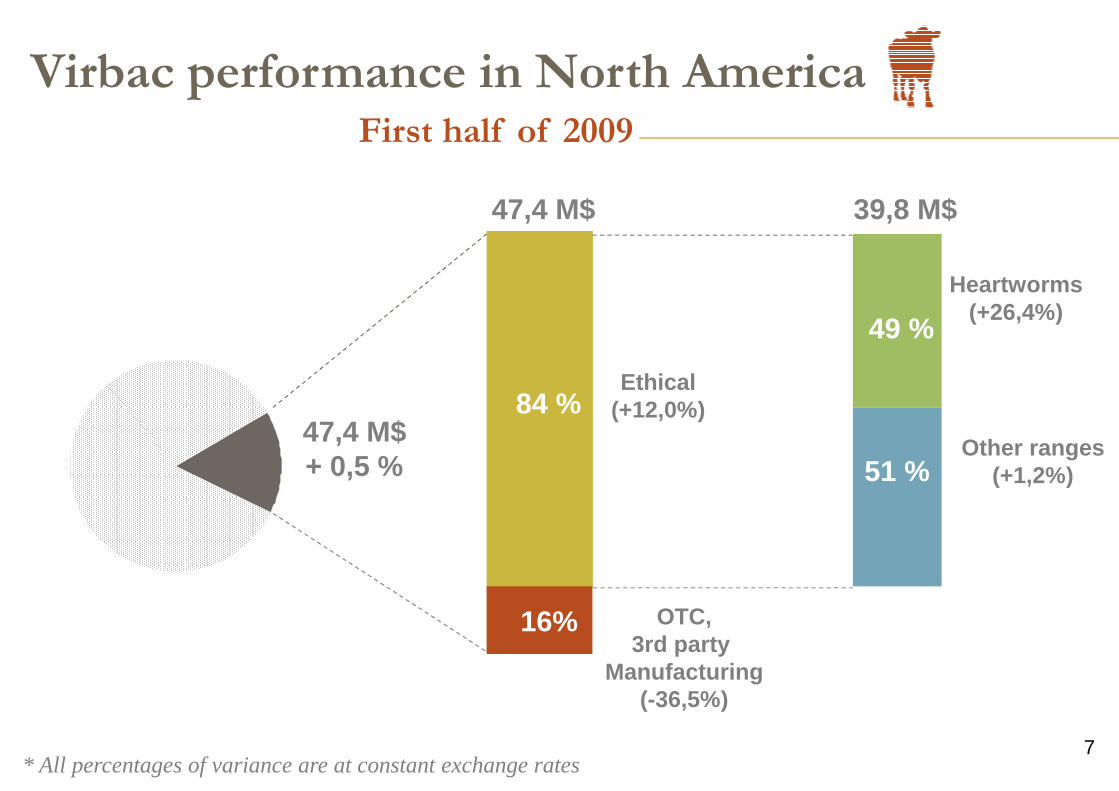
Virbac performance in North AmericaFirst half of 2009
47,4 M$
84 %
16%
Ethical(+12,0%)
OTC,3rd party
Manufacturing(-36,5%)
49 %
51 %
* All percentages of variance are at constant exchange rates
Heartworms(+26,4%)
Other ranges(+1,2%)
39,8 M$
47,4 M$+ 0,5 %
8
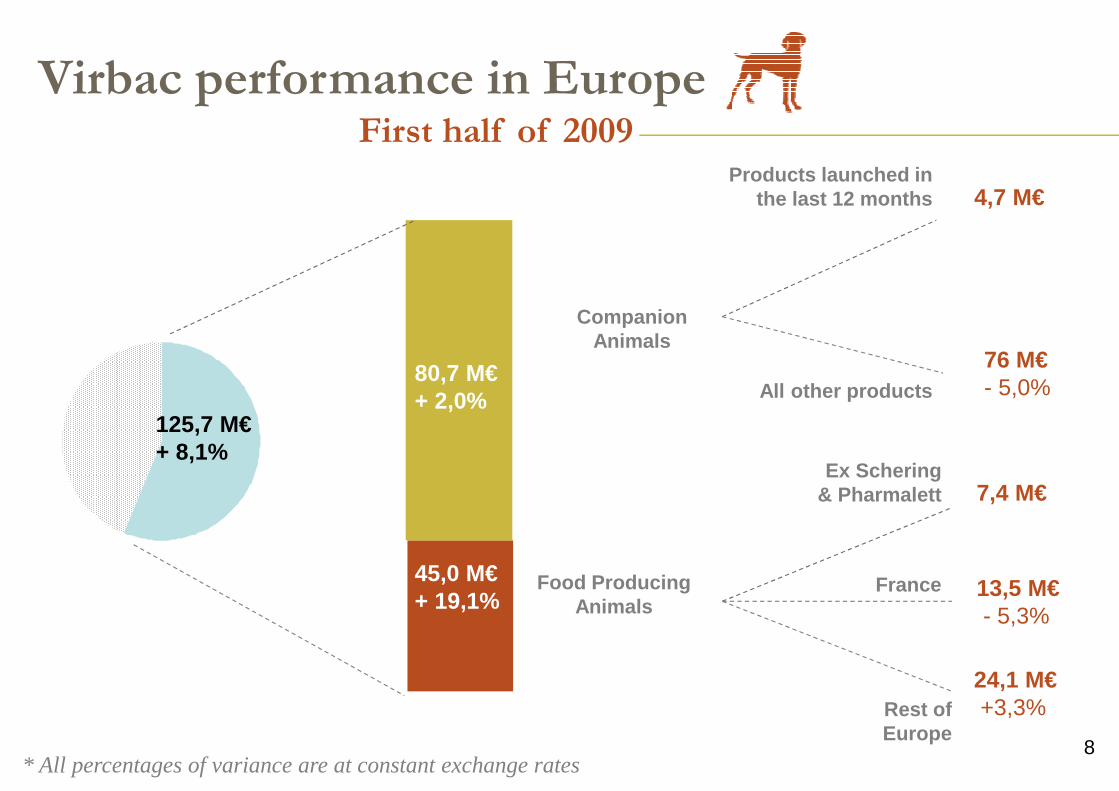
Virbac performance in EuropeFirst half of 2009
* All percentages of variance are at constant exchange rates
125,7 M€+ 8,1%
80,7 M€+ 2,0%
45,0 M€+ 19,1%
Ex Schering& Pharmalett
France
Rest of Europe
4,7 M€Products launched in
the last 12 months
76 M€- 5,0%All other products
7,4 M€
13,5 M€- 5,3%
24,1 M€+3,3%
Companion Animals
Food Producing Animals

9
Virbac performance in the rest of the world first half of 2009
+ 5% / + 15% > +15%Growth *
Turnover
10 / 15 M€Australia All others
combinedIndia
South Africa
4 / 10 M€MexicoBrazil
Japon
< - 5% - 5% / + 5%
+ 8.4% OVERALL
* Constant exchange rates
64.1 M€
+7.5%
10
• Recent market trends and the performance of Virbac
• 2009 first half consolidated financials
• Growth levers and 2009 outlook
Agenda

11
• Good increase of sales despite the market slow down :
+6,6 % at constant exchange rates / +3,1% organic
• Contribution of 2008 acquisitions in line with expectations
• Gross margin level maintained in spite of the decline of certain currencies (£, …)
• Cost control ; selective increase in R&D (USA) and marketing-sales (launches of
new products) :
� evolution of the operating profit in line with sales, excluding one-time items
� One-time items : industrial restructurings in 2009 vs. exceptional profits in 2008
• Improvement of cash generation (cash-flow, working capital) and slight seasonal increase of debt
2009 First half highlights

12
Consolidated sales30.06.2009
Consolidated sales 225.5 211.8 +6.4%
- Exchange rate impact vs. 2008 0.2
Consolidated sales at constant rates 225.7 211.8 +6.6%
- Change of perimeter (7.4) (0.2)
Consolidated sales, pro-forma
at constant exchange rates 218.3 211.6 +3.1%
2008 Var. %2009Million euros
13
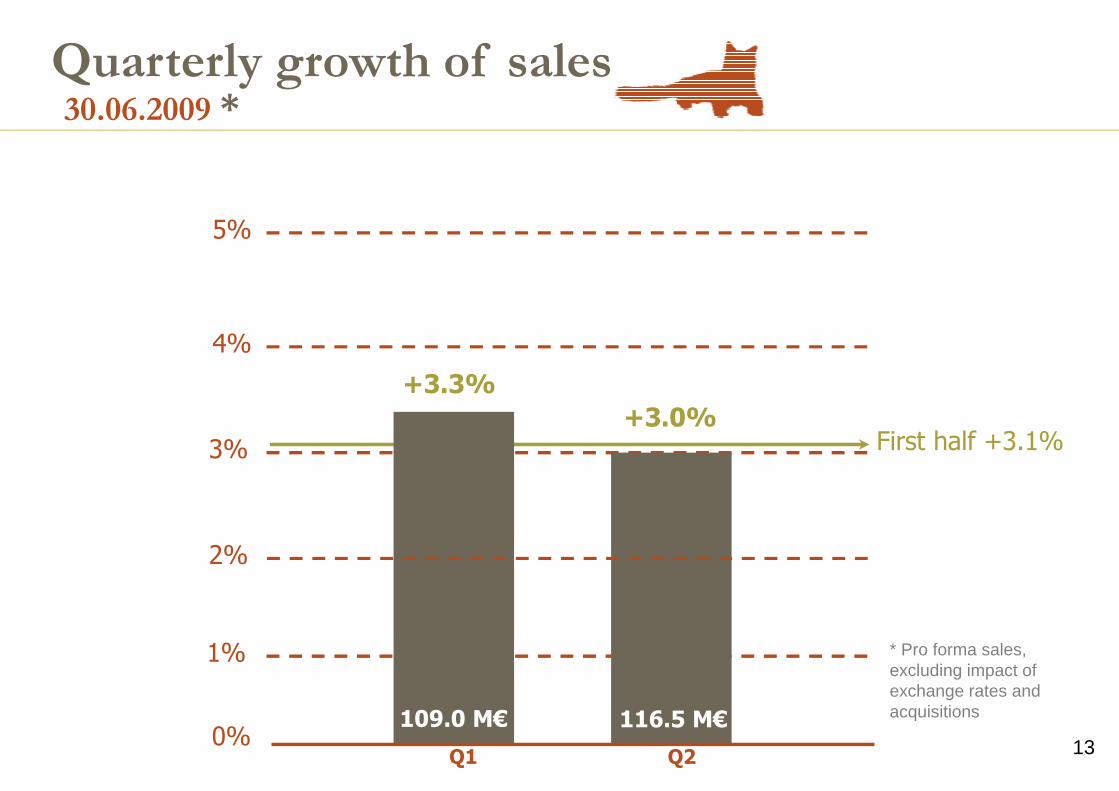
Quarterly growth of sales30.06.2009 *
3%
1%
0%
First half +3.1%
Q1 Q2
+3.3%
+3.0%
2%
109.0 M€ 116.5 M€
4%
5%
* Pro forma sales, excluding impact of exchange rates and acquisitions

14
France 45.7 45.7 0.1% 0.1%Europe outside France 80.0 71.7 11.5% 13.1%North America 35.7 31.0 15.2% 0.5%Latin America 13.6 13.6 0.4% 12.0%Africa & Middle East 11.6 11.5 1.1% 4.2%Asia 26.2 22.1 18.2% 17.3%Pacific 12.6 16.1 -22.1% -10.2%
TOTAL 225.5 211.8 6.4% 6.6%
2008 Variation %2009Million eurosVar. Tx
Constants
Consolidated sales first half 2009Geographical breakdown

15
Growth by segment – first half 2009At constant exchange rates
> - 5%- 5% à
0%0% à +
5%+5% à +10%
+10% à +15%
> 15%
Companion Animals 138,4 3,9%
Parasiticides 35,3 0,3%
Vaccines 23,1 4,7%
Antibiotics/Dermatology 20,5 5,5%
Specialties 28,3 10,2%
Horses 10,8 -10,7%
Petfood 9,5 13,8%
Others 10,9 6,3%
Food producing animals 82,3 14,4%
Bovine parasiticides 12,6 10,0%
Other Bovine products 45,1 23,3%
Antibiotics swine/poultry 19,2 1,9%
Others 5,4 7,6%
Other businesses 4,8 -30,5%
TOTAL 225,5 6,6%
Businesses / RangesGrowth at constant rates
Net Revenue 2009 (M€)
0% à + 5%
+5% à +10%
3,7%
5,1%
5,6%
3,1%
of which organic growth
16
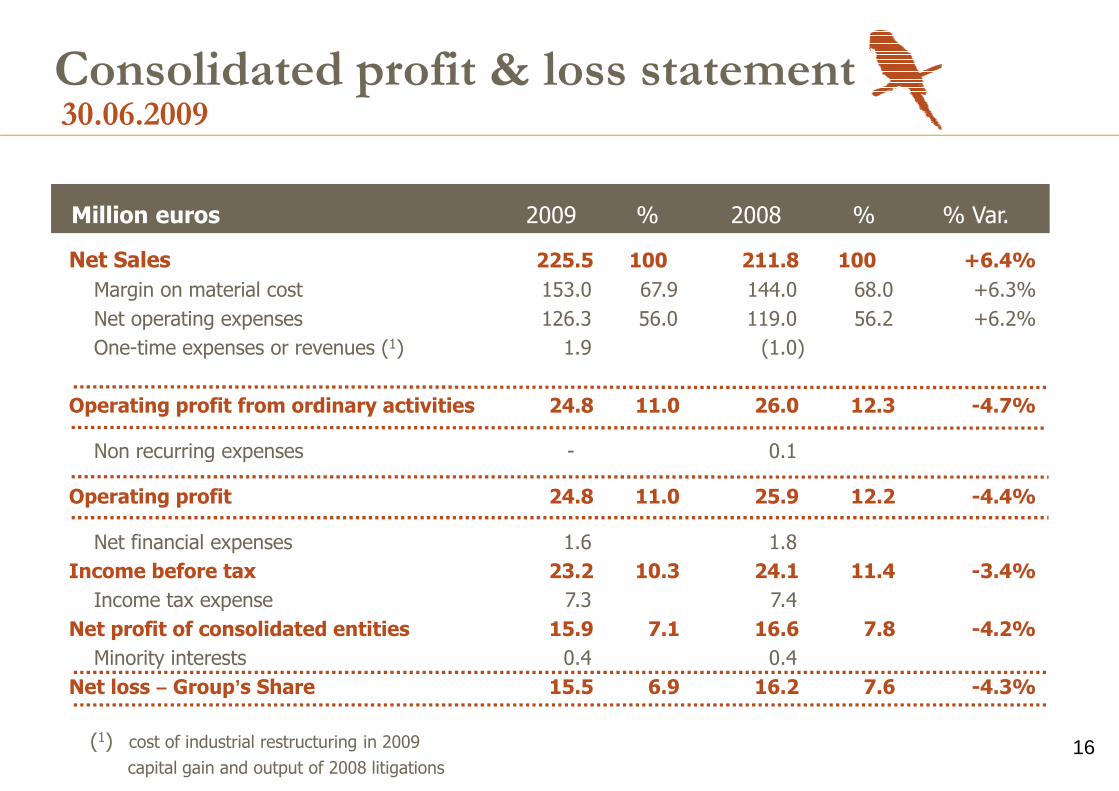
Consolidated profit & loss statement30.06.2009
Net Sales 225.5 100 211.8 100 +6.4%
Margin on material cost 153.0 67.9 144.0 68.0 +6.3%
Net operating expenses 126.3 56.0 119.0 56.2 +6.2%
One-time expenses or revenues (1) 1.9 (1.0)
Operating profit from ordinary activities 24.8 11.0 26.0 12.3 -4.7%
Non recurring expenses - 0.1
Operating profit 24.8 11.0 25.9 12.2 -4.4%
Net financial expenses 1.6 1.8
Income before tax 23.2 10.3 24.1 11.4 -3.4%
Income tax expense 7.3 7.4
Net profit of consolidated entities 15.9 7.1 16.6 7.8 -4.2%
Minority interests 0.4 0.4
Net loss – Group’s Share 15.5 6.9 16.2 7.6 -4.3%
2008 %% % Var.2009Million euros
(1) cost of industrial restructuring in 2009
capital gain and output of 2008 litigations
17
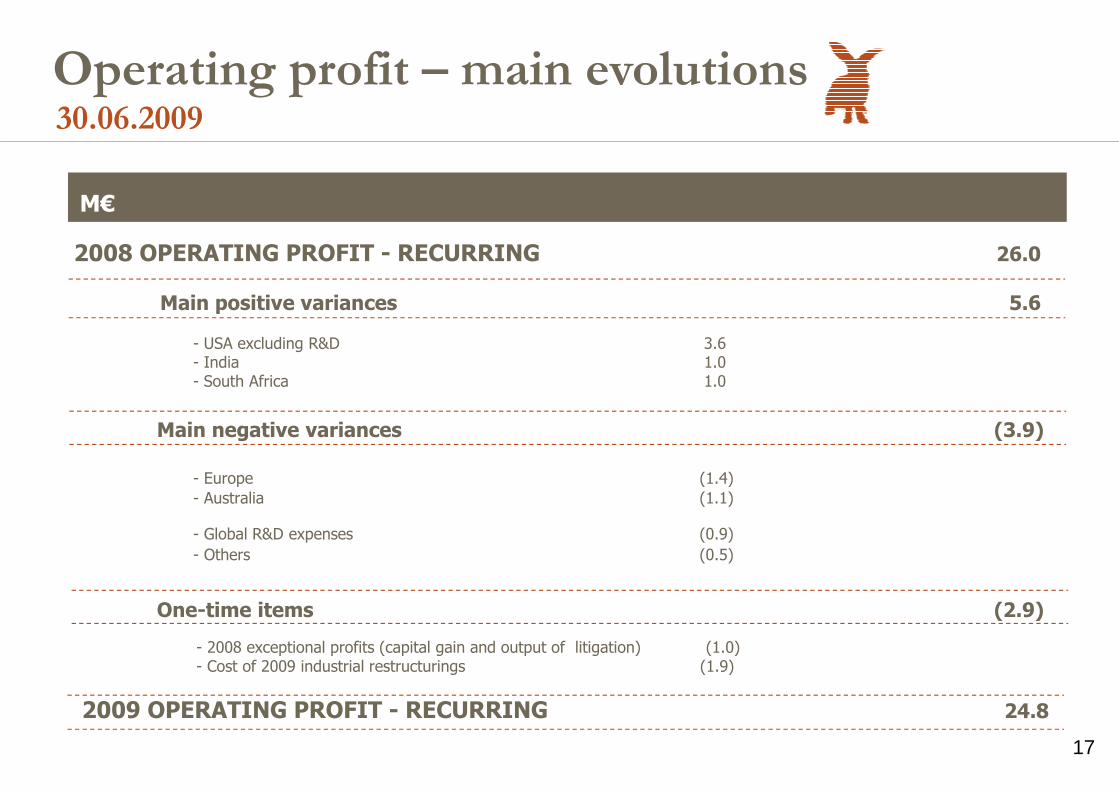
2009 OPERATING PROFIT - RECURRING 24.8
2008 OPERATING PROFIT - RECURRING 26.0
Main positive variances 5.6
- USA excluding R&D 3.6- India 1.0- South Africa 1.0
M€
Main negative variances (3.9)
- Europe (1.4)
- Australia (1.1)
- Global R&D expenses (0.9)
- Others (0.5)
One-time items (2.9)
30.06.2009
Operating profit – main evolutions
- 2008 exceptional profits (capital gain and output of litigation) (1.0)- Cost of 2009 industrial restructurings (1.9)
18
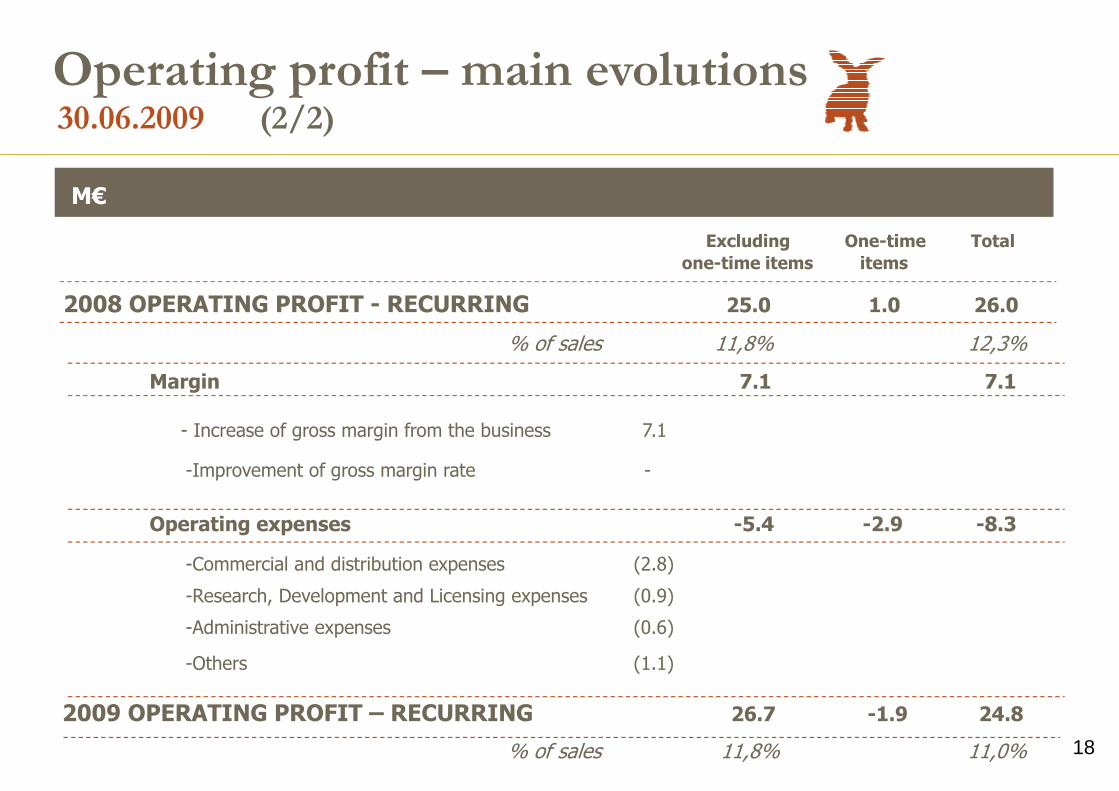
2009 OPERATING PROFIT – RECURRING 26.7 -1.9 24.8
% of sales 11,8% 11,0%
Excluding One-time Totalone-time items items
2008 OPERATING PROFIT - RECURRING 25.0 1.0 26.0
% of sales 11,8% 12,3%
Margin 7.1 7.1
- Increase of gross margin from the business 7.1
-Improvement of gross margin rate -
Operating expenses -5.4 -2.9 -8.3
-Commercial and distribution expenses (2.8)
-Research, Development and Licensing expenses (0.9)
-Administrative expenses (0.6)
-Others (1.1)
M€
30.06.2009
Operating profit – main evolutions(2/2)
19
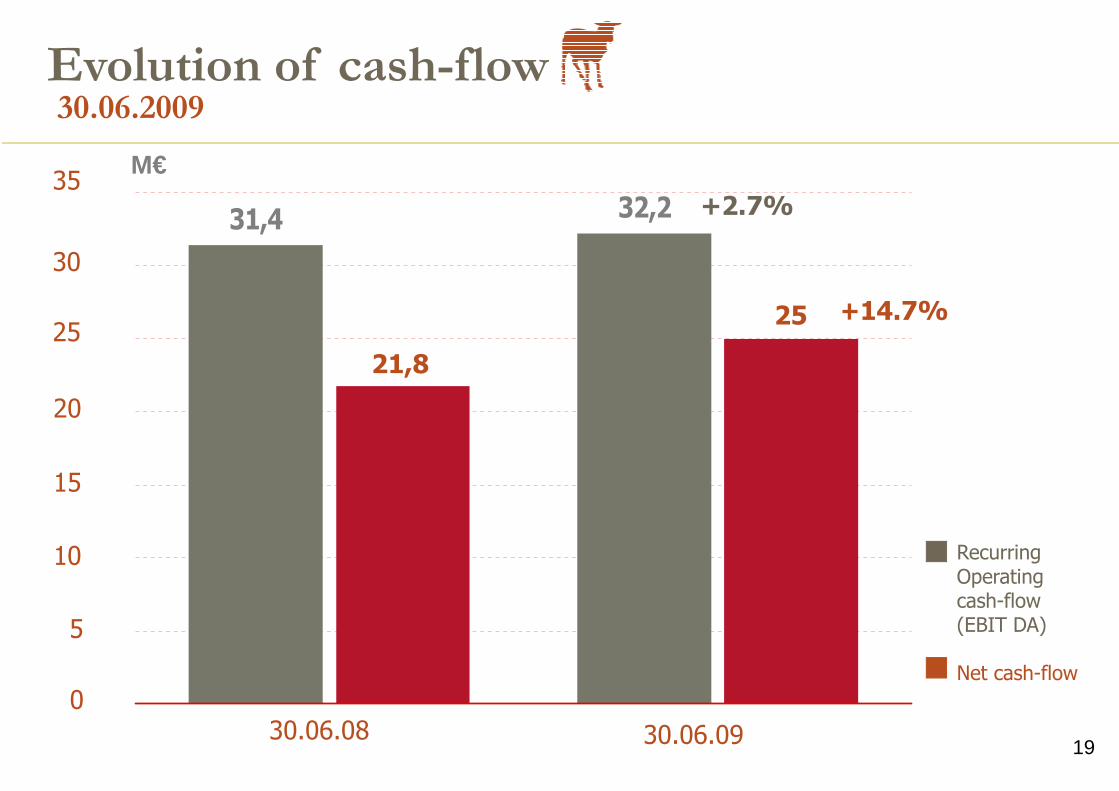
30.06.2009Evolution of cash-flow
RecurringOperating cash-flow (EBIT DA)
Net cash-flow
31,4 32,2
21,8
25 +14.7%
+2.7%
30
30.06.08
25
20
15
10
5
0
30.06.09
35M€
21,8
25
20
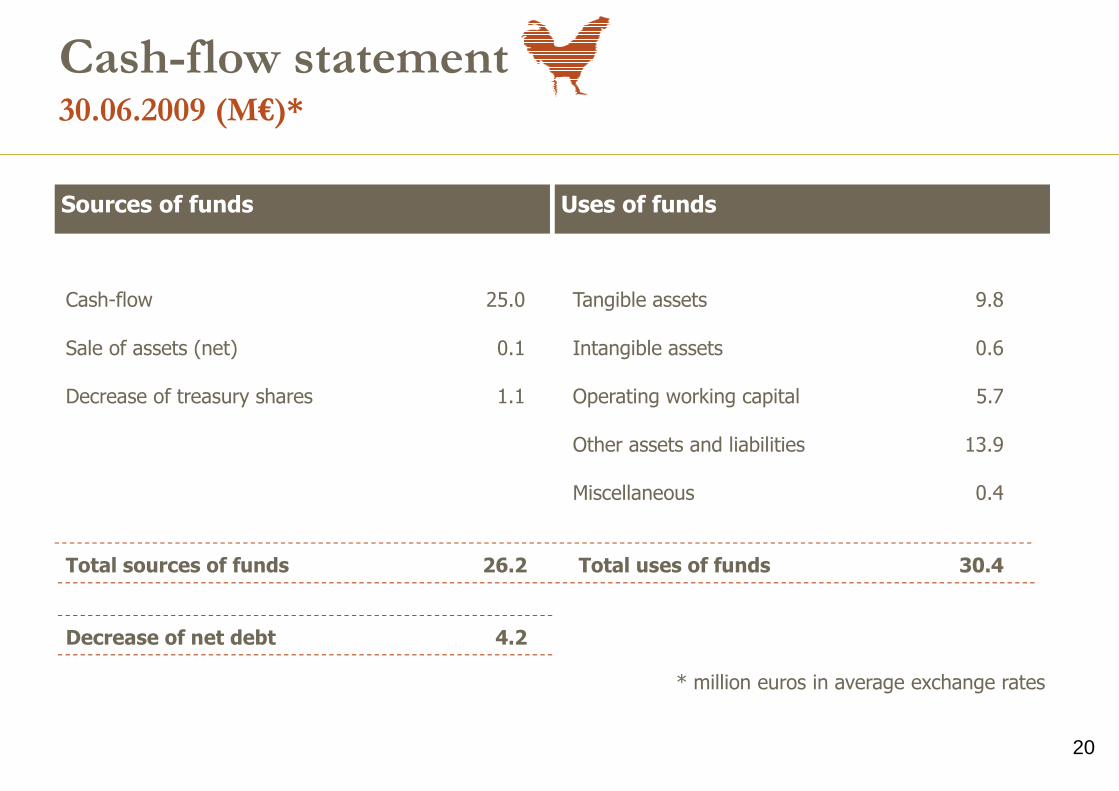
Cash-flow statement
Cash-flow 25.0 Tangible assets 9.8
Sale of assets (net) 0.1 Intangible assets 0.6
Decrease of treasury shares 1.1 Operating working capital 5.7
Other assets and liabilities 13.9
Miscellaneous 0.4
Total sources of funds 26.2 Total uses of funds 30.4
Decrease of net debt 4.2
30.06.2009 (M€)*
Sources of funds Uses of funds
* million euros in average exchange rates

21
30.06.08 30.06.09 30.06.08 30.06.09
INVESTED CAPITAL CAPITAL EMPLOYED
253.7
295.2
Shareholder’s equity
Minority interests +LT reserves
Net financial debt
Working capital
Fixed assets
253.7
295.2
Balance sheet analysis
43.4
210.3 243.1
52.1
180.6
14.3
58.8 (1)
208.6
17.1
69.5
30.06.2009
+16.4%
(1) 30.06.2008 = before the acquisition of the Schering-Plough products (25.4 M€)
Debt reductionoutside acquisitions:15 M€
M€
22
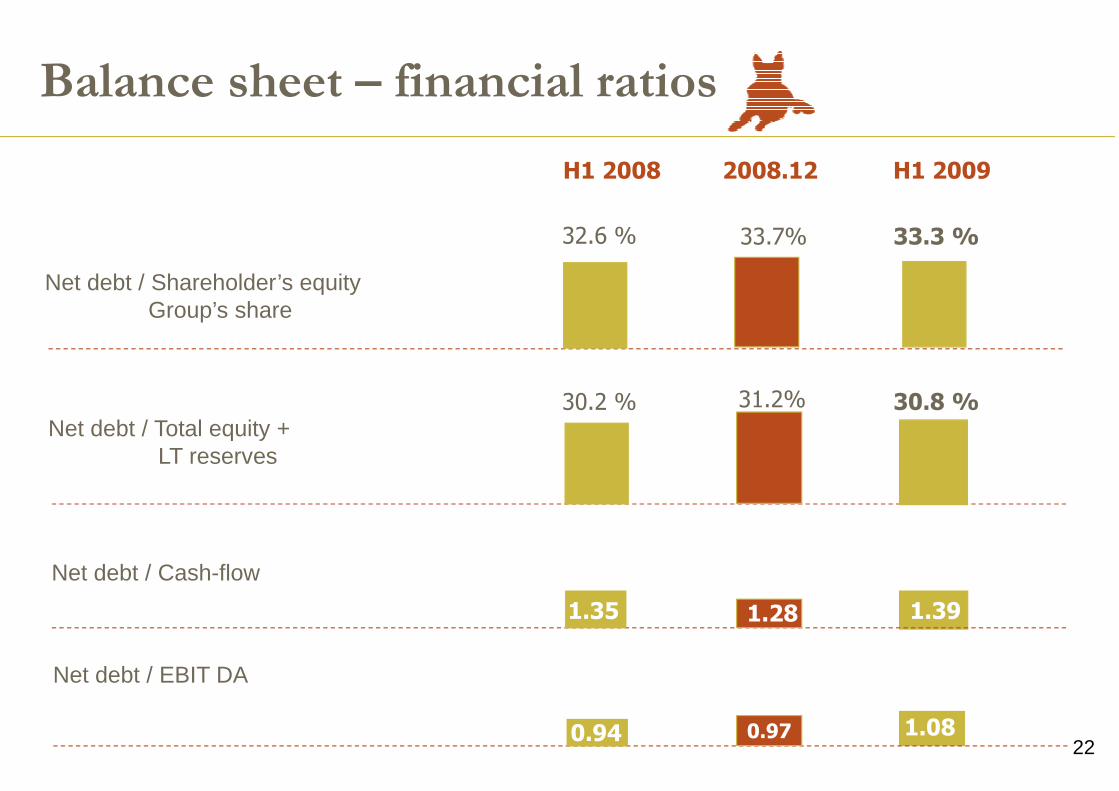
Balance sheet – financial ratios
H1 2008 2008.12 H1 2009
Net debt / Shareholder’s equity Group’s share
Net debt / Total equity + LT reserves
Net debt / Cash-flow
Net debt / EBIT DA
0.94
1.35
32.6 %
30.2 %
33.7%
31.2%
1.28
0.97 1.08
1.39
33.3 %
30.8 %
23
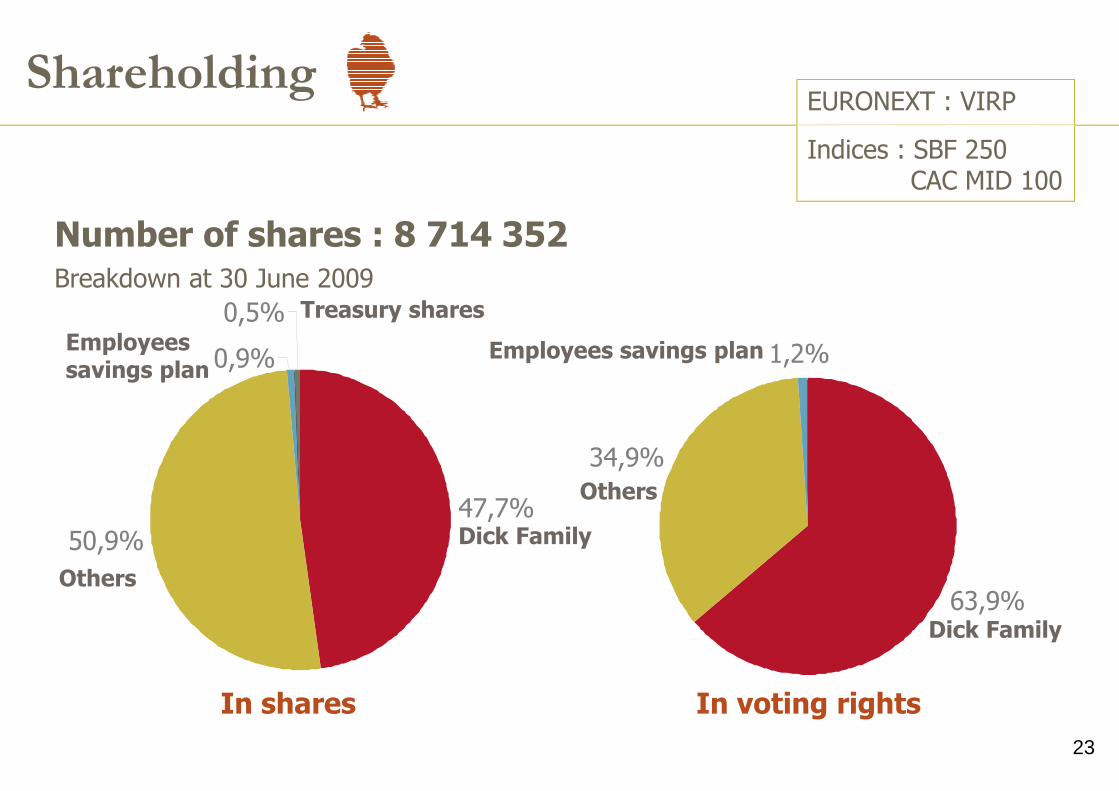
Shareholding
47,7%
50,9%
0,9%
0,5%
63,9%
34,9%
1,2%
Number of shares : 8 714 352Breakdown at 30 June 2009
In shares In voting rights
Dick Family
Dick Family
Others
Others
Treasury shares
Employees savings plan
Employees savings plan
EURONEXT : VIRP
Indices : SBF 250CAC MID 100
24
• Recent market trends and the performance of Virbac
• 2009 first half consolidated financials
• Growth levers and 2009 outlook
Agenda

25
Effipro / Fiproline
The Growth Levers
• Europe
� Launch, in almost all European countries in June 2009, with good results
� Difficulties in France linked to a quality defect of the Effipro spot-on pipette, that occurred in July and has been solved since
� Request for a variation of the Marketing Authorization by the French Agency. Marketing of Effipro spot-on stopped in France in July and unlikely to resume before 2010
• United States :
� Possible launch in 2011 (marketing authorization expected end of 2010 at federal level)
26
• Clinical studies :
� at 21 months : Efficacy statistically proven
� at 24 months (end of studies) : Results currently processed
CANILEISH Vaccine
• Marketing Authorization dossier to be filed in Q1 2010, in the likely event of a statistically proven efficacy at 24 months
• A small scale commercialization with a restricted status is possible in 2010
• Marketing at european level is conceivable in 2011, depending on the date of the Marketing Authorization and the scale up of production capacities.
27
• Latin America
• Eastern Europe
• Wyeth / Pfizer product portfolios
Acquisitions : ongoing projects
28
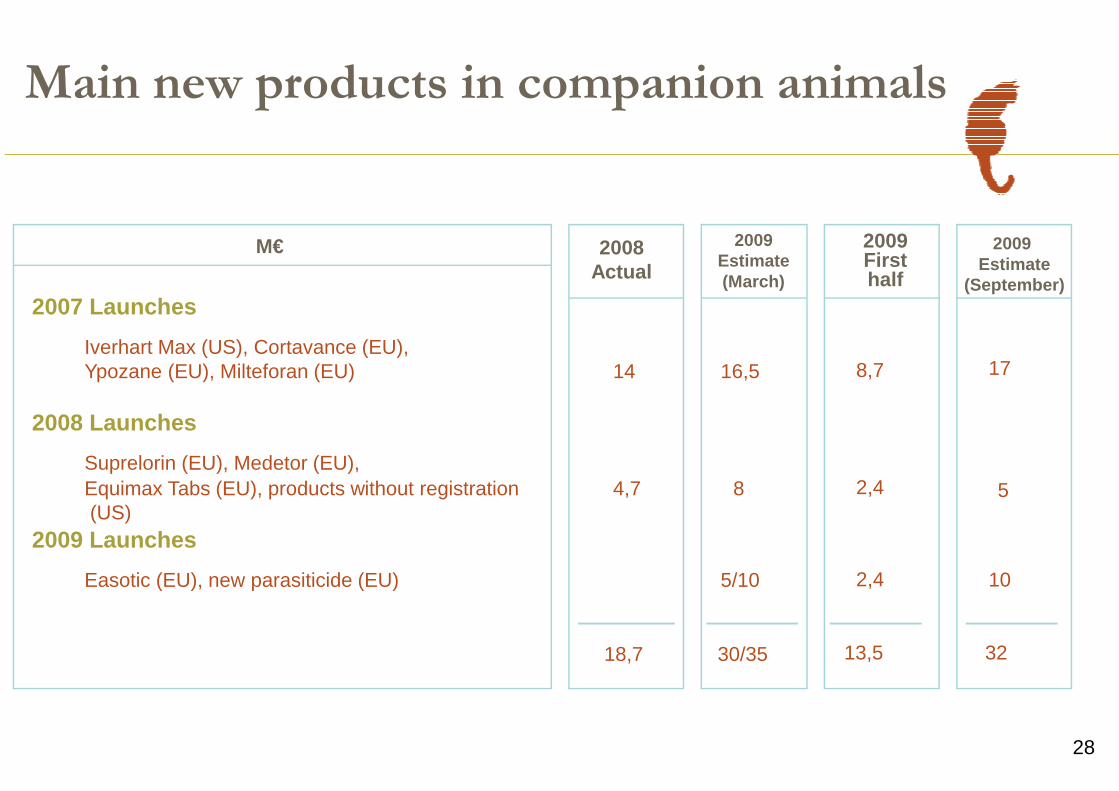
Main new products in companion animals
2008Actual
2009Estimate(March)
Iverhart Max (US), Cortavance (EU),Ypozane (EU), Milteforan (EU) 14 16,5
Suprelorin (EU), Medetor (EU),Equimax Tabs (EU), products without registration(US)
4,7 8
Easotic (EU), new parasiticide (EU) 5/10
18,7 30/35
M€ 2009First half
8,7
2,4
2,4
13,5
2009 Estimate
(September)
17
10
5
32
2007 Launches
2008 Launches
2009 Launches
29
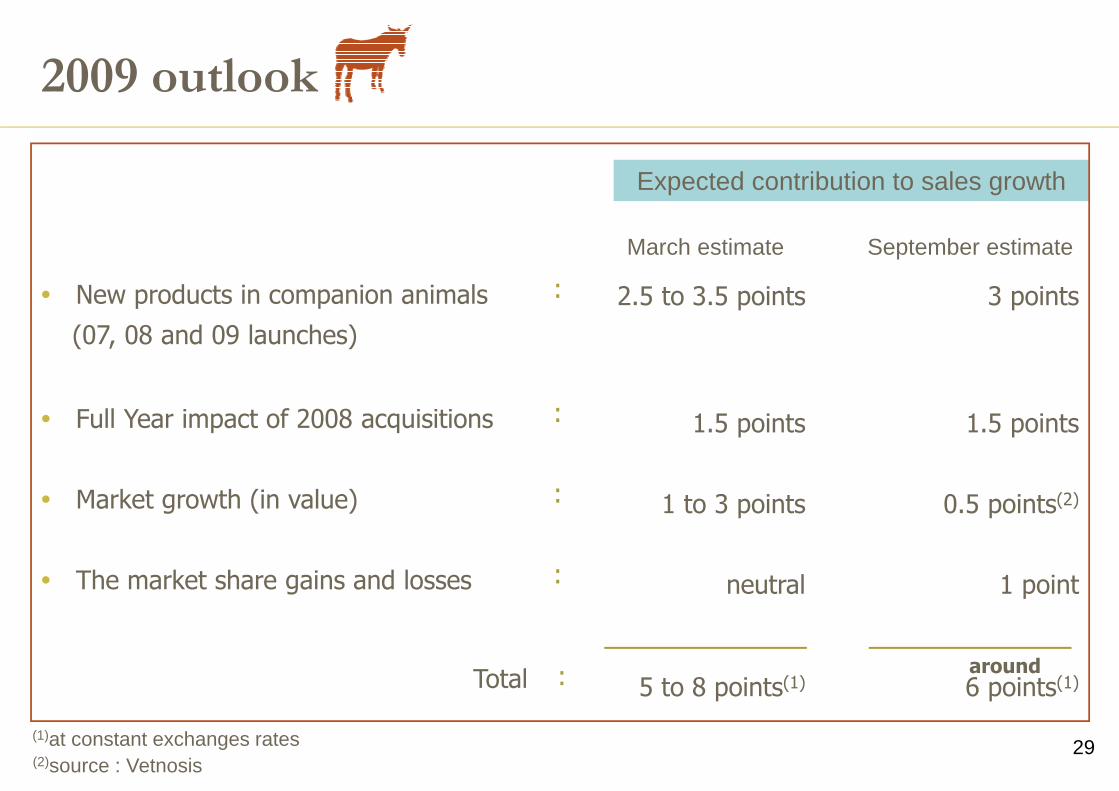
2.5 to 3.5 points
1.5 points
1 to 3 points
neutral
5 to 8 points(1)
2009 outlook
� New products in companion animals
(07, 08 and 09 launches)
� Full Year impact of 2008 acquisitions
� Market growth (in value)
� The market share gains and losses
:
:
:
:
:
Expected contribution to sales growth
(1)at constant exchanges rates
Total
3 points
1.5 points
0.5 points(2)
1 point
6 points(1)
March estimate September estimate
(2)source : Vetnosis
around

30
Thank you for your attention
Related Documents


