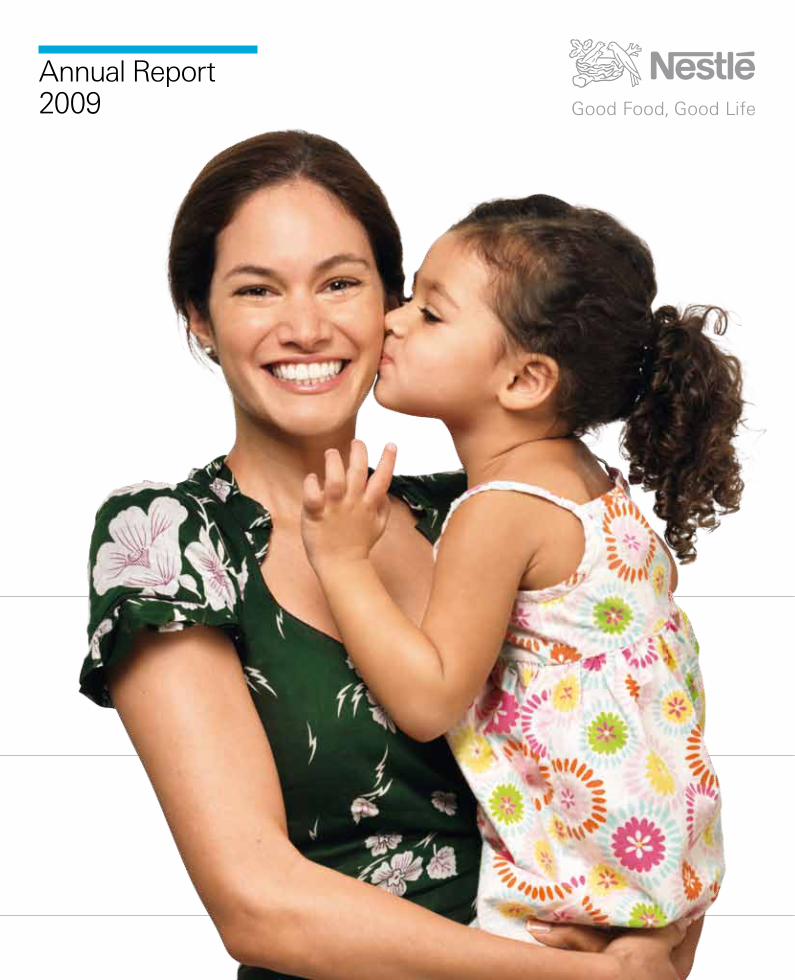
Annual Report 2009

2009 Annual Report En
Oct 24, 2015
2009 annual report giving a factual insight on the company
Welcome message from author
This document is posted to help you gain knowledge. Please leave a comment to let me know what you think about it! Share it to your friends and learn new things together.
Transcript
Annual Report 2009
Creating Shared Value Summary Report 2009
Corporate Governance Report 2009;2009 Financial Statements
Accompanying reports
The brands in italics are registered trademarks of the Nestlé Group.
Letter to our shareholdersBoard of Directors of Nestlé S.A.Executive Board of Nestlé S.A.
The Nestlé Roadmap to Good Food, Good LifeFour competitive advantagesFour growth driversFour operational pillars
Financial review Geographic data: people, factories and salesCorporate Governance and Compliance Shareholder information
Table of contents 267
8101214
16323436
Our objective is to be the recognised leader in Nutrition, Health and Wellness and the industry reference for financial performance
Corporate Governance Report 2009including Compensation Report 2009
2009 Financial Statements
Figures highlighted throughout the report with this symbol are tracked as Key Performance Indicators and summarised in the KPI table inside the front flap.
The brands in italics are registered trademarks of the Nestlé Group.
Creating Shared Value Summary Report 2009
Annual Report 2009 Corporate Governance Report 2009;2009 Financial Statements
Accompanying reports
A message from our Chairman and CEO About our reporting Overview of Creating Shared ValueAreas of focus and engagement Nutrition Water and environmental sustainability Rural developmentOur people Support for global principles and goals
Table of contents 12346
10162024
This is a summary report. Please see our full Creating Shared Value Report at www.nestle.com/csv
Cover: Through The Cocoa Plan, farmers like Nadège Akissi Kouakou (left) from Gagnoa, Côte d’Ivoire, receive high-yield cocoa plantlets and technical support from agronomist Kam-Rigne Laossi.
Opposite, left: Nestlé Chairman Peter Brabeck-Letmathe joins sixth graders from Seoul Soorak Elementary School, Republic of Korea, in a lesson about nutrition, delivered as part of the Healthy Kids Programme.
Opposite, right: Nestlé Chief Executive Officer Paul Bulcke visits a Maggi stand during a visit to a market in Ghana.
Corporate Governance Report 2009including Compensation Report 2009
2009 Financial Statements

© 2010, Nestlé S.A., Cham and Vevey (Switzerland)
The Annual Report contains forward looking statements which reflect Management’s current views and estimates. The forward looking statements involve certain risks and uncertainties that could cause actual results to differ materially from those contained in the forward looking statements. Potential risks and uncertainties include such factors as general economic conditions, foreign exchange fluctuations, competitive product and pricing pressures and regulatory developments.
In case of doubt or differences of interpretation, the English version shall prevail over the French and German text.
Concept and designNestec Ltd., Corporate Identity & Design, with Esterson Associates
PhotographyBoard pictures: Philippe Prêtre/APG ImageProducts and consumers: Matthew Donaldson
PrintingUD Print (Switzerland)
PaperThis report is printed on Arctic the Volume, a paper produced from well-managed forests and other controlled sources certified by the Forest Stewardship Council (FSC).
Key figures (consolidated)
In millions of CHF (except per share data)
Sales
EBIT (Group) Earnings Before Interest, Taxes, restructuring and impairments
as % of sales
EBIT (Food and Beverages) Earnings Before Interest, Taxes, restructuring and impairments
as % of sales (Food and Beverages)
Profit for the year attributable to shareholders of the parent Net profit (a)
as % of sales
as % of average equity attributable to shareholders of the parent
Capital expenditure
as % of sales
Equity attributable to shareholders of the parent before proposed appropriation of profit of Nestlé S.A.
Market capitalisation, end December
Operating cash flow
Free cash flow (b)
Net financial debt
Ratio of net financial debt to equity (gearing)
Per share
Total basic earnings per share (a) CHF
Underlying (c) CHF
Equity attributable to shareholders of the parent before proposed appropriation of profit of Nestlé S.A. CHF
Dividend as proposed by the Board of Directors of Nestlé S.A. CHF
EBIT In millions of CHF
15 000
13 000
11 000
Net profit (a)
In millions of CHF
18 000
12 000
6 000
Dividend per shareIn CHF
1.60
1.30
1.00
Capital expenditure In millions of CHF
5 000
4 250
3 500
EBIT marginIn %
14
13
12
Earnings per shareIn CHF
4.50
3.00
1.50
Underlying (c)
Total (a)
Total cash returned to shareholdersIn billions of CHF
12
8
4
Share Buy-Back
Dividend
Return on invested capital (d)
In %
33
22
11
Including goodwill
Excluding goodwill
(a) 2008 comparatives benefited from the profit on disposal of 24.8% of Alcon outstanding capital. (b) Operating cash flow less capital expenditure, disposal of tangible assets, purchase and disposal of intangible assets, movement with associates as well as with non-controlling interests. (c) Profit per share for the year attributable to shareholders of the parent before impairments, restructuring costs, results on disposals and significant one-off items. The tax impact from the adjusted items is also adjusted for. (d) ROIC calculation was amended in 2009 following changes in segment reporting. 2008 figures have been restated accordingly.
11 876
2005
13 302
2006
15 024
2007
15 676
2008
15 699
2009
13.0
2005
13.5
2006
14.0
2007
14.3
2008
14.6
2009
0.90
2005
8 081
2005
1.04
2006
+15.6%
+17.3%+14.8%
+14.3%
9 197
2006
1.22
2007
1.40
2008
1.60
2009
10 649
2007
18 039
2008
10 428
2009
1.3
3.1
2005
2.7
3.5
2006
4.4
4.0
2007
8.7
4.6
2008
7.0
5.0
2009
2.15
2.08
2005
2.41
2.39
2006
2.80
2.78
2007
2.82
4.87
2008
3.09
2.92
2009
3 375
2005
4 200
2006
4 971
2007
4 869
2008
4 641
2009
11.4
20.8
2005
11.7
21.2
2006
12.2
22.2
2007
14.7
34.8
2008
15.6
35.1
2009
2009
107 618
15 699
14.6%
13 083
13.1%
10 428
9.7%
20.9%
4 641
4.3%
48 915
174 294
17 934
12 369
18 085
37.0%
2.92
3.09
13.69
1.60
2008
109 908
15 676
14.3%
13 103
12.8%
18 039
16.4%
34.9%
4 869
4.4%
50 774
150 409
10 763
5 033
14 596
28.7%
4.87
2.82
13.71
1.40

Annual Report 2009
Creating Shared Value Summary Report 2009
Corporate Governance Report 2009;2009 Financial Statements
Accompanying reports
The brands in italics are registered trademarks of the Nestlé Group.
Letter to our shareholdersBoard of Directors of Nestlé S.A.Executive Board of Nestlé S.A.
The Nestlé Roadmap to Good Food, Good LifeFour competitive advantagesFour growth driversFour operational pillars
Financial review Geographic data: people, factories and salesCorporate Governance and Compliance Shareholder information
Table of contents 267
8101214
16323436
Our objective is to be the recognised leader in Nutrition, Health and Wellness and the industry reference for financial performance
Corporate Governance Report 2009including Compensation Report 2009
2009 Financial Statements
Figures highlighted throughout the report with this symbol are tracked as Key Performance Indicators and summarised in the KPI table inside the front flap.
The brands in italics are registered trademarks of the Nestlé Group.
Creating Shared Value Summary Report 2009
Annual Report 2009 Corporate Governance Report 2009;2009 Financial Statements
Accompanying reports
A message from our Chairman and CEO About our reporting Overview of Creating Shared ValueAreas of focus and engagement Nutrition Water and environmental sustainability Rural developmentOur people Support for global principles and goals
Table of contents 12346
10162024
This is a summary report. Please see our full Creating Shared Value Report at www.nestle.com/csv
Cover: Through The Cocoa Plan, farmers like Nadège Akissi Kouakou (left) from Gagnoa, Côte d’Ivoire, receive high-yield cocoa plantlets and technical support from agronomist Kam-Rigne Laossi.
Opposite, left: Nestlé Chairman Peter Brabeck-Letmathe joins sixth graders from Seoul Soorak Elementary School, Republic of Korea, in a lesson about nutrition, delivered as part of the Healthy Kids Programme.
Opposite, right: Nestlé Chief Executive Officer Paul Bulcke visits a Maggi stand during a visit to a market in Ghana.
Corporate Governance Report 2009including Compensation Report 2009
2009 Financial Statements
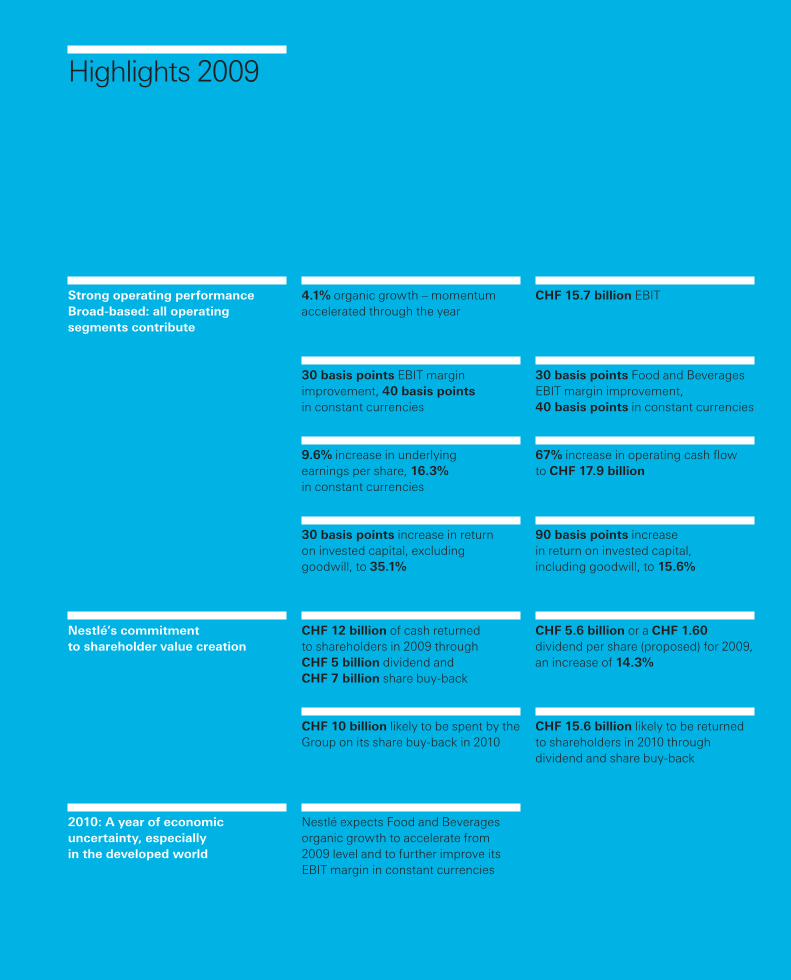
Highlights 2009
4.1% organic growth – momentum accelerated through the year
30 basis points EBIT margin improvement, 40 basis points in constant currencies
9.6% increase in underlying earnings per share, 16.3% in constant currencies
30 basis points increase in return on invested capital, excluding goodwill, to 35.1%
CHF 15.7 billion EBIT
30 basis points Food and Beverages EBIT margin improvement, 40 basis points in constant currencies
67% increase in operating cash flow to CHF 17.9 billion
90 basis points increase in return on invested capital, including goodwill, to 15.6%
Strong operating performance Broad-based: all operating segments contribute
Nestlé’s commitment to shareholder value creation
2010: A year of economic uncertainty, especially in the developed world
CHF 12 billion of cash returned to shareholders in 2009 through CHF 5 billion dividend and CHF 7 billion share buy-back
CHF 10 billion likely to be spent by the Group on its share buy-back in 2010
CHF 5.6 billion or a CHF 1.60 dividend per share (proposed) for 2009, an increase of 14.3%
CHF 15.6 billion likely to be returned to shareholders in 2010 through dividend and share buy-back
Nestlé expects Food and Beverages organic growth to accelerate from 2009 level and to further improve its EBIT margin in constant currencies
Nestlé Annual Report 200922
Letter to our shareholders
Fellow shareholders,
In our letter last year we said that we hoped that 2009 would shape a world which would be more stable and sustainable, and ultimately more just and prosperous for everyone. Although we are not there as yet, there are signs of improvement, as economies begin to recover and consumer confidence returns, driven by government intervention, economic stimuli and hopes of a sustained improvement in standards of living. The global economic recovery remains somewhat fragile, however, with high unemployment and deficits as well as slow growth in the developed world. So, whilst we believe there will be a better environment in 2010, the degree of improvement is not certain.
We said in 2009 that we thought the notion of trust was central to the crisis. Trust, therefore, is central also to the recovery: between business partners, between legislators and industry, and between companies and the consumers of their products. Nestlé, as a food and beverage company whose products are consumed around the world, could be described as being in the business of trust. We know that trust needs to be earned with all stakeholders product by product, brand by brand, consumer by consumer, and we understand that trust is also about corporate behaviour. This, perhaps, is truer than ever in a time of crisis and was one reason why we increased our investment in
consumer communication in 2009: to ensure that we understood how consumers’ needs and priorities were changing and to keep them abreast of how we were adapting our product ranges and offerings to their needs.
Your Company has the privilege of being deeply integrated into households around the globe, with many consumers buying our products on a daily basis. This gives us a wonderful opportunity to contribute meaningfully to the quality of their lives through our mission of “Good Food, Good Life”. That mission is to provide consumers with the best tasting, most nutritious choices in a wide range of food and beverage categories and eating occasions, from morning to night, and thereby to help them to live enjoyable, healthy lives.
That close integration also means, however, that Nestlé was likely to be touched by a recession that impacted families around the world, and especially in developed countries. The resulting weak level of consumer demand as well as raw material cost pressure and related pricing, intense competition amongst branded and non-branded manufacturers, as well as currency depreciations and political uncertainty in different parts of the world all combined to make 2009 a particularly challenging year. Equally, the economic slowdown in many countries caused their currencies to fall in value compared with Nestlé’s reporting currency, the Swiss franc.
The Company’s performance should be seen in that context, and with progress made in all key financial metrics, and with all major operations and all parts of the world contributing, it demonstrates the strength and resilience of your Company.
Nestlé’s organic sales growth was 4.1%, including real internal growth (RIG) of 1.9% and pricing of 2.2%. This growth, achieved despite many countries having a negative GDP development, is testament to the strength of our brands, as well as to the speed with which our people responded to the challenging
environments they faced. It also demonstrates the benefit of our policy, regardless of the economic environment, of investing continuously in our brands through R&D and marketing. Both increased again in 2009. The strength of the Swiss franc relative to many other currencies had a –5.5% impact on Nestlé’s reported sales which, with a –0.7% impact from divestitures, net of acquisitions, resulted in a fall of –2.1% to CHF 107.6 billion.
Despite the higher levels of investment in marketing and R&D, the EBIT rose to CHF 15.7 billion and the EBIT margin increased by 30 basis points to 14.6%, or by 40 basis points in constant currencies. Our Food and Beverages business achieved 3.9% organic growth and a 30 basis points improvement in its EBIT margin, 40 basis points in constant currencies. The foundation for this performance was a strong delivery, above target, of efficiency gains in our operations, distribution activities and administrative costs, as well as the continued positive trend in organic growth. The underlying earnings per share were up by 9.6% to CHF 3.09 per share. The reported net profit in 2009 is not comparable to 2008 because of the profit on the sale of 24.8% of Alcon in 2008.
The quality of the Group’s 2009 performance met the demands of our total performance framework, in that the operating cash flow and the return on invested capital both also improved. A key contributor to the CHF 7.2 billion increase in operating cash flow was the improvement in working capital. The Group’s return on invested capital increased by 90 basis points to 15.6%, including goodwill, and by 30 basis points, excluding goodwill, to 35.1%.
Nestlé is known for its long-term thinking, characterised in 2009 by our continued investment in our people, our operations and distribution, our brands and innovation, but it was our short-term action-oriented entrepreneurialism that made the difference to our performance in 2009. This performance demonstrated

3Nestlé Annual Report 2009 3
Your Company has the privilege of being deeply integrated into households around the globe, with many consumers buying our products on a daily basis. This gives us a wonderful opportunity to contribute meaningfully to the quality of their lives through our mission of “Good Food, Good Life”.

Nestlé Annual Report 20094
the significant benefit of having our people aligned behind a consistent, clear and cohesive strategy, combined with a high level of discipline in timely execution, as well as a focus on acceleration in operational performance. These are all aspects of our roadmap, discussed later in this report. Our policy, meanwhile of having devolved responsibilities throughout the organisation, has enabled our people to respond quickly to the changing dynamics in their markets.
We continued to invest for the future in 2009. Capital expenditure was 4.3% of sales, as we opened new factories and R&D centres. We remained vigilant for bolt-on acquisitions that combine a good strategic fit with appropriate financial returns. The most significant of these was the acquisition of Kraft Pizza announced on 5 January 2010. Your Board also announced an increase of CHF 3 billion in the amount of our shares to be bought back in 2009, to CHF 7 billion. We continued to challenge underperformers with an active programme of product rationalisation, and to prune some non-strategic assets, as well as to simplify our business and reduce associated costs in areas such as legal structures.
The most significant divestment was announced on 4 January 2010, with the agreement to sell our remaining holding in Alcon, for about USD 28 billion. The completion of this transaction will bring the total value realised from the three-part disposal of Alcon to over USD 40 billion. Alcon was acquired by Nestlé in 1977 for USD 280 million. The enormous value created for Nestlé’s shareholders over that time is a great credit to the past and present management of Alcon, as well as to Nestlé, and we thank everybody who has contributed.
The completion of the Alcon disposal will strengthen your Company’s balance sheet in 2010 and beyond. Your Board has reviewed Nestlé’s capital structure and believes that, over the longer term, a structure
Nestlé is known for its long-term thinking, characterised in 2009 by our continued investment in our people, our operations and distribution, our brands and innovation, but it was our short-term action-oriented entrepreneurialism that made the difference to our performance in 2009.
5Nestlé Annual Report 2009
Peter Brabeck-LetmatheChairman of the Board
Paul BulckeChief Executive Officer
that is in line with Nestlé’s 2009 credit ratings is appropriate. With that in mind, we announced our intention to buy back at least an additional CHF 10 billion of Nestlé’s shares over the next two years, once the current programme is completed, meaning that we will buy back about CHF 15 billion of shares during 2010 and 2011, and about CHF 35 billion between 2007 and 2011.
We will be proposing to shareholders a dividend of CHF 1.60 per share, an increase of 14.3%. This represents a payout ratio of 51.8% and reflects a dividend policy of sharing the underlying earnings of the Company with shareholders every year. We believe that this dividend policy, together with the Share Buy-Back Programmes, underlines your Board’s commitment to sustainably enhance the Company’s value creation for its shareholders.
Your Board has always believed that a company can only create long-term value for its shareholders if it is also creating value for society as a whole. Nestlé, as the largest food and beverages manufacturer in the world, is one of the most geographically diverse companies and touches more communities than most. As such, our objective to create value for society at large is integral to our way of doing business and is encapsulated in what we call “Creating Shared Value”. In April 2009, we announced that we would focus particularly on three areas that are very close to our business: addressing nutritional deficiencies, the challenge of water scarcity and the development of rural communities in emerging countries. These areas can benefit the people we touch and are essential building blocks for Nestlé to become the world’s recognised leading Nutrition, Health and Wellness company. As such they are also absolutely aligned with “Good Food, Good Life”. They are discussed in more detail in the accompanying Creating Shared Value Summary Report.
There was one change to the Executive Board during 2009.
Francisco Castañer retired at the end of the year after 45 years with the Group and 12 years on the Executive Board. We would like to thank him for his great service, as well as for agreeing to continue to represent Nestlé on the Boards of Alcon, L’Oréal and Galderma. Jean-Marc Duvoisin, who joined Nestlé in 1986, will take over responsibility for Human Resources and Center Administration. He was appointed to the Executive Board as a Deputy Executive Vice President on 1 January 2010.
Two new directors will be proposed to shareholders at the 2010 Annual General Meeting. Mrs Titia de Lange, a Dutch national, is a specialist in cell biology and genetics and has a strong research background that will contribute significantly to the Board’s scientific knowledge. Mr Jean-Pierre Roth, a Swiss national, is the former Chairman of the Governing Board of the Swiss National Bank and was the Chairman of the Board of Directors of the Bank for International Settlements. It was with great sadness that the Board of Directors learned of the death of Lord Edward George in April. He had been on the Board since 2004 and had brought to it the expertise, judgement and wisdom that had characterised his time as Governor of the Bank of England.
The economic environment made 2009 a tough year for everyone. We would like, therefore, more than ever, to thank our people all over the world for their commitment day after day to doing their best to make us continually better in everything that we do. We said last year that we would strive to improve our results in 2009, even despite the environment.
The fact that we were able to do so is due to the efforts of our people, and we thank them for their great contributions.
As for the trading environment in 2010, we have already said that it is far from clear how 2010 will unfold. Your Company has demonstrated its resilience and strength in 2009, and this gives us confidence that it will continue to make progress in 2010.Consequently, in spite of continued economic uncertainty in 2010, especially in developed countries, Nestlé expects its Food and Beverages business to achieve higher organic growth than in 2009 and further increase its EBIT margin in constant currencies for the year as a whole.

Nestlé Annual Report 20096
Board of Directors of Nestlé S.A.at 31 December 2009
Peter Brabeck-Letmathe (3, 5)
ChairmanTerm expires 2012 (1, 2)
Jean-René Fourtou (3, 4)
Chairman of the Supervisory Board, Vivendi.Term expires 2011 (1, 2)
Paul Bulcke (3)
Chief Executive OfficerTerm expires 2011 (1, 2)
Rolf Hänggi (3, 6)
2nd Vice Chairman Chairman, Rüd, Blass & Cie AG, Bankers. Term expires 2011 (1, 2)
Jean-Pierre Meyers (4)
Vice Chairman, L’Oréal S.A. Term expires 2011 (1, 2)
Naïna Lal Kidwai (6)
Group General Manager and Country Head of HSBC Group Companies in India.Term expires 2011 (1, 2)
Beat Hess (6)
Group Legal Director, Royal Dutch Shell plc.Term expires 2011 (1, 2)
Carolina Müller-Möhl (5)
President, Müller-Möhl Group.Term expires 2012 (1, 2)
Daniel Borel (4)
Co-founder and Board member, Logitech International S.A. Term expires 2012 (1, 2)
André Kudelski (6)
Chairman and CEO, Kudelski Group.Term expires 2011 (1, 2)
Steven G. Hoch (5)
Founder and Senior Partner, Highmount Capital.Term expires 2011 (1, 2)
Andreas Koopmann (3, 4, 5)
1st Vice Chairman Former CEO, Bobst Group. Term expires 2011 (1, 2)
Helmut O. Maucher Honorary Chairman
(1) On the date of the Annual General Meeting.(2) As Nestlé’s revised Articles of Association, adopted on 10 April 2008, provide for three-year terms, all members of the Board will be re-elected over the course of the following three years.(3) Chairman’s and Corporate Governance Committee.
(4) Compensation Committee.(5) Nomination Committee.(6) Audit Committee.
For further information on the Board of Directors please refer to the Corporate Governance Report 2009, enclosed.
David P. Frick Secretary to the Board
KPMG SA Geneva branch Independent auditors. Term expires 2010 (1)
7Nestlé Annual Report 2009
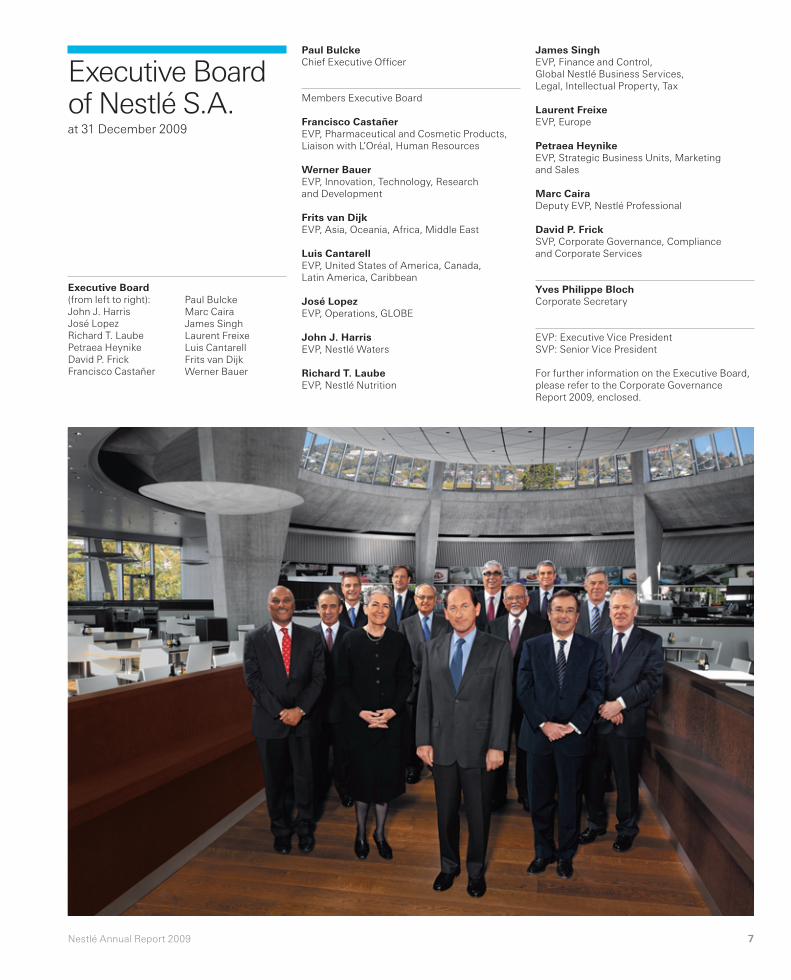
Executive Board of Nestlé S.A.at 31 December 2009
Paul Bulcke Chief Executive Officer
Members Executive Board
Francisco Castañer EVP, Pharmaceutical and Cosmetic Products, Liaison with L’Oréal, Human Resources
Werner BauerEVP, Innovation, Technology, Research and Development
Frits van DijkEVP, Asia, Oceania, Africa, Middle East
Luis CantarellEVP, United States of America, Canada, Latin America, Caribbean
José LopezEVP, Operations, GLOBE
John J. HarrisEVP, Nestlé Waters
Richard T. LaubeEVP, Nestlé Nutrition
Executive Board (from left to right):John J. HarrisJosé LopezRichard T. LaubePetraea HeynikeDavid P. FrickFrancisco Castañer
Paul BulckeMarc CairaJames SinghLaurent FreixeLuis CantarellFrits van DijkWerner Bauer
James SinghEVP, Finance and Control, Global Nestlé Business Services, Legal, Intellectual Property, Tax
Laurent FreixeEVP, Europe
Petraea HeynikeEVP, Strategic Business Units, Marketing and Sales
Marc CairaDeputy EVP, Nestlé Professional
David P. FrickSVP, Corporate Governance, Compliance and Corporate Services
Yves Philippe BlochCorporate Secretary
EVP: Executive Vice President SVP: Senior Vice President
For further information on the Executive Board, please refer to the Corporate Governance Report 2009, enclosed.
Nestlé Annual Report 20098
The Nestlé Roadmap to Good Food, Good Life
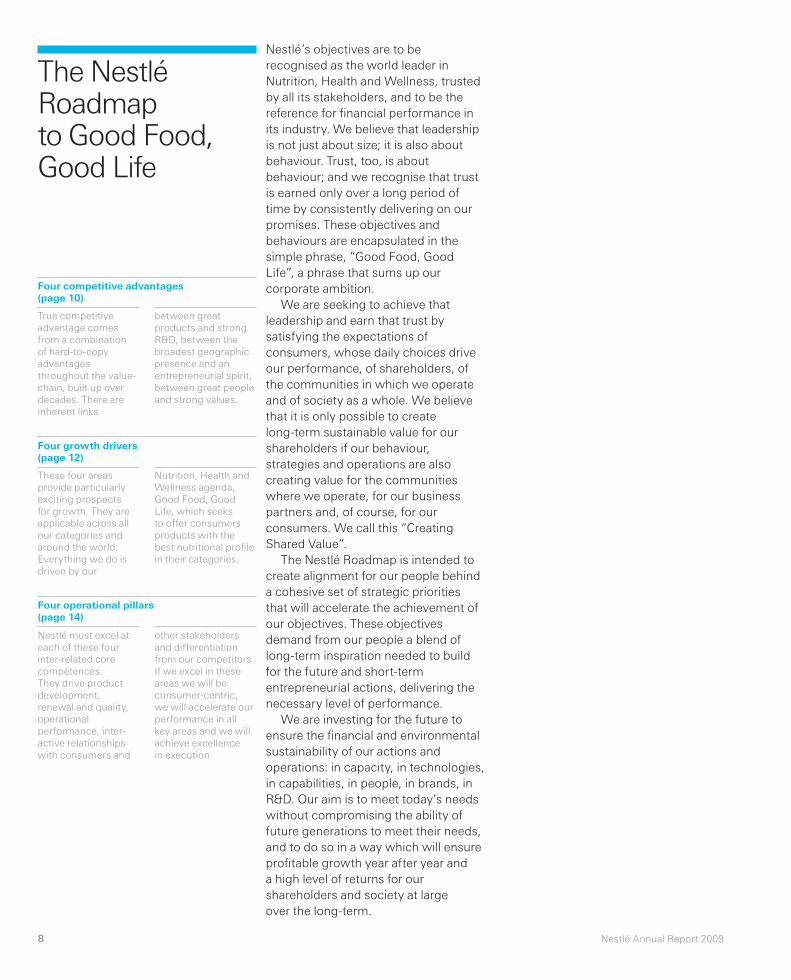
Nestlé’s objectives are to be recognised as the world leader in Nutrition, Health and Wellness, trusted by all its stakeholders, and to be the reference for financial performance in its industry. We believe that leadership is not just about size; it is also about behaviour. Trust, too, is about behaviour; and we recognise that trust is earned only over a long period of time by consistently delivering on our promises. These objectives and behaviours are encapsulated in the simple phrase, “Good Food, Good Life”, a phrase that sums up our corporate ambition.
We are seeking to achieve that leadership and earn that trust by satisfying the expectations of consumers, whose daily choices drive our performance, of shareholders, of the communities in which we operate and of society as a whole. We believe that it is only possible to create long-term sustainable value for our shareholders if our behaviour, strategies and operations are also creating value for the communities where we operate, for our business partners and, of course, for our consumers. We call this “Creating Shared Value”.
The Nestlé Roadmap is intended to create alignment for our people behind a cohesive set of strategic priorities that will accelerate the achievement of our objectives. These objectives demand from our people a blend of long-term inspiration needed to build for the future and short-term entrepreneurial actions, delivering the necessary level of performance.
We are investing for the future to ensure the financial and environmental sustainability of our actions and operations: in capacity, in technologies, in capabilities, in people, in brands, in R&D. Our aim is to meet today’s needs without compromising the ability of future generations to meet their needs, and to do so in a way which will ensure profitable growth year after year and a high level of returns for our shareholders and society at large over the long-term.
True competitive advantage comes from a combination of hard-to-copy advantages throughout the value-chain, built up over decades. There are inherent links
between great products and strong R&D, between the broadest geographic presence and an entrepreneurial spirit, between great people and strong values.
These four areas provide particularly exciting prospects for growth. They are applicable across all our categories and around the world. Everything we do is driven by our
Nutrition, Health and Wellness agenda, Good Food, Good Life, which seeks to offer consumers products with the best nutritional profile in their categories.
Nestlé must excel at each of these four inter-related core competences. They drive product development, renewal and quality, operational performance, inter-active relationships with consumers and
other stakeholders and differentiation from our competitors. If we excel in these areas we will be consumer-centric, we will accelerate our performance in all key areas and we will achieve excellence in execution.
Four competitive advantages (page 10)
Four growth drivers (page 12)
Four operational pillars (page 14)

Unmatched product
and brand portfolio
Nutrition, Health and Wellness
Innovation & renovation
Unmatched geographic presence
Out-of-home consumption
Whenever,wherever, however
Unmatched research and development
capability
Emerging markets and
Popularly Positioned Products
Operationalefficiency
People, culture, values and attitude
PremiumisationConsumer
communication
Competitive advantages
Growth drivers
Operationalpillars
Our objective is to be the recognised leader in Nutrition,
Health and Wellness, and the industry reference for
financial performance
Creating Shared Value Nestlé culture and values
C
ompl
ianc
e –
Sust
ainab
ility

Nestlé Annual Report 20091010
Four competitive advantages
Unmatched product and brand portfolioNestlé’s product and brand portfolio is characterised by strong market positions, often leadership. It is focused and diverse: focused in that 75% of sales are accounted for by about 30 brands; diverse in that we have strong local brands, in a good spread of categories, cherished by consumers over many generations. Our consumer is local, with local taste preferences, local eating traditions and unique expectations. Our understanding of these differences ensures our global brands are relevant locally to consumers everywhere. Nescafé coffee, for example, comes in many variations, adapted to local tastes and preferences.
Unmatched research and development capabilityUnseen behind our portfolio of brands is the impetus from R&D that provides fuel for growth through consumer-centric innovation and renovation, through creating product differentiation and by providing variety; through focusing on taste and those consumer benefits most relevant to Nestlé’s products and by pushing barriers in nutritional science. But our R&D goes beyond food to encompass new products, packaging, technology and manufacturing, particularly focused on environmental performance.
Unmatched geographic presenceThe uniqueness of Nestlé’s global presence is linked to our history: soon after Nestlé was founded, it wanted to expand beyond its relatively small domestic Swiss market; today, Nestlé’s presence in many markets, including emerging markets, dates back for many generations, over 100 years in some cases.
This has created very close relationships between our brands and their consumers, as well as an in-depth understanding of our consumers and an expertise in related trends. It has also enabled us to develop local management teams,
build local manufacturing and R&D and establish local supply-chain initiatives including long-term relationships with farmers and other suppliers.
People, culture, values and attitudeHow can a CHF 100 billion company with 278 000 people really be entrepreneurial? Nestlé achieves this through a decentralised structure with devolved responsibilities and accountabilities that encourages an entrepreneurial spirit within our operations and is balanced by a cohesive strategic direction and tight financial controls. Strong cohesion is also consolidated through our embedded company culture based on sharing our common values. We manage for the longer term, we have patience as new initiatives gestate, we are open to risk, but we are also fast-moving and focused on the competitive challenges in the marketplace. It is these marketplaces, around the globe, that shape our world of food, and it is our people who are closest to these markets who take the key decisions about local innovation, communication and launches.
Unmatched product and brand portfolio
90% of sales are No. 1 or No. 2 in their market; 28 brands had sales over CHF 1 bio and achieved 5.8% organic growth in 2009; Focused on 9 categories
Unmatched research and development capability
CHF 2.0 bio spend in R&D; Over 5200 employees in Food & Beverages R&D; 300 external R&D relationships – open innovations
Unmatched geographic presence
140+ countries;449 factories globally, with 220 in emerging markets; 540 000 farmers receive assistance from 950 agronomists directly employed by Nestlé; 3 400 000 people earn livelihoods from Nestlé supply chain in emerging markets
People, culture, values and attitude
100+ nationalities working at Nestlé; Long-term inspiration, short-term action; Devolved responsibilities and accountabilities; 42% of local Management Committee members native to country in developing countries
Key facts in 2009
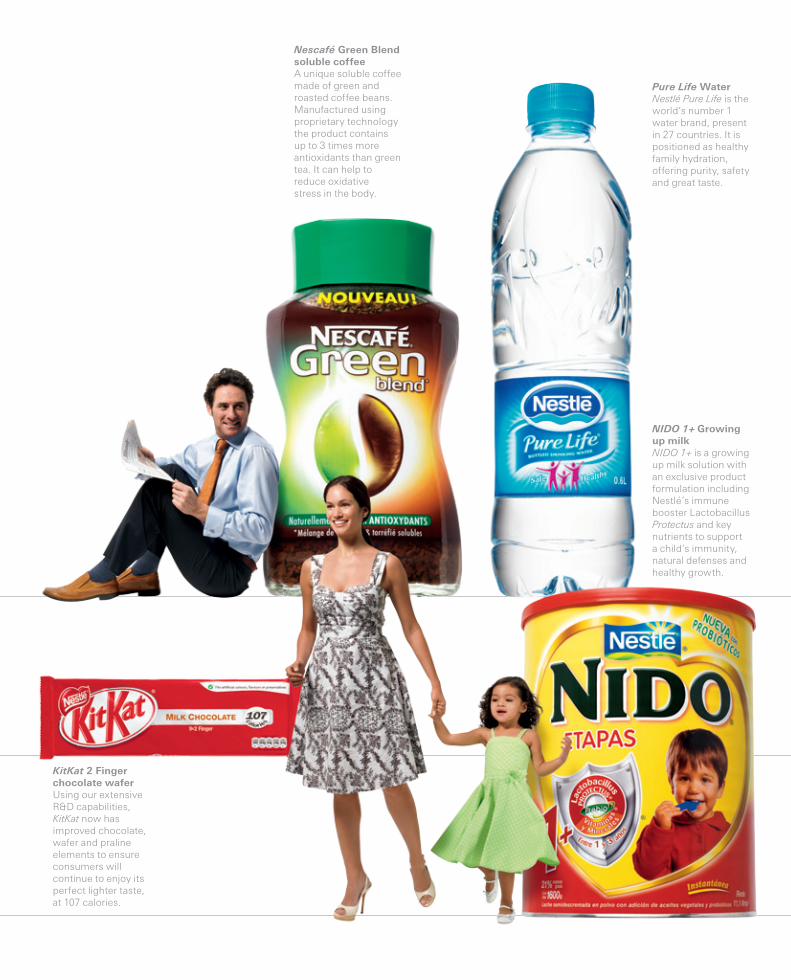
Nescafé Green Blend soluble coffeeA unique soluble coffee made of green and roasted coffee beans. Manufactured using proprietary technology the product contains up to 3 times more antioxidants than green tea. It can help to reduce oxidative stress in the body.
Pure Life WaterNestlé Pure Life is the world’s number 1 water brand, present in 27 countries. It is positioned as healthy family hydration, offering purity, safety and great taste.
NIDO 1+ Growing up milkNIDO 1+ is a growing up milk solution with an exclusive product formulation including Nestlé’s immune booster Lactobacillus Protectus and key nutrients to support a child’s immunity, natural defenses and healthy growth.
KitKat 2 Finger chocolate waferUsing our extensive R&D capabilities, KitKat now has improved chocolate, wafer and praline elements to ensure consumers will continue to enjoy its perfect lighter taste, at 107 calories.

Nestlé Annual Report 20091212
Four growth drivers
Nutrition, Health and WellnessNestlé’s cornerstone, and its inspiration, is its Nutrition, Health and Wellness agenda, encapsulated in the expression “Good Food, Good Life”. It is the non-negotiable starting point for the strategy of each of our food and beverage product groups. We make products which are consumed by millions of consumers on multiple occasions every day, and which meet the realities of consumers, such as their need for pleasure, balance and clear nutritional advice. Our Company’s science-based nutritional expertise allows us to leverage our innovation across all our products and all of our brands. This gives us a privileged position to bring improved taste and nutrition, enjoyment and pleasure, to consumers in a meaningful way on multiple occasions throughout every day of their lives. We aim to do this by ensuring that our product launches are nutritionally superior to those of our main competitors and, of course, that they taste better. We call this 60/40+. It is important because, more and more, consumers want not just good taste but good nutrition too. This trend will accelerate, making Nutrition, Health and Wellness a growth driver for years to come. Consumers also seek products that address specific nutritional needs. We address some of those needs through Nestlé Nutrition, focused on infant nutrition, healthcare nutrition, performance nutrition and weight management. Our commitment to healthy nutrition is at the centre of all we do. “Good Food, Good Life” – these words capture the very essence of Nestlé and the promise we commit ourselves to, everyday, everywhere.
Emerging markets and Popularly Positioned ProductsNestlé’s presence in emerging markets is both highly developed, with nearly CHF 35 billion of sales, and rich with opportunity as these markets continue to grow dynamically. Our businesses in these markets not only grow faster than the rest of the Group; they also
achieve good EBIT margins. The challenge we have is to accelerate that growth whilst further improving the margins. One way is to continue to deepen our distribution in these markets. Another is through specific business models to address specific consumer segments. For example, there is huge potential amongst emerging consumers: we estimate that over the coming years about one billion consumers will eat branded food products for the first time. To address this opportunity, we have created a low-cost, high-quality business model, with good financial returns, that we call Popularly Positioned Products, which focuses on creating items that are both highly nutritious and affordable on a daily basis for low-income consumers.
Out-of-home consumptionThe out-of-home segment is growing faster than overall food consumption in both developed and emerging markets. Nestlé Professional, the largest branded manufacturer in this segment, is intent upon capitalising on the longer-term trends such as increased incomes and more leisure time which will see further growth in this market. Our business has two divisions, Branded Beverages, which is predominantly a system-based business, either front-of-house branded machines or back-of-house dispensers, and Customised Food Solutions, which has specific B-2-B and consumer brands and offers ancillary services for chefs.
PremiumisationIncreasing incomes and leisure time, as well as fast growth of more affluent communities in emerging markets are positive trends for the premium sector. Nespresso is one beneficiary, having created the premium single-serve coffee market, but each of our product groups has its own premium strategy, encompassing brands such as S. Pellegrino, Mövenpick, Fancy Feast Appetizers, Cailler, and Nescafé Alta Rica. This is an area of the food industry that should combine strong growth with high returns.
Nutrition, Health and Wellness
CHF 16.8 bio sales of products that went through 60/40+; CHF 10.0 bio sales of Nestlé Nutrition; CHF 5.0 bio sales achieved by products with Branded Active Benefits; 10 000 000+ children went through Nestlé programmes on nutrition
Emerging markets and Popularly Positioned Products
3.3 bio increase expected in population in emerging markets (2000–2050); CHF 34.5 bio sales in emerging markets, with organic growth of 8.6% in 2009;12.7% organic growth achieved by PPP initiatives
Out-of-home consumption
Over 40% of food spend in developed world is out-of-home; CHF 5.8 bio sales of Nestlé Professional
Premiumisation
All product categories have specific premiumisation strategies; CHF 2.8 bio sales of Nespresso with 27.2% organic growth; 50% of coffee beans to be sourced through Nespresso AAA Sustainable Quality programme in 2010
Key facts in 2009

Maggi 2-Minute noodlesThe combination of science-based nutrition and local taste preferences creates a “Great taste, great health” offering with protein, calcium fortification and a “Masala” taste signature, addressing the needs of the bottom of the pyramid.
Nespresso Volluto coffeeA pure roast and ground coffee from South America, 100% sourced from the
Nespresso AAA Sustainable Quality programme, Volluto provides a unique sweet and fruity profile.
The Skinny Cow ice creamThe Skinny Cow: the light-hearted side of nutrition for independent women who still want the freedom to indulge on their way to living and looking better. Portion control sizes for an exceptionally satisfying treat... that happens to be low in fat and calories.
NAN H.A. formulaNestlé Nutrition has pioneered hypoallergenic infant formula. The protein in these formulas is less likely than normal proteins to trigger an allergic reaction because it has been broken down into smaller “peptides”. Clinical studies demonstrate a reduced risk of developing allergies and allergy-related skin problems by up to 50%.

Nestlé Annual Report 20091414
Four operational pillars
Innovation & renovation… to ensure products are new, or remain relevant to our consumersInnovation at Nestlé is about taking big steps, about changing the rules of the game in a category or even about creating a new category. True innovation is hard to copy; its reward is profitable growth for decades to come. Renovation is about taking smaller steps, updating, adapting, extending products and brands to enhance their relevance to consumers and sharpen their competitive edge. Seventy years ago, innovation created Nescafé coffee; today continual renovation ensures Nescafé coffee remains the consumers’ favourite, with more than 4000 cups drunk per second.
Operational efficiency… to have the highest quality, the lowest cost, the best customer serviceFrom supplier to customer, Nestlé wants to enhance its sustainability by being better, faster, more efficient, less wasteful, and, as a result, higher performing. We also want to help our suppliers, whether farmers or industrial, to be more efficient. Greater efficiency means we will lose cost and gain competitiveness; we will increase our eco-efficiency and reduce our environmental footprint; it means a safer working place and better job-satisfaction. It means getting things right first time and it leads to higher quality products, improved customer relationships and happier consumers.
Whenever, wherever, however… to have our products always in an arm’s reach of our consumersSimply, we believe that our products and brands should be available whenever, wherever and however consumers want them. At work or play, travelling or at home, in a restaurant or a hospital, in single-serve or a family pack, in the world’s largest retailer or in the smallest village, we want our brands to be there, adapted to local habits, preferences and nutritional needs. And we have created specific
business models, distribution channels and product solutions to meet this objective.
Consumer communication… to excite consumers… and to learn from our consumers Our brands are recognised instantly by consumers around the world, and are brought to life by consumers, with communication key to those relationships. Every year there are more touch-points between brands and their consumers, and these go beyond traditional marketing communication and beyond traditional media. We try to achieve deep levels of consumer understanding so that our brands’ behaviour and communication are aligned with consumers’ expectations. It is not just about trust and pleasure, or Nutrition, Health and Wellness, but is also about citizenship and responsibility, as perceived by consumers, and about understanding how consumer trends can play into our R&D efforts to ensure future profitable growth.
Consumer communication completes a virtuous circle that starts with hearing from our consumers about what they want; it circles through innovation and renovation that delivers on those desires, and keeps us at the forefront of consumer trends; it moves on to operational efficiency to offer the lowest cost with the highest quality products, delivered whenever, wherever and however the consumer wants them; and the circle is closed at consumer communication, both to inform consumers of what’s new, but also to restart the circle by learning from them… before circling back through innovation & renovation and on…
Innovation & renovation (I&R)
7252 products renovated for nutrition or health considerations; 36% of sales in 2009 accounted for by new products (I&R) launched between 2007 and 2009
Operational efficiency
CHF 1.5 bio of efficiency savings in 2009; 12.2% of onsite energy generated from renewable resources; 59% reduction of water withdrawal per tonne of product since 2000; 48% reduction of GHG emissions per tonne of product since 2000; 59 000 tonnes reduction of total packaging material weight; 21.8% reduction of packaging weight (per litre of product) over 5 years – Nestlé Waters
Whenever, wherever, however
Global branded leader in OOH market;Increased penetration in emerging markets; Direct store distribution to “Mom & Pop” stores; Improved customer service levels with major global customers
Consumer communication
10.1% increase in consumer-facing marketing spend;10 000 000 1-on-1 interactions on consumer phone-lines
Key facts in 2009

Milo beverage with ProtomaltProtomalt is a new malt extract with less sugar but more longer-chain carbohydrates that are rapidly absorbed to generate the energy kids need.
NesVita cereal beveragesNesVita Tradition Selections were launched in China offering women a combination of the goodness of traditional Chinese ingredients with wholegrain cereal beverages.
Lean Cuisine mealsLean Cuisine, the North American leader, delivers healthy frozen meals that are calorie reduced and have controlled fat and sodium levels, but do not compromise on taste, helping people manage their weight.
NaturNes baby foodAll NaturNes recipes are made with 100% natural ingredients. A revolutionary gentle steam cooking process better preserves nutrients and natural taste.

Financial review
Sales
CHF 107.6 billion
EBIT Group
CHF 15.7 billion
EBIT margin Food and Beverages
+30 bps to 13.1%
Operating cash flow
CHF 17.9 billion
Organic growth (OG)
4.1%
EBIT margin Group
+30 bps to 14.6%
EBIT margin Food and Beverages in constant currencies
+40 bps
Free cash flow
CHF 12.4 billion
Real internal growth (RIG)
1.9%
EBIT margin Group in constant currencies
+40 bps
Underlying earnings per share in constant currencies
+16.3%
Proposed dividend per share
+14.3% to CHF 1.60
17Nestlé Annual Report 2009
In millions of CHF (except per share data)
Sales
EBIT (Group) Earnings Before Interest, Taxes, restructuring and impairments
EBIT (Food and Beverages) Earnings Before Interest, Taxes, restructuring and impairments
Profit for the year attributable to shareholders of the parent Net profit (a)
Equity attributable to shareholders of the parent before proposed appropriation of profit of Nestlé S.A.
Market capitalisation, end December
Per share
Total basic earnings per share (a) CHF
Equity attributable to shareholders of the parent before proposed appropriation of profit of Nestlé S.A. CHF
In millions of USD (except per share data)
Sales
EBIT (Group) Earnings Before Interest, Taxes, restructuring and impairments
EBIT (Food and Beverages) Earnings Before Interest, Taxes, restructuring and impairments
Profit for the year attributable to shareholders of the parent Net profit (a)
Equity attributable to shareholders of the parent before proposed appropriation of profit of Nestlé S.A.
Market capitalisation, end December
Per share
Total basic earnings per share (a) USD
Equity attributable to shareholders of the parent before proposed appropriation of profit of Nestlé S.A. USD
In millions of EUR (except per share data)
Sales
EBIT (Group) Earnings Before Interest, Taxes, restructuring and impairments
EBIT (Food and Beverages) Earnings Before Interest, Taxes, restructuring and impairments
Profit for the year attributable to shareholders of the parent Net profit (a)
Equity attributable to shareholders of the parent before proposed appropriation of profit of Nestlé S.A.
Market capitalisation, end December
Per share
Total basic earnings per share (a) EUR
Equity attributable to shareholders of the parent before proposed appropriation of profit of Nestlé S.A. EUR
(a) 2008 comparatives benefited from the profit on disposal of 24.8% of Alcon outstanding capital.
Principal key figures (illustrative)Income statement figures translated at weighted average rate; Balance sheet figures at year-end rate.
2009
107 618
15 699
13 083
10 428
48 915
174 294
2.92
13.69
2009
99 361
14 495
12 079
9 628
47 449
169 070
2.70
13.28
2009
71 259
10 395
8 663
6 905
32 922
117 308
1.93
9.22
2008
109 908
15 676
13 103
18 039
50 774
150 409
4.87
13.71
2008
101 389
14 461
12 087
16 640
48 095
142 473
4.49
12.98
2008
69 288
9 882
8 260
11 372
34 120
101 074
3.07
9.21

Nestlé Annual Report 200918
Overview
This section should be read in connection with the 2009 Consolidated Financial Statements.
The after-shocks of the financial crisis were still reverberating around the world as 2009 started, with projections of sharp declines in economic growth, and of rising unemployment leading to dramatic falls in consumer confidence. Looking forward in January it was therefore difficult to imagine how the year would unfold, both from a macro-context and for Nestlé. We did, however, have some certainties: our commitment to our strategy was unwavering, even if our execution was adaptable; we had a clear set of priorities and a roadmap for where we wanted to get to; we had instilled in the organisation a need for acceleration with discipline in all that we were doing and we had achieved the alignment of our people behind our roadmap, discussed in the previous chapter.
It was also clear that in an environment that was less conducive to growth than the previous few years we would need to step up our efficiency programmes and target our investment to capture growth wherever there was an opportunity to do so. This two-pronged approach was an example of our acceleration, and was particularly important because we were facing continued input cost pressure in an economic environment that was making consumers even more price-conscious.
Looking back at the Group’s performance a year later, and analysing a strong, broad-based performance, it is clear that our businesses all over the world rose to their challenges to deliver good results despite the uncertainties that they faced. The alignment that we have achieved internally behind our roadmap is evident in our 2009 results, with a meaningful contribution to our EBIT margin coming from the faster growth of focus areas such as nutrition, health and wellness, premiumisation and Popularly Positioned Products. Our commitment to investing in consumer communication extends beyond just supporting our brands to building a close understanding of our consumers. This means that in 2009 we were attuned to consumer behaviour
changes, whilst our R&D abilities and our presence in almost every distribution channel meant that we were able to respond to those changing patterns of shopping behaviour with new channel-specific product offerings. Equally, our unmatched geographic presence meant that we were able to ride the wave of recovery in emerging markets, whilst benefiting from the resilience of North American consumers. During 2009 we further enhanced our relationships with our consumers and customers, with a continued focus on meeting their specific needs which are very different in different parts of the world, and we continued to improve our capabilities to leverage our scale and global reach by extending our R&D capabilities and presence.

19Nestlé Annual Report 2009
Performance of billionaire brands: 5.8% organic growthOrganic growth
Over 20%
10.1% to 20%
7.6% to 10%
5.1% to 7.5%
3.1% to 5%
0.0% to 3%
Below 0%
Nestlé Annual Report 200920
Sales (Group)In billions of CHF
110
100
90
In billions of CHFP Europe (a)
P Americas (a)
P Asia, Oceania and Africa (a)
(a) Each region includes sales of the Zones, Nestlé Waters, Nestlé Nutrition, Nestlé Professional, Nespresso and Food and Beverages joint ventures.
0 10 20 30 40 CHF bio
Food and Beverages sales and organic growth by continent (OG)OG (%)
7.5
5.0
2.5
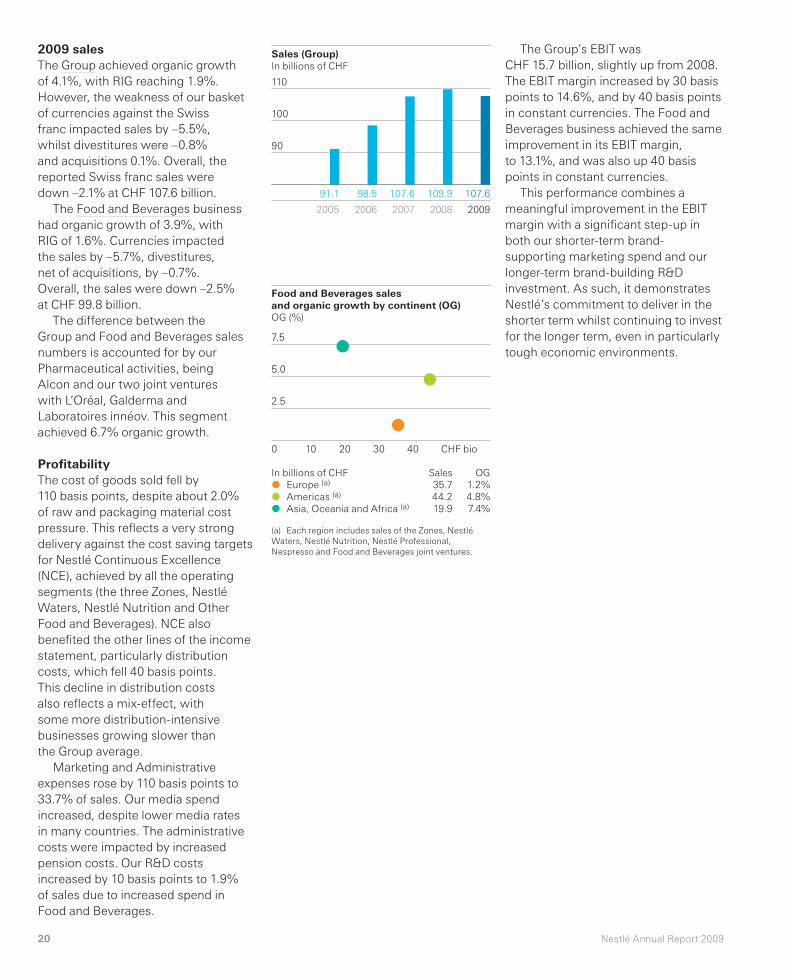
2009 salesThe Group achieved organic growth of 4.1%, with RIG reaching 1.9%. However, the weakness of our basket of currencies against the Swiss franc impacted sales by –5.5%, whilst divestitures were –0.8% and acquisitions 0.1%. Overall, the reported Swiss franc sales were down –2.1% at CHF 107.6 billion.
The Food and Beverages business had organic growth of 3.9%, with RIG of 1.6%. Currencies impacted the sales by –5.7%, divestitures, net of acquisitions, by –0.7%. Overall, the sales were down –2.5% at CHF 99.8 billion.
The difference between the Group and Food and Beverages sales numbers is accounted for by our Pharmaceutical activities, being Alcon and our two joint ventures with L’Oréal, Galderma and Laboratoires innéov. This segment achieved 6.7% organic growth.
ProfitabilityThe cost of goods sold fell by 110 basis points, despite about 2.0% of raw and packaging material cost pressure. This reflects a very strong delivery against the cost saving targets for Nestlé Continuous Excellence (NCE), achieved by all the operating segments (the three Zones, Nestlé Waters, Nestlé Nutrition and Other Food and Beverages). NCE also benefited the other lines of the income statement, particularly distribution costs, which fell 40 basis points. This decline in distribution costs also reflects a mix-effect, with some more distribution-intensive businesses growing slower than the Group average.
Marketing and Administrative expenses rose by 110 basis points to 33.7% of sales. Our media spend increased, despite lower media rates in many countries. The administrative costs were impacted by increased pension costs. Our R&D costs increased by 10 basis points to 1.9% of sales due to increased spend in Food and Beverages.
The Group’s EBIT was CHF 15.7 billion, slightly up from 2008. The EBIT margin increased by 30 basis points to 14.6%, and by 40 basis points in constant currencies. The Food and Beverages business achieved the same improvement in its EBIT margin, to 13.1%, and was also up 40 basis points in constant currencies.
This performance combines a meaningful improvement in the EBIT margin with a significant step-up in both our shorter-term brand-supporting marketing spend and our longer-term brand-building R&D investment. As such, it demonstrates Nestlé’s commitment to deliver in the shorter term whilst continuing to invest for the longer term, even in particularly tough economic environments.
109.9
2008
107.6
2009
107.6
2007
98.5
2006
91.1
2005
Sales35.744.219.9
OG 1.2%4.8%7.4%

21Nestlé Annual Report 2009
Operating segments: Food and Beverages EBIT margin In %
Zone Europe
Zone Americas
Zone Asia, Oceania and Africa
Nestlé Waters
Nestlé Nutrition
Other Food and Beverages (a)
(a) Mainly Nestlé Professional, Nespresso andFood and Beverages joint ventures managed on a worldwide basis.
Operating segments: Food and Beverages sales and organic growth (OG)OG (%)
7.5
5.0
2.5
0
–2.5
0 10 20 30 CHF bio
EBIT (Group)In billions of CHF
15
13
11
EBIT margin (Group)In %
14
13
12
In billions of CHFP Zone EuropeP Zone AmericasP Zone Asia, Oceania and AfricaP Nestlé WatersP Nestlé NutritionP Other Food and Beverages (a)
Operating segmentsThe organic growth of Nestlé’s Food and Beverages business accelerated in the fourth quarter to reach 3.9% for the year. Real internal growth increased to 1.6%. This improvement was evident in each region, with organic growth for the total Food and Beverages business in the Americas of 4.8%, of 1.2% in Europe and of 7.4% in Asia, Oceania and Africa.
Zone Americas had sales of CHF 32.2 billion. Organic growth was 6.5% and RIG was 2.8%, above the level achieved in 2008. The EBIT margin increased by 20 basis points to 16.8%, reflecting the benefits of the strong growth and mix. In North America, petcare, ambient dairy, soluble coffee and chocolate performed particularly well. Overall, North America achieved higher RIG than in 2008. In Latin America, Brazil achieved double-digit organic growth and there were good contributions also from Mexico and the other regions. By category, there were strong performances from most categories in Latin America, with chocolate, soluble coffee, ambient culinary, petcare, biscuits and powdered and ready-to-drink beverages all achieving double digit organic growth.
Zone Europe had sales of CHF 22.5 billion. Organic growth was 0.3% and RIG was –0.9%. The EBIT margin was unchanged at 12.4%. This was a resilient EBIT margin performance during a year in which marketing spend increased noticeably. Great Britain, France and Switzerland achieved good growth. Amongst the categories there was strong growth in petcare, soluble coffee, powdered beverages and sugar confectionery. Eastern Europe achieved mid-single digit organic growth despite the tough economic environment in many countries. Soluble coffee, ambient culinary and powdered beverages all contributed well.
Zone Asia, Oceania and Africa had sales of CHF 15.9 billion. Organic growth was 6.7% and RIG was 4.6%. The EBIT margin increased by 20 basis
12.4
16.8
16.7
7.0
17.4
15.7
15.7
2008
15.7
2009
14.3
2008
14.6
2009
15.0
2007
14.0
2007
13.3
2006
13.5
2006
11.9
2005
13.0
2005
Sales22.532.215.99.0
10.010.2
OG 0.3%6.5%6.7%
–1.4%2.8%6.8%

Nestlé Annual Report 200922
points to 16.7%. The Zone’s EBIT margin benefited from the strong growth, particularly in emerging markets, and was achieved whilst increasing our investment in brand support and in distribution in emerging markets. Africa, Greater China, South Asia, the Philippines and Indonesia, in particular, performed well. Australia was the best of the developed markets. Amongst the categories, soluble coffee, ambient culinary, chocolate, petcare, ready-to-drink and powdered beverages had particularly strong growth.
Nestlé Waters had sales of CHF 9.0 billion. Organic growth was –1.4% and RIG was –1.5%. The EBIT margin increased by 100 basis points to 7.0% due to input cost benefits and supply chain optimisation. The division achieved its priorities of increasing margin whilst defending or building shares. The sales performance was similar in Europe and North America, with both regions improving slightly in the final quarter of a year that has seen consumers trade the inarguable health benefits of the category for savings in their household budgets. The emerging market business had a strong year, once again delivering double-digit growth. Nestlé Pure Life, the biggest water brand in the world, present in both emerging markets and North America, achieved 14.0% organic growth.
Nestlé Nutrition had sales of CHF 10.0 billion. Organic growth was 2.8% and RIG was 0%. The EBIT margin increased by 10 basis points to 17.4%. Infant Nutrition had a good year generally, achieving double digit growth in many emerging markets. However, its growth was affected by weaker than expected performance in Germany and France. There were very strong contributions to the margin improvement from Healthcare Nutrition, due to the delivery of acquisition synergies, and from Performance Nutrition where successful innovation had a positive impact. The improving growth trend evident earlier in the year across all four
divisions, continued in the final quarter, including for Jenny Craig, the weight management division, which was impacted through the year by lower consumer spend in the USA.
The Other Food & Beverages segment had sales of CHF 10.2 billion. Organic growth was 6.8% and RIG was 3.6%. The EBIT margin increased by 80 basis points to 15.7%, partly due to Nespresso which had another year of dynamic growth. Cereal Partners Worldwide enjoyed mid-single digit growth. Nestlé Professional, our recently formed globally managed business, has been focused on establishing its strategic priorities around branded beverages and customised food solutions. It achieved improving growth momentum through the course of 2009 and improved its EBIT margin.
Pharmaceutical products had sales of CHF 7.8 billion. Organic growth was 6.7% and RIG was 5.9%. The EBIT margin fell by 60 basis points to 33.5%. Alcon and the joint ventures as a whole achieved good growth.
ProductsPowdered and liquid beverages had sales of CHF 19.3 billion. Organic growth was 9.5% and RIG was 5.6%. The EBIT margin fell by 40 basis points to 21.7%, due to increased levels of brand investment in soluble coffee and powdered beverages, raw material cost pressure and the investment in the continuing successful roll-out of Nescafé Dolce Gusto, now in 24 countries. Soluble coffee achieved good growth in all three zones. It benefited from the continued roll-out of renovated Nescafé brands such as Alta Rica, innovations such as Nescafé Green Blend and initiatives such as PPP in Asia and Latin America, and targeting Hispanic consumers in the USA with Nescafé Clásico. Powdered beverage brands such as Milo and Nesquik also grew well around the world. Milo enhanced its favoured position with consumers in Zone AOA whilst Nesquik enjoyed a resurgence in Europe following a renovated recipe with an improved nutritional profile and accompanying communication. Nestea powder had a strong year, with launches such as Nestea Litro in the Philippines. The ready-to-drink business, incorporating those same brands, also performed well with good growth in the USA, Mexico, Brazil and China amongst others.
Milk products and Ice cream had sales of CHF 19.6 billion. Organic growth was 2.0% and RIG was 1.3%. The EBIT margin increased by 50 basis points to 12.0%. There were savings from the lower dairy costs in the milk business. These were reinvested in brand support and promotional activity. The Ice cream business achieved a good improvement in its EBIT margin, with most markets contributing. The challenge for the milk business in 2009 has been to re-engage with emerging market consumers about value following the extreme high raw-material price in 2007 and 2008. The increasing growth momentum through the year suggests that this has been achieved, both through communication and through the continued roll-out of
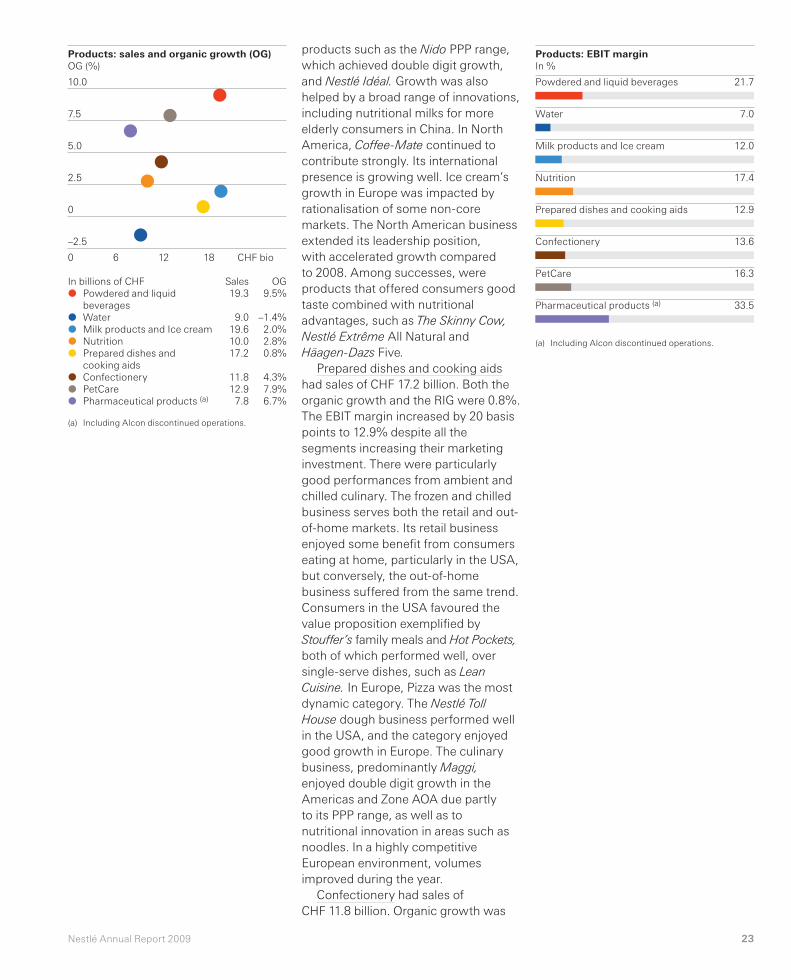
23Nestlé Annual Report 2009
Products: EBIT margin In %
Powdered and liquid beverages
Water
Milk products and Ice cream
Nutrition
Prepared dishes and cooking aids
Confectionery
PetCare
Pharmaceutical products (a)
(a) Including Alcon discontinued operations.
In billions of CHFP Powdered and liquid
beveragesP WaterP Milk products and Ice creamP NutritionP Prepared dishes and
cooking aidsP ConfectioneryP PetCareP Pharmaceutical products (a)
(a) Including Alcon discontinued operations.
Products: sales and organic growth (OG)OG (%)
10.0
7.5
5.0
2.5
0
–2.5
0 6 12 18 CHF bio
products such as the Nido PPP range, which achieved double digit growth, and Nestlé Idéal. Growth was also helped by a broad range of innovations, including nutritional milks for more elderly consumers in China. In North America, Coffee-Mate continued to contribute strongly. Its international presence is growing well. Ice cream’s growth in Europe was impacted by rationalisation of some non-core markets. The North American business extended its leadership position, with accelerated growth compared to 2008. Among successes, were products that offered consumers good taste combined with nutritional advantages, such as The Skinny Cow, Nestlé Extrême All Natural and Häagen-Dazs Five.
Prepared dishes and cooking aids had sales of CHF 17.2 billion. Both the organic growth and the RIG were 0.8%. The EBIT margin increased by 20 basis points to 12.9% despite all the segments increasing their marketing investment. There were particularly good performances from ambient and chilled culinary. The frozen and chilled business serves both the retail and out-of-home markets. Its retail business enjoyed some benefit from consumers eating at home, particularly in the USA, but conversely, the out-of-home business suffered from the same trend. Consumers in the USA favoured the value proposition exemplified by Stouffer’s family meals and Hot Pockets, both of which performed well, over single-serve dishes, such as Lean Cuisine. In Europe, Pizza was the most dynamic category. The Nestlé Toll House dough business performed well in the USA, and the category enjoyed good growth in Europe. The culinary business, predominantly Maggi, enjoyed double digit growth in the Americas and Zone AOA due partly to its PPP range, as well as to nutritional innovation in areas such as noodles. In a highly competitive European environment, volumes improved during the year.
Confectionery had sales of CHF 11.8 billion. Organic growth was
21.7
7.0
12.0
17.4
12.9
13.6
16.3
33.5
Sales19.3
9.019.610.017.2
11.812.97.8
OG9.5%
–1.4%2.0%2.8%0.8%
4.3%7.9%6.7%
Nestlé Annual Report 200924
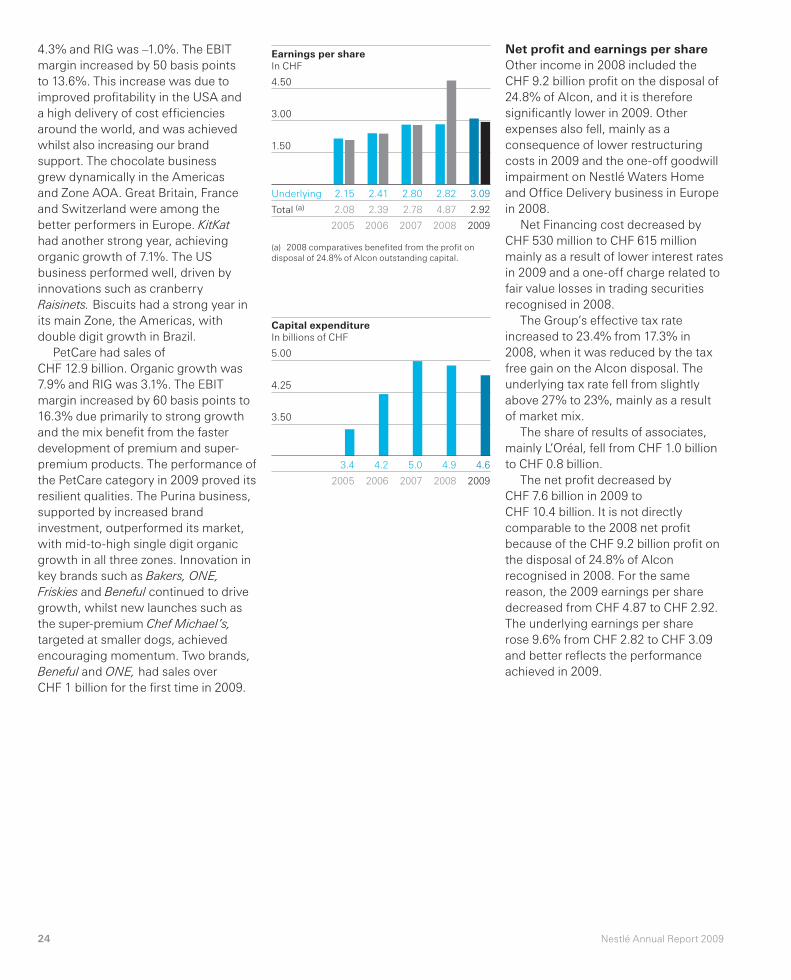
Earnings per share In CHF
4.50
3.00
1.50
Underlying
Total (a)
(a) 2008 comparatives benefited from the profit on disposal of 24.8% of Alcon outstanding capital.
Capital expenditureIn billions of CHF
5.00
4.25
3.50
4.3% and RIG was –1.0%. The EBIT margin increased by 50 basis points to 13.6%. This increase was due to improved profitability in the USA and a high delivery of cost efficiencies around the world, and was achieved whilst also increasing our brand support. The chocolate business grew dynamically in the Americas and Zone AOA. Great Britain, France and Switzerland were among the better performers in Europe. KitKat had another strong year, achieving organic growth of 7.1%. The US business performed well, driven by innovations such as cranberry Raisinets. Biscuits had a strong year in its main Zone, the Americas, with double digit growth in Brazil.
PetCare had sales of CHF 12.9 billion. Organic growth was 7.9% and RIG was 3.1%. The EBIT margin increased by 60 basis points to 16.3% due primarily to strong growth and the mix benefit from the faster development of premium and super-premium products. The performance of the PetCare category in 2009 proved its resilient qualities. The Purina business, supported by increased brand investment, outperformed its market, with mid-to-high single digit organic growth in all three zones. Innovation in key brands such as Bakers, ONE, Friskies and Beneful continued to drive growth, whilst new launches such as the super-premium Chef Michael’s, targeted at smaller dogs, achieved encouraging momentum. Two brands, Beneful and ONE, had sales over CHF 1 billion for the first time in 2009.
Net profit and earnings per shareOther income in 2008 included the CHF 9.2 billion profit on the disposal of 24.8% of Alcon, and it is therefore significantly lower in 2009. Other expenses also fell, mainly as a consequence of lower restructuring costs in 2009 and the one-off goodwill impairment on Nestlé Waters Home and Office Delivery business in Europe in 2008.
Net Financing cost decreased by CHF 530 million to CHF 615 million mainly as a result of lower interest rates in 2009 and a one-off charge related to fair value losses in trading securities recognised in 2008.
The Group’s effective tax rate increased to 23.4% from 17.3% in 2008, when it was reduced by the tax free gain on the Alcon disposal. The underlying tax rate fell from slightly above 27% to 23%, mainly as a result of market mix.
The share of results of associates, mainly L’Oréal, fell from CHF 1.0 billion to CHF 0.8 billion.
The net profit decreased by CHF 7.6 billion in 2009 to CHF 10.4 billion. It is not directly comparable to the 2008 net profit because of the CHF 9.2 billion profit on the disposal of 24.8% of Alcon recognised in 2008. For the same reason, the 2009 earnings per share decreased from CHF 4.87 to CHF 2.92. The underlying earnings per share rose 9.6% from CHF 2.82 to CHF 3.09 and better reflects the performance achieved in 2009.
4.9
2008
4.6
2009
5.0
2007
4.2
2006
3.4
2005
2.15
2.08
2005
2.41
2.39
2006
2.80
2.78
2007
2.82
4.87
2008
3.09
2.92
2009
25Nestlé Annual Report 2009
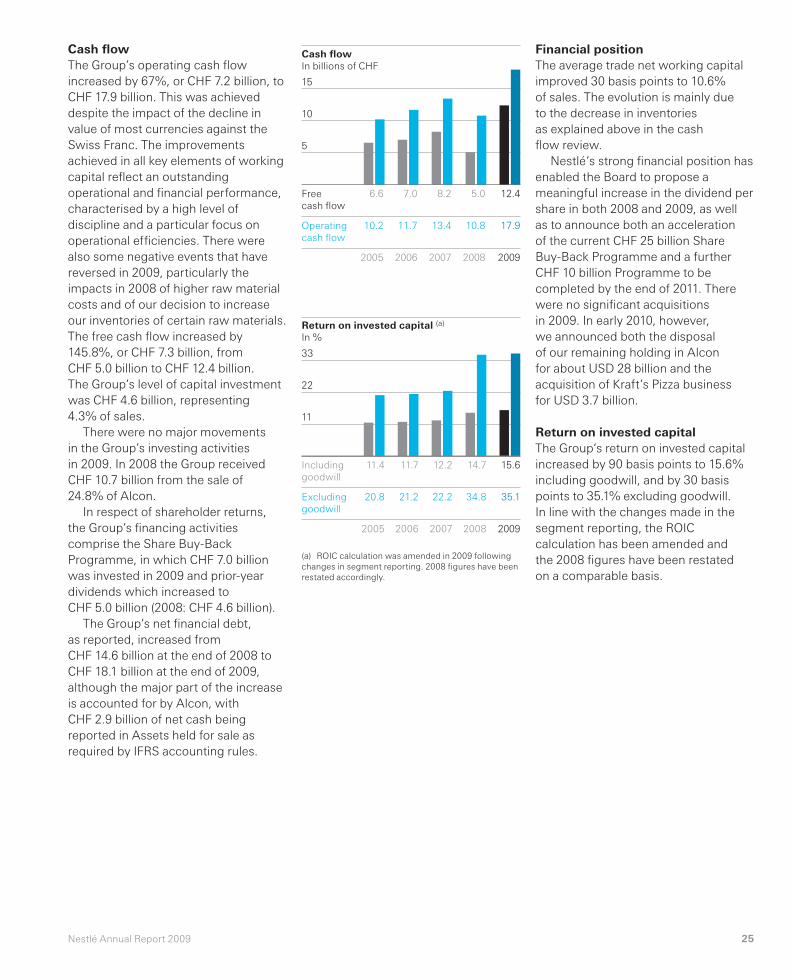
Financial positionThe average trade net working capital improved 30 basis points to 10.6% of sales. The evolution is mainly due to the decrease in inventories as explained above in the cash flow review.
Nestlé’s strong financial position has enabled the Board to propose a meaningful increase in the dividend per share in both 2008 and 2009, as well as to announce both an acceleration of the current CHF 25 billion Share Buy-Back Programme and a further CHF 10 billion Programme to be completed by the end of 2011. There were no significant acquisitions in 2009. In early 2010, however, we announced both the disposal of our remaining holding in Alcon for about USD 28 billion and the acquisition of Kraft’s Pizza business for USD 3.7 billion.
Return on invested capitalThe Group’s return on invested capital increased by 90 basis points to 15.6% including goodwill, and by 30 basis points to 35.1% excluding goodwill. In line with the changes made in the segment reporting, the ROIC calculation has been amended and the 2008 figures have been restated on a comparable basis.
Cash flowThe Group’s operating cash flow increased by 67%, or CHF 7.2 billion, to CHF 17.9 billion. This was achieved despite the impact of the decline in value of most currencies against the Swiss Franc. The improvements achieved in all key elements of working capital reflect an outstanding operational and financial performance, characterised by a high level of discipline and a particular focus on operational efficiencies. There were also some negative events that have reversed in 2009, particularly the impacts in 2008 of higher raw material costs and of our decision to increase our inventories of certain raw materials. The free cash flow increased by 145.8%, or CHF 7.3 billion, from CHF 5.0 billion to CHF 12.4 billion. The Group’s level of capital investment was CHF 4.6 billion, representing 4.3% of sales.
There were no major movements in the Group’s investing activities in 2009. In 2008 the Group received CHF 10.7 billion from the sale of 24.8% of Alcon.
In respect of shareholder returns, the Group’s financing activities comprise the Share Buy-Back Programme, in which CHF 7.0 billion was invested in 2009 and prior-year dividends which increased to CHF 5.0 billion (2008: CHF 4.6 billion).
The Group’s net financial debt, as reported, increased from CHF 14.6 billion at the end of 2008 to CHF 18.1 billion at the end of 2009, although the major part of the increase is accounted for by Alcon, with CHF 2.9 billion of net cash being reported in Assets held for sale as required by IFRS accounting rules.
Cash flow In billions of CHF
15
10
5
Free cash flow
Operating cash flow
Return on invested capital (a)
In %
33
22
11
Including goodwill
Excluding goodwill
(a) ROIC calculation was amended in 2009 followingchanges in segment reporting. 2008 figures have been restated accordingly.
5.0
10.8
2008
8.2
13.4
2007
7.0
11.7
2006
6.6
10.2
2005
12.4
17.9
2009
11.4
20.8
2005
11.7
21.2
2006
12.2
22.2
2007
14.7
34.8
2008
15.6
35.1
2009

Nestlé Annual Report 200926
Dividend per shareIn CHF
1.60
1.30
1.00
Total cash returned to shareholders In billions of CHF
12
8
4
Share Buy-Back
Dividend
Principal risks and uncertaintiesGroup Risk ManagementThe Nestlé Group Enterprise Risk Management Framework (ERM) is designed to identify, communicate, and mitigate risks in order to minimise their potential impact on the Group. A “Top-Down” assessment occurs annually and focuses on the Group’s global risk portfolio. It involves the aggregation of individual “Top-Down” assessments of Zones, Globally Managed Businesses, and selected markets. It is intended to provide a high-level mapping of Group risk and allow Group Management to make sound decisions on the future operations of the Company. Risk assessments are the responsibility of line management; this applies equally to a business, a market or a function, and any mitigating actions identified in the assessments are the responsibility of the individual line management. If a Group-level intervention is required, responsibility for mitigating actions will generally be determined by the Executive Board. The results of the Group ERM are presented to the Executive Board and Audit Committee annually. In the case of an individual risk assessment identifying a risk which requires action at Group level, an ad hoc presentation is made to the Executive Board.
Factors affecting resultsNestlé’s reputation is based on consumers’ trust. Any major event triggered by a serious food safety or other compliance issue could potentially impact upon Nestlé’s reputation or brand image. The Group has all required policies, processes and controls in place to prevent against such an event.
Nestlé is dependant on sustainable supply of a number of raw materials, packaging materials and services/utilities. Any major event triggered by natural hazards (drought, flood, etc.), change in macro-economic environment (shift in production patterns, “biofuels”, excessive trading) resulting in input price volatilities and/or capacity constraints could
potentially impact upon Nestlé’s financial results. The Group has necessary policies, processes and controls in place to mitigate against such an event.
The Group’s liquidities/liabilities (currency, interest rate, derivatives, and/or hedging, pension funding obligations, commercial credit) could potentially be impacted by any major event in the financial markets. Nestlé has necessary policies, processes and controls in place to mitigate against such an event.
Nestlé is dependent on sustainable supply of finished goods for all product categories. A major event in one of Nestlé’s key plants, at a key supplier, contract manufacturers, co-packers, and/or key warehouse facility could potentially lead to a supply disruption and impact upon Nestlé’s financial results. Necessary business continuity plans are established and regularly maintained in order to mitigate against such an event.
Nestlé has factories in 83 different countries and its products are sold in more than 140 countries in the world. Security, political stability, legal & regulatory, macroeconomic, foreign trade, labour, and/or infrastructure risk(s) could potentially impact upon Nestlé’s ability to do business in a country or region. Events such as a human pandemic could potentially also impact upon the Group’s ability to operate. Any of these events could potentially lead to a supply disruption and impact upon Nestlé’s financial results. Regular monitoring and ad hoc business continuity plans are established in order to mitigate against such an event. The Group’s wide geographical and product category spreads represent a tremendous natural hedge.
1.3
3.1
2005
2.7
3.5
2006
4.4
4.0
2007
8.7
4.6
2008
7.0
5.0
2009
0.90
2005
1.04
2006
+15.6%
+17.3%+14.8%
+14.3%
1.22
2007
1.40
2008
1.60
2009

27Nestlé Annual Report 2009
Evolution of the Nestlé registered share in 2009
In CHF
50.00
42.50
35.00
27.50
P Registered shareP Nestlé relative to Swiss Market Index
120%
100%
80%
The Nestlé shareThe Nestlé share price recovered well after its weakness in 2008. Having ended 2008 at CHF 41.60, it ended 2009 at CHF 50.20. This represents a +2.03% out-performance against the Swiss Market Index and a –8.95% under-performance against the Dow Jones Stoxx Food and Beverage Index.
DividendThe Board is proposing to shareholders an increase in the dividend of 14.3% from CHF 1.40 to CHF 1.60 per share.
2010 outlookCapitalising on the momentum of an excellent year in 2008, Nestlé’s 2009 results combined strong top and bottom line performance in a very challenging environment, thereby reconfirming the group’s long-term commitment to the Nestlé Model. This performance was broad-based across all categories and regions, demonstrating our commitment to delivering in the shorter term whilst continuing to invest for longer-term profitable growth. Consequently, in spite of continued economic uncertainty in 2010, especially in developed countries, Nestlé expects its Food and Beverages business to achieve higher organic growth than in 2009 and further increase its EBIT margin in constant currencies for the year as a whole.

Nestlé Annual Report 200928
Management responsibilities: Food and Beverages
Zone Europe
Western
Eastern and Central
Powdered and liquid beverages
Milk products and Ice cream
Prepared dishes and cooking aids
Confectionery
PetCare
Total sales
EBIT
Capital expenditure
Zone Americas
USA and Canada
Latin America and Caribbean
Powdered and liquid beverages
Milk products and Ice cream
Prepared dishes and cooking aids
Confectionery
PetCare
Total sales
EBIT
Capital expenditure
In millions of CHF 2008
20 854
4 244
5 362
3 147
7 243
5 416
3 930
25 098
3 101
885
19 106
12 251
3 746
9 884
5 291
4 632
7 804
31 357
5 206
1 341
2007
24 476
3 988
6 168
3 556
9 254
5 593
3 893
28 464
3 412
932
20 824
12 093
4 007
10 159
6 534
4 678
7 539
32 917
5 359
1 371
84.1%
15.9%
22.5%
12.0%
27.9%
20.8%
16.8%
100.0%
12.4%
3.4%
62.0%
38.0%
11.9%
30.2%
16.8%
15.0%
26.1%
100.0%
16.8%
3.4%
RIG (%)
–0.4
–3.6
2.8
–6.4
–0.6
–4.3
2.1
–0.9
2.8
3.0
5.1
2.7
1.7
1.2
3.8
2.8
OG (%)
–0.9
5.7
6.5
–6.2
–4.0
–0.4
5.7
0.3
5.1
8.6
9.3
3.6
3.5
9.4
9.1
6.5
2009
18 941
3 587
5 072
2 708
6 288
4 686
3 774
22 528
2 802
759
19 946
12 222
3 830
9 698
5 414
4 831
8 395
32 168
5 402
1 092
(a)
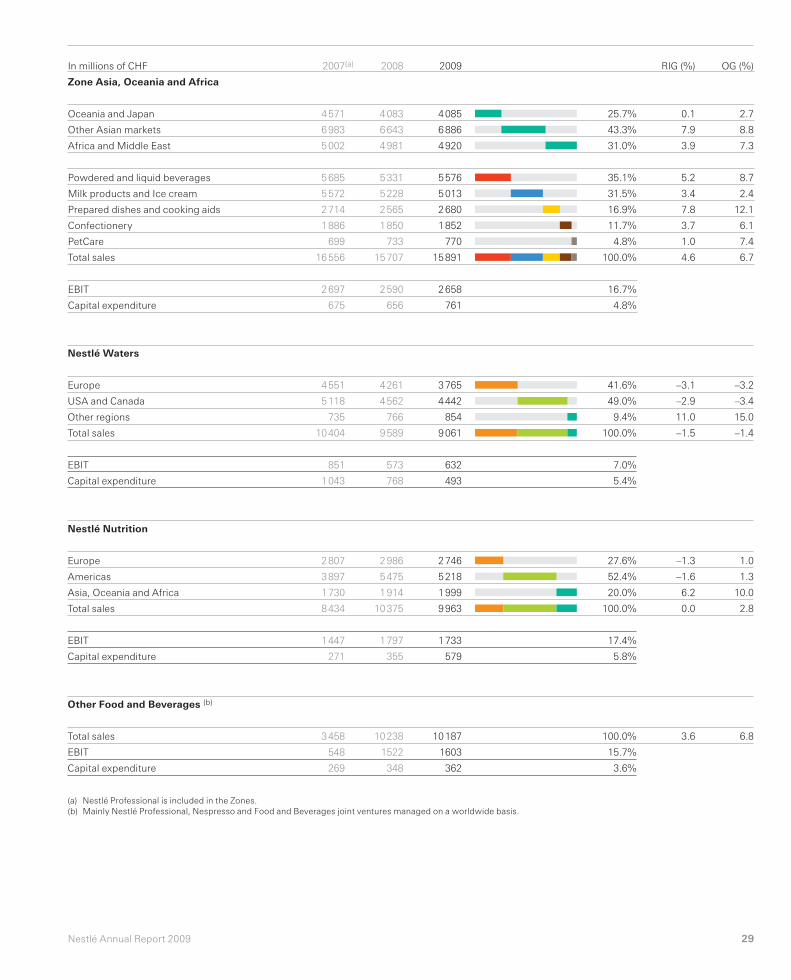
29Nestlé Annual Report 2009
In millions of CHF
Nestlé Waters
Europe
USA and Canada
Other regions
Total sales
EBIT
Capital expenditure
Nestlé Nutrition
Europe
Americas
Asia, Oceania and Africa
Total sales
EBIT
Capital expenditure
Other Food and Beverages (b)
Total sales
EBIT
Capital expenditure
(a) Nestlé Professional is included in the Zones. (b) Mainly Nestlé Professional, Nespresso and Food and Beverages joint ventures managed on a worldwide basis.
Zone Asia, Oceania and Africa
Oceania and Japan
Other Asian markets
Africa and Middle East
Powdered and liquid beverages
Milk products and Ice cream
Prepared dishes and cooking aids
Confectionery
PetCare
Total sales
EBIT
Capital expenditure
2007
4 571
6 983
5 002
5 685
5 572
2 714
1 886
699
16 556
2 697
675
25.7%
43.3%
31.0%
35.1%
31.5%
16.9%
11.7%
4.8%
100.0%
16.7%
4.8%
RIG (%)
0.1
7.9
3.9
5.2
3.4
7.8
3.7
1.0
4.6
OG (%)
2.7
8.8
7.3
8.7
2.4
12.1
6.1
7.4
6.7
2008
4 083
6 643
4 981
5 331
5 228
2 565
1 850
733
15 707
2 590
656
2009
4 085
6 886
4 920
5 576
5 013
2 680
1 852
770
15 891
2 658
761
4 551
5 118
735
10 404
851
1 043
2 807
3 897
1 730
8 434
1 447
271
3 458
548
269
41.6%
49.0%
9.4%
100.0%
7.0%
5.4%
27.6%
52.4%
20.0%
100.0%
17.4%
5.8%
100.0%
15.7%
3.6%
–3.1
–2.9
11.0
–1.5
–1.3
–1.6
6.2
0.0
3.6
–3.2
–3.4
15.0
–1.4
1.0
1.3
10.0
2.8
6.8
4 261
4 562
766
9 589
573
768
2 986
5 475
1 914
10 375
1 797
355
10 238
1522
348
3 765
4 442
854
9 061
632
493
2 746
5 218
1 999
9 963
1 733
579
10 187
1603
362
(a)
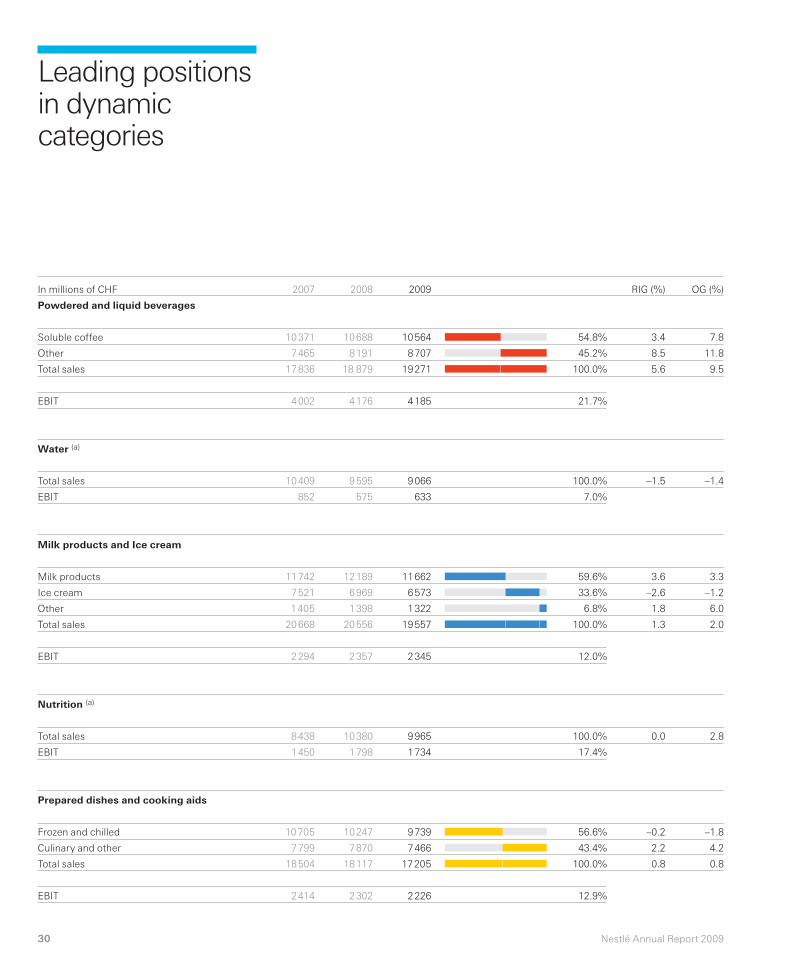
Nestlé Annual Report 200930
In millions of CHF
Powdered and liquid beverages
Soluble coffee
Other
Total sales
EBIT
Water (a)
Total sales
EBIT
Milk products and Ice cream
Milk products
Ice cream
Other
Total sales
EBIT
Nutrition (a)
Total sales
EBIT
Prepared dishes and cooking aids
Frozen and chilled
Culinary and other
Total sales
EBIT
Leading positions in dynamic categories
2007
10 371
7 465
17 836
4 002
10 409
852
11 742
7 521
1 405
20 668
2 294
8 438
1 450
10 705
7 799
18 504
2 414
2008
10 688
8 191
18 879
4 176
9 595
575
12 189
6 969
1 398
20 556
2 357
10 380
1 798
10 247
7 870
18 117
2 302
2009
10 564
8 707
19 271
4 185
9 066
633
11 662
6 573
1 322
19 557
2 345
9 965
1 734
9 739
7 466
17 205
2 226
54.8%
45.2%
100.0%
21.7%
100.0%
7.0%
59.6%
33.6%
6.8%
100.0%
12.0%
100.0%
17.4%
56.6%
43.4%
100.0%
12.9%
RIG (%)
3.4
8.5
5.6
–1.5
3.6
–2.6
1.8
1.3
0.0
–0.2
2.2
0.8
OG (%)
7.8
11.8
9.5
–1.4
3.3
–1.2
6.0
2.0
2.8
–1.8
4.2
0.8

31Nestlé Annual Report 2009
Confectionery
Chocolate
Sugar confectionery
Biscuits
Total sales
EBIT
PetCare
Total sales
EBIT
Alcon
Total sales
EBIT
Health and beauty joint ventures
Nestlé’s share of sales
Nestlé’s share of EBIT
Associated companies
Nestlé’s share of results
(a) 2008 comparatives have been restated following first application of IFRS 8. Moreover, the water products are now disclosed separately from Powdered and liquid beverages, and the nutrition products from Milk products and Ice cream. The figures between Operating segments and Products are slightly different due to the fact that some water and nutrition products are also sold by Operating segments other than Nestlé Waters and Nestlé Nutrition.
In millions of CHF
79.4%
9.4%
11.2%
100.0%
13.6%
100.0%
16.3%
100.0%
35.2%
RIG (%)
–1.4
–1.1
2.2
–1.0
3.1
6.1
OG (%)
3.9
4.1
7.3
4.3
7.9
6.4
2007
9 754
1 207
1 287
12 248
1 426
12 130
1 876
6 679
2 326
640
109
1 280
2008
9 802
1 145
1 423
12 370
1 619
12 467
1 962
6 822
2 436
722
137
1 005
2009
9 369
1 109
1 318
11 796
1 599
12 938
2 108
7 039
2 477
781
139
800
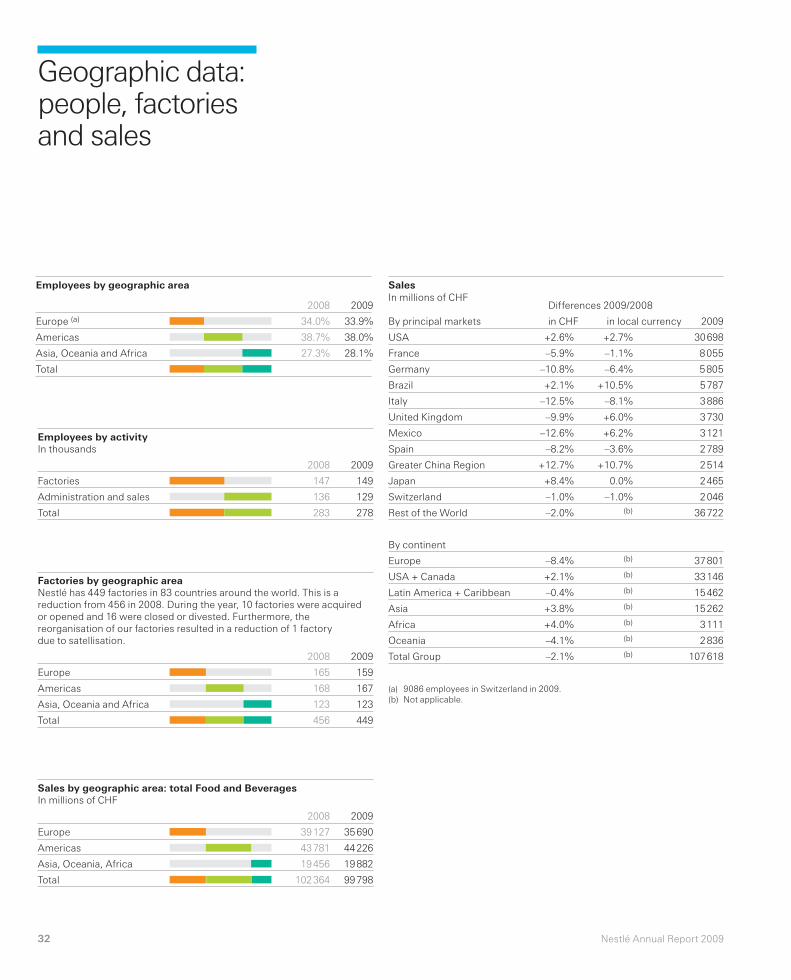
Nestlé Annual Report 200932
Employees by activityIn thousands
Factories
Administration and sales
Total
Sales by geographic area: total Food and BeveragesIn millions of CHF
Europe
Americas
Asia, Oceania, Africa
Total
Employees by geographic area
Europe (a)
Americas
Asia, Oceania and Africa
Total
SalesIn millions of CHF
By principal markets
USA
France
Germany
Brazil
Italy
United Kingdom
Mexico
Spain
Greater China Region
Japan
Switzerland
Rest of the World
By continent
Europe
USA + Canada
Latin America + Caribbean
Asia
Africa
Oceania
Total Group
(a) 9086 employees in Switzerland in 2009.(b) Not applicable.
Differences 2009/2008
in CHF in local currency
Geographic data: people, factories and sales
Factories by geographic areaNestlé has 449 factories in 83 countries around the world. This is a reduction from 456 in 2008. During the year, 10 factories were acquired or opened and 16 were closed or divested. Furthermore, the reorganisation of our factories resulted in a reduction of 1 factory due to satellisation.
Europe
Americas
Asia, Oceania and Africa
Total
2009
149
129
278
2008
147
136
283
2009
33.9%
38.0%
28.1%
2008
34.0%
38.7%
27.3%
2009
159
167
123
449
2008
165
168
123
456
2009
35 690
44 226
19 882
99 798
2008
39 127
43 781
19 456
102 364
2009
30 698
8 055
5 805
5 787
3 886
3 730
3 121
2 789
2 514
2 465
2 046
36 722
37 801
33 146
15 462
15 262
3 111
2 836
107 618
+2.7%
–1.1%
–6.4%
+10.5%
–8.1%
+6.0%
+6.2%
–3.6%
+10.7%
0.0%
–1.0%(b)
(b)
(b)
(b)
(b)
(b)
(b)
(b)
+2.6%
–5.9%
–10.8%
+2.1%
–12.5%
–9.9%
–12.6%
–8.2%
+12.7%
+8.4%
–1.0%
–2.0%
–8.4%
+2.1%
–0.4%
+3.8%
+4.0%
–4.1%
–2.1%

33Nestlé Annual Report 2009
Asia, Oceania and Africa
Algeria 1 PL L L L LAustralia 11 PL PL L PL PL LBahrain 1 PL L L L LBangladesh 1 PL PL PL LCameroon 1 L PL PL LCôte d’Ivoire 2 PL PL P LEgypt 3 PL PL P L LGhana 1 PL PL L L LGreater China Region 18 PL PL PL PL PL LGuinea 1 L L PL L LIndia 6 PL P P P LIndonesia 3 PL PL PL PL L LIran 2 PL PL L L LIsrael 9 PL PL P PL L LJapan 3 PL PL L PL L LJordan 1 PL L L L LKenya 1 PL PL PL L LLebanon 1 PL L L L LMalaysia 6 PL PL PL PL L LMorocco 1 PL PL PL L LNew Caledonia 1 L PL L PL LNew Zealand 2 L PL PL PL PL LNigeria 1 PL PL PL P LPakistan 4 PL PL P L LPapua New Guinea 1 PL PL PL L LPhilippines 4 PL PL L L L LQatar 1 PL L L L LRepublic of Korea 2 PL P L L L LSaudi Arabia 7 PL PL PL L LSenegal 1 L L PL LSingapore 1 PL L PL L L LSouth Africa 9 PL PL PL PL PL LSri Lanka 1 PL PL P LSyria 1 PL PL PL LThailand 6 PL PL PL L L LTunisia 1 L PL L L LUnited Arab Emirates 2 PL PL L L L LUzbekistan 1 PL PL L L LVietnam 3 PL PL PL LZimbabwe 1 PL PL PL L L
Europe
Austria 1 PL L PL L L LBelgium 3 P L L L L L PLBulgaria 2 L PL L PL L LCzech Republic 3 L L PL PL L LFinland 2 L PL L L L LFrance 30 PL PL PL L PL PLGermany 22 PL PL PL PL PL PLGreece 4 PL PL L L L LHungary 3 PL PL L PL PL LItaly 15 PL PL PL PL PL LNetherlands 2 L PL L L PL LPoland 8 PL PL PL PL L LPortugal 4 PL PL L L L LRepublic of Ireland 1 L L L L L PLRepublic of Serbia 1 L PL L L L LRomania 1 PL L L PL L LRussia 11 PL PL PL PL PL LSlovak Republic 1 L L PL L L LSpain 13 PL PL PL PL PL PLSweden 2 PL L L L L LSwitzerland 12 PL PL PL PL L PLTurkey 4 PL L P P L LUkraine 2 PL L PL PL L LUnited Kingdom 12 PL PL L PL PL L
Americas
Argentina 8 PL PL PL L P LBrazil 23 PL PL P PL PL PLCanada 10 PL PL PL PL PL PLChile 6 PL PL PL PL L LColombia 4 PL PL PL PL PL LCosta Rica 1 L PL LCuba 3 PL PL L L LDominican Republic 2 L PL PL L L LEcuador 2 PL PL PL PL L LGuatemala 1 L L PL L L LJamaica 1 PL PL L L L LMexico 13 PL PL PL PL PL PLNicaragua 1 L PL L L L LPanama 1 L PL PL L L LPeru 1 PL PL PL PL L LTrinidad and Tobago 1 PL PL L L L LUnited States 81 PL PL PL P P PLUruguay 1 PL L L L L LVenezuela 7 PL PL PL PL PL L
The figure in black after the country denotes the number of factories.
P Local production (may represent production in several factories).
L Imports (may, in a few particular cases, represent purchases from third parties in the market concerned).
P BeveragesP Milk products, Nutrition
and Ice creamP Prepared dishes and
cooking aidsP ConfectioneryP PetCareP Pharmaceutical products

Nestlé Annual Report 200934
Corporate GovernanceNestlé pursues a strategy of best practice of corporate governance. In 2008, the Annual General Meeting approved a complete revision of the Company’s Articles of Association. 99% of the votes represented at the meeting were cast in favour of the revision. The new Articles have modernised our governance in the best interests of our Company and its stakeholders to aim for long-term, sustainable value creation, a statement which was expressly added to the new Articles.
While the new Articles have addressed many governance issues, compensation remains the subject of much political debate. In 2008, we produced for the first time a special annual compensation report describing our compensation system and the compensation granted. The report was approved by the shareholders as part of the approval of the annual financial statements. Since then, we kept in close contact with many of our shareholders and asked for their opinion regarding this issue. As a result, at the 2009 Annual General Meeting, we submitted our compensation report for the first time to a separate advisory vote of the shareholders, as per the alternative procedure foreseen in the Swiss Code of Best Practice for Corporate Governance. In 2010 we will again submit the report to a separate advisory vote as an interim solution until the new Swiss law is clarified on this topic.
We recognize that in turbulent times the corporate governance framework is of particular importance and take an active role in its development based on a continuous engagement with our investors and other stakeholders. In that spirit we undertook in 2009 another shareholder survey, this time among the shareholders attending our last shareholders’ meeting, to receive their input and priorities regarding this event. The results (see www.nestle.com) confirmed support for our format and suggested topics to be covered in future meetings.
ComplianceCompliance builds trust. It forms the base of how we do business and is the first layer of how we create shared value.
While responsibility for compliance is assigned to the markets as per the Custodian Concept, a small corporate Compliance function and a cross-functional Compliance Committee define the framework, facilitate the coordination between the various relevant support functions and provide guidance and best practices. Through the Compliance Committee and the Corporate Compliance Programme we build awareness and ensure a coordinated, holistic approach to compliance and risk management.
The implementation of the values enshrined in the Corporate Business Principles, the Nestlé Management and Leadership Principles and the Code of Business Conduct is the cornerstone of the Corporate Compliance Programme. In 2009 we focussed on the implementation of our Code of Business Conduct including a compliance e-learning tool and of our Supplier Code of Conduct. An anti-trust learning tool initially implemented in Zone Europe was launched across all Zones in locally adapted versions. The addition of a new integrity module to our CARE programme (Compliance Assessment of Human Resources, Safety & Health, Environment and Business Integrity, our audit
programme relating to the Corporate Business Principles using independent auditors), and the creation of a fraud database strengthened our audit efforts. Our anti-bribery programme and our internal complaints management were other focus areas. An internal Data Protection Office was registered with the authorities, and the annual self-assessment of the Group’s internal control system and the annual Board risk assessment were performed.
Corporate Governance and Compliance

35Nestlé Annual Report 2009
Shareholders by geography (a)
Distribution of Share Capital by geography (a)
P 35.6% SwitzerlandP 21.5% USAP 10.8% United KingdomP 4.3% Germany
P 3.7% CanadaP 3.6% NorwayP 3.2% FranceP 17.3% Others
60%
40%
20%
2000 2001 2002 2003 2004 2005 2006 2007 2008 2009
Share Capital by Investor Type (a)
90%
60%
30%
2000 2001 2002 2003 2004 2005 2006 2007 2008 2009P InstitutionsP Private Shareholders
(a) Percentage derived from total number of registered shares. Registered shares represent 61.9% of the total share capital. Statistics are rounded, as at 31.12.2009.
P SwitzerlandP USAP United KingdomP Germany
P Canada P NorwayP France
Nestlé Annual Report 200936
Stock exchange listingAt 31 December 2009, Nestlé S.A. shares were listed on the SIX Swiss Exchange (ISIN code: CH0038863350). American Depositary Receipts (ADRs) (ISIN code: US6410694060) representing Nestlé S.A. shares are offered in the USA by Citibank.
Registered OfficesNestlé S.A.Avenue Nestlé 55, CH-1800 Vevey (Switzerland)tel.: +41 (0)21 924 21 11
Nestlé S.A. (Share Transfer Office)Zugerstrasse 8, CH-6330 Cham (Switzerland)tel.: +41 (0)41 785 20 20
Further informationTo order additional copies of this document, please go to www.nestle.com/Media_Center/order.
For additional information, contact: Nestlé S.A., Investor RelationsAvenue Nestlé 55, CH-1800 Vevey (Switzerland)tel.: +41 (0)21 924 35 09fax: +41 (0)21 924 28 13e-mail: [email protected]
The Nestlé Annual Report, the Financial Statements and the Corporate Governance Report are available on-line as a PDF file in English, French and German. The consolidated income statement, balance sheet and cash flow statement are also available as Excel files.
As to information concerning the share register (registrations, transfers, address changes, dividends, etc.), please contact:Nestlé S.A. (Share Transfer Office)Zugerstrasse 8, CH-6330 Cham (Switzerland)tel.: +41 (0)41 785 20 20fax: +41 (0)41 785 20 24e-mail: [email protected]
The Company offers the possibility of depositing, free of charge, Nestlé S.A. shares traded on the SIX Swiss Exchange.
Nestlé URL: www.nestle.com
Shareholder information
Important dates15 April 2010143rd Annual General Meeting, “Palais de Beaulieu”, Lausanne
16 April 2010Last trading day with entitlement to dividend
19 April 2010Ex dividend date
22 April 2010Payment of the dividend
22 April 2010Announcement of first quarter 2010 sales figures
11 August 2010Publication of the Half-yearly Report January/June 2010
22 October 2010Announcement of nine months 2010 sales figures
17 February 20112010 Full Year Results; press conference
14 April 2011144th Annual General Meeting, “Palais de Beaulieu”, Lausanne

© 2010, Nestlé S.A., Cham and Vevey (Switzerland)
The Annual Report contains forward looking statements which reflect Management’s current views and estimates. The forward looking statements involve certain risks and uncertainties that could cause actual results to differ materially from those contained in the forward looking statements. Potential risks and uncertainties include such factors as general economic conditions, foreign exchange fluctuations, competitive product and pricing pressures and regulatory developments.
In case of doubt or differences of interpretation, the English version shall prevail over the French and German text.
Concept and designNestec Ltd., Corporate Identity & Design, with Esterson Associates
PhotographyBoard pictures: Philippe Prêtre/APG ImageProducts and consumers: Matthew Donaldson
PrintingUD Print (Switzerland)
PaperThis report is printed on Arctic the Volume, a paper produced from well-managed forests and other controlled sources certified by the Forest Stewardship Council (FSC).
Key figures (consolidated)
In millions of CHF (except per share data)
Sales
EBIT (Group) Earnings Before Interest, Taxes, restructuring and impairments
as % of sales
EBIT (Food and Beverages) Earnings Before Interest, Taxes, restructuring and impairments
as % of sales (Food and Beverages)
Profit for the year attributable to shareholders of the parent Net profit (a)
as % of sales
as % of average equity attributable to shareholders of the parent
Capital expenditure
as % of sales
Equity attributable to shareholders of the parent before proposed appropriation of profit of Nestlé S.A.
Market capitalisation, end December
Operating cash flow
Free cash flow (b)
Net financial debt
Ratio of net financial debt to equity (gearing)
Per share
Total basic earnings per share (a) CHF
Underlying (c) CHF
Equity attributable to shareholders of the parent before proposed appropriation of profit of Nestlé S.A. CHF
Dividend as proposed by the Board of Directors of Nestlé S.A. CHF
EBIT In millions of CHF
15 000
13 000
11 000
Net profit (a)
In millions of CHF
18 000
12 000
6 000
Dividend per shareIn CHF
1.60
1.30
1.00
Capital expenditure In millions of CHF
5 000
4 250
3 500
EBIT marginIn %
14
13
12
Earnings per shareIn CHF
4.50
3.00
1.50
Underlying (c)
Total (a)
Total cash returned to shareholdersIn billions of CHF
12
8
4
Share Buy-Back
Dividend
Return on invested capital (d)
In %
33
22
11
Including goodwill
Excluding goodwill
(a) 2008 comparatives benefited from the profit on disposal of 24.8% of Alcon outstanding capital. (b) Operating cash flow less capital expenditure, disposal of tangible assets, purchase and disposal of intangible assets, movement with associates as well as with non-controlling interests. (c) Profit per share for the year attributable to shareholders of the parent before impairments, restructuring costs, results on disposals and significant one-off items. The tax impact from the adjusted items is also adjusted for. (d) ROIC calculation was amended in 2009 following changes in segment reporting. 2008 figures have been restated accordingly.
11 876
2005
13 302
2006
15 024
2007
15 676
2008
15 699
2009
13.0
2005
13.5
2006
14.0
2007
14.3
2008
14.6
2009
0.90
2005
8 081
2005
1.04
2006
+15.6%
+17.3%+14.8%
+14.3%
9 197
2006
1.22
2007
1.40
2008
1.60
2009
10 649
2007
18 039
2008
10 428
2009
1.3
3.1
2005
2.7
3.5
2006
4.4
4.0
2007
8.7
4.6
2008
7.0
5.0
2009
2.15
2.08
2005
2.41
2.39
2006
2.80
2.78
2007
2.82
4.87
2008
3.09
2.92
2009
3 375
2005
4 200
2006
4 971
2007
4 869
2008
4 641
2009
11.4
20.8
2005
11.7
21.2
2006
12.2
22.2
2007
14.7
34.8
2008
15.6
35.1
2009
2009
107 618
15 699
14.6%
13 083
13.1%
10 428
9.7%
20.9%
4 641
4.3%
48 915
174 294
17 934
12 369
18 085
37.0%
2.92
3.09
13.69
1.60
2008
109 908
15 676
14.3%
13 103
12.8%
18 039
16.4%
34.9%
4 869
4.4%
50 774
150 409
10 763
5 033
14 596
28.7%
4.87
2.82
13.71
1.40
Related Documents