Welcome message from author
This document is posted to help you gain knowledge. Please leave a comment to let me know what you think about it! Share it to your friends and learn new things together.
Transcript

Mr. G. D. Birla and Mr. Aditya Birla, our founding fathers.
We live by their values.
Integrity, Commitment, Passion, Seamlessness and Speed
i
THE CHAIRMAN’S LETTER TO SHAREHOLDERS
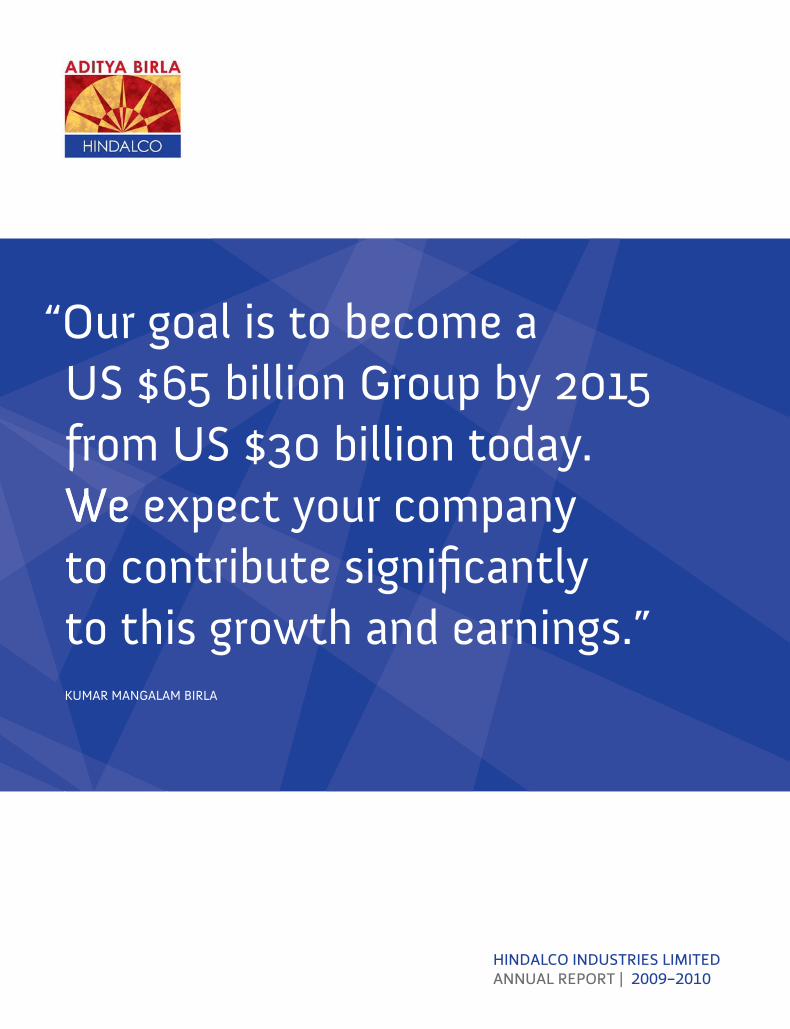
Dear Shareholder,
The global economy is gradually
emerging from the throes of the
meltdown of 2008. While growth rates
have picked up, it will still be a while to
get back to the pre-crisis path. However,
the fundamentals of the global economy
appear to be reasonably good. The IMF
has forecasted a growth of 2.3% for the
advanced countries and 6.3% for the
emerging economies for 2010. Of all
the countries, China’s growth has been
most impressive. Its economy has
recorded a double-digit growth for
several quarters. And it continues to
surge.
India also is on a strong growth trajectory.
Our economy is slated to grow in excess
of 8%. Consumer spending is gaining
momentum. Private investment is picking
up steam. Globally and in India, the
trend is encouraging. These impact your
Company’s growth and performance.
For the Financial Year 2009-10, your
Company ’s performance has been
phenomenal both at the standalone and
consolidated level. Your Company’s Net
Revenue on consolidated basis stood at

ii
THE CHAIRMAN’S LETTER TO SHAREHOLDERS
US $ 12.8 billion (Rs. 60,722.1 crores). Significantly, Net Profit at US $ 829.2 million (Rs. 3,925.5
crores) soared by 712%, in comparison to previous year.
A number of strategic initiatives have been taken by
your Management in the interest of its multiple
stakeholders. As these have been detailed in the
‘Management Discussion and Analysis’, I will give you
a helicopter view.
Your Company is today a premium metals major, global
in size and reach. Today 76% of its US $ 12.8 billion
sales at the consolidated level are from outside India.
Likewise, 61% of its assets are spread across the world.
Despite the extremely challenging macro-environment,
your Company has outperformed its peers. And I have
every reason to believe that this trend will continue.
The integrated nature of aluminium and copper, have
been the major performance drivers. For instance, in
the aluminium business bauxite mining to value added
downstream products and in the copper business, copper mining to value added products along
with the fertilizer stream and precious metal refinery bolstered growth.
Your Company’s strategy of building a portfolio of an extremely volatile yet high profit upstream
business and a relatively low margin but stable downstream businesses of Novelis as well as
Copper, has worked well in a time of low aluminium prices. Your Company’s operational performance
at your Company has been the best ever. Both Aluminium and Copper production have reached
new highs.
Having said that, I must add that for Novelis too, your Company’s subsidiary it has been an
unprecedented year. The high point has been the turnaround of Novelis. This was accomplished
through a slew of initiatives. Strategic measures, realignment of the product line to the
revised demand scenario, closure of some capacities, pruning of overhead costs and
prudent inventory management altogether have generated measurable returns across Novelis’s
global operations.
For the Financial Year 2009-10,
your Company’s performance
has been phenomenal
both at the standalone
and consolidated level.
Your Company’s Net Revenue
on consolidated basis stood
at US $ 12.8 billion
(Rs.60,722.1 crores).
Significantly, Net Profit
at US $ 829.2 million
(Rs.3,925.5 crores) soared
by 712%, in comparison
to previous year.

iii
THE CHAIRMAN’S LETTER TO SHAREHOLDERS
Novelis has been rejuvenated. Its focus shifted. Novelis’ paradigm
changed from being volume driven to profit driven. The Company
also went for higher pricing. Its adjusted EBITDA at US $ 754
million represents a 55% increase over the preceding year. Novelis
now has free cash flows of US $ 355 million and a liquidity
available of almost US $ 1 billion. This is a great accomplishment
for a company that was written off by investors not so long ago.
Novelis is now set to grow on a strong base.
The process of marrying Novelis’ high end technology with Hindalco’s cost focus is also progressing
well. The high-cost assets of Rogerstone in UK are being moved to Hirakud in Orissa, close to
our smelter. This will act as a hub for Can body stock. In turn it will help us grow the highly
potential beverage Can market in India.
I am also pleased to record that Aditya Birla Minerals Ltd., your Company’s Australian subsidiary,
also witnessed a turnaround in its financial performance, largely due to sustained cost management
processes. It has reported a PAT of AUD 61.4 million, as against a loss of AUD 76 million in the
earlier year.
All of your Company’s Greenfield projects – Utkal Alumina, Mahan Aluminium, Aditya Aluminium
and Jharkhand Aluminium are on course. Regardless of the tough financial markets, your Company
has made considerable progress on each of them. Let me reiterate that when these projects go
on stream, your Company would be a 1.8 million tons Aluminium Company.
Outlook
It is apparent that the volatile financial and commodity markets in the last two financial years have
severely tested the resilience of your Company’s business model. It has been baptism by fire and
your Company has emerged much stronger. Your Company’s ongoing focus on cost optimization,
operational excellence and the integrated business approach will ensure its long term success. The
outlook is cautiously optimistic in the near future, before the impending quantum growth leap.
To our teams
I very warmly want to thank all of our colleagues in Hindalco for their immense contribution to
your Company’s praiseworthy performance. I look forward to their continued commitment to your
Company’s reaching greater heights and enhancing shareholder value.
The process of
marrying Novelis’
high end technology
with Hindalco’s cost
focus is also
progressing well.
iv
THE CHAIRMAN’S LETTER TO SHAREHOLDERS
The Aditya Birla Group in perspective
Today, we are a multicultural, multinational,
multidimensional Group anchored by over 1,30,000
employees, belonging to 30 nationalities, across
6 continents. Our Group turnover is a little over
US $ 29 billion. Our leadership across several levels is
fleet of foot, flexible enough to adapt to the ever
changing environment, and ambitious enough to dream
audaciously.
Our goal is to become a US $ 65 billion Group by
2015 from US $ 30 billion today. We expect your
Company to contribute significantly to this growth and
earnings.
To attain this bold and ambitious vision, we have launched
a series of people centered strategies. I believe, the best
of goals can only fruition if we have the best of people
and harness people potential, irrespective of positions.
As the Group continues to expand globally, exploring and seizing opportunities, we have accelerated
the pace of offerings to our intellectual capital. Our endeavour is to provide them with unparalleled
opportunities, dynamic challenges, a rewarding professional career and a sense of fulfillment on
the personal front. This is a priority area. To take this forward, we launched our employee value
proposition. Simply put, it is “a world of opportunities”. It entails the reinforcement of a four
pronged approach.
Firstly, offering exciting career prospects that give employees a leeway to chart their own growth
trajectory.
Secondly, intensifying learning processes that hone existing skills. Transcending it, we have taken
the learning to a higher stage where talented employees are able to convert knowledge into action
through exposure to the best global minds. For example, this year at Gyanodaya, our benchmarkable
Institute of Management Learning, more than 500 colleagues at senior levels participated in
specially designed, intellectually stimulating, innovative focused programmes. These related to
globalization, leadership, innovation and getting far beyond the mind of the customer. These were
Today, we are a
multicultural, multinational,
multidimensional Group
anchored by over 1,30,000
employees, belonging to
30 nationalities, across
6 continents. Our Group
turnover is a little over
US $ 29 billion.
Our leadership across
several levels is fleet of foot,
flexible enough to adapt
to the ever changing
environment, and ambitious
enough to dream

v
THE CHAIRMAN’S LETTER TO SHAREHOLDERS
conducted in collaboration with the best in class faculty
from International Business Schools and consulting
organizations. Among these feature, The Ross School of
Business, The Duke University, UCLA (all from USA), ISB
(Hyderabad), The Hay Group and Mercer Consulting.
It might interest you to learn that this year as well over
a 1,000 executives enlisted for different learning sessions.
Gyanodaya’s virtual campuses reached out to more than
13,500 learners through its e-learning courses and
webinars.
Thirdly, as part of our concerted efforts towards a sharp organizational focus and alignment in
the talent management processes, across the businesses, we put in place critical differentiators.
Besides linking rewards to performance, special performance incentives, international assignments,
and Group-wide recognition programmes have been set in motion.
Fourthly, promoting enriched living by encouraging talent to look beyond just professional
enhancement and to work toward building a wholesome, balanced life.
I believe, our Employee Value Proposition also helps to create an enabling environment that sets
people up for success, enthuses in them the drive to excel, achieve and push back the frontiers
of excellence.
Finally, I am delighted to share with you that in a comprehensive global study of organizational
leadership across the world, conducted by The Hewitt Associates, in partnership with The RBL
Group and Fortune Magazine (2009) on “Top Companies for Leaders to engage in”, our Group,
was adjudged “The 6th great place for leaders in the Asia pacific Region”. That of 177 companies
who participated in this study, we should have been chosen is indeed a great achievement. Their
critical assessment criteria included strength and depth of leadership practices, culture, examples
of developing world class leaders, business performance and company reputation. On all counts,
we are on course.
Yours sincerely,
Kumar Mangalam Birla
I believe, our Employee Value
Proposition also helps to
create an enabling
environment that sets people
up for success, enthuses in
them the drive to excel,
achieve and push back the
frontiers of excellence.
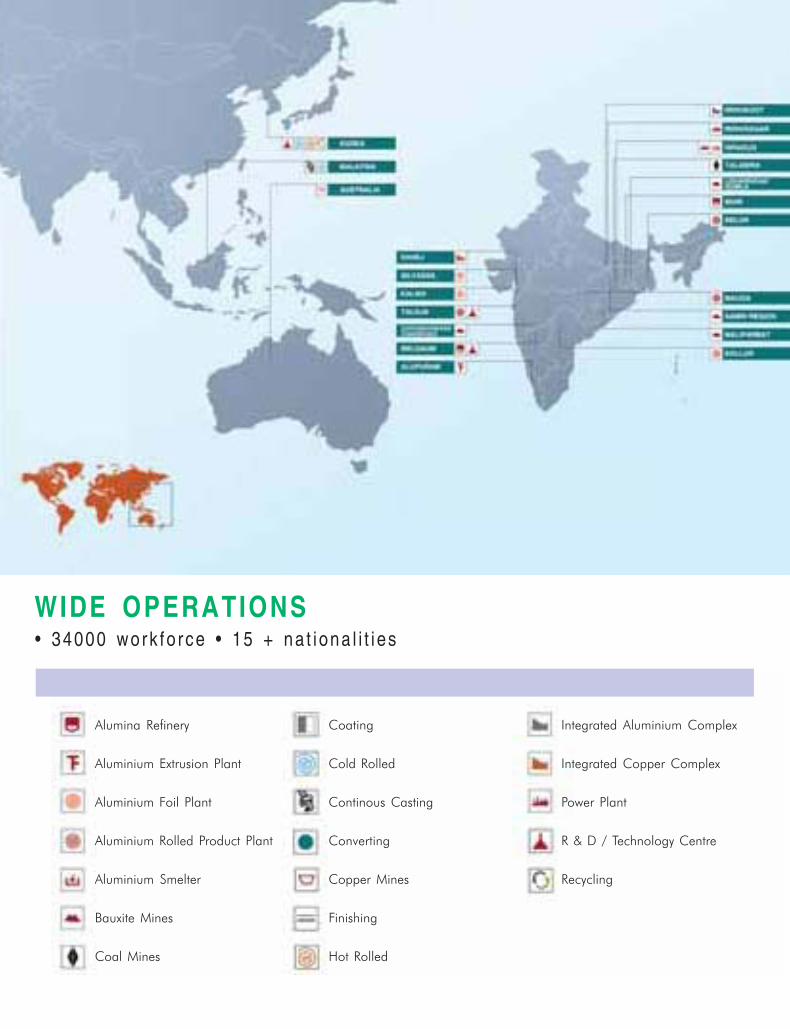
WIDE OPERATIONS
• 34000 work fo rce • 15 + na t i ona l i t i es
Alumina Refinery
Aluminium Extrusion Plant
Aluminium Foil Plant
Aluminium Rolled Product Plant
Aluminium Smelter
Bauxite Mines
Coal Mines
Coating
Cold Rolled
Continous Casting
Converting
Copper Mines
Finishing
Hot Rolled
Integrated Aluminium Complex
Integrated Copper Complex
Power Plant
R & D / Technology Centre
Recycling

. . .D IVERSE WORLD
51 un i t s • 13 coun t r i es
SUBSIDIARIES UNIT LOCATED AT
Novelis Inc North America • Rolled Product
• Foil
• Recycled Product
Europe • Rolled Product
• Recycled Product
Asia • Rolled Product
• Recycled Product
South America • Rolled Product
• Alumina
• Aluminium
• Recycled Product
Aditya Birla Minerals Limited Nifty Mines • Copper Cathode
Mt Gordon Mines • Copper Concentrate
Australia • Power
• Copper Concentrate

viii
Hindalco’s well-crafted growth
and integration hinges on the
three cornerstones of
COST COMPETITIVENESS
Reflected through its strong
manufacturing base and operational
efficiencies across the value chain
QUALITY
Through its versatile range of
products serving core applications
for diverse industries; and
GLOBAL REACH
Operations in 5 continents.
Reaching Customers across
more than 50 countries
CONTENTS
Board of Directors ...................................................... 1
Financial Highlights .................................................... 2
Management Discussion & Analysis ............................. 4
Report on Corporate Governance ............................... 22
Shareholder Information ............................................. 32
Sustainable Development : Environment Responsibility ... 41
Sustainable Development : Inclusive Growth ................ 43
Directors’ Report ......................................................... 47
Auditors’ Report .......................................................... 68
Balance Sheet ............................................................ 72
Profit and Loss Account ............................................... 73
Cash Flow Statement .................................................. 74
Schedules ................................................................... 75
Consolidated Financial Statements .............................. 116
SUPER POWER
IN PREMIUM METALS

[1]
Supe r Power i n Premium Me ta l s
BOARD OF DIRECTORS
Non Executive Directors
Mr. Kumar Mangalam Birla, Chairman
Mrs. Rajashree Birla
Mr. A.K. Agarwala
Mr. E.B. Desai
Mr. S.S. Kothari
Mr. C.M. Maniar
Mr. M.M. Bhagat
Mr. K.N. Bhandari
Mr. N.J. Jhaveri
Executive Director
Mr. D. Bhattacharya
Managing Director
CHIEF FINANCIAL OFFICER
Mr. S. Talukdar
Group Executive President & CFO
CORPORATE
Mr. R. Ram, Senior President
(Corporate Projects & Procurement)
Mr. Vineet Kaul, Chief People Officer
ADVISOR
Mr. R.K. Kasliwal
COMPANY SECRETARY
Mr. Anil Malik
KEY EXECUTIVES
ALUMINIUM BUSINESS
Mr. Shashi K. Maudgal, Chief Marketing Officer
Mr. R. S. Dhulkhed, Senior President (Operations)
Mr. S. M. Bhatia, President (Foil & Packaging)
Mr. Vinod Sood, President (Chemicals & International Trade)
Mr. Anil Kumar Sinha, President (Human Resources)
Renukoot & Renusagar Units
Mr. D. K. Kohly, Chief Operating Officer
Mr. Ashok Machher, Joint President (F & C)
Aditya Aluminium
Mr. S. N. Bontha, Chief Executive Officer
Mr. S. N. Jena, Chief Operating Officer
COPPER BUSINESS
Mr. Dilip Gaur, Group Executive President
Mr. Shambhu Sharma, President & Chief Operating Officer
Mr. N. M. Patnaik, President (Finance & Commercial)
Mr. J. P. Paliwal, Joint Executive President (Commercial)
Mr. B. M. Sharma, Chief Marketing Officer
AUDITORS
Singhi & Co., Kolkata
COST AUDITORS
R. Nanabhoy & Co., Mumbai
Mani & Co., Kolkata
HINDALCO INDUSTRIES LIMITED

[2]
Supe r Power i n Premium Me ta l s
FINANCIAL HIGHLIGHTS - STANDALONE
USD in Mn * (Rs. in Crores)
2009-10 2009-10 2008-09 2007-08 2006-07 2005-06 2004-05 2003-04 2002-03 2001-02 2000-01
PROFITABILITY
Net Sales and Operating Revenues 4,358 19,536 18,220 19,201 18,313 11,396 9,523 6,208 4,986 2,331 2,275
Cost of Sales 3,700 16,586 15,184 15,800 14,298 8,791 7,247 4,708 3,741 1,337 1,223
Operating Profit 658 2,950 3,036 3,401 4,015 2,605 2,276 1,500 1,245 994 1,052
Depreciation and Impairment 149 667 645 588 638 521 463 317 264 154 142
Other Income 58 260 637 493 370 244 270 240 218 211 131
Interest and Finance Charges 62 278 337 281 242 225 170 177 136 46 62
Profit before Tax and Exceptional Items 505 2,265 2,690 3,025 3,505 2,103 1,913 1,246 1,063 1,005 980
Exceptional Items (Net) - - - - - (3) 9 - 163 - -
Profit before Tax 505 2,265 2,690 3,025 3,505 2,106 1,904 1,246 899 1,005 980
Tax for current year 103 462 611 705 940 450 575 407 317 319 302
Tax adjustment for earlier years (Net) (25) (113) (151) (541) - - - - - - -
Net Profit 427 1,916 2,230 2,861 2,564 1,656 1,329 839 582 686 678
FINANCIAL POSITION
Gross Fixed Assets (including CWIP) 3,903 17,496 14,783 13,728 12,729 11,251 10,096 7,126 6,470 3,736 3,051
Depreciation and Impairment 1,351 6,059 5,506 4,799 4,246 3,635 3,169 1,918 1,607 1,041 899
Net Fixed Assets 2,551 11,437 9,277 8,929 8,483 7,616 6,927 5,208 4,863 2,695 2,152
Investments 4,792 21,481 19,149 14,108 8,675 3,971 3,702 3,377 2,648 1,985 1,917
Net Current Assets 606 2,716 5,068 4,051 3,741 4,150 1,958 1,833 1,923 1,303 1,024
Capital Employed 7,949 35,634 33,493 27,088 20,900 15,737 12,587 10,418 9,435 5,984 5,094
Loan Funds 1,418 6,357 8,324 8,329 7,359 4,903 3,800 2,565 2,395 958 715
Deferred Tax Liability (Net) 305 1,366 1,411 1,323 1,126 1,233 1,130 995 849 444 -
Net Worth 6,226 27,911 23,758 17,436 12,415 9,601 7,657 6,858 6,191 4,582 4,379
Net Worth represented by :
Share Capital 43 191 170 123 104 99 93 92 92 74 74
Share Warrants/ Suspense - - - 139 - - - - - - -
Reserves and Surplus # 6,183 27,720 23,588 17,174 12,311 9,502 7,564 6,765 6,099 4,507 4,304
6,226 27,911 23,758 17,436 12,415 9,601 7,657 6,858 6,191 4,582 4,379
Dividend
Preference Shares (including Tax) - - 0.03 0.03 - - - - - - -
Equity Shares (including Tax) 67.2 301 269 265 202 247 212 172 141 101 98
RATIOS AND STATISTICS
Unit 2009-10 2008-09 2007-08 2006-07 2005-06 2004-05 2003-04 2002-03 2001-02 2000-01
Operating Margin % 15.10 16.66 17.71 21.92 22.86 23.90 24.17 24.97 42.64 46.27
Net Margin % 9.81 12.24 14.90 14.00 14.53 13.96 13.51 11.68 29.42 29.80
Gross Interest Cover Times 5.23 5.48 6.08 10.50 11.19 12.47 8.77 7.51 13.50 14.92
Net Interest Cover Times 11.55 10.90 13.88 18.09 12.65 14.98 9.82 10.72 26.43 19.14
ROCE % 7.14 9.04 12.21 17.93 14.79 16.55 13.66 12.71 17.56 20.46
ROE % 6.86 9.39 16.41 20.66 17.24 17.36 12.23 9.40 14.97 15.49
Basic EPS $ Rs. 10.82 14.82 22.23 25.52 16.79 13.48 8.53 5.92 8.67 8.57
Diluted EPS $ Rs. 10.81 14.82 22.11 25.52 16.79 13.48 8.53 5.92 8.67 8.57
Cash EPS $ Rs. 14.58 19.10 26.80 31.87 22.07 18.18 11.76 8.61 10.62 10.37
Dividend per Share % 135 135 185 170 220 200 165 135 135 120
Capital Expenditure Rs. in Cr. 2,860 1,121 1,049 1,516 1,188 1,097 669 1,037 701 299
Foreign Exchange earning on Export Rs. in Cr. 5,268 5,148 6,434 6,973 3,643 2,605 1,295 1,028 337 376
Debt Equity Ratio Times 0.23 0.35 0.48 0.59 0.51 0.50 0.37 0.39 0.21 0.16
Book value per Share $ Rs. 145.87 139.73 142.09 118.97 97.40 82.54 74.16 66.95 61.53 58.81
Market Capitalisation Rs. in Cr. 34,682 8,850 20,260 13,963 19,196 12,002 11,256 4,943 5,734 5,744
Number of Equity Shareholders Nos. 339,281 435,064 335,337 520,019 396,766 117,721 117,124 153,606 35,955 37,925
Number of Employees Nos. 19,539 19,867 19,667 20,366 19,593 19,687 13,675 13,752 12,955 12,892
Average Cash LME (Aluminium) USD 1,868 2,234 2,623 2,663 2,028 1,779 1,496 1,354 1,395 1,533
Average Cash LME (Copper) USD 6,112 5,885 7,521 6,985 4,099 3,000 2,046 1,586 - -
* 1 USD = Rs. 44.83
# Including Employee Stock Options Outstanding but Net of Miscellaneous Expenditure.
$ Figures recomputed for all the years prior to 2005-06 for stock split in the ratio of 10 : 1 (Face value Rs. 10/- to Re. 1/-) effected in 2005-06.
Figures for 2002-03 onwards include figures relating to the copper business of Indo Gulf Corporation Limited acquired pursuant to Scheme of Arrangement with effect from 01.04.2002.
Figures for 2004-05 onwards include figures relating to de-merged Units of Indian Aluminium Company, Limited acquired pursuant to Scheme of Arrangement with effect from 01.04.2004.
Figures for 2007-08 onwards include figures of Indian Aluminium Company, Limited amalgamated pursuant to Scheme of Amalgamation with effect from 01.04.2007.
FIN
AN
CIA
L H
IGH
LIG
HTS

[3]
Supe r Power i n Premium Me ta l s
FINANCIAL HIGHLIGHTS - CONSOLIDATED
USD in Mn * (Rs. in Crores)
2009-10 2009-10 2008-09 2007-08 2006-07 2005-06 2004-05 2003-04 2002-03 2001-02
PROFITABILITY
Net Sales and Operating Revenues 13,545 60,722 65,963 60,013 19,316 12,120 10,105 8,223 6,401 3,565
Cost of Sales 11,371 50,976 62,993 53,378 14,886 9,275 7,675 6,268 4,899 2,365
Operating Profit 2,174 9,746 2,970 6,635 4,431 2,845 2,431 1,956 1,502 1,201
Depreciation and Impairment 621 2,784 3,038 2,488 865 796 632 514 371 218
Other Income 72 323 691 656 409 281 278 280 241 238
Interest and Finance Charges 246 1,104 1,228 1,849 313 301 216 235 190 81
Profit before Tax and Exceptional Items 1,379 6,181 (605) 2,954 3,662 2,028 1,860 1,486 1,182 1,141
Exceptional Items (Net) - - - - - (2) 13 1 161 7
Profit before Tax 1,379 6,181 (605) 2,954 3,662 2,030 1,847 1,485 1,020 1,133
Tax for current year 431 1,932 (805) 1,189 958 440 623 487 350 355
Tax adjustment for earlier years (Net) (23) (103) (149) (548) 0 (0) (72) 1 (0) -
Profit before Minority Interest 971 4,352 349 2,313 2,703 1,590 1,296 997 670 779
Minority Interest 95 424 (172) 219 16 11 11 4 5 30
Share in Profit/(Loss) of Associates (Net) 1 3 37 (100) 1 - - - - -
Net Profit 876 3,925 484 2,193 2,686 1,580 1,285 993 666 749
FINANCIAL POSITION
Gross Fixed Assets (including CWIP) 11,471 51,423 49,169 44,569 16,188 14,484 12,592 10,970 9,554 5,559
Depreciation and Impairment 3,708 16,622 14,404 7,405 5,035 4,600 3,906 3,041 2,495 1,608
Net Fixed Assets 7,763 34,801 34,765 37,164 11,153 9,883 8,685 7,929 7,060 3,950
Investments 2,508 11,246 10,389 14,008 7,874 3,163 2,956 1,866 1,187 1,241
Net Current Assets 1,154 5,172 3,011 4,254 4,257 3,967 2,161 2,249 2,305 1,607
Capital Employed 11,425 51,219 48,165 55,426 23,285 17,014 13,802 12,043 10,552 6,798
Loan Funds 5,353 23,999 28,310 32,352 8,443 6,279 4,931 3,724 3,304 1,395
Minority Interest 388 1,737 1,287 1,615 857 130 86 93 36 199
Deferred Tax Liability (Net) 878 3,938 2,811 4,172 1,172 1,228 1,134 1,195 1,026 598
Net Worth 4,806 21,545 15,758 17,286 12,814 9,377 7,651 7,031 6,186 4,606
Net Worth represented by :
Share Capital 43 191 170 123 104 147 142 141 131 74
Share Warrants/ Suspense - - - 140 - - - - 11 -
Reserves and Surplus # 4,763 21,353 15,588 17,023 12,709 9,230 7,510 6,889 6,044 4,531
4,806 21,545 15,758 17,286 12,814 9,377 7,651 7,031 6,186 4,606
Dividend
Preference Shares (including Tax) - - 0.03 0.03 - - - - - -
Equity Shares (including Tax) 67.7 303 271 268 204 249 213 173 141 101
RATIOS AND STATISTICS
Unit 2009-10 2008-09 2007-08 2006-07 2005-06 2004-05 2003-04 2002-03 2001-02
Operating Margin % 16.05 4.50 11.06 22.94 23.47 24.05 23.78 23.47 33.67
Net Margin % 6.46 0.73 3.65 13.90 13.03 12.71 12.08 10.40 21.01
Gross Interest Cover Times 9.12 2.98 3.30 9.91 8.87 10.32 8.60 6.89 11.41
Net Interest Cover Times 9.12 2.98 3.94 15.44 10.37 12.54 9.53 9.16 17.81
ROCE % 14.22 1.29 8.67 17.07 13.69 15.04 14.29 13.00 17.97
ROE % 18.22 3.07 12.69 20.96 16.85 16.79 14.13 10.76 16.26
Basic EPS $ Rs. 22.17 3.21 17.04 26.73 16.02 13.03 10.11 6.77 9.46
Diluted EPS $ Rs. 22.16 3.21 16.95 26.73 16.02 13.03 10.11 6.77 9.46
Cash EPS $ Rs. 37.88 23.40 36.38 35.33 24.09 19.44 15.33 10.54 12.21
Capital Expenditure Rs. in Cr 5,983 2,452 2,989 2,349 1,758 1,565 1,177 1,256 793
Debt Equity Ratio Times 1.11 1.80 1.87 0.66 0.67 0.64 0.53 0.53 0.30
Book value per Share $ Rs. 112.59 92.68 140.86 122.79 95.14 82.47 76.03 66.89 61.86
* 1 USD = Rs. 44.83
# Including Employee Stock Options Outstanding but Net of Miscellaneous Expenditure.
$ Figures recomputed for all the years prior to 2005-06 for stock split in the ratio of 10 : 1 (Face value Rs. 10/- to Re. 1/-) effected in 2005-06.
Figures for 2003-04 onwards include the figures of Bihar Caustic and Chemicals Limited which has become subsidiary of the Company with effect from 07.05.2003.
Figures for 2007-08 onwards include the figures of Novelis Inc., a foreign subsidiary, acquired by the Company on 16.05.2007 through its wholly-owned overseas subsidiaries.
FIN
AN
CIA
L H
IGH
LIG
HTS

MA
NAG
EM
EN
T D
ISC
USSIO
N A
ND
A
NA
LYSIS
MANAGEMENT D ISCUSSION AND ANALYSIS
[4]
Supe r Power i n Premium Me ta l s
Business Overview:
FY 10 was a remarkable year on various counts.
Today, as one looks back at the strong recovery
in the aftermath of an unprecedented sanguinary
spell that befell us towards the second half of
FY09, it appears to be a far better year than
FY09. After reaching its nadir in March 09, the
commodity prices have recovered and the
situation appears to be far better than it was
around the same time last year.
And yet, if one compares full year FY10 with
FY09, in FY09 average commodity prices were
almost the same or were higher than FY10
averages, a fact overlooked by many. This also
explains the velocity of decline and recovery, of
commodity prices; a truly amazing phenomenon.
Equally intriguing was the sharp fall in demand
and subsequent demand recovery initially in the
wake of Government’s stimulus measures and
later on account of general improvement in the
global demand, primarily led by the emerging
markets.
Consolidated sales were Rs.60,722 crore in
FY10 as compared with Rs.65,963 crore in
FY09. Revenues were lower mainly due to lower
aluminium prices and softness in the Company’s
end-markets in the first half of the year, especially
for Novelis. Further, change in the status of
Idea Cellular Ltd. from Joint Venture to Associate
w.e.f from 1st
Jan 2009 for the purpose of
consolidation, also resulted in proportionate
revenue from Idea not being included in the
consolidated revenue.The PBIDTA stood at
Rs.10,069 Crore as compared with Rs.3,661
Crore in the previous year. This includes USD
578 million of unrealized gains consisting of
USD 504 million reversal of previously
recognized losses upon settlement of derivatives
and USD 74 million of unrealized gains relating
to mark to market adjustments on metal and
currency derivatives at Novelis.
Aluminium business revenue fell by 11% to
Rs.48,091 crore mainly due to lower LME; and
lower demand in first half of the year. Earning
before Interest turned around from a loss of
Rs.425 crore to a profit of Rs.5,998 crore. This
is significantly attributable to the remarkable
results of Novelis.
The performance of the Aluminium business
segment of standalone Hindalco during FY10
was impacted due to lower average LME.
Average LME was lower by around 16% than
the previous year. The demand for downstream
value added products improved smartly in the
second half and the sales volumes for the year
were higher by 21% compared to previous year.
Operational Highlights:
1. Highest ever aluminium production.
2. Highest ever downstream value added
production leading to improved product mix.
3. Significantly higher sales in more
lucrative domestic market.
4. Continuous reduction in conversion cost
despite rising input cost pressures.
We continued producing more metal both
through asset sweating and brownfield expansion
of the Hirakud smelter and de-bottlenecking at
Renukoot. We produced 555 KT of hot metal
against 523 KT in the previous year. The
Company recorded highest ever primary
D. Bhattacharya
Managing Director

MA
NAG
EM
EN
T D
ISC
USSIO
N A
ND
A
NA
LYSIS
MANAGEMENT D ISCUSSION AND ANALYSIS
[5]
Supe r Power i n Premium Me ta l s
World Leader in World Leader in
Aluminium Rolling
and Recyclingand Recycling
aluminium production in this year . The turnover
in the aluminium business declined by 8% to
Rs. 7,001 crore vis-à-vis Rs. 7,604 crore in the
corresponding period in the previous year with
decline in LME, even though the decline was
partly offset through higher volumes.
To mitigate the impact of sharp fall in realizations
several cost control initiatives were successfully
adopted. The increased proportion of Hirakud
metal in our basket also enabled us to reduce
blended cost of production.
The EBIT margin of our Aluminium business is
amongst the highest relative to domestic and
global peers which underlines our strategic thrust
and commitment to combine cost leadership
and portfolio de-risking. As a result, our EBIT
margin is relatively less impacted by LME
compared to pure play aluminium companies.
FY10 was perhaps one of the most challenging
years for Copper smelters worldwide. The
business witnessed extreme price volatility in the
aftermath of the economic meltdown,
compounded by acute tightness in the
concentrate market and unviable spot
TCRC levels. While the benchmark TCRC’s
were a healthy 75/7.5, the spot TCRC’s
plummeted from a high of 90/9 in Jan, 09 to
near zero by Q310 and remained well below
the cash costs of most smelters for significant
part of the year.
The Copper business significantly improved its
underlying operating performance despite
tightness in the concentrate market and
escalating input costs. Copper business revenue
increased by 18% to Rs. 12,542 crore and EBIT
doubled from Rs. 379 crore to Rs. 660 crore.
Novelis
Novelis witnessed a tremendous turnaround in
the midst of challenging circumstances. In an
economy that was still emerging from recession
Novelis reported record results. Record adjusted
EBITDA, record liquidity and record free cash
flow. Novelis achieved these record results
despite a 2% decrease in shipments Y-o-Y
driven by soft market conditions in the first
half of the year. Novelis’ sales declined due to
North America
11 Rolled products Facilities
including 2 recycling
facilities
Europe
13 Rolled products Facilities
including 1 recycling facility
Asia
3 Rolled products Facilities
South America
2 Smelters and
2 Rolled products FacilitiesNO
VE
LI
S
UN
IT
S

MA
NAG
EM
EN
T D
ISC
USSIO
N A
ND
A
NA
LYSIS
MANAGEMENT D ISCUSSION AND ANALYSIS
[6]
Supe r Power i n Premium Me ta l s
decrease in the average LME prices and 2%
lower shipments.
Adjusted EBITDA increased by 55% Y-o-Y,
reaching USD 754 Million. This was achieved
on the back of price increases negotiated in
specific contracts across all regions and cost-
out and restructuring initiatives that the company
identified and implemented throughout the year.
Your Company also saw a dramatic
improvement in liquidity over the past year,
liquidity surpassed USD 1 Billion driven by strong
operational cash flow, the bond issuance and
increased gross borrowing capacity under the
ABL. Free cash flow went from a negative
USD 352 Million in FY09 to a positive
USD 355 Million in FY10. This was a direct
result of stronger performance, working capital
management and controlled capex levels.
The IT subsidiary of Novelis in Pune, Novelis
India Infotech Ltd is now up and running. It is
now catering to some of the IT and ERP
requirements of Novelis globally.
Effective, 1st
January, 2010, Novelis is no longer
impacted by can price ceilings. In terms of
continued cost savings, Novelis is taking a series
of steps to streamline and optimise the
manufacturing operations in mature markets.
In response to the growing demand for its
products in South America, the company is
undertaking a major expansion in Brazil. The
expansion will increase the plant’s capacity in
Brazil by more than 50%.
Aditya Birla Minerals
Aditya Birla Minerals Limited, your Company’s
Australian Subsidiary, reported Profit after Tax
of AUD 61.4 Million as against a loss of
AUD 76.0 Million in the previous year. Sustained
cost management resulted in turnaround in
financial performance. The production was
however; lower mainly due to loss of production
of Copper in Concentrate at Mt. Gordon and
Cathode production at Nifty Oxide operations
which were put under Care & Maintenance as
a conscious management decision. The drop in
overall production was partly off-set by 13.8%
increase in Nifty’s production of Copper in
Concentrate.
Projects
Our projects continue to follow the strategic
plan which we have set for ourselves. The
benefits of brownfield expansions and earlier
inorganic acquisitions have been the major
factors which helped us tide over the challenging
environment in FY10. We are working on five
greenfield sites in difficult terrain and uncertain
regulatory environment. Site work on all
greenfield projects has gained momentum and
is in various stages of progress.
Business Reconstruction Reserve
Last year the Company formulated a scheme of
financial restructuring to deal with various extra-
ordinary costs associated with its organic and
inorganic growth plan. The recent economic
downturn particularly in the commodity space is
also expected to result in impairment / diminution
in value of certain assets/ investments.
Accordingly, as per a Scheme of Arrangement
under Sections 391 to 394 of the Companies
Act 1956 (“the Scheme”) between the Company
and its equity shareholders approved by the High
Court of judicature of Bombay, a separate reserve
account titled as Business Reconstruction Reserve
(“BRR”) has been created by transferring balance
standing to the credit of Securities Premium
Account of the Company for adjustment of certain
expenses as prescribed therein. This year no
adjustment was made pertaining to standalone
accounts in this reserve and Rs. 304 Crore
relating to interest and finance charges on loan
taken by AV Minerals (Netherlands) B.V. was
made for consolidated accounts, which has been
suitably disclosed.
Corporate
The standalone basic and diluted Earning per
Share was at Rs.10.8 per share FY10 as
compared with Rs.14.8 per share in FY09.

MA
NAG
EM
EN
T D
ISC
USSIO
N A
ND
A
NA
LYSIS
MANAGEMENT D ISCUSSION AND ANALYSIS
[7]
Supe r Power i n Premium Me ta l s
Business Performance Review:
Aluminium Business
Aluminium Industry Review
Global economies recovered after an
unprecedented sharp fall in FY09. The recovery
was equally spectacular but fraught with
uncertainty and the average aluminium prices
remained lower than the FY09 averages.
The Indian economy showed its resilience in
FY09 and staged a sharp recovery albeit on the
back of generous stimulus packages by the
Government. In the aftermath of FY09 meltdown
and in the midst of uncertainty surrounding this
recovery, many global majors were forced to
adapt to the dynamic conditions in an ad hoc
manner and resorted to reactive actions in
response to the challenges faced such as
curtailing production, closing facilities and then
re-starting some of these facilities when the
situation improved.
Your company on the other hand approached
these adversities in a much steadier and
controlled manner and was able to weather the
storm much better. Not only did it perform
credibly on the operational front but also
ensured smooth and steady progress on the
various Greenfield projects.
Demand and Market:
In CY 2009, the world aluminium consumption
stood at around 34 Mn tonnes, a sharp decline
of over 8% from around 37.5 Mn tonnes
consumption in CY 2008. The CY09 production
stood at 37.7 Mn tonnes against production of
40 Mn tonnes in CY 08.
After an abysmal first quarter, the growth
rebounded in FY10 reaching around 36.3 Mn
tonnes, a growth of around 2.5%.
India on the other hand witnessed a smart
recovery post a slow down in FY2009, as the
GDP clawed back to 7.4% in FY10 from 6.7%
in FY09. A sharp turnaround in the end user
segments such as automobiles, Industrial and
infrastructure and thrust on power sector growth
propelled the aluminium industry growth. The
improvement coupled with low base effect resulted
in a strong 27.8% growth in domestic demand.
In FY10 LME aluminium prices staged a
remarkable recovery to around USD 2,000
levels after touching lows of sub USD1400 in
March 2009.
The depreciating rupee helped domestic
aluminium producers partially as the prices are
dollar denominated. The prices continued to
rise even as inventory levels remained at their
historic highs. This was the result of tightness in
the physical market, with most inventories tied
up at various ware houses under financing deals.
0
500
1000
1500
2000
2500
3000
3500
FY10FY09
MarFebJanDecNovOctSepAugJulJunMayApr
LME Aluminium Price ($ per ton)
201020092008
N America+11%
Europe+9%
China+18%
India+14%
RoWOth. Asia
13.7%
39001
6483
1664
16409
6975
5033
34302
37419
63595690
1463
13931
6431
4547
1239
12602
8775
5990
8.3%
(kt)
Rs./$
36
38
40
42
44
46
48
50
52
Q4 FY10Q3 FY10Q2 FY10Q1 FY10Q4 FY09Q3 FY09Q2 FY09Q1 FY09
41.66
43.78
48.76
49.7748.79 48.42
46.6445.93

MA
NAG
EM
EN
T D
ISC
USSIO
N A
ND
A
NA
LYSIS
MANAGEMENT D ISCUSSION AND ANALYSIS
[8]
Supe r Power i n Premium Me ta l s
Aluminium continued to remain in contango
taking more and more aluminium outside
the physical market as borrowing costs remain
low and warehouses rent continued to be
attractive.
Globally, Aluminium production increased as
the producers restarted their capacities with the
smart recovery in the aluminium LME. As a result
the global markets continued to be in surplus
and global inventory increased to historical peaks.
The primary aluminium production for the year
was around 40 Mn tonnes. China again led
the production in 2009, producing around
14 Mn tonnes.
The cost of production of aluminium increased
as input costs such as alumina and power
surged. Alumina costs increased as the
aluminium prices recovered and bauxite quality
deteriorated. For most producers power costs
increased with sharp rise in coal/energy prices.
The cost of other inputs such as CPC coke and
anodes also increased in line with recovery in
the crude prices.
Operational Review
On this backdrop, your Company’s performance
was commendable and its performance was
amongst the best performance in the industry.
The aluminium business operational
performance was indeed exceptional and
recorded highest ever production of aluminium
metal surpassing the record it achieved last year.
Alumina
We increased alumina production by 6% to
1.3 Mn tonnes primarily through production ramp
up post expansion at Muri. We increased the higher
paying domestic sale of specials by 4%. Overall
alumina sales volumes however, were almost flat
on account of higher captive consumption.
Primary Metal
Primary aluminium production increased to
555,404 MT up 6% over the previous year.
This increase in production growth was possible
through brownfield expansion of Hirakud smelter
facility that led to 16% production growth from
134,301 Mt to 156,206 Mt and through
Tailor-made Solutions for Tailor-made Solutions for
Businesses WorldwideBusinesses Worldwide
Alumina
1.50 million tpa
Refineries
Renukoot 700,000 tpa
Belgaum 350,000 tpa
Muri 450,000 tpa
Bauxite Reserves
JHARKHAND
Lohardaga/Gumla
MAHARASHTRA
Durgmanwadi/Chandgad
ORISSA
Maliparbat
CHATTISGARH
Samri
OU
R
CA
PA
CI
TY

MA
NAG
EM
EN
T D
ISC
USSIO
N A
ND
A
NA
LYSIS
MANAGEMENT D ISCUSSION AND ANALYSIS
[9]
Supe r Power i n Premium Me ta l s
continued efforts to debottleneck the Renukoot
capacity, which yielded around 10,000 tonnes
of incremental production.
Aluminium sales volumes increased in line with
the production increase. However it was sales
of value added products such as FRP and
Extrusions that improved sharply.
Wire Rods
Wire rods production grew by over 23% from
74,968 MT in FY 09 to 91,903 MT. The
production was increased to cater to growing
demand from power sector.
Value Added Products (VAP)
This remains the key focus area of your company
to enhance profitability. This segment saw a
sharp rebound with improved economic
scenario.
The VAP (i.e. flat rolled products, extrusions and
foils) volumes in tonnage improved significantly
compared to that of last year. The overall
revenue though remained depressed on account
of lower aluminium LME. The markup in the
down stream business has shown a continuous
improvement over the years with continuous
improvement in product mix as well as
geographical mix.
Flat Rolled Products
The FRP production increased to 205,265 MT,
in line with the increasing domestic demand,
an increase of 13% over previous years. The
export demand though remained subdued.
Extrusions
Extrusion segment demand also improved as
the economy recovered. An improvement in the
fortunes of housing and automobile sectors
resulted in a demand increase for extruded
products. Extrusion production was higher at
38,909 MT in FY10 as compared with 35,895
MT in FY09. Extrusions sales volume increased
9% in FY10.
Financial Performance
The turnover of the aluminium domestic business
declined by 8% to Rs. 7,001 Crore
Primary Aluminium
Smelting Capacity
500,000 tpa
Smelters
Renukoot 345,000 tpa
Hirakud 155,000 tpa
Conductor Redraw Plants
Renukoot 56,400 tpa
Captive Power Plants
Renusagar 742 MW
Hirakud 367 MW
Coal Mine
Talabira
OU
R
CA
PA
CI
TY
Leading Low-cost Leading Low-cost
Producer of Aluminium Producer of Aluminium

MA
NAG
EM
EN
T D
ISC
USSIO
N A
ND
A
NA
LYSIS
MANAGEMENT D ISCUSSION AND ANALYSIS
[10]
Supe r Power i n Premium Me ta l s
India’s Leader in Value-Added India’s Leader in Value-Added
Rolled ProductsRolled Products
vis-à-vis Rs. 7,604 crore in the previous year,
inspite of the highest ever metal volumes, as
average LME for the year was 16% lower than
the previous year.
Earnings before interest and taxes (EBIT) declined
by 18% to Rs. 1,767 Crore due to pressure on
realizations and the cost push. The costs push,
was the result of increase in crude prices leading
to some increase in crude derivative prices such
as CP coke and fuel oil. Coal prices also
increased sharply. Aluminium producers across
the globe experienced pressure on EBIT margins
The decline in the case of your Company was
amongst the lowest in the industry. This was
possible primarily on account of higher
production, sales volumes and superior product
and geographic mix as discussed earlier.
The other cost management measures that
helped in containing the fall in EBIT were :
• Improvement in operational efficiency in
Power consumption, Carbon consumption etc.
• Cost effective sourcing of key Raw materials.
The sustainability of your company’s profitability
is reflected in healthy EBIT margins of 25%
despite all the adversities.
Aluminium Outlook
In 2010, the global aluminium demand is
expected to recover back to almost 39 Mn
tonnes an improvement of almost 13% over
2009. The Chinese demand is expected to rise
by almost 18% after a relatively modest increase
in 2009. The US demand is expected to recover
25000
27000
29000
31000
33000
35000
37000
39000
41000
43000
2010(Industry
Est.)
20092008200720060
500
1000
1500
2000
2500
3000
thou
sand
ton
es
$ p
er t
on
Production (kt) Consumption (kt)
LME Price ($/t)
Rolling Capacity
205,000 tpa
Sheet Rolling Plants
Renukoot 80,000 tpa
Belur 45,000 tpa
Taloja 50,000 tpa
Mauda 30,000 tpa
OU
R
CA
PA
CI
TY
MA
NAG
EM
EN
T D
ISC
USSIO
N A
ND
A
NA
LYSIS
MANAGEMENT D ISCUSSION AND ANALYSIS
[11]
Supe r Power i n Premium Me ta l s
India’s Premier Source of India’s Premier Source of
World-class ExtrusionsWorld-class Extrusions
sharply awhile Europe is expected to recover
slowly. In India, the demand is expected to
increase at almost 14% with an improvement in
Industrial activity and automobile growth. Over
the medium term, thrust on power sector
spending will spur the aluminium demand.
Aluminium production is expected to increase in
line with the demand. The market surplus is going
to continue for a while. With unprecedented
demand destruction towards later part of FY2009,
the prices of aluminium had declined very sharply
by over 50% in less than 4 months. The recovery
has also been strong. As a result, many smelters
that had curtailed production are again back in
action. In addition some new smelters are on the
verge of delivering.
The cost push has been felt in the recent times
with rise in crude prices from the recent highs.
Most input costs such as fuel oil, coal tar pitch
have increased along with the freight costs.
The prices are expected to continue to stay range
bound over the short term with a large inventory
overhang. Aluminium inventories across the globe
are near all time high. But most of these inventories
are reportedly bound in financing deals and are
not expected to flood the market. The long term
fundamentals are strong and the surplus is
expected to reduce significantly by FY 10 end.
Business Outlook
Your Company has demonstrated its mettle in
the wake of severe macroeconomic adversities.
The ferocity and the velocity of the turmoil
surprised the industry. But by leveraging its
fundamental strengths and through robust
business model your Company has emerged
stronger from the meltdown.
Your Company has adopted a consistent strategy
to achieve global size and scale through the
acquisition of Novelis. The de-risked business
model of Novelis, where LME is a pass through,
its robust product portfolio with over 50% going
into manufacture of beverage cans and strong
presence in emerging markets has shown its
strength in possibly worst of the times. This
business complements your Company’s ongoing
brownfield and greenfield expansion plans in
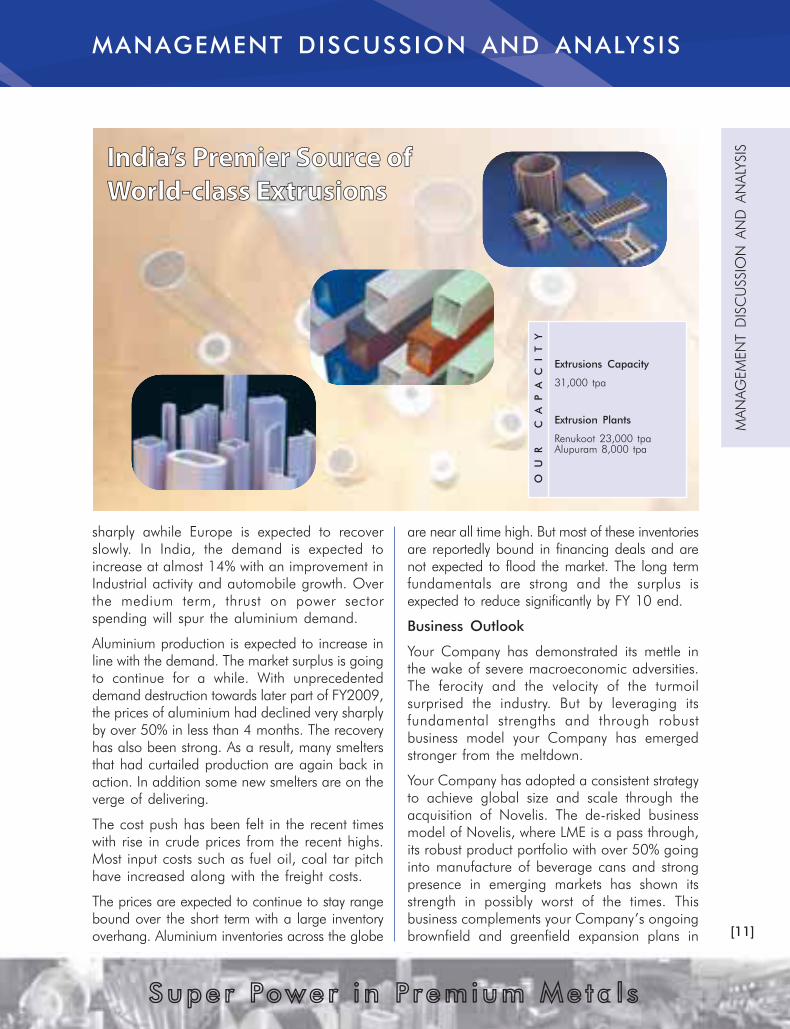
Extrusions Capacity
31,000 tpa
Extrusion Plants
Renukoot 23,000 tpa
Alupuram 8,000 tpa
OU
R
CA
PA
CI
TY

MA
NAG
EM
EN
T D
ISC
USSIO
N A
ND
A
NA
LYSIS
MANAGEMENT D ISCUSSION AND ANALYSIS
[12]
Supe r Power i n Premium Me ta l s
the upstream aluminium business. This will also
guard your Company against the commodity
meltdown in future.
Brownfield Expansions
• The expansion of Muri Alumina Refinery
from 110,000 tpa to 450,000 tpa is
complete.
• The Hirakud Smelter expansion from
143,000 tpa to 155,000 tpa is complete.
Further expansion from 155,000 tonnes to
161,000 tonnes is under progress and is
expected to be completed by Q2 FY11.
• In Hirakud, work is on to expand the
capacity further to 213,000 tonnes, through
addition of 80 pots. We expect to complete
this by Q4 FY 12.
• Further to the above, we are evaluating the
possibility of expanding the smelting capacity
at Hirakud from the proposed 213 KTPA to
360 KTPA with corresponding increase in
back-up captive power from proposed 467.5
MW to 967.5 MW.
• Flat Rolled Products:
A project is underway for transfer of all key
equipments for flat rolled products from the
Novelis Plant at Rogerstone, UK to Hirakud.
This will enable the company to produce
Can Body Stock for local and export
markets. The project is slated for completion
in Q2 FY 12. Dismantling activities are
around 65 % completed. Many of the major
orders for refurbishment of existing
equipment and procurement of new
equipment have been placed.
Greenfield Projects
Greenfield Projects have made significant
progress.
Utkal Alumina project: Construction of 1.5
Mio TPA Alumina refinery along with a 90 MW
captive cogen plant is in full swing. The output
from Utkal would be sufficient to feed alumina
to the Mahan and the Aditya smelters.
Engineering for Refinery and captive cogen plant
is nearing completion. Contractors are working
Greenfield Projects
will significantly
enchance the scale of
operations and will
further improve the
cost competitiveness
of the Company.
MA
NAG
EM
EN
T D
ISC
USSIO
N A
ND
A
NA
LYSIS
MANAGEMENT D ISCUSSION AND ANALYSIS
[13]
Supe r Power i n Premium Me ta l s
at site for civil & structural work and have
mobilized more than 5000 people at site. Piling
is 85% complete, fabrication and concreting
are around 35% complete. Major equipment
like Boilers, Evaporators & Turbines have started
arriving at site. The erection and structural work
for various equipments is in progress. Orders
for all the long delivery equipments placed.
Around 82% of the project cost has already
been committed.
The project team has estimated a total cost
of Rs.5,600 crore without financing cost.
The project commissioning is projected in
Q2 FY12.
Sanctioned credit approvals from a consortium
of banks for the entire debt requirement of the
project have been obtained. The Common loan
agreement was signed in July, 2010 and the
drawdown is expected soon.
Mahan Aluminium project: An 359 ktpa,
Aluminium Smelter of capacity along with a
900 MW captive power plant is coming up in
Bargwan, Madhya Pradesh.
All major approvals are in place and site
activities are on track. Major contractors have
mobilized about 10,000 people at site.
Three out of the six boilers & electrostatic
precipitator foundations are complete.
The powerhouse foundation work is in
progress. Two chimney rafts are complete.
The erection of the engineering structure for
boilers is in progress.
Around 82% of the total project cost has been
committed. The project team has estimated a
total cost of Rs.9,200 crore without financing
cost. The project is expected to be commissioned
in Q2FY12.
The Aditya Aluminium project: A 359 ktpa,
Aluminium smelter along with a 900 MW captive
power plant, identical to the Mahan Project, is
coming up in Orissa.
All major approvals are in place. Critical
equipment orders have been placed for both
the smelter and the power plant. The site
activities like area grading and boundary wall
are on.
Around 59% of the total project cost has been
committed. The project team has estimated a
total cost of Rs.9,200 crore without the financing
cost. The project commissioning is slated in
Q3 FY12.
The Aditya Refinery Project: A 1.5 Mio TPA
Alumina Refinery along with a 90 MW cogen
plant, replica of the Utkal Alumina refinery is
coming up in Orissa. The cost estimate in the
order of magnitude is Rs. 6,000 crore without
financing cost. It is planned for commissioning
in Q1 FY14.
The Jharkhand Aluminium project: 359 ktpa,
Aluminium smelter along with a 900 MW captive
power plant is coming up in Sonahatu,
Jharkhand. The land acquisition process has
already begun. The process for obtaining
environmental clearance has begun. To that
effect, a presentation has been made to the
MOEF expert committee. The Tubed Coal Mine
has been allotted to the project jointly with Tata
Power.
This project seeks to replicate the Aditya /
Mahan smelter. The cost estimate in the order
of magnitude is Rs.10,000 crore without
financing cost. It is planned for commissioning
in Q1 FY14.
The blueprint for a suitable financing plan for
the projects is in place. These projects will
significantly enhance the scale of operations of
your company. These will further improve the
cost competitiveness of your Company and will
firmly establish it as one of the lowest cost global
alumina and aluminium producers.
To debottleneck and increase capacity,
primarily in South America and Asia,
Novelis has increased its capital expenditure
plan by approximately USD150 Million or
148 percent for fiscal 2011 compared to the
previous year. A significant amount is aimed at
expanding its rolling operations in Brazil.
This investment will increase capacity by over

MA
NAG
EM
EN
T D
ISC
USSIO
N A
ND
A
NA
LYSIS
MANAGEMENT D ISCUSSION AND ANALYSIS
[14]
Supe r Power i n Premium Me ta l s
50 percent and better support the increasing
demand for flat rolled products in the Regions.
The expansion is expected to be completed by
late 2012.
Copper Business Review
Industry Review
Global refined copper consumption declined
second year on the trot in CY 2009. In last 2
years, the decline has been from 18 Mn tonnes
(CY 2007) to 16.7 Mn tonnes (CY 2009). The
decline in CY 09 though was much lower than
earlier anticipated. The production however,
continued to remain reasonably strong declining
to only 18 Mn tonnes resulting into a surplus.
However, China continued to import large
quantities of copper through SRB purchases. In
the last quarter of CY 09 and the first quarter
of CY10, copper demand witnessed a sharp
recovery. Globally refined copper consumption
increased 13% in Q4 FY10 over the same
period last year, albeit on a low base. Projections
suggest that world copper market is likely to
remain in surplus in 2010, although at a much
smaller surplus than in the previous year. The
copper price on LME has generally been firm,
though it witnessed some decline in the last few
days due to increased risk aversion.
FY10 was perhaps one of the most challenging
years for Copper smelters worldwide. The
business witnessed extreme price volatility in the
aftermath of the economic meltdown,
compounded by acute tightness in the
concentrate market and unviable spot TcRc
levels. While the benchmark TcRc was a healthy
75/7.5, the spot TcRc’s plummeted from a high
of 90/9 in Jan, 09 to near zero by Q3,09 and
remained well below the cash costs of smelters
for most part of the year. The situation got further
aggravated by precipitous fall in sulphuric acid
prices from a peak of $350/t in 2008 to -
$25/t fob in FH- 2009 and sharp drop in
fertilizer subsidies.
Company Performance:
The Copper business performed well despite
adverse macroeconomic environment.
Your company recorded creditable production
performance notwithstanding bi-annual
shutdowns. Your Company also managed its
market mix well to improve overall copper
realizations despite lower volumes.
Globally many Smelters were forced to cut back
their output on account of Sulphuric acid
evacuation problems. Global smelter capacity
FY10FY09 FY10FY09
Cathod (kt) DAP (kt)
298
333
170
182
0
10
20
30
40
50
Q1 10Q3 09
Q1 09Q3 08
Q1 08Q3 07
Q1 07Q3 06
Q1 06Q3 05
Q1 05
Spot TcRc (c/Lb)
3800
4000
4200
4400
4600
4800
5000
World Prodn
10 Q1
09 Q4
09 Q3
09 Q2
09 Q1
08 Q4
08 Q3
08 Q2
08 Q1
07 Q4
07 Q3
07 Q2
07 Q1
World Cons
2000
3000
4000
5000
6000
7000
8000
9000
LME cash $/tonne
Mn T

MA
NAG
EM
EN
T D
ISC
USSIO
N A
ND
A
NA
LYSIS
MANAGEMENT D ISCUSSION AND ANALYSIS
[15]
Supe r Power i n Premium Me ta l s
utilization, as a result, dropped by 7-8% during
the year, whereas our capacity utilization
increased by 9% during the same period.
Your Company proactively seized a larger share
of the shrinking pie of sulphuric acid demand
through innovative supply chain interventions &
aggressive pricing, thus not letting our Smelters
suffer on this count.
During the year significant improvements were
achieved in operating performance. Your
Company delivered highest ever production of
cathode-improvement of 12% over the previous
year. DAP volumes too were 7% higher than the
pervious year.
The high point of operational performance was
dramatic reduction in cost of production
through improvement in operational efficiencies
and innovative optimization of input energy cost
through use of alternative fuels (LNG and
Petcoke).
In FY10, your Company delivered 30% reduction
in cost of production over the previous year.
Today Dahej ranks in top quartile of the Global
cost competitiveness.
Financial
The sharp rise in LME coupled with higher sales
volumes led to higher revenues, which were up
by 18%. However, for custom smelters like your
company, copper prices are just a pass through
and the margins are largely determined by
Tc/Rc and as a result a decline in LME copper
prices did not have significant impact on the
profitability.
The favourable impact of higher contracted
Tc/Rc was largely negated by lower
product contribution. However, operational
improvements, better working capital
management led to delivery of robust
performance and improvement in cash flows.
Copper Outlook:
The global refined copper demand is expected
to increase by around 5.5% in CY2010.
Marginal recovery in western world consumption,
with strong demand from emerging economies
Smelting
500,000 tpa
Copper Cathodes
500,000 tpa
Continuous Cast Copper Rods
142,200 tpa
Sulphuric Acid
16,70,000 tpa
Phosphoric Acid
180,000 tpa
DAP & Complexes
400,000 tpa
Gold
15 tpa
Silver
150 tpa
Mines (Australia)
Nifty
Mount Gordon
OU
R
CA
PA
CI
TY
Largest Custom Copper Largest Custom Copper
Smelter at a Single Location Smelter at a Single Location

MA
NAG
EM
EN
T D
ISC
USSIO
N A
ND
A
NA
LYSIS
MANAGEMENT D ISCUSSION AND ANALYSIS
[16]
Supe r Power i n Premium Me ta l s
notably Asia and South America will keep overall
demand buoyant. The US is showing early signs
of recovery, while Europe after early promises is
depicting some edginess.
The surplus will continue over short term,
however with constrained supply from mines
the extent of surplus shall be lower than previous
year. China will be a large determinant for
the market as has been the case in the
recent past.
The long term Tc Rc contracts for the year were
significantly lower than CY2009 due to
constrained mine supply and strong demand
for refined copper.
The Spot Tc Rcs declined to historical lows driven
by tight concentrate availability on account of
delays in the expected new mine capacities,
rising project costs and associated risk / socio-
political factors. Higher capital costs, declining
ore grades and labour related issues in some
of the major copper producing countries are
expected to restrict the availability of concentrate
and put further pressure on spot Tc Rcs.
Indian refined copper consumption is expected to
increase sharply after a brief pause last year. The
annual consumption growth is expected to be
around 9% with strong growth in power,
automobile and manufacturing sector. The long
term fundamentals are strong and the copper
consumption is expected to increase with
renewed thrust on power sector reforms and
urban housing.
The copper consumption in India is relatively
low. The per capita copper consumption stands
at around a Kg as compared to 7Kgs in the US
or even 3.6 Kgs in China and hence the growth
potential is enormous.
Business Outlook
Your Company has continued to perform
creditably in the challenging times. It continues
to make steady progress on the planned growth
track. Your Company will continue to strive to
improve operating efficiencies and reduce
conversion costs. Your Company’s production
flexibility with respect to various value added
byproducts will increase the available options
for profit and cash flow improvements.
Financial Review and Analysis:
Share of Net Sales Value
Net Sales and Operating Revenues
Standalone Net Sales and Operating Revenues
for the year 2009-10 increased by 7 % YOY to
Rs. 19,536 Crore due to higher volumes and
also on the back of higher copper LME, while
aluminium LME declined.
Consolidated revenues decreased from
Rs. 65,963 crore to Rs. 60,722 crore, a drop
of 8%, primarily on account of weaker
Aluminium LME and lower Novelis shipment
volume.
Other Income
Standalone other Income at Rs. 260 Crore was
sharply lower as compared to Rs. 637 Crore in
the previous year largely due to lower treasury
corpus post repayment of bridge loan in
November 08 for Novelis acquisition and higher
project spending. The yield was also lower due
SAP, DAP and Complexes, Precious Metals
and Others11%
Hydrate and Alumina
3% Aluminium Ingots and Billets
10%
Rolled Products12%
Extrusions3%
Copper64%
Aluminium36%
Copper Cathodes
29%
Concast Copper Rods24%
Conductor and Redraw Rods
5%Aluminium Foils,
Wheels and Others 3%

MA
NAG
EM
EN
T D
ISC
USSIO
N A
ND
A
NA
LYSIS
MANAGEMENT D ISCUSSION AND ANALYSIS
[17]
Supe r Power i n Premium Me ta l s
to lower interest rates on the short end of yield
curve, which was largely due to higher liquidity
in the economy.
Interest
Your Company’s working capital requirement
increased on account of higher copper
prices due to higher LME. Softening interest
rates resulted in lower average cost of
borrowing which also affected yields on the
company’s investments which are mostly in
liquid plans. It also reduced the cost of
working capital borrowing. As a result the
interest and financing charges have reduced
from Rs. 337 crore in FY09 to Rs. 278 crore in
FY10.
Depreciation
Depreciation charges were at Rs. 667 crore in
FY10 against Rs. 645 crore in FY09.
Taxes
The provision for tax was lower due to lower
PBT and higher capitalization.
Profit
In the Aluminium business, lower Rupee LME
eroded around Rs.750 crore. Additionally
Rs.100 crore was lost on account of the higher
coal cost at Renusagar. Copper business which
benefited by higher contracted TcRc lost Rs. 750
crore on lower by-product credit in terms of
Sulphuric acid realisation and lower fertiliser
subsidy. On this back drop Net Profit declined
by 14% to Rs.1,916 Crore.
Due to early adoption of Accounting Standard
(AS) 30 on Financial Instrument : Recognition
and Measurement, the figures of the current
period are not comparable with the previous
year.
Consolidated Profit stood at Rs. 3,925 Crore
as compared to Rs. 484 Crore in the previous
year.
Consolidated result include Pre-tax adjustments
for unrealised derivatives gain / (loss) of
Rs. 2,736 Crore in FY10.
Cashflow Analysis:
Rs. in Crore
Particulars FY09 FY10 %
SOURCE OF CASH
Cash from operations 3,171 1,717 36%
Non-operating income 691 322 7%
Equity Raised 4,426 2,750 57%
Divestments of
investments (Net) 5,507
Total 13,795 4,789 100%
APPLICATION OF CASH
Net capital expenditure 967 2,619 48%
Investment in subsidiaries 11,004 276 5%
Other investments (Net) — 1,501 27%
Net debt Outflows 193 186 3%
Interest & Finance
Charges 669 641 12%
Dividend payout 266 269 5%
Total 13,099 5,492 100%
Increase / (Decrease) 696 (703)
in Cash and Cash
Equivalents
Sources of Cash
Cash from operations
Lower realisations for Aluminium and Lower TcRc
affected cash profits and this coupled with
increase in working capital due to higher Copper
LME towards end of fiscal resulted in lower cash
flow from operations compared to last year.
Non-operating Income
Cash from non-operating income decreased to
Rs. 322 crore as compared to Rs. 691 crore in
last year. The decrease is on account of lower
dividend and other income on investments.
Average investments were lower due to
liquidation of treasury investments in last year
for take-out of the bridge loan taken for Novelis
acquisition and for capital expenditures.
MA
NAG
EM
EN
T D
ISC
USSIO
N A
ND
A
NA
LYSIS
MANAGEMENT D ISCUSSION AND ANALYSIS
[18]
Supe r Power i n Premium Me ta l s
Equity
Your Company raised Rs.2,750 crore (net of
issue expenses) from issue of equity to qualified
institutional investors to finance capital expenditure.
Application of Cash
Capital Expenditure
Your Company spent Rs. 2,619 crore on various
expansion and efficiency improvement projects.
Going forward, this amount is slated to rise
considerably as per planned investments in
Brownfield and Greenfield projects.
Investment in Subsidiaries (Net)
Aggregate Investments (net), including Loans &
Advances to Subsidiaries, amounted to Rs. 276
crore.
Other Investments (Net)
Increase of Rs.1501 Crore in other investments
(net) is mainly in short term treasury investments.
Treasury investments rose on account of issue
of equity to qualified institutional investors.
Interest
Interest & Finance charges paid for the year
was Rs.641 Crore, almost same as in last year.
Interest charged to profit and loss account is
only Rs.278 crore on account of interest
capitalized.
Dividend
Dividend paid including tax on dividend is
Rs.269 Crore.
• We have put in place a strong capital
structure to support our strategic business
plan. We successfully managed to raise USD
600 Mn through a Qualified Institutional
Placement issuance; one of the largest QIP’s
to hit the market in 2009. The price
achieved was strong too, representing a
discount of just 1.6% on the previous day’s
closing share price. There was a very strong
participation from long only investors and
the stock traded up post the issuance. We
managed to preserve our balance sheet
strength to grow by reducing our leverage
while doing so. With this we have largely
tied up equity contribution for our green
field expansion plans.
RISK MANAGEMENT
In addition to the risk and currency fluctuation
inherent in its operations, your company has
got significant exposure to commodity prices.
Hindalco’s financial performance is significantly
impacted by fluctuations in the prices of
Aluminium Alumina exchange rates and interest
rates. The Company takes a very structured
approach to the identification and quantification
of each such risk and has a comprehensive risk
management policy.
Clearly defined policies and management
controls govern all risk management activities.
Transactions in financial instruments for which
there is no underlying exposure to the company
are prohibited. All of the commodity, interest
rate and foreign currency contracts are used to
mitigate uncertainty and volatility and to cover
underlying exposures.
Commodity Price Risk
Company’s commodity hedging activities can
be divided into following:
• Timing mismatch risk: This is the price risk
arising due to timing mismatch of purchases
of copper concentrate, which is priced based
on copper, gold and silver content and sale
of copper products, gold and silver. We use
various spread risk management tools to
hedge this risk.
• Absolute price risk: We have price risk on
aluminium that we produce. We use various
derivative tools for hedging this risk from
time to time.
Foreign Currency Exchange Risk
Exchange rate movements, particularly between
the Indian Rupee (INR) and United States Dollars
(USD) have an impact on Hindalco’s cost and
revenues. Since the company is long in USD

MA
NAG
EM
EN
T D
ISC
USSIO
N A
ND
A
NA
LYSIS
MANAGEMENT D ISCUSSION AND ANALYSIS
[19]
Supe r Power i n Premium Me ta l s
(inflow greater than outflow), the company will
benefit from weakening of the INR against USD
and conversely, is disadvantaged if the rupee
appreciates. In order to hedge this risk, your
Company uses various tools such as foreign
currency borrowings, currency forward and
option contracts.
Interest Rate Risk
Your Company uses interest rate swaps to help
maintain a strategic balance between fixed and
floating-rate debts and to manage overall
financing costs. Most of the long term loans
are at fixed rate currently.
Project Execution Risk
Your Company is in the process of setting up
4 greenfield projects in difficult terrain. The
project execution is contingent upon several
external factors including but not limited to
land acquisition, project management skills,
timely delivery of equipments etc. Any delay in
these activities could result in change in
implementation schedule and affect the
financial performance of the Company. Your
Company is continuously monitoring the
progress to ensure that the implementation
schedules are adhered.
Internal Control
A strong internal control culture is pervasive
throughout our Group. Regular internal audits
at all our locations are undertaken to ensure
that the highest standards of internal control
are maintained. The effectiveness of a business’
internal control environment is a component of
senior management performance appraisals.
The principal aim of the system of internal control
Integrity
Commitment
Passion
Seamlessness
SpeedOU
R
VA
LU
ES
Diverse Skills driven by Diverse Skills driven by
Team-Centric People PowerTeam-Centric People Power
EMPOWERED PEOPLE EMPOWERED MINDS
At the heart of Hindalco’s precess and products, behind its growth and success lies the story of
Team Hindalco. A multi-lingual, multi-cultural cross section of people bound by the same values
and pursuing a common mission to create superior value for all stakeholders.
MA
NAG
EM
EN
T D
ISC
USSIO
N A
ND
A
NA
LYSIS
MANAGEMENT D ISCUSSION AND ANALYSIS
[20]
Supe r Power i n Premium Me ta l s
is the management of business risks, with a view
to enhancing shareholders’ value and
safeguarding the Group’s assets. It provides a
reasonable assurance on the internal control
environment and assurance against material
misstatement or loss.
The Group operates a comprehensive annual
planning, financial reporting and forecasting
process. The Board formally approves a strategic
plan and the annual budget. The Group’s
performance is monitored against the budget
on a monthly and quarterly basis by the Executive
Committee; significant variances are reviewed.
The audit observations are reported and
discussed by the senior management and the
important ones are also presented to the Audit
Committee of the Board. The audit observations
are discussed and the appropriate feedback is
conveyed to the relevant managers.
Arising from the announcement of the Institute
of Chartered Accountants of India dated 29th
March, 2008 on Accounting for Derivatives, the
Company has decided for early adoption of
Accounting Standard (AS) 30 on Financial
Instruments : Recognition and Measurement, in
so far as it relates to derivative accounting,
from 1st
April, 2009. In order to get reliable fair
valuation and do accounting of different types
of derivative transactions which the Company
enters into to mitigate certain financial risks, we
have used one third party software of
international repute. Besides its usefulness in
the area of derivative accounting, this software
also has the capability to effectively take care
of various tenets of hedge accounting. The
resultant impact of early adoption of the AS
and various disclosure requirements associated
with derivative accounting have been dealt with
elaborately in Notes on Accounts section of
separate financial statements of the Company.
Material developments in human resources/
industrial relations front, including number
of people employed
In 2007, our Group was adjudged as the best
employer in India by Hewitt. Our culture and
reputation as a business leader in the industry
enables us to recruit and retain the best available
talent in India.
Human capital
Our professionals are our most important assets.
We are committed to remaining among the
industry’s leading employers. We have a pool
of around 19,500 employees in our fold. The
group has a well laid talent development plan
that ensures attracting the talent and provides
for nurturing and enhancement of talent.
Training and Development
Our training, continuing education and career
development programs are designed to ensure
that our professionals enhance their business
skills. Our Group initiatives and our learning
campus provide continuous learning
opportunities. Our inhouse faculty conducts
integrated training for our new employees.
Leadership development is a core part of our
training program.
Conclusion
To sum up the achievements in the financial
year, your Company recorded a commendable
performance in a volatile year fraught with huge
uncertainty in the financial and commodity
markets. This performance is testimony to the
sound business models of our Aluminium and
Copper businesses, the underlying strength of
business operations and project management
capabilities, stable and capable processes, and
successful implementation of a well thought out
strategic plan for quantum growth supported by
a strong balance sheet and robust cash flows
from existing operations. The year also witnessed
a dramatic turnaround at Novelis and ABML
two contrasting businesses operating in two
entirely different geographies amidst different
challenges.
With our business portfolio proving its mettle,
we now have focused on timely execution of
Greenfield projects that would further enhance
our cost competitiveness and catapult us to a
position of further strength.

MA
NAG
EM
EN
T D
ISC
USSIO
N A
ND
A
NA
LYSIS
MANAGEMENT D ISCUSSION AND ANALYSIS
[21]
Supe r Power i n Premium Me ta l s
CAUTIONARY STATEMENT
Statements in this “Management’s Discussion and Analysis” describing the Company’s objectives, projections, estimates,
expectations or predictions may be “forward looking statements” within the meaning of applicable securities laws and
regulations. Actual results could differ materially from those expressed or implied. Important factors that could make a
difference to the Company’s operations include global and Indian demand supply conditions, finished goods prices,
feedstock availability and prices, cyclical demand and pricing in the Company’s principal markets, changes in the
Government regulations, tax regimes, economic developments within India and the countries within which the Company
conducts business and other factors such as litigation and labour negotiations. The Company assumes no responsibility
to publicly amend, modify or revise any forward looking statements, on the basis of any subsequent development,
information or events or otherwise.
Global economy is expected to revive slowly
and overall growth could remain subdued. The
upstream aluminium industry will continue to
face pricing pressure on account of large
inventories and uncertain demand growth, while
copper business will continue to face challenges
on account of poor concentrate availability and
low TcRcs.
FY 11 will be a landmark year:
• We have strengthened our balance sheet
and have reduced our leverage. This would
allow us to progress smoothly on the
Greenfield projects through a calibrated
approach.
• The brownfield expansions at Muri and
Hirakud have been commissioned and will
deliver the targeted cash flows to help
finance our growth aspirations.
• We working on five greenfield sites in difficult
terrain and have put in place the necessary
organization to keep these projects on track.
The key focus will be to:
• Maintain profitability in the uncertain macro-
economic environment.
• Maximise Free Cash Flow from existing
operations.
• Leverage economies of scale and cutting
edge technology in greenfield upstream
projects and high-end downstream
products.
• Your Company is progressing well to realise
its aggressive growth plans.
These plans will enable your Company to grow
in a steady and robust manner and continue to
outperform the peers. Several cost reduction
measures across the businesses and your
company’s inherent strengths will help us to
sharpen its focus further and become even more
competitive in the near future.
Mumbai
Dated the 4th Day of June, 2010.

[22]
CORPORATE GOVERNANCE REPORTC
ORPO
RATE G
OVERN
AN
CE REPO
RT
Supe r Power i n Premium Me ta l s
GOVERNANCE PHILOSOPHY
The Aditya Birla Group is committed to the
adoption of best governance practices and its
adherence in the true spirit, at all times. Our
governance practices are a product of self-desire
reflecting the culture of the trusteeship i.e. deeply
ingrained in our value system and reflected in
our strategic thought process. At a macro level,
our governance philosophy rests on five basic
tenets viz., Board accountability to the Company
and shareholders, strategic guidance and
effective monitoring by the Board, protection of
minority interests and rights, equitable treatment
of all shareholders as well as superior
transparency and timely disclosure.
In line with this philosophy Hindalco Industries
Ltd. continuously strives for excellence through
adoption of best governance & disclosure practices.
Compliance with Corporate Governance
Guidelines
The Company is fully compliant with the
requirements of the prevailing and applicable
Corporate Governance Code. Your Company’s
compliance with requirements is presented in
the subsequent sections of this Report.
BOARD OF DIRECTORS
Composition of the Board
Your Company’s Board comprises of 9 Non-
executive Directors with considerable experience
in their respective fields. Of these, 6 Directors
are independent Directors. Clause 49 of the
Listing Agreement as amended in April 2008,
requires that if the Non-executive Chairman of
the Company is the promoter then at least half
of the Board of Directors of such Company
should consist of independent Directors and we
are in compliance with the above requirement
of Clause 49 of the Listing Agreement.
None of the Directors is a Director in more
than 15 Companies and Member of more than
10 Committee or a Chairman of more than 5
Committee (as specified in Clause 49), across
all the Company in which he/she is a Director.
All the Directors have intimated periodically
about their Directorship and Membership in the
various Board committees of other companies,
which are within permissible limits of the
Companies Act, 1956 and Corporate
Governance Code.
The details of the attendance of each Director
at the Board Meetings & Annual General
Meeting held during the year and directorships,
Membership/Chairmanship in Board
Committees of other Companies are as
follows:
Director Category No. of Attendance No of other No. of other
Board at last Directorships Companies’ committee
Meetings AGM Held3
Positions Held4
attended
Public Private Member Chairman
Mr. Kumar Mangalam Birla Non Executive 5 Yes 9 13 — —
Mrs. Rajashree Birla Non Executive 4 Yes 6 12 1 —
Mr. A. K. Agarwala Non Executive2
6 Yes 5 — — —
Mr. E. B. Desai Independent 6 Yes 8 2 2 4
Mr. S. S. Kothari Independent — No — 1 — —
Mr. C. M. Maniar Independent 5 Yes 14 4 6 1
Mr. M. M. Bhagat Independent 5 Yes 4 1 1 1
Mr. K. N. Bhandari Independent 6 Yes 9 — 2 1
Mr. N. J. Jhaveri Independent 4 Yes 11 2 3 4
Mr. D. Bhattacharya Managing Director 6 Yes 8 1 — 1
1. Independent Director means a director defined as such under Clause 49 of the Listing Agreement.
2. Mr. A. K. Agarwala was an Executive Director till 10th
September 2003. Thereafter, he has moved to
other responsibilities in the Aditya Birla Group.
3. Excludes Directorship held in Foreign Companies and Companies incorporated under Section 25 of the
Companies Act, 1956.
4. Represents only membership/chairmanship of Audit Committee and Shareholders’ / Investors’ Grievance
Committee of Indian Public Limited Companies.
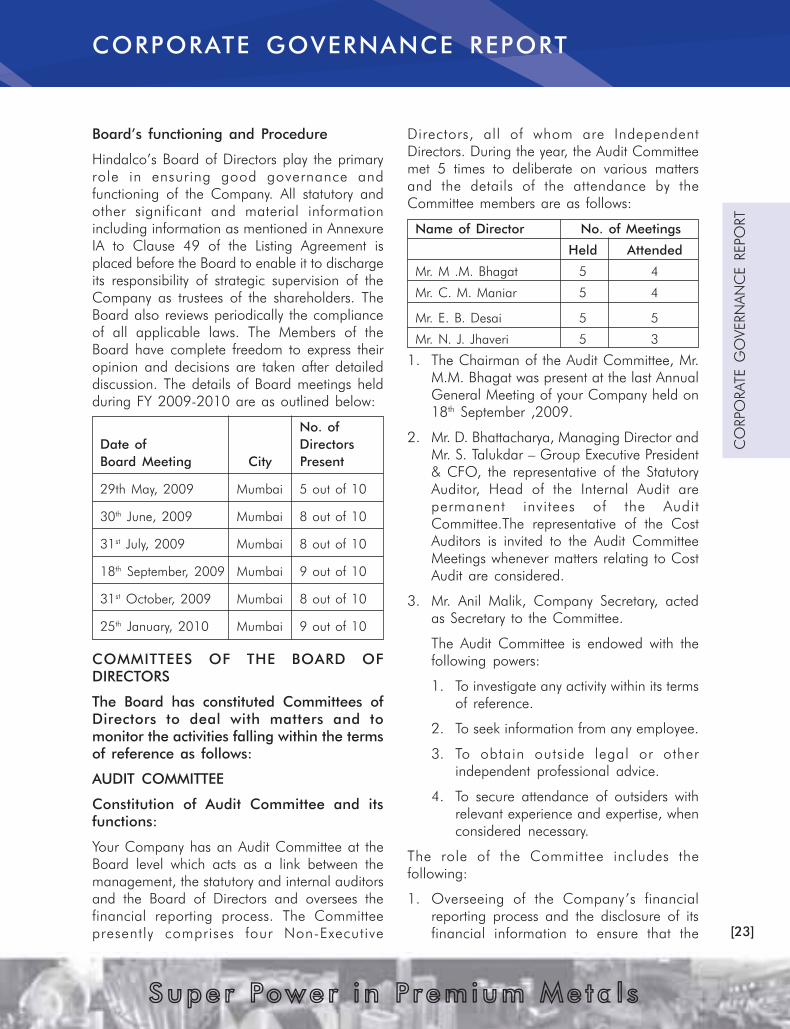
[23]
CORPORATE GOVERNANCE REPORT
CO
RPO
RATE G
OVERN
AN
CE REPO
RT
Supe r Power i n Premium Me ta l s
Board’s functioning and Procedure
Hindalco’s Board of Directors play the primary
role in ensuring good governance and
functioning of the Company. All statutory and
other significant and material information
including information as mentioned in Annexure
IA to Clause 49 of the Listing Agreement is
placed before the Board to enable it to discharge
its responsibility of strategic supervision of the
Company as trustees of the shareholders. The
Board also reviews periodically the compliance
of all applicable laws. The Members of the
Board have complete freedom to express their
opinion and decisions are taken after detailed
discussion. The details of Board meetings held
during FY 2009-2010 are as outlined below:
No. of
Date of Directors
Board Meeting City Present
29th May, 2009 Mumbai 5 out of 10
30th
June, 2009 Mumbai 8 out of 10
31st
July, 2009 Mumbai 8 out of 10
18th
September, 2009 Mumbai 9 out of 10
31st
October, 2009 Mumbai 8 out of 10
25th
January, 2010 Mumbai 9 out of 10
COMMITTEES OF THE BOARD OF
DIRECTORS
The Board has constituted Committees of
Directors to deal with matters and to
monitor the activities falling within the terms
of reference as follows:
AUDIT COMMITTEE
Constitution of Audit Committee and its
functions:
Your Company has an Audit Committee at the
Board level which acts as a link between the
management, the statutory and internal auditors
and the Board of Directors and oversees the
financial reporting process. The Committee
presently comprises four Non-Executive
Directors, all of whom are Independent
Directors. During the year, the Audit Committee
met 5 times to deliberate on various matters
and the details of the attendance by the
Committee members are as follows:
Name of Director No. of Meetings
Held Attended
Mr. M .M. Bhagat 5 4
Mr. C. M. Maniar 5 4
Mr. E. B. Desai 5 5
Mr. N. J. Jhaveri 5 3
1. The Chairman of the Audit Committee, Mr.
M.M. Bhagat was present at the last Annual
General Meeting of your Company held on
18th
September ,2009.
2. Mr. D. Bhattacharya, Managing Director and
Mr. S. Talukdar – Group Executive President
& CFO, the representative of the Statutory
Auditor, Head of the Internal Audit are
permanent invitees of the Audit
Committee.The representative of the Cost
Auditors is invited to the Audit Committee
Meetings whenever matters relating to Cost
Audit are considered.
3. Mr. Anil Malik, Company Secretary, acted
as Secretary to the Committee.
The Audit Committee is endowed with the
following powers:
1. To investigate any activity within its terms
of reference.
2. To seek information from any employee.
3. To obtain outside legal or other
independent professional advice.
4. To secure attendance of outsiders with
relevant experience and expertise, when
considered necessary.
The role of the Committee includes the
following:
1. Overseeing of the Company’s financial
reporting process and the disclosure of its
financial information to ensure that the

[24]
CORPORATE GOVERNANCE REPORTC
ORPO
RATE G
OVERN
AN
CE REPO
RT
Supe r Power i n Premium Me ta l s
financial statement is correct, sufficient and
credible;
2. Recommending to the Board, the
appointment, re-appointment and, if
required, the replacement or removal of the
statutory auditor and the fixation of audit
fees.
3. Approval of payment of fees for any other
services rendered by the statutory auditors.
4. Reviewing, with the management the annual
financial statements before submission to
the Board for approval, focussing primarily
on :
a. Matters required to be included in the
Director’s Responsibility Statement to be
included in the Board’s report in terms
of Clause (2AA) of Section 217 of the
Companies Act, 1956.
b. Changes, if any, in accounting policies
and practices and reasons for the same.
c. Major accounting entries involving
estimates based on the exercise of
judgment by management.
d. Significant adjustments made in the
financial statements arising out of audit
findings.
e. Compliance with listing and other legal
requirements relating to financial
statements.
f. Disclosure of any Related party
transactions.
g. Qualifications in draft audit report.
5. Reviewing, with the management, the
quarterly financial results before submission
to the board for approval.
6. Reviewing, with the management,
performance of statutory and internal
auditors, adequacy of the internal control
systems.
7. Reviewing the adequacy of internal audit
function, if any, including the structure of
the internal audit department, staffing and
seniority of the official heading the
department, reporting structure coverage
and frequency of internal audit.
8. Discussion with internal auditors any
significant findings and follow up there on.
9. Reviewing the findings of any internal
investigations by the internal auditors into
matters where there is suspected fraud or
irregularity or a failure of internal control
systems of a material nature and reporting
the matter to the Board.
10. Discussion with statutory auditors before the
audit commences, about the nature and
scope of audit as well as post-audit
discussion to ascertain any area of concern.
11. Looking into the reasons for substantial
defaults in payment to the depositors,
debenture holders, shareholders (in case of
non payment of declared dividends) and
creditor, if any;.
12. Reviewing the following information :
• Management discussion and analysis of
financial condition and results of
operations;
• Statement of significant related party
transactions (as defined by the audit
committee), submitted by management;
• Management letters / letters of internal
control weaknesses issued by the
statutory auditors;
• Internal audit reports relating to internal
control weaknesses;
• The appointment, removal and terms of
remuneration of the Chief internal
auditor;
• Risk Management Framework.
13. Reviewing any other areas which may be
specified as role of the Audit Committee
under the Listing Agreement, Companies Act
and other statutes, as amended from time
to time.

[25]
CORPORATE GOVERNANCE REPORT
CO
RPO
RATE G
OVERN
AN
CE REPO
RT
Supe r Power i n Premium Me ta l s
SHAREHOLDER’S GRIEVANCES COMMITTEE
The Company has an “Investor Grievance
Committee” at the Board level to deal with
various matters relating to redressal of
shareholders and investor grievances, such as
transfer and transmission of shares, issue of
duplicate shares, non-receipt of dividend/
notices/ Annual Reports, etc. In addition, the
Committee looks into other issues including
status of dematerialisation / rematerialisation
of shares and debentures, systems and
procedures followed to track investor complaints
and suggest measures for improvement from
time to time.
The composition of the Committee is as follows:
Mr. E. B Desai - Chairman
Mr. C. M Maniar - Member
During the year under review, the Committee
met thrice to deliberate on various matters
referred above. Details of attendance by
Directors for the Committee meetings are as
follows:
Name of Director No. of Meetings
Held Attended
Mr. E.B. Desai 3 3
Mr. C.M. Maniar 3 3
Mr. Anil Malik, Company Secretary, acts as
Secretary to the Committee.
The Company’s shares are compulsorily traded
and delivered in the dematerialised form in all
Stock Exchanges. To expedite the transfer in the
physical segment, necessary authority has been
delegated to certain officers, who are authorised
to transfer up to 10,000 shares under one
transfer deed.
Mr. Anil Malik, Company Secretary is
Compliance Officer of the Company.
Details of complaints received, disposed off and
pending during the year, number of shares
transferred during the year, time taken for
effecting these transfers and the number of share
transfers pending are furnished in the
“Shareholder Information” section of this Annual
Report.
Non Executive Directors’ compensation and
disclosure
All fees/compensation including sitting fee paid to
the non-executive directors of the Company are
fixed by Board of Directors within the limits
approved by the shareholders. Details of sitting
fee/compensation paid including stock options ,
if any, to them are given at the respective places
in the report.
Remuneration of Directors and others
Since the company has one Executive Director,
your Company does not have a Remuneration
Committee. The Board of Directors decides the
remuneration of the Managing Director.
The Company has a system where all the
directors or senior management of the Company
are required to disclose all pecuniary relationship
or transactions with the Company. No significant
material transactions have been made with the
Non- Executive Directors vis- a vis the Company
during the year.
Besides sitting fees @ Rs. 5000/- per meeting
of the Board or Committee thereof , the
Company also pays Commission to the Non-
Executive Directors.
For FY- 2009-10, the Board has approved
payment of Rs.14 Crores (Previous Year Rs.7.50
Crores) as Commission to the Non- Executive
Directors of the Company pursuant to the
authority given by the shareholders at the Annual
General Meeting held on 28th
July, 2006 to
pay Commission not exceeding 1% of the net
profits of the Company to the Non-Executive
directors of the Company. The Amount of
Commission payable is determined after
assigning weightage to attendance and the type
of meeting and other responsibilities.
Executive Director is paid remuneration within
the limits prescribed under Schedule XIII of the
Companies Act, 1956. The said remuneration
is approved by the Board as well as the
Shareholders of the Company.
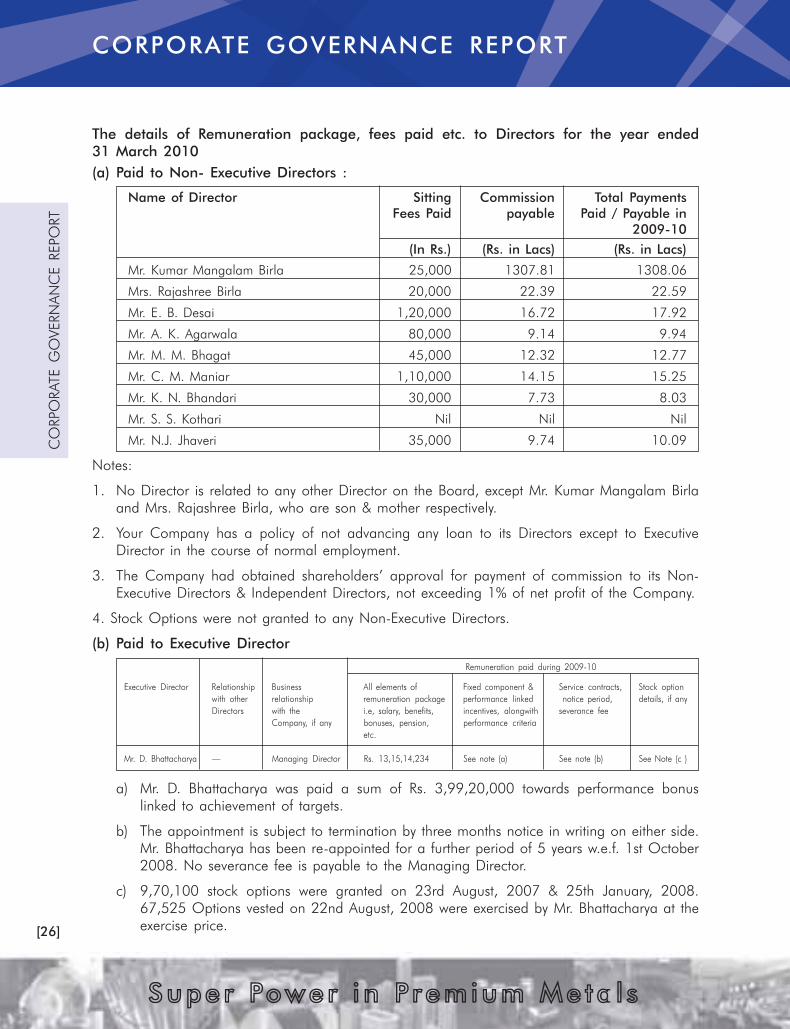
[26]
CORPORATE GOVERNANCE REPORTC
ORPO
RATE G
OVERN
AN
CE REPO
RT
Supe r Power i n Premium Me ta l s
The details of Remuneration package, fees paid etc. to Directors for the year ended
31 March 2010
(a) Paid to Non- Executive Directors :
Name of Director Sitting Commission Total Payments
Fees Paid payable Paid / Payable in
2009-10
(In Rs.) (Rs. in Lacs) (Rs. in Lacs)
Mr. Kumar Mangalam Birla 25,000 1307.81 1308.06
Mrs. Rajashree Birla 20,000 22.39 22.59
Mr. E. B. Desai 1,20,000 16.72 17.92
Mr. A. K. Agarwala 80,000 9.14 9.94
Mr. M. M. Bhagat 45,000 12.32 12.77
Mr. C. M. Maniar 1,10,000 14.15 15.25
Mr. K. N. Bhandari 30,000 7.73 8.03
Mr. S. S. Kothari Nil Nil Nil
Mr. N.J. Jhaveri 35,000 9.74 10.09
Notes:
1. No Director is related to any other Director on the Board, except Mr. Kumar Mangalam Birla
and Mrs. Rajashree Birla, who are son & mother respectively.
2. Your Company has a policy of not advancing any loan to its Directors except to Executive
Director in the course of normal employment.
3. The Company had obtained shareholders’ approval for payment of commission to its Non-
Executive Directors & Independent Directors, not exceeding 1% of net profit of the Company.
4. Stock Options were not granted to any Non-Executive Directors.
(b) Paid to Executive Director
Remuneration paid during 2009-10
Executive Director Relationship Business All elements of Fixed component & Service contracts, Stock option
with other relationship remuneration package performance linked notice period, details, if any
Directors with the i.e, salary, benefits, incentives, alongwith severance fee
Company, if any bonuses, pension, performance criteria
etc.
Mr. D. Bhattacharya — Managing Director Rs. 13,15,14,234 See note (a) See note (b) See Note (c )
a) Mr. D. Bhattacharya was paid a sum of Rs. 3,99,20,000 towards performance bonus
linked to achievement of targets.
b) The appointment is subject to termination by three months notice in writing on either side.
Mr. Bhattacharya has been re-appointed for a further period of 5 years w.e.f. 1st October
2008. No severance fee is payable to the Managing Director.
c) 9,70,100 stock options were granted on 23rd August, 2007 & 25th January, 2008.
67,525 Options vested on 22nd August, 2008 were exercised by Mr. Bhattacharya at the
exercise price.
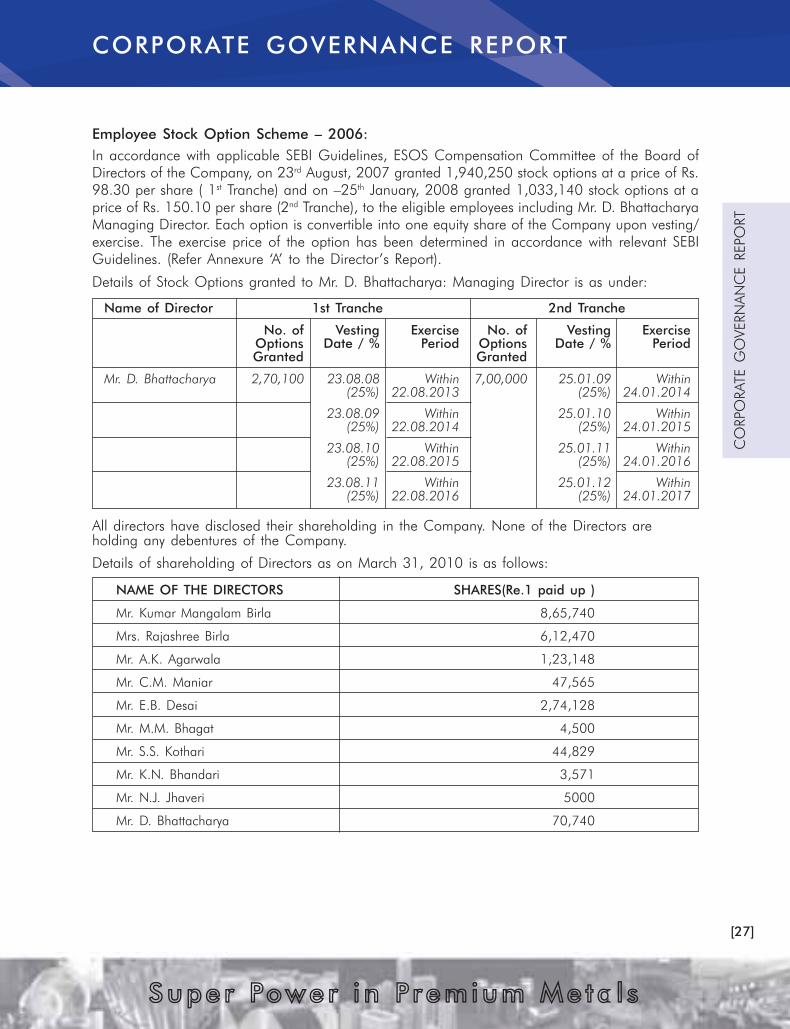
[27]
CORPORATE GOVERNANCE REPORT
CO
RPO
RATE G
OVERN
AN
CE REPO
RT
Supe r Power i n Premium Me ta l s
Employee Stock Option Scheme – 2006:
In accordance with applicable SEBI Guidelines, ESOS Compensation Committee of the Board of
Directors of the Company, on 23rd
August, 2007 granted 1,940,250 stock options at a price of Rs.
98.30 per share ( 1st
Tranche) and on –25th
January, 2008 granted 1,033,140 stock options at a
price of Rs. 150.10 per share (2nd
Tranche), to the eligible employees including Mr. D. Bhattacharya
Managing Director. Each option is convertible into one equity share of the Company upon vesting/
exercise. The exercise price of the option has been determined in accordance with relevant SEBI
Guidelines. (Refer Annexure ‘A’ to the Director’s Report).
Details of Stock Options granted to Mr. D. Bhattacharya: Managing Director is as under:
Name of Director 1st Tranche 2nd Tranche
No. of Vesting Exercise No. of Vesting Exercise
Options Date / % Period Options Date / % Period
Granted Granted
Mr. D. Bhattacharya 2,70,100 23.08.08 Within 7,00,000 25.01.09 Within
(25%) 22.08.2013 (25%) 24.01.2014
23.08.09 Within 25.01.10 Within
(25%) 22.08.2014 (25%) 24.01.2015
23.08.10 Within 25.01.11 Within
(25%) 22.08.2015 (25%) 24.01.2016
23.08.11 Within 25.01.12 Within
(25%) 22.08.2016 (25%) 24.01.2017
All directors have disclosed their shareholding in the Company. None of the Directors are
holding any debentures of the Company.
Details of shareholding of Directors as on March 31, 2010 is as follows:
NAME OF THE DIRECTORS SHARES(Re.1 paid up )
Mr. Kumar Mangalam Birla 8,65,740
Mrs. Rajashree Birla 6,12,470
Mr. A.K. Agarwala 1,23,148
Mr. C.M. Maniar 47,565
Mr. E.B. Desai 2,74,128
Mr. M.M. Bhagat 4,500
Mr. S.S. Kothari 44,829
Mr. K.N. Bhandari 3,571
Mr. N.J. Jhaveri 5000
Mr. D. Bhattacharya 70,740

[28]
CORPORATE GOVERNANCE REPORTC
ORPO
RATE G
OVERN
AN
CE REPO
RT
Supe r Power i n Premium Me ta l s
Code of Conduct
Hindalco’s Code of Conduct, as adopted by
the Board of Directors, is applicable to all
Directors, Senior management and employees
of the Company. The Code is available on the
Company’s website.
For the year under review, all Directors, Senior
management personnel of the Company have
confirmed their adherence to the provisions of
the said Code.
Declaration as required under Clause 49 of the
Listing Agreement
We hereby confirm that:
All Directors, Senior Management and
Employees of the Company have affirmed
compliance with the Code of Conduct for the
financial year ended 31st
March, 2010.
Place: Mumbai D. Bhattacharya
Date : 4th June, 2010 Managing Director
CODE OF CONDUCT FOR PREVENTION OF
INSIDER TRADING
As part of Aditya Birla Group, the Company
has a strong legacy of fair, transparent and
ethical governance practices. The Company has
a Code of Conduct for Prevention of Insider
Trading in the Shares and securities of the
Company for its Directors and designated
employees. This Code of Conduct was amended
in line with the amended Securities and
Exchange Board of India (SEBI) Regulations in
this regard.
SUBSIDIARY COMPANIES
Your Company does not have any material non-
listed Indian Subsidiary Company. The Audit
Committee reviews once in a year the financial
statements and investments made by unlisted
subsidiary companies. The minutes of the Board
meeting as well as statements of all significant
transactions of the unlisted subsidiary companies
are placed before the Board Meeting for their
review.
DISCLOSURES
(A) Basis of related party transaction
All the related party transactions are strictly
done on arm’s length basis. The Company
places all the relevant details before the
Audit Committee from time to time. Attention
of the Members is drawn to the disclosures
of transactions with the related parties set
out in Notes of Accounts forming part of
the Annual Report.
(B) Non-compliance /Strictures/penalties/
imposed
No non-compliance / strictures / penalties
have been imposed on the Company by
stock exchange(s) or the SEBI or any statutory
authority on any matters related to capital
markets during the last three years.
(C) Disclosure of Accounting Treatment
Your Company has followed all relevant
Accounting Standards while preparing the
Financial Statements . The Company had
formulated a Scheme of Financial
restructuring under Section 391 to 394 of
Companies Act, 1956 (“the Scheme”)
between the Company and its Equity
shareholders approved by the High Court
of Judicature of Bombay to deal with various
costs associated with its organic and
inorganic growth plan. Pursuant to this, a
separate reserve account titled as Business
Reconstruction Reserve (“BRR”) has been
created during the previous year by
transferring balance standing to the credit
of Securities Premium Account of the
Company for adjustment of certain expenses
as prescribed in the Scheme. Accordingly
Rs. 8647.37 crores has been transferred to
BRR during the previous year and Interest
and Finance charges amounting to
Rs. 304.39 crores on loan taken by
A.V Minerals (Netherlands) B.V Subsidiary
of the Company has been adjusted this year
against consolidated financial as per the
aforesaid Scheme.
(D) Risk Management
Risk evaluation and management is an
ongoing process within the Organisation.
Your Company has comprehensive risk
management policy and it is periodically

[29]
CORPORATE GOVERNANCE REPORT
CO
RPO
RATE G
OVERN
AN
CE REPO
RT
Supe r Power i n Premium Me ta l s
reviewed by the Board of Directors. During
the period under review, a detailed exercise
on Risk Management was carried out
covering the entire gamut of operation of
the Company.
(E) Proceeds from public issues, right issues,
preferential issues etc
The Company discloses to the Audit
Committee, the uses/applications of
proceeds/funds raised from rights issue, QIP
etc., as part of quarterly review of financial
results.
F) Management
Management Discussion and Analysis Report
is prepared in accordance with the
requirements laid out in Clause 49 of the
Listing Agreement and forms part of this
Annual Report.
No material transaction has been entered
into by the Company with the Promoters,
Directors or the Management, their
subsidiaries or relatives, etc., that may have
a potential conflict with interests of the
Company.
(G) Shareholders
The Company has provided the details of
Directors seeking re-appointment in the
Annual General Meeting notice attached
with the Annual Report.
Quarterly Presentations on the Company
results are available on the website of the
Company (www.hindalco.com) and the
Aditya Birla Group website
(www.adityabirla.com).
CEO/CFO CERTIFICATION
The Managing Director and the CFO have
certified to the Board that :
(a) They have reviewed financial statements and
the cash flow statement for the year and
that to the best of their knowledge and
belief:
(i) these statements do not contain any
materially untrue statement or omit any
material fact or contain statements that
might be misleading;
(ii) these statements together present a true
and fair view of the company’s affairs
and are in compliance with existing
accounting standards, applicable laws
and regulations.
(b) There are, to the best of their knowledge
and belief, no transactions entered into by
the company during the year which are
fraudulent, illegal or violative of the
company’s code of conduct.
(c) They accept responsibility for establishing
and maintaining internal controls and that
they have evaluated the effectiveness of the
internal control systems of the company and
they have disclosed to the auditors and the
Audit Committee, deficiencies in the design
or operation of internal controls, if any, of
which they are aware and the steps they
have taken or propose to take to rectify
these deficiencies.
(d) They have indicated to the Auditors and the
Audit committee
(i) significant changes in internal control
during the year;
(ii) significant changes in accounting
policies during the year and that the
same have been disclosed in the notes
to the financial statements; and
(iii) instances of significant fraud of which
they have become aware and the
involvement therein, if any, of the
management or an employee having a
significant role in the company’s internal
control system.
REPORT OF CORPORATE GOVERNANCE
A separate section on Corporate Governance
forms part of the Annual Report. Certificate from
the Statutory Auditors confirming compliance
with all the conditions of Corporate Governance
as stipulated in Clause 49 of the Listing
agreement of the Stock Exchanges in India forms
part of this report.
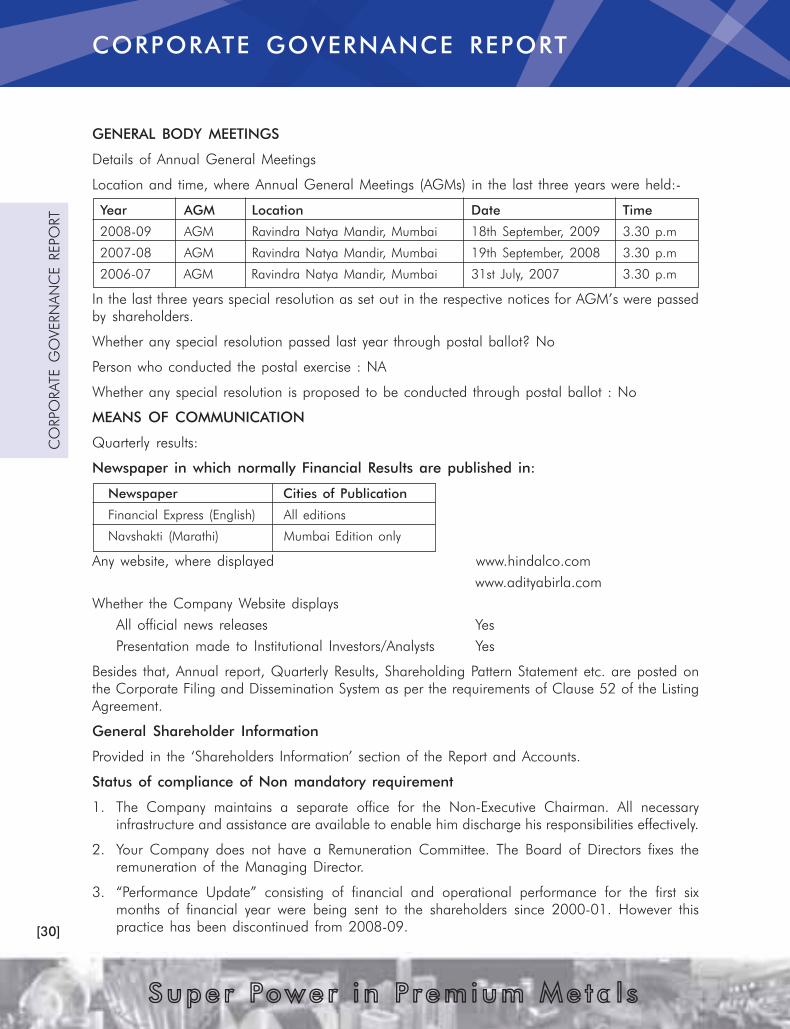
[30]
CORPORATE GOVERNANCE REPORTC
ORPO
RATE G
OVERN
AN
CE REPO
RT
Supe r Power i n Premium Me ta l s
GENERAL BODY MEETINGS
Details of Annual General Meetings
Location and time, where Annual General Meetings (AGMs) in the last three years were held:-
Year AGM Location Date Time
2008-09 AGM Ravindra Natya Mandir, Mumbai 18th September, 2009 3.30 p.m
2007-08 AGM Ravindra Natya Mandir, Mumbai 19th September, 2008 3.30 p.m
2006-07 AGM Ravindra Natya Mandir, Mumbai 31st July, 2007 3.30 p.m
In the last three years special resolution as set out in the respective notices for AGM’s were passed
by shareholders.
Whether any special resolution passed last year through postal ballot? No
Person who conducted the postal exercise : NA
Whether any special resolution is proposed to be conducted through postal ballot : No
MEANS OF COMMUNICATION
Quarterly results:
Newspaper in which normally Financial Results are published in:
Newspaper Cities of Publication
Financial Express (English) All editions
Navshakti (Marathi) Mumbai Edition only
Any website, where displayed www.hindalco.com
www.adityabirla.com
Whether the Company Website displays
All official news releases Yes
Presentation made to Institutional Investors/Analysts Yes
Besides that, Annual report, Quarterly Results, Shareholding Pattern Statement etc. are posted on
the Corporate Filing and Dissemination System as per the requirements of Clause 52 of the Listing
Agreement.
General Shareholder Information
Provided in the ‘Shareholders Information’ section of the Report and Accounts.
Status of compliance of Non mandatory requirement
1. The Company maintains a separate office for the Non-Executive Chairman. All necessary
infrastructure and assistance are available to enable him discharge his responsibilities effectively.
2. Your Company does not have a Remuneration Committee. The Board of Directors fixes the
remuneration of the Managing Director.
3. “Performance Update” consisting of financial and operational performance for the first six
months of financial year were being sent to the shareholders since 2000-01. However this
practice has been discontinued from 2008-09.

[31]
CORPORATE GOVERNANCE REPORT
CO
RPO
RATE G
OVERN
AN
CE REPO
RT
Supe r Power i n Premium Me ta l s
4. During the period under review, there is no
audit qualification in the financial statement.
The Company continues to adopt best
practices to ensure unqualified financial
statements.
5. During the duration of the Audit and Board
Meetings, the management and the
executive Director give extensive briefings
to the Board members on the business
model of the Company. The Company has
also formed a Risk Management Board
comprising of Directors and Executives of
the Company which meets periodically to
review Commodity and Foreign Exchange
exposures of the Company.
6. All the Aditya Birla Group Companies have
common “Corporate Principles & Code of
Conduct”, applicable to all the employees.
Interalia, it provides for mechanisms to
enforce and report violations of the
principles and the code.
Voluntary Guidelines – 2009:
The Ministry of Corporate Affairs has issued
a set of Voluntary Guidelines on ‘Corporate
Governance’ and ‘Corporate Social
Responsibility’ in December 2009. These
guidelines are expected to serve as a
benchmark for the Corporate Sector and
also help them in acheiving the highest
standard of corporate governance.
Some of the provisions of these guidelines
are already in place as reported elsewhere
in this Report. The other provisions of these
guidelines are being evaluated, and your
Company will strive to adopt the same in a
phased manner.
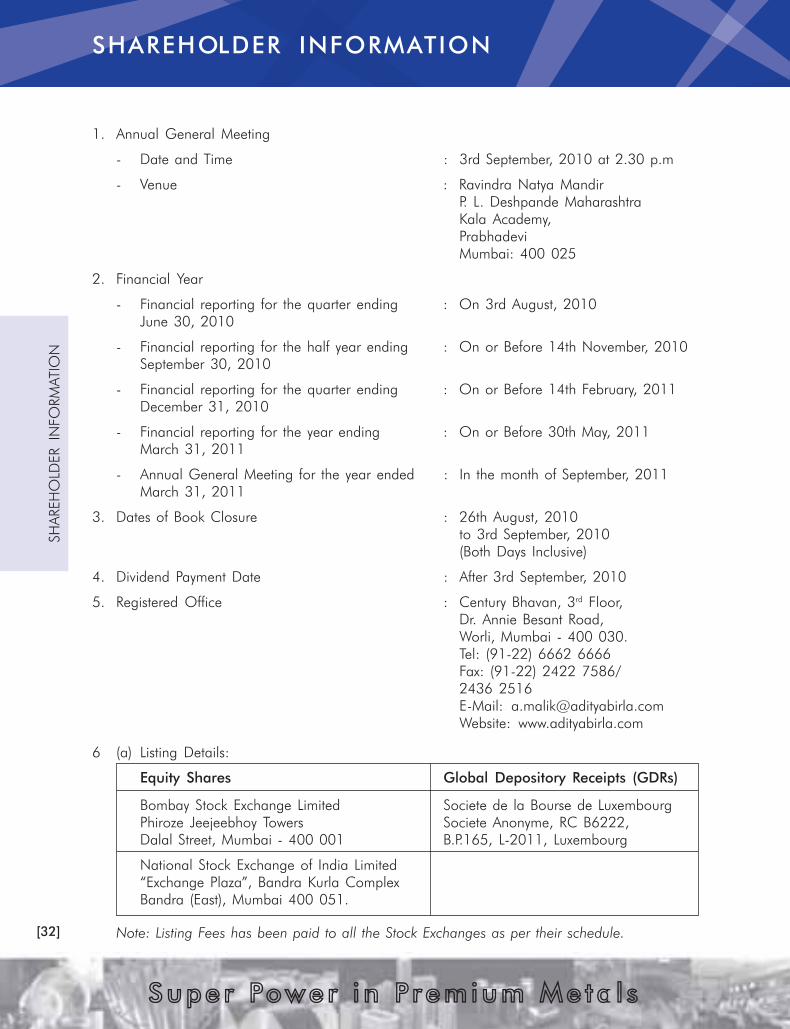
[32]
SHAREHOLDER INFORMATIONSH
AREH
OLD
ER IN
FO
RM
ATIO
N
Supe r Power i n Premium Me ta l s
1. Annual General Meeting
- Date and Time : 3rd September, 2010 at 2.30 p.m
- Venue : Ravindra Natya Mandir
P. L. Deshpande Maharashtra
Kala Academy,
Prabhadevi
Mumbai: 400 025
2. Financial Year
- Financial reporting for the quarter ending : On 3rd August, 2010
June 30, 2010
- Financial reporting for the half year ending : On or Before 14th November, 2010
September 30, 2010
- Financial reporting for the quarter ending : On or Before 14th February, 2011
December 31, 2010
- Financial reporting for the year ending : On or Before 30th May, 2011
March 31, 2011
- Annual General Meeting for the year ended : In the month of September, 2011
March 31, 2011
3. Dates of Book Closure : 26th August, 2010
to 3rd September, 2010
(Both Days Inclusive)
4. Dividend Payment Date : After 3rd September, 2010
5. Registered Office : Century Bhavan, 3rd
Floor,
Dr. Annie Besant Road,
Worli, Mumbai - 400 030.
Tel: (91-22) 6662 6666
Fax: (91-22) 2422 7586/
2436 2516
E-Mail: [email protected]
Website: www.adityabirla.com
6 (a) Listing Details:
Equity Shares Global Depository Receipts (GDRs)
Bombay Stock Exchange Limited Societe de la Bourse de Luxembourg
Phiroze Jeejeebhoy Towers Societe Anonyme, RC B6222,
Dalal Street, Mumbai - 400 001 B.P.165, L-2011, Luxembourg
National Stock Exchange of India Limited
“Exchange Plaza”, Bandra Kurla Complex
Bandra (East), Mumbai 400 051.
Note: Listing Fees has been paid to all the Stock Exchanges as per their schedule.

[33]
SHAREHOLDER INFORMATION
SH
AREH
OLD
ER IN
FO
RM
ATIO
N
Supe r Power i n Premium Me ta l s
6 (b) Overseas Depository for GDRs : J.P. Morgan Chase Bank
60 Wall Street, New York, NY 10260
Tel: 1-302-552 0253 Fax: 1-302-552 0320
6 (c) Domestic Custodian of GDRs : Citibank N.A.
Trent House Plot No C-60
Bandra Kurla Complex, Bandra
Mumbai - 400051
Tel: 91-22- 40296118
7. ISIN Equity Share of Re. 1/- : ISIN INE038A01020
GDR : ISIN US4330641022 CUSIP No. 433064300
Stock Code:
Stock Code Scrip Code
Bombay Stock Exchange 500440
National Stock Exchange HINDALCO
Stock Exchange: Reuters Bloomberg
Bombay Stock Exchange HALC.BO HNDL IN
National Stock Exchange HALC.NS NHNDL IN
Luxembourg Stock Exchange (GDRs) (GDRs) HDCD LI
8. Stock Price Data
Bombay Stock Exchange National Stock Exchange Luxembourg Stock Exchange
High Low Close Volume High Low Close Volume High Low Close
(In Rs.) (In Nos) (In Rs.) (In Nos) (In US$)
Apr-09 67.00 50.85 53.85 53,030,978 66.70 50.90 53.75 187,897,686 1.26 1.00 1.07
May-09 90.00 55.85 84.70 69,227,105 86.45 55.90 84.65 223,652,818 1.74 1.00 1.55
Jun-09 106.40 78.80 86.45 102,568,101 106.50 78.65 86.45 316,585,599 2.18 1.70 1.80
Jul-09 102.60 68.40 100.20 55,797,407 102.70 68.15 100.30 186,229,818 2.09 1.44 2.09
Aug-09 116.00 98.50 105.85 71,334,722 116.00 95.25 106.00 268,099,139 2.45 2.00 2.16
Sep-09 139.60 101.00 128.85 65,733,328 139.90 101.05 129.05 278,884,723 2.87 2.12 2.69
Oct-09 144.35 116.85 121.95 42,703,143 144.45 116.70 121.85 189,265,976 3.05 2.40 2.59
Nov-09 140.80 106.75 138.05 38,949,212 140.80 106.30 138.10 174,420,329 2.97 2.30 2.97
Dec-09 163.00 136.55 160.75 45,480,869 163.00 136.25 160.85 237,456,822 3.47 2.73 3.45
Jan-10 179.75 139.55 147.25 39,558,247 179.80 139.80 147.35 235,986,577 3.83 3.18 3.19
Feb-10 162.65 133.55 161.25 54,161,648 164.90 133.55 162.65 268,719,103 3.49 2.88 3.49
Mar-10 186.85 158.25 181.70 44,141,476 186.90 158.15 181.25 198,143,859 4.10 3.40 4.05
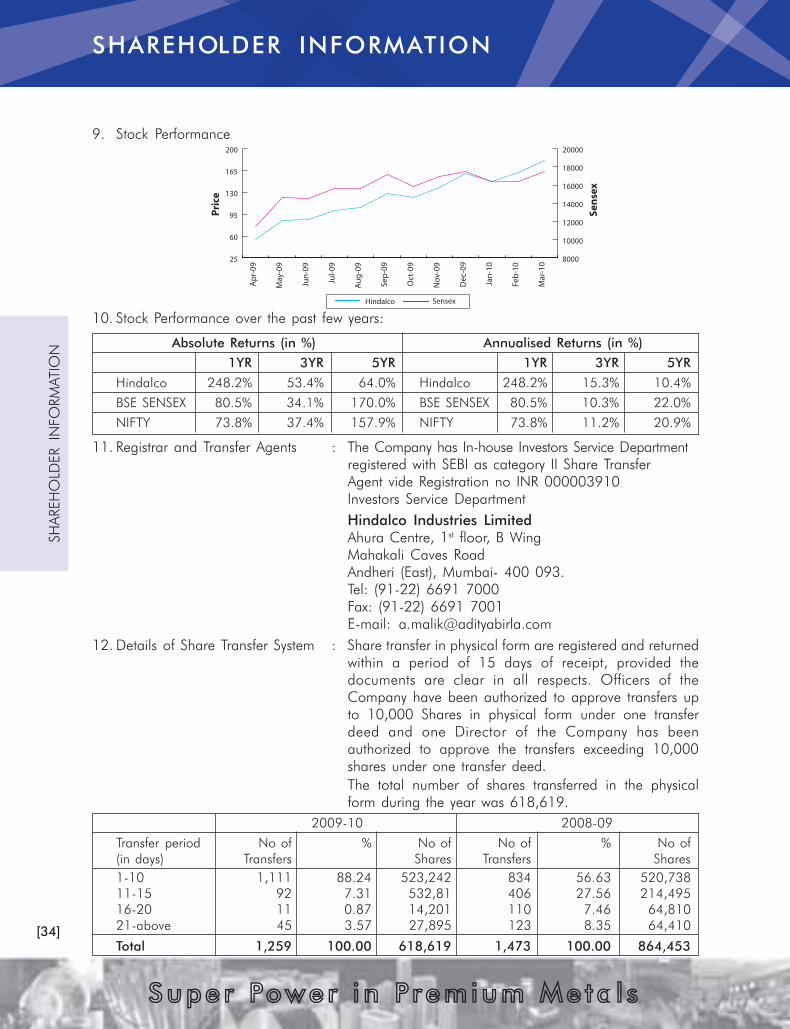
[34]
SHAREHOLDER INFORMATIONSH
AREH
OLD
ER IN
FO
RM
ATIO
N
Supe r Power i n Premium Me ta l s
9. Stock Performance
10. Stock Performance over the past few years:
Absolute Returns (in %) Annualised Returns (in %)
1YR 3YR 5YR 1YR 3YR 5YR
Hindalco 248.2% 53.4% 64.0% Hindalco 248.2% 15.3% 10.4%
BSE SENSEX 80.5% 34.1% 170.0% BSE SENSEX 80.5% 10.3% 22.0%
NIFTY 73.8% 37.4% 157.9% NIFTY 73.8% 11.2% 20.9%
11. Registrar and Transfer Agents : The Company has In-house Investors Service Department
registered with SEBI as category II Share Transfer
Agent vide Registration no INR 000003910
Investors Service Department
Hindalco Industries Limited
Ahura Centre, 1st
floor, B Wing
Mahakali Caves Road
Andheri (East), Mumbai- 400 093.
Tel: (91-22) 6691 7000
Fax: (91-22) 6691 7001
E-mail: [email protected]
12. Details of Share Transfer System : Share transfer in physical form are registered and returned
within a period of 15 days of receipt, provided the
documents are clear in all respects. Officers of the
Company have been authorized to approve transfers up
to 10,000 Shares in physical form under one transfer
deed and one Director of the Company has been
authorized to approve the transfers exceeding 10,000
shares under one transfer deed.
The total number of shares transferred in the physical
form during the year was 618,619.
2009-10 2008-09
Transfer period No of % No of No of % No of
(in days) Transfers Shares Transfers Shares
1-10 1,111 88.24 523,242 834 56.63 520,738
11-15 92 7.31 532,81 406 27.56 214,495
16-20 11 0.87 14,201 110 7.46 64,810
21-above 45 3.57 27,895 123 8.35 64,410
Total 1,259 100.00 618,619 1,473 100.00 864,453
25
60
95
130
165
200
Hindalco
8000
10000
12000
14000
16000
18000
20000
Sensex
Mar
-10
Feb
-10
Jan
-10
Dec
-09
Nov
-09
Oct
-09
Sep
-09
Au
g-0
9
Jul-
09
Jun
-09
May
-09
Ap
r-09
Sen
sex
Pri
ce

[35]
SHAREHOLDER INFORMATION
SH
AREH
OLD
ER IN
FO
RM
ATIO
N
Supe r Power i n Premium Me ta l s
13. Investor Services
a) Complaints received during the year
Nature of complaints 2009-2010 2008-2009
Received Cleared Received Cleared
Relating to Transfers, Transmissions 82 82 120 120
Dividend, Interest, Redemption, Demat – Remat,
Rights Issue and Change of Address etc.
b) Shares pending for transfer : Nil
14. a) Distribution of Shareholding of as on 31st March:
2010 2009
No of No of % of No of % No of % of No of %
Equity Share Share Shares Share Share Share Shares Share
Shares held Holders holders held holding Holders holders held holding
1-1000 313,718 92.46 51,534,233 2.69 404,237 92.64 65,980,811 3.88
1001-2000 11,360 3.35 16,521,731 0.86 14,326 3.42 20,917,727 1.23
2001-5000 8,176 2.41 26,000,024 1.36 9,745 2.33 31,068,983 1.83
5001-10000 3,161 0.93 22,376,058 1.17 3,661 0.87 25,917,559 1.52
10001-50000 2,172 0.64 41,548,911 2.17 2,497 0.60 48,154,900 2.83
50001-100000 191 0.06 13,300,348 0.70 221 0.05 15,468,306 0.91
100001 and above 503 0.15 1,742,181,137 91.05 377 0.09 1,492,762,521 87.80
Total 339,281 100.00 1,913,462,442 100.00 435,064 100.00 1700,270,807 100.00
15. Dematerialisation of : Around 97% of outstanding shares have been dematerialized.
Shares and Liquidity Trading in Hindalco Shares is permitted only in the dematerialized
form from 5th
April, 1999 .
16. Details on use of : The Company had raised Rs. 4545 crore from the rights issue on
public funds obtained October, 2008 of Re. 1 each at a premium of Rs. 95 per equity
in three years share. The objective of the rights issue was to fund part of the
repayment of bridge loan availed by A.V. Minerals (Netherlands)
B.V an overseas subsidiary of the Company for the acquisition of
Novelis Inc, Canada. The fund raised has been utilized for the
above envisaged purpose.
The Company has raised Rs.2790.10 Crores through Qualified
Institutional Placement on 1st December, 2009. Out of this amount
Rs. 396 crores has been spent for various ongoing projects (including
issue related expenses) till 31st
March, 2010 and the balance amount
has been invested temporarily in mutual funds.
17. Outstanding GDR/ : 165,143,129 GDR’s are outstanding as on 31st
March, 2010.
Warrants/Convertible Each GDR represents one underlying equity share.
Bonds

[36]
SHAREHOLDER INFORMATIONSH
AREH
OLD
ER IN
FO
RM
ATIO
N
Supe r Power i n Premium Me ta l s
Birla Copper Division
P.O. Dahej, Lakhigam
Dist. Bharuch – 392 130
Gujarat
Tel: (02641) 256004-06,
251009
Fax: (02641) 251003/002
Foils Division
Village Khutli, Khanvel,
Silvassa-396 230
U.T. of Dadra & Nagar Haveli
Tel: (0260) 6618100
Fax: (0260) 2677025
Belur Sheet
39, Grand Trunk Road
Belurmath 711 202
Dist: Howrah, West Bengal
Tel: (033) 26100408
Fax: (033) 2654 9982/5740
Taloja Sheet
Plot 2, MIDC Industrial Area
Taloja A.V.
Dist : Raigad
Navi Mumbai - 410 208
Maharashtra
Tel: (022) 66292929
Fax: (022) 2741 2430/31
Kalwa Foil
Thane Belapur Road
Kalwa, Thane 400 605
Maharashtra
Tel: (022) 25321141
Fax: (022) 25348798
Mauda Unit
Village Dahali
Ramtek Road, Mouda
Nagpur – 441 104
Tel: (07115) 660777/786
Kollur Works
Village- Kollur Re Puram
Mandal Via Mutangi, Medak
Dist Andhra Pradesh – 502 300
Tel: (08413) 234300/
234204/05
Fax: (08455) 288829
Alupuram Extrusion
Alupuram P.B. No. 30
Kalamassery 683 104
Dist: Ernakulam,
Kerala
Tel: (0484) 2532441-48
Fax: (0484) 2532468
Renukoot Plant*
P.O. Renukoot -231217
Dist Sonbhadra
Uttar Pradesh.
Tel : (05446) 252077-9
Fax: (05446) 252107/427
Renusagar Power
Division
P. O. Renusagar
Dist. Sonbhadra,
Uttar Pradesh.
Tel: (05446) 277161-3/
278592-5
Fax: (05446) 27164/
278596
Hirakud Smelter
Hirakud 768 016
Dist: Sambalpur Orissa
Tel: (0663) 2481307/452
Fax: (0663) 2481356
Hirakud Power
Post Box No.12
Hirakud 768 016
Dist: Sambalpur Orissa
Tel: (0663) 2481307/
2481273/452
Fax: (0663) 2481356
Muri Alumina
Post Chotamuri-835 101
Dist: Ranchi, Jharkhand
Tel: (06522) 244253/334
Fax: (06522) 244342
Belgaum Alumina
Village Yamanapur
Belgaum 590 010
Karnataka
Tel: (0831) 2472717/18
Fax: (0831) 2472728
Mines
Chandgad Mines
At Post: Chandgad 416509
Dist: KolhapurMaharashtra
Tel/Fax: (02320) 213342
Durgmanwadi Mines
At Post Radhanagri
Dist: Kolhapur,
Maharashtra - 416 212
Tel: (02321) 2371008
Fax: (02321) 237478
Lohardaga Mines
Dist: Lohardaga 835 302
Jharkhand
Tel/Fax: (06526) 224112
Talabira Mines
Talabira-1, Coal Project
Qrs. No. A6/1
Saraswati Vihar
P.O. Sankarma
Dist. Sambalpur, Orissa
Tel: (0663) 2230573
Samari Mines
P.O: Kusumi 497222
Dist : Sarguja Chattisgarh
Tel/Fax(07778)274325
*Renukoot works has also manufacturing facilities of Chemicals, Sheets and Extrusions.
18. Plant Locations:
Aluminium & Power Copper Chemicals Sheet, Foil, Packaging
& Extrusions
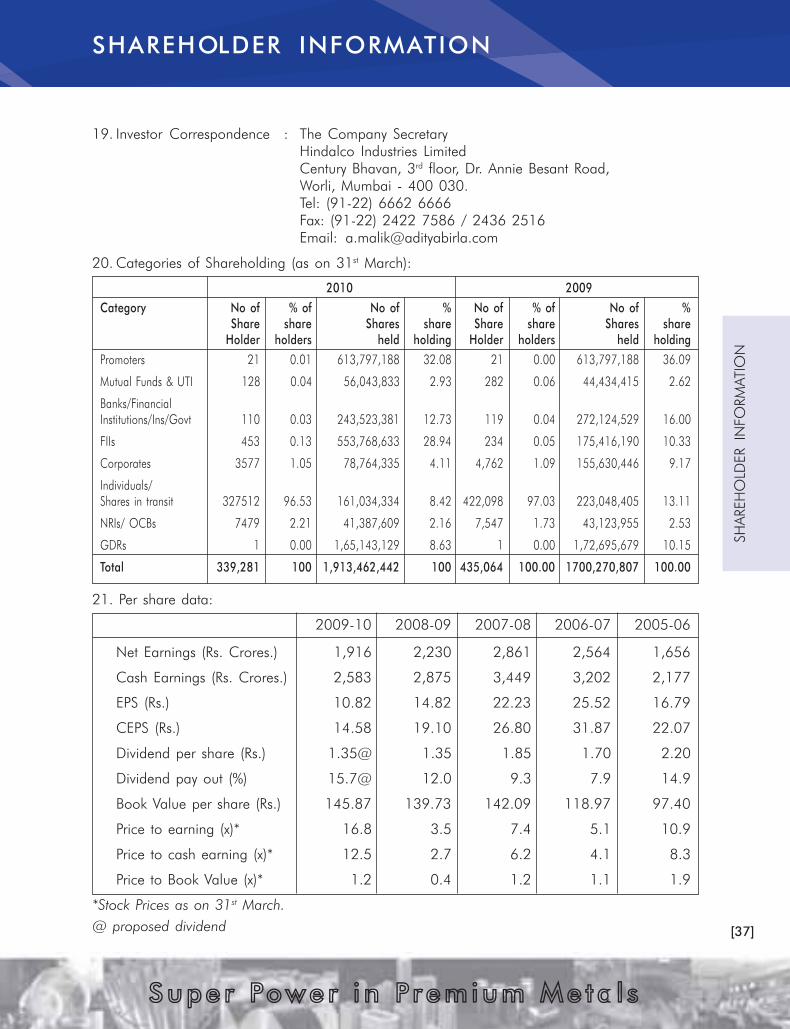
[37]
SHAREHOLDER INFORMATION
SH
AREH
OLD
ER IN
FO
RM
ATIO
N
Supe r Power i n Premium Me ta l s
19. Investor Correspondence : The Company Secretary
Hindalco Industries Limited
Century Bhavan, 3rd
floor, Dr. Annie Besant Road,
Worli, Mumbai - 400 030.
Tel: (91-22) 6662 6666
Fax: (91-22) 2422 7586 / 2436 2516
Email: [email protected]
20. Categories of Shareholding (as on 31st
March):
2010 2009
Category No of % of No of % No of % of No of %
Share share Shares share Share share Shares share
Holder holders held holding Holder holders held holding
Promoters 21 0.01 613,797,188 32.08 21 0.00 613,797,188 36.09
Mutual Funds & UTI 128 0.04 56,043,833 2.93 282 0.06 44,434,415 2.62
Banks/Financial
Institutions/Ins/Govt 110 0.03 243,523,381 12.73 119 0.04 272,124,529 16.00
FIIs 453 0.13 553,768,633 28.94 234 0.05 175,416,190 10.33
Corporates 3577 1.05 78,764,335 4.11 4,762 1.09 155,630,446 9.17
Individuals/
Shares in transit 327512 96.53 161,034,334 8.42 422,098 97.03 223,048,405 13.11
NRIs/ OCBs 7479 2.21 41,387,609 2.16 7,547 1.73 43,123,955 2.53
GDRs 1 0.00 1,65,143,129 8.63 1 0.00 1,72,695,679 10.15
Total 339,281 100 1,913,462,442 100 435,064 100.00 1700,270,807 100.00
21. Per share data:
2009-10 2008-09 2007-08 2006-07 2005-06
Net Earnings (Rs. Crores.) 1,916 2,230 2,861 2,564 1,656
Cash Earnings (Rs. Crores.) 2,583 2,875 3,449 3,202 2,177
EPS (Rs.) 10.82 14.82 22.23 25.52 16.79
CEPS (Rs.) 14.58 19.10 26.80 31.87 22.07
Dividend per share (Rs.) 1.35@ 1.35 1.85 1.70 2.20
Dividend pay out (%) 15.7@ 12.0 9.3 7.9 14.9
Book Value per share (Rs.) 145.87 139.73 142.09 118.97 97.40
Price to earning (x)* 16.8 3.5 7.4 5.1 10.9
Price to cash earning (x)* 12.5 2.7 6.2 4.1 8.3
Price to Book Value (x)* 1.2 0.4 1.2 1.1 1.9
*Stock Prices as on 31st
March.
@ proposed dividend
[38]
SHAREHOLDER INFORMATIONSH
AREH
OLD
ER IN
FO
RM
ATIO
N
Supe r Power i n Premium Me ta l s
22. OTHER USEFUL INFORMATION FOR SHAREHOLDERS
Shareholders who have not yet encashed their dividend warrants for the years 2002-2003 to
2008-2009 may approach the Company for revalidation / issue of duplicate dividend warrant
quoting reference of their Ledger Folio numbers / DP & Client ID.
Shareholders of 6% Cumulative Redeemable Preference Shares who have not yet encashed
their dividend warrants for the years 2007-2008, 2008-2009 and Redemption warrant may
approach the Company for revalidation / issue of duplicate dividend warrant quoting reference
of their Ledger Folio numbers / DP & Client ID.
22.1 The Unclaimed dividend for the financial year 2001-2002 has been transferred by the
Company to the Investor Education & Protection Fund constituted by the Central
Government under Section 205A & 205C of the Companies Act, 1956.
Shareholders are advised that dividends for the financial year ended 2002 -2003
onwards which remains unpaid/unclaimed over a period of 7 years have to be
transferred by the Company to Investor Education & Protection Fund (IEPF) constituted
by the Central Government under Section 205A & 205C of the Companies Act,
1956. Shareholders who have not claimed the dividend for this period are requested
to lodge their claim with the Company, as under the amended provisions of Section
205B of the Act, no claim shall lay for the unclaimed dividends from IEPF by the
Members.
Upon effectiveness of the Scheme of Arrangement under the Companies Act, 1956
between Indo Gulf Corporation Limited (IGCL), Hindalco Industries Limited (Hindalco)
and Indo Gulf Fertilisers Limited (IGFL), all unpaid dividend amounts of the then IGCL
for FY1998-99 to FY 2001-02 have been taken over by the Company and transferred
to the Investor Education & Protection Fund constituted by the Central Government
under Section 205A & 205C of the Companies Act, 1956.
Upon effectiveness of the Scheme of Arrangement under the Companies Act, 1956
between Indian Aluminium Company, Limited (Indal) and Hindalco Industries Limited
(Hindalco) all unpaid dividend amounts of the then Indal for FY2000-01 and FY2001-
02 have been taken over by the Company and transferred to the Investor Education
and Protection Fund constituted by the Central Government under Section 205A and
205C of the Companies Act, 1956.
As required under the Companies Unpaid Dividend (Transfer to General Revenue
Account of the Central Government) Rules 1978, the then Indal has transferred all
unclaimed dividend up to FY 1994-95 to the General Revenue Account of the
Central Government. Members who have so far not claimed or collected their dividend
for the said financial year(s), may claim the same from the Registrar of Companies,
West Bengal, Nizam Palace, 234/4, A J C Bose Road, Kolkata 700 020 by submitting
an application in the prescribed form.
In case of any query contact –
Investor Service Department
Hindalco Industries limited
1, Prafulla Chandra Sen Sarani
Kolkata 700 071
Tel.: (033) 2281 2534
Email ID: [email protected]

[39]
SHAREHOLDER INFORMATION
SH
AREH
OLD
ER IN
FO
RM
ATIO
N
Supe r Power i n Premium Me ta l s
22.2 ECS/NECS Facility
The Company uses “Electronic Clearing Service” (ECS) facility for remitting dividend
to its shareholders wherever available.
In terms of a notification issued by the Reserve Bank of India, with effect from
1st October, 2009, remittance of dividend through ECS is replaced by National
Electronic Clearing Service (NECS). Banks have been instructed to move to the NECS
platform. The advantages of NECS over ECS include faster credit of remittance to the
beneficiary’s account, coverage of more bank branches and ease of operations.
NECS essentially operates on the new and unique bank account number, allotted by
banks post implementation of Core Banking Solutions (CBS) for centralised processing
of inward instructions and efficiency in handling bulk transactions.
To enable remittance of dividend through NECS, Members are requested to provide
their new account number allotted to them by their respective banks after implementation
of CBS. The account number must be provided to the Company in respect of shares
held in physical form and to the Depository Participants in respect of shares held in
electronic form.
23. INVESTOR SERVICES
23.1 Equity Shares of the Company are under compulsory demat trading by all investors,
with effect from 5th
April, 1999. Considering the advantages of scrip less trading,
shareholders are requested to consider dematerialisation of their shareholding so as
to avoid inconvenience in future.
23.2 Shareholders/Beneficial Owners are requested to quote their Folio No./DP & Client
ID Nos., as the case may be, in all correspondence with the Company.
All correspondences regarding shares & debentures of the Company should be
addressed to the Investor Service Department of the Company at Ahura Centre,
1st
Floor, ‘B’ Wing, Mahakali Caves Road, Andheri (East), Mumbai - 400 093 and not
to any other office(s) of the Company.
23.3 Shareholders holding shares in physical form are requested to notify to the Company,
change in their address/Pin Code number and Bank Account details promptly by
written request under the signatures of sole / first joint holder. Beneficial Owners of
shares in demat form are requested to send their instructions regarding change of
name, change of address, bank details, nomination, power of attorney, etc. directly to
their DP.
23.4 To prevent fraudulent encashment of dividend warrants, members are requested to
provide their Bank Account Details (if not provided earlier) to the Company (if shares
are held in physical form) or to DP (if shares are held in demat form), as the case may
be, for printing of the same on their dividend warrants.
23.5 Non-resident members are requested to immediately notify:-
� change in their residential status on return to India for permanent settlement;
� Particulars of their NRE Bank Account with a bank in India, if not furnished earlier.

[40]
SHAREHOLDER INFORMATIONSH
AREH
OLD
ER IN
FO
RM
ATIO
N
Supe r Power i n Premium Me ta l s
23.6 In case of loss/misplacement of share certificate, investors should immediately lodge
a FIR/Complaint with the police and inform to Company along with original or
certified copy of FIR/acknowledged copy of the complaint.
23.7 For expeditious transfer of shares, shareholders should fill in complete and correct
particulars in the transfer deed, wherever applicable registration number of Power of
Attorney should also be quoted in the transfer deed at the appropriate place.
The Securities and Exchange Board of India (SEBI) vide circular ref. no. MRD/DoP/
Cir-05/2007 dated April 27, 2007 made PAN mandatory for all securities market
transactions. Thereafter, vide Circular no. MRD/DoP/Cir-05/2009 dated May 20,
2009, SEBI has clarified that for securities market transactions and off-market/ private
transactions involving transfer of shares in physical form of listed companies, it shall
be mandatory for the transferee(s) to furnish copy of PAN Card to the Company/ RTAs
for registration of such transfer of shares.
SEBI has further clarified that it shall be mandatory to furnish a copy of PAN in the
following cases:
a) Deletion of name of the deceased shareholder(s), where the shares are held in the
name of two or more shareholder(s).
b) Transmission of shares to the legal heir(s), where deceased shareholder was the
sole holder of shares.
c) Transposition of shares- when there is a change in the order of names in which
physical shares are held jointly in the names of two or more shareholders.
23.8 Shareholders are requested to keep record of their specimen signature before lodgment
of shares with the Company to obviate possibility of difference in signature at a later
date.
23.9 Shareholders(s) of the Company who have multiple accounts in identical name(s) or
holding more than one Share Certificates in the same name under different Ledger
Folio(s) are requested to apply for consolidation of such Folio(s) and send the relevant
Share Certificates to the Company.
23.10 Section 109A of the Companies Act, 1956 extends nomination facility to individuals
holding shares in physical form in companies. Shareholders, in particular those holding
shares in single name, may avail of the above facility by furnishing the particulars of
their nominations in the prescribed Nomination Form.
23.11 Shareholders are requested to give us their valuable suggestions for improvement of
our investor services.
23.12 Shareholders are requested to quote their E-mail Ids, Telephone/Fax numbers for
prompt reply to their communication.

[41]
SUSTAINABLE DEVELOPMENT :
ENVIRONMENT RESPONSIBILITY
EN
VIR
ON
MEN
T RESPO
NSIB
ILIT
Y
Supe r Power i n Premium Me ta l s
Protecting the EnvironmentProtecting the Environment
is Central to our Businessis Central to our Business
Consistently
winning National
Awards for
Energy
Conservation
Environment
Management
and Safety
OU
R
AC
HI
EV
EM
EN
TS
The challenges that the world faces on
environment conservation, are indeed alarming.
Just to highlight a few – climate change, the
severity of droughts and floods, their impact on
rain fed agriculture, the emission of greenhouse
gases and our ability to pursue sustainable
development. We in India are no exception to
these issues. Environment conservation and
sustainable development are continuously on
your Company ’s radar. Hence these are
integrated into its business strategies as well as
its efforts towards fostering inclusive growth
through its rural development and community
initiatives.
All of your Company’s plants and mines, adopt
clean technologies and processes that combine
both economic progress and sustainable
environment. Among these are the integrated
Aluminium and Copper Complexes at Renukoot,
Hirakud and Dahej, the Alumina plants
at Belgaum and Muri, the Smelter power
complex at Hirakud, the Sheet Rolling plants at
Belur, Taloja, Mauda, the Foil Plants at Kalwa,
Kollur and Silvassa, the Extrusions plant at
Alupuram and the Company’s Bauxite and Coal
mines in Chattisgarh, Jharkhand and
Maharashtra.
At most of your Company’s plants, ISO 9001,
ISO-14001 and OHSAS-18001 have been
combined into the Integrated Management
System (IMS).
State-of-the-art automated industrial and
domestic effluent treatment plants operate across
all the manufacturing units. The treated effluent
and treated domestic water is recycled and is
used for process, horticulture and irrigation. At
your Company’s Muri Unit, consequent to
effluent recycling, the fresh water requirement
for the alumina refinery has been reduced by
over 60%. Going forward, the fresh water
requirement at the power plant will be reduced
substantially through segregated and
direct use of clean effluents from the alumina
refinery, besides 100% use of treated effluents
in non-process areas. Eventually, we
hope to make the Muri Unit a Zero discharge
Plant.

[42]
SUSTAINABLE DEVELOPMENT :
ENVIRONMENT RESPONSIBILITY
EN
VIR
ON
MEN
T RESPO
NSIB
ILIT
Y
Supe r Power i n Premium Me ta l s
Likewise, your Company’s Belgaum unit has
embarked on a project for comprehensive
effluent management. This includes construction
of a new effluent holding pond, a process ETP
and a rain water harvesting pond. This facility
scheduled to be commissioned in July 2010,
will render it a Zero discharge plant besides
reducing the fresh water consumption at its
Alumina refinery.
The Mauda Rolling plant is a Zero Discharge
plant already. It has significantly reduced fresh
water consumption as well.
To conserve natural resources at your
Company’s Copper complex, a 4400 M3/day
Reverse Osmosis (RO) plant treats the process
water from the cooling tower and a portion of
streams from the effluent treatment plant. The
treated water from the RO plant is used for
horticulture and slag granulation. This has
resulted in conserving process water
consumption by 1200 to 1500 m3/day.
At Renukoot Plant, Solid waste is put to reuse by
your Company. The stacking of red mud is in
place. The sludge from STP (Sewage Treatment
Plant) and ETP (Effluent Treatment Plant) is used
to nurture trees and plants. Fly ash and fly ash
bricks are utilized in the construction sector.
Advance Hi-Tech Dry Scrubbing Systems on all
potlines, of Renukoot are in place to efficiently
arrest fluorine emissions and particulate matter.
The efficient ESPs (Electrostatic Precipitators) in
boilers and calciners and FTPs (Fume Treatment
Plants) in Baking Furnaces have been
strategically positioned to stall dust emission.
Dry ash handling system has been installed for
better ash utilization and to reduce dusting
during unloading of ash from all Boilers. To cut
emission even further retrofitting of old Baking
Furnaces is in progress.
At the Renusagar Captive Power Plant, an
advanced Chemical Jet Dust Suppression system
has been installed in all the Coal conveyers
and at coal transfer points. MST compound
(a proprietary item-name given by the supplier)
is used for mist formation leading to low water
consumption. Dust Extraction system with bag
filters have also been provided at the coal
screen. Water sprinklers all around the coal yard
and ash disposal site suppress air borne
particles. The installation of Dry fog system is in
progress at the unloading station at ARW (Aerial
Ropeway) for controlling dust emission.
To conserve electricity, translucent sheets for
natural illumination are being set up inside the
Silvassa plant. This will help cut down the
consumption of electricity during the day.
The mapping of Carbon Footprint for your
Company ’s operations is underway.
Subsequently, your Company intends to
benchmark the action points of identified
projects, aimed at the reduction of the Carbon
footprint.
A number of pro-active and growth oriented
measures for scaling up your Company’s
Environment Management performance, are in
progress. Your Company is actively pursuing
the Charter on Corporate Responsibility for
Environment Protection (CREP) mooted by the
Ministry of Environment and Forest.
Your Company continues to make substantive
investments towards environment protection. Up
until now an investment of over Rs.6,343 million
has been made. An additional capex of
Rs.809 million has been earmarked for
bettering the processes at Renukoot and
Renusagar.
The green cover at your Company’s plants is
simply awesome. At some points, you cannot
even see the skyline. Only the leaves and
the flowers and hear the cacophony of the
birds. When you walk through this wooded
ambience, you can never imagine that there
would be a plant in the midst of nature. Our
Board, our Management and all of our
colleagues are committed to living in harmony
with nature.
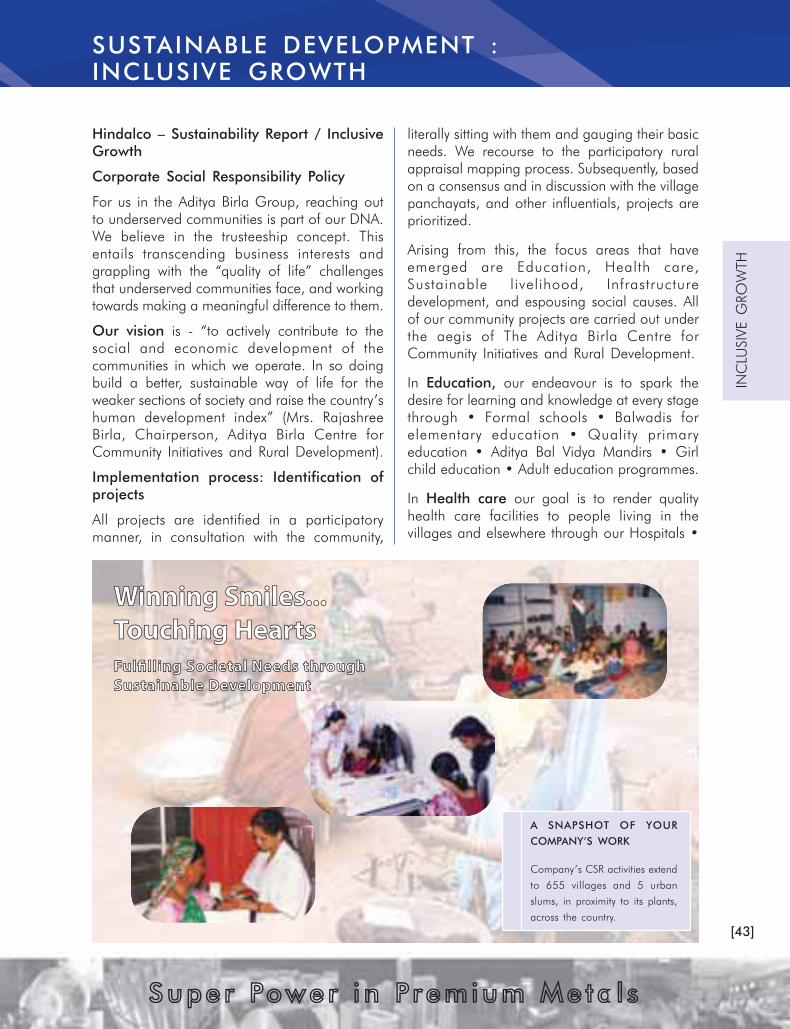
[43]
SUSTAINABLE DEVELOPMENT :
INCLUSIVE GROWTH
INC
LU
SIV
E G
RO
WTH
Supe r Power i n Premium Me ta l s
Hindalco – Sustainability Report / Inclusive
Growth
Corporate Social Responsibility Policy
For us in the Aditya Birla Group, reaching out
to underserved communities is part of our DNA.
We believe in the trusteeship concept. This
entails transcending business interests and
grappling with the “quality of life” challenges
that underserved communities face, and working
towards making a meaningful difference to them.
Our vision is - “to actively contribute to the
social and economic development of the
communities in which we operate. In so doing
build a better, sustainable way of life for the
weaker sections of society and raise the country’s
human development index” (Mrs. Rajashree
Birla, Chairperson, Aditya Birla Centre for
Community Initiatives and Rural Development).
Implementation process: Identification of
projects
All projects are identified in a participatory
manner, in consultation with the community,
literally sitting with them and gauging their basic
needs. We recourse to the participatory rural
appraisal mapping process. Subsequently, based
on a consensus and in discussion with the village
panchayats, and other influentials, projects are
prioritized.
Arising from this, the focus areas that have
emerged are Education, Health care,
Sustainable livelihood, Infrastructure
development, and espousing social causes. All
of our community projects are carried out under
the aegis of The Aditya Birla Centre for
Community Initiatives and Rural Development.
In Education, our endeavour is to spark the
desire for learning and knowledge at every stage
through • Formal schools • Balwadis for
elementary education • Quality primary
education • Aditya Bal Vidya Mandirs • Girl
child education • Adult education programmes.
In Health care our goal is to render quality
health care facilities to people living in the
villages and elsewhere through our Hospitals •
Winning Smiles...Winning Smiles...
Touching HeartsTouching HeartsFulfilling Societal Needs throughFulfilling Societal Needs through
Sustainable DevelopmentSustainable Development
A SNAPSHOT OF YOUR
COMPANY’S WORK
Company’s CSR activities extend
to 655 villages and 5 urban
slums, in proximity to its plants,
across the country.

[44]
SUSTAINABLE DEVELOPMENT :
INCLUSIVE GROWTH
INC
LU
SIV
E G
RO
WTH
Supe r Power i n Premium Me ta l s
Primary health care centres • Mother and Child
care projects • Immunization programmes with
a thrust on polio eradication • Health care for
the visually impaired, and physically challenged
• Preventive health through awareness
programmes.
In Sustainable Livelihood our programmes aim
at providing livelihood in a locally appropriate
and environmentally sustainable manner through
• Formation of Self Help Groups for women
empowerment • Vocational training through
Aditya Birla Rural Technology Parks • Agriculture
development and better farmer focus •
Watershed development • Partnership with
Industrial Training Institutes.
In Infrastructure Development we endeavour
to set up essential services that form the
foundation of sustainable development through
• Basic infrastructure facilities • Housing facilities
• Safe drinking water • Sanitation & hygiene •
Renewable sources of energy.
To bring about Social Change, we advocate
and support • Dowryless marriage • Widow
remarriage • Awareness programmes on anti
social issues • De-addiction campaigns and
programmes • Espousing basic moral values.
Activities, setting measurable targets with
timeframes and performance management.
Prior to the commencement of projects, we carry
out a baseline study of the villages. The study
encompasses various parameters such as –
health indicators, literacy levels, sustainable
livelihood processes, population data - below
the poverty line and above the poverty line,
state of infrastructure, among others. From the
data generated, a 1-year plan and a 5-year
rolling plan are developed for the holistic and
integrated development of the marginalized.
These plans are presented at the Annual
Planning and Budgeting meet. All projects are
assessed under the agreed strategy, and are
monitored every quarter, measured against
targets and budgets. Wherever necessary,
midcourse corrections are affected.
Organizational mechanism and
responsibilities
The Aditya Birla Centre for Community Initiatives
and Rural Development provides the vision under
the leadership of its Chairperson, Mrs. Rajashree
Birla. This vision underlines all CSR activities.
Every Manufacturing Unit has a CSR Cell. Every
Company has a CSR Head, who reports to the
Group Executive President (Communications &
CSR) at the Centre. At the Company, the
Business Director takes on the role of the mentor,
while the onus for the successful and time bound
implementation of the projects is on the various
Unit Presidents and CSR teams. To measure the
impact of the work done, a social satisfaction
survey / audit is carried out by an external
agency.
Partnerships
Collaborative partnerships are formed with the
Government, the District Authorities, the village
panchayats, NGOs and other like-minded
stakeholders. This helps widen the Company’s
reach and leverage upon the collective expertise,
wisdom and experience that these partnerships
bring to the table.
In collaboration with FICCI, we have set up
Aditya Birla CSR Centre for Excellence to make
CSR an integral part of corporate culture.
The Company engages with well established
and recognized programs and national
platforms such as the CII, FICCI, ASSOCHAM
to name a few, given their commitment to
inclusive growth.
Budgets
A specific budget is allocated for CSR activities.
This budget is project driven.
Information dissemination
The Company’s engagement in this domain is
disseminated on its website, Annual Reports, its
house journals and through the media.

[45]
SUSTAINABLE DEVELOPMENT :
INCLUSIVE GROWTH
INC
LU
SIV
E G
RO
WTH
Supe r Power i n Premium Me ta l s
Management Commitment
Our Board of Directors, our Management and
all of our employees subscribe to the philosophy
of compassionate care. We believe and act on
an ethos of generosity and compassion,
characterized by a willingness to build a society
that works for everyone. This is the cornerstone
of our CSR policy.
Our Corporate Social Responsibility policy
conforms to the Corporate Social Responsibility
Voluntary Guidelines spelt out by the Ministry of
Corporate Affairs, Government of India in
collaboration with FICCI (2009).
Inclusive Growth
Towards inclusive growth
A snapshot of your Company’s work
Your Company’s CSR activities extend to 655
villages and 5 urban slums, in proximity to its
plants, across the country.
Health Care
We reached out to 3,19,000 villagers in 1,750
medical camps conducted for general health
checkups and thousands of villagers in the
remotest areas through our rural mobile
medical van services. Those afflicted with
serious ailments were referred to our hospitals.
At the Company hospitals, across the Units,
over 5 lakh patients have been treated at
virtually no cost to them.
At the eye camps conducted by us, 2,492
patients were operated for cataract, and intra-
ocular lens fitted for their vision.
At the medical camps organized for the
physically challenged, 60 patients who were
given artificial limbs, can now walk.
Mother and Child Health Care
We immunized 13,20,083 children against
polio, and thousands of children against other
diseases like malaria, typhoid and hepatitis-B.
More than 57,870 women took advantage of
the anti-natal, post natal, mass immunization,
nutrition and escort services for institutional
delivery. These are core activities of the
Reproductive and Child Health programmes.
Our focused programme on adolescent health
care covered 1,326 girls.
As a result of our intensive motivation drives
towards responsible family raising 21,000
villagers opted for planned families.
Education
Over 10,460 children were enlisted this year at
our Balwadis. Additionally, we were able to
enroll 5,758 children in the local schools.
To encourage the spirit of excellence, 5,395
students from the rural schools supported by
us, were awarded scholarships.
To focus on the girl child, several of our units
foster the cause of Girl child education through
the Kasturba Gandhi Balika Vidyalayas(KGVB)-
residential schools for girls.
Over 4,515 people have joined our adult
literacy classes.
Sustainable Livelihood
At the Aditya Birla Rural Technology Park, more
than 275 programmes were conducted. The
thrust was on repair and maintenance of diesel
pump sets, electric and electronic goods, hand
pumps, making bags, ropes, tailoring and
knitting.
Skill sets of 10,767 rural youth have been honed
to enable them stand on their feet.
Training in crop diversification, floriculture
demonstration, integrated pest management and
post harvest technology has been a boon to
18,411 farmers.
Watershed Development projects ensure
optimum use of land and water resources.
Installation of lift irrigation projects, construction
[46]
SUSTAINABLE DEVELOPMENT :
INCLUSIVE GROWTH
INC
LU
SIV
E G
RO
WTH
Supe r Power i n Premium Me ta l s
of check dams, water channels and digging of
wells, have benefitted 27,149 farmers.
Women Self Help Groups
Our 1,892 Self Help Groups empower 20,000
women financially and socially. These women
have taken to tailoring, weaving, knitting, crafting
bamboo baskets, san sutli (ropes), vermin
compost, rearing samplings, mushrooms
cultivation, making pickles and spices, selling
vegetables and fruits and running grocery stores.
Infrastructure
Ongoing community support in the form of
better roads, potable water systems, biogas
plants, building of community centres, animal
sheds, construction of dry toilets, provision of
street lights and electricity, subsidizing houses,
served the needs of over 1,71,615 people.
To conserve water and support agriculture,
67 ponds, over a 100 check dams and bore
wells were constructed.
Panchayat meeting halls, schools buildings and
community halls have also been maintained by
your Company.
Of the 105 villages that we have committed for
conversion into model villages, 17 have been
already transformed this year.
In sum
Our Board of Directors, our Management and
all of our employees subscribe to the philosophy
of compassionate care and to the upliftment of
our rural societies.

DIR
EC
TO
RS’ REPO
RT
DIRECTORS’ REPORT TO THE SHAREHOLDERS
[47]
Supe r Power i n Premium Me ta l s
Dear Shareholders,
Your Directors are pleased to present the
51st Annual Report along with the audited
annual accounts for the year ended 31st March,
2010.
The severe downturn witnessed in the previous
year was arrested and macro economic factors
showed signs of recovery. Several measures
taken by your Company started yielding results
in the form of higher production, lower cost
and higher sale of value-added products. Your
Company also successfully placed QIP of USD
600 Million during the year under review.
Financial Performance
Your Company’s Consolidated Revenue crossed
USD 12.8 Billion mark during the year.
The consolidated EBIDTA was at USD 2.1 Billion
i.e. Rs.10,069 Crore. Business Performance is
amongst the best ever with highest net profit.
Overall results of your Company clearly reflect
derisked business portfolio in terms of
geographic and product mix.
Standalone Results
For the year ended 31 March 2010, net sales
at Rs.19,536 crore were higher by 7%.
The highest ever metal volume, better product
and geographic mix, despite subdued
commodity prices helped improve the company’s
performance. The superior operational
performance in terms of highest ever metal
production and substantial cost savings on
improved efficiencies were negated by adverse
macro-economic factors, which were
pronounced in both the businesses.
In the Aluminium Business, lower Rupee-LME
eroded profit by around Rs.750 crore.
Additionally, Rs.100 crore was lost on account
of the higher coal cost at Renusagar Power.
Copper Business, which benefitted from higher
contracted TcRc (Treatment charges and Refining
charges), lost Rs.750 crore on lower by-product
credit, in terms of sulphuric acid realisation and
lower fertiliser subsidy. Against this backdrop,
the performance of both the Businesses was
satisfactory. Other income at Rs.260 crore was
lower by Rs.377 crore, on account of low
treasury corpus, post repayment of bridge loan
in November 2008, which was taken for Novelis
acquisition and for higher project spending.
Abundant liquidity kept short-term rates low.
This also affected yields on the company’s
investments which are mostly in liquid plans.
It also reduced the cost of working capital
borrowing. As a result, the interest and financing
charges also reduced from Rs.337crore in FY09
to Rs.278 crore in FY10.
Arising from the announcement of the Institute
of Chartered Accountants of India dated
29th March, 2008 on Accounting for
Derivatives, the Company has decided for early
adoption of Accounting Standard (AS) 30 on
Financial Instruments : Recognition and
Measurement, in so far as it relates to derivative
accounting, from 1st April, 2009. Accordingly,
net loss arising on fair valuation of outstanding
derivatives as on 01st April, 2009 amounting
to Rs. 230.58 crore (net of deferred tax of
Rs. 118.73 crore) has been adjusted against
General Reserves following transitional
provisions. Accounting for all derivatives from
1st April, 2009 have been done as prescribed
under the AS. As a result, net gain / (loss) of
Rs. (236.12) crore and Rs. 167.75 crore &
Rs. 246.09 crore for the year ended 31st March,
2010 have been included under Sales and Raw
Materials Consumed & Other Expenses
(in Manufacturing and Other Expenses),
respectively, with consequential impact on
profit for the year ended 31st March, 2010.
The figures of the current year in respect of
above items are, therefore, not comparable with
those of the previous year.
Consolidated Results
Consolidated revenues were lower at Rs. 60,722
crore, mainly due to lower aluminum prices and
softness in the Company’s end-markets in the
first half of the year, especially for Novelis.

DIR
EC
TO
RS’ REPO
RT
DIRECTORS’ REPORT TO THE SHAREHOLDERS
[48]
Supe r Power i n Premium Me ta l s
Further, change in the status of
Idea Cellular Ltd. from joint venture to associate
w.e.f from 1st January 2009 for the purpose of
consolidation, also resulted in proportionate
revenue from Idea not being included in the
consolidated revenues.
Profit before depreciation, interest and taxes
soared to a record level of Rs.10,069 crore
from Rs. 3,661crore in FY09.Consolidated result
include pre-tax adjustment for unrealised
derivative gain/(Loss) of Rs. 2,736.4 crore in
FY 10 and (Rs. 2,380.7) crore in FY 09 at
Novelis.
Aluminium Business revenue fell by 11% to
Rs.48,091 crore on the back of lower LME
and lower demand in first half of the year.
Earning before interest and tax turned around
from a loss of Rs. 425 crore to a profit of
Rs. 5,998 crore. This reflects steady improvements
in operations across the board. Copper business
revenue increased by 13% to Rs.12,575 crore
and EBIT trebled from Rs. 374 crore to
Rs. 1,003 crore.
(Rs. in Crores)
Standalone Consolidated
Financial Results for the year ended 31.03.2010 31.03.2009 31.03.2010 31.03.2009
Net Sales and Operating Revenues 19,536.28 18,219.65 60,722.11 65,962.95
Profit before Tax 2,264.56 2,690.32 6,180.76 (604.92)
Provision for Current Tax 374.20 478.11 554.30 872.53
Provision for Deferred Tax 87.90 121.40 1,377.59 (1,689.36)
Provision for Fringe Benefit Tax 0.00 11.37 0.00 12.19
Tax adjustment for earlier years (Net) (113.17) (150.83) (102.98) (149.11)
Profit before Minority Interest 1,915.63 2,230.27 4,351.85 348.83
Minority Interest 0.00 0.00 423.70 (171.78)
Share in Profit / (Loss) of Associates (Net) 0.00 0.00 2.68 36.72
Net Profit 1,915.63 2,230.27 3,925.47 483.89
Appropriations:
Debenture Redemption Reserve 0.00 5.00 0.00 5.00
Capital Reserve 0.00 0.00 0.00 1.50
Capital Redemption Reserve 0.00 0.41 0.00 0.41
Special Reserve 0.00 0.00 0.48 0.92
Dividend on Preference Shares 0.00 0.02 0.00 0.02
Dividend Tax on Preference Shares 0.00 0.01 0.00 0.01
Proposed Dividend on Equity Shares 258.32 229.58 259.91 231.16
Tax on Proposed Dividend 42.90 39.02 43.48 39.61
Transfer to General Reserve 1,701.91 1,956.23 1,704.96 1,958.55
Dividend
Your Directors have recommended a dividend
of Rs.1.35 per share i.e. @135% per equity
share for the financial year ended
March 31, 2010 amounting to Rs.258.32 crore.
Together with the Corporate Dividend Tax of
Rs. 42.90 crore, the total payout works out to
Rs. 301.22 crore.

DIR
EC
TO
RS’ REPO
RT
DIRECTORS’ REPORT TO THE SHAREHOLDERS
[49]
Supe r Power i n Premium Me ta l s
Growth plans underway in Aluminium
Your Company is aggressively pursuing various brownfield and greenfield growth opportunities in
Aluminium as described below:
Project Commissioning
Hirakud Smelter
155 KTPA to 161 KTPA Q2FY11
161 KTPA to 213 KTPA Q4FY12
Flat Rolled Products at Hirakud Q2FY12
Utkal Alumina Project Q2FY12
Mahan Aluminium Project Q2FY12
Aditya Aluminium Project Q3FY12
Aditya Refinery Project Q1FY14
Jharkhand Aluminium Project Q1FY14
Further to the above, the smelting capacity at
Hirakud is intended to be expanded from the
proposed 213 KTPA to 360 KTPA with
corresponding increase in back-up captive
power from proposed 467.5 MW to 967.5 MW.
The Company undertakes to appropriately
finance the project.
To debottleneck and increase capacity, primarily
in South America and Asia, Novelis has
increased its capital expenditure plan by
approximately USD 150 Million or 148 per cent
for fiscal 2011 compared to the previous year.
A significant amount is aimed at expanding its
rolling operations in Brazil. This investment will
increase capacity by over 50 per cent and better
support the increasing demand for flat rolled
products in the region. The expansion is
expected to be completed by late 2012.
The details of the projects are covered in greater
detail as the part of Management Discussion
and Analysis section.
Finance
The Authorised Capital of the Company has
increased from Rs. 200.00 crore to Rs. 215.00
crore by way of increase of 15,00,00,000 equity
shares of Re. 1 each pursuant to a resolution
passed at the Annual general meeting held on
18 September, 2009.
Upon allotment of 213,147,391 equity shares
of Re 1 each at a premium of Rs 129.90 through
Qualified Institutions Placement (QIP) on
1st December, 2009, paid-up capital of the
Company has increased by Rs. 21.31 crore.
The total amount received against QIP is
Rs. 2,790.10 crore. Out of this amount
Rs. 396 crore has been spent for various
ongoing projects (including issue related
expenses) till 31st March, 2010 and the balance
amount has been invested temporarily in mutual
funds.
Consolidated Financial Statements
In accordance with Accounting Standards
AS-21 on Consolidated Financial Statements
read with Accounting Standard 23 on
Accounting for investments in Associates and
AS-27 on Financial Reporting of Interest in Joint
Ventures, the audited Consolidated Financial
Statements are provided in the Annual Report.
Management Discussion and Analysis Report
The Management Discussion and Analysis Report
forming part of Directors’ Report for the year
under review, as stipulated under Clause 49 of
the Listing Agreement with the Stock Exchange(s),
forms part of Annual Report. The report provides
strategic direction and a more detailed analysis
on the performance of individual businesses and
their outlook.
Corporate Governance
Your Directors reaffirm their commitment to the
corporate governance standards as prescribed
by The Securities and Exchange Board of India
(SEBI). A separate section on Corporate

DIR
EC
TO
RS’ REPO
RT
DIRECTORS’ REPORT TO THE SHAREHOLDERS
[50]
Supe r Power i n Premium Me ta l s
Governance together with a certificate from the
Auditors of the Company regarding full
compliance of conditions of Corporate
Governance as stipulated under Clause 49 of
the Listing Agreement with the Stock Exchange(s)
forms part of Annual Report.
Directors’ Responsibility Statement
Your Directors affirm that the audited accounts
containing financial statements for the financial
year 2009-10 are in full conformity with the
requirements of the Companies Act, 1956. They
believe that the financial statements reflect fairly,
the form and substance of transactions carried
out during the year and reasonably present the
Company’s financial condition and results of
operations. These statements were audited
by the statutory auditors of the Company,
M/s. Singhi & Co., Chartered Accountants.
Your Directors further confirm that:
1) In the presentation of the Annual Accounts,
applicable Accounting Standards have been
followed. However, the deviation from the
Accounting Standard has been caried out
with reference to the Scheme of
arrangement, approved by the court for the
purpose of preparing Consolidated Financial
Statements. Refer Notes on Accounts for
details of the same.
2) That the accounting policies are consistently
applied and reasonable, prudent judgment
and estimates are made so as to give a
true and fair view of the state of affairs of
the Company at the end of the Financial
Year.
3) The Directors have taken proper and
sufficient care for the maintenance of
adequate accounting records in accordance
with the provisions of the Act for
safeguarding the assets of the Company and
for preventing and detecting fraud and other
irregularities.
4) The Directors have prepared the Annual
Accounts on a going-concern basis.
Your Company’s Internal Auditors have
conducted periodic audits to provide
reasonable assurance that established
policies and procedures have been followed.
Subsidiaries/ Joint Venture
A wholly-owned subsidiary by the name Mauda
Energy Limited has been incorporated on
5th October 2009 for generation of power to
be used captively.
In terms of the facility agreement for foreign
currency borrowing of US$ 981.80 Million
availed by A V Minerals (Netherlands) B.V., a
wholly owned subsidiary, the Company has
entered into a deed of pledge of registered
shares in A V Minerals (Netherlands) B.V. in
favour of HSBC Bank USA, N.A. as pledgee.
Novelis
Shipments of aluminium rolled products totalled
2,708 kilotonne for fiscal 2010, a decrease of
two percent compared to shipments of 2,770
kilotonne in the previous year, driven by softer
end-market conditions in most of the regions
during the first half of the year.
Net sales for fiscal 2010 were USD 8.7 Billion;
a decrease of 15 per cent compared to the
USD 10.2 Billion reported in the same period a
year ago, a result of lower aluminium prices
and softness in the Company’s end-markets in
the first half of the year.
Adjusted EBITDA for the year was a record
USD 754 Million, representing a 55 per cent
increase from adjusted EBITDA of USD 486
Million posted for the same period a year ago.
These record operating results were primarily
due to the Company’s focus on cost reductions
and restructuring initiatives.
Aditya Birla Minerals
Aditya Birla Minerals Limited, the Australian
subsidiary, reported profit after tax of AUD 61.4
Million as against a loss of AUD 76.0 Million
in the previous year. Sustained cost management
resulted in turnaround in financial performance.
Lower production was mainly due to loss of
production of copper in concentrate at Mt.
Gordon and cathode production at Nifty oxide
operations which were put under care and
maintenance as a management decision. The
drop in overall production was partly off-set by
13.8% increase in Nifty’s production of copper
in concentrate.
FY10 FY09
Copper Production (MT) 57,093 70,111
EBIT (AUD ‘000) 93,259 (103,605)
PAT (AUD ‘000) 61,440 (76,019)
The performance of the subsidiaries is covered
elsewhere in this Annual Report.

DIR
EC
TO
RS’ REPO
RT
DIRECTORS’ REPORT TO THE SHAREHOLDERS
[51]
Supe r Power i n Premium Me ta l s
Your Company has applied to the Central
Government for grant of an exemption to your
Company under Section 212(8) of the
Companies Act, 1956, from attaching a copy
of the Balance Sheet, Profit and Loss Account,
Report of the Board of Directors and the Report
of the Auditors to all the Subsidiary Companies.
Subject to receipt of the approval, aforesaid
documents are not being attached with the
financial statements of your Company. These
documents can be requested by any member,
investor of the company / subsidiary company.
Further, in line with the Listing Agreement and
in accordance with the Accounting Standard
21 (AS-21), Consolidated Financial Statements
prepared by the Company include financial
information of its subsidiaries.
Employee Stock Option Scheme
The shareholders of the Company has approved
an Employee Stock Option Scheme (“ESOS
2006”), formulated by the Company, under
which the Company may issue 3,475,000
options to its permanent employees in the
management cadre, in one or more tranches,
whether working in India or out of India,
including the Whole Time Directors of the
Company. Each option when exercised would
be converted into one fully paid-up equity share
of Re. 1/- each of the Company. The ESOS
2006 is administered by the Compensation
Committee of the Board of Directors of the
Company (“the Committee”). Under the ESOS
2006, the Committee has granted 2,973,390
options to its eligible employees in two tranches.
Disclosure pursuant to the provisions of the
Securities and Exchange Board of India
(Employee Stock Option Scheme) Guidelines,
1999 is given in Annexure –A.
Particulars as per Section 217 of the
Companies Act, 1956
The information relating to the conservation of
Energy, Technology Absorption and Foreign
Exchange Earnings and Outgo required under
Section 217 (1)(e) of the Companies Act, 1956,
is set out in a separate statement attached to
this report (Annexure B).
In accordance with the provisions of sections
217 (2A), read with the Companies (Particulars
of Employees) Rules, 1975, the names and
other particulars of employees are to be set
out in the directors’ report, as an addendum
thereto. However, as per the provisions of
Section 219 (1) (b)(iv) of the Companies Act,
1956, the report and accounts, as therein set
out, are being sent to all members of the
company excluding the aforesaid information
about employees. Any member, who is interested
in obtaining such particulars about employees,
may write to the Company Secretary at the
Registered Office of the company.
Fixed Deposits
Your Company was accepting Fixed Deposits
from the Employees. Acceptance of such fixed
deposits has been discontinued from
FY 2009-10. The total outstanding deposits are
Rs. 0.33 crore as at 31st March, 2010.
Directors
In accordance with Article 146 of the Articles of
Association of the Company, Mr. Kumar
Mangalam Birla, Mr. E.B. Desai and Mr. A.K.
Agarwala retire from office by rotation, and being
eligible, offer themselves for reappointment.
Awards & Recognitions
Several accolades have been conferred upon
your Company, in recognition of its contribution
in diverse fields. A selective list:
1. Renukoot unit was awarded the Greentech
Safety Gold Award 2009 for Occupational
Health and Safety Management and the
Greentech Environment Gold Award 2009
for environmental excellence, in the Mining
and Metal Sector, presented by Greentech
Foundation, New Delhi.
2. Renukoot unit was awarded the prestigious
“Golden Peacock National Quality Award
– 2010”.
3. Amity International Business School
conferred on Renukoot unit the “Amity
Corporate Excellence Award” for its notable
initiatives in Corporate Social Responsibility.
4. Institute of Engineers (India) awarded
Renukoot unit with the “Safety Innovation
Award-2009” in the metals sector for its
exemplary initiatives in Occupational Health
and Safety.
5. Renusagar Power Division was awarded the
“Golden Peacock Environment Management
Award 2009”.
6. Renusagar Power Division received the “Rajiv
Gandhi National Quality Award 2008,’’
Commendation Certificate presented by the
Bureau of Indian Standard (BIS).

DIR
EC
TO
RS’ REPO
RT
DIRECTORS’ REPORT TO THE SHAREHOLDERS
[52]
Supe r Power i n Premium Me ta l s
7. Renusagar Power Unit was awarded the
“Greentech Environment Excellence Gold
Award 2009,” in Thermal Power Plant
Category, by Greentech Foundation, New
Delhi.
8. CII has conferred the “Energy Efficient Unit”
award to Renusagar Power Division during
the “10th
National Awards for Excellence in
Energy Management-2009”.
9. Hirakud Smelter unit was awarded the
National Energy Conservation Award 2009,
ranking first in the Aluminium Sector.
10. Hirakud Smelter unit awarded the Greentech
Safety Silver Award 2009 for Occupational
Health and Safety Management presented
by GreenTech Foundation, New Delhi.
11. Hirakud Power Unit was globally recognised
as one of the top six power plants for its
environment friendly operations by the
POWER Magazine.
12. Hirakud Power Unit was awarded the
Greentech Environment Gold Award 2009
for best environment management and
practices, and the Greentech Safety Silver
Award 2009, by Greentech Foundation,
New Delhi.
13. Your Company’s Mines earned awards in
Environment, Safety, Mining Practices during
the Mines Safety Week and Mineral
Conservation Week programmes at regional
levels.
14. Birla Copper Dahej was awarded the
Greentech Environment Gold Award for its
exemplary environmental practices and
performance and the Greentech Safety Silver
Award, presented by Greentech Foundation,
New Delhi.
Environment Protection and Pollution
Control
Your Company is committed to sustainable
development. Your Company is a signatory to
the Global Compact and subscribes to the
principle of triple-bottom line accountability.
A separate chapter in this report deals at length
with your Company’s initiatives and commitment
to environment conservation.
Auditors
The observations made in the Auditors’ Report
are self-explanatory and do not call for any
further comments under Section 217 (3) of the
Companies Act, 1956.
M/s. Singhi & Company, Chartered Accountants
and Auditors of the Company, retire, and being
eligible, offer themselves for appointment.
Human Resource Development
Your Company continuously strives to foster a
culture of high performance. Your Management
has infused a lot of rigor and intensity in its
people development processes and in honing
skill sets. Its HR processes are absolutely aligned
to organizational goals. The implementation of
People Soft HRMS (Human Resource
Management System), the variable pay plan and
job bands have been institutionalized.
Ongoing learning, refreshing HR systems in line
with global benchmarks, aligning rewards and
recognition with performance, have enabled
your Company sustain its reputation of a
meritocratic organization. The Group’s
Corporate Human Resources function has played
and continues to play an integral role in your
Company’s Talent Management Processes.
Appreciation
Your Directors place on record their sincere
appreciation for the assistance and guidance
provided by the Honorable Ministers, Secretaries
and other officials of the Ministry of Mines,
Ministry of Coal, the Ministry of Chemicals and
Fertilizers and various State Governments. Your
Directors thank the Financial Institutions and
Banks associated with your Company for their
support as well.
Your Company’s employees are instrumental in
your Company scaling new heights, year after
year. Their commitment and contribution is
deeply acknowledged.
Your involvement as Shareholders is greatly
valued. Your Directors look forward to your
continuing support.
For and on behalf of the Board
Mumbai
Dated the 4th Day of June, 2010 Chairman

DIR
EC
TO
RS’ REPO
RT
DIRECTORS’ REPORT TO THE SHAREHOLDERS
[53]
Supe r Power i n Premium Me ta l s
ANNEXURE ‘A’ TO THE DIRECTORS’ REPORT
Disclosure pursuant to the provisions of the Securities and Exchange Board of India (Employee
Stock Option Scheme) Guidelines, 1999
Nature of Disclosure Particulars
a) Options Granted 2,973,390
b) The pricing Formula Tranche I
The exercise price was determined by averaging the daily
closing price of the Company’s equity shares during 7
days immediately preceding the date of grant and
discounting it by 30%. (Exercise price- Rs. 98.30 per
option).
Tranche -II
The exercise price was the closing market price, prior to
the date of grant. (Exercise price - Rs. 150.10 per option).
c) Options vested/Exercisable as at 958,270
31st March 2010
d) Options Exercised during the year 44,244
e) The total number of shares arising
as a result of exercise of options 44,244
f) Options Lapsed Nil
g) Variation in terms of options Nil
h) Money realised on exercise of options Rs. 4,349,185
i) Total number of options in force 2,028,555
j) Employee-wise details of options granted:
i) Senior Managerial Personnel: Mr. D. Bhattacharya – 9,70,100
ii) Any other employee who received
a grant in any one year of option
amounting to 5% or more of options
granted during that year Nil
iii) Identified employees who were
granted option during any one year,
equal to or exceeding 1% of the
issued capital (excluding outstanding
warrants and conversions) of the
company at the time of grant Nil
k) Diluted Earnings per share NA
l) Difference between the employee
compensation cost computed using
intrinsic value of the stock options, and
the employee compensation cost that
shall have been recognised, if the fair
value of the options was used. Rs. 1.84 crore

DIR
EC
TO
RS’ REPO
RT
DIRECTORS’ REPORT TO THE SHAREHOLDERS
[54]
Supe r Power i n Premium Me ta l s
The impact of this difference on profits The effect of adopting the fair value on the net income
and on EPS of the company and earnings per share for 2009-10 is as presented below
Particulars Rs. In Crore
Particulars 2009-10
Net Profit as Reported 1,915.63
Less: Dividend on Preference Shares (including Tax) 0.00
Net Profit attributable to Equity Shareholders 1,915.63
Add: Compensation cost under ESOS as per intrinsic
value included in the Net Profit 1.00
Less: Compensation cost under ESOS as per fair value -2.84
Proforma Net Profit 1,913.79
Less: Tax adjustment for earlier years -113.17
Proforma Net Profit before Tax adjustment for
earlier years 1,800.62
Weighted average number of Basic
Equity Shares outstanding 1,770,939,077
Weighted average number of Diluted
Equity Shares outstanding 1,771,286,354
Face value of Equity Shares (in Re.) 1
Reported Earning per Share (EPS):
Basic EPS (in Rs.) 10.82
Diluted EPS (in Rs.) 10.81
Basic EPS before Tax adjustment for earlier years (in Rs.) 10.18
Diluted EPS before Tax adjustment for earlier years (in Rs.) 10.18
Proforma Earning per Share (EPS):
Basic EPS (in Rs.) 10.81
Diluted EPS (in Rs.) 10.80
Basic EPS before Tax adjustment for earlier years (in Rs.) 10.17
Diluted EPS before Tax adjustment for earlier years (in Rs.) 10.17
m) i) Weighted-average exercise prices and Options granted under Tranche II
weighted average fair values of options Weighted average exercise price (Rs.) 150.10
whose exercise price equals the market Weighted average fair value (Rs.): 57.11
price of the stock
ii) Weighted-average exercise prices and Options granted under Tranche -I
weighted average fair values of options Weighted average exercise price (Rs.) 98.30
whose exercise price is less than the Weighted average fair value (Rs.): 65.78
market price of the stock
iii) Weighted-average exercise prices and
weighted average fair values of options
whose exercise price exceeds the
market price of the stock
n) A description of method and significant
assumptions used during the year to
estimate the fair values of options, including
the following weighted average information:
i) Risk free Interest rate (%) 8
ii) Expected life (No. of Years) 5
iii) Expected volatility (%) Tranche I 34%
Tranche -II 37%
iv) Dividend yield (%) 170
v) The price of the underlying shares in Tranche I Rs. 138.95
the market at the time of option grant Tranche -II Rs. 150.10
ANNEXURE ‘A’ TO THE DIRECTORS’ REPORT (Contd.)

[55]
DIREC
TO
RS’ REPO
RT
Supe r Power i n Premium Me ta l s
[Statement of particulars under the Companies (Disclosure of particulars in the Report of the Board of
Directors) Rules, 1988]
A. CONSERVATION OF ENERGY
Energy plays a key role in achieving the goals of sustainable development. Increasing access to energy
and enhanced energy efficiency is important for our development. Our own policy of appreciating the
importance of Energy Conservation for sustainable development is by way of promotion of energy
efficiency. In an unending endeavor & strong commitment to improve the Energy efficiency and capacity
utilization, we are continuously working towards reduction in cost of production. The Company has a
well-defined Energy Policy, which is meticulously adhered to across all the establishments of the company
in the country. Every unit of your Company has trained professionals to implement this policy. The
Company has a well-defined Energy Management Organization structure, with a Bottom Up & Top
Down approach. It acts as a catalyst towards its continuous journey for excellence in energy conservation.
Involvement of all employees right from workmen level to the top executive is ensured through walk
through & detailed energy audits, quality circles, WCM committees and suggestion scheme. To inculcate
awareness on the importance of Energy conservation, Your Company as corporate entity, focuses not
only on employees of company but also the society.
The Company has a dedicated & well established Energy Cell having prime objective of minimizing energy
consumption, putting consistent efforts for optimizing operating process parameters and modernizing /
upgrading technology for increasing energy efficiency throughout the organization. Employees are
encouraged to give suggestions and get involved in Energy Conservation initiatives & suggestions with
significant merit are suitably rewarded under the well established reward & recognition system.
Company’s efforts in Energy Conservation have been consistently recognized over the years by the
competent authorities. Hirakud unit of your Company’s Aluminium business have been recently awarded
the “Top Rank Award” in the “National Awards for Energy Conservation” instituted by the Ministry of
Power, Government of India for the year 2009.
a. ENERGY CONSERVATION MEASURES TAKEN
GENERAL MEASURES
i. Optimization of colony power voltage to save power.
ii. Rationalization of luminary’s wattage.
iii. Modification in lighting circuit for ON/OFF control of lights.
iv. Interlocking of Cooling Towers fan motor through temperature switch.
v. Conversion of connection from delta to star for under loaded motors.
vi. Installation of capacitor banks to improve power factor.
vii. Installation of small PLC logo in office AC system to avoid idle running.
viii. Motor HP rationalization.
ix. Installation of transparent sheets in roof to utilize the natural light.
x. Interlocking of auxiliary equipments with main equipment.
xi. Regular monitoring and cleaning of waste heat recovery system.
xii. Regular walkthrough audit of Steam and compressed air lines to avoid the losses.
xiii. Regular monitoring and benchmarking of Energy Intensive equipment.
xiv. Optimization of transformer loading.
xv. Optimization of AC unit running time as well as temp setting.
xvi. Energy audit from external agencies.
xvii. Installation of efficient luminaries.
xviii.Optimum utilization of Energy through process redesigning as well as employment of equipment
that offers improved energy efficiency.
xix. Installation of door limit switches in MCC rooms.
ANNEXURE ‘B’ TO THE DIRECTORS’ REPORT

[56]
DIREC
TO
RS’ REPO
RT
Supe r Power i n Premium Me ta l s
1. ALUMINA PLANT:
i. Installation of VFD for PD Overflow re-circulation pump # 1.
ii. Energy efficient double digestion technology in place of high temperature Digestion technology.
iii. Installation of DSM screen to increase output of Ball mill # 4 & 8 thus reducing the specific
power consumption.
iv. Installation of energy efficient falling film evaporation unit # 4.
v. Introduction of additive in acid cleaning of liquor heaters to improve heat transfer co-efficient.
vi. Provision of additional chemical cleaning facilities for parallel cleaning of slurry heaters of
digestion I & II units.
vii. Upgradation of Liquor-A & T-6 mud washers underflow pipelines together with replacement of
Motors and incorporation of VFD.
viii. Installation of temperature switches in cooling towers to optimize the fan running hours.
ix. Modified the impeller of ISC cold well pump and use lower HP hot well pump to meet out the
reduced flow requirement during winter.
x. Re-routing of DS tank slurry transfer line to eliminate the use of transfer pump.
xi. Modification in lighting circuits of different areas to optimize the lighting load and ON time.
2. SMELTER:
i. Optimization of DSS fan flow to reduce specific power consumption.
ii. Installation of VFD operated screw compressor.
iii. Installation of Harmonic filter at Rectifier station #2.
iv. Welding of Anode bus bar and riser bus bar bolted joints for reduction in DC voltage drops.
v. Modification in discharge circuits of air slides fans to optimize of running number of fans.
vi. Optimization of lifting height of primary air lifts of Pot line # 9 to 11 DSS to save power.
vii. Optimization of compressed air header pressure of point feeder & DSS line to save power.
viii. Modification in suction line of reciprocating compressors to increase its efficiency.
ix. Installation of VFD for ventilation fans of Pot line # 7 to 11.
x. Minimizing the load of the equipment by modifying the control philosophy in PLC in Pot line 9
to 11 Air lift blower.
xi. Better utilization of Induction furnace to save power.
xii. Modification in ducting system of Paste Plant Bag houses to optimize the loading.
xiii. Reduced pot voltage through process optimization to reduce specific energy consumption of
smelter.
xiv. Modification in water circuit of AC System of Rectifier Plant # 2 control room to stop the
running of water pump.
xv. Commissioning of one 90 MVA high energy efficient transformer in place of old low efficiency
transformer.
xvi. Better utilization of 132 KV standby higher efficient Rectifier for feeding the load of Pot line # 3.
xvii. Switching off cooling fan of Pot line # 1 Rectifier Unit as and when required.
xviii. Reduction in yoke to carbon drops of anode.
3. FABRICATION PLANT:
i. Revamping of one Properzi Furnace to improve its efficiency.
ii. Installation of off delay timer in hydraulic pump motors of blue cut Star CTL and Caster Unit
to avoid the idle running.
iii. Interlocking of LNP motor to avoid idle running.
iv. Reduction in running time of cooling fan motors of Extrusion Press # 3, 5 & 6.
ANNEXURE ‘B’ TO THE DIRECTORS’ REPORT
[57]
DIREC
TO
RS’ REPO
RT
Supe r Power i n Premium Me ta l s
v. Automatic switching off of 90 TR AC compressor unit based on temperature.
vi. Optimization of Homogenizing of AA 3003 DDQ cycles to save energy.
vii. Optimization of Annealing practices to reduce power consumption.
viii. Installation of VFDs in Casting Plant, Extrusion Press and Rolling Mill Coolant filter.
ix. Reduction in number cold rolling passes through modification in AA 3105 coils.
x. Elimination of one stress relieving cycle by process modification in AA 5052 rolled coils.
xi. Clubbing of process to increase the productivity of furnaces.
xii. Optimization of partial annealing cycles to reduce the cycle time.
xiii. Conversion of H32 temper into H22 temper to save energy.
xiv. Re – insulation of Pre heater of Furnace # 2 & 3.
4. POWER PLANTS / CO-GENERATIONS:
i. Installation of VFD in FD Fans of Boiler # 3 of Co-Generation unit and AC Unit # 2.
ii. Reduction in Boiler # 3 Feed pump rotor stage to reduce auxiliary power consumption of Co-
Generation unit.
iii. Fuel substitution from HSD to FO in Boilers to reduce cost of Co-Generation Unit and
Captive Power Plant.
iv. Trimming of CW pump impeller of TG # 4, 6 & 7 to save auxiliary power at Captive Power
Plant.
v. Installation of additional APH baskets in Spare Boiler of Captive Power plant to increase its
efficiency.
vi. Operation of single FD Fan instead of two in 9 Boilers of Captive Power Plant to reduce
auxiliary power.
vii. Modification in LDAD system for ash slurry discharging at lower elevation resulted stoppage of
350 kW Pump.
viii. Increase in chilled water temperature of administrative building air conditioner of Captive
Power Plant to reduce power consumption.
ix. Modification Raw water header of CHP area & ESP area to eliminate pump running.
x. Conversion of connection from delta to star in coal feeder motors of Captive Power.
xi. Stage removal of recovery water pump impeller at Bichhari.
xii. Installation of SS liner in Boiler # 4 bunker at Captive Power Plant to avoid coal flow
interruption.
xiii. Installation of Fluid Coupling in Boiler feed Pump-A of Unit # 1.
5. FOIL DIVISION:
i. Optimization of the frequency of VFD at Fume Exhaust fan at Mill M50.
ii. Modified and rerouted the power cable to shut off the 4 nos. of HT transformers to save its no
load losses.
iii. Optimization of annealing practices to reduce power.
6. COPPER DIVISION:
i. Replacement of SA and PU fans of HT motor by LT Motor.
ii. Installation of variable frequency drive for Boiler-1,3 & 4 and PAP.
iii. Installation of MV Drive in PA fan HT motor in Boiler no. 3.
iv. VFD installation in combined cooling tower fan in Smelter-1.
v. Installation of HT capacitor bank to improve the power factor.
vi. Replacement of conventional light with CFL.
ANNEXURE ‘B’ TO THE DIRECTORS’ REPORT
[58]
DIREC
TO
RS’ REPO
RT
Supe r Power i n Premium Me ta l s
b. ADDITIONAL INVESTMENT AND PROPOSALS BEING IMPLEMENTED
1. ALUMINA PLANT:
i. Installation of VAM unit utilizing waste heat stream of Calciner fluxo cooler.
ii. Up-gradation of ISC cooling tower.
iii. Installation of energy efficient pumps in place of Old inefficient pumps and VFDs in 13 B
Evaporators.
iv. Installation of additional heater in Evaporation # 1 to increase availability for effective
cooling cleaning.
v. Installation of VFD for Evaporation Unit # 3 feed pump, PT feed area slurry disposal pump &
PD overflow re-circulation pump # 2.
vi. Installation of voltage regulating transformer in lighting circuit.
vii. Installation of level control switches in sump pits to avoid idle running sump pumps.
viii. Installation of door limit switches in lighting circuit of control rooms.
ix. Bokela modification on drum filter no.- 2.
x. Revamping of IBSH with addition of 5th Set.
xi. Installation of VFDs in Primary, secondary Air fans, Rotary vane feeder, Air Slide Fan, compressor
and Cooling tower.
2. SMELTER:
i. Arrangement of water showers at the roof of cooling chamber of Billet Casting.
ii. Replacement of Baking Furnace ID Fan with energy efficient fan.
iii. Modification in insulation of Metal transfer Cruce to reduce the heat loss.
iv. Improvement in Coefficient of Performance of Air Conditioners.
v. Installation of temperature sensor in Induction furnace.
vi. Replacements of chain drive system of conveyor # 21 of Rodding shop with gravity roller
conveyor.
vii. Installation of thermostatic controller to optimize the running of cooling Tower fans.
viii. Installations of MV drive in DSS main Fan.
ix. Capacity enhancement of bath crushing plant.
x. Redesign of ID Fan impeller of Pot line # 7.
xi. Redesign of Bag houses of Pot line # 5 & 6.
xii. Provide pressure regulator in tapping air to reduce the compressed air consumption.
xiii. Modification in pulley ratio of alumina transfer system ID fan at TT -2.
xiv. Introduction of stepped cathode technology for reducing energy consumption in smelter.
xv. Replacement of reciprocating compressors by centrifugal compressors and inefficient Rectiformers
& transformers.
xvi. Reduction in DC voltage drop in Cathode bar and Anode by using cast iron pouring and Yoke
to carbon drop respectively.
3. FABRICATION PLANT:
i. Introduction of longer carbon chain additive to take higher reduction thereby reduction in
number of cold rolling passes.
ii. Optimization of Homogenizing cycles to reduce energy consumption at Hot Mill.
iii. Installation of VFD in reciprocating compressor.
iv. Installation of photo switches to control the on time of Street lights.
v. Installation of small PLCs (Logo) to control the running of Office ACs.
ANNEXURE ‘B’ TO THE DIRECTORS’ REPORT

[59]
DIREC
TO
RS’ REPO
RT
Supe r Power i n Premium Me ta l s
vi. Replacement of 24 nos inefficient motors with efficient motors of Hot Mill and Annealing
Furnaces.
vii. Re – insulation of Annealing furnaces.
viii. To install VFDs in Soaking Pit # 4 and Rolling Mill auxiliary.
ix. To install re – generative burners in Remelting Furnace.
x. To replace inefficient AC with more efficient Air Conditioner.
xi. Replacement of convectional lighting with CFL.
4. POWER PLANTS / CO-GENERATION UNITS:
i. Modification in heat recovery system of Boiler # 1 & 3 of Co-Generation Unit to improve its
efficiency.
ii. Removal of feed pump rotor stage of Boiler # 4 of Co-Generation unit to reduce auxiliary
power consumption.
iii. Installation of VFD in FD Fans of Boiler # 3.
iv. Modification of Boiler Feed pumps to reduce auxiliary power consumption.
v. Heat recovery from Boiler # 3 flue gas.
vi. Installation of additional APH Basket in Boiler 5 to 8 & spare Boiler to improve Boiler
efficiency.
vii. Up-gradation of Motor capacity of Boiler # 4 PA Fan at Co-Generation Unit to make system
run on one Fan.
viii. Installation of coal dust extraction system to reduce the coal dust losses at Co-Generation
Unit.
ix. Installation of additional APH baskets in Boiler # 5 to 8 of Captive Power plant to increase its
efficiency.
x. Installation of additional economizer coil in Spare Boiler to increase its efficiency.
xi. Resizing of Boiler Feed pump impeller of TG # 1, 2 & 8 at Captive Power Plant to reduce the
auxiliary power consumption.
xii. Installation of VFD in CEP of TG # 3 to 5 to reduce auxiliary power consumption at Captive
Power Plant.
xiii. Installation of refrigerated air drier in series with existing heatless type instrument air driers in
unit # 9 & 10 at Captive Power Plant.
xiv. Installation of VFD in two numbers of PA fan of one of the boilers in Unit 3 and cooling Tower
# 2 & 3.
5. FOIL DIVISION:
i. Installation of one new pump in pump house for water supply system of the plant.
ii. To provide the infrastructure required for wheeling of power by installing and commissioning
the CT, PT and ABT metering system of 0.2 class of accuracy.
iii. Installation of VFD s in Rolling Mill, Coater & Laminator.
iv. Replacement of old plant & street Lighting with Energy efficient lighting system.
6. COPPER DIVISION:
i. To install variable frequency drives in more Energy intensive equipments.
ii. Replacement of conventional light with CFL in the plant.
iii. Installation of Capacitor Bank for power factor improvement.
c. IMPACT OF MEASURES IN (a) AND (b) ABOVE
The various Energy Conservation Measures undertaken by your Company have yielded encouraging
results in most production centers. Efforts continue to further optimize energy productivity through
ongoing and planned measures.
ANNEXURE ‘B’ TO THE DIRECTORS’ REPORT
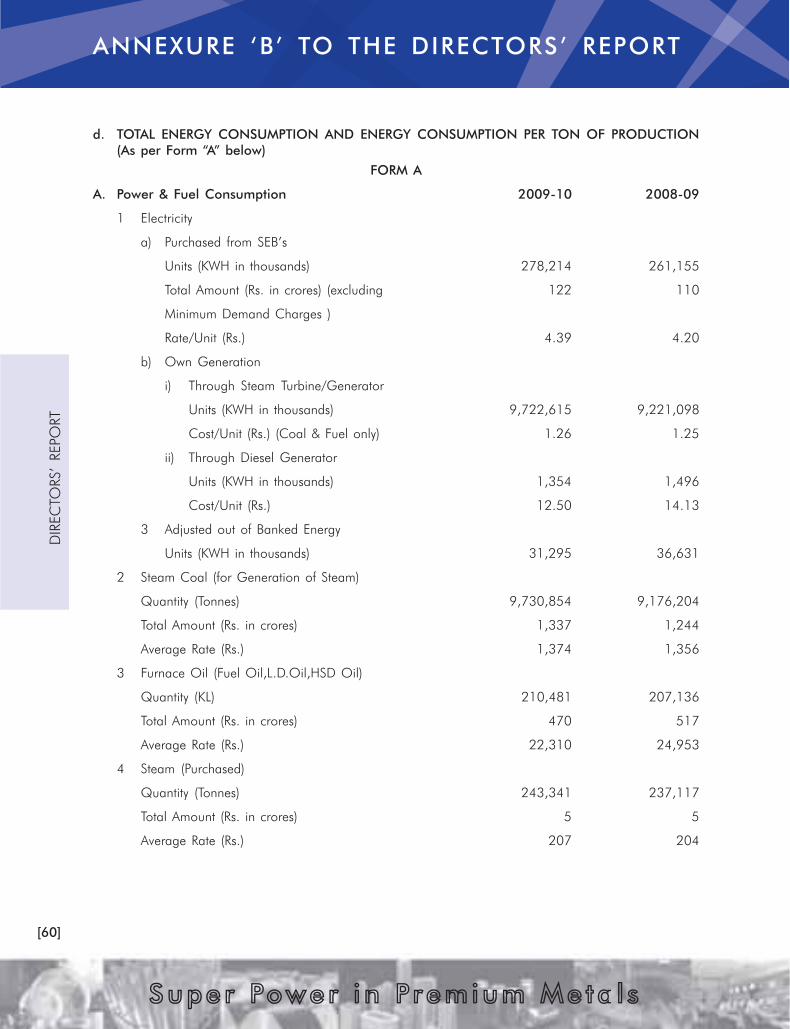
[60]
DIREC
TO
RS’ REPO
RT
Supe r Power i n Premium Me ta l s
d. TOTAL ENERGY CONSUMPTION AND ENERGY CONSUMPTION PER TON OF PRODUCTION
(As per Form “A” below)
FORM A
A. Power & Fuel Consumption 2009-10 2008-09
1 Electricity
a) Purchased from SEB’s
Units (KWH in thousands) 278,214 261,155
Total Amount (Rs. in crores) (excluding 122 110
Minimum Demand Charges )
Rate/Unit (Rs.) 4.39 4.20
b) Own Generation
i) Through Steam Turbine/Generator
Units (KWH in thousands) 9,722,615 9,221,098
Cost/Unit (Rs.) (Coal & Fuel only) 1.26 1.25
ii) Through Diesel Generator
Units (KWH in thousands) 1,354 1,496
Cost/Unit (Rs.) 12.50 14.13
3 Adjusted out of Banked Energy
Units (KWH in thousands) 31,295 36,631
2 Steam Coal (for Generation of Steam)
Quantity (Tonnes) 9,730,854 9,176,204
Total Amount (Rs. in crores) 1,337 1,244
Average Rate (Rs.) 1,374 1,356
3 Furnace Oil (Fuel Oil,L.D.Oil,HSD Oil)
Quantity (KL) 210,481 207,136
Total Amount (Rs. in crores) 470 517
Average Rate (Rs.) 22,310 24,953
4 Steam (Purchased)
Quantity (Tonnes) 243,341 237,117
Total Amount (Rs. in crores) 5 5
Average Rate (Rs.) 207 204
ANNEXURE ‘B’ TO THE DIRECTORS’ REPORT
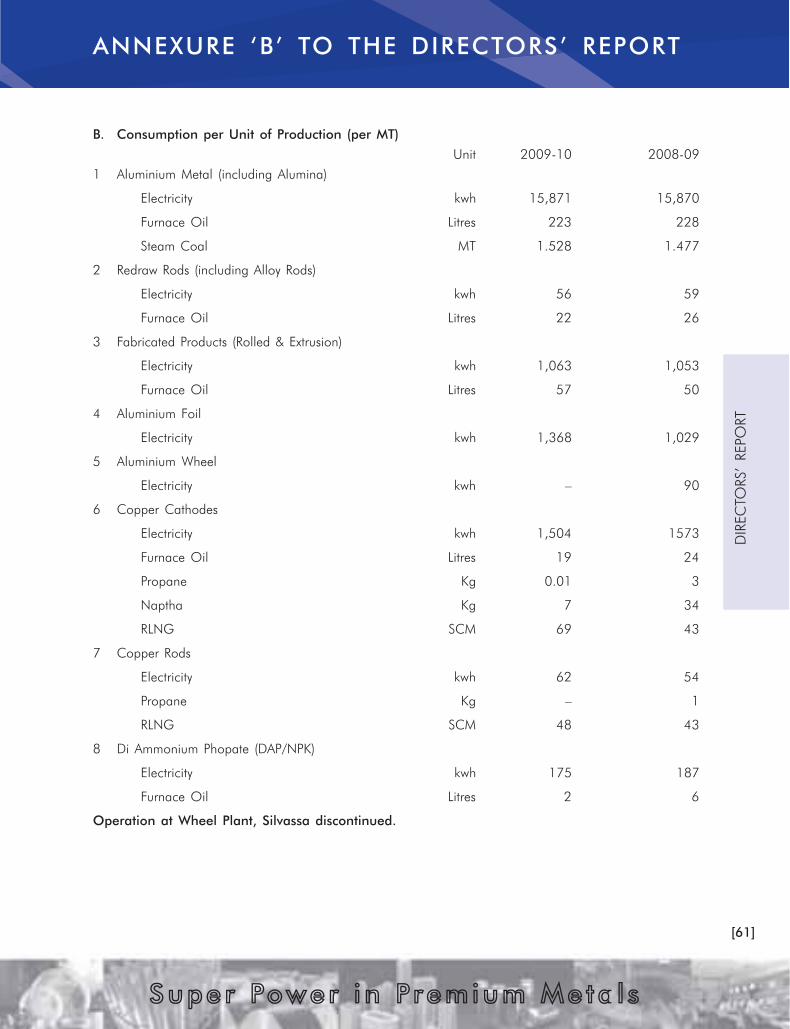
[61]
DIREC
TO
RS’ REPO
RT
Supe r Power i n Premium Me ta l s
B. Consumption per Unit of Production (per MT)
Unit 2009-10 2008-09
1 Aluminium Metal (including Alumina)
Electricity kwh 15,871 15,870
Furnace Oil Litres 223 228
Steam Coal MT 1.528 1.477
2 Redraw Rods (including Alloy Rods)
Electricity kwh 56 59
Furnace Oil Litres 22 26
3 Fabricated Products (Rolled & Extrusion)
Electricity kwh 1,063 1,053
Furnace Oil Litres 57 50
4 Aluminium Foil
Electricity kwh 1,368 1,029
5 Aluminium Wheel
Electricity kwh – 90
6 Copper Cathodes
Electricity kwh 1,504 1573
Furnace Oil Litres 19 24
Propane Kg 0.01 3
Naptha Kg 7 34
RLNG SCM 69 43
7 Copper Rods
Electricity kwh 62 54
Propane Kg – 1
RLNG SCM 48 43
8 Di Ammonium Phopate (DAP/NPK)
Electricity kwh 175 187
Furnace Oil Litres 2 6
Operation at Wheel Plant, Silvassa discontinued.
ANNEXURE ‘B’ TO THE DIRECTORS’ REPORT

[62]
DIREC
TO
RS’ REPO
RT
Supe r Power i n Premium Me ta l s
A. ALUMINIUM BUSINESS
1. Specific Areas in which R&D has been carried out
• Development of High Grade Lithographic Sheet, High Pressure Gas Cylinder application,
Composite Panel Stock material, Foil Stock Coils and Finstock.
• Development of indigenous hydrophilic coating for Fin-stock.
• Optimization of packing methods across foil business.
• Argon gas was used to see effect of materials in cast structures in order to avoid homogenizing
process from production cycle.
• Casting practice was modified to suit production of High Strength - Low Cost aluminium
specially for defence, ordinance and auto sector product segment.
• Study on recovery of precious metals from Red Mud was undertaken.
• Process development for the reduction of silica content from high-silica bauxite ores.
• Process development for the production of special grade alumina for catalyst application,
Special refractory and ceramic grades.
• Process trials for with anti-scaling additives, coating for chimney, calciner exit duct and related
high corrosion prone areas was carried out to improve process efficiency and elongation of
service life.
• Efforts were made to create value from waste generated from plant operations and utilizing it in
production chain to minimize cost of inputs for metal production.
• Material development work using special liner to improve slidability of alumina powder on
each pots feedbox.
• Welding of cast iron grade valve bodies, pressure vessel of extrusion press was examined and
tested for its soundness and health subsequent to repair.
• Vendor development and capability study was undertaken for procurement of Tension Leveler
Rolls with indigenous source.
• Roll failure analysis study was undertaken in collaboration with external stress analysis service
providers ANSYS, Roll Designers and Manufacturers.
• Heat balance studies on Baking furnace to reduce oil consumption.
• New Gauging system alongwith MG slitter with new Technology for better process control.
2. Benefits derived as a result of the above R&D
• Continued leadership in all product segments.
• Reduction in operational, energy and resource cost with focus on improving efficiency.
• Increased net running time / availability of production equipment.
• Exploratory identification of potential new businesses and improved customer satisfaction.
• Reduced dependency on imports.
ANNEXURE ‘B’ TO DIRECTORS’ REPORT
TECHNOLOGY ABSORPTION
Efforts made in Technology Absorptions Form “B”
RESEARCH & DEVELOPMENT (R&D)
FORM B
ANNEXURE ‘B’ TO THE DIRECTORS’ REPORT

[63]
DIREC
TO
RS’ REPO
RT
Supe r Power i n Premium Me ta l s
3. Future plan of action
• Exploring new aluminium markets and increasing penetration.
• Continue to identify non-value adding / processes and work for its replacement with value
adding processes.
• Capturing new product specification and looking for its feasibility of its production in existing
facility like foil for pharmaceutical application, high strength low cost aluminium, specialty
aluminas and aluminium products.
• Development of anodes for improved electrical and mechanical properties.
• Development of lubricants and oil testing methods for casting operations.
• Roll bending and roll coolant system improvement for customer delight.
B. COPPER BUSINESS
1. Specific areas in which R&D has been carried out
• Improvement in uptime of Cu-1 WHB in smelter to reduce accretion formation and modification
of slide gate dampers in Cu-1 converter.
• Installation and commissioning of new hammering & rapping system in Cu-1 Smelter and
burner in AF launders of Cu-3 Smelter.
• Reduction in anode weight variation in Cu-3 plant.
• Recovery of Tellurium as Copper Telluride in Refinery.
2. Benefits derived as a result of the above R&D
• New product development.
• Improved plant operation performance, heat recovery, Operational reliability and anode quality.
• Reduction in Converter Blowtime.
• Better life of the water cooled launder and cost saving.
3. Future Plan of action
• Expansion of PMR plant.
• Production of Copper Telluride.
• Development of mineralogical model of Cu-1 Smelter with capability to predict the FSF
performance with different blend.
Expenditure on R & D
(Rs. In Crores)
2009-10 2008-09
a) Capital 2.35 0.86
b) Recurring 5.45 7.73
c) Total (a+b) 7.80 8.59
d) Total R & D Expenditure as % of Total Turnover 0.04% 0.04%
ANNEXURE ‘B’ TO DIRECTORS’ REPORT (Contd.)
ANNEXURE ‘B’ TO THE DIRECTORS’ REPORT

[64]
DIREC
TO
RS’ REPO
RT
Supe r Power i n Premium Me ta l s
Technology Absorption, Adaptation and Innovation
i) Efforts in Brief:
• Imported technologies have been fully absorbed and the plant operations are stabilized.
ii) Benefits derived:
• Improvement in plant production capacities.
• Reduction in overall energy consumption.
• Improvement in product quality and reduction in cost.
• New product development.
• Advancement of basic skill and knowledge.
• Reduction in specific consumption of power/utilities.
• Increased Plant availability/capacity.
• Excellent Environment performance.
iii) Details of technology imported in the past 5 years:
Technology Imported for Year of Has technology If not fully absorbed,
Import been fully areas where this has
absorbed not taken place,
reason thereof and
future plan of action
ALUMINIUM
Clad Sheet manufacturing 2006-07 Yes NA
Improvement in quality and productivity
of brazing sheet 2007-08 Yes NA
High Pressure Double Digestion technology 2007-08 Yes NA
COPPER
Cryogenic air separation for Oxygen IV 2005-06 Yes NA
Cryogenic air separation for Oxygen V 2006-07 Yes NA
Molecular Recognition Technology for
Bismuth Recovery 2008-09 Yes NA
Continuous Cast Rod Plant-II from
SouthWire, USA 2009-10 Yes NA
C. FOREIGN EXCHANGE EARNINGS & OUTGO
a) Activities related to Exports
Exports during the year were Rs. 5,267.58 Crores.
b) Total Foreign Exchange used and earned
Foreign exchange used Rs. 12,213.67 Crores.
Foreign exchange earned Rs. 5,278.64 Crores.
ANNEXURE ‘B’ TO DIRECTORS’ REPORT (Contd.)
ANNEXURE ‘B’ TO THE DIRECTORS’ REPORT
[65]
DIREC
TO
RS’ REPO
RT
Supe r Power i n Premium Me ta l s
Auditor’s Certificate on Corporate Governance
To the Members of Hindalco Industries Limited
We have examined the compliance of the conditions of Corporate Governance by Hindalco Industries
Limited for the year ended 31st March 2010 as stipulated in Clause 49 of the Listing Agreement of the said
Company with the Stock Exchanges in India.
The Compliance of conditions of Corporate Governance is the responsibility of the Management. Our
examination was limited to the procedures and implementation thereof, adopted by the Company for
ensuring the compliance of conditions of Corporate Governance. It is neither an audit nor an expression of
the opinion on the financial statements of the Company.
In our opinion and to the best of our information and explanations given to us, we certify that the Company
has complied with the conditions of Corporate Governance as stipulated in the above mentioned Listing
Agreement.
We further state that such compliance is neither an assurance as to the future viability of the Company nor
the efficiency or effectiveness with which the Management has conducted the affairs of the Company.
Camp : Mumbai For SINGHI & Co.,
Dated : The 4th day of June 2010. Chartered Accountants
Firm Registration No.302049E
(RAJIV SINGHI)
1-B, Old Post Office Street, Partner
Kolkata -700 001 Membership No. 53518

[66]
DIREC
TO
RS’ REPO
RT
Supe r Power i n Premium Me ta l s
Persons constituting group coming within the definition of “group” for the purpose of Regulation 3 (1)(e)(i) of
the Securities and Exchange Board of India (Substantial Acquisition of Shares and Takeovers) Regulations,
1997, include the following :
Shri Kumar Mangalam Birla
Smt. Rajashree Birla
Smt. Neerja Birla
Master Aryaman Vikram Birla
Birla Group Holdings Private Limited
BGH Exim Limited
Birla TMT Holdings Private Limited
Chaturbhuj Enterprises LLP
Essel Mining & Industries Limited
Global Holdings Private Limited
Gwalior Properties And Estates Private Limited
Heritage Housing Finance Limited
IGH Holdings Private Limited
Infocyber India Private Limited
Mangalam Services Limited
Naman Finance And Investment Private Limited
Rajratna Holdings Private Limited
Seshasayee Properties Private Limited
Siddhipriya Enterprises LLP
TGS Investment And Trade Private Limited
Trapti Trading And Investments Private Limited
Turquoise Investments And Finance Private Limited
Umang Commercial Company Limited
Vighnahara Enterprises LLP
Vaibhav Holdings Private Limited

[67]
AU
DITO
RS’ REPO
RT
Supe r Power i n Premium Me ta l s
FINANCIALS

[68]
AU
DITO
RS’ REPO
RT
Supe r Power i n Premium Me ta l s
AUDITORS’ REPORT TO THE SHAREHOLDERS
We have audited the attached balance sheet of HINDALCO INDUSTRIES LIMITED as at 31st
March, 2010
and also the profit and loss account and the cash flow statement for the year ended on that date. These
financial statements are the responsibility of the Company’s management. Our responsibility is to express
an opinion on these financial statements based on our Audit.
We conducted our audit in accordance with auditing standards generally accepted in India. Those
standards require that we plan and perform the audit to obtain reasonable assurance about whether the
financial statements are free of material misstatement. An audit includes examining, on a test basis,
evidence supporting the amounts and disclosures in the financial statements. An audit also includes
assessing the accounting principles used and significant estimates made by management, as well as
evaluating the overall financial statement presentation. We believe that our audit provides a reasonable
basis for our opinion.
As required by the Companies (Auditor’s report) Order, 2003, as amended by the Companies (Auditor’s
Report)(Amendment) Order, 2004 issued by the Central Government of India in terms of Sub-Section (4A)
of Section 227 of the Companies Act, 1956, we enclose as Annexure, a statement on the matters specified
in the paragraphs 4 and 5 of the said order.
Further to our comments in the Annexure referred above, we report that:
1) We have obtained all the information and explanations, which to the best of our knowledge and belief
were necessary for the purpose of our audit;
2) In our opinion, proper books of account as required by law have been kept by the Company so far as
appears from our examination of those books;
3) The Balance Sheet, Profit & Loss Account and Cash Flow Statement dealt with by this report are in
agreement with the books of account;
4) In our opinion, the Balance Sheet, Profit and Loss Account and Cash Flow Statement dealt with by this
report comply with the accounting standards referred to in Sub-Section (3C) of Section 211 of the
Companies Act,1956.
5) On the basis of the written representations received from the directors as on 31st
March, 2010 and
taken on record by the Board of Directors, we report that none of the Directors is disqualified as on
31st
March, 2010 from being appointed as a Director in terms of Clause (g) of Sub-Section (1) of
Section 274 of the Companies Act, 1956;
6) Without qualifying our opinion, attention is drawn to the following :-
As referred in Note no 20 of Schedule 19, the Company has partially adopted Accounting Standard
(AS) 30 on Financial Instruments : Recognition and Measurement, in so far as it relates to derivative
accounting, from 1st
April, 2009. Accordingly, net loss arising on fair valuation of outstanding derivatives
as on 1st
April, 2009 amounting to Rs. 230.58 crores (net of deferred tax of Rs.118.73 crores) has
been adjusted against general reserve following transitional provisions. Accounting for all derivatives
from 1st
April, 2009 have been done as prescribed under the AS. Accordingly, net gain / (loss) of
Rs. (236.12) crores , Rs. 167.75 crores and Rs. 246.09 crores for the year ended 31st
March, 2010
have been included under Sales and Raw Materials Consumed & Other Expenses (in Manufacturing
and Other Expenses), respectively, with consequential impact on profit for the year ended 31st
March,2010.
In our opinion and to the best of our information and according to the explanations given to us, the said
accounts read together with significant accounting policies in Schedule 19 and notes appearing thereon
give the information required by the Companies Act, 1956 (as amended) in the manner so required and
give a true and fair view in conformity with the accounting principles generally accepted in India;
(a) In the case of the Balance Sheet, of the state of affairs of the Company as at 31st
March, 2010;
(b) In the case of the Profit and Loss Account, of the Profit for the year ended on that date; and
(c) In the case of Cash Flow Statement, of the Cash Flows for the year ended on that date.
For SINGHI & CO.,
Camp: Mumbai Chartered Accountants
Dated: The 4th
day of June, 2010 Firm Registration No.302049E
RAJIV SINGHI
1-B, Old Post Office Street, (Partner)
Kolkata-700 001 Membership No. 53518

[69]
AU
DITO
RS’ REPO
RT
Supe r Power i n Premium Me ta l s
I (a) The Company has maintained proper records showing full particulars including quantitative details
and situation of Fixed Assets.
(b) Fixed Assets have been physically verified by the management according to a phased program
designated to cover all items over a period of three years which in our opinion is, reasonable
having regard to size of the Company and the nature of its assets. Pursuant to the program,
certain fixed assets have been physically verified by the management during the year and no
material discrepancies between book record and physical inventory has been noticed.
(c) No substantial part of fixed assets has been disposed of during the year, which has bearing on the
going concern assumption.
II (a) Physical verification of inventory, (except stocks in transit and stocks lying with third parties,
confirmation for which has been obtained) have been conducted at reasonable intervals during
the year by the management/ outside agencies.
(b) In our opinion, the procedures of physical verification of inventory followed by the management
are reasonable and adequate in relation to the size of the Company and nature of its business.
(c) The Company has maintained proper records of inventory. No material discrepancies were noticed
on physical verification.
III (a) The Company has not granted any loans, secured or unsecured to companies, firms or other
parties listed in the register maintained under Section 301 of the Companies Act, 1956.
(b) The Company has not taken any loans, secured or unsecured from companies, firms or other
parties listed in the register maintained under Section 301 of the Companies Act, 1956.
IV On the basis of checks carried out during the course of audit and as per explanations given to us, we
are of the opinion that there are adequate internal control procedures commensurate with the size of
the Company and the nature of its business; for the purchase of inventory and fixed assets and for the
sale of goods and services. During the course of our audit, no major weakness has been noticed or
reported in the internal controls.
V In our opinion and according to the information and explanations given to us, there are no contracts
or arrangements referred to in Section 301 of the Companies Act, 1956, particulars of which needs to
be entered into register maintained under Section 301 of the Act. Accordingly, clause 4(v)(b) of the
Order is not applicable.
VI The Directives issued by the Reserve Bank of India and the provisions of Sections 58A and 58AA and
other relevant provisions of the Companies Act, 1956 and the rules framed there-under have been
complied with in respect of deposits accepted from the public. We have been informed that, no order
has been passed by Company Law Board or National Company Law Tribunal or Reserve Bank of India
or any other Court or Tribunal in this regard.
VII The Company has an internal audit system, which in our opinion is commensurate with the size and
nature of the business.
VIII The Company has maintained proper cost records as prescribed by Central Government under Section
209 (1) (d) of the Companies Act, 1956 for the products of the Company but no detailed examination
of such records has been carried out by us.
IX (a) According to the information and explanations given to us and on the basis of our examination of
the books of account, the Company is generally regular in depositing undisputed statutory dues
including Provident Fund, Investor Education and Protection Fund, Employees’ State Insurance,
Income Tax, Sales Tax, Wealth Tax, Service Tax, Customs Duty, Excise Duty, Cess and other
statutory dues with the appropriate authorities. According to the information and explanations
given to us no undisputed statutory dues as above were outstanding as at 31st March, 2010 for a
period of more than 6 months from the date they became payable.
ANNEXURE TO THE AUDITORS’ REPORT
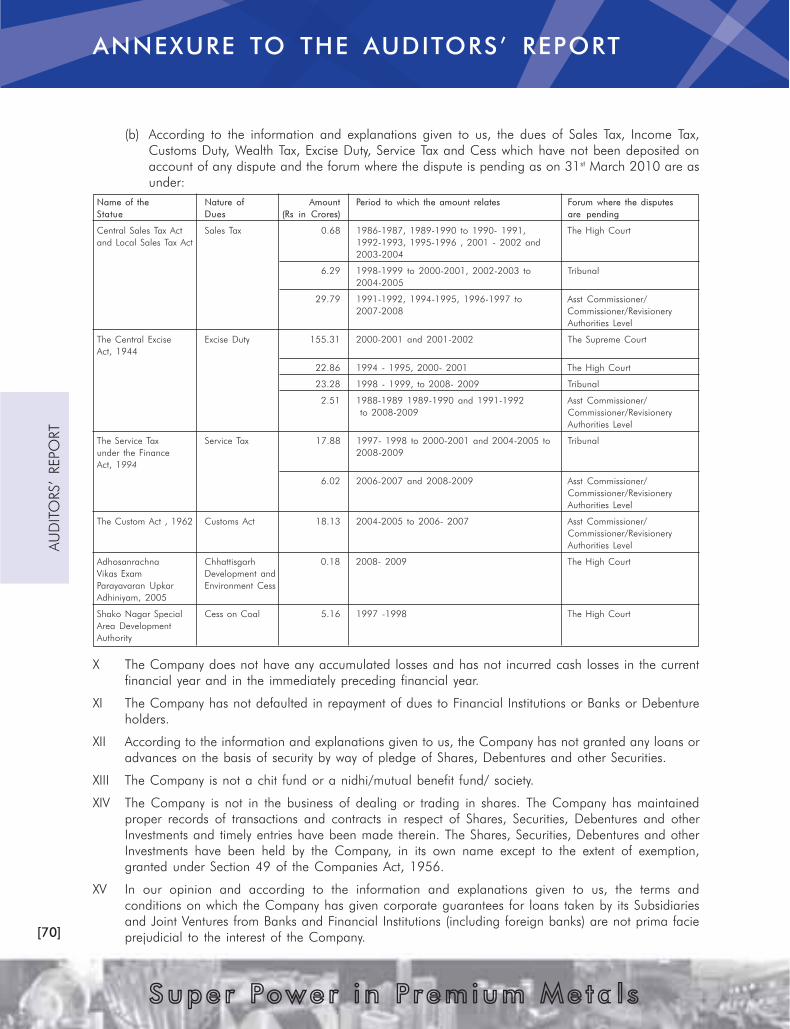
[70]
AU
DITO
RS’ REPO
RT
Supe r Power i n Premium Me ta l s
(b) According to the information and explanations given to us, the dues of Sales Tax, Income Tax,
Customs Duty, Wealth Tax, Excise Duty, Service Tax and Cess which have not been deposited on
account of any dispute and the forum where the dispute is pending as on 31st
March 2010 are as
under:
Name of the Nature of Amount Period to which the amount relates Forum where the disputes
Statue Dues (Rs in Crores) are pending
Central Sales Tax Act Sales Tax 0.68 1986-1987, 1989-1990 to 1990- 1991, The High Court
and Local Sales Tax Act 1992-1993, 1995-1996 , 2001 - 2002 and
2003-2004
6.29 1998-1999 to 2000-2001, 2002-2003 to Tribunal
2004-2005
29.79 1991-1992, 1994-1995, 1996-1997 to Asst Commissioner/
2007-2008 Commissioner/Revisionery
Authorities Level
The Central Excise Excise Duty 155.31 2000-2001 and 2001-2002 The Supreme Court
Act, 1944
22.86 1994 - 1995, 2000- 2001 The High Court
23.28 1998 - 1999, to 2008- 2009 Tribunal
2.51 1988-1989 1989-1990 and 1991-1992 Asst Commissioner/
to 2008-2009 Commissioner/Revisionery
Authorities Level
The Service Tax Service Tax 17.88 1997- 1998 to 2000-2001 and 2004-2005 to Tribunal
under the Finance 2008-2009
Act, 1994
6.02 2006-2007 and 2008-2009 Asst Commissioner/
Commissioner/Revisionery
Authorities Level
The Custom Act , 1962 Customs Act 18.13 2004-2005 to 2006- 2007 Asst Commissioner/
Commissioner/Revisionery
Authorities Level
Adhosanrachna Chhattisgarh 0.18 2008- 2009 The High Court
Vikas Exam Development and
Parayavaran Upkar Environment Cess
Adhiniyam, 2005
Shako Nagar Special Cess on Coal 5.16 1997 -1998 The High Court
Area Development
Authority
X The Company does not have any accumulated losses and has not incurred cash losses in the current
financial year and in the immediately preceding financial year.
XI The Company has not defaulted in repayment of dues to Financial Institutions or Banks or Debenture
holders.
XII According to the information and explanations given to us, the Company has not granted any loans or
advances on the basis of security by way of pledge of Shares, Debentures and other Securities.
XIII The Company is not a chit fund or a nidhi/mutual benefit fund/ society.
XIV The Company is not in the business of dealing or trading in shares. The Company has maintained
proper records of transactions and contracts in respect of Shares, Securities, Debentures and other
Investments and timely entries have been made therein. The Shares, Securities, Debentures and other
Investments have been held by the Company, in its own name except to the extent of exemption,
granted under Section 49 of the Companies Act, 1956.
XV In our opinion and according to the information and explanations given to us, the terms and
conditions on which the Company has given corporate guarantees for loans taken by its Subsidiaries
and Joint Ventures from Banks and Financial Institutions (including foreign banks) are not prima facie
prejudicial to the interest of the Company.
ANNEXURE TO THE AUDITORS’ REPORT

[71]
AU
DITO
RS’ REPO
RT
Supe r Power i n Premium Me ta l s
XVI Based on information and explanations given to us by the management, term loans were applied for
the purpose for which the loans were obtained though unutilized funds which were not required for
immediate use for capital expenditure have been temporarily invested in mutual funds / bank deposit.
XVII According to the information and explanations given to us and on the basis of our overall examination
of the Balance Sheet and Cash Flow Statement, we report that no funds raised on short term basis
have been used for long term investment of the Company.
XVIII During the year under audit, the Company has not made any preferential allotment of Shares to
parties and Companies covered under register maintained under Section 301 of the Companies Act
1956.
XIX During the year under audit, the Company has neither issued any debentures nor any debentures
were outstanding at the year end.
XX The Company has not raised any money by Public Issues during the year. However, the Company has
raised Rs. 2,790.10 crores through Qualified Institutions Placement (“QIP”) by allotting 213,147,391
Equity Shares at a price of Rs. 130.90 per share and has disclosed the end use of money received
from QIP in note no.16 (b) of Schedule 19 on notes on accounts and the same has been verified by
us.
XXI During the course of our examination of the books and records of the Company, carried out in
accordance with the Generally Accepted Auditing Practice in India, and according to the information
and explanations given to us, we have neither come across any instance of fraud on or by the
Company, noticed or reported during the year, nor have we been informed of such cases by the
management.
For SINGHI & CO.,
Camp: Mumbai Chartered Accountants
Dated: The 4th
day of June, 2010 Firm Registration No.302049E
RAJIV SINGHI
1-B, Old Post Office Street, (Partner)
Kolkata-700 001 Membership No. 53518
ANNEXURE TO THE AUDITORS’ REPORT

[72]
STA
ND
ALO
NE FIN
AN
CIA
L STATEM
EN
TS
Supe r Power i n Premium Me ta l s
BALANCE SHEET AS AT MARCH 31, 2010
(Rs. in Crores)
As at 31st As at 31st
Schedule March, 2010 March, 2009
SOURCES OF FUNDS
SHAREHOLDERS’ FUNDS
Share Capital ‘1’ 191.37 170.46
Employee Stock Options Outstanding 3.99 3.17
Reserves and Surplus ‘2’ 27,715.61 23,584.69
27,910.97 23,758.32
LOAN FUNDS
Secured Loans ‘3’ 5,153.90 5,713.23
Unsecured Loans ‘4’ 1,203.00 2,611.06
6,356.90 8,324.29
DEFERRED TAX LIABILITY (NET) 1,366.44 1,410.67
TOTAL 35,634.31 33,493.28
APPLICATION OF FUNDS
FIXED ASSETS
Gross Block ‘5’ 13,793.35 13,393.07
Less : Depreciation 5,840.00 5,241.65
Less : Impairment 218.53 264.45
Net Block 7,734.82 7,886.97
Capital Work-in-Progress 3,702.79 1,389.63
11,437.61 9,276.60
INVESTMENTS ‘6’ 21,480.83 19,148.84
CURRENT ASSETS, LOANS AND ADVANCES
Inventories ‘7’ 5,921.41 4,070.14
Sundry Debtors ‘8’ 1,311.87 1,201.22
Cash and Bank Balances ‘9’ 140.21 843.72
Other Current Assets ‘10’ 53.43 51.78
Loans and Advances ‘11’ 1,437.37 1,573.05
8,864.29 7,739.91
Less :
CURRENT LIABILITIES AND PROVISIONS
Current Liabilities ‘12’ 5,426.93 1,868.91
Provisions ‘13’ 721.49 803.16
6,148.42 2,672.07
NET CURRENT ASSETS 2,715.87 5,067.84
TOTAL 35,634.31 33,493.28
Significant Accounting Policies and Notes on Accounts ‘19’
As per our report annexed.
For SINGHI & CO.
Chartered Accountants
RAJIV SINGHI
Partner S. Talukdar
Membership No. 53518 Group Executive President & CFO
Camp: Mumbai Anil Malik
Dated: The 4th day of June, 2010 Company Secretary
For and on behalf of the Board
Kumar Mangalam Birla – Chairman
D. Bhattacharya – Managing Director
M. M. Bhagat – Director

[73]
STA
ND
ALO
NE FIN
AN
CIA
L STATEM
EN
TS
Supe r Power i n Premium Me ta l s
PROFIT AND LOSS ACCOUNT FOR THE YEAR
ENDED MARCH 31, 2010
(Rs. in Crores)
For the year For the year
ended 31st ended 31st
Schedule March, 2010 March, 2009
INCOME
Gross Sales and Operating Revenues ‘14’ 20,585.11 19,718.34
Less: Excise Duty 1,048.83 1,498.69
Net Sales and Operating Revenues 19,536.28 18,219.65
Other Income ‘15’ 259.85 636.65
19,796.13 18,856.30
EXPENDITURE
(Increase)/ Decrease in Stocks ‘16’ (755.25) 520.58
Trade Purchases 71.99 113.04
Manufacturing and Other Expenses ‘17’ 17,269.62 14,550.16
Interest and Finance Charges ‘18’ 278.00 336.93
Depreciation 671.36 644.34
Impairment (4.15) 0.93
17,531.57 16,165.98
PROFIT BEFORE TAX 2,264.56 2,690.32
Provision for Current Tax 374.20 478.11
Provision for Deferred Tax 87.90 121.40
Provision for Fringe Benefit Tax - 11.37
Tax adjustment for earlier years (Net) (113.17) (150.83)
NET PROFIT 1,915.63 2,230.27
Balance brought forward from Previous year 300.00 300.00
Transfer from Debenture Redemption Reserve 87.50 -
BALANCE AVAILABLE FOR APPROPRIATIONS 2,303.13 2,530.27
APPROPRIATIONS
Debenture Redemption Reserve - 5.00
Capital Redemption Reserve - 0.41
Dividend on Preference Shares - 0.02
Dividend Tax on Preference Shares - 0.01
Proposed Dividend on Equity Shares 258.32 229.58
Tax on Proposed Dividend 42.90 39.02
Transfer to General Reserve 1,701.91 1,956.23
Balance Carried to Balance Sheet 300.00 300.00
2,303.13 2,530.27
Earnings per Share (EPS):
Basic EPS (in Rs.) 10.82 14.82
Diluted EPS (in Rs.) 10.81 14.82
Basic EPS before Tax adjustment for earlier years (in Rs.) 10.18 13.81
Diluted EPS before Tax adjustment for earlier years (in Rs.) 10.18 13.81
Significant Accounting Policies and Notes on Accounts‘19’
As per our report annexed.
For SINGHI & CO.
Chartered Accountants
RAJIV SINGHI
Partner S. Talukdar
Membership No. 53518 Group Executive President & CFO
Camp: Mumbai Anil Malik
Dated: The 4th day of June, 2010 Company Secretary
For and on behalf of the Board
Kumar Mangalam Birla – Chairman
D. Bhattacharya – Managing Director
M. M. Bhagat – Director
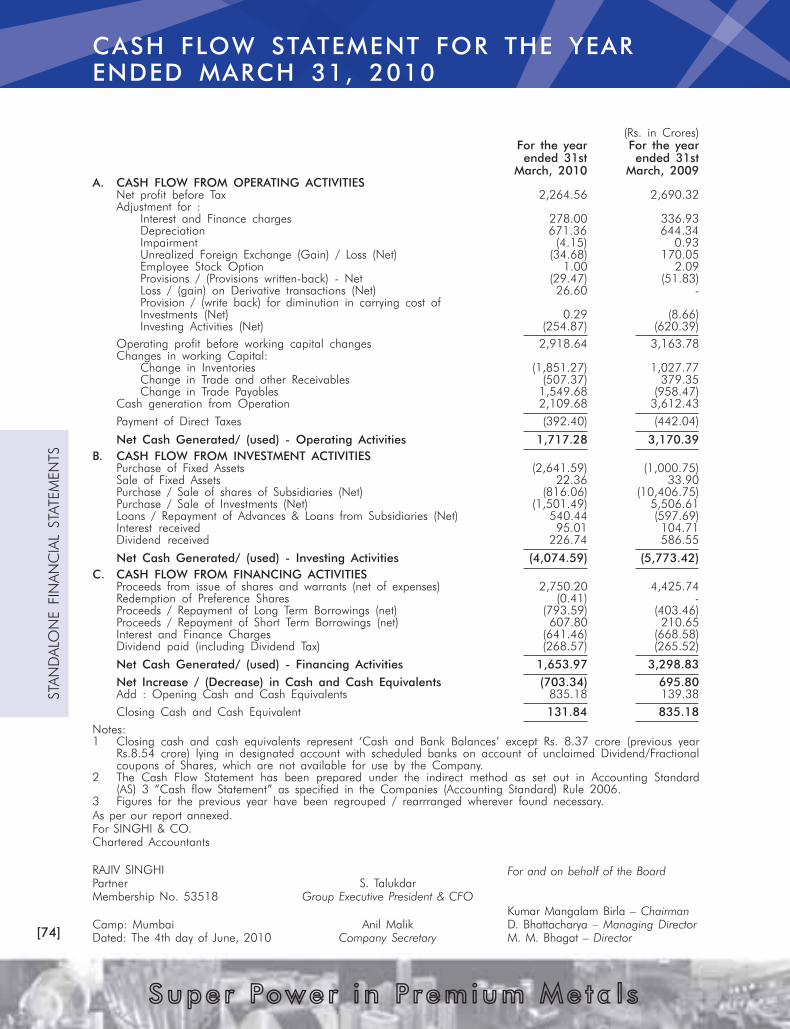
[74]
STA
ND
ALO
NE FIN
AN
CIA
L STATEM
EN
TS
Supe r Power i n Premium Me ta l s
CASH FLOW STATEMENT FOR THE YEAR
ENDED MARCH 31, 2010
(Rs. in Crores)
For the year For the year
ended 31st ended 31st
March, 2010 March, 2009
A. CASH FLOW FROM OPERATING ACTIVITIES
Net profit before Tax 2,264.56 2,690.32
Adjustment for :
Interest and Finance charges 278.00 336.93
Depreciation 671.36 644.34
Impairment (4.15) 0.93
Unrealized Foreign Exchange (Gain) / Loss (Net) (34.68) 170.05
Employee Stock Option 1.00 2.09
Provisions / (Provisions written-back) - Net (29.47) (51.83)
Loss / (gain) on Derivative transactions (Net) 26.60 -
Provision / (write back) for diminution in carrying cost of
Investments (Net) 0.29 (8.66)
Investing Activities (Net) (254.87) (620.39)
Operating profit before working capital changes 2,918.64 3,163.78
Changes in working Capital:
Change in Inventories (1,851.27) 1,027.77
Change in Trade and other Receivables (507.37) 379.35
Change in Trade Payables 1,549.68 (958.47)
Cash generation from Operation 2,109.68 3,612.43
Payment of Direct Taxes (392.40) (442.04)
Net Cash Generated/ (used) - Operating Activities 1,717.28 3,170.39
B. CASH FLOW FROM INVESTMENT ACTIVITIES
Purchase of Fixed Assets (2,641.59) (1,000.75)
Sale of Fixed Assets 22.36 33.90
Purchase / Sale of shares of Subsidiaries (Net) (816.06) (10,406.75)
Purchase / Sale of Investments (Net) (1,501.49) 5,506.61
Loans / Repayment of Advances & Loans from Subsidiaries (Net) 540.44 (597.69)
Interest received 95.01 104.71
Dividend received 226.74 586.55
Net Cash Generated/ (used) - Investing Activities (4,074.59) (5,773.42)
C. CASH FLOW FROM FINANCING ACTIVITIES
Proceeds from issue of shares and warrants (net of expenses) 2,750.20 4,425.74
Redemption of Preference Shares (0.41) -
Proceeds / Repayment of Long Term Borrowings (net) (793.59) (403.46)
Proceeds / Repayment of Short Term Borrowings (net) 607.80 210.65
Interest and Finance Charges (641.46) (668.58)
Dividend paid (including Dividend Tax) (268.57) (265.52)
Net Cash Generated/ (used) - Financing Activities 1,653.97 3,298.83
Net Increase / (Decrease) in Cash and Cash Equivalents (703.34) 695.80
Add : Opening Cash and Cash Equivalents 835.18 139.38
Closing Cash and Cash Equivalent 131.84 835.18
Notes:
1 Closing cash and cash equivalents represent ‘Cash and Bank Balances’ except Rs. 8.37 crore (previous year
Rs.8.54 crore) lying in designated account with scheduled banks on account of unclaimed Dividend/Fractional
coupons of Shares, which are not available for use by the Company.
2 The Cash Flow Statement has been prepared under the indirect method as set out in Accounting Standard
(AS) 3 ”Cash flow Statement” as specified in the Companies (Accounting Standard) Rule 2006.
3 Figures for the previous year have been regrouped / rearrranged wherever found necessary.
As per our report annexed.
For SINGHI & CO.
Chartered Accountants
RAJIV SINGHI
Partner S. Talukdar
Membership No. 53518 Group Executive President & CFO
Camp: Mumbai Anil Malik
Dated: The 4th day of June, 2010 Company Secretary
For and on behalf of the Board
Kumar Mangalam Birla – Chairman
D. Bhattacharya – Managing Director
M. M. Bhagat – Director

[75]
STA
ND
ALO
NE FIN
AN
CIA
L STATEM
EN
TS
Supe r Power i n Premium Me ta l s
SCHEDULES FORMING PART OF BALANCE SHEET
(Rs. in Crores)
Numbers Numbers As at 31st As at 31st
31st March, 2010 31st March, 2009 March, 2010 March, 2009
SCHEDULE ‘1’
SHARE CAPITAL
Authorized:
Equity Shares of Re.1/- each. 2,100,000,000 1,950,000,000 210.00 195.00
Redeemable Cumulative Preference
Shares of Rs. 2/- each 25,000,000 25,000,000 5.00 5.00
215.00 200.00
Issued:
Equity Shares of Re.1/- each 1,914,727,460 1,701,535,825 191.47 170.15
6% Redeemable Cumulative Preference
Shares of Rs. 2/- each - 2,032,734 - 0.41
191.47 170.56
Subscribed and Paid-up:
Equity Share Capital
Equity Shares of Re.1/- each fully paid-up 1,914,008,691 1,700,817,056 191.40 170.08
Less: Face value of Shares forfeited 546,249 546,249 0.05 0.05
191.35 170.03
Add: Forfeited Shares Account (Amount Paid-up) 0.02 0.02
191.37 170.05
Preference Share Capital
6% Redeemable Cumulative Preference
Shares of Rs. 2/- each - 2,032,734 - 0.41
191.37 170.46
Note:
1. Subscribed and Paid-up Equity Share Capital include:
(i) 491,766,770 (Previous year 491,766,770) Equity Shares of Re. 1/- each fully paid-up allotted as fully paid-
up Bonus Shares by Capitalisation of General Reserve and Capital Redemption Reserve.
(ii) 6,000,000 (Previous year 6,000,000) Equity Shares of Re. 1/- each fully paid-up allotted pursuant to a
contract for consideration other than cash.
(iii) 187,678,350 (Previous year 187,678,350) Equity Shares of Re. 1/- each fully paid-up allotted to the share
holders of erstwhile Indo Gulf Corporation Limited pursuant to the Scheme of Arrangement without payment
being received in cash.
(iv) 2,995,220 (Previous year 2,995,220) Equity Shares of Re. 1/- each fully paid-up allotted to the share holders
of erstwhile Indian Aluminium Company, Limited pursuant to the Scheme of Arrangement without payment
being received in cash.
(v) 376 (Previous year 376) Equity Shares of Re. 1/- each fully paid-up allotted to the share holders of erstwhile
Indian Aluminium Company, Limited pursuant to the Scheme of Amalgamation without payment being
received in cash.
2. Subscribed and Paid-up Preference Share Capital include:
(i) 2,032,734 6% Redeemable Cumulative Preference Shares of Rs. 2/- each fully paid-up allotted during last
year to the share holders of erstwhile Indian Aluminium Company, Limited pursuant to the Scheme of
Amalgamation without payment being received in cash has been redeemed on 1st April, 2009.

[76]
STA
ND
ALO
NE FIN
AN
CIA
L STATEM
EN
TS
Supe r Power i n Premium Me ta l s
SCHEDULES FORMING PART OF BALANCE SHEET
(Rs. in Crores)
As at 31st As at 31st
SCHEDULE ‘2‘ March, 2010 March, 2009
RESERVES AND SURPLUS
Capital Reserve
As per last Balance Sheet 139.54 0.44
Add: Transfer on forfeiture of Share Warrants - 139.10
139.54 139.54
Capital Redemption Reserve
As per last Balance Sheet 101.57 101.16
Add: Created as per Scheme of Amalgamation - 0.41
101.57 101.57
Securities Premium Account
As per last Balance Sheet - 4,268.10
Add: Amount received on Rights Issue - 4,501.03
Add: Amount received on QIP Issue 2,768.79 -
Add: Received on exercise of ESOP 0.61 3.14
2,769.40 8,772.27
Less: Rights issue Expenses - 124.90
Less: QIP Issue Expenses (net of deferred tax) 26.94 -
Less: Transferred to Business Reconstruction Reserve
(refer Note No. 19 in Schedule ‘19’) - 8,647.37
2,742.46 -
Business Reconstruction Reserve
As per last Balance Sheet 8,580.39 -
Add: Transfer from Securities Premium Account - 8,647.37
8,580.39 8,647.37
Less: Adjusted during the year (refer Note No. 19 in Schedule ‘19’) - 66.98
8,580.39 8,580.39
Debenture Redemption Reserve
As per last Balance Sheet 87.50 82.50
Add: Created during the year - 5.00
87.50 87.50
Less: Transferred to Profit and Loss Account 87.50 -
- 87.50
Hedging Reserve
Gain/ (Loss) recognized during the year (Net) (1.30) -
Less: Gain/ (Loss) recycled during the year (Net) (5.93) -
(refer Note No. 26 (i) (f) in Schedule ‘19’) 4.63 -
General Reserve
As per last Balance Sheet 14,375.69 12,419.33
Add: On lapse of vested ESOP - 0.13
Add: Transfer from Profit and Loss Account 1,701.91 1,956.23
16,077.60 14,375.69
Less: Adjusted for Transitional Provision (refer Note No. 20 in Schedule ‘19’) 230.58 -
15,847.02 14,375.69
Profit and Loss Account Balance 300.00 300.00
27,715.61 23,584.69
SCHEDULE ‘3’
SECURED LOANS
Debentures - 350.00
Loans from Banks 5,153.90 5,363.22
Other Loans - 0.01
5,153.90 5,713.23
SCHEDULE ‘4’
UNSECURED LOANS
Fixed Deposits 0.33 1.13
Short Term Loans:
From Banks 1,192.97 2,372.15
Other Loans:
From Banks (Rs. Nil due within one year; Previous year Rs. 224.35 crores) - 224.35
From Others 9.70 13.43
1,203.00 2,611.06

[77]
STA
ND
ALO
NE FIN
AN
CIA
L STATEM
EN
TS
Supe r Power i n Premium Me ta l s
SCHEDULES FORMING PART OF BALANCE SHEET
SC
HED
ULE ‘5’
(Rs. in
C
rores)
FIXED
A
SSETS
O R I
G I
N A
L C
O
S T
D E P R E C
I
A T I
O N
I M
P A
I
R M
E N
T
N E T B O
O
K
V
A
L U
E
As at
31st
Additio
ns/
As at
31st
As at
31st
Additio
ns/
As at
31st
As at
31st
Additio
ns/
Deductions/
As at
31st
As at
31st
As at
31st
March,
2009
Adju
stm
ents
Deductions
March,
2010
March,
2009
Adju
stm
ents
Deductions
March,
2010
March,
2009
Adju
stm
ents
Revers
al
March,
2010
March,
2010
March,
2009
A.
Tan
gible A
ssets
Min
ing Rig
hts
34
.0
22
.2
8-
36
.3
0(a)
15
.6
41
.1
6-
16
.8
0-
--
-1
9.5
01
8.3
8
Leasehold
Land
42
.5
3-
-4
2.5
3(b)
4.8
40
.5
4-
5.3
8-
--
-3
7.1
53
7.6
9
Freehold
Land
71
.7
50
.0
8-
71
.8
3(c)
0.2
50
.0
1-
0.2
61
.3
5-
0.6
60
.6
97
0.8
87
0.1
5
Buildin
gs
1,1
73
.0
46
0.6
91
0.2
01
,2
23
.5
3(d)
26
2.2
53
2.1
42
.1
92
92
.2
02
1.3
6-
8.8
71
2.4
99
18
.8
48
89
.4
3
Pla
nt
and M
achin
ery
11
,6
03
.1
34
52
.9
71
15
.7
81
1,9
40
.3
2(e)
4,6
85
.5
86
04
.1
85
4.8
05
,2
34
.9
62
41
.7
23
.9
24
0.2
92
05
.3
56
,5
00
.0
16
,6
75
.8
3
Vehic
les and A
ircraft
14
3.5
94
.0
63
.4
61
44
.1
96
2.9
19
.5
51
.9
27
0.5
4-
--
-7
3.6
58
0.6
8
Furniture and Fittings
22
8.6
21
0.9
71
5.9
42
23
.6
51
51
.2
21
4.7
81
3.1
21
52
.8
8-
--
-7
0.7
77
7.4
0
Railw
ay Sid
ings
33
.2
31
4.3
9-
47
.6
2(f)
6.8
83
.3
1-
10
.1
9-
--
-3
7.4
32
6.3
5
Liv
e Sto
ck
0.0
60
.0
30
.0
10
.0
8-
--
--
--
-0
.0
80
.0
6
B.
In
tan
gible A
ssets
Technolo
gic
al
Lic
ences
31
.1
7-
0.2
53
0.9
2(h)
23
.3
13
.5
00
.1
12
6.7
0-
--
-4
.2
27
.8
6
Com
pute
r Softw
are
31
.9
31
.2
40
.7
93
2.3
8(h)
28
.7
72
.1
90
.8
73
0.0
90
.0
2-
0.0
2-
2.2
93
.1
4
13
,3
93
.0
75
46
.7
11
46
.4
31
3,7
93
.3
5(g)
5,2
41
.6
56
71
.3
67
3.0
15
,8
40
.0
02
64
.4
53
.9
24
9.8
42
18
.5
37
,7
34
.8
27
,8
86
.9
7
Previo
us Year
12
,6
08
.4
68
51
.5
96
6.9
81
3,3
93
.0
74
,6
36
.8
16
44
.3
43
9.5
05
,2
41
.6
51
62
.3
21
04
.3
02
.1
72
64
.4
5
C.
Capital W
ork-in
-Pro
gress
3,7
02
.7
91
,3
89
.6
3
11
,4
37
.6
19
,2
76
.6
0
No
tes:
a.
Min
ing Rig
hts
fo
r 2
0 / 3
0 years le
ase w
ritte
n off proportionate
ly.
b.
Leasehold
Land in
clu
des la
nd am
ounting Rs. 2
0.7
3 crores (Previo
us year Rs. 2
0.7
3 crores) fo
r w
hic
h regis
tration is
pendin
g. (N
et
Book Valu
e Rs. 1
9.3
2 crores; Previo
us
year Rs. 1
9.5
3 crores).
c.
Freehold
Land in
clu
des Rs. 0
.3
0 crores (Previo
us year Rs. 0
.3
0 crores) to
wards alternate
la
nd m
ade available
fo
r acquirin
g rig
ht
to use th
e fo
rest
land, ow
nership
of
whic
h
vests
w
ith th
e sta
te governm
ent
auth
oritie
s. (N
et
Book Valu
e Rs. 0
.2
7 crores; Previo
us year Rs. 0
.2
7 crores).
d.
Buildin
gs in
clu
de:
i).
Rs. 2
.9
3 crores (Previo
us year Rs. 2
.9
3 crores) bein
g contr
ibution fo
r constr
uction of
road, th
e ow
nership
of
whic
h vests
w
ith th
e sta
te governm
ent
auth
oritie
s. (N
et
Book Valu
e Rs. 0
.9
6 crores; Previo
us year Rs. 1
.2
8 crores).
ii).
Rs. 1
6.3
6 crores (Previo
us year Rs. 1
6.3
6 crores) to
wards rig
ht
to occupy and use of
certa
in prem
ises fo
r w
hic
h th
e C
om
pany has in
veste
d Rs. 1
3.1
8 crores (Previo
us
year Rs. 1
3.1
8 crores) in
Shares &
D
ebentu
res of
a com
pany. (N
et
Book Valu
e Rs. 1
3.9
6 crores; Previo
us year Rs. 1
4.2
2 crores).
e.
Pla
nt
& M
achin
ery in
clu
de Rs. 6
0.5
4 crores (Previo
us year Rs. 6
0.5
4 crores) bein
g th
e am
ount
spent
for la
yin
g pow
er line and w
ate
r pip
e line, th
e ow
nership
of
whic
h vests
with th
e sta
te governm
ent
auth
oritie
s. (N
et
Book Valu
e Rs. 2
4.5
7 crores; Previo
us year Rs. 2
7.5
7 crores).
f.Railw
ay Sid
ings in
clu
de Rs. 9
.1
4 crores (Previo
us year Rs. 9
.1
4 crores) bein
g assets
not
ow
ned by th
e C
om
pany. (N
et
Book Valu
e Rs. 7
.5
6 crores; Previo
us year Rs. 8
.1
8
crores).
g.
Assets
held
under C
o-ow
nership
:
i)Freehold
Land
-Rs. 5
2.4
5 crores (Previo
us year Rs. 5
2.4
5 crores). (N
et
Book Valu
e Rs. 5
2.3
6 crores; Previo
us year Rs. 5
2.3
7 crores)
ii)
Buildin
gs
-Rs. 4
8.1
0 crores (Previo
us year Rs. 4
8.1
0 crores). (N
et
Book Valu
e Rs. 4
1.2
7 crores; Previo
us year Rs. 4
1.9
7 crores)
iii)
Pla
nt
and M
achin
ery
-Rs. N
il (Previo
us year Rs. 4
.1
9 crores). (N
et
Book Valu
e Rs. N
il; Previo
us year Rs. 3
.1
5 crores)
iv)
Vehic
les and A
ircraft
-Rs. 6
0.7
6 crores (Previo
us year Rs. 3
0.6
6 crores). (N
et
Book Valu
e Rs. 4
0.5
6 crores; Previo
us year Rs.
20
.0
1 crores)
v)
Furniture and Fittings
-Rs. 1
8.7
2 crores (Previo
us year Rs. 1
4.4
0 crores). (N
et
Book Valu
e Rs. 9
.2
2 crores; Previo
us year Rs. 8
.0
0 crores)
h.
The usefu
l life
of
Technolo
gic
al
Lic
ences is
consid
ered 4
- 6
years and th
at
of
Com
pute
r Softw
are is
consid
ered 2
- 3
years.

[78]
STA
ND
ALO
NE FIN
AN
CIA
L STATEM
EN
TS
Supe r Power i n Premium Me ta l s
(Rs. in Crores)
Face Value Total As at 31st As at 31st
(Rupees) Nos. March, 2010 March, 2009
SCHEDULE ‘6’
INVESTMENTS
A. LONG TERM INVESTMENTS
1. UNQUOTED
a. Trade
i. Shares in Subsidiary Companies - Fully paid-up
Equity Shares of Utkal Alumina International Limited 10 1,050,242,340 1,160.51 663.51
Equity Shares of Dahej Harbour & Infrastructure Limited 10 50,000,000 50.00 50.00
Common Shares of Birla Resources Pty Limited - 650,000 1.79 1.79
Equity Shares of Minerals & Minerals Limited (including 606
Equity Shares held jointly with nominees) 10 50,000 0.17 0.17
Equity Shares of Hindalco-Almex Aerospace Limited 10 30,359,000 30.36 26.78
Common Shares of A V Minerals (Netherlands) B.V. Euro 1,000 2,150,327 13,146.55 12,865.30
Equity Shares of Tubed Coal Mines Limited 10 2,970,000 2.97 1.77
Equity Shares of East Coast Bauxite Mining Company
Private Limited 10 7,600 0.01 0.01
Equity Shares of Mauda Energy Limited (incorporated
during the year; refer Note No. 18 in Schedule ‘19’) 10 150,000 0.15 -
ii. Shares in Subsidiary Company - Partly paid-up
Common Shares of A V Minerals (Netherlands) B.V. Euro 1,000 51,749 98.83 67.79
iii. Other Shares, Debentures and Bonds- Fully paid-up
Equity Shares of Mahan Coal Limited 10 5,375,000 5.38 4.38
Equity Shares of MNH Shakti Limited 10 3,765,000 3.77 0.02
Equity Shares of Hydromine Global Minerals
GMBH Limited USD 100 45 0.02 0.02
Equity Shares of Sanjana Cryogenic Limited 10 780,000 3.12 3.12
Equity Shares of Aditya Birla Science & Technology
Company Limited 10 9,800,000 9.80 9.80
b. Other than Trade
i. Shares in Subsidiary Companies- Fully paid-up
Equity Shares of Renuka Investments & Finance Limited
(including 10 Equity Shares held jointly with nominees) 10 9,250,000 9.25 9.25
15% Redeemable Cumulative Preference Shares of
Renuka Investments & Finance Limited 100 150
Equity Shares of Renukeshwar Investments & Finance Limited
(including 10 Equity Shares held jointly with nominees) 10 4,795,000 4.80 4.80
15% Redeemable Cumulative Preference Shares of
Renukeshwar Investments & Finance Limited 100 150
Equity Shares of Indal Exports Limited 10 140,000 0.14 0.14
Equity Shares of Suvas Holdings Limited 10 2,024,700 2.03 0.19
Equity Shares of Lucknow Finance Company Limited 10 12,002,500 12.00 12.00
ii. Other Shares, Debentures, Units and Bonds- Fully paid-up
Ordinary Shares of Birla International Limited CHF 100 2,500 0.53 0.53
Equity Shares of Bharuch-Dahej Railway Company Limited 10 10,000,000 10.00 -
5.25% Cumulative Redeemable Preference Shares of
Aditya Birla Health Services Limited 100 2,500,000 25.00 25.00
7% Preference Shares of Birla Global Finance
Company Limited 10 25,000,000 25.05 25.05
Non-Convertible Debentures of DSP Merrill Lynch Capital
Limited (interest linked to Nifty index and due on maturity) - 10.10
Carried over .... 14,602.23 13,781.52
SCHEDULES FORMING PART OF BALANCE SHEET
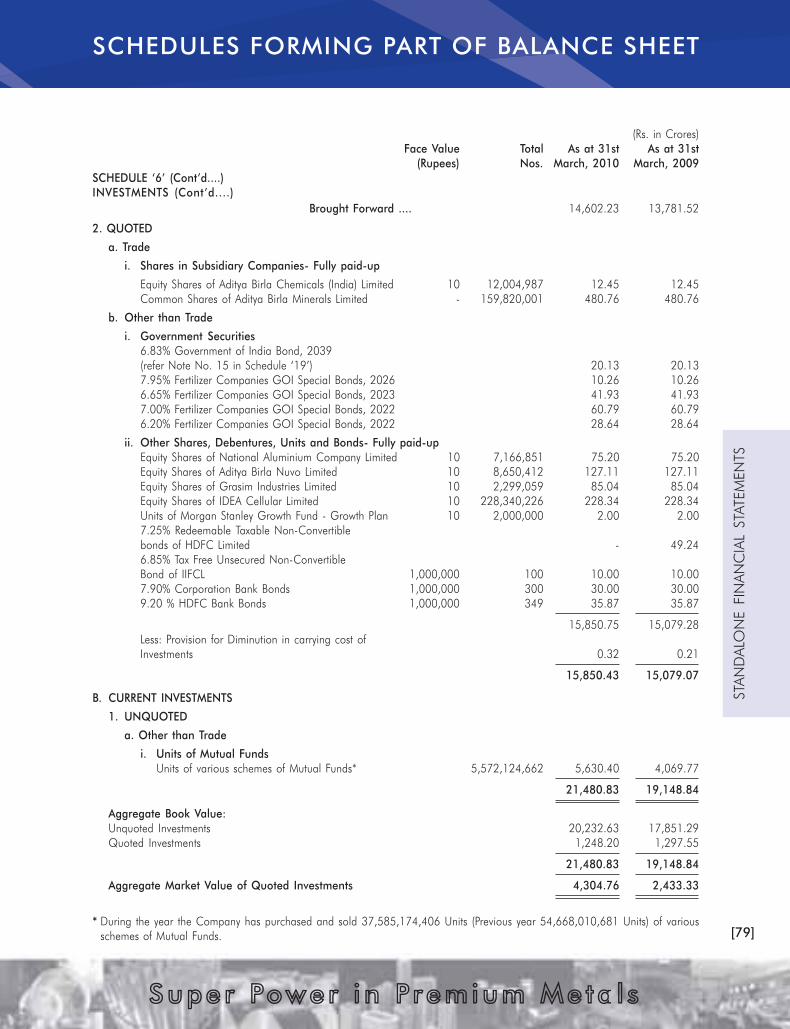
[79]
STA
ND
ALO
NE FIN
AN
CIA
L STATEM
EN
TS
Supe r Power i n Premium Me ta l s
(Rs. in Crores)
Face Value Total As at 31st As at 31st
(Rupees) Nos. March, 2010 March, 2009
SCHEDULE ‘6’ (Cont’d....)
INVESTMENTS (Cont’d....)
Brought Forward .... 14,602.23 13,781.52
2. QUOTED
a. Trade
i. Shares in Subsidiary Companies- Fully paid-up
Equity Shares of Aditya Birla Chemicals (India) Limited 10 12,004,987 12.45 12.45
Common Shares of Aditya Birla Minerals Limited - 159,820,001 480.76 480.76
b. Other than Trade
i. Government Securities
6.83% Government of India Bond, 2039
(refer Note No. 15 in Schedule ‘19’) 20.13 20.13
7.95% Fertilizer Companies GOI Special Bonds, 2026 10.26 10.26
6.65% Fertilizer Companies GOI Special Bonds, 2023 41.93 41.93
7.00% Fertilizer Companies GOI Special Bonds, 2022 60.79 60.79
6.20% Fertilizer Companies GOI Special Bonds, 2022 28.64 28.64
ii. Other Shares, Debentures, Units and Bonds- Fully paid-up
Equity Shares of National Aluminium Company Limited 10 7,166,851 75.20 75.20
Equity Shares of Aditya Birla Nuvo Limited 10 8,650,412 127.11 127.11
Equity Shares of Grasim Industries Limited 10 2,299,059 85.04 85.04
Equity Shares of IDEA Cellular Limited 10 228,340,226 228.34 228.34
Units of Morgan Stanley Growth Fund - Growth Plan 10 2,000,000 2.00 2.00
7.25% Redeemable Taxable Non-Convertible
bonds of HDFC Limited - 49.24
6.85% Tax Free Unsecured Non-Convertible
Bond of IIFCL 1,000,000 100 10.00 10.00
7.90% Corporation Bank Bonds 1,000,000 300 30.00 30.00
9.20 % HDFC Bank Bonds 1,000,000 349 35.87 35.87
15,850.75 15,079.28
Less: Provision for Diminution in carrying cost of
Investments 0.32 0.21
15,850.43 15,079.07
B. CURRENT INVESTMENTS
1. UNQUOTED
a. Other than Trade
i. Units of Mutual Funds
Units of various schemes of Mutual Funds* 5,572,124,662 5,630.40 4,069.77
21,480.83 19,148.84
Aggregate Book Value:
Unquoted Investments 20,232.63 17,851.29
Quoted Investments 1,248.20 1,297.55
21,480.83 19,148.84
Aggregate Market Value of Quoted Investments 4,304.76 2,433.33
* During the year the Company has purchased and sold 37,585,174,406 Units (Previous year 54,668,010,681 Units) of various
schemes of Mutual Funds.
SCHEDULES FORMING PART OF BALANCE SHEET

[80]
STA
ND
ALO
NE FIN
AN
CIA
L STATEM
EN
TS
Supe r Power i n Premium Me ta l s
(Rs. in Crores)
As at 31st As at 31st
March, 2010 March, 2009
SCHEDULE ‘7’
INVENTORIES
Stores and Spare parts 263.46 260.21
Coal and Fuel 120.82 108.90
Raw Materials (including Rs. Nil offset hedging cost, Previous year Rs. 173.16 crores) 2,448.33 1,378.10
Work-in-Process 2,838.30 2,150.27
Finished Goods 228.96 161.74
Excise Duty on Stock 21.54 10.92
5,921.41 4,070.14
SCHEDULE ‘8’
SUNDRY DEBTORS
(Unsecured unless otherwise stated)
Exceeding six months:
Considered Good (including Rs. 1.59 crores secured;
Previous year Rs. 1.25 crores) 44.27 42.65
Considered Doubtful 36.50 20.46
Others:
Considered Good (including Rs. 13.83 crores secured;
Previous year Rs. 4.76 crores) 1,267.60 1,158.57
1,348.37 1,221.68
Less: Provision for doubtful debts 36.50 20.46
1,311.87 1,201.22
SCHEDULE ‘9’
CASH AND BANK BALANCES
Cash balance on hand 0.37 0.32
Cheques and Drafts in hand 25.95 53.69
Balance with Scheduled Banks:
In Current Accounts 113.62 159.43
In Deposit Account 0.25 630.24
Balance with Others:
In Current Accounts (with Municipal Co-operative Bank Limited,
Mumbai, maximum balance at any time during the year Rs. 0.04 crores;
Previous year Rs. 0.06 crores) 0.02 0.04
140.21 843.72
SCHEDULE ‘10’
OTHER CURRENT ASSETS
Accrued Interest
On Investments 3.20 3.94
On Inter Corporate Deposits and Deposit in Banks - 1.62
On Others 4.80 4.72
Accrued Export and other Incentives 45.43 41.50
53.43 51.78
SCHEDULES FORMING PART OF BALANCE SHEET
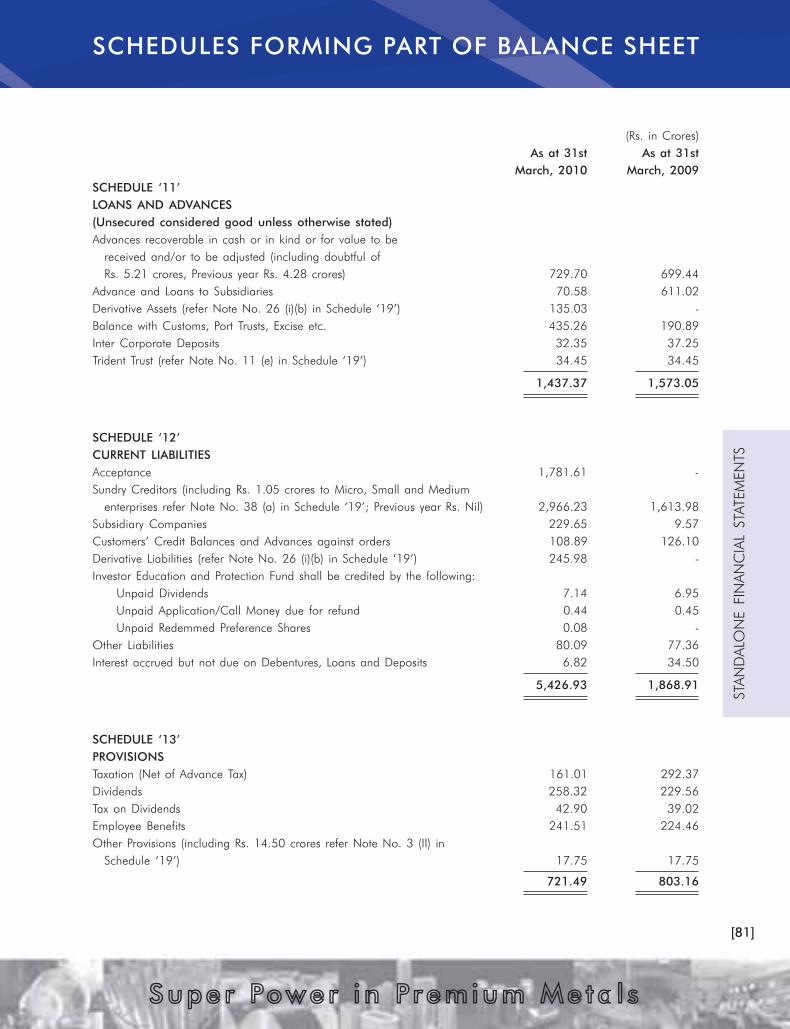
[81]
STA
ND
ALO
NE FIN
AN
CIA
L STATEM
EN
TS
Supe r Power i n Premium Me ta l s
(Rs. in Crores)
As at 31st As at 31st
March, 2010 March, 2009
SCHEDULE ‘11’
LOANS AND ADVANCES
(Unsecured considered good unless otherwise stated)
Advances recoverable in cash or in kind or for value to be
received and/or to be adjusted (including doubtful of
Rs. 5.21 crores, Previous year Rs. 4.28 crores) 729.70 699.44
Advance and Loans to Subsidiaries 70.58 611.02
Derivative Assets (refer Note No. 26 (i)(b) in Schedule ‘19’) 135.03 -
Balance with Customs, Port Trusts, Excise etc. 435.26 190.89
Inter Corporate Deposits 32.35 37.25
Trident Trust (refer Note No. 11 (e) in Schedule ‘19’) 34.45 34.45
1,437.37 1,573.05
SCHEDULE ‘12’
CURRENT LIABILITIES
Acceptance 1,781.61 -
Sundry Creditors (including Rs. 1.05 crores to Micro, Small and Medium
enterprises refer Note No. 38 (a) in Schedule ‘19’; Previous year Rs. Nil) 2,966.23 1,613.98
Subsidiary Companies 229.65 9.57
Customers’ Credit Balances and Advances against orders 108.89 126.10
Derivative Liabilities (refer Note No. 26 (i)(b) in Schedule ‘19’) 245.98 -
Investor Education and Protection Fund shall be credited by the following:
Unpaid Dividends 7.14 6.95
Unpaid Application/Call Money due for refund 0.44 0.45
Unpaid Redemmed Preference Shares 0.08 -
Other Liabilities 80.09 77.36
Interest accrued but not due on Debentures, Loans and Deposits 6.82 34.50
5,426.93 1,868.91
SCHEDULE ‘13’
PROVISIONS
Taxation (Net of Advance Tax) 161.01 292.37
Dividends 258.32 229.56
Tax on Dividends 42.90 39.02
Employee Benefits 241.51 224.46
Other Provisions (including Rs. 14.50 crores refer Note No. 3 (II) in
Schedule ‘19’) 17.75 17.75
721.49 803.16
SCHEDULES FORMING PART OF BALANCE SHEET
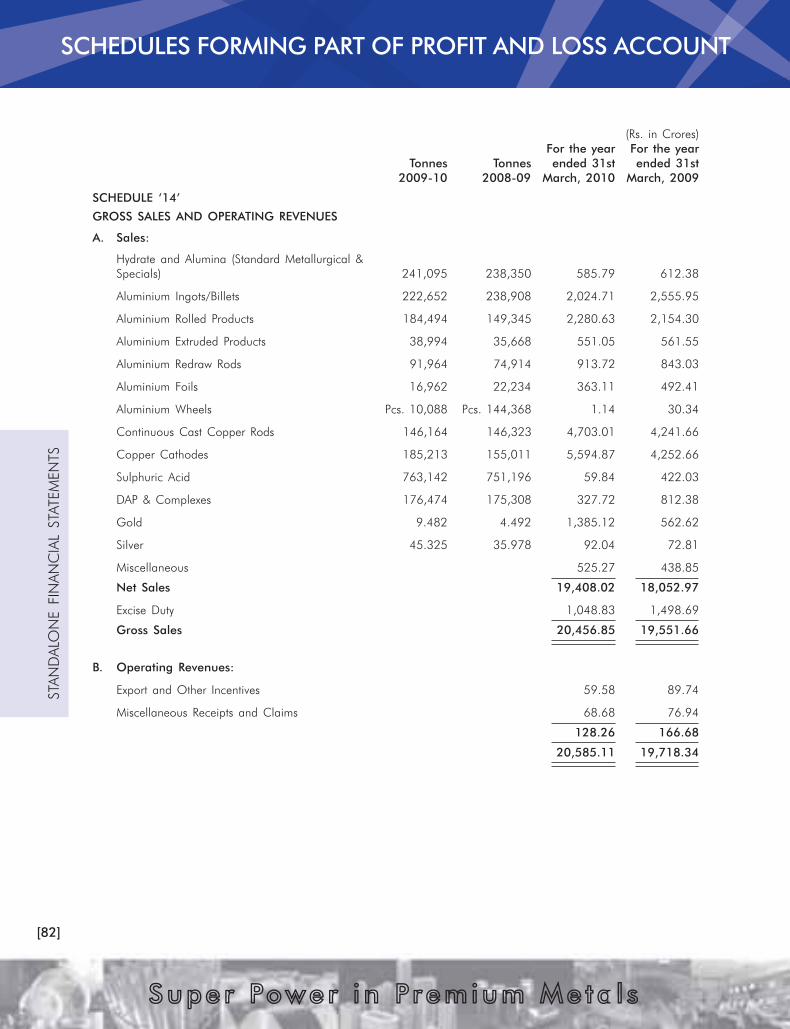
[82]
STA
ND
ALO
NE FIN
AN
CIA
L STATEM
EN
TS
Supe r Power i n Premium Me ta l s
(Rs. in Crores)
For the year For the year
Tonnes Tonnes ended 31st ended 31st
2009-10 2008-09 March, 2010 March, 2009
SCHEDULE ‘14’
GROSS SALES AND OPERATING REVENUES
A. Sales:
Hydrate and Alumina (Standard Metallurgical &
Specials) 241,095 238,350 585.79 612.38
Aluminium Ingots/Billets 222,652 238,908 2,024.71 2,555.95
Aluminium Rolled Products 184,494 149,345 2,280.63 2,154.30
Aluminium Extruded Products 38,994 35,668 551.05 561.55
Aluminium Redraw Rods 91,964 74,914 913.72 843.03
Aluminium Foils 16,962 22,234 363.11 492.41
Aluminium Wheels Pcs. 10,088 Pcs. 144,368 1.14 30.34
Continuous Cast Copper Rods 146,164 146,323 4,703.01 4,241.66
Copper Cathodes 185,213 155,011 5,594.87 4,252.66
Sulphuric Acid 763,142 751,196 59.84 422.03
DAP & Complexes 176,474 175,308 327.72 812.38
Gold 9.482 4.492 1,385.12 562.62
Silver 45.325 35.978 92.04 72.81
Miscellaneous 525.27 438.85
Net Sales 19,408.02 18,052.97
Excise Duty 1,048.83 1,498.69
Gross Sales 20,456.85 19,551.66
B. Operating Revenues:
Export and Other Incentives 59.58 89.74
Miscellaneous Receipts and Claims 68.68 76.94
128.26 166.68
20,585.11 19,718.34
SCHEDULES FORMING PART OF PROFIT AND LOSS ACCOUNT
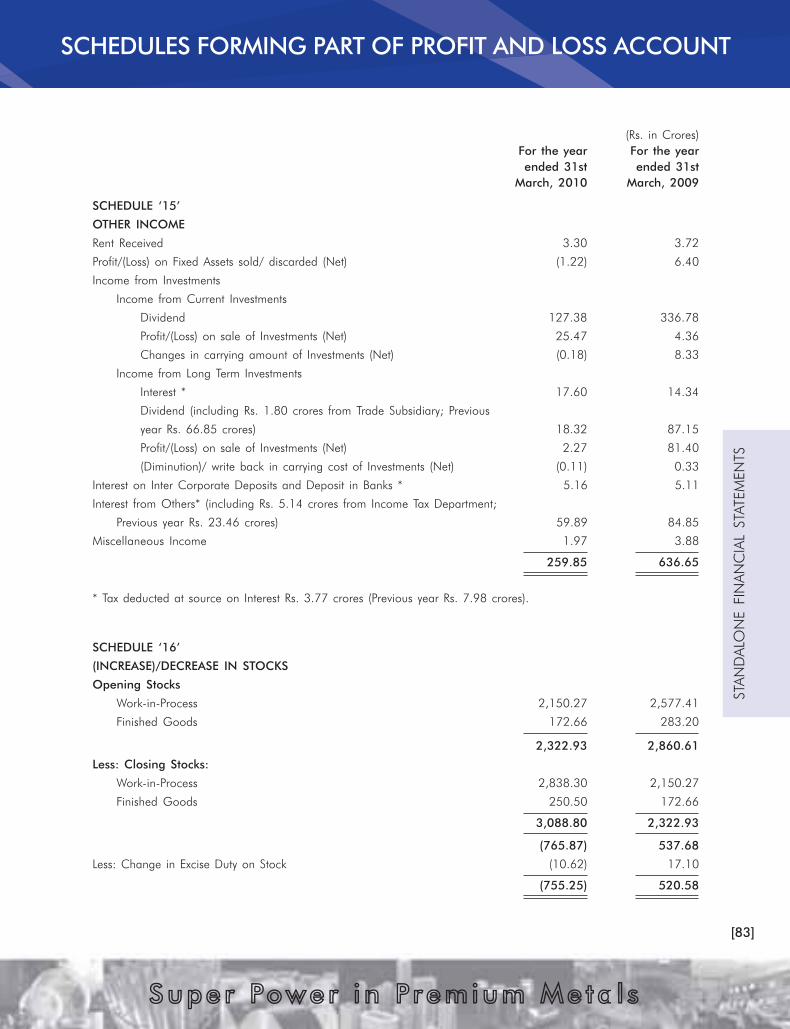
[83]
STA
ND
ALO
NE FIN
AN
CIA
L STATEM
EN
TS
Supe r Power i n Premium Me ta l s
(Rs. in Crores)
For the year For the year
ended 31st ended 31st
March, 2010 March, 2009
SCHEDULE ‘15’
OTHER INCOME
Rent Received 3.30 3.72
Profit/(Loss) on Fixed Assets sold/ discarded (Net) (1.22) 6.40
Income from Investments
Income from Current Investments
Dividend 127.38 336.78
Profit/(Loss) on sale of Investments (Net) 25.47 4.36
Changes in carrying amount of Investments (Net) (0.18) 8.33
Income from Long Term Investments
Interest * 17.60 14.34
Dividend (including Rs. 1.80 crores from Trade Subsidiary; Previous
year Rs. 66.85 crores) 18.32 87.15
Profit/(Loss) on sale of Investments (Net) 2.27 81.40
(Diminution)/ write back in carrying cost of Investments (Net) (0.11) 0.33
Interest on Inter Corporate Deposits and Deposit in Banks * 5.16 5.11
Interest from Others* (including Rs. 5.14 crores from Income Tax Department;
Previous year Rs. 23.46 crores) 59.89 84.85
Miscellaneous Income 1.97 3.88
259.85 636.65
* Tax deducted at source on Interest Rs. 3.77 crores (Previous year Rs. 7.98 crores).
SCHEDULE ‘16’
(INCREASE)/DECREASE IN STOCKS
Opening Stocks
Work-in-Process 2,150.27 2,577.41
Finished Goods 172.66 283.20
2,322.93 2,860.61
Less: Closing Stocks:
Work-in-Process 2,838.30 2,150.27
Finished Goods 250.50 172.66
3,088.80 2,322.93
(765.87) 537.68
Less: Change in Excise Duty on Stock (10.62) 17.10
(755.25) 520.58
SCHEDULES FORMING PART OF PROFIT AND LOSS ACCOUNT
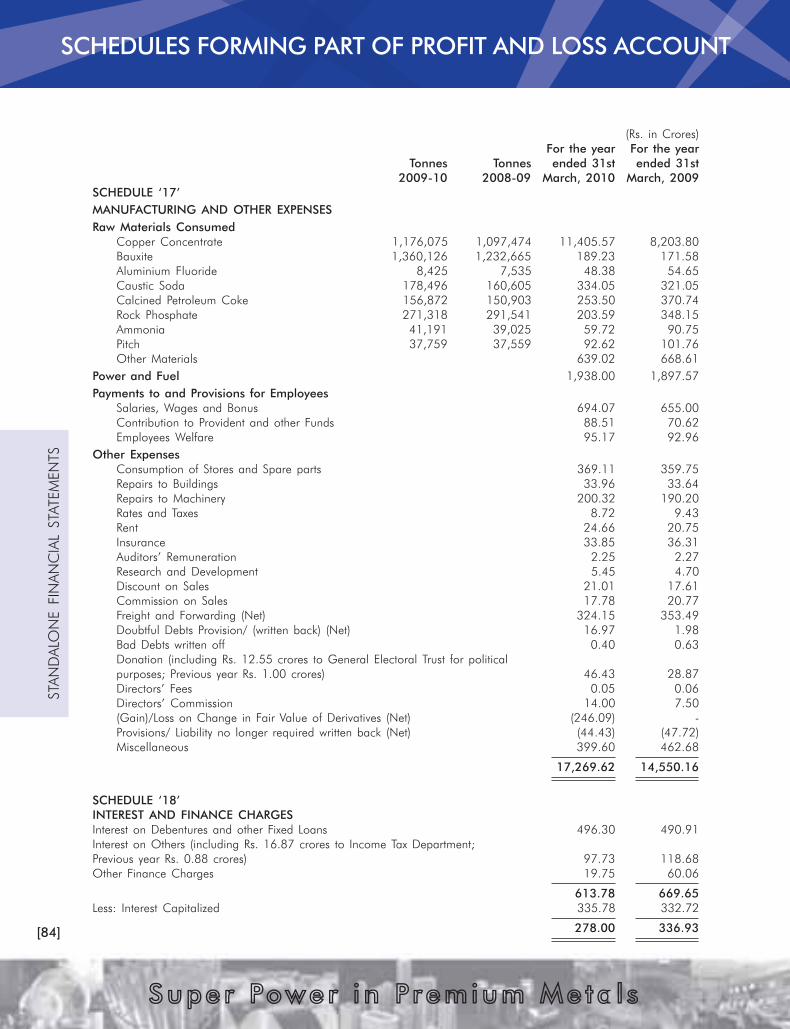
[84]
STA
ND
ALO
NE FIN
AN
CIA
L STATEM
EN
TS
Supe r Power i n Premium Me ta l s
(Rs. in Crores)
For the year For the year
Tonnes Tonnes ended 31st ended 31st
2009-10 2008-09 March, 2010 March, 2009
SCHEDULE ‘17’
MANUFACTURING AND OTHER EXPENSES
Raw Materials Consumed
Copper Concentrate 1,176,075 1,097,474 11,405.57 8,203.80
Bauxite 1,360,126 1,232,665 189.23 171.58
Aluminium Fluoride 8,425 7,535 48.38 54.65
Caustic Soda 178,496 160,605 334.05 321.05
Calcined Petroleum Coke 156,872 150,903 253.50 370.74
Rock Phosphate 271,318 291,541 203.59 348.15
Ammonia 41,191 39,025 59.72 90.75
Pitch 37,759 37,559 92.62 101.76
Other Materials 639.02 668.61
Power and Fuel 1,938.00 1,897.57
Payments to and Provisions for Employees
Salaries, Wages and Bonus 694.07 655.00
Contribution to Provident and other Funds 88.51 70.62
Employees Welfare 95.17 92.96
Other Expenses
Consumption of Stores and Spare parts 369.11 359.75
Repairs to Buildings 33.96 33.64
Repairs to Machinery 200.32 190.20
Rates and Taxes 8.72 9.43
Rent 24.66 20.75
Insurance 33.85 36.31
Auditors’ Remuneration 2.25 2.27
Research and Development 5.45 4.70
Discount on Sales 21.01 17.61
Commission on Sales 17.78 20.77
Freight and Forwarding (Net) 324.15 353.49
Doubtful Debts Provision/ (written back) (Net) 16.97 1.98
Bad Debts written off 0.40 0.63
Donation (including Rs. 12.55 crores to General Electoral Trust for political
purposes; Previous year Rs. 1.00 crores) 46.43 28.87
Directors’ Fees 0.05 0.06
Directors’ Commission 14.00 7.50
(Gain)/Loss on Change in Fair Value of Derivatives (Net) (246.09) -
Provisions/ Liability no longer required written back (Net) (44.43) (47.72)
Miscellaneous 399.60 462.68
17,269.62 14,550.16
SCHEDULE ‘18’
INTEREST AND FINANCE CHARGES
Interest on Debentures and other Fixed Loans 496.30 490.91
Interest on Others (including Rs. 16.87 crores to Income Tax Department;
Previous year Rs. 0.88 crores) 97.73 118.68
Other Finance Charges 19.75 60.06
613.78 669.65
Less: Interest Capitalized 335.78 332.72
278.00 336.93
SCHEDULES FORMING PART OF PROFIT AND LOSS ACCOUNT

[85]
STA
ND
ALO
NE FIN
AN
CIA
L STATEM
EN
TS
Supe r Power i n Premium Me ta l s
SCHEDULES
SCHEDULE ‘19’
SIGNIFICANT ACCOUNTING POLICIES & NOTES ON ACCOUNTS
A SIGNIFICANT ACCOUNTING POLICIES
1. Accounting Convention
The financial statements are prepared under the historical cost convention, on an accrual basis and in accordance
with the generally accepted accounting principles in India, the applicable mandatory Accounting Standards as notified
by the Companies (Accounting Standard) Rules, 2006 and the relevant provisions of the Companies Act, 1956 of
India.
2. Use of Estimates
The preparation of financial statements require estimates and assumptions to be made that affect the reported
amount of assets and liabilities on the date of the financial statements and the reported amount of revenues and
expenses during the reporting period. Difference between the actual results and estimates are recognized in the
period in which the results are known / materialized.
3. Fixed Assets
(a) Tangible Assets are stated at cost less accumulated depreciation and impairment loss, if any. Cost comprises
of purchase price and any directly attributable cost of bringing the assets to its working condition for its intended
use.
(b) Intangible Assets are stated at cost less accumulated amortization. Cost includes any directly attributable
expenditure on making the asset ready for its intended use.
(c) Machinery spares which can be used only in connection with an item of Fixed Asset and whose use is not of
regular nature are written off over the estimated useful life of the relevant asset.
4. Depreciation and Amortization
(a) Depreciation on Tangible Fixed Assets has been provided using Straight Line Method at the rates and manner
prescribed under Schedule XIV of Companies Act, 1956 of India.
(b) Mining Rights and leasehold land are amortized over the period of lease on straight line basis.
(c) Intangible assets are amortized over their estimated useful lives on straight line basis.
5. Impairment
An asset is treated as impaired when the carrying cost of the asset exceeds its recoverable value being higher of
value in use and net selling price. Value in use is computed at net present value of cash flow expected over the
balance useful life of the assets. An impairment loss is recognized as an expense in the Profit & Loss Account in the
year in which an asset is identified as impaired. The impairment loss recognized in prior accounting period is reversed
if there has been an improvement in recoverable amount.
6. Leases
Lease payments under an operating lease are recognized as expense in the statement of Profit & Loss Account as
per terms of lease agreement.
7. Investments
(a) Long term investments are carried at cost after deducting provision, if any, for diminution in value considered
to be other than temporary in nature.
(b) Current investments are stated at lower of cost and fair value.
8. Inventories
(a) Inventories of stores and spare parts are valued at or below cost after providing for cost of obsolescence and
other anticipated losses, wherever considered necessary.
(b) Inventories of items other than those stated above are valued ‘At cost or Net Realizable Value, whichever is
lower’. Cost is generally determined on weighted average cost basis and wherever required, appropriate
overheads are taken into account. Net Realizable Value is the estimated selling price in the ordinary course of
business less the estimated cost of completion and the estimated costs necessary to make the sale.
(c) Materials and other supplies held for use in the production of inventories are not written down below cost if
the finished products in which they will be incorporated are expected to be sold at or above cost.
9. Foreign Currency Transactions
Transactions in foreign currency are recorded at the rate of exchange prevailing on the date of transaction. Year
end balance of foreign currency transactions is translated at the year end rates. Exchange differences arising on
settlement of monetary items or on reporting of monetary items at rates different from those at which they were
initially recorded during the period or reported in previous financial statements are recognized as income or expense
in the period in which they arise.

[86]
STA
ND
ALO
NE FIN
AN
CIA
L STATEM
EN
TS
Supe r Power i n Premium Me ta l s
SCHEDULES
10. Employee benefits
Employee benefits of short term nature are recognized as expense as and when it accrues. Long term employee
benefits (e.g. long-service leave) and post employment benefits (e.g. gratuity), both funded and unfunded, are
recognized as expense based on actuarial valuation at year end using the Projected unit credit method. Actuarial
gain and losses are recognized immediately in the Profit & Loss Account.
11. Employee Stock Option Scheme
In respect of stock option granted to employees pursuant to the Company’s stock option schemes, accounting is
done as per the intrinsic value method permitted by the SEBI guidelines, 1999 and the Guidance Note on Share
Based Payment issued by the ICAI. The excess of market price of share as on date of grant of option over the
exercise price is recognized as deferred employee compensation and is charged to Profit & Loss Account on straight
line basis over the vesting period.
12. Revenue Recognition
Sales revenue is recognized on transfer of significant risk and rewards of the ownership of the goods to the buyer
and stated at net of trade discount and rebates. Dividend income on investments is accounted for when the right
to receive the payment is established. Export incentive, certain insurance, railway and other claims where quantum
of accruals can not be ascertained with reasonable certainty, are accounted on acceptance basis.
13. Borrowing Cost
Borrowing costs directly attributable to the acquisition or construction of qualifying assets are capitalized. Other
borrowing costs are recognized as expenses in the period in which they are incurred. In determining the amount of
borrowing costs eligible for capitalization during a period, any income earned on the temporary investment of
those borrowings is deducted from the borrowing costs incurred.
14. Taxation
Provision for current income tax is made in accordance with the Income tax Act, 1961. Deferred tax liabilities and
assets are recognized at substantively enacted tax rates, subject to the consideration of prudence, on timing difference,
being the difference between taxable income and accounting income that originate in one period and are capable
of reversal in one or more subsequent periods.
15. Derivative Financial Instruments
(a) The Company uses derivative financial instruments such as Forwards, Swaps, Options, etc. to hedge its risks
associated with foreign exchange fluctuations. Risks associated with fluctuations in the price of the Company’s
products (Copper, Alumina, Aluminium and precious metals) are minimised by undertaking appropriate hedging
transactions. The fair values of all such derivative financial instruments are recognized as assets or liabilities
at the balance sheet date.
(b) For derivative financial instruments designated as Cash Flow hedges, the effective portion of the fair value of
the derivative financial instruments are recognized in Hedging Reserve and reclassified to ‘Sales’, ‘Raw Materials
Consumed’ or ‘Other Expenses’ in the period in which the Profit & Loss Account is impacted by the hedged
items or in the period when the hedge relationship no longer qualifies as cash flow hedge. If the hedging
relationship ceases to be effective or it becomes probable that the expected transaction will no longer occur,
future gains or losses on the derivative financial instruments are recognized in ‘Other Expenses’ in the Profit &
Loss Account.
(c) For derivative financial instruments designated as Fair Value hedges, the fair value of both the derivative financial
instrument and the hedged item are recognized in ‘Sales’, ‘Raw Materials Consumed’ or ‘Other Expenses’ in
the Profit & Loss Account till the period the relationship is found to be effective. If the hedging relationship
ceases to be effective or it becomes probable that the expected transaction will no longer occur, future gains
or losses on the derivative financial instruments are recognized in ‘Other Expenses’ in the Profit & Loss Account.
(d) If no hedging relationship is designated, the fair value of the derivative financial instruments is marked to
market through Profit & Loss Account and included in ‘Other Expenses’.
16. Research and Development
Expenditure incurred during research phase is charged to revenue when no intangible asset arises from such research.
Assets procured for research and development activities are generally capitalized.
17. Government Grants
Government Grants are recognized when there is a reasonable assurance that the same will be received. Revenue
grants are recognized in the Profit & Loss Account. Capital grants relating to specific fixed assets are reduced from
the gross value of the respective fixed assets. Other capital grants are credited to Capital Reserve.
SCHEDULE ‘19’ (Cont’d)
SIGNIFICANT ACCOUNTING POLICIES & NOTES ON ACCOUNTS (Cont’d)
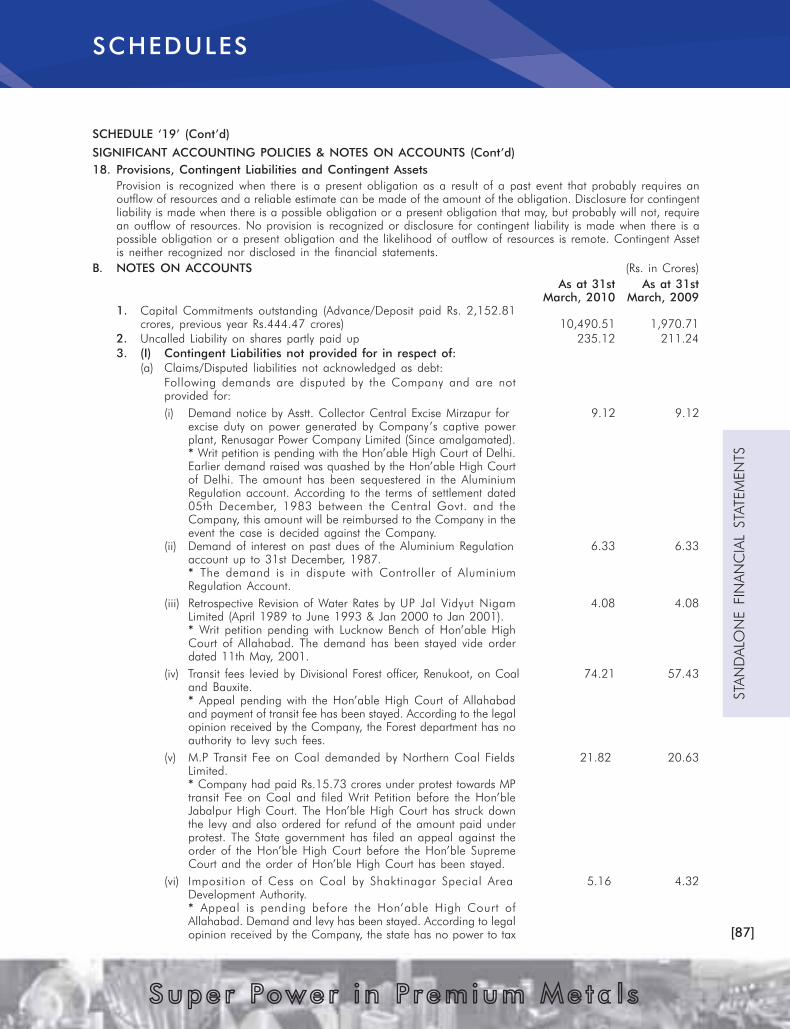
[87]
STA
ND
ALO
NE FIN
AN
CIA
L STATEM
EN
TS
Supe r Power i n Premium Me ta l s
SCHEDULES
18. Provisions, Contingent Liabilities and Contingent Assets
Provision is recognized when there is a present obligation as a result of a past event that probably requires an
outflow of resources and a reliable estimate can be made of the amount of the obligation. Disclosure for contingent
liability is made when there is a possible obligation or a present obligation that may, but probably will not, require
an outflow of resources. No provision is recognized or disclosure for contingent liability is made when there is a
possible obligation or a present obligation and the likelihood of outflow of resources is remote. Contingent Asset
is neither recognized nor disclosed in the financial statements.
B. NOTES ON ACCOUNTS (Rs. in Crores)
As at 31st As at 31st
March, 2010 March, 2009
1. Capital Commitments outstanding (Advance/Deposit paid Rs. 2,152.81
crores, previous year Rs.444.47 crores) 10,490.51 1,970.71
2. Uncalled Liability on shares partly paid up 235.12 211.24
3. (I) Contingent Liabilities not provided for in respect of:
(a) Claims/Disputed liabilities not acknowledged as debt:
Following demands are disputed by the Company and are not
provided for:
(i) Demand notice by Asstt. Collector Central Excise Mirzapur for 9.12 9.12
excise duty on power generated by Company’s captive power
plant, Renusagar Power Company Limited (Since amalgamated).
* Writ petition is pending with the Hon’able High Court of Delhi.
Earlier demand raised was quashed by the Hon’able High Court
of Delhi. The amount has been sequestered in the Aluminium
Regulation account. According to the terms of settlement dated
05th December, 1983 between the Central Govt. and the
Company, this amount will be reimbursed to the Company in the
event the case is decided against the Company.
(ii) Demand of interest on past dues of the Aluminium Regulation 6.33 6.33
account up to 31st December, 1987.
* The demand is in dispute with Controller of Aluminium
Regulation Account.
(iii) Retrospective Revision of Water Rates by UP Jal Vidyut Nigam 4.08 4.08
Limited (April 1989 to June 1993 & Jan 2000 to Jan 2001).
* Writ petition pending with Lucknow Bench of Hon’able High
Court of Allahabad. The demand has been stayed vide order
dated 11th May, 2001.
(iv) Transit fees levied by Divisional Forest officer, Renukoot, on Coal 74.21 57.43
and Bauxite.
* Appeal pending with the Hon’able High Court of Allahabad
and payment of transit fee has been stayed. According to the legal
opinion received by the Company, the Forest department has no
authority to levy such fees.
(v) M.P Transit Fee on Coal demanded by Northern Coal Fields 21.82 20.63
Limited.
* Company had paid Rs.15.73 crores under protest towards MP
transit Fee on Coal and filed Writ Petition before the Hon’ble
Jabalpur High Court. The Hon’ble High Court has struck down
the levy and also ordered for refund of the amount paid under
protest. The State government has filed an appeal against the
order of the Hon’ble High Court before the Hon’ble Supreme
Court and the order of Hon’ble High Court has been stayed.
(vi) Imposition of Cess on Coal by Shaktinagar Special Area 5.16 4.32
Development Authority.
* Appeal is pending before the Hon’able High Court of
Allahabad. Demand and levy has been stayed. According to legal
opinion received by the Company, the state has no power to tax
SCHEDULE ‘19’ (Cont’d)
SIGNIFICANT ACCOUNTING POLICIES & NOTES ON ACCOUNTS (Cont’d)

[88]
STA
ND
ALO
NE FIN
AN
CIA
L STATEM
EN
TS
Supe r Power i n Premium Me ta l s
the mineral since this field is covered under Mines and Minerals
Development and Regulation Act.
(vii) Demand of Royalty on Vanadium by District Mining officer,
Lohardaga. 8.44 8.44
* Appeal is pending with the Hon’able High Court of Allahabad.
The demand has been stayed on certain conditions.
(viii) The demand of Excise Duty on gold. 155.31 155.31
* Part of the demand was confirmed against which our ROM
request is pending at CESTAT. Department’s appeal is pending
before the Hon’able Supreme Court for the part of the demand
and penalty that was dropped.
(ix) Demand for disallowances of depreciation claim and other claim
on the leased assets by Lessor. 18.02 18.02
* Matter is pending with Lessor.
(x) Tax under MPGATSVA, 2005 @ 5% on basic price of coal w.e.f.
30th September, 2005 by M.P. State Government. 48.19 41.03
*Writ petition has been filed before the Hon’able High Court of
Madhya Pradesh at Jabalpur. Demand has been stayed.
(xi) Demand raised on the assessment for entry tax with retrospective
effect from the period 01st November, 1999 to till date. 179.28 148.42
* Writ petition is pending before Hon’able High Court of
Allahabad and demand has been stayed.
(xii) Demand raised on assessment under CST Act and UP Sales Tax Act. 5.56 34.07
* Appeals have been filed with Sales Tax Tribunal and JC Appeal
for different years.
(xiii) Revision of surface rent on land by Government of Jharkhand
w.e.f. 16th June, 2005. 11.07 7.29
* Matter is in dispute at Hon’able High Court of Jharkhand.
(xiv) Demand made by Nayab Tehsildar Kusmi / Collector under 2.71 2.26
Chattisgarh as per Adhosanrachna Vikas evam Parayavaran
Upkar Adhiniyam, 2005 @ 5% as environment tax on royalty plus
5% as development tax.
*The Writ petition which has been filed by the Company before
Hon’able High Court of Chhattisgarh at Bilaspur, has been
transferred to the Hon’able Supreme Court and tagged with other
Civil Appeals.
(xv) Service tax paid on Goods Transport Agency and Business Auxiliary
Services. 11.27 7.42
* Commissioner has confirmed the demand. Appeal is being
filed at CESTAT New Delhi.
(xvi) M.P Transit fee on Bauxite. 1.20 1.16
* Writ petition pending with the Hon’able High Court at
Jabalpur.
(xvii) Demand for Entry Tax relating to valuation dispute of 2004-05 1.18 1.18
to 2005-06, for which appeals have been filed.
* Appeal has been filed with Additional CCT, Sambalpur.
(xviii) CST demand on reopening of assessments for 1999-00 to
2003-04. 8.81 8.81
* Appeals have been filed.
(xix) Demand on Interest on excess CENVAT Credit taken. 1.00 1.00
*Appeal pending with CESTAT, Mumbai.
SCHEDULE ‘19’ (Cont’d)
B. NOTES ON ACCOUNTS (Cont’d)
(Rs. in Crores)
As at 31st As at 31st
March, 2010 March, 2009
SCHEDULES

[89]
STA
ND
ALO
NE FIN
AN
CIA
L STATEM
EN
TS
Supe r Power i n Premium Me ta l s
(xx) Disallowances of Sales Tax Forms for Sales Tax Assessment - 1.21
year 1997-98.
*Appeal is pending with Joint Commissioner (Appeal), Vadodara,
Gujarat.
(xxi) Demand for Sales Tax u/s 15B for A.Y. 2001-02 & 2002-03. 14.62 8.72
* Appeal is pending with J. C Appellate Authority, Baroda.
(xxii) Demand for Stamp Duty on Imported Cargo. - 27.72
* Matter is pending with Hon’ble High Court, Ahmedabad.
(xxiii) Service tax on insurance policy attributable to Renusagar. 2.86 2.11
* Commissioner has confirmed the demand. Appeal is pending
before the CESTAT, New Delhi.
(xxiv) Demand of Interest on differential duty on account of final 17.55 17.55
assessment of Bill of Entries.
*The matter is pending with Commissioner of Customs, Appeal,
Ahmedabad.
(xxv) Disallowance of CENVAT credit. 5.29 5.29
*The matter is pending with CESTAT, Ahmedabad.
(xxvi) Demand for interest on claim with IFFCO, Kandla. 6.79 6.05
* Matter is pending with arbitrator.
(xxvii) Demand raised on assessment under CST Act and APGST Act 5.56 1.86
for various years.
* Appeals have been filed with appropriate authorities.
(xxviii) Demand for Service Tax on Consulting Engineer Services and 3.84 3.84
Scientific & Tech Service.
* Appeal pending with Commissioner (Appeals), Ahmedabad.
(xxix) Excise duty on Dross 9.13 -
*Company has challenged the letter issued by Excise department
to pay Excise duty on dross before Hon’ble Allahabad High court.
(xxx) Claim for Plot Rent at Lohardaga Siding 3.39 -
*Excess amount demanded by Railway authorities. Protest letter
regarding excess demand has been given to railway authorities.
(xxxi) Other Contingent Liabilities in respect of Excise, Customs, Sales
Tax etc. each being for less than Rs.1 crore. 12.08 13.18
* The demands are in dispute at various legal forums.
Tota l 653.87 623.85
* indicating uncertainties
(b) (i) Bills discounted with Banks 0.19 -
(ii) Corporate Guarantees outstanding
**(Rs. 7,446.04 crores (previous year Rs. 7,164.54 crores) given
on behalf of subsidiary companies). 7,462.75 7,181.25
(c) The Company has received supplementary bills on account of revision
in rate of power for Main Supply from the UPSEB for the period 15th
May, 1976 to 30th June, 1980 and the same remains un-provided
for as disputed by the Company. - 5.01
(d) Customs duty on Capital Goods and Raw Materials imported under
Advance Licence / EPCG Scheme, against which export obligation is
to be fulfilled. 168.46 187.78
** Includes US$ 1.4 billion (Rs. 6,276.20 crores (previous year Rs. 7,133.00 crores)) given by the Company
for due performance of facility agreement entered into by one of its wholly owned subsidiary Companies with
the Bankers for availing loan of US$ 981.80 million for acquisition of Novelis Inc.
SCHEDULE ‘19’ (Cont’d)
B. NOTES ON ACCOUNTS (Cont’d)
(Rs. in Crores)
As at 31st As at 31st
March, 2010 March, 2009
SCHEDULES

[90]
STA
ND
ALO
NE FIN
AN
CIA
L STATEM
EN
TS
Supe r Power i n Premium Me ta l s
(II) Provisions:
(Rs. in Crores)
Nature Balance as Addition Utilisation Balance as at
at 1st April, during the during the 31st March,
2009 year year 2010
Excise duty on electricity 5.47 - - 5.47
Sales tax 1.84 - - 1.84
Others 7.19 - - 7.19
Total 14.50 - - 14.50
(a) The provision for excise duty and sales tax are on account of legal matters, where the Company
anticipates probable outflow. The amount of provision is estimated by the Company considering the
facts and circumstances of each case for which cash flow will be determined on settlement of these
matters.
(b) Provision for others is on account of dispute pertaining to non-supply of material to a customer.
(III) The Company has given undertakings to various Financial Institutions and Banks, as relevant, for:
(i) Non disposal of equity shares of Aditya Birla Chemicals (India) Limited till the Institutional Loans are
repaid in full in addition to finance the cost over run, if any, in respect of an on-going project of the
Company for which the loan has been taken.
(ii) Following Sponsors Undertakings have been given by the Company, along with Aditya Birla Nuvo
Ltd, Grasim Industries Ltd. and Birla TMT Holdings Pvt. Ltd (the Sponsors), being promoters of IDEA
Cellular Ltd.( IDEA).:-
(a) The Sponsors shall collectively continue to hold at least 33% of the equity capital of IDEA till the
end of FY 2015-16 and shall not without prior written approval of the Facility Agent, divest,
transfer, assign, dispose of, pledge, charge, create any lien or in any way encumber 33% of
shareholdings in IDEA. Consequent upon the infusion of fresh equity capital of IDEA, if the
Sponsors’ stake gets diluted from 40% to 33% in the equity capital of IDEA, the Sponsors agree
and undertake to obtain the prior consent of the Rupee Facility Agent and in other circumstances,
the Sponsors agree and undertake to obtain the prior consent of the secured lenders representing
51% of the aggregate outstanding secured loans.
(b) The Sponsors shall collectively continue to hold 26% of the equity capital of IDEA after FY 2015-
16 and shall not without the prior written approval of the Rupee Facility Agent, divest, transfer,
assign, dispose of, pledge, charge, create any lien or in any way encumber 26% shareholdings
in the capital of IDEA.
(c) Not without prior approval of the Facility Agent in writing divest shareholdings in the equity capital
of IDEA that may result in a single investor along with its affiliates holding more than 25% of
the equity capital of IDEA.
4. The Company has received a notice dated 24th March, 2007 from collector (Stamp) Kanpur, Uttar Pradesh alleging
that stamp duty of Rs. 252.96 crores is payable in view of order dated 18th November, 2002 of Hon’ble High
Court of Allahabad approving scheme of arrangement for merger of Copper business of Indo Gulf Corporation
Limited with the Company. The Company is of the opinion that it has a very strong case as there is no substantive/
computation provision for levy/calculation of stamp duty on court order approving scheme of arrangement under
Companies Act, 1956 within the provisions of Uttar Pradesh Stamp Act, moreover the properties in question are
located in the State of Gujarat and thus the collector (stamp) Kanpur has no territorial jurisdiction to make such a
demand. It is pertinent to note that the Company in 2003-04 has already paid stamp duty which has been accepted
as per the provisions of the Bombay Stamp Act 1958 with regard to transfer of shareholding of Indo Gulf Corporation
Limited as per the Scheme of Arrangement. Furthermore, the demand made is on an incorrect assumption. The
Company’s contention amongst the various other grounds made is that the demand is illegal, against the principles
of natural justice, incorrect, bad in law and malafide. The Company has filed a writ petition before the Hon’able
High Court of Allahabad, inter alia, on the above said grounds, which is pending determination.
SCHEDULE ‘19’ (Cont’d)
B. NOTES ON ACCOUNTS (Cont’d)
SCHEDULES
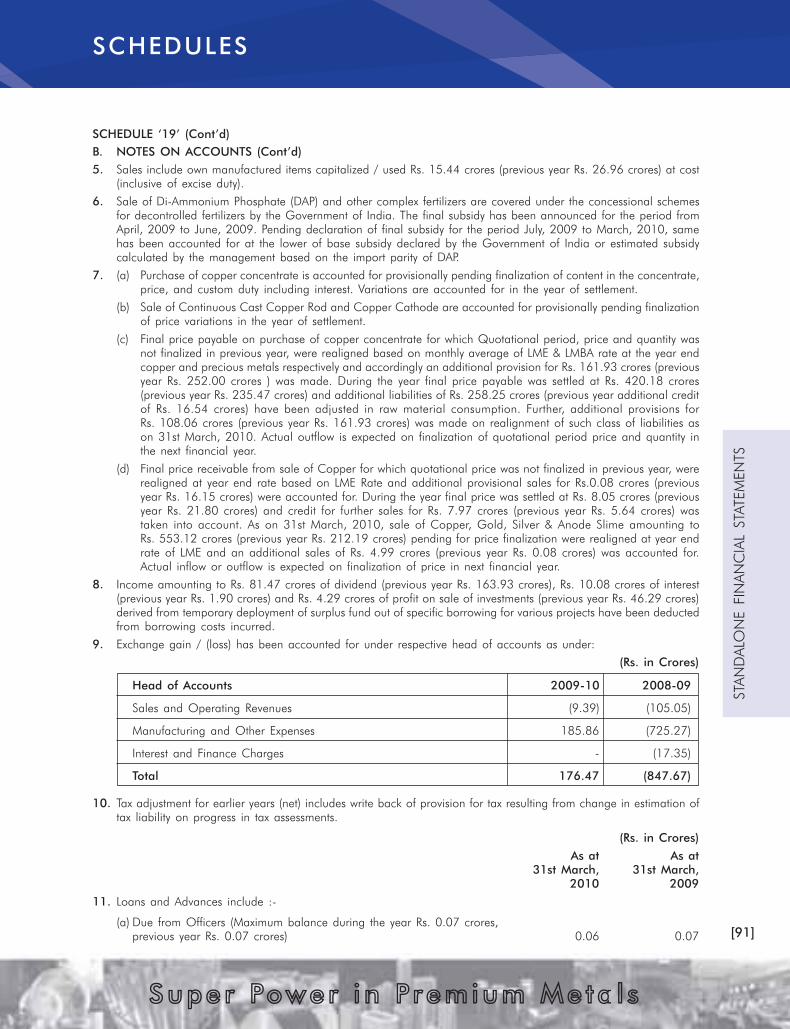
[91]
STA
ND
ALO
NE FIN
AN
CIA
L STATEM
EN
TS
Supe r Power i n Premium Me ta l s
5. Sales include own manufactured items capitalized / used Rs. 15.44 crores (previous year Rs. 26.96 crores) at cost
(inclusive of excise duty).
6. Sale of Di-Ammonium Phosphate (DAP) and other complex fertilizers are covered under the concessional schemes
for decontrolled fertilizers by the Government of India. The final subsidy has been announced for the period from
April, 2009 to June, 2009. Pending declaration of final subsidy for the period July, 2009 to March, 2010, same
has been accounted for at the lower of base subsidy declared by the Government of India or estimated subsidy
calculated by the management based on the import parity of DAP.
7. (a) Purchase of copper concentrate is accounted for provisionally pending finalization of content in the concentrate,
price, and custom duty including interest. Variations are accounted for in the year of settlement.
(b) Sale of Continuous Cast Copper Rod and Copper Cathode are accounted for provisionally pending finalization
of price variations in the year of settlement.
(c) Final price payable on purchase of copper concentrate for which Quotational period, price and quantity was
not finalized in previous year, were realigned based on monthly average of LME & LMBA rate at the year end
copper and precious metals respectively and accordingly an additional provision for Rs. 161.93 crores (previous
year Rs. 252.00 crores ) was made. During the year final price payable was settled at Rs. 420.18 crores
(previous year Rs. 235.47 crores) and additional liabilities of Rs. 258.25 crores (previous year additional credit
of Rs. 16.54 crores) have been adjusted in raw material consumption. Further, additional provisions for
Rs. 108.06 crores (previous year Rs. 161.93 crores) was made on realignment of such class of liabilities as
on 31st March, 2010. Actual outflow is expected on finalization of quotational period price and quantity in
the next financial year.
(d) Final price receivable from sale of Copper for which quotational price was not finalized in previous year, were
realigned at year end rate based on LME Rate and additional provisional sales for Rs.0.08 crores (previous
year Rs. 16.15 crores) were accounted for. During the year final price was settled at Rs. 8.05 crores (previous
year Rs. 21.80 crores) and credit for further sales for Rs. 7.97 crores (previous year Rs. 5.64 crores) was
taken into account. As on 31st March, 2010, sale of Copper, Gold, Silver & Anode Slime amounting to
Rs. 553.12 crores (previous year Rs. 212.19 crores) pending for price finalization were realigned at year end
rate of LME and an additional sales of Rs. 4.99 crores (previous year Rs. 0.08 crores) was accounted for.
Actual inflow or outflow is expected on finalization of price in next financial year.
8. Income amounting to Rs. 81.47 crores of dividend (previous year Rs. 163.93 crores), Rs. 10.08 crores of interest
(previous year Rs. 1.90 crores) and Rs. 4.29 crores of profit on sale of investments (previous year Rs. 46.29 crores)
derived from temporary deployment of surplus fund out of specific borrowing for various projects have been deducted
from borrowing costs incurred.
9. Exchange gain / (loss) has been accounted for under respective head of accounts as under:
(Rs. in Crores)
Head of Accounts 2009-10 2008-09
Sales and Operating Revenues (9.39) (105.05)
Manufacturing and Other Expenses 185.86 (725.27)
Interest and Finance Charges - (17.35)
Total 176.47 (847.67)
10. Tax adjustment for earlier years (net) includes write back of provision for tax resulting from change in estimation of
tax liability on progress in tax assessments.
(Rs. in Crores)
As at As at
31st March, 31st March,
2010 2009
11. Loans and Advances include :-
(a) Due from Officers (Maximum balance during the year Rs. 0.07 crores,
previous year Rs. 0.07 crores) 0.06 0.07
SCHEDULE ‘19’ (Cont’d)
B. NOTES ON ACCOUNTS (Cont’d)
SCHEDULES

[92]
STA
ND
ALO
NE FIN
AN
CIA
L STATEM
EN
TS
Supe r Power i n Premium Me ta l s
(b) To subsidiary companies:-
(Rs. in Crores)
Name of Subsidiary As at Maximum As at Maximum
31st March, outstanding 31st March, outstanding
2010 during 2010 2009 during 2009
Renukeshwar Investments & Finance Limited - 0.00 - 0.05
Renuka Investments & Finance Limited - 0.18 - 0.08
Aditya Birla Chemicals (India) Limited 0.01 0.02 - 13.03
Lucknow Finance Company Limited (without interest) - 0.48 - 0.52
Utkal Alumina International Limited 0.51 498.62 319.92 319.94
Indal Exports Limited - 0.01 0.01 0.01
Birla (Nifty) Pty Limited - 194.21 194.21 327.85
Birla Mt. Gordon Pty Limited - 96.75 96.76 103.40
East Coast Bauxite Mining Company Private Limited 0.01 0.02 0.01 0.01
Hindalco-Almex Aerospace limited 69.99 70.00 0.03 3.91
Dahej Harbour and Infrastructure Limited 0.00 0.00 - -
Suvas Holdings Limited 0.00 1.84 - -
Tubed Coal Mines Limited 0.00 0.00 - 0.08
A V Minerals (Netherlands) B.V. - 114.00 - 10,084.71
Novelis Inc. 0.06 0.08 0.08 0.75
Total 70.58 611.02
(c) Inter Corporate Deposits include:
(i) Rs. 32.35 crores (previous year Rs. 13.23 crores) given to Aditya Birla Science and Technology Company
Limited, an associate of the Company, bearing interest. Maximum balance outstanding during the year
was Rs. 32.35 crores (previous year Rs. 13.23 crores).
(ii) The Company is one of the promoter members of Aditya Birla Management Corporation Private Limited
(ABMCPL), a Company limited by guarantee which has been formed to provide common facilities and
resources to its members, with a view to optimize the benefits of specialization and minimize cost for
each member. The Company is one of the participants in the common pool and shares the expenses
incurred by ABMCPL and accounted for under appropriate heads.
Rs. nil (previous year Rs. 24.02 crores) is given to ABMCPL, bearing interest. Maximum balance outstanding
during the year was Rs. 24.02 crores (previous year Rs. 24.02 crores).
(d) Loan to employees as per Company’s policy are not considered.
(e) Balances with Trident Trust representing 16,316,130 equity shares of Re.1/- each of the Company issued
pursuant to the Scheme of Arrangement approved by the Hon’ble High Courts at Mumbai and Allahabad
vide their Orders dated 31st October, 2002 and 18th November, 2002, respectively, to the Trident Trust, which
is created wholly for the benefit of the Company and is being managed by trustees appointed by it. The tenure
of the trust has been extended up to 23rd January, 2017.
12. Receivables (Sundry Debtors) include following amounts outstanding from subsidiary companies:–
(Rs. in Crores)
As at Maximum As at Maximum
31 March, balance 31 March, balance
2010 outstanding 2009 outstanding
Aditya Birla Chemicals (India) Limited 1.10 1.30 (0.10) 2.66
Hindalco-Almex Aerospace Limited 1.55 3.62 1.66 4.31
Total 2.65 1.56
SCHEDULE ‘19’ (Cont’d)
B. NOTES ON ACCOUNTS (Cont’d)
SCHEDULES
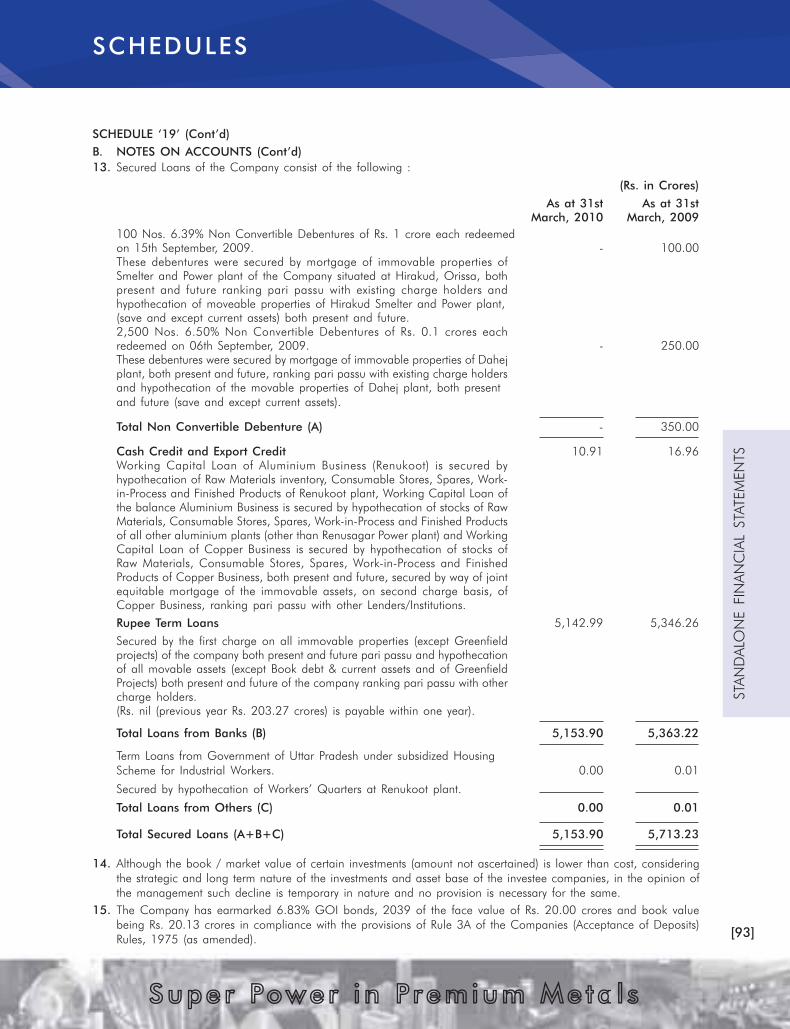
[93]
STA
ND
ALO
NE FIN
AN
CIA
L STATEM
EN
TS
Supe r Power i n Premium Me ta l s
SCHEDULE ‘19’ (Cont’d)
B. NOTES ON ACCOUNTS (Cont’d)
13. Secured Loans of the Company consist of the following :
(Rs. in Crores)
As at 31st As at 31st
March, 2010 March, 2009
100 Nos. 6.39% Non Convertible Debentures of Rs. 1 crore each redeemed
on 15th September, 2009. - 100.00
These debentures were secured by mortgage of immovable properties of
Smelter and Power plant of the Company situated at Hirakud, Orissa, both
present and future ranking pari passu with existing charge holders and
hypothecation of moveable properties of Hirakud Smelter and Power plant,
(save and except current assets) both present and future.
2,500 Nos. 6.50% Non Convertible Debentures of Rs. 0.1 crores each
redeemed on 06th September, 2009. - 250.00
These debentures were secured by mortgage of immovable properties of Dahej
plant, both present and future, ranking pari passu with existing charge holders
and hypothecation of the movable properties of Dahej plant, both present
and future (save and except current assets).
Total Non Convertible Debenture (A) - 350.00
Cash Credit and Export Credit 10.91 16.96
Working Capital Loan of Aluminium Business (Renukoot) is secured by
hypothecation of Raw Materials inventory, Consumable Stores, Spares, Work-
in-Process and Finished Products of Renukoot plant, Working Capital Loan of
the balance Aluminium Business is secured by hypothecation of stocks of Raw
Materials, Consumable Stores, Spares, Work-in-Process and Finished Products
of all other aluminium plants (other than Renusagar Power plant) and Working
Capital Loan of Copper Business is secured by hypothecation of stocks of
Raw Materials, Consumable Stores, Spares, Work-in-Process and Finished
Products of Copper Business, both present and future, secured by way of joint
equitable mortgage of the immovable assets, on second charge basis, of
Copper Business, ranking pari passu with other Lenders/Institutions.
Rupee Term Loans 5,142.99 5,346.26
Secured by the first charge on all immovable properties (except Greenfield
projects) of the company both present and future pari passu and hypothecation
of all movable assets (except Book debt & current assets and of Greenfield
Projects) both present and future of the company ranking pari passu with other
charge holders.
(Rs. nil (previous year Rs. 203.27 crores) is payable within one year).
Total Loans from Banks (B) 5,153.90 5,363.22
Term Loans from Government of Uttar Pradesh under subsidized Housing
Scheme for Industrial Workers. 0.00 0.01
Secured by hypothecation of Workers’ Quarters at Renukoot plant.
Total Loans from Others (C) 0.00 0.01
Total Secured Loans (A+B+C) 5,153.90 5,713.23
14. Although the book / market value of certain investments (amount not ascertained) is lower than cost, considering
the strategic and long term nature of the investments and asset base of the investee companies, in the opinion of
the management such decline is temporary in nature and no provision is necessary for the same.
15. The Company has earmarked 6.83% GOI bonds, 2039 of the face value of Rs. 20.00 crores and book value
being Rs. 20.13 crores in compliance with the provisions of Rule 3A of the Companies (Acceptance of Deposits)
Rules, 1975 (as amended).
SCHEDULES
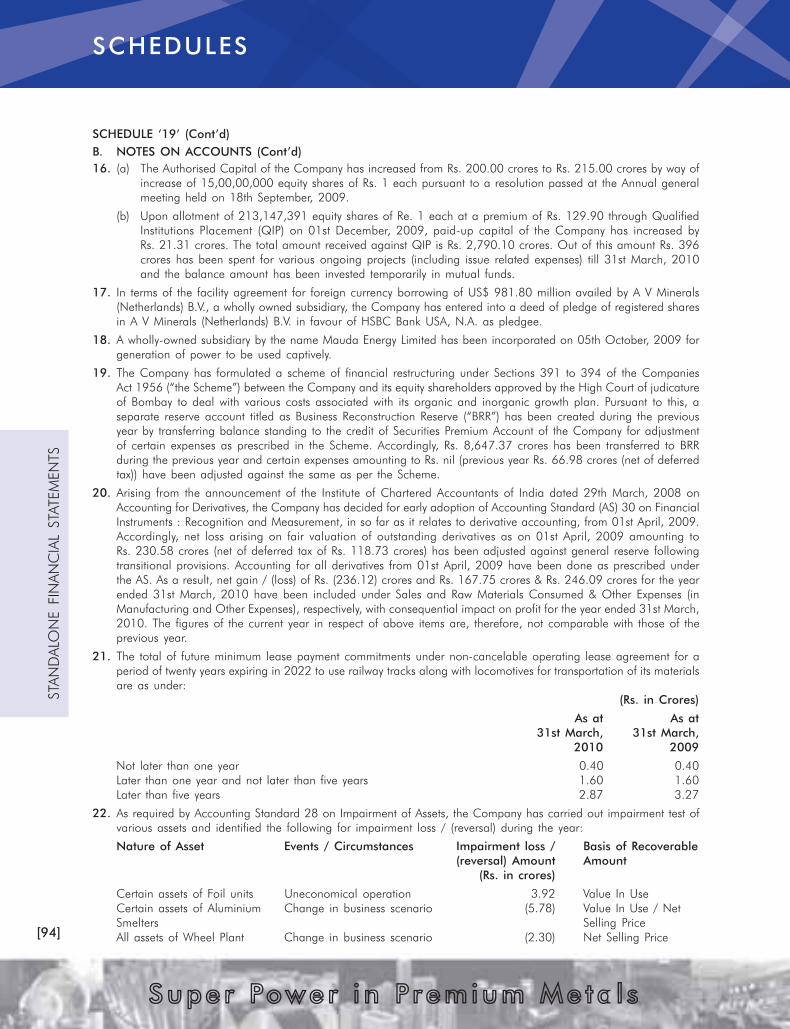
[94]
STA
ND
ALO
NE FIN
AN
CIA
L STATEM
EN
TS
Supe r Power i n Premium Me ta l s
16. (a) The Authorised Capital of the Company has increased from Rs. 200.00 crores to Rs. 215.00 crores by way of
increase of 15,00,00,000 equity shares of Rs. 1 each pursuant to a resolution passed at the Annual general
meeting held on 18th September, 2009.
(b) Upon allotment of 213,147,391 equity shares of Re. 1 each at a premium of Rs. 129.90 through Qualified
Institutions Placement (QIP) on 01st December, 2009, paid-up capital of the Company has increased by
Rs. 21.31 crores. The total amount received against QIP is Rs. 2,790.10 crores. Out of this amount Rs. 396
crores has been spent for various ongoing projects (including issue related expenses) till 31st March, 2010
and the balance amount has been invested temporarily in mutual funds.
17. In terms of the facility agreement for foreign currency borrowing of US$ 981.80 million availed by A V Minerals
(Netherlands) B.V., a wholly owned subsidiary, the Company has entered into a deed of pledge of registered shares
in A V Minerals (Netherlands) B.V. in favour of HSBC Bank USA, N.A. as pledgee.
18. A wholly-owned subsidiary by the name Mauda Energy Limited has been incorporated on 05th October, 2009 for
generation of power to be used captively.
19. The Company has formulated a scheme of financial restructuring under Sections 391 to 394 of the Companies
Act 1956 (“the Scheme”) between the Company and its equity shareholders approved by the High Court of judicature
of Bombay to deal with various costs associated with its organic and inorganic growth plan. Pursuant to this, a
separate reserve account titled as Business Reconstruction Reserve (“BRR”) has been created during the previous
year by transferring balance standing to the credit of Securities Premium Account of the Company for adjustment
of certain expenses as prescribed in the Scheme. Accordingly, Rs. 8,647.37 crores has been transferred to BRR
during the previous year and certain expenses amounting to Rs. nil (previous year Rs. 66.98 crores (net of deferred
tax)) have been adjusted against the same as per the Scheme.
20. Arising from the announcement of the Institute of Chartered Accountants of India dated 29th March, 2008 on
Accounting for Derivatives, the Company has decided for early adoption of Accounting Standard (AS) 30 on Financial
Instruments : Recognition and Measurement, in so far as it relates to derivative accounting, from 01st April, 2009.
Accordingly, net loss arising on fair valuation of outstanding derivatives as on 01st April, 2009 amounting to
Rs. 230.58 crores (net of deferred tax of Rs. 118.73 crores) has been adjusted against general reserve following
transitional provisions. Accounting for all derivatives from 01st April, 2009 have been done as prescribed under
the AS. As a result, net gain / (loss) of Rs. (236.12) crores and Rs. 167.75 crores & Rs. 246.09 crores for the year
ended 31st March, 2010 have been included under Sales and Raw Materials Consumed & Other Expenses (in
Manufacturing and Other Expenses), respectively, with consequential impact on profit for the year ended 31st March,
2010. The figures of the current year in respect of above items are, therefore, not comparable with those of the
previous year.
21. The total of future minimum lease payment commitments under non-cancelable operating lease agreement for a
period of twenty years expiring in 2022 to use railway tracks along with locomotives for transportation of its materials
are as under:
(Rs. in Crores)
As at As at
31st March, 31st March,
2010 2009
Not later than one year 0.40 0.40
Later than one year and not later than five years 1.60 1.60
Later than five years 2.87 3.27
22. As required by Accounting Standard 28 on Impairment of Assets, the Company has carried out impairment test of
various assets and identified the following for impairment loss / (reversal) during the year:
Nature of Asset Events / Circumstances Impairment loss / Basis of Recoverable
(reversal) Amount Amount
(Rs. in crores)
Certain assets of Foil units Uneconomical operation 3.92 Value In Use
Certain assets of Aluminium Change in business scenario (5.78) Value In Use / Net
Smelters Selling Price
All assets of Wheel Plant Change in business scenario (2.30) Net Selling Price
SCHEDULE ‘19’ (Cont’d)
B. NOTES ON ACCOUNTS (Cont’d)
SCHEDULES

[95]
STA
ND
ALO
NE FIN
AN
CIA
L STATEM
EN
TS
Supe r Power i n Premium Me ta l s
SCHEDULE ‘19’ (Cont’d)
B. NOTES ON ACCOUNTS (Cont’d)
23. Deferred Tax
Major components of Deferred Tax arising on account of temporary timing differences are:
(Rs. in Crores)
Particulars As at 31st As at 31st
March, 2010 March, 2009
Deferred Tax Assets (A)
On Retirement benefits expenses as per AS - 15 63.40 64.67
Expenses / provisions allowable 34.42 19.66
Total 97.82 84.33
Deferred Tax Liability (B)
Depreciation 1,464.26 1,495.00
Total 1,464.26 1,495.00
Net Deferred Tax Liabilities (B-A) 1,366.44 1,410.67
24. Share-based Compensation
The shareholders of the Company has approved an Employee Stock Option Scheme (“ESOS 2006”), formulated
by the Company, under which the Company may issue 3,475,000 options to its permanent employees in the
management cadre, in one or more trenches, whether working in India or out of India, including the Whole Time
Directors of the Company. Each option when exercised would be converted into one fully paid-up equity share of
Re. 1/- each of the Company. The ESOS 2006 is administered by the Compensation Committee of the Board of
Directors of the Company (“the Committee”). Under the ESOS 2006, the Committee has granted 2,973,390
options to its eligible employees in two trenches. The following share-based payment arrangements were in
existence during the reporting periods:
ESOS 2006
Tranche I Tranche II
Number of Options Granted 19,40,250 10,33,140
Vesting Plan Graded Vesting- Graded Vesting-
25% every year 25% every year
Exercise Period 5 Years from the 5 Years from the
date of Vesting date of Vesting
Grant Date 23.08.2007 25.01.2008
Grant Price (Rs. per Option) 98.30 150.10
Method of Accounting Intrinsic Value Intrinsic Value
Movement of Options Granted:
The movement of the options for the year ended 31st March, 2010 is given below:
Weighted Average
Remaining
Stock Options Range of Exercise Weighted Average Contractual life
Particulars (Numbers) Prices (Rs.) Exercise Prices (Rs.) (Years)
Outstanding at beginning of the year 2,151,451 98.30 - 150.10 120.46 6.18
Granted during the year - - - -
Forfeited during the year (78,652) 98.30 - 150.10 116.09 -
Exercised during the year (44,244) 98.30 98.30 -
Lapsed during the year - - - -
Outstanding at the end of the year 2,028,555 98.30- 150.10 121.12 5.17
Exercisable at the end of the year 958,270 98.30 - 150.10 123.18 4.17
SCHEDULES

[96]
STA
ND
ALO
NE FIN
AN
CIA
L STATEM
EN
TS
Supe r Power i n Premium Me ta l s
SCHEDULE ‘19’ (Cont’d)
B. NOTES ON ACCOUNTS (Cont’d)
SCHEDULES
The movement of the options for the year ended 31st March, 2009 is given below:
Weighted Average
Remaining
Stock Options Range of Exercise Weighted Average Contractual life
Particulars (Numbers) Prices (Rs.) Exercise Prices (Rs.) (Years)
Outstanding at beginning of the year 2,694,290 98.30 - 150.10 118.16 7.03
Granted during the year - - - -
Forfeited during the year (284,742) 98.30 - 150.10 118.77 -
Exercised during the year (227,454) 98.30 98.30 -
Lapsed during the year (30,643) 98.30 98.30 -
Outstanding at the end of the year 2,151,451 98.30 - 150.10 120.46 6.18
Exercisable at the end of the year 414,475 98.30 - 150.10 127.06 4.63
The weighted average share price at the date of exercise of stock options exercised during the year ended 31st
March, 2010 and 31st March, 2009 was Rs. 158.81 and Rs. 139.20 respectively.
Fair Valuation:
At grant date, the estimated fair value of stock options granted in Tranche I and Tranche ll under ESOS 2006 was
Rs. 65.78 and Rs. 57.11 respectively. The fair valuation of options have been done by an independent valuer
using Black and Scholes Model. The various inputs and assumptions considered in the pricing model at grant date
for the stock options granted under ESOS 2006 are as under:
Particulars Tranche I Tranche II
Number of Option Granted 19,40,250 10,33,140
Grant Date 23.08.2007 25.01.2008
Risk Free interest Rate (%) 8.00 8.00
Option Life (Years) 5 5
Expected Volatility 0.3391 0.3655
Expected Dividend Yield (%) 170.00 170.00
Share Price at options grant date (Rs. per Share) 138.95 150.10
Had the compensation cost for the stock options granted been recognized based on fair value at the date of grant
in accordance with Black and Scholes Model, the proforma amount of net profit and earnings per share of the
Company would have been as under: Rs. in Crores
2009-10 2008-09
Net Profit as Reported 1,915.63 2,230.27
Less: Dividend on Preference Shares (including Tax) - (0.03)
Net Profit attributable to Equity Shareholders 1,915.63 2,230.24
Add: Compensation cost under ESOS as per intrinsic value included in the Net Profit 1.00 2.09
Less: Compensation cost under ESOS as per fair value (2.84) (5.82)
Proforma Net Profit 1,913.79 2,226.51
Less: Tax adjustment for earlier years (113.17) (150.83)
Proforma Profit before Tax adjustment for earlier years 1,800.62 2,075.68
Weighted average number of Basic Equity Shares outstanding 1,770,939,077 1,505,245,463
Weighted average number of Diluted Equity Shares outstanding 1,771,286,354 1,505,245,463
Face value of Equity Shares (in Re.) 1.00 1.00
Reported Earning per Share (EPS):
Basic EPS (in Rs.) 10.82 14.82
Diluted EPS (in Rs.) 10.81 14.82
Basic EPS before Tax adjustment for earlier years (Rs.) 10.18 13.81
Diluted EPS before Tax adjustment for earlier years (Rs.) 10.18 13.81
Proforma Earning per Share (EPS):
Basic EPS (in Rs.) 10.81 14.79
Diluted EPS (in Rs.) 10.80 14.79
Basic EPS before Tax adjustment for earlier years (Rs.) 10.17 13.79
Diluted EPS before Tax adjustment for earlier years (Rs.) 10.17 13.79
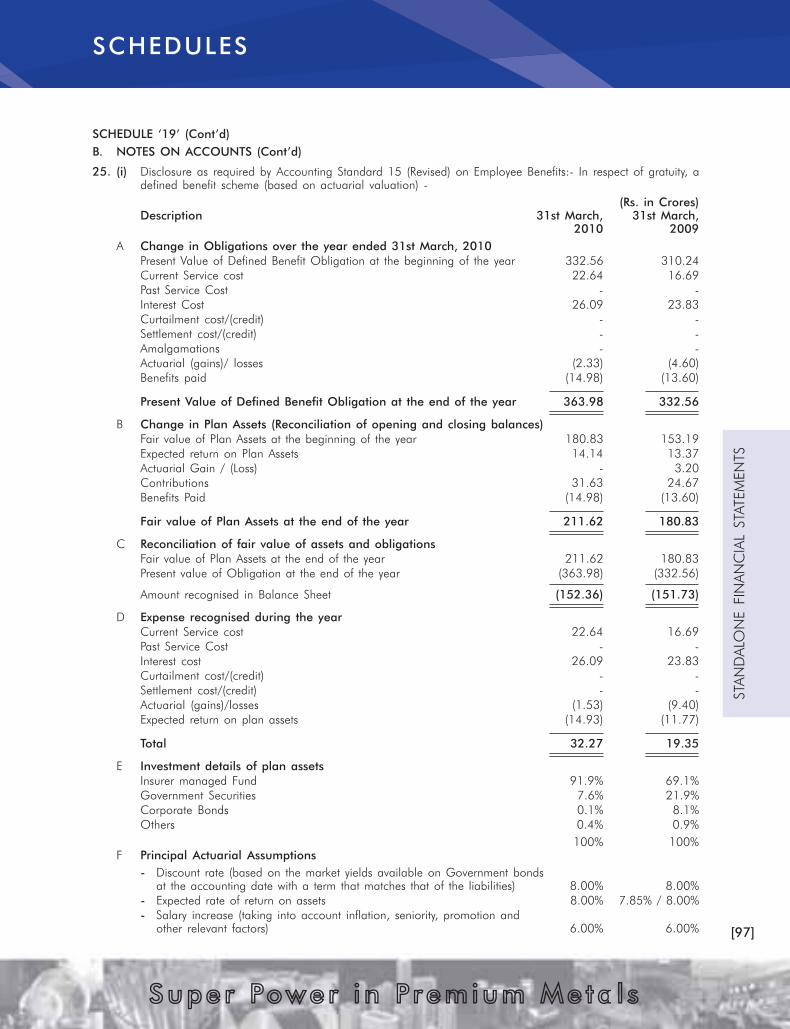
[97]
STA
ND
ALO
NE FIN
AN
CIA
L STATEM
EN
TS
Supe r Power i n Premium Me ta l s
SCHEDULE ‘19’ (Cont’d)
B. NOTES ON ACCOUNTS (Cont’d)
SCHEDULES
25. (i) Disclosure as required by Accounting Standard 15 (Revised) on Employee Benefits:- In respect of gratuity, a
defined benefit scheme (based on actuarial valuation) -
(Rs. in Crores)
Description 31st March, 31st March,
2010 2009
A Change in Obligations over the year ended 31st March, 2010
Present Value of Defined Benefit Obligation at the beginning of the year 332.56 310.24
Current Service cost 22.64 16.69
Past Service Cost - -
Interest Cost 26.09 23.83
Curtailment cost/(credit) - -
Settlement cost/(credit) - -
Amalgamations - -
Actuarial (gains)/ losses (2.33) (4.60)
Benefits paid (14.98) (13.60)
Present Value of Defined Benefit Obligation at the end of the year 363.98 332.56
B Change in Plan Assets (Reconciliation of opening and closing balances)
Fair value of Plan Assets at the beginning of the year 180.83 153.19
Expected return on Plan Assets 14.14 13.37
Actuarial Gain / (Loss) - 3.20
Contributions 31.63 24.67
Benefits Paid (14.98) (13.60)
Fair value of Plan Assets at the end of the year 211.62 180.83
C Reconciliation of fair value of assets and obligations
Fair value of Plan Assets at the end of the year 211.62 180.83
Present value of Obligation at the end of the year (363.98) (332.56)
Amount recognised in Balance Sheet (152.36) (151.73)
D Expense recognised during the year
Current Service cost 22.64 16.69
Past Service Cost - -
Interest cost 26.09 23.83
Curtailment cost/(credit) - -
Settlement cost/(credit) - -
Actuarial (gains)/losses (1.53) (9.40)
Expected return on plan assets (14.93) (11.77)
Total 32.27 19.35
E Investment details of plan assets
Insurer managed Fund 91.9% 69.1%
Government Securities 7.6% 21.9%
Corporate Bonds 0.1% 8.1%
Others 0.4% 0.9%
100% 100%
F Principal Actuarial Assumptions
- Discount rate (based on the market yields available on Government bonds
at the accounting date with a term that matches that of the liabilities) 8.00% 8.00%
- Expected rate of return on assets 8.00% 7.85% / 8.00%
- Salary increase (taking into account inflation, seniority, promotion and
other relevant factors) 6.00% 6.00%

[98]
STA
ND
ALO
NE FIN
AN
CIA
L STATEM
EN
TS
Supe r Power i n Premium Me ta l s
SCHEDULE ‘19’ (Cont’d)
B. NOTES ON ACCOUNTS (Cont’d)
SCHEDULE ‘19’ (Cont’d)
B. NOTES ON ACCOUNTS (Cont’d)
SCHEDULES
The Company has various schemes (funded / unfunded) for payment of gratuity to all eligible employees
calculated at specified number of days (ranging from 15 days to 1 month) of last drawn salary depending
upon tenure of service for each year of completed service subject to minimum service of five years payable at
the time of separation upon superannuation or on exit otherwise.
(ii) In respect of Defined contribution schemes –
(a) The Guidance Notes on Implementation of Accounting Standard 15 (revised) issued by the ICAI states
that provident fund set up by the employers, which require interest shortfall to be met by the employers,
needs to be treated as defined benefit plan. The fund set up by the Company does not have existing
deficit of interest shortfall. With regard to future obligation arising due to interest shortfall, pending issuance
of the guidance notes from Actuarial Society of India, the Company’s actuary has expressed his inability
to reliably measure the provident fund liability. The Company contributes 12% of salary for all eligible
employees towards Provident Fund managed either by approved trusts or by the Central Government.
The amount debited to Profit & Loss Account during the year was Rs. 50.62 crores (previous year
Rs. 47.62 crores).
(b) The Company also contributes a certain percentage of salary for all eligible employees in managerial
cadre towards Superannuation Funds managed by approved trusts or by Life Insurance Corporation of
India. The amount debited to Profit & Loss Account during the year was Rs. 9.38 crores (previous year
Rs. 7.52 crores).
26. Derivative Financial instruments
(i) (a) In the ordinary course of business, the Company is exposed to risks resulting from changes in prices of
commodity, exchange rate fluctuation and interest rate movements. It manages its exposure to these risks
through derivative financial instruments. It uses derivative instruments such as forwards, futures, swaps
and options to manage these risks. Such derivative financial instruments are used as risk management
tools only and not for speculative purposes. These derivative financial instruments reduce the impact of
both favourable and unfavourable fluctuations. Except where noted, the derivative contracts are marked-
to-market (MTM) and the related gains and losses are included in Profit & Loss Account in the current
accounting period.
The Company’s risk management activities are subject to the management, direction and control of Risk
Management Board (RMB). The RMB is composed of two directors including Managing Director, Chief
Financial Officer and other officers and employees selected by the Managing Director. The RMB reports
to the Board of Directors on the scope of its activities.
The decision of whether and when to execute derivative financial instruments along with its tenure can
vary from period to period depending on market conditions and the relative costs of the instruments. The
tenure is always linked to the timing of the underlying exposure, with the connection between the two
being regularly monitored.
The Company is exposed to losses in the event of non-performance by the counterparties to the derivative
contracts. All derivative contracts are executed with counterparties that, in our judgment, are creditworthy.
The credit levels are reviewed to ensure that there is not an inappropriate concentration of outstanding to
any particular counterparty.
Commodity Price Risk
Copper and Precious Metals
This business is conducted under a conversion model. The prices of input and output are derived
from the same benchmark and/or are linked to each other through a defined formula. The objective
of risk management is to attempt to use hedging to balance out the price fluctuations on the input
and output side so as to ‘pass through’ the change in input cost to customers to make the margins
immune to the fluctuations in prices of the input and output.
Aluminium
This business is vertically integrated. The main raw material viz. bauxite (mostly mined from own mines)
and other purchased raw materials do not have any linkage with the output price which is Aluminium
LME prices. When the prices of input(s) and output(s) do not follow the above condition, then risk
management attempts to use hedging so as to protect the margins from adverse movements in prices
on either side, i.e. from a rise in input cost or from a fall in output price.

[99]
STA
ND
ALO
NE FIN
AN
CIA
L STATEM
EN
TS
Supe r Power i n Premium Me ta l s
SCHEDULE ‘19’ (Cont’d)
B. NOTES ON ACCOUNTS (Cont’d)
SCHEDULE ‘19’ (Cont’d)
B. NOTES ON ACCOUNTS (Cont’d)
SCHEDULES
As a condition of sale, customers often require the Company to enter into fixed price commitments.
These commitments expose the Company to the risk of fluctuating aluminum prices between the time
the order is committed and the time that the material is shipped. The Company may enter into derivative
financial instruments to mitigate the risk arising out of the fixed price commitments. Consequently, the
gain or loss resulting from movements in the price of aluminum on these contracts would generally be
offset by an equal and opposite impact on the net sales and purchases being hedged.
Foreign Currency Exchange Risk
Exchange rate movements, particularly the United States Dollar (USD) and Euro (EUR) against Indian Rupee
(INR), have an impact on our operating results. In addition to the foreign exchange flow from exports, the
commodity prices in the domestic market are derived based on the landed cost of imports in India where
LME prices and USD_INR exchange rate are the main factors. In case of conversion business, the objective
is to match the exchange rate of outflows and related inflows through derivative financial instruments.
With respect to Aluminium business where costs are predominantly in INR, the strengthening of INR against
USD adversely affects the profitability of the business and benefits when INR depreciates against USD.
The company enters into various foreign exchange contracts to protect profitability.
The Company also enters into various foreign exchange contracts to mitigate the risk arising out of foreign
currency exchange rate movement in foreign currency contracts executed with foreign suppliers to procure
capital items for its project activities.
Cash Flow Hedges
For derivative financial instruments that are designated and qualify as cash flow hedges, the effective
portion of the gain or loss is reported as a component of Hedging Reserve and reclassified into Profit &
Loss Account in the same period or periods during which the hedged transaction affects Profit & Loss
Account. Gains and losses on the derivative financial instruments representing either hedge ineffectiveness
or hedge components excluded from the assessment of effectiveness are recognized in Profit & Loss Account.
(b) The Asset and Liability position of various derivative financial instruments outstanding as at 31st March,
2010 is given below:
(Rs. in Crores)
Particulars Nature of Risk Liability Asset Net Fair
being Hedged Value
Current
Cash flow hedges
- Commodity contracts All cash flow risk other than (77.11) 6.06 (71.05)
foreign currency
- Foreign currency contracts Exchange rate movement risk (98.71) 94.47 (4.24)
Non-designated hedges
- Commodity contracts (35.53) 10.42 (25.11)
- Foreign currency contracts (19.01) 24.08 5.07
Total (230.36) 135.03 (95.33)
Non - current
Cash flow hedges
- Foreign currency contracts Exchange rate movement risk (14.94) - (14.94)
Non-designated hedges
- Foreign currency contracts (0.68) - (0.68)
Total (15.62) - (15.62)
Grand Total (245.98) 135.03 (110.95)

[100]
STA
ND
ALO
NE FIN
AN
CIA
L STATEM
EN
TS
Supe r Power i n Premium Me ta l s
SCHEDULE ‘19’ (Cont’d)
B. NOTES ON ACCOUNTS (Cont’d)
SCHEDULES
(c) The following table presents the outstanding position and fair value of various foreign exchange derivative
financial instruments as at 31st March, 2010:
Average Notional Fair Value
Foreign currency forwards Currency exchange value Gain/(Loss)
Pair rate (in Million) (Rs. In Crores)
Cash flow hedges
Sell USD_INR 49.55 219.63 94.47
Buy USD_INR 47.03 5.57 (0.85)
Buy CHF_INR 48.64 3.17 (1.44)
Buy EUR_INR 68.26 173.66 (107.69)
Buy GBP_INR 74.91 2.93 (1.62)
Buy NOK_INR 8.14 40.58 (2.05)
Total (19.18)
Non-Designated
Sell USD_INR 49.46 67.85 23.63
Buy USD_INR 45.81 182.01 (10.25)
Buy CHF_INR 47.08 0.54 (0.22)
Buy EUR_INR 64.98 22.66 (8.77)
Buy GBP_INR 67.97 0.33 0.02
Buy NOK_INR 7.60 6.85 (0.02)
Buy EUR_USD 1.35 0.03 0.00
Total 4.39
(d) The following table presents the outstanding position and fair value of various commodity derivative financial
instruments as at 31st March, 2010:
Commodity futures / Average Price Qty Unit Notional Fair Value
forwards (USD / Unit) value (USD Gain/(Loss)
in Millions) (Rs. in Crores)
Cash flow hedges
Aluminium Sell 2,320.78 11,000 MT 25.53 (0.15)
Gold Sell 1,032.59 207,144 TOZ 213.90 (67.12)
Silver Sell 16.58 1,123,556 TOZ 18.63 (3.78)
Total 258.06 (71.05)
Non-Designated Hedges
Copper Buy 7,507.91 3,700 MT 27.78 10.43
Copper Sell 7,589.71 2,800 MT 21.25 (11.47)
Aluminium Buy 2,153.20 6,625 MT 14.26 7.33
Aluminium Sell 2,227.35 5,550 MT 12.36 (2.53)
Gold Buy 1,109.36 551 TOZ 0.61 (0.65)
Gold Sell 1,109.75 6,137 TOZ 6.81 (22.00)
Silver Buy * 0.01
Silver Sell 17.01 242,356 TOZ 4.12 (2.63)
Total 87.19 (21.51)
Commodity options
(Non–Designated hedges)
Copper Sell * (0.37)
Aluminium Sell * 4,500 MT 10.22 (0.23)
Total 10.22 (0.60)
Commodity Swaps
(Non-designated hedges)
Copper Sell * (1.27)
Aluminium Sell * (1.73)
Total - (3.00)
*Represent derivatives matured within 31st March, 2010 for which cash flow to happen on settlement
date during April, 2010.

[101]
STA
ND
ALO
NE FIN
AN
CIA
L STATEM
EN
TS
Supe r Power i n Premium Me ta l s
SCHEDULE ‘19’ (Cont’d)
B. NOTES ON ACCOUNTS (Cont’d)
SCHEDULES
(e) The following table presents details of amount held in Hedging Reserve as at 31st March, 2010 and the
period during which these are going to be released and affecting Profit & Loss Account:
(Rs. in Crores)
Release
Closing Value In
Hedging Reserve
Hedge Instrument Product / as at 31st In less than After 12
Type Currency Pair March, 2010 12 Months Months
Gain / (Loss) Gain / (Loss) Gain / (Loss)
Commodity Forwards Aluminium (0.18) (0.18)
Gold (36.51) (36.51)
Silver (4.56) (4.56)
Total (41.25) (41.25)
Debt Liability 64.92 64.92
Foreign currency Forwards CHF_INR (1.44) (0.69) (0.75)
EUR_INR (107.17) (93.54) (13.64)
GBP_INR (1.62) (1.38) (0.23)
NOK_INR (2.05) (1.76) (0.29)
USD_INR 93.24 93.24
Total (19.04) (4.13) (14.91)
Grand Total 4.63 19.54 (14.91)
(f) The following table presents the amount of gain / (loss) recognized in Hedging Reserve and recycled
during the year 2009-10:
(Rs. in Crores)
Opening Amount Amount Closing
Item Balance recognized recycled Balance
Commodity - (258.43) (217.18) (41.25)
Forex - 257.13 211.25 45.88
Total - (1.30) (5.93) 4.63
(g) The following table presents the amount of gain / (loss) recycled from Hedging Reserve and reference of
the line item in Profit & Loss Account where those amounts are included:
Schedule No Schedule Line Item (Rs. in Crores)
14 Aluminium Ingots/Billets (73.81)
14 Copper Cathodes 11.55
14 Continuous Cast Copper Rods 11.05
14 Gold (117.62)
14 Silver (19.09)
17 Copper Concentrate 230.58
17 (Gain)/Loss in change in Fair value of derivatives (net) 48.59
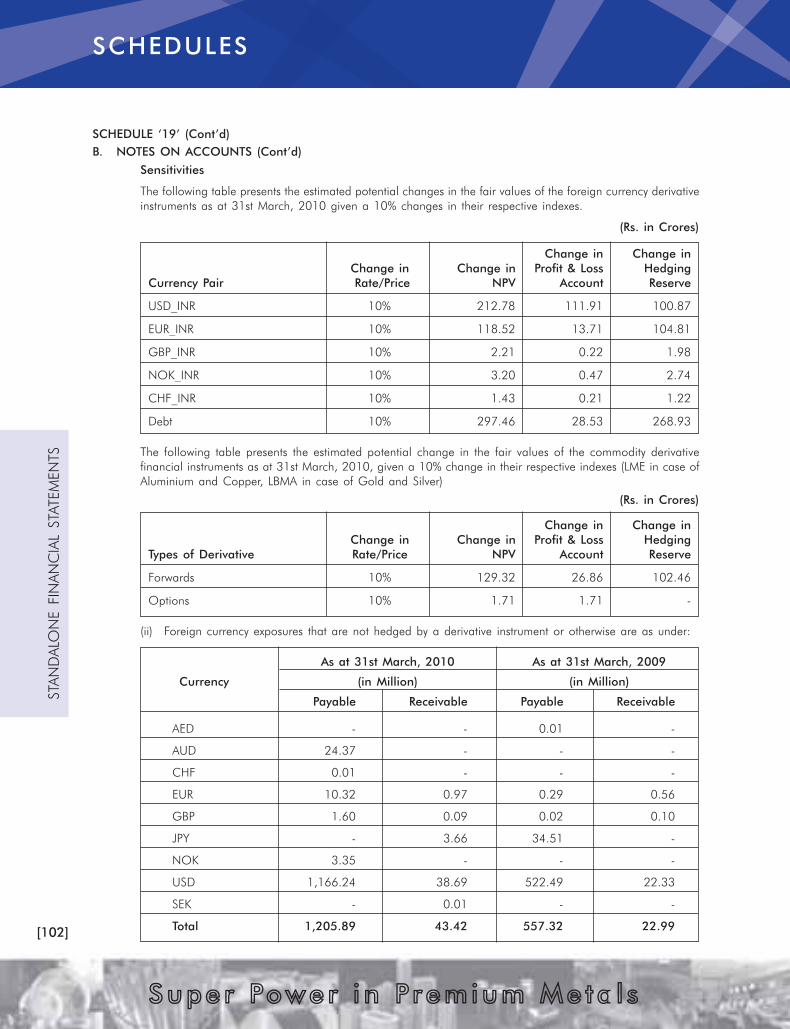
[102]
STA
ND
ALO
NE FIN
AN
CIA
L STATEM
EN
TS
Supe r Power i n Premium Me ta l s
SCHEDULE ‘19’ (Cont’d)
B. NOTES ON ACCOUNTS (Cont’d)
SCHEDULES
Sensitivities
The following table presents the estimated potential changes in the fair values of the foreign currency derivative
instruments as at 31st March, 2010 given a 10% changes in their respective indexes.
(Rs. in Crores)
Change in Change in
Change in Change in Profit & Loss Hedging
Currency Pair Rate/Price NPV Account Reserve
USD_INR 10% 212.78 111.91 100.87
EUR_INR 10% 118.52 13.71 104.81
GBP_INR 10% 2.21 0.22 1.98
NOK_INR 10% 3.20 0.47 2.74
CHF_INR 10% 1.43 0.21 1.22
Debt 10% 297.46 28.53 268.93
The following table presents the estimated potential change in the fair values of the commodity derivative
financial instruments as at 31st March, 2010, given a 10% change in their respective indexes (LME in case of
Aluminium and Copper, LBMA in case of Gold and Silver)
(Rs. in Crores)
Change in Change in
Change in Change in Profit & Loss Hedging
Types of Derivative Rate/Price NPV Account Reserve
Forwards 10% 129.32 26.86 102.46
Options 10% 1.71 1.71 -
(ii) Foreign currency exposures that are not hedged by a derivative instrument or otherwise are as under:
As at 31st March, 2010 As at 31st March, 2009
Currency (in Million) (in Million)
Payable Receivable Payable Receivable
AED - - 0.01 -
AUD 24.37 - - -
CHF 0.01 - - -
EUR 10.32 0.97 0.29 0.56
GBP 1.60 0.09 0.02 0.10
JPY - 3.66 34.51 -
NOK 3.35 - - -
USD 1,166.24 38.69 522.49 22.33
SEK - 0.01 - -
Total 1,205.89 43.42 557.32 22.99

[103]
STA
ND
ALO
NE FIN
AN
CIA
L STATEM
EN
TS
Supe r Power i n Premium Me ta l s
SCHEDULE ‘19’ (Cont’d)
B. NOTES ON ACCOUNTS (Cont’d)
SCHEDULES
27. In compliance with Accounting Standard 27 on Financial Reporting of Interests in Joint Ventures, following disclosures
are made in respect of jointly controlled entities in which the Company is a joint venturer:
(Rs. in Crores)
Particulars Hydromine Global Minerals Mahan Coal Limited
(GMBH) Limited (Audited) (Audited)
Country of incorporation British Virgin Islands India
Year ended, Year ended, Year ended, Year ended,
31st March 31st March 31st March 31st March
2010 2009 2010 2009
Percentage of Share in Joint Venture 45% 45% 50.00% 50.00%
Assets 19.92 7.75 7.09 5.64
Liabilities 0.09 0.00 0.74 0.19
Income - - 0.02 -
Expenditure 1.44 - 0.17 -
Capital Commitments (net of advance) - - 1.08 0.07
Contingent Liabilities - - 16.71 16.71
(Rs. in Crores)
31st March, 31st March,
2010 2009
28. Earnings Per Share (EPS):
Net Profit 1,915.63 2,230.27
Less: Dividend on Preference Shares (including Dividend Tax) - (0.03)
Net Profit attributable to Equity Shareholders 1,915.63 2,230.24
Less: Tax adjustment for earlier years (113.17) (150.83)
Profit before Tax adjustment for earlier years 1,802.46 2,079.41
Weighted average number of Basic Equity Shares outstanding 1,770,939,077 1,505,245,463
Weighted average number of Diluted Equity Shares outstanding 1,771,286,354 1,505,245,463
Face Value of Equity Shares (in Rs.) 1.00 1.00
Earnings per share (EPS):
Basic EPS (in Rs.) 10.82 14.82
Diluted EPS (in Rs.) 10.81 14.82
Basic EPS before Tax adjustment for earlier years (in Rs.) 10.18 13.81
Diluted EPS before Tax adjustment for earlier years (in Rs.) 10.18 13.81

[104]
STA
ND
ALO
NE FIN
AN
CIA
L STATEM
EN
TS
Supe r Power i n Premium Me ta l s
SCHEDULE ‘19’ (Cont’d)
B. NOTES ON ACCOUNTS (Cont’d)
SCHEDULES
29. Related Party Disclosures
A. List of Related Parties
(a) Subsidiaries of the Company
1 Aditya Birla Minerals Limited
2 Birla Nifty Pty Limited
3 Birla Maroochydore Pty Limited
4 Birla Mt Gordon Pty Limited
5 Birla Resources Pty Limited
6 Dahej Harbour and Infrastructure Limited
7 Aditya Birla Chemicals (India) Limited
8 Hindalco-Almex Aerospace Limited
9 Indal Exports Limited
10 Lucknow Finance Company Limited
11 Minerals & Minerals Limited
12 Renuka Investments & Finance Limited
13 Renukeshwar Investments & Finance Limited
14 Suvas Holdings Limited
15 Utkal Alumina International Limited
16 East Coast Bauxite Mining Company Private Limited
17 Tubed Coal Mines Limited
18 AV Minerals (Netherlands) B. V.
19 AV Metals Inc.
20 AV Aluminum Inc.
21 HAAL (USA) Inc.
22 Mauda Energy Limited
23 Novelis Inc.
24 Novelis Benelux NV
25 Albrasilis - Aluminio do Brasil Industria e Comercia Ltda
26 Novelis do Brasil Ltda.
27 4260848 Canada Inc.
28 4260856 Canada Inc.
29 Novelis Cast House Technology Ltd.
30 Novelis No. 1 Limited Partnership
31 Novelis Foil France SAS
32 Novelis Lamines France SAS
33 Novelis PAE SAS
34 Novelis Aluminium Beteiligungs GmbH
35 Novelis Deutschland GmbH
36 Novelis Aluminium Holding Company
37 Novelis Italia SpA
38 Novelis Luxembourg SA
39 Alcom Nikkei Specialty Coatings Sdn Berhad
40 Aluminum Company of Malaysia Berhad
41 A1 Dotcom Sdn Berhad
42 Novelis (India) Infotech Ltd.
43 Novelis de Mexico SA de CV
44 Novelis Korea Ltd.
45 Novelis Belgique SA
46 Novelis AG
47 Novelis Switzerland SA
48 Novelis Technology AG
49 Evermore Recycling LLC (J-V)
50 Novelis Europe Holdings Limited
51 Novelis UK Ltd.

[105]
STA
ND
ALO
NE FIN
AN
CIA
L STATEM
EN
TS
Supe r Power i n Premium Me ta l s
SCHEDULE ‘19’ (Cont’d)
B. NOTES ON ACCOUNTS (Cont’d)
SCHEDULES
52 Aluminum Upstream Holdings LLC (Delaware)
53 Eurofoil, Inc. (USA) (New York)
54 Logan Aluminium Inc. (Delaware)
55 Novelis Corporation (Texas)
56 Novelis Brand LLC (Delaware)
57 Novelis PAE Corp (Delaware)
58 Novelis South America Holdings LLC
59 Novelis Madeira, Unipessoal, Lda
60 Novelis Services Limited
(b) Trust of the Company
Trident Trust
(c) Joint Venture
1 Hydromine Global Minerals GMBH Limited
2 Mahan Coal Limited
(d) Associates of the Company
1 Aditya Birla Science & Technology Company Limited
2 Consorcio Candonga
3 France Aluminium Recyclage SA
4 Aluminium Norf GmbH
5 Deutsche Aluminium Verpackung Recycling GmbH
6 MiniMRF LLC (Delaware)
7 IDEA Cellular Limited
(e) Key Managerial Personnel:
Mr. D. Bhattacharya - Managing Director
B. The Following transactions were carried out with the Related parties in the ordinary course of
business:
(a) Subsidiary Companies, Associate and Joint Ventures:
(Rs. in Crores)
2009-10 2008-09
Sl. Transaction during the year Subsidiaries Associates Joint Subsidiaries Associates Joint
No. Ventures Ventures
1 Sales and Conversion 24.81 - - 22.91 - -
a) Aditya Birla Chemicals(India)
Limited 16.60 - - 21.06 - -
b) Hindalco - Almex Aerospace
Limited 8.21 - - - - -
c) Others - - - 1.85 - -
2 Services rendered 0.62 0.15 - 0.33 - -
a) Dahej Harbour and
Infrastructure Limited 0.61 - - 0.33 - -
b) Idea Cellular Limited
(wef 1st January 2009) - 0.15 - - - -
c) Others 0.01 0.00 - - - -
3 Interest and dividend received 12.09 1.31 - 73.05 0.64 -
a) Aditya Birla Science &
Technology Company Limited - 1.31 - - 0.64 -
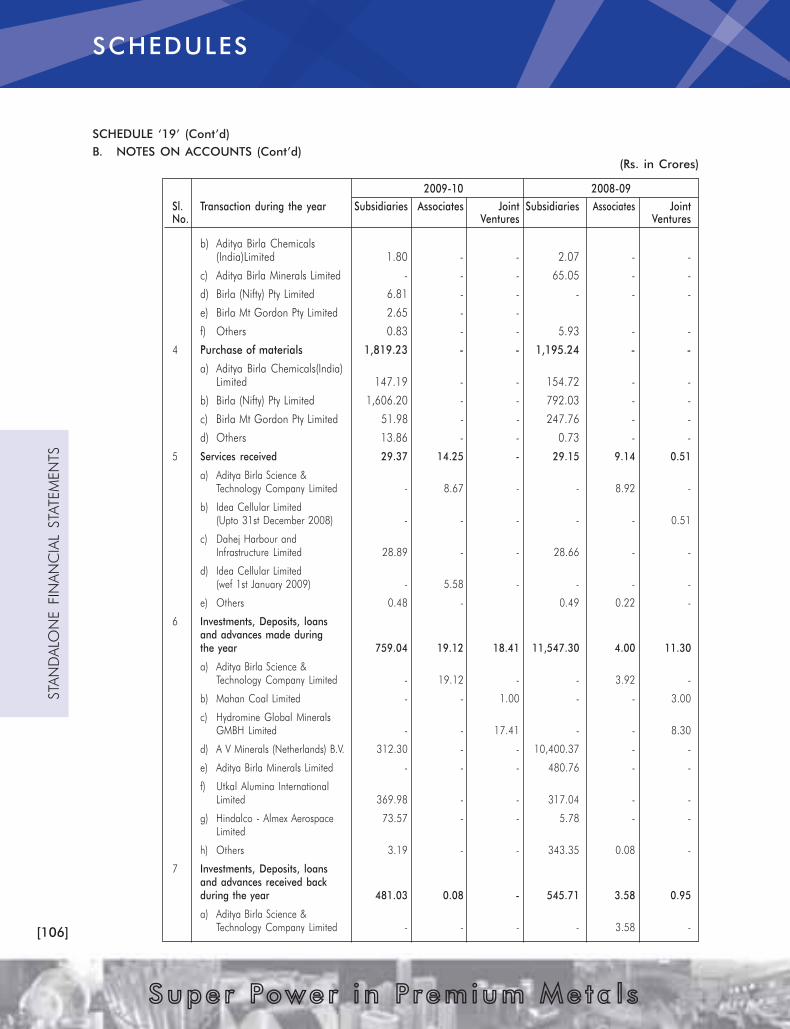
[106]
STA
ND
ALO
NE FIN
AN
CIA
L STATEM
EN
TS
Supe r Power i n Premium Me ta l s
SCHEDULE ‘19’ (Cont’d)
B. NOTES ON ACCOUNTS (Cont’d)
(Rs. in Crores)
2009-10 2008-09
Sl. Transaction during the year Subsidiaries Associates Joint Subsidiaries Associates Joint
No. Ventures Ventures
SCHEDULES
b) Aditya Birla Chemicals
(India)Limited 1.80 - - 2.07 - -
c) Aditya Birla Minerals Limited - - - 65.05 - -
d) Birla (Nifty) Pty Limited 6.81 - - - - -
e) Birla Mt Gordon Pty Limited 2.65 - -
f) Others 0.83 - - 5.93 - -
4 Purchase of materials 1,819.23 - - 1,195.24 - -
a) Aditya Birla Chemicals(India)
Limited 147.19 - - 154.72 - -
b) Birla (Nifty) Pty Limited 1,606.20 - - 792.03 - -
c) Birla Mt Gordon Pty Limited 51.98 - - 247.76 - -
d) Others 13.86 - - 0.73 - -
5 Services received 29.37 14.25 - 29.15 9.14 0.51
a) Aditya Birla Science &
Technology Company Limited - 8.67 - - 8.92 -
b) Idea Cellular Limited
(Upto 31st December 2008) - - - - - 0.51
c) Dahej Harbour and
Infrastructure Limited 28.89 - - 28.66 - -
d) Idea Cellular Limited
(wef 1st January 2009) - 5.58 - - - -
e) Others 0.48 - 0.49 0.22 -
6 Investments, Deposits, loans
and advances made during
the year 759.04 19.12 18.41 11,547.30 4.00 11.30
a) Aditya Birla Science &
Technology Company Limited - 19.12 - - 3.92 -
b) Mahan Coal Limited - - 1.00 - - 3.00
c) Hydromine Global Minerals
GMBH Limited - - 17.41 - - 8.30
d) A V Minerals (Netherlands) B.V. 312.30 - - 10,400.37 - -
e) Aditya Birla Minerals Limited - - - 480.76 - -
f) Utkal Alumina International
Limited 369.98 - - 317.04 - -
g) Hindalco - Almex Aerospace 73.57 - - 5.78 - -
Limited
h) Others 3.19 - - 343.35 0.08 -
7 Investments, Deposits, loans
and advances received back
during the year 481.03 0.08 - 545.71 3.58 0.95
a) Aditya Birla Science &
Technology Company Limited - - - - 3.58 -
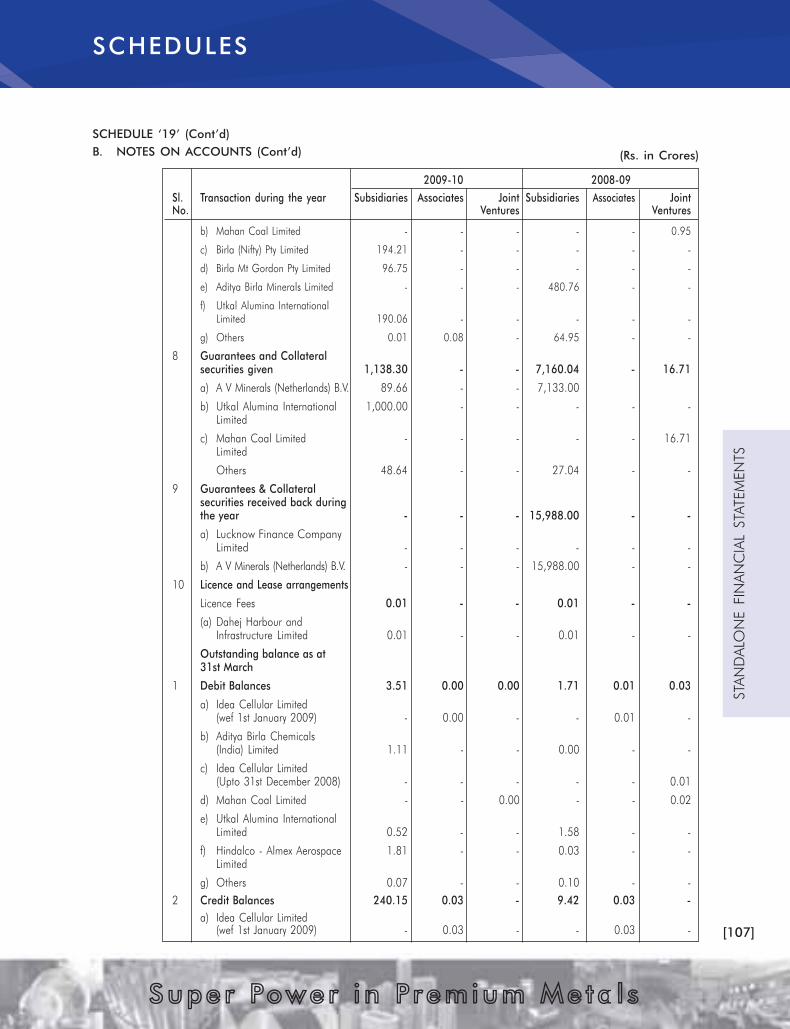
[107]
STA
ND
ALO
NE FIN
AN
CIA
L STATEM
EN
TS
Supe r Power i n Premium Me ta l s
SCHEDULE ‘19’ (Cont’d)
B. NOTES ON ACCOUNTS (Cont’d)
SCHEDULES
(Rs. in Crores)
2009-10 2008-09
Sl. Transaction during the year Subsidiaries Associates Joint Subsidiaries Associates Joint
No. Ventures Ventures
b) Mahan Coal Limited - - - - - 0.95
c) Birla (Nifty) Pty Limited 194.21 - - - - -
d) Birla Mt Gordon Pty Limited 96.75 - - - - -
e) Aditya Birla Minerals Limited - - - 480.76 - -
f) Utkal Alumina International
Limited 190.06 - - - - -
g) Others 0.01 0.08 - 64.95 - -
8 Guarantees and Collateral
securities given 1,138.30 - - 7,160.04 - 16.71
a) A V Minerals (Netherlands) B.V. 89.66 - - 7,133.00
b) Utkal Alumina International 1,000.00 - - - - -
Limited
c) Mahan Coal Limited - - - - - 16.71
Limited
Others 48.64 - - 27.04 - -
9 Guarantees & Collateral
securities received back during
the year - - - 15,988.00 - -
a) Lucknow Finance Company
Limited - - - - - -
b) A V Minerals (Netherlands) B.V. - - - 15,988.00 - -
10 Licence and Lease arrangements
Licence Fees 0.01 - - 0.01 - -
(a) Dahej Harbour and
Infrastructure Limited 0.01 - - 0.01 - -
Outstanding balance as at
31st March
1 Debit Balances 3.51 0.00 0.00 1.71 0.01 0.03
a) Idea Cellular Limited
(wef 1st January 2009) - 0.00 - - 0.01 -
b) Aditya Birla Chemicals
(India) Limited 1.11 - - 0.00 - -
c) Idea Cellular Limited
(Upto 31st December 2008) - - - - - 0.01
d) Mahan Coal Limited - - 0.00 - - 0.02
e) Utkal Alumina International
Limited 0.52 - - 1.58 - -
f) Hindalco - Almex Aerospace 1.81 - - 0.03 - -
Limited
g) Others 0.07 - - 0.10 - -
2 Credit Balances 240.15 0.03 - 9.42 0.03 -
a) Idea Cellular Limited
(wef 1st January 2009) - 0.03 - - 0.03 -
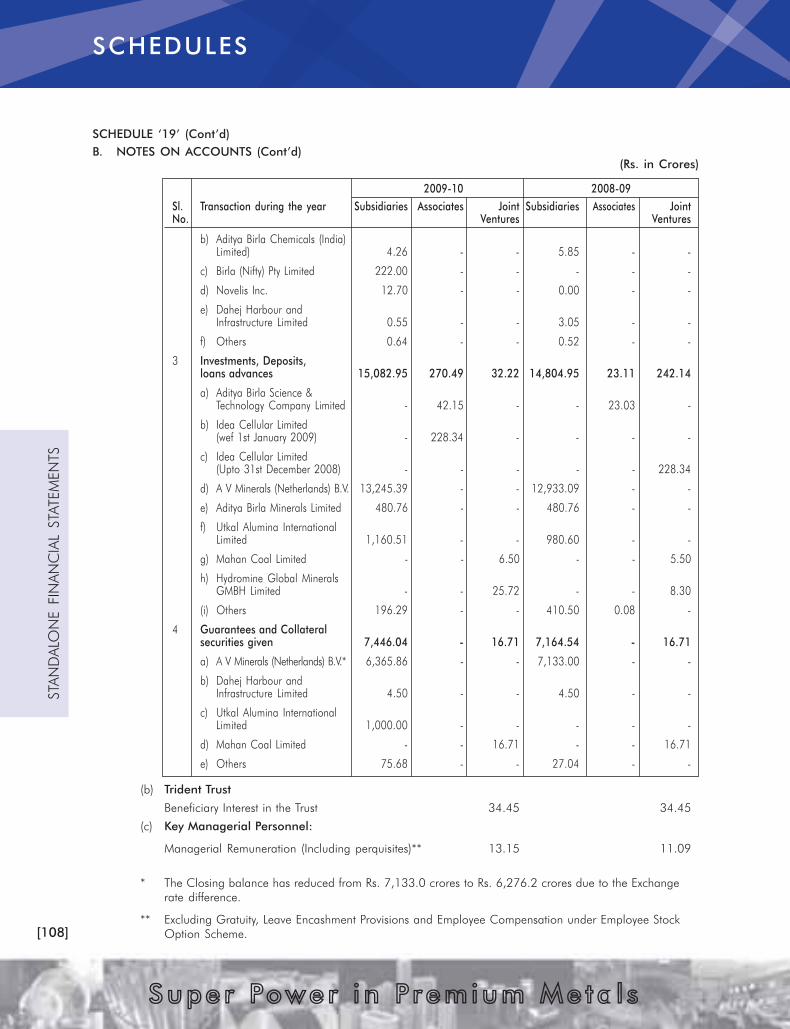
[108]
STA
ND
ALO
NE FIN
AN
CIA
L STATEM
EN
TS
Supe r Power i n Premium Me ta l s
b) Aditya Birla Chemicals (India)
Limited) 4.26 - - 5.85 - -
c) Birla (Nifty) Pty Limited 222.00 - - - - -
d) Novelis Inc. 12.70 - - 0.00 - -
e) Dahej Harbour and
Infrastructure Limited 0.55 - - 3.05 - -
f) Others 0.64 - - 0.52 - -
3 Investments, Deposits,
loans advances 15,082.95 270.49 32.22 14,804.95 23.11 242.14
a) Aditya Birla Science &
Technology Company Limited - 42.15 - - 23.03 -
b) Idea Cellular Limited
(wef 1st January 2009) - 228.34 - - - -
c) Idea Cellular Limited
(Upto 31st December 2008) - - - - - 228.34
d) A V Minerals (Netherlands) B.V. 13,245.39 - - 12,933.09 - -
e) Aditya Birla Minerals Limited 480.76 - - 480.76 - -
f) Utkal Alumina International
Limited 1,160.51 - - 980.60 - -
g) Mahan Coal Limited - - 6.50 - - 5.50
h) Hydromine Global Minerals
GMBH Limited - - 25.72 - - 8.30
(i) Others 196.29 - - 410.50 0.08 -
4 Guarantees and Collateral
securities given 7,446.04 - 16.71 7,164.54 - 16.71
a) A V Minerals (Netherlands) B.V.* 6,365.86 - - 7,133.00 - -
b) Dahej Harbour and
Infrastructure Limited 4.50 - - 4.50 - -
c) Utkal Alumina International
Limited 1,000.00 - - - - -
d) Mahan Coal Limited - - 16.71 - - 16.71
e) Others 75.68 - - 27.04 - -
(b) Trident Trust
Beneficiary Interest in the Trust 34.45 34.45
(c) Key Managerial Personnel:
Managerial Remuneration (Including perquisites)** 13.15 11.09
* The Closing balance has reduced from Rs. 7,133.0 crores to Rs. 6,276.2 crores due to the Exchange
rate difference.
** Excluding Gratuity, Leave Encashment Provisions and Employee Compensation under Employee Stock
Option Scheme.
SCHEDULE ‘19’ (Cont’d)
B. NOTES ON ACCOUNTS (Cont’d)
(Rs. in Crores)
2009-10 2008-09
Sl. Transaction during the year Subsidiaries Associates Joint Subsidiaries Associates Joint
No. Ventures Ventures
SCHEDULES

[109]
STA
ND
ALO
NE FIN
AN
CIA
L STATEM
EN
TS
Supe r Power i n Premium Me ta l s
30. (a) Primary Segment Reporting (by Business Segment):
(i) The Company has two reportable segments viz. Aluminium and Copper which have been identified in
line with the Accounting Standard 17 on Segment Reporting, taking into account the organizational
structure as well as differential risk and return of these segments. Details of products included in each
segments are as under:
Aluminium : Hydrate & Alumina, Aluminium and Aluminium Products.
Copper : Continuous Cast Copper Rods, Copper Cathode, Sulphuric Acid, DAP & Complexes, Gold
and Silver.
(ii) Inter-segment transfers are based on market rates.
(iii) Information about Primary Segments are follows: (Rs. in Crores)
2009-10 2008-09
Particulars Aluminium Copper Total Aluminium Copper Total
REVENUE
External Sales 6,997.63 12,538.65 19,536.28 7,600.54 10,619.11 18,219.65
Inter Segment Sales 3.02 3.73 6.75 3.30 5.40 8.70
Total Revenue 7,000.65 12,542.38 19,543.03 7,603.84 10,624.51 18,228.35
RESULTS
Segment Results 1,766.58 660.13 2,426.71 2,157.76 379.14 2,536.90
Unallocated Corporate Expenses (89.55) (81.13)
Operating Profit 2,337.16 2,455.77
Unallocated Other Income 205.40 571.48
Interest Expenses (278.00) (336.93)
Income Taxes (348.93) (460.05)
Net Profit 1,915.63 2,230.27
OTHER INFORMATION
Assets:
Segment Assets 11,681.90 8,194.96 19,876.86 9,513.12 6,279.32 15,792.44
Unallocated Corporate Assets 21,905.87 20,372.91
Total Assets 41,782.73 36,165.35
Liabilities:
Segment Liabilities 1,085.00 2,768.12 3,853.12 943.29 1,104.52 2,047.81
Unallocated Corporate Liabilities 10,018.64 10,359.22
Total Liabilities 13,871.76 12,407.03
Capital Expenditure 2,747.66 67.38 1,040.48 79.00
Non-Cash Expenses:
Depreciation
(including Impairment) 496.05 164.24 472.20 167.57
Others 16.13 1.24 1.69 0.92
(b) Secondary Segment Reporting (by Geographical demarcation):
(i) The secondary segment is based on geographical demarcation i.e India and Rest of the World.
(ii) Information about Secondary Segments are follows: (Rs. in Crores)
2009-10 2008-09
Particulars India Rest of the Total India Rest of the Total
World World
Segment Revenue 14,164.07 5,378.96 19,543.03 12,856.59 5,371.76 18,228.35
Segment Assets 19,600.81 276.05 19,876.86 15,257.93 534.51 15,792.44
Capital Expenditure 2,815.04 - 2,815.04 1,119.48 - 1,119.48
SCHEDULE ‘19’ (Cont’d)
B. NOTES ON ACCOUNTS (Cont’d)
SCHEDULES

[110]
STA
ND
ALO
NE FIN
AN
CIA
L STATEM
EN
TS
Supe r Power i n Premium Me ta l s
(Rs. in Crores)
2009-10 2008-09
31. Miscellaneous Expenses under Manufacturing and Other Expenses
(Schedule 17) include payment -
(a) to a firm of solicitors in which Director is a partner 0.46 0.20
(b) as pension to a Director who was president of the Company before
appointment as Director 0.01 0.01
32. Auditors’ Remuneration
(Rs. in Crores)
(a) Statutory Auditors
Audit Fees 1.22 1.06
Certification/Company law/Other matters* 0.62 0.83
Tax Audit Fees 0.24 0.22
Expenses 0.10 0.10
(b) Cost Auditors
Audit Fees 0.06 0.06
Expenses 0.01 -
Total 2.25 2.27
* Excludes an amount of Rs. 0.65 crores related to certification work for
Qualified Institutions Placement during the year (previous year Rs. 1.15
crores related to certification work for rights issue) which have been
adjusted against Securities Premium Account.
33. Expenses include following payments to Managing Director (Rs. in Crores)
Salary 3.30 2.99
Contribution to Provident Fund & Superannuation Fund 0.88 0.73
Special Allowance 2.82 2.15
Performance Linked Pay 3.99 3.60
Perquisites 1.16 0.72
Leave Travel Assistance 1.00 0.90
Total 13.15 11.09
Expenses towards gratuity and leave encashment provisions are determined
actuarially on overall company basis and accordingly have not been
considered in the above information. Compensation under Employee
Stock Option Scheme has also not been considered in the above
information.
34. Computation of Other Directors’ Commission
Computation of net profit in accordance with sections 198 and 309 (5)(Rs. in Crores)
of the Companies Act, 1956
Profit before extraordinary items and tax 2,264.56 2,690.32
Add:
Other Directors’ remuneration 14.00 7.50
Directors’ fees 0.05 0.06
Doubtful debts provision / (written back) - net 16.97 1.98
(Profit) / Loss on Fixed Assets sold / discarded (net) 1.22 (6.40)
Diminution in carrying cost of investments / (written back) 0.29 (8.66)
2,297.09 2,684.80
Less:
Profit on sale of Investments (net) 27.74 85.76
Net Profit for the year 2,269.35 2,599.04
Other Directors’ Commission –1% of the above profit 22.69 25.99
Restricted to maximum amount payable 14.00 7.50
SCHEDULE ‘19’ (Cont’d)
B. NOTES ON ACCOUNTS (Cont’d)
SCHEDULES

[111]
STA
ND
ALO
NE FIN
AN
CIA
L STATEM
EN
TS
Supe r Power i n Premium Me ta l s
SCHEDULE ‘19’ (Cont’d)
B. NOTES ON ACCOUNTS (Cont’d)
SCHEDULES
(Rs. in Crores)
2009-10 2008-09
35. Capital work-in-progress includes
Pre-operative expenses pending allocation:-
Raw Materials Consumed 2.71 10.73
Power & Fuel 1.21 4.07
Salary, Wages, Bonus, Ex-gratia, Pension and Provisions 17.69 6.78
Raw Water Charges and Cess 0.01 0.02
Insurance 5.12 0.40
Technology Fee 95.49 -
Consultancy expenses 36.83 0.16
Miscellaneous expenses 57.58 6.11
216.64 28.27
Add: Brought Forward from previous year 30.17 23.26
Sub Total 246.81 51.53
Less: Allocated to Fixed Assets 6.19 21.36
Balance 240.62 30.17
36. Remittance of Dividend on Equity Shares/GDRs in Foreign Currency
No. of Non-Resident Shareholders 489 597
No. of Shares held
- Fully Paid up 200,109,511 165,730,039
- Partly Paid up - -
Dividend (Rs. in Crores) 27.01 30.66
37. The amount transferable to Investor Education and Protection Fund does not include any amount due and
outstanding to be transferred to said fund except Rs. 0.07 crores (previous year Rs. 0.07 crores) which is held in
abeyance due to legal case pending.
38. Information related to Micro, Small and Medium Enterprises Development Act, 2006 (the Act) is disclosed
hereunder. The information given below has been determined to the extent such parties have been identified on
the basis of information available with the Company:
(Rs. in Crores)
As at 31st As at 31st
March, 2010 March, 2009
(a) (i) Principal amount remaining unpaid to any supplier at the end
of the accounting year. 1.05 -
(ii) Interest due on above. - -
Total 1.05 -
(b) Amount of Interest paid by the buyer in terms of Section 16 of the
Act, along with amount of payment made beyond the appointed
date during the year. - -
(c) Amount of interest accrued and remaining unpaid at the end of the
financial year. - -
(d) Amount of interest due and payable for the period of delay in making
payment (which have been paid but beyond the due date during
the year) but without adding the interest specified under the Act. - -
(e) Amount of further interest remaining due and payable even in the
succeeding years, until such date when the interest dues as above
are actually paid to the Small enterprise, for the purpose of
disallowance as a deductible expenditure under section 23 of the Act. - -

[112]
STA
ND
ALO
NE FIN
AN
CIA
L STATEM
EN
TS
Supe r Power i n Premium Me ta l s
39. Additional information pursuant to paragraphs 3 and 4 of Part II of Schedule VI to the Companies Act, 1956
(As amended)
(a) Particulars in respect of Goods manufactured: -
Class of goods Installed Actual Stock of Goods Produced
Capacity Production Opening Closing
Qty. Qty. Qty. Qty. 01.04.09 01.04.08 31.03.10 31.03.09
2009-10 2008-09 2009-10 2008-09 Qty. Value Qty. Value Qty. Value Qty. Value
Tonnes Tonnes Tonnes Tonnes Tonnes (Rs. Crore) Tonnes (Rs. Crore) Tonnes (Rs. Crores) Tonnes (Rs. Crores)
Aluminium Metal 500,000 * 488,000 555,404 523,453 326 2.35 254 1.81 175 1.10 3 26 2.35
Rolled Products 205,000 205,000 205,265 (#) 181,784 5,734 54.89 3,734 32.44 5,044 47.55 5,734 54.89
Extruded Products 31,000 31,000 38,909 (@) 35,895 1,052 10.09 906 8.02 900 8.59 1,052 10.09
Conductor Redraw Rods 56,400 56,400 91,903 74,968 98 0.67 44 0.32 37 0.26 98 0.67
Aluminium Foil 40,000 40,000 16,920 ($) 22,046 320 5.37 699 9.19 278 4.06 320 5.37
Aluminium Wheel - ** 300,000 1,792 141,030 8,296 1.69 11,634 1.67 - - 8,296 1.69
Pcs Pcs Pcs Pcs Pcs - Pcs - Pcs - Pcs -
Hydrate & Alumina 1,500,000 1,500,000 1,307,323 1,237,284 19,064 23.50 37,342 50.29 31,721 50.21 19,064 23.50
Electricity 1,109.2 MW 1,109.2 9,314 MU 8,827 - - - - - - - -
Electricity (Co-generation) 248.8 *** MW 242.8 1,508 MU 1,446 - - - - - - -
Continuous Cast Copper Rods (CCR) 142,200 **** 97,200 147,220 145,542 597 11.24 1,556 45.93 471 16.26 597 11.24
Copper cathodes 500,000 500,000 333,360 300,862 217 4.03 3,036 90.67 2,348 80.22 217 4.03
Sulphuric Acid 1,670,000 1,670,000 1,042,799 999,253 21,929 - 34,320 2.55 49,932 4.16 21,929 -
Phosporic Acid 180,000 180,000 85,187 80,245 - - - - - - - -
DAP & complexes 400,000 400,000 182,378 170,176 8 0.02 5,476 9.27 5,610 10.19 8 0.02
Gold 15 15 9.116 4.872 0.381 42.46 0.001 0.10 0.015 2.05 0.381 42.46
Silver 150 150 44.856 37.307 1.350 2.69 0.021 0.04 0.881 1.96 1.350 2.69
Others 2.74 2.90 2.34 2.74
TOTAL 161.74 255.18 228.96 161.74
The Installed Capacity is as certified by the Management and license capacity is not given as licensing is not applicable.
* Installed capacity of Hirakud Smelter increased.
** Operation at Wheel Plant, Silvassa discontinued.
*** Installed capacity of Renukoot increased.
**** Installed capacity of Dahej increased.
# Includes 7 T (Previous Year 64 T) converted from outside party, 3,618 T (Previous year, 2,753 T) being production out of customers’ material and 21,461
(Previous year 30,438 T) transferred for captive consumption.
@ Include 1 T (Previous year 23 T) converted from outside party and 67 T (Previous year 81 T) transferred for captive consumption.
Alumina includes 1,053,571 T (1,017,211 T) transferred for own consumption/ further processing.
$ Includes 0 T (previous year 191 T ) being production out of customers material / transferred for own consumption/ further processing.
Production of CCR, Copper cathodes, Sulphuric acid, and Phosphoric acid include 1,182 T, 148,424 T, 251,654 T and 85,187 T (Previous year 178 T,
150,444 T, 260,448 T and 80,245 T) respectively which have been captively consumed / to be consumed.
During the year production and standardization loss of DAP & complexes is 302 T (Previous Year is 336 T).
Previous year figures have been regrouped / rearranged wherever necessary.
(b) CIF value of imports (Excluding goods in transit and imported items purchased locally):-
(Rs. in Crores)
Particulars 2009-10 2008-09
(i) Raw materials 11,521.42 7,936.56
(ii) Coal 136.97 228.04
(iii) Components & Spare parts 242.36 64.05
(iv) Capital Goods 89.01 78.83
(v) Trading Goods 71.99 112.63
(vi) Furnace Oil - 30.50
SCHEDULE ‘19’ (Cont’d)
B. NOTES ON ACCOUNTS (Cont’d)
SCHEDULES
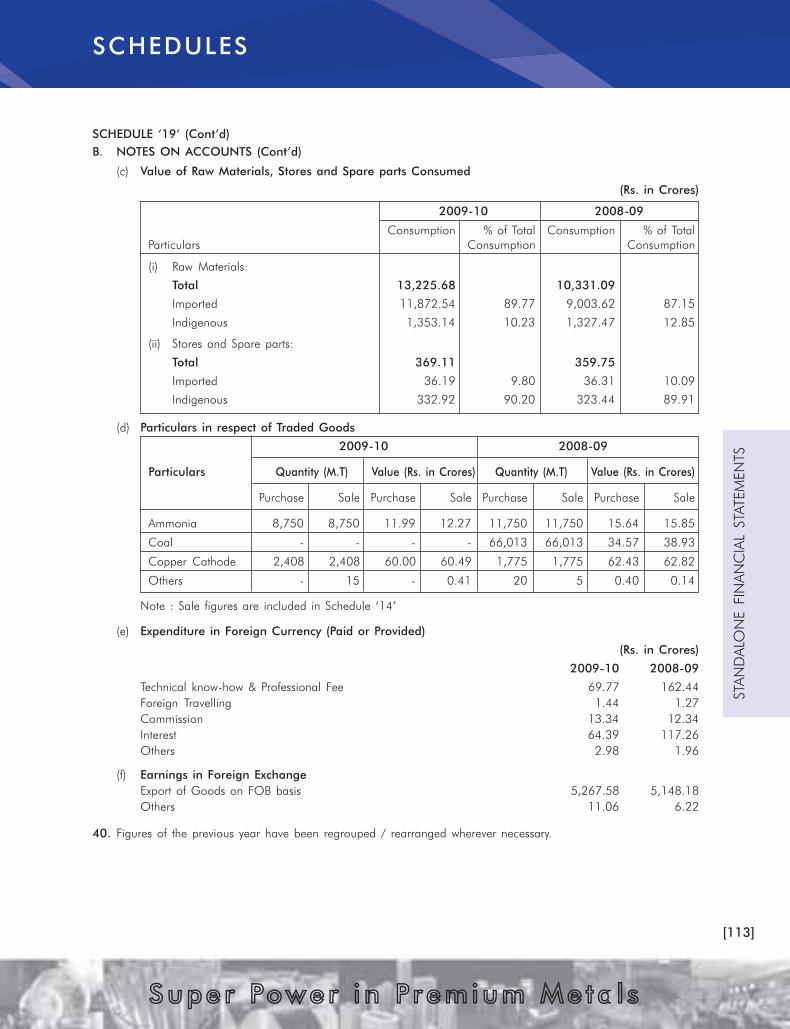
[113]
STA
ND
ALO
NE FIN
AN
CIA
L STATEM
EN
TS
Supe r Power i n Premium Me ta l s
(c) Value of Raw Materials, Stores and Spare parts Consumed
(Rs. in Crores)
2009-10 2008-09
Consumption % of Total Consumption % of Total
Particulars Consumption Consumption
(i) Raw Materials:
Total 13,225.68 10,331.09
Imported 11,872.54 89.77 9,003.62 87.15
Indigenous 1,353.14 10.23 1,327.47 12.85
(ii) Stores and Spare parts:
Total 369.11 359.75
Imported 36.19 9.80 36.31 10.09
Indigenous 332.92 90.20 323.44 89.91
(d) Particulars in respect of Traded Goods
2009-10 2008-09
Particulars Quantity (M.T) Value (Rs. in Crores) Quantity (M.T) Value (Rs. in Crores)
Purchase Sale Purchase Sale Purchase Sale Purchase Sale
Ammonia 8,750 8,750 11.99 12.27 11,750 11,750 15.64 15.85
Coal - - - - 66,013 66,013 34.57 38.93
Copper Cathode 2,408 2,408 60.00 60.49 1,775 1,775 62.43 62.82
Others - 15 - 0.41 20 5 0.40 0.14
Note : Sale figures are included in Schedule ‘14’
(e) Expenditure in Foreign Currency (Paid or Provided)
(Rs. in Crores)
2009-10 2008-09
Technical know-how & Professional Fee 69.77 162.44
Foreign Travelling 1.44 1.27
Commission 13.34 12.34
Interest 64.39 117.26
Others 2.98 1.96
(f) Earnings in Foreign Exchange
Export of Goods on FOB basis 5,267.58 5,148.18
Others 11.06 6.22
40. Figures of the previous year have been regrouped / rearranged wherever necessary.
SCHEDULE ‘19’ (Cont’d)
B. NOTES ON ACCOUNTS (Cont’d)
SCHEDULES

[114]
STA
ND
ALO
NE FIN
AN
CIA
L STATEM
EN
TS
Supe r Power i n Premium Me ta l s
41. Balance Sheet Abstract and Company’s General Business Profile
I. REGISTRATION DETAILS
Registration No. 1 1 - 1 1 2 3 8 Balance Sheet 3 1 0 3 2 0 1 0
State Code 1 1 Date Month Year
II. CAPITAL RAISED DURING THE YEAR (Rs. in Crores)
Public/Euro Issue QIP Issue
N I L 2 7 9 0 . 1 0
Bonus Issue Private Placement
N I L N I L
Share Warrants Employee Stock Option
N I L 0 . 6 1
III. POSITION OF MOBILISATION AND DEPLOYMENT OF FUNDS (Rs. in Crores)
Total Liabilities Total Assets
4 1 7 8 2 . 7 3 4 1 7 8 2 . 7 3
Sources of Funds:
Paid-up Capital Secured Loans
1 9 1 . 3 7 5 1 5 3 . 9 0
Employee Stock Options Outstanding Unsecured Loans
3 . 9 9 1 2 0 3 . 0 0
Reserves & Surplus Deferred Tax Liability (Net)
2 7 7 1 5 . 6 1 1 3 6 6 . 4 4
Application of Funds:
Net Fixed Assets Investments
1 1 4 3 7 . 6 1 2 1 4 8 0 . 8 3
Net Current Assets Misc. Expenditure
2 7 1 5 . 8 7 N I L
Accumulated Losses
N I L
IV. PERFORMANCE OF THE COMPANY (Rs. in Crores)
Turnover/Income Total Expenditure
1 9 7 9 6 . 1 3 1 7 5 3 1 . 5 7
Profit/Loss Before Profit/Loss After
Extraordinary Item & Tax Extraordinary Item & Tax
+ 2 2 6 4 . 5 6 + 1 9 1 5 . 6 3
Basic EPS (in Rs.) Diluted EPS (in Rs.)
1 0 . 8 2 1 0 . 8 1
Dividend %*
1 3 5 . 0 0
* Proposed
V. GENERIC NAMES OF FIVE PRINCIPAL PRODUCTS/SERVICES OF COMPANY
Item Code No. (ITC Code) 7 6 0 1
Product Description A L U M I N I U M I N G O T S
Item Code No. (ITC Code) 7 6 0 6
Product Description A L U M I N I U M R O L L E D P R O D U C T S
Item Code No. (ITC Code) 7 6 0 5
Product Description A L U M I N I U M R E D R A W R O D S
Item Code No. (ITC Code) 7 4 0 3 1 1
Product Description C O P P E R C A T H O D E S
Item Code No. (ITC Code) 7 4 0 7 1 0
Product Description C O N T I N U O U S C A S T C O P P E R R O D S
SCHEDULE ‘19’(Cont’d)
NOTES ON ACCOUNTS (Cont’d)
As per our report annexed.
For SINGHI & CO.
Chartered Accountants
RAJIV SINGHI
Partner Managing Director
Membership No. 53518
Camp: Mumbai
Dated: The 4th day of June, 2010
For and on behalf of the Board
S. Talukdar
Group Executive President & CFOKumar Mangalam Birla – Chairman
Anil Malik D. Bhattacharya – Managing Director
Company Secretary M. M. Bhagat – Director
SCHEDULES

[115]
STA
ND
ALO
NE FIN
AN
CIA
L STATEM
EN
TS
Supe r Power i n Premium Me ta l s
For and on behalf of the Board
S. Talukdar
Group Executive President & CFO
Kumar Mangalam Birla — Chairman
Anil Malik D. Bhattacharya — Managing Director
Dated: The 4th day of June, 2010 Company Secretary M. M. Bhagat — Director
(Rs. in Crores)
Name of the Subsidiary Companies Financial Extent of Net aggregate amount of the Profit/(Loss)
year of the the of the Subsidiary, so far as it concerns the
Subsidiary Holding members of the Holding Company
ended on Company’s Additional
interest (%) Not dealt with in the Dealt with in the Informa-
Holding Company’s Holding Company’s tions under
Accounts Accounts Sec. 212 (5)
For the For the For the For the
Financial previous Financial previous
Year of the Financial Year Financial
Subsidiary Years of the Years
since they Subsidiary since they
become become
Subsidiary Subsidiary
1 Indal Exports Limited 31.03.2010 100.00% (0.00) (0.03) Nil Nil N.A.
2 Minerals & Minerals Limited 31.03.2010 100.00% 0.01 1.12 Nil Nil N.A.
3 Renuka Investments & Finance Limited 31.03.2010 100.00% 2.41 32.29 Nil 0.65 N.A.
4 Renukeshwar Investments & Finance Limited 31.03.2010 100.00% 0.90 23.82 Nil 0.10 N.A.
5 Suvas Holdings Limited 31.03.2010 51.00% Nil Nil Nil Nil N.A.
6 Utkal Alumina International Limited 31.03.2010 100.00% (15.41) Nil Nil Nil N.A.
7 Aditya Birla Chemicals (India) Limited 31.03.2010 54.65% 33.20 103.93 1.80 6.54 N.A.
8 Hindalco-Almex Aerospace Limited 31.03.2010 70.00% (4.62) (10.71) Nil Nil N.A.
9 HAAL USA Inc $ 31.03.2010 70.00% 0.09 (0.01) Nil Nil N.A.
10 Lucknow Finance Company Limited 31.03.2010 100.00% 1.83 6.80 Nil Nil N.A.
11 Dahej Harbour and Infrastructure Limited 31.03.2010 100.00% 46.03 214.02 Nil Nil N.A.
12 East Coast Bauxite Mining Company Private Limited 31.03.2010 74.00% (0.00) (0.00) Nil Nil N.A.
13 Tubed Coal Mines Limited 31.03.2010 60.00% (0.04) Nil Nil Nil N.A.
14 Mauda Energy Limited 31.03.2010 100.00% Nil Nil Nil Nil N.A.
15 Aditya Birla Minerals Limited - Consolidated * 31.03.2010 51.00% 126.24 (13.71) Nil 65.05 N.A.
16 Birla Resources Pty Limited * 31.03.2010 100.00% 0.00 (8.68) Nil Nil N.A.
17 A V Minerals (Netherlands) B.V. * 31.03.2010 100.00% (402.51) (1090.62) Nil Nil N.A.
18 A V Metals Inc # * 31.03.2010 100.00% (0.92) (14.32) Nil Nil N.A.
19 A V Aluminum Inc # # * 31.03.2010 100.00% (9.82) (134.60) Nil Nil N.A.
20 Novelis Inc - Consolidated # # # * 31.03.2010 100.00% 1906.52 (6174.55) Nil Nil N.A.
* Translated at Average exchange rate.
$ Subsidiary of Hindalco-Almex Aerospace Limited.
# Subsidiary of A V Minerals (Netherlands) B.V.
# # Subsidiary of A V Metals Inc.
# # # Subsidiary of A V Aluminum Inc.
Note:
1. As the Financial Year of the Subsidary Companies coincide with the Financial Year of the Holding Company,
Section 212 (5) of the Companies Act, 1956, is not applicable.
STATEMENT PURSUANT TO SECTION 212 OF THE COMPANIES
ACT, 1956, RELATING TO SUBSIDIARY COMPANIES

[116]
CO
NSO
LID
ATED
FIN
AN
CIA
L STATEM
EN
TS
Supe r Power i n Premium Me ta l s
AUDITORS’ REPORT ON THE CONSOLIDATED
FINANCIAL STATEMENTS
AUDITORS’ REPORT TO THE BOARD OF DIRECTORS OF HINDALCO INDUSTRIES LIMITED ON THE
CONSOLIDATED FINANCIAL STATEMENTS OF HINDALCO INDUSTRIES LIMITED, ITS SUBSIDIARIES, JOINT
VENTURES AND ASSOCIATES.
1) We have audited the attached consolidated balance sheet of HINDALCO INDUSTRIES LIMITED, (“the
Company”), its subsidiaries, joint ventures and associates (collectively referred as “the Group”) as at
31st
March, 2010, the consolidated profit and loss account and also the consolidated cash flow
statement for the year ended on that date annexed thereto. These financial statements are the responsibility
of the Company’s management and have been prepared by the management on the basis of separate
financial statement and other financial information regarding components. Our responsibility is to
express an opinion on these financial statements based on our audit.
2) We conducted our audit in accordance with auditing standards generally accepted in India. Those
standards require that we plan and perform the audit to obtain reasonable assurance about whether the
financial statements are free of material misstatement. An audit includes examining on a test basis,
evidence supporting the amounts and disclosures in the financial statements. An audit also includes
assessing the accounting principles used and significant estimates made by management, as well as
evaluating the overall financial statement presentation. We believe that our audit provides a reasonable
basis for our opinion.
a) We did not audit the financial statements of certain Indian subsidiaries whose financial statements
reflect total assets of Rs.2,631.08 crores as at 31st
March, 2010, total revenue of Rs. 258.23
crores and net cash flow amounting to Rs 13.60 crores for the year then ended. These financial
statements and other financial information have been audited by other auditors whose reports have
been furnished to us and our opinion is based solely on the report of other auditors.
b) The consolidated financial statements of foreign subsidiaries namely Novelis Inc. and Aditya Birla
Minerals Ltd and the standalone financial statements of A V Minerals (Netherlands) B.V., A V Metals
Inc., A V Aluminum Inc., and Birla Resources Pty Ltd. and HAAL USA INC. have not been audited
by us. These financial statements have been audited by other auditors as appointed under the
respective laws.
(i) Of the above, certain foreign subsidiaries whose consolidated financial statements/financial
statements reflect total assets of Rs. 36,807.57 crores as at 31st
March, 2010,( net of investment
of fellow foreign subsidiaries) total revenue of Rs. 41,110.47 crores and net cash flow amounting
to Rs. 612.74 crores for the year then ended, have been prepared by the Management of the
Company and its subsidiaries in accordance with the generally accepted accounting principles
in India and other recognized accounting practices and policies followed by the Company.
These financial statements have been audited by a firm of Chartered Accountants and have
been included in the Consolidated financial statement of the Group on the basis of their Fit for
Consolidation Report (“FFC”) received from them.
(ii) The consolidated financial statements/financial statement of certain other foreign subsidiaries
have been audited by other auditors appointed under the respective laws, converted into Indian
GAAP by the management to the extent possible and reviewed by us. These foreign subsidiaries
reflect total assets of Rs.2,432.06 crores as at 31st
March, 2010 and total revenue Rs 1,675.53
crores and net cash flow amounting to Rs 0.94 crores for the year then ended.
c) These consolidated financial statements include total assets of Rs. 19.92 crores as at 31st
March, 2010
and total revenue of Rs. nil and net cash flow amounting to Rs 0.55 crores for the year then ended,
being proportionate share in the foreign Joint venture Hydromine Global Minerals (GMBH) Limited
which is based on financial statements audited by other firm of Chartered Accountants in accordance
with Indian GAAP.
d) The Company’s share of profit in associates aggregating to Rs. 66.48 crores and the net carrying cost
of investment as at 31st
March, 2010, of Rs 560.96 crores, have been accounted for based on audited
financial statements audited by other auditors.
e) Our opinion on the figures included in the aforesaid results relating to subsidiaries, associates and joint
ventures to the extent not audited/ reviewed by us, have been formed based on reports received from
other auditors/ firm of Chartered Accountants .
3) We report that the consolidated financial statements have been prepared by the Company in accordance
with the requirements of Accounting Standard (AS) 21, “Consolidated Financial Statements”, except as

[117]
CO
NSO
LID
ATED
FIN
AN
CIA
L STATEM
EN
TS
Supe r Power i n Premium Me ta l s
AUDITORS’ REPORT ON THE CONSOLIDATED
FINANCIAL STATEMENTS
mentioned in Para 5(b) below , Accounting Standard (AS) 23, “Accounting for Investment in Associates
in Consolidated Financial Statements” and Accounting Standard (AS) 27 “Financial reporting on interest
in Joint Venture” and other applicable Accounting Standards as notified by the Companies (Accounting
Standard) Rules, 2006.
4) Paragraph 4 of the Fit for Consolidation (“FFC”) reports as referred to in paragraph 2(b)(i) above states
that “ Based on our audit, and on the basis of the information and explanations given to us, in our
opinion, the accompanying FFC consolidated financial statements of the Company read with the notes
thereon and attached thereto give, before the Ultimate Holding Company level consolidation adjustments/
disclosures referred to in paragraph 2 above which have been properly carried out, a true and fair view
in conformity with generally accepted accounting principles and other recognized accounting practices
and policies in India”.
5) Without qualifying our opinion, Attention is drawn to the following
a) As referred in note no 13 of schedule 20, the Company has partially adopted Accounting Standard
(AS) 30 on Financial Instruments: Recognition and Measurement, in so far as it relates to derivative
accounting, from 1st
April 2009. Accordingly, net loss arising on fair valuation of outstanding
derivatives as on 1st
April, 2009 amounting to Rs. 230.58 crores (net of deferred tax of Rs. 118.73
crores) has been adjusted against General Reserve following transitional provisions. Accounting for
all derivatives from 1st
April, 2009 have been done as prescribed under the AS. Accordingly,
net gain / (loss) of Rs. (236.12) crores and Rs. 167.75 crores and Rs. 246.09 crores for the year
ended 31st
March, 2010 have been included under Sales and Raw Materials Consumed & Other
Expenses (in Manufacturing and Other Expenses), respectively, with consequential impact on profit
for the year ended 31st
March, 2010.
b) As per Scheme of Arrangement Under Section 391 to 394 of the Companies Act 1956, approved
by the Honorable High Court of Mumbai, the Company has created Business Reconstruction
Reserve (“BRR”) during the previous year by transferring balance standing to the credit of Securities
Premium Account for adjusting certain expenses as defined in the scheme. Accordingly, the
management of the company, during the year has identified and adjusted impairment loss of Rs. nil
(Previous Year Rs. 3,743.00 crores) and interest and other expenses of Rs. 304.39 crores (Previous
Year Rs. 908.27 crores) against BRR. This has resulted in net profit of the group for the year being
higher by Rs. 304.39 crores (during the previous year reported net profit of the group of
Rs. 483.89 crores would have been lower by Rs. 4,651.27 crores) Refer note no 7 in schedule 20.
c) The consolidated financial statement for the year ended 31st
March, 2009 were drawn up after
taking into consideration unaudited consolidated accounts of IDEA Cellular Limited (IDEA), an
associate, as available then. The consolidated figures for the year ended 31st
March, 2009
included in this consolidated financial statements has been restated based on the audited consolidated
financial statements of IDEA. The effect of such restatement is given in note no 2 in schedule 20.
6) We report that on the basis of the information and according to the explanations given to us, and on
consideration of the separate audit reports and fit for consolidation reports, we are of the opinion that
the said consolidated financial statements , read together with significant accounting policies in schedule
20 and notes appearing thereon and Para 5 above , give a true and fair view in conformity with the
accounting principles generally accepted in India:
(a) in the case of the consolidated Balance Sheet, of the state of affairs of the Group as at
31st
March, 2010;
(b) in the case of the consolidated Profit and Loss Account, of the consolidated profit of the Group for
the year ended on that date; and
(c) in the case of the consolidated Cash Flow Statement, of the consolidated cash flows of the Group
for the year ended on that date.
For Singhi & Co.,
Chartered Accountants
Firm Registration No.302049E
Camp: Mumbai
Dated: The 4th
day of June, 2010. RAJIV SINGHI
1B, Old Post Office Street Partner
Kolkata, 700 001 Membership No. 53518
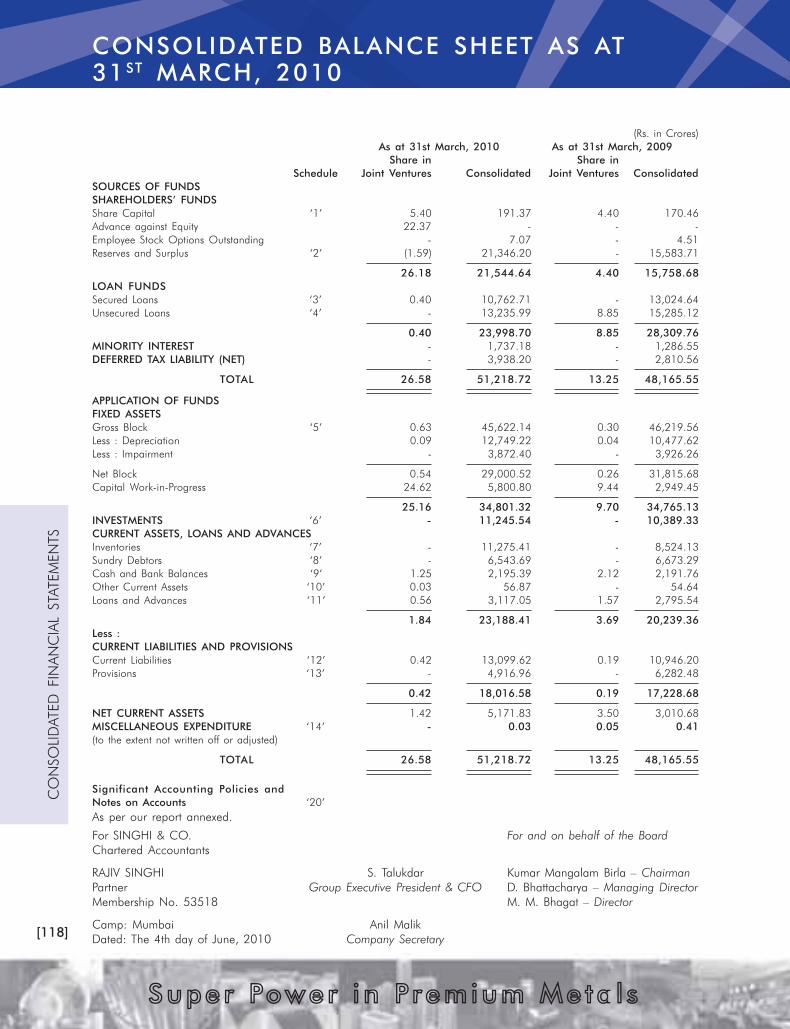
[118]
CO
NSO
LID
ATED
FIN
AN
CIA
L STATEM
EN
TS
Supe r Power i n Premium Me ta l s
CONSOLIDATED BALANCE SHEET AS AT
31ST
MARCH, 2010
(Rs. in Crores)
As at 31st March, 2010 As at 31st March, 2009
Share in Share in
Schedule Joint Ventures Consolidated Joint Ventures Consolidated
SOURCES OF FUNDS
SHAREHOLDERS’ FUNDS
Share Capital ‘1’ 5.40 191.37 4.40 170.46
Advance against Equity 22.37 - - -
Employee Stock Options Outstanding - 7.07 - 4.51
Reserves and Surplus ‘2’ (1.59) 21,346.20 - 15,583.71
26.18 21,544.64 4.40 15,758.68
LOAN FUNDS
Secured Loans ‘3’ 0.40 10,762.71 - 13,024.64
Unsecured Loans ‘4’ - 13,235.99 8.85 15,285.12
0.40 23,998.70 8.85 28,309.76
MINORITY INTEREST - 1,737.18 - 1,286.55
DEFERRED TAX LIABILITY (NET) - 3,938.20 - 2,810.56
TOTAL 26.58 51,218.72 13.25 48,165.55
APPLICATION OF FUNDS
FIXED ASSETS
Gross Block ‘5’ 0.63 45,622.14 0.30 46,219.56
Less : Depreciation 0.09 12,749.22 0.04 10,477.62
Less : Impairment - 3,872.40 - 3,926.26
Net Block 0.54 29,000.52 0.26 31,815.68
Capital Work-in-Progress 24.62 5,800.80 9.44 2,949.45
25.16 34,801.32 9.70 34,765.13
INVESTMENTS ‘6’ - 11,245.54 - 10,389.33
CURRENT ASSETS, LOANS AND ADVANCES
Inventories ‘7’ - 11,275.41 - 8,524.13
Sundry Debtors ‘8’ - 6,543.69 - 6,673.29
Cash and Bank Balances ‘9’ 1.25 2,195.39 2.12 2,191.76
Other Current Assets ‘10’ 0.03 56.87 - 54.64
Loans and Advances ‘11’ 0.56 3,117.05 1.57 2,795.54
1.84 23,188.41 3.69 20,239.36
Less :
CURRENT LIABILITIES AND PROVISIONS
Current Liabilities ‘12’ 0.42 13,099.62 0.19 10,946.20
Provisions ‘13’ - 4,916.96 - 6,282.48
0.42 18,016.58 0.19 17,228.68
NET CURRENT ASSETS 1.42 5,171.83 3.50 3,010.68
MISCELLANEOUS EXPENDITURE ‘14’ - 0.03 0.05 0.41
(to the extent not written off or adjusted)
TOTAL 26.58 51,218.72 13.25 48,165.55
Significant Accounting Policies and
Notes on Accounts ‘20’
As per our report annexed.
For SINGHI & CO. For and on behalf of the Board
Chartered Accountants
RAJIV SINGHI S. Talukdar Kumar Mangalam Birla – Chairman
Partner Group Executive President & CFO D. Bhattacharya – Managing Director
Membership No. 53518 M. M. Bhagat – Director
Camp: Mumbai Anil Malik
Dated: The 4th day of June, 2010 Company Secretary
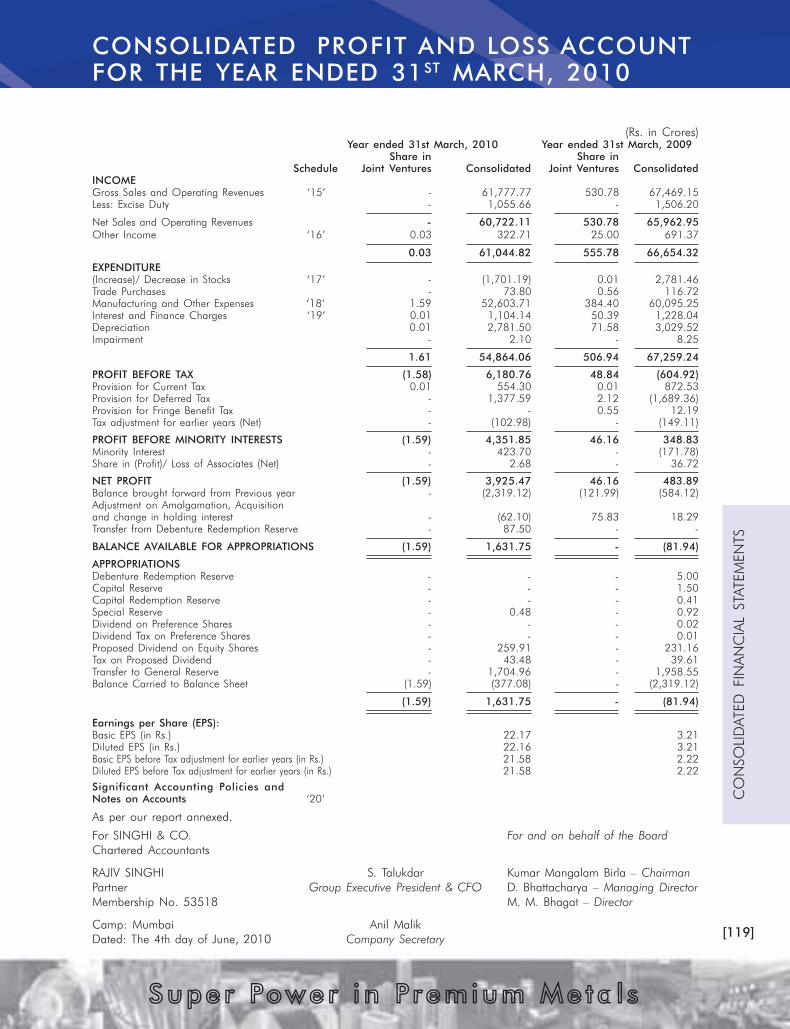
[119]
CO
NSO
LID
ATED
FIN
AN
CIA
L STATEM
EN
TS
Supe r Power i n Premium Me ta l s
CONSOLIDATED PROFIT AND LOSS ACCOUNT
FOR THE YEAR ENDED 31ST
MARCH, 2010
(Rs. in Crores)
Year ended 31st March, 2010 Year ended 31st March, 2009
Share in Share in
Schedule Joint Ventures Consolidated Joint Ventures Consolidated
INCOME
Gross Sales and Operating Revenues ‘15’ - 61,777.77 530.78 67,469.15
Less: Excise Duty - 1,055.66 - 1,506.20
Net Sales and Operating Revenues - 60,722.11 530.78 65,962.95
Other Income ‘16’ 0.03 322.71 25.00 691.37
0.03 61,044.82 555.78 66,654.32
EXPENDITURE
(Increase)/ Decrease in Stocks ‘17’ - (1,701.19) 0.01 2,781.46
Trade Purchases - 73.80 0.56 116.72
Manufacturing and Other Expenses ‘18’ 1.59 52,603.71 384.40 60,095.25
Interest and Finance Charges ‘19’ 0.01 1,104.14 50.39 1,228.04
Depreciation 0.01 2,781.50 71.58 3,029.52
Impairment - 2.10 - 8.25
1.61 54,864.06 506.94 67,259.24
PROFIT BEFORE TAX (1.58) 6,180.76 48.84 (604.92)
Provision for Current Tax 0.01 554.30 0.01 872.53
Provision for Deferred Tax - 1,377.59 2.12 (1,689.36)
Provision for Fringe Benefit Tax - - 0.55 12.19
Tax adjustment for earlier years (Net) - (102.98) - (149.11)
PROFIT BEFORE MINORITY INTERESTS (1.59) 4,351.85 46.16 348.83
Minority Interest - 423.70 - (171.78)
Share in (Profit)/ Loss of Associates (Net) - 2.68 - 36.72
NET PROFIT (1.59) 3,925.47 46.16 483.89
Balance brought forward from Previous year - (2,319.12) (121.99) (584.12)
Adjustment on Amalgamation, Acquisition
and change in holding interest - (62.10) 75.83 18.29
Transfer from Debenture Redemption Reserve - 87.50 - -
BALANCE AVAILABLE FOR APPROPRIATIONS (1.59) 1,631.75 - (81.94)
APPROPRIATIONS
Debenture Redemption Reserve - - - 5.00
Capital Reserve - - - 1.50
Capital Redemption Reserve - - - 0.41
Special Reserve - 0.48 - 0.92
Dividend on Preference Shares - - - 0.02
Dividend Tax on Preference Shares - - - 0.01
Proposed Dividend on Equity Shares - 259.91 - 231.16
Tax on Proposed Dividend - 43.48 - 39.61
Transfer to General Reserve - 1,704.96 - 1,958.55
Balance Carried to Balance Sheet (1.59) (377.08) - (2,319.12)
(1.59) 1,631.75 - (81.94)
Earnings per Share (EPS):
Basic EPS (in Rs.) 22.17 3.21
Diluted EPS (in Rs.) 22.16 3.21
Basic EPS before Tax adjustment for earlier years (in Rs.) 21.58 2.22
Diluted EPS before Tax adjustment for earlier years (in Rs.) 21.58 2.22
Significant Accounting Policies and
Notes on Accounts ‘20’
As per our report annexed.
For SINGHI & CO. For and on behalf of the Board
Chartered Accountants
RAJIV SINGHI S. Talukdar Kumar Mangalam Birla – Chairman
Partner Group Executive President & CFO D. Bhattacharya – Managing Director
Membership No. 53518 M. M. Bhagat – Director
Camp: Mumbai Anil Malik
Dated: The 4th day of June, 2010 Company Secretary
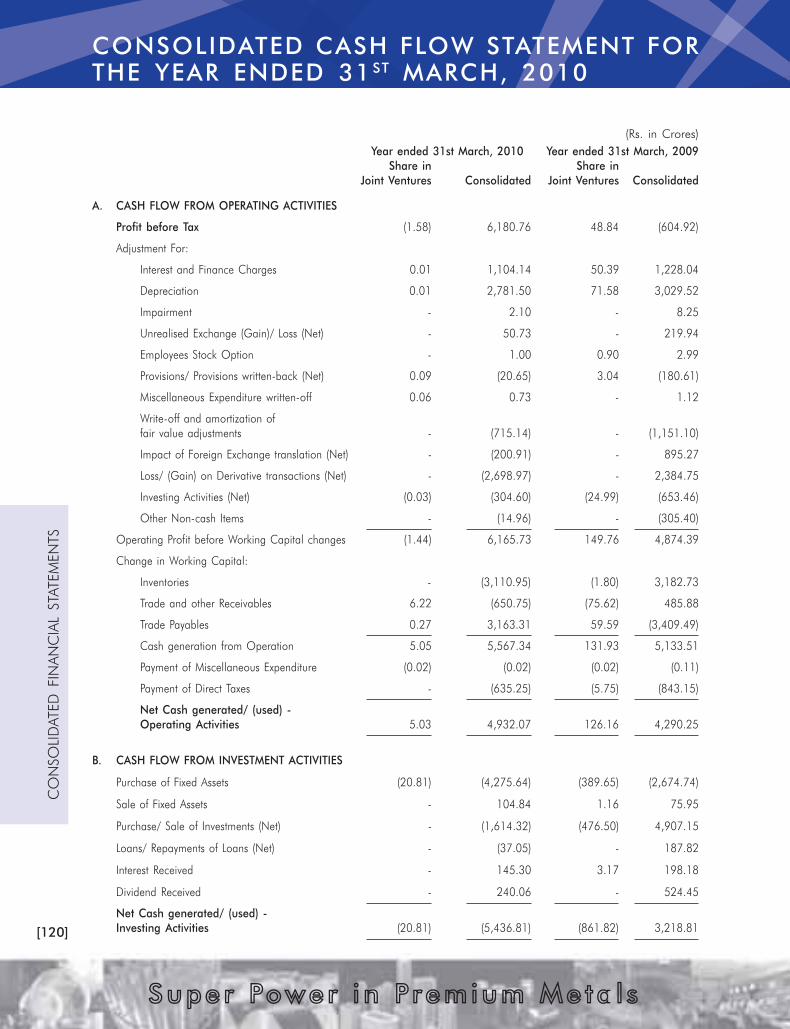
[120]
CO
NSO
LID
ATED
FIN
AN
CIA
L STATEM
EN
TS
Supe r Power i n Premium Me ta l s
CONSOLIDATED CASH FLOW STATEMENT FOR
THE YEAR ENDED 31ST
MARCH, 2010
(Rs. in Crores)
Year ended 31st March, 2010 Year ended 31st March, 2009
Share in Share in
Joint Ventures Consolidated Joint Ventures Consolidated
A. CASH FLOW FROM OPERATING ACTIVITIES
Profit before Tax (1.58) 6,180.76 48.84 (604.92)
Adjustment For:
Interest and Finance Charges 0.01 1,104.14 50.39 1,228.04
Depreciation 0.01 2,781.50 71.58 3,029.52
Impairment - 2.10 - 8.25
Unrealised Exchange (Gain)/ Loss (Net) - 50.73 - 219.94
Employees Stock Option - 1.00 0.90 2.99
Provisions/ Provisions written-back (Net) 0.09 (20.65) 3.04 (180.61)
Miscellaneous Expenditure written-off 0.06 0.73 - 1.12
Write-off and amortization of
fair value adjustments - (715.14) - (1,151.10)
Impact of Foreign Exchange translation (Net) - (200.91) - 895.27
Loss/ (Gain) on Derivative transactions (Net) - (2,698.97) - 2,384.75
Investing Activities (Net) (0.03) (304.60) (24.99) (653.46)
Other Non-cash Items - (14.96) - (305.40)
Operating Profit before Working Capital changes (1.44) 6,165.73 149.76 4,874.39
Change in Working Capital:
Inventories - (3,110.95) (1.80) 3,182.73
Trade and other Receivables 6.22 (650.75) (75.62) 485.88
Trade Payables 0.27 3,163.31 59.59 (3,409.49)
Cash generation from Operation 5.05 5,567.34 131.93 5,133.51
Payment of Miscellaneous Expenditure (0.02) (0.02) (0.02) (0.11)
Payment of Direct Taxes - (635.25) (5.75) (843.15)
Net Cash generated/ (used) -
Operating Activities 5.03 4,932.07 126.16 4,290.25
B. CASH FLOW FROM INVESTMENT ACTIVITIES
Purchase of Fixed Assets (20.81) (4,275.64) (389.65) (2,674.74)
Sale of Fixed Assets - 104.84 1.16 75.95
Purchase/ Sale of Investments (Net) - (1,614.32) (476.50) 4,907.15
Loans/ Repayments of Loans (Net) - (37.05) - 187.82
Interest Received - 145.30 3.17 198.18
Dividend Received - 240.06 - 524.45
Net Cash generated/ (used) -
Investing Activities (20.81) (5,436.81) (861.82) 3,218.81
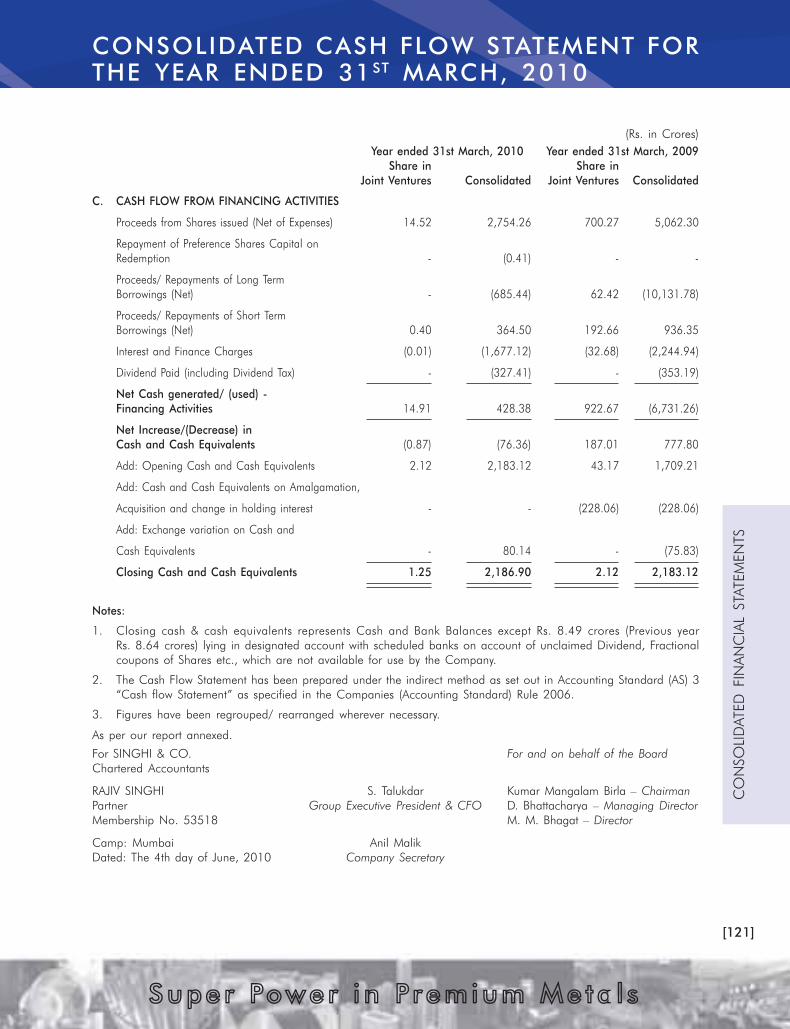
[121]
CO
NSO
LID
ATED
FIN
AN
CIA
L STATEM
EN
TS
Supe r Power i n Premium Me ta l s
CONSOLIDATED CASH FLOW STATEMENT FOR
THE YEAR ENDED 31ST
MARCH, 2010
(Rs. in Crores)
Year ended 31st March, 2010 Year ended 31st March, 2009
Share in Share in
Joint Ventures Consolidated Joint Ventures Consolidated
C. CASH FLOW FROM FINANCING ACTIVITIES
Proceeds from Shares issued (Net of Expenses) 14.52 2,754.26 700.27 5,062.30
Repayment of Preference Shares Capital on
Redemption - (0.41) - -
Proceeds/ Repayments of Long Term
Borrowings (Net) - (685.44) 62.42 (10,131.78)
Proceeds/ Repayments of Short Term
Borrowings (Net) 0.40 364.50 192.66 936.35
Interest and Finance Charges (0.01) (1,677.12) (32.68) (2,244.94)
Dividend Paid (including Dividend Tax) - (327.41) - (353.19)
Net Cash generated/ (used) -
Financing Activities 14.91 428.38 922.67 (6,731.26)
Net Increase/(Decrease) in
Cash and Cash Equivalents (0.87) (76.36) 187.01 777.80
Add: Opening Cash and Cash Equivalents 2.12 2,183.12 43.17 1,709.21
Add: Cash and Cash Equivalents on Amalgamation,
Acquisition and change in holding interest - - (228.06) (228.06)
Add: Exchange variation on Cash and
Cash Equivalents - 80.14 - (75.83)
Closing Cash and Cash Equivalents 1.25 2,186.90 2.12 2,183.12
Notes:
1. Closing cash & cash equivalents represents Cash and Bank Balances except Rs. 8.49 crores (Previous year
Rs. 8.64 crores) lying in designated account with scheduled banks on account of unclaimed Dividend, Fractional
coupons of Shares etc., which are not available for use by the Company.
2. The Cash Flow Statement has been prepared under the indirect method as set out in Accounting Standard (AS) 3
“Cash flow Statement” as specified in the Companies (Accounting Standard) Rule 2006.
3. Figures have been regrouped/ rearranged wherever necessary.
As per our report annexed.
For SINGHI & CO. For and on behalf of the Board
Chartered Accountants
RAJIV SINGHI S. Talukdar Kumar Mangalam Birla – Chairman
Partner Group Executive President & CFO D. Bhattacharya – Managing Director
Membership No. 53518 M. M. Bhagat – Director
Camp: Mumbai Anil Malik
Dated: The 4th day of June, 2010 Company Secretary
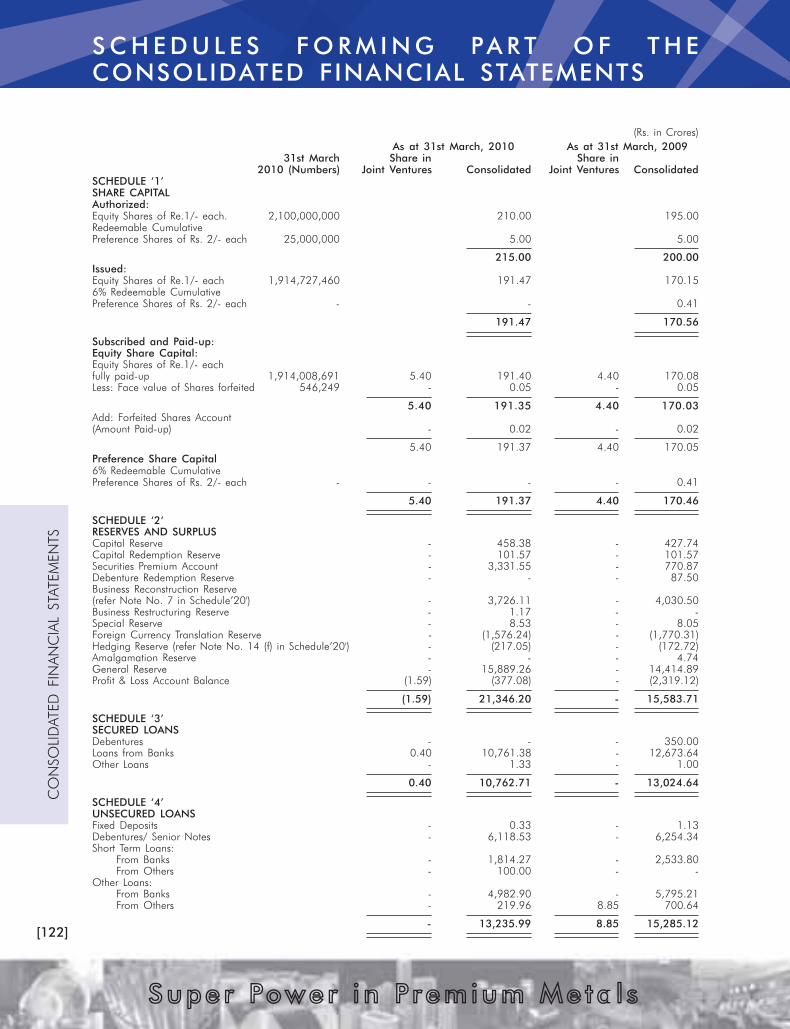
[122]
CO
NSO
LID
ATED
FIN
AN
CIA
L STATEM
EN
TS
Supe r Power i n Premium Me ta l s
S C H E D U L E S F O R M I N G PA R T O F T H E
CONSOLIDATED FINANCIAL STATEMENTS
(Rs. in Crores)
As at 31st March, 2010 As at 31st March, 2009
31st March Share in Share in
2010 (Numbers) Joint Ventures Consolidated Joint Ventures Consolidated
SCHEDULE ‘1’
SHARE CAPITAL
Authorized:
Equity Shares of Re.1/- each. 2,100,000,000 210.00 195.00
Redeemable Cumulative
Preference Shares of Rs. 2/- each 25,000,000 5.00 5.00
215.00 200.00
Issued:
Equity Shares of Re.1/- each 1,914,727,460 191.47 170.15
6% Redeemable Cumulative
Preference Shares of Rs. 2/- each - - 0.41
191.47 170.56
Subscribed and Paid-up:
Equity Share Capital:
Equity Shares of Re.1/- each
fully paid-up 1,914,008,691 5.40 191.40 4.40 170.08
Less: Face value of Shares forfeited 546,249 - 0.05 - 0.05
5.40 191.35 4.40 170.03
Add: Forfeited Shares Account
(Amount Paid-up) - 0.02 - 0.02
5.40 191.37 4.40 170.05
Preference Share Capital
6% Redeemable Cumulative
Preference Shares of Rs. 2/- each - - - - 0.41
5.40 191.37 4.40 170.46
SCHEDULE ‘2‘
RESERVES AND SURPLUS
Capital Reserve - 458.38 - 427.74
Capital Redemption Reserve - 101.57 - 101.57
Securities Premium Account - 3,331.55 - 770.87
Debenture Redemption Reserve - - - 87.50
Business Reconstruction Reserve
(refer Note No. 7 in Schedule’20') - 3,726.11 - 4,030.50
Business Restructuring Reserve - 1.17 - -
Special Reserve - 8.53 - 8.05
Foreign Currency Translation Reserve - (1,576.24) - (1,770.31)
Hedging Reserve (refer Note No. 14 (f) in Schedule’20') - (217.05) - (172.72)
Amalgamation Reserve - - - 4.74
General Reserve - 15,889.26 - 14,414.89
Profit & Loss Account Balance (1.59) (377.08) - (2,319.12)
(1.59) 21,346.20 - 15,583.71
SCHEDULE ‘3’
SECURED LOANS
Debentures - - - 350.00
Loans from Banks 0.40 10,761.38 - 12,673.64
Other Loans - 1.33 - 1.00
0.40 10,762.71 - 13,024.64
SCHEDULE ‘4’
UNSECURED LOANS
Fixed Deposits - 0.33 - 1.13
Debentures/ Senior Notes - 6,118.53 - 6,254.34
Short Term Loans:
From Banks - 1,814.27 - 2,533.80
From Others - 100.00 - -
Other Loans:
From Banks - 4,982.90 - 5,795.21
From Others - 219.96 8.85 700.64
- 13,235.99 8.85 15,285.12

[123]
CO
NSO
LID
ATED
FIN
AN
CIA
L STATEM
EN
TS
Supe r Power i n Premium Me ta l s
S C H E D U L E S F O R M I N G PA R T O F T H E
CONSOLIDATED FINANCIAL STATEMENTS
SC
HED
ULE ‘5
’
FIXED
A
SSETS
(Rs. in
C
rores)
ORIG
IN
AL C
OST
DEPREC
IA
TIO
NIM
PA
IRM
EN
TN
ET BO
OK
V
ALU
E
As at 3
1st M
arch
, 2
01
0A
s at 3
1st M
arch
, 2
00
9A
s at 3
1st M
arch
, 2
01
0A
s at 3
1st M
arch
, 2
00
9A
s at 3
1st M
arch
, 2
01
0A
s at 3
1st M
arch
, 2
00
9A
s at 3
1st M
arch
, 2
01
0A
s at 3
1st M
arch
, 2
00
9
Share in
Share in
Share in
Share in
Share in
Share in
Share in
Share in
Jo
int
Co
nso
lid
ated
Jo
int
Co
nso
lid
ated
Jo
int
Co
nso
lid
ated
Jo
int
Co
nso
lid
ated
Jo
int
Co
nso
lid
ated
Jo
int
Co
nso
lid
ated
Jo
int
Co
nso
lid
ated
Jo
int
Co
nso
lid
ated
Ven
tu
res
Ven
tu
res
Ven
tu
res
Ven
tu
res
Ven
tu
res
Ven
tu
res
Ven
tu
res
Ven
tu
res
A.
Tan
gib
le A
ssets
Min
ing
Rig
hts
-1
,3
43
.5
2-
1,1
74
.7
9-
61
5.5
0-
45
6.0
5-
--
--
72
8.0
2-
71
8.7
4
Leasehold
Land
0.2
29
9.4
7-
76
.5
2-
8.1
5-
7.1
4-
--
-0
.2
29
1.3
2-
69
.3
8
Freehold
Land
0.0
41
,0
68
.4
3-
1,1
31
.1
3-
59
.5
6-
38
.6
7-
22
.9
5-
26
.6
50
.0
49
85
.9
2-
1,0
65
.8
1
Buildin
gs
-4
,7
97
.8
0-
5,1
14
.9
5-
1,0
44
.4
4-
82
7.9
7-
12
.4
9-
21
.3
6-
3,7
40
.8
7-
4,2
65
.6
2
Pla
nt
and M
achin
ery
0.0
72
4,8
66
.0
10
.0
72
4,9
76
.3
1-
9,5
19
.9
0-
7,8
68
.6
2-
23
9.6
6-
28
0.9
30
.0
71
5,1
06
.4
50
.0
71
6,8
26
.7
6
Vehic
les
and
Aircraft
0.0
41
60
.1
70
.0
41
57
.7
70
.0
17
6.1
6-
67
.3
8-
--
-0
.0
38
4.0
10
.0
49
0.3
9
Furniture
and
Fittings
0.1
87
69
.6
10
.1
97
88
.5
60
.0
54
23
.9
10
.0
44
45
.8
8-
--
-0
.1
33
45
.7
00
.1
53
42
.6
8
Railw
ay
Sid
ings
-5
5.0
6-
40
.6
6-
13
.0
3-
9.3
7-
--
--
42
.0
3-
31
.2
9
Liv
e Sto
ck
-0
.0
8-
0.0
6-
--
--
--
--
0.0
8-
0.0
6
B.
In
tan
gib
le A
ssets
Go
odw
ill
-8
,0
30
.6
6-
7,8
88
.0
6-
--
--
3,5
97
.3
0-
3,5
97
.3
0-
4,4
33
.3
6-
4,2
90
.7
6
Rehabilitation
Assets
-1
03
.9
0-
64
.1
9-
34
.0
7-
26
.6
8-
--
--
69
.8
3-
37
.5
1
Techno
logy
-7
74
.7
0-
87
1.7
4-
16
9.2
6-
12
8.3
8-
--
--
60
5.4
4-
74
3.3
6
Com
pute
r
Softw
are
0.0
82
22
.6
4-
18
4.6
30
.0
31
46
.6
3-
12
7.6
9-
--
0.0
20
.0
57
6.0
1-
56
.9
2
Trade
Marks
-6
28
.6
8-
71
4.5
0-
90
.3
9-
67
.0
0-
--
--
53
8.2
9-
64
7.5
0
Entr
y/ Lic
ence Fees
--
--
--
--
--
--
--
--
Custo
mer
Rela
tionship
-2
,0
80
.1
1-
2,3
39
.4
5-
29
8.2
7-
21
8.9
6-
--
--
1,7
81
.8
4-
2,1
20
.4
9
Favourable
C
ontr
acts
-6
21
.3
0-
69
6.2
4-
24
9.9
5-
18
7.8
3-
--
--
37
1.3
5-
50
8.4
1
0.6
34
5,6
22
.1
40
.3
04
6,2
19
.5
60
.0
91
2,7
49
.2
20
.0
41
0,4
77
.6
2-
3,8
72
.4
0-
3,9
26
.2
60
.5
42
9,0
00
.5
20
.2
63
1,8
15
.6
8
C.
Capital
Work-in
-Progress
(inclu
din
g
Incid
enta
l Expenditure
durin
g
Constr
uction
perio
d)
24
.6
25
,8
00
.8
09
.4
42
,9
49
.4
5
25
.1
63
4,8
01
.3
29
.7
03
4,7
65
.1
3

[124]
CO
NSO
LID
ATED
FIN
AN
CIA
L STATEM
EN
TS
Supe r Power i n Premium Me ta l s
(Rs. in Crores)
As at 31st March, 2010 As at 31st March, 2009
Share in Share in
Joint Ventures Consolidated Joint Ventures Consolidated
SCHEDULE ‘6’
INVESTMENTS
A. Long Term Investments:
Government Securities - 161.75 - 161.75
Shares in Associates
(refer Note No. 8 in Schedule’20') - 4,692.15 - 5,466.34
Shares, Debentures, Bonds,
Units of Mutual Funds and Others - 488.04 - 517.73
B. Current Investments:
Shares, Debentures, Bonds,
Units of Mutual Funds and Others - 5,903.60 - 4,243.51
- 11,245.54 - 10,389.33
SCHEDULE ‘7’
INVENTORIES
Stores and Spare parts - 754.44 - 733.83
Coal and Fuel - 119.82 - 108.19
Raw Materials - 3,747.23 - 2,428.41
Work-in-Process - 5,074.62 - 3,923.59
Finished Goods - 1,557.60 - 1,318.99
Excise Duty on Stock - 21.70 - 11.12
- 11,275.41 - 8,524.13
SCHEDULE ‘8’
SUNDRY DEBTORS
Considered Good - 6,543.69 - 6,673.29
Considered Doubtful - 56.88 - 33.22
- 6,600.57 - 6,706.51
Less: Provision for doubtful debts - 56.88 - 33.22
- 6,543.69 - 6,673.29
SCHEDULE ‘9’
CASH AND BANK BALANCES
Cash balance on hand - 1.03 - 0.93
Cheques and Drafts in hand - 26.80 - 54.44
Balance with Scheduled Banks:
In Current Accounts - 138.71 0.82 176.53
In Deposit Account 0.50 65.59 - 686.29
Balance with Others:
In Current Accounts 0.75 1,138.15 1.30 864.76
In Deposit Account - 825.11 - 408.81
1.25 2,195.39 2.12 2,191.76
S C H E D U L E S F O R M I N G PA R T O F T H E
CONSOLIDATED FINANCIAL STATEMENTS
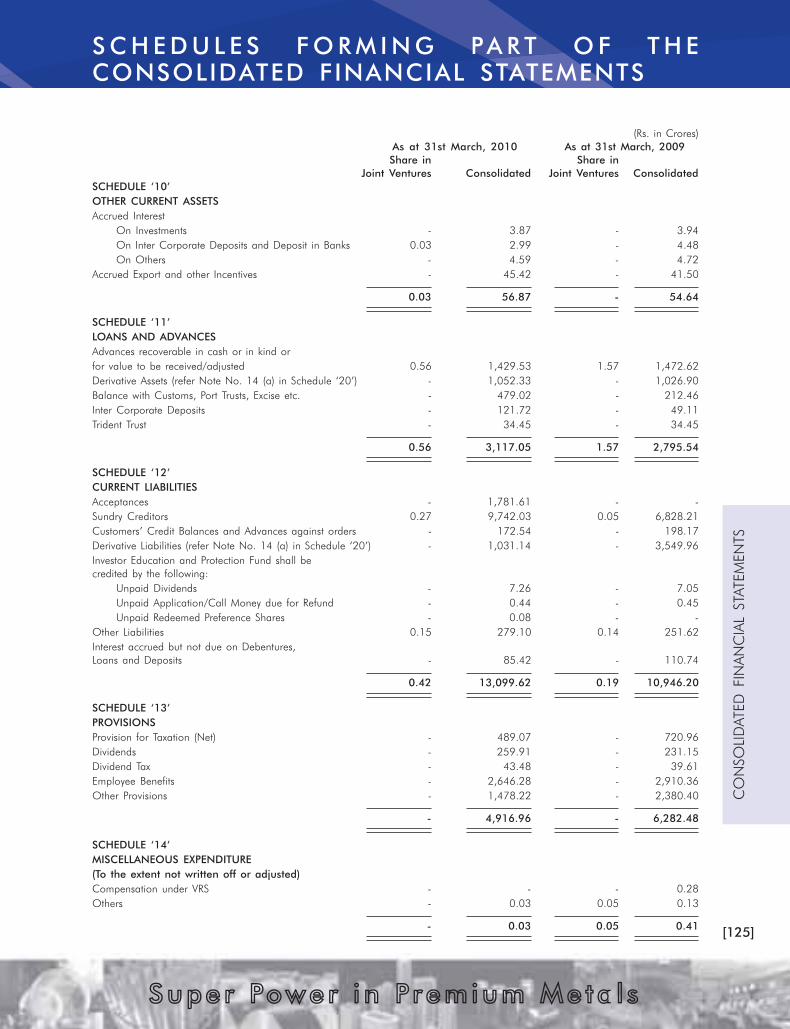
[125]
CO
NSO
LID
ATED
FIN
AN
CIA
L STATEM
EN
TS
Supe r Power i n Premium Me ta l s
(Rs. in Crores)
As at 31st March, 2010 As at 31st March, 2009
Share in Share in
Joint Ventures Consolidated Joint Ventures Consolidated
SCHEDULE ‘10’
OTHER CURRENT ASSETS
Accrued Interest
On Investments - 3.87 - 3.94
On Inter Corporate Deposits and Deposit in Banks 0.03 2.99 - 4.48
On Others - 4.59 - 4.72
Accrued Export and other Incentives - 45.42 - 41.50
0.03 56.87 - 54.64
SCHEDULE ‘11’
LOANS AND ADVANCES
Advances recoverable in cash or in kind or
for value to be received/adjusted 0.56 1,429.53 1.57 1,472.62
Derivative Assets (refer Note No. 14 (a) in Schedule ‘20’) - 1,052.33 - 1,026.90
Balance with Customs, Port Trusts, Excise etc. - 479.02 - 212.46
Inter Corporate Deposits - 121.72 - 49.11
Trident Trust - 34.45 - 34.45
0.56 3,117.05 1.57 2,795.54
SCHEDULE ‘12’
CURRENT LIABILITIES
Acceptances - 1,781.61 - -
Sundry Creditors 0.27 9,742.03 0.05 6,828.21
Customers’ Credit Balances and Advances against orders - 172.54 - 198.17
Derivative Liabilities (refer Note No. 14 (a) in Schedule ‘20’) - 1,031.14 - 3,549.96
Investor Education and Protection Fund shall be
credited by the following:
Unpaid Dividends - 7.26 - 7.05
Unpaid Application/Call Money due for Refund - 0.44 - 0.45
Unpaid Redeemed Preference Shares - 0.08 - -
Other Liabilities 0.15 279.10 0.14 251.62
Interest accrued but not due on Debentures,
Loans and Deposits - 85.42 - 110.74
0.42 13,099.62 0.19 10,946.20
SCHEDULE ‘13’
PROVISIONS
Provision for Taxation (Net) - 489.07 - 720.96
Dividends - 259.91 - 231.15
Dividend Tax - 43.48 - 39.61
Employee Benefits - 2,646.28 - 2,910.36
Other Provisions - 1,478.22 - 2,380.40
- 4,916.96 - 6,282.48
SCHEDULE ‘14’
MISCELLANEOUS EXPENDITURE
(To the extent not written off or adjusted)
Compensation under VRS - - - 0.28
Others - 0.03 0.05 0.13
- 0.03 0.05 0.41
S C H E D U L E S F O R M I N G PA R T O F T H E
CONSOLIDATED FINANCIAL STATEMENTS

[126]
CO
NSO
LID
ATED
FIN
AN
CIA
L STATEM
EN
TS
Supe r Power i n Premium Me ta l s
(Rs. in Crores)
Year ended 31st March, 2010 Year ended 31st March, 2009
Share in Share in
Joint Ventures Consolidated Joint Ventures Consolidated
SCHEDULE ‘15’
GROSS SALES AND OPERATING REVENUES
A. Sales and Services
Net Sales - 60,562.55 530.41 65,752.41
Excise Duty - 1,055.66 - 1,506.20
Gross Sales - 61,618.21 530.41 67,258.61
B. Operating Revenues
Export and other Incentives - 59.58 - 89.74
Miscellaneous Receipts and Claims - 99.98 0.37 120.80
- 159.56 0.37 210.54
- 61,777.77 530.78 67,469.15
SCHEDULE ‘16’
OTHER INCOME
Rent Received - 5.43 - 5.92
Profit/(Loss) on Fixed Assets sold/discarded (Net) - (16.96) 0.06 (9.52)
Income from Current Investments:
Dividend - 128.12 - 337.54
Profit/(Loss) on sale of Investments (Net) - 37.69 13.66 22.36
Change in carrying amount of Investments (Net) - (0.18) - 8.33
Income from Long Term Investments:
Interest - 18.36 - 14.34
Dividend - 18.72 - 24.44
Profit/(Loss) on sale of Investments (Net) - 2.10 - 81.41
(Diminution)/ write back in carrying cost of Investments (Net) - (0.11) - 0.33
Interest from Inter Corporate Deposits and Deposit in Banks 0.03 15.25 11.28 28.68
Interest from Others - 101.61 - 145.55
Miscellaneous Income - 12.68 - 31.99
0.03 322.71 25.00 691.37
SCHEDULE ‘17’
(INCREASE)/ DECREASE IN STOCKS
Opening Stocks:
Work-in-Process - 3,923.59 - 5,390.31
Finished Goods - 1,330.11 - 1,801.48
- 5,253.70 - 7,191.79
Less: Closing Stocks:
Work-in-Process - 5,074.62 - 3,923.59
Finished Goods - 1,579.30 - 1,330.11
- 6,653.92 - 5,253.70
- (1,400.22) - 1,938.09
Less: Stock on Acquisition/ Amalgamation - - (0.01) (0.01)
Less: Change in Excise Duty on Stock - (10.58) - 17.38
Less: Currency Translation Adjustment - 311.55 - (860.74)
- (1,701.19) 0.01 2,781.46
S C H E D U L E S F O R M I N G PA R T O F T H E
CONSOLIDATED FINANCIAL STATEMENTS

[127]
CO
NSO
LID
ATED
FIN
AN
CIA
L STATEM
EN
TS
Supe r Power i n Premium Me ta l s
(Rs. in Crores)
Year ended 31st March, 2010 Year ended 31st March, 2009
Share in Share in
Joint Ventures Consolidated Joint Ventures Consolidated
SCHEDULE ‘18’
MANUFACTURING AND OTHER EXPENSES
Raw Materials Consumed - 38,100.38 - 40,355.62
Power and Fuel - 3,345.14 26.57 3,639.30
Payments to and Provisions for Employees
Salaries, Wages and Bonus - 4,184.50 24.64 4,111.62
Contribution to Provident and other Funds - 221.61 1.59 137.36
Employees Welfare - 658.90 1.09 1,091.42
Other Expenses
Consumption of Stores and Spare parts - 2,190.31 4.89 2,038.40
Repairs to Buildings - 183.88 0.11 204.25
Repairs to Machinery - 836.97 12.69 1,128.75
Rates and Taxes 0.01 92.79 59.25 144.74
Rent - 177.52 14.73 197.00
Insurance - 118.05 0.42 121.06
Auditors’ Remuneration 0.03 37.68 0.13 34.52
Research and Development - 186.99 - 195.21
Discount on Sales - 21.02 - 17.62
Commission on Sales - 37.34 22.20 68.13
Freight and Forwarding (Net) - 1,640.79 - 1,960.59
Provision for doubtful debts/(written back) (Net) - 26.40 1.60 11.24
Bad Debts written off - 0.40 - 0.63
Donation - 50.80 - 32.63
Directors’ Fees - 3.02 0.01 3.46
Directors’ Commission - 14.00 - 7.50
Miscellaneous Expenditure written off 0.06 0.73 - 1.12
Incidental Expenditure written off (Net) 0.08 11.58 - 8.73
Liability no longer required written back (Net) - (143.01) (0.42) (170.75)
(Gain)/Loss on Change in Fair Value of Derivatives (Net) - (1,159.32) - 2,553.36
Miscellaneous 1.41 1,765.24 214.90 2,201.74
1.59 52,603.71 384.40 60,095.25
SCHEDULE ‘19’
INTEREST AND FINANCE CHARGES
Interest on Debentures and other Fixed Loans - 983.51 48.26 1,138.50
Interest on Others 0.01 245.87 0.89 167.22
Other Finance Charges - 210.54 1.24 255.04
0.01 1,439.92 50.39 1,560.76
Less: Interest Capitalised - 335.78 - 332.72
0.01 1,104.14 50.39 1,228.04
S C H E D U L E S F O R M I N G PA R T O F T H E
CONSOLIDATED FINANCIAL STATEMENTS

[128]
CO
NSO
LID
ATED
FIN
AN
CIA
L STATEM
EN
TS
Supe r Power i n Premium Me ta l s
S C H E D U L E S F O R M I N G PA R T O F T H E
CONSOLIDATED FINANCIAL STATEMENTS
SCHEDULE ‘20’
SIGNIFICANT ACCOUNTING POLICIES AND NOTES ON ACCOUNTS
A. PRINCIPLES OF CONSOLIDATION
The Consolidated Financial Statements (CFS) relate to Hindalco Industries Limited (the Company), its Subsidiaries
and its interest in Joint Ventures and Associates (the Group). The CFS have been prepared in accordance with
Accounting Standard 21 on “Consolidated Financial Statements” (AS 21), Accounting Standard 23 on “Accounting
for Investments in Associates in Consolidated Financial Statements” (AS 23) and Accounting Standard 27 on
“Financial reporting of interests in Joint Ventures” (AS 27) and are prepared on the following basis:
(a) The financial statements of the Company and its Subsidiaries are combined on a line-by-line basis by adding
together the book values of like items of assets, liabilities, income and expenses, after fully eliminating inter-
group balances and inter-group transactions including unrealized profits/ losses in period end inventories. The
difference between the Company’s cost of investments in the Subsidiaries, over its portion of equity at the time
of acquisition of shares is recognized in the consolidated financial statements as Goodwill or Capital Reserve,
as the case may be. Minority Interest’s share in net profit/ loss of consolidated subsidiaries for the year is
adjusted against the income of the Group in order to arrive at the net income attributable to equity shareholders
of the Company. Minority Interest’s share in net assets of consolidated subsidiaries is presented in the
Consolidated Balance Sheet separate from liabilities and the equity of the Company’s shareholders. Minority
Interest in the consolidated financial statements is identified and recognized after taking into consideration:
i. The amount of equity attributable to minorities at the date on which investments in a subsidiary is made.
ii. The minorities’ share of movement in equity since the date parent-subsidiary relationship came into
existence.
iii. The losses attributable to the minorities are adjusted against the minority interest in the equity of the
subsidiary.
iv. The excess of loss over the minority interest in the equity, is adjusted against General Reserve of the
Company.
(b) In case of foreign subsidiaries, being non-integral foreign operations, revenue items are translated at the average
rates prevailing during the period. Assets, liabilities and equity are translated at the closing rate. Any exchange
difference arising on translation is recognized in the “Foreign Currency Translation Reserve”.
(c) Investments in Associates are accounted for using equity method in accordance with AS 23. For this purpose
investments are initially recorded at cost. Any goodwill/capital reserves arising at the time of acquisition are
identified and carrying amount of investment are adjusted thereafter for the post acquisition share of profits or
losses. Adjustment for any change in equity that has not been included in the profit and loss account are
directly made in the carrying amount of investments without routing it through the consolidated profit and loss
account. The corresponding debit/credit are made in the relevant head of the equity interest in the consolidated
balance sheet.
(d) Interests in jointly controlled entities, where the Company is a direct venturer, are accounted for using
proportionate consolidation in accordance with AS 27. The difference between costs of the Company’s interests
in jointly controlled entities over its share of net assets in the jointly controlled entities, at the date on which
interest is acquired, is recognized in the CFS as Goodwill or Capital Reserve as the case may be.
(e) The CFS are prepared by using uniform accounting policies for like transactions and other events in similar
circumstances and necessary adjustments required for deviations, if any and to the extent possible, are made
in the CFS and are presented in the same manner as the Company’s separate financial statements except
otherwise stated elsewhere in this schedule.
B. SIGNIFICANT ACCOUNTING POLICIES
1. Accounting Convention
The financial statements are prepared under the historical cost convention, on an accrual basis and in
accordance with generally accepted accounting principles in India, applicable mandatory Accounting Standards
as notified by the Companies (Accounting Standard) Rules, 2006 and relevant provisions of the Companies
Act, 1956 of India.
2. Use of Estimates
The preparation of financial statements require estimates and assumptions to be made that affect the reported
amount of assets and liabilities on the date of the financial statements and the reported amount of revenues
and expenses during the reporting period. Difference between the actual results and estimates are recognized
in the period in which the results are known / materialized.
3. Fixed Assets
(a) Tangible Assets are stated at cost less accumulated depreciation and impairment loss, if any. Cost comprises
of purchase price and any directly attributable cost of bringing the assets to its working condition for its
intended use.

[129]
CO
NSO
LID
ATED
FIN
AN
CIA
L STATEM
EN
TS
Supe r Power i n Premium Me ta l s
S C H E D U L E S F O R M I N G PA R T O F T H E
CONSOLIDATED FINANCIAL STATEMENTS
(b) Intangible Assets are stated at cost less accumulated amortization. Cost includes any directly attributable
expenditure on making the asset ready for its intended use.
(c) Machinery spares which can be used only in connection with an item of Fixed Asset and whose use is
not of regular nature are written off over the estimated useful life of the relevant asset.
4. Depreciation and Amortization
(a) Depreciation on Fixed Assets are provided using straight line method based on estimated useful life or on the
basis of depreciation rates prescribed under respective local laws.
(b) Leasehold lands (including mining rights) are amortized over the period of lease on straight line basis.
(c) Intangible assets, other than Goodwill, are amortized over their estimated useful lives on straight line basis.
(d) Depreciation on assets acquired under finance lease is spread over the lease term.
5. Impairment
An asset is treated as impaired when the carrying cost of assets exceeds its recoverable value (being higher of
value-in-use and net selling price). Value-in-use is computed at net present value of cash flow expected over the
balance useful life of the assets. An impairment loss is recognized as an expense in the Profit and Loss Account in
the year in which an asset is identified as impaired. The impairment loss recognized in prior accounting period is
reversed if there has been an improvement in recoverable amount except in the case of goodwill for which specific
external event of an exceptional nature that caused impairment loss has actually reversed the effect of that event.
6. Leases
(a) Lease payments under an operating lease are recognized as expense in the profit and loss account as per
terms of lease agreement.
(b) Finance leases prior to 1st April, 2001: Lease rental recognized as expense in the profit and loss account as
per terms of lease agreement.
(c) Finance leases on or after 1st April, 2001: The lower of the fair value of the assets and the present value of
the minimum lease rental is recorded as fixed assets with corresponding amount shown as unsecured Loan.
The principal component in the lease rental is adjusted against the lease liability and the interest component
is charged to profit and loss account as interest cost.
7. Investments
(a) Long term investments are carried at cost after deducting provision, if any, for diminution in value considered
to be other than temporary in nature.
(b) Current investments are stated at lower of cost and fair value.
8. Inventories
(a) Inventories of stores and spare parts are valued at or below cost after providing for cost of obsolescence and
other anticipated losses, wherever considered necessary.
(b) Inventories of items other than those stated above are valued ‘At cost or Net Realizable Value, whichever is
lower’. Cost is generally determined on weighted average cost basis and wherever required, appropriate
overheads are taken into account. Net Realizable Value is the estimated selling price in the ordinary course of
business less the estimated cost of completion and the estimated costs necessary to make the sale.
(c) Materials and other supplies held for use in the production of inventories are not written down below cost if
the finished products in which they will be incorporated are expected to be sold at or above cost.
9. Foreign Currency Transactions
Transactions in foreign currency are recorded at the rate of exchange prevailing on the date of transaction. Year
end balance of foreign currency transactions is translated at the year end rates. Exchange differences arising on
settlement of monetary items or on reporting of monetary items at rates different from those at which they were
initially recorded during the period or reported in previous financial statements are recognized as income or expense
in the period in which they arise.
10. Employee benefits
Employee benefits of short term nature are recognized as expense as and when it accrues. Long term employee
benefits (e.g. long-service leave) and post employment benefits (e.g. gratuity), both funded and unfunded, are
recognized as expense based on actuarial valuation at year end using the Projected unit credit method. Actuarial
gain and losses are recognized immediately in the Profit & Loss Account.
SCHEDULE ‘20’ (Contd.)
[130]
CO
NSO
LID
ATED
FIN
AN
CIA
L STATEM
EN
TS
Supe r Power i n Premium Me ta l s
11. Employee Stock Option Scheme
In respect of stock option granted to employees pursuant to the Company’s stock option schemes, accounting is
done as per the intrinsic value method permitted by the SEBI guidelines, 1999 and the Guidance Note on Share
Based Payment issued by the ICAI. The excess of market price of share as on date of grant of option over the
exercise price is recognized as deferred employee compensation and is charged to Profit & Loss Account on straight
line basis over the vesting period.
12. Revenue Recognition
Sales revenue is recognized on transfer of significant risk and rewards of the ownership of the goods to the buyer
and stated at net of trade discount and rebates. Dividend income on investments is accounted for when the right
to receive the payment is established. Export incentive, certain insurance, railway and other claims where quantum
of accruals can not be ascertained with reasonable certainty, are accounted on acceptance basis.
13. Borrowing Costs
Borrowing costs directly attributable to the acquisition or construction of qualifying assets are capitalized. Other
borrowing costs are recognized as expenses in the period in which they are incurred. In determining the amount of
borrowing costs eligible for capitalization during a period, any income earned on the temporary investment of
those borrowings is deducted from the borrowing costs incurred.
14. Taxation
Provision for current income tax is made in accordance with local laws. Deferred tax liabilities and assets are
recognized at substantively enacted tax rates, subject to the consideration of prudence, on timing difference.
15. Derivative Financial Instruments
(a) The Company uses derivative financial instruments such as Forwards, Swaps, Options, etc. to hedge its risks
associated with foreign exchange fluctuations. Risks associated with fluctuations in the price of the Company’s
products are minimized by undertaking appropriate hedging transactions. The fair values of all such derivative
financial instruments are recognized as assets or liabilities at the balance sheet date.
(b) For derivative financial instruments designated as Cash Flow hedges, the effective portion of the fair value of
the derivative financial instruments are recognized in Hedging Reserve and reclassified to ‘Sales’, ‘Raw Materials
Consumed’, ‘Interest’ and ‘Other Expenses’ in the period in which the Profit and Loss is impacted by the hedged
items or in the period when the hedge relationship no longer qualifies as cash flow hedge. If the hedging
relationship ceases to be effective or it becomes probable that the expected transaction will no longer occur,
future gains or losses on the derivative financial instruments are recognized in ‘Other Expenses’ in the Profit
and Loss Account.
(c) For derivative financial instruments designated as Fair Value hedges, the fair value of both the derivative financial
instrument and the hedged item are recognized in ‘Sales’, ‘Raw Materials Consumed’, ’Interest’ or ‘Other
Expenses’ in the Profit and Loss Account till the period the relationship is found to be effective. If the hedging
relationship ceases to be effective or it becomes probable that the expected transaction will no longer occur,
future gains or losses on the derivative financial instruments are recognized in ‘Other Expenses’ in the Profit
and Loss Account.
(d) For derivative financial instruments designated as Net Investment Hedges in Foreign Operations gains and
losses on derivative instruments are included, net of taxes, to the extent the hedges are effective, in the Foreign
Currency Translation Reserve. The ineffective portions of net investments hedges in foreign operations, if any,
are recognized as gains or losses and included in ‘Other Expenses’.
(e) If no hedging relationship is designated, the fair value of the derivative financial instruments is marked to
market through Profit and Loss Account and included in ‘Other Expenses’.
16. Research and Development
Expenditure incurred during research phase is charged to revenue when no intangible asset arises from such research.
Assets procured for research and development activities are generally capitalized.
17. Government Grants
Government Grants are recognized when there is a reasonable assurance that the same will be received. Revenue
grants are recognized in the Profit & Loss Account. Capital grants relating to specific fixed assets are reduced from
the gross value of the respective fixed assets. Other capital grants are credited to Capital Reserve.
18. Provisions, Contingent Liabilities and Contingent Assets
Provision is recognized when there is a present obligation as a result of a past event that probably requires an
outflow of resources and a reliable estimate can be made of the amount of the obligation. Disclosure for contingent
liability is made when there is a possible obligation or a present obligation that may, but probably will not, require
an outflow of resources. No provision is recognized or disclosure for contingent liability is made when there is a
SCHEDULE ‘20’ (Contd.)
S C H E D U L E S F O R M I N G PA R T O F T H E
CONSOLIDATED FINANCIAL STATEMENTS
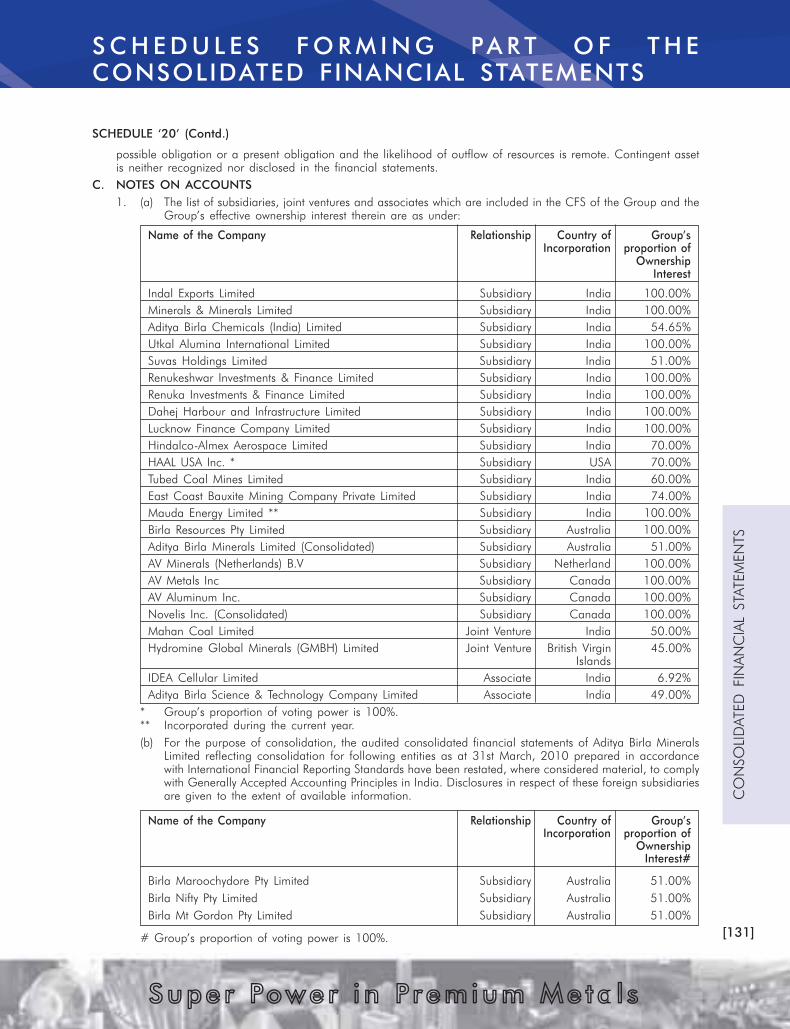
[131]
CO
NSO
LID
ATED
FIN
AN
CIA
L STATEM
EN
TS
Supe r Power i n Premium Me ta l s
SCHEDULE ‘20’ (Contd.)
possible obligation or a present obligation and the likelihood of outflow of resources is remote. Contingent asset
is neither recognized nor disclosed in the financial statements.
C. NOTES ON ACCOUNTS
1. (a) The list of subsidiaries, joint ventures and associates which are included in the CFS of the Group and the
Group’s effective ownership interest therein are as under:
Name of the Company Relationship Country of Group’s
Incorporation proportion of
Ownership
Interest
Indal Exports Limited Subsidiary India 100.00%
Minerals & Minerals Limited Subsidiary India 100.00%
Aditya Birla Chemicals (India) Limited Subsidiary India 54.65%
Utkal Alumina International Limited Subsidiary India 100.00%
Suvas Holdings Limited Subsidiary India 51.00%
Renukeshwar Investments & Finance Limited Subsidiary India 100.00%
Renuka Investments & Finance Limited Subsidiary India 100.00%
Dahej Harbour and Infrastructure Limited Subsidiary India 100.00%
Lucknow Finance Company Limited Subsidiary India 100.00%
Hindalco-Almex Aerospace Limited Subsidiary India 70.00%
HAAL USA Inc. * Subsidiary USA 70.00%
Tubed Coal Mines Limited Subsidiary India 60.00%
East Coast Bauxite Mining Company Private Limited Subsidiary India 74.00%
Mauda Energy Limited ** Subsidiary India 100.00%
Birla Resources Pty Limited Subsidiary Australia 100.00%
Aditya Birla Minerals Limited (Consolidated) Subsidiary Australia 51.00%
AV Minerals (Netherlands) B.V Subsidiary Netherland 100.00%
AV Metals Inc Subsidiary Canada 100.00%
AV Aluminum Inc. Subsidiary Canada 100.00%
Novelis Inc. (Consolidated) Subsidiary Canada 100.00%
Mahan Coal Limited Joint Venture India 50.00%
Hydromine Global Minerals (GMBH) Limited Joint Venture British Virgin 45.00%
Islands
IDEA Cellular Limited Associate India 6.92%
Aditya Birla Science & Technology Company Limited Associate India 49.00%
* Group’s proportion of voting power is 100%.
** Incorporated during the current year.
(b) For the purpose of consolidation, the audited consolidated financial statements of Aditya Birla Minerals
Limited reflecting consolidation for following entities as at 31st March, 2010 prepared in accordance
with International Financial Reporting Standards have been restated, where considered material, to comply
with Generally Accepted Accounting Principles in India. Disclosures in respect of these foreign subsidiaries
are given to the extent of available information.
Name of the Company Relationship Country of Group’s
Incorporation proportion of
Ownership
Interest#
Birla Maroochydore Pty Limited Subsidiary Australia 51.00%
Birla Nifty Pty Limited Subsidiary Australia 51.00%
Birla Mt Gordon Pty Limited Subsidiary Australia 51.00%
# Group’s proportion of voting power is 100%.
S C H E D U L E S F O R M I N G PA R T O F T H E
CONSOLIDATED FINANCIAL STATEMENTS
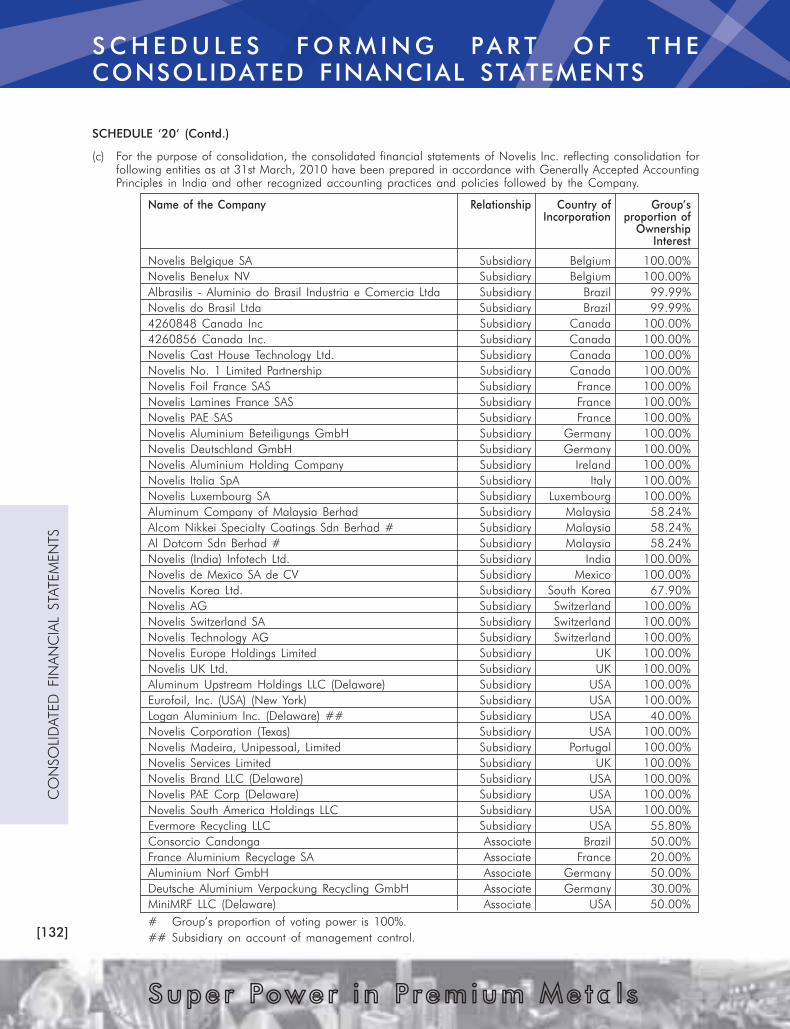
[132]
CO
NSO
LID
ATED
FIN
AN
CIA
L STATEM
EN
TS
Supe r Power i n Premium Me ta l s
(c) For the purpose of consolidation, the consolidated financial statements of Novelis Inc. reflecting consolidation for
following entities as at 31st March, 2010 have been prepared in accordance with Generally Accepted Accounting
Principles in India and other recognized accounting practices and policies followed by the Company.
Name of the Company Relationship Country of Group’s
Incorporation proportion of
Ownership
Interest
Novelis Belgique SA Subsidiary Belgium 100.00%
Novelis Benelux NV Subsidiary Belgium 100.00%
Albrasilis - Aluminio do Brasil Industria e Comercia Ltda Subsidiary Brazil 99.99%
Novelis do Brasil Ltda Subsidiary Brazil 99.99%
4260848 Canada Inc Subsidiary Canada 100.00%
4260856 Canada Inc. Subsidiary Canada 100.00%
Novelis Cast House Technology Ltd. Subsidiary Canada 100.00%
Novelis No. 1 Limited Partnership Subsidiary Canada 100.00%
Novelis Foil France SAS Subsidiary France 100.00%
Novelis Lamines France SAS Subsidiary France 100.00%
Novelis PAE SAS Subsidiary France 100.00%
Novelis Aluminium Beteiligungs GmbH Subsidiary Germany 100.00%
Novelis Deutschland GmbH Subsidiary Germany 100.00%
Novelis Aluminium Holding Company Subsidiary Ireland 100.00%
Novelis Italia SpA Subsidiary Italy 100.00%
Novelis Luxembourg SA Subsidiary Luxembourg 100.00%
Aluminum Company of Malaysia Berhad Subsidiary Malaysia 58.24%
Alcom Nikkei Specialty Coatings Sdn Berhad # Subsidiary Malaysia 58.24%
Al Dotcom Sdn Berhad # Subsidiary Malaysia 58.24%
Novelis (India) Infotech Ltd. Subsidiary India 100.00%
Novelis de Mexico SA de CV Subsidiary Mexico 100.00%
Novelis Korea Ltd. Subsidiary South Korea 67.90%
Novelis AG Subsidiary Switzerland 100.00%
Novelis Switzerland SA Subsidiary Switzerland 100.00%
Novelis Technology AG Subsidiary Switzerland 100.00%
Novelis Europe Holdings Limited Subsidiary UK 100.00%
Novelis UK Ltd. Subsidiary UK 100.00%
Aluminum Upstream Holdings LLC (Delaware) Subsidiary USA 100.00%
Eurofoil, Inc. (USA) (New York) Subsidiary USA 100.00%
Logan Aluminium Inc. (Delaware) ## Subsidiary USA 40.00%
Novelis Corporation (Texas) Subsidiary USA 100.00%
Novelis Madeira, Unipessoal, Limited Subsidiary Portugal 100.00%
Novelis Services Limited Subsidiary UK 100.00%
Novelis Brand LLC (Delaware) Subsidiary USA 100.00%
Novelis PAE Corp (Delaware) Subsidiary USA 100.00%
Novelis South America Holdings LLC Subsidiary USA 100.00%
Evermore Recycling LLC Subsidiary USA 55.80%
Consorcio Candonga Associate Brazil 50.00%
France Aluminium Recyclage SA Associate France 20.00%
Aluminium Norf GmbH Associate Germany 50.00%
Deutsche Aluminium Verpackung Recycling GmbH Associate Germany 30.00%
MiniMRF LLC (Delaware) Associate USA 50.00%
# Group’s proportion of voting power is 100%.
## Subsidiary on account of management control.
SCHEDULE ‘20’ (Contd.)
S C H E D U L E S F O R M I N G PA R T O F T H E
CONSOLIDATED FINANCIAL STATEMENTS
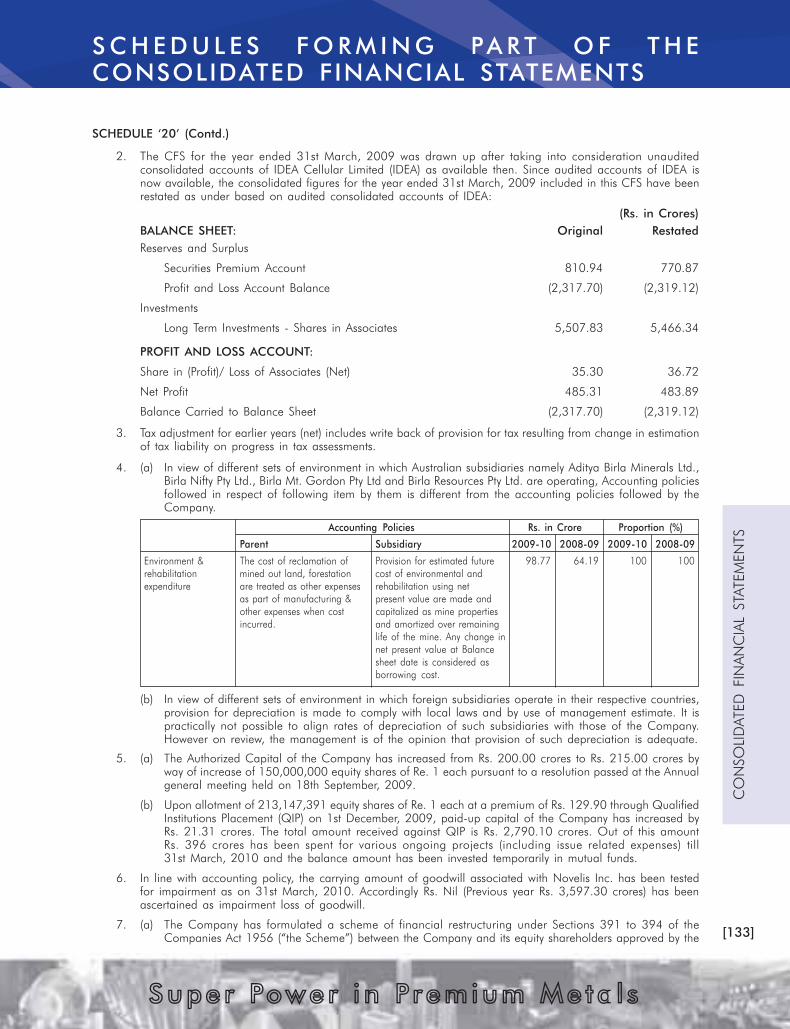
[133]
CO
NSO
LID
ATED
FIN
AN
CIA
L STATEM
EN
TS
Supe r Power i n Premium Me ta l s
2. The CFS for the year ended 31st March, 2009 was drawn up after taking into consideration unaudited
consolidated accounts of IDEA Cellular Limited (IDEA) as available then. Since audited accounts of IDEA is
now available, the consolidated figures for the year ended 31st March, 2009 included in this CFS have been
restated as under based on audited consolidated accounts of IDEA:
(Rs. in Crores)
BALANCE SHEET: Original Restated
Reserves and Surplus
Securities Premium Account 810.94 770.87
Profit and Loss Account Balance (2,317.70) (2,319.12)
Investments
Long Term Investments - Shares in Associates 5,507.83 5,466.34
PROFIT AND LOSS ACCOUNT:
Share in (Profit)/ Loss of Associates (Net) 35.30 36.72
Net Profit 485.31 483.89
Balance Carried to Balance Sheet (2,317.70) (2,319.12)
3. Tax adjustment for earlier years (net) includes write back of provision for tax resulting from change in estimation
of tax liability on progress in tax assessments.
4. (a) In view of different sets of environment in which Australian subsidiaries namely Aditya Birla Minerals Ltd.,
Birla Nifty Pty Ltd., Birla Mt. Gordon Pty Ltd and Birla Resources Pty Ltd. are operating, Accounting policies
followed in respect of following item by them is different from the accounting policies followed by the
Company.
Accounting Policies Rs. in Crore Proportion (%)
Parent Subsidiary 2009-10 2008-09 2009-10 2008-09
Environment & The cost of reclamation of Provision for estimated future 98.77 64.19 100 100
rehabilitation mined out land, forestation cost of environmental and
expenditure are treated as other expenses rehabilitation using net
as part of manufacturing & present value are made and
other expenses when cost capitalized as mine properties
incurred. and amortized over remaining
life of the mine. Any change in
net present value at Balance
sheet date is considered as
borrowing cost.
(b) In view of different sets of environment in which foreign subsidiaries operate in their respective countries,
provision for depreciation is made to comply with local laws and by use of management estimate. It is
practically not possible to align rates of depreciation of such subsidiaries with those of the Company.
However on review, the management is of the opinion that provision of such depreciation is adequate.
5. (a) The Authorized Capital of the Company has increased from Rs. 200.00 crores to Rs. 215.00 crores by
way of increase of 150,000,000 equity shares of Re. 1 each pursuant to a resolution passed at the Annual
general meeting held on 18th September, 2009.
(b) Upon allotment of 213,147,391 equity shares of Re. 1 each at a premium of Rs. 129.90 through Qualified
Institutions Placement (QIP) on 1st December, 2009, paid-up capital of the Company has increased by
Rs. 21.31 crores. The total amount received against QIP is Rs. 2,790.10 crores. Out of this amount
Rs. 396 crores has been spent for various ongoing projects (including issue related expenses) till
31st March, 2010 and the balance amount has been invested temporarily in mutual funds.
6. In line with accounting policy, the carrying amount of goodwill associated with Novelis Inc. has been tested
for impairment as on 31st March, 2010. Accordingly Rs. Nil (Previous year Rs. 3,597.30 crores) has been
ascertained as impairment loss of goodwill.
7. (a) The Company has formulated a scheme of financial restructuring under Sections 391 to 394 of the
Companies Act 1956 (“the Scheme”) between the Company and its equity shareholders approved by the
SCHEDULE ‘20’ (Contd.)
S C H E D U L E S F O R M I N G PA R T O F T H E
CONSOLIDATED FINANCIAL STATEMENTS

[134]
CO
NSO
LID
ATED
FIN
AN
CIA
L STATEM
EN
TS
Supe r Power i n Premium Me ta l s
SCHEDULE ‘20’ (Contd.)
High Court of judicature of Bombay to deal with various costs associated with its organic and inorganic
growth plan. Pursuant to this, a separate reserve account titled as Business Reconstruction Reserve (“BRR”)
has been created during the previous year by transferring balance standing to the credit of Securities
Premium Account of the Company for adjustment of certain expenses as prescribed in the Scheme.
Accordingly, Rs. 8,647.37 crores has been transferred to BRR during the previous year and the following
expenses have been adjusted against the same as per the Scheme.
(Rs. in Crores)
2009-10 2008-09
Opening Balance 4,030.50 -
Add: Transfer from Securities Premium Account as per Scheme - 8,647.37
Less: Adjustments made:
i. Impairment of goodwill arising on consolidation of Novelis Inc.
while preparing consolidated accounts of the Group. - 3,597.30
ii. Impairment of fixed assets - 111.30
iii. Interest and Finance Charges on loan taken by A V Minerals
(Netherlands) B.V., subsidiary of the Company, for acquisition of
Novelis Inc. by the Company. 304.39 544.47
iv. Costs in connection with exiting business. - 363.62
v. Certain costs in connection with the Scheme. - 0.18
Closing balance 3,726.11 4,030.50
(b) Had the Scheme not prescribed aforesaid treatment, the impact would have been as under:
i) Profit and Loss Account line items higher/(lower) by:
(Rs. in Crores)
For the year ended
31.03.2010 31.03.2009
Impairment - 3,743.00
Manufacturing and Other Expenses - 363.80
Interest and Finance Charges 304.39 544.47
Profit before Tax (304.39) (4,651.27)
Provision for Deferred Tax - (34.40)
Net Profit (304.39) (4,616.87)
ii) Balance Sheet line items higher/(lower) by:
(Rs. in Crores)
For the year ended
31.03.2010 31.03.2009
Reserves and Surplus:
Securities Premium Account 8,647.37 8,647.37
Business Reconstruction Reserve (3,726.11) (4,030.50)
Profit & Loss Account Balance (4,921.26) (4,616.87)
iii) Earning per Share (EPS) would have been as under:
For the year ended
31.03.2010 31.03.2009
Basic EPS (in Rs.) 20.45 (27.45)
Diluted EPS (in Rs.) 20.44 (27.45)
Basic EPS before Tax adjustment for earlier years (in Rs.) 19.87 (28.44)
Diluted EPS before Tax adjustment for earlier years (in Rs.) 19.86 (28.44)
S C H E D U L E S F O R M I N G PA R T O F T H E
CONSOLIDATED FINANCIAL STATEMENTS

[135]
CO
NSO
LID
ATED
FIN
AN
CIA
L STATEM
EN
TS
Supe r Power i n Premium Me ta l s
SCHEDULE ‘20’ (Contd.)
8. The carrying amount of investment in the Associates includes Rs. 3,476.71 crores (Previous year Rs. 3,951.13
crores) towards goodwill.
9. During the year, a scheme of amalgamation (the Scheme) of Spice Communications Limited with the IDEA
Cellular Limited (IDEA), an associate of the Company, was approved by the Hon’ble High Court of Gujarat
and Hon’ble High Court of Delhi and became effective on 1st March, 2010. Accordingly, IDEA has made
certain accounting adjustment as prescribed in the Scheme. Had the Scheme not mandated the specific
accounting treatment done by IDEA, our share in profit of the IDEA and the carrying amount of investment in
IDEA would have been lower by Rs. 30.57 crores.
10. The Company has not chosen the option of adjusting exchange difference on long term foreign currency loan
to the cost of the assets acquired out of these foreign currency loans issued by the Ministry of Corporate Affairs
vide Notification (F.No. 17/33/2008/CL-V) dated 31st March, 2009. However one of the entities, included in
consolidated accounts, has opted for the said option and consequently during the year Rs. 6.21 crores (Previous
year Rs. 9.97 crores) of exchange differences on restatement of long term loans used for acquiring assets has
been capitalized. Due to this profit of the Group for the year is lower by Rs. 6.78 crores (Previous year higher
by Rs. 9.70 crores).
11. The Company has received a notice dated 24th March, 2007 from Collector (Stamp) Kanpur, Uttar Pradesh
alleging that stamp duty of Rs. 252.96 crores is payable in view of order dated 18th November, 2002 of
Hon’ble High Court of Allahabad approving scheme of arrangement for merger of Copper business of Indo
Gulf Corporation Limited with the Company. The Company is of the opinion that it has a very strong case as
there is no substantive/computation provision for levy/calculation of stamp duty on court order approving scheme
of arrangement under Companies Act, 1956 within the provisions of Uttar Pradesh Stamp Act, moreover the
properties in question are located in the State of Gujarat and thus the Collector (stamp) Kanpur has no territorial
jurisdiction to make such a demand. It is pertinent to note that the Company in 2003-04 has already paid
stamp duty which has been accepted as per the provisions of the Bombay Stamp Act 1958 with regard to
transfer of shareholding of Indo Gulf Corporation Limited as per the Scheme of Arrangement. Furthermore,
the demand made is on an incorrect assumption. The Company’s contention amongst the various other grounds
made is that the demand is illegal, against the principles of natural justice, incorrect, bad in law and malafide.
The Company has filed a writ petition before the Hon’able High Court of Allahabad, inter alia, on the above
said grounds, which is pending determination.
12. Following Sponsors Undertakings have been given by the Company, along with Aditya Birla Nuvo Ltd, Grasim
Industries Ltd. and Birla TMT Holdings Pvt. Ltd (the Sponsors), being promoters of IDEA Cellular Ltd.( IDEA).:-
(a) The Sponsors shall collectively continue to hold at least 33% of the equity capital of IDEA till the end of
FY 2015-16 and shall not without prior written approval of the Facility Agent, divest, transfer, assign,
dispose of, pledge, charge, create any lien or in any way encumber 33% of shareholdings in IDEA.
Consequent upon the infusion of fresh equity capital of IDEA, if the Sponsors’ stake gets diluted from
40% to 33% in the equity capital of IDEA, the Sponsors agree and undertake to obtain the prior consent
of the Rupee Facility Agent and in other circumstances, the Sponsors agree and undertake to obtain the
prior consent of the secured lenders representing 51% of the aggregate outstanding secured loans.
(b) The Sponsors shall collectively continue to hold 26% of the equity capital of IDEA after FY 2015-16 and
shall not without the prior written approval of the Rupee Facility Agent, divest, transfer, assign, dispose of,
pledge, charge, create any lien or in any way encumber 26% shareholdings in the capital of IDEA.
(c) Not without prior approval of the Facility Agent in writing divest shareholdings in the equity capital of
IDEA that may result in a single investor along with its affiliates holding more than 25% of the equity
capital of IDEA.
13. Arising from the announcement of the Institute of Chartered Accountants of India dated 29th March, 2008 on
Accounting for Derivatives, the Company has decided for early adoption of Accounting Standard (AS) 30 on
Financial Instruments : Recognition and Measurement, in so far as it relates to derivative accounting, from
1st April, 2009. Accordingly, net loss arising on fair valuation of outstanding derivatives as on 1st April, 2009
amounting to Rs. 230.58 crores (net of deferred tax of Rs. 118.73 crores) has been adjusted against General
Reserve following transitional provisions. Accounting for all derivatives from 1st April, 2009 have been done
as prescribed under the AS. As a result, net gain / (loss) of Rs. (236.12) crores and Rs. 167.75 crores and
Rs. 246.09 crores for the year ended 31st March, 2010 have been included under Sales and Raw Materials
Consumed & Other Expenses (in Manufacturing and Other Expenses), respectively, with consequential impact
on profit for the year ended 31st March, 2010. The figures of the current year in respect of above items are,
therefore, not comparable with those of the previous year.
S C H E D U L E S F O R M I N G PA R T O F T H E
CONSOLIDATED FINANCIAL STATEMENTS

[136]
CO
NSO
LID
ATED
FIN
AN
CIA
L STATEM
EN
TS
Supe r Power i n Premium Me ta l s
14. Derivative Financials Instruments and Risk Management
In the ordinary course of business, the Company is exposed to risks resulting from changes in prices of
commodity, exchange rate fluctuation and interest rate movements. It manages its exposure to these risks through
derivative financial instruments. It uses derivative instruments such as forwards, futures, swaps and options to
manage these risks. Such derivative financial instruments are used as risk management tools only and not for
speculative purposes. These derivative financial instruments reduce the impact of both favourable and
unfavourable fluctuations. Except where noted, the derivative contracts are marked-to-market (MTM) and the
related gains and losses are included in Profit and Loss Account in the current accounting period.
The Company’s risk management activities are subject to the management, direction and control of Risk
Management Board (RMB). The RMB is composed of two directors including Managing Director, Chief Financial
Officer and other officers and employees selected by the Managing Director. The RMB reports to the Board of
Directors on the scope of its activities.
The decision of whether and when to execute derivative financial instruments along with its tenure can vary
from period to period depending on market conditions and the relative costs of the instruments. The tenure is
always linked to the timing of the underlying exposure, with the connection between the two being regularly
monitored.
The Company is exposed to losses in the event of non-performance by the counterparties to the derivative
contracts. All derivative contracts are executed with counterparties that, in our judgment, are creditworthy. The
credit levels are reviewed to ensure that there is not an inappropriate concentration of outstanding to any
particular counterparty.
Commodity Price Risk
Copper and Precious Metals: This business is conducted under a conversion model. The prices of input
and output are derived from the same benchmark and/or are linked to each other through a defined
formula. The objective of risk management is to attempt to use hedging to balance out the price fluctuations
on the input and output side so as to ‘pass through’ the change in input cost to customers to make the
margins immune to the fluctuations in prices of the input and output.
Aluminium: This business is vertically integrated. The main raw material viz. bauxite (mostly mined from
own mines) and other purchased raw materials do not have any linkage with the output price which is
Aluminium LME prices. When the prices of input(s) and output(s) do not follow the above condition, then
risk management attempts to use hedging so as to protect the margins from adverse movements in prices
on either side, i.e. from a rise in input cost or from a fall in output price.
As a condition of sale, customers often require the Company to enter into fixed price commitments. These
commitments expose the Company to the risk of fluctuating aluminum prices between the time the order
is committed and the time that the material is shipped. The Company may enter into derivative financial
instruments to mitigate the risk arising out of the fixed price commitments. Consequently, the gain or loss
resulting from movements in the price of aluminium on these contracts would generally be offset by an
equal and opposite impact on the net sales and purchases being hedged.
Natural Gas: The Company purchases natural gas on the open market in Europe, Asia and South America
which exposes the Company to market pricing fluctuations. The Company mitigates the future exposure
to natural gas prices through the use of forward purchase contracts.
Electricity: The Company has entered into an electricity swap in North America to fix a portion of the
cost of electricity requirement in North America.
Foreign Currency Exchange Risk
Exchange rate movements, particularly the United States Dollar (USD) and Euro (EUR) against Indian Rupee
(INR), have an impact on our operating results. In addition to the foreign exchange flow from exports, the
commodity prices in the domestic market are derived based on the landed cost of imports in India where LME
prices and USD/INR exchange rate are the main factors. In case of conversion business, the objective is to
match the exchange rate of outflows and related inflows through derivative financial instruments. With respect
to Aluminium business where costs are predominantly in INR, the strengthening of INR against USD adversely
affects the profitability of the business and benefits when INR depreciates against USD. The company enters
into various foreign exchange contracts to protect profitability.
The Company enters into various cross currency swaps to manage the exposure to fluctuating exchange rate
arising from loans given to and net investments made in various European subsidiaries.
SCHEDULE ‘20’ (Contd.)
S C H E D U L E S F O R M I N G PA R T O F T H E
CONSOLIDATED FINANCIAL STATEMENTS
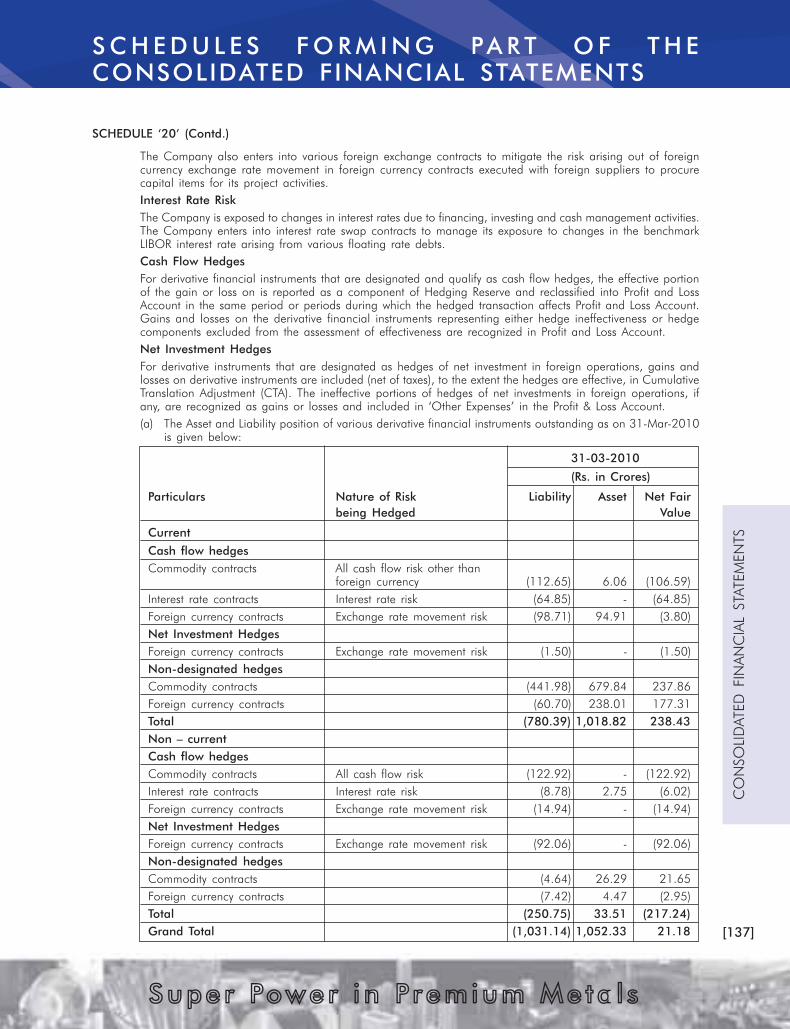
[137]
CO
NSO
LID
ATED
FIN
AN
CIA
L STATEM
EN
TS
Supe r Power i n Premium Me ta l s
The Company also enters into various foreign exchange contracts to mitigate the risk arising out of foreign
currency exchange rate movement in foreign currency contracts executed with foreign suppliers to procure
capital items for its project activities.
Interest Rate Risk
The Company is exposed to changes in interest rates due to financing, investing and cash management activities.
The Company enters into interest rate swap contracts to manage its exposure to changes in the benchmark
LIBOR interest rate arising from various floating rate debts.
Cash Flow Hedges
For derivative financial instruments that are designated and qualify as cash flow hedges, the effective portion
of the gain or loss on is reported as a component of Hedging Reserve and reclassified into Profit and Loss
Account in the same period or periods during which the hedged transaction affects Profit and Loss Account.
Gains and losses on the derivative financial instruments representing either hedge ineffectiveness or hedge
components excluded from the assessment of effectiveness are recognized in Profit and Loss Account.
Net Investment Hedges
For derivative instruments that are designated as hedges of net investment in foreign operations, gains and
losses on derivative instruments are included (net of taxes), to the extent the hedges are effective, in Cumulative
Translation Adjustment (CTA). The ineffective portions of hedges of net investments in foreign operations, if
any, are recognized as gains or losses and included in ‘Other Expenses’ in the Profit & Loss Account.
(a) The Asset and Liability position of various derivative financial instruments outstanding as on 31-Mar-2010
is given below:
31-03-2010
(Rs. in Crores)
Particulars Nature of Risk Liability Asset Net Fair
being Hedged Value
Current
Cash flow hedges
Commodity contracts All cash flow risk other than
foreign currency (112.65) 6.06 (106.59)
Interest rate contracts Interest rate risk (64.85) - (64.85)
Foreign currency contracts Exchange rate movement risk (98.71) 94.91 (3.80)
Net Investment Hedges
Foreign currency contracts Exchange rate movement risk (1.50) - (1.50)
Non-designated hedges
Commodity contracts (441.98) 679.84 237.86
Foreign currency contracts (60.70) 238.01 177.31
Total (780.39) 1,018.82 238.43
Non – current
Cash flow hedges
Commodity contracts All cash flow risk (122.92) - (122.92)
Interest rate contracts Interest rate risk (8.78) 2.75 (6.02)
Foreign currency contracts Exchange rate movement risk (14.94) - (14.94)
Net Investment Hedges
Foreign currency contracts Exchange rate movement risk (92.06) - (92.06)
Non-designated hedges
Commodity contracts (4.64) 26.29 21.65
Foreign currency contracts (7.42) 4.47 (2.95)
Total (250.75) 33.51 (217.24)
Grand Total (1,031.14) 1,052.33 21.18
SCHEDULE ‘20’ (Contd.)
S C H E D U L E S F O R M I N G PA R T O F T H E
CONSOLIDATED FINANCIAL STATEMENTS

[138]
CO
NSO
LID
ATED
FIN
AN
CIA
L STATEM
EN
TS
Supe r Power i n Premium Me ta l s
The Asset and Liability position of various derivative financial instruments outstanding as on 31-Mar-2009
is given below:
31-03-2009
(Rs. in Crores)
Particulars Nature of Risk Liability Asset Net Fair
being Hedged Value
Current
Cash flow hedges
Commodity contracts All cash flow risk (30.56) - (30.56)
Interest rate contracts Interest rate risk (71.35) - (71.35)
Non-designated hedges
Commodity contracts (2,782.07) 561.27 (2,220.80)
Foreign currency contracts (405.17) 123.86 (281.30)
Total (3,289.14) 685.14 (2,604.01)
Non – current
Cash flow hedges
Commodity contracts All cash flow risk (61.05) - (61.05)
Interest rate contracts Interest rate risk (19.87) - (19.87)
Net Investment Hedges
Foreign currency contracts Exchange rate movement risk (53.80) - (53.80)
Non-designated hedges
Commodity contracts (62.30) 188.01 125.71
Foreign currency contracts (63.79) 153.75 89.97
Total (260.82) 341.76 80.95
Grand Total (3,549.96) 1,026.90 (2,523.06)
(b) The following table presents the outstanding position and fair value of various foreign exchange derivative
financial instruments as of 31-Mar-2010:
As on 31-3-2010
Average Notional Fair Value
Foreign currency forwards Currency exchange value Gain/(Loss)
Pair rate (in Million) (Rs. In Crores)
Cash flow hedges
Sell USD / INR 49.55 219.63 94.47
Sell USD/AUD 1.11 12.30 0.44
Buy USD / INR 47.03 5.57 (0.85)
Buy CHF / INR 48.64 3.17 (1.44)
Buy EUR / INR 68.26 173.66 (107.69)
Buy GBP / INR 74.91 2.93 (1.62)
Buy NOK / INR 8.14 40.58 (2.05)
Total (18.74)
Net investment hedges
Sell EUR / USD 1.21 162.48 (93.56)
Total (93.56)
Non-Designated
Sell USD / INR 49.46 67.85 23.63
Sell AUD / GBP 0.55 0.70 (0.88)
Sell BRL / USD 0.56 16.50 (0.13)
Sell CAD / USD 0.98 49.85 (0.29)
Sell CHF / EUR 0.68 9.77 (10.69)
Sell CHF / USD 0.96 22.67 (0.69)
Sell DKK / EUR 0.13 0.30 -
Sell EUR / USD 1.40 192.91 32.94
Sell GBP / EUR 1.15 32.84 3.90
Sell GBP / USD 1.57 27.59 4.10
Sell KRW / EUR 0.00 0.34 (0.03)
Sell KRW / USD 0.00 209.85 67.69
SCHEDULE ‘20’ (Contd.)
S C H E D U L E S F O R M I N G PA R T O F T H E
CONSOLIDATED FINANCIAL STATEMENTS
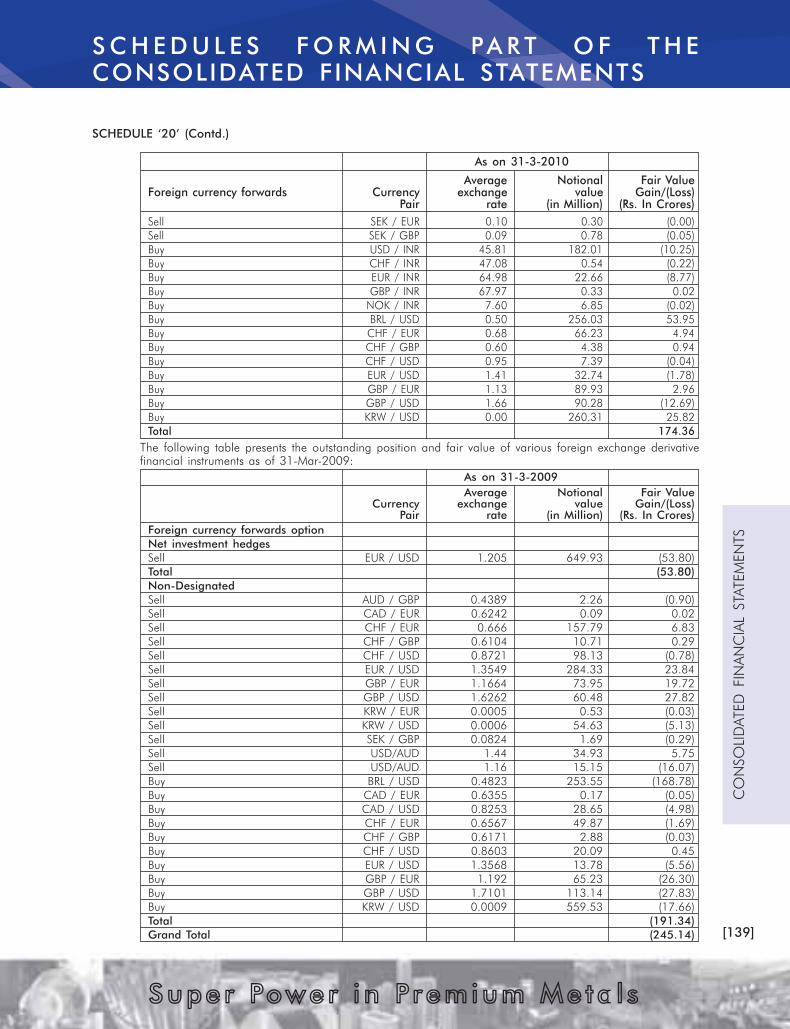
[139]
CO
NSO
LID
ATED
FIN
AN
CIA
L STATEM
EN
TS
Supe r Power i n Premium Me ta l s
Sell SEK / EUR 0.10 0.30 (0.00)
Sell SEK / GBP 0.09 0.78 (0.05)
Buy USD / INR 45.81 182.01 (10.25)
Buy CHF / INR 47.08 0.54 (0.22)
Buy EUR / INR 64.98 22.66 (8.77)
Buy GBP / INR 67.97 0.33 0.02
Buy NOK / INR 7.60 6.85 (0.02)
Buy BRL / USD 0.50 256.03 53.95
Buy CHF / EUR 0.68 66.23 4.94
Buy CHF / GBP 0.60 4.38 0.94
Buy CHF / USD 0.95 7.39 (0.04)
Buy EUR / USD 1.41 32.74 (1.78)
Buy GBP / EUR 1.13 89.93 2.96
Buy GBP / USD 1.66 90.28 (12.69)
Buy KRW / USD 0.00 260.31 25.82
Total 174.36
The following table presents the outstanding position and fair value of various foreign exchange derivative
financial instruments as of 31-Mar-2009:
As on 31-3-2009
Average Notional Fair Value
Currency exchange value Gain/(Loss)
Pair rate (in Million) (Rs. In Crores)
Foreign currency forwards option
Net investment hedges
Sell EUR / USD 1.205 649.93 (53.80)
Total (53.80)
Non-Designated
Sell AUD / GBP 0.4389 2.26 (0.90)
Sell CAD / EUR 0.6242 0.09 0.02
Sell CHF / EUR 0.666 157.79 6.83
Sell CHF / GBP 0.6104 10.71 0.29
Sell CHF / USD 0.8721 98.13 (0.78)
Sell EUR / USD 1.3549 284.33 23.84
Sell GBP / EUR 1.1664 73.95 19.72
Sell GBP / USD 1.6262 60.48 27.82
Sell KRW / EUR 0.0005 0.53 (0.03)
Sell KRW / USD 0.0006 54.63 (5.13)
Sell SEK / GBP 0.0824 1.69 (0.29)
Sell USD/AUD 1.44 34.93 5.75
Sell USD/AUD 1.16 15.15 (16.07)
Buy BRL / USD 0.4823 253.55 (168.78)
Buy CAD / EUR 0.6355 0.17 (0.05)
Buy CAD / USD 0.8253 28.65 (4.98)
Buy CHF / EUR 0.6567 49.87 (1.69)
Buy CHF / GBP 0.6171 2.88 (0.03)
Buy CHF / USD 0.8603 20.09 0.45
Buy EUR / USD 1.3568 13.78 (5.56)
Buy GBP / EUR 1.192 65.23 (26.30)
Buy GBP / USD 1.7101 113.14 (27.83)
Buy KRW / USD 0.0009 559.53 (17.66)
Total (191.34)
Grand Total (245.14)
SCHEDULE ‘20’ (Contd.)
As on 31-3-2010
Average Notional Fair Value
Foreign currency forwards Currency exchange value Gain/(Loss)
Pair rate (in Million) (Rs. In Crores)
S C H E D U L E S F O R M I N G PA R T O F T H E
CONSOLIDATED FINANCIAL STATEMENTS

[140]
CO
NSO
LID
ATED
FIN
AN
CIA
L STATEM
EN
TS
Supe r Power i n Premium Me ta l s
(c) The following table presents the outstanding position and fair value of various commodity derivative financial
instruments as of 31-Mar-2010:
As on 31-3-2010
Average Price Qty Unit Notional Fair Value
(USD / Unit) value (USD Gain/(Loss)
in Millions) (Rs. in Crores)
Commodity futures / forwards
Cash flow hedges
Aluminium Sell 2,320.91 11,000 MT 25.53 (0.15)
Gold Sell 1,032.61 207,144 TOZ 213.90 (67.11)
Silver Sell 16.58 1,123,556 TOZ 18.63 (3.78)
Electricity Buy 32.33 1,671,040 MWh 54.02 (157.10)
Total 312.08 (228.14)
Non-Designated Hedges
Copper Buy 7,508.11 3,700 MT 27.78 10.43
Copper Sell 7,589.29 2,800 MT 21.25 (11.47)
Aluminium Buy 2,036.47 541,860 MT 1,103.48 589.53
Aluminium Sell 2,266.85 -482,406 MT (1,093.54) (253.74)
Gold Buy 1,107.08 551 TOZ 0.61 (0.65)
Gold Sell 1,109.66 6,137 TOZ 6.81 (22.00)
Silver Buy * 0 - 0.01
Silver Sell 17.00 242,356 TOZ 4.12 (2.63)
Mid-West Premium Buy 0.06 0 Lbs - (0.06)
Natural Gas Buy 5.91 4,200,000 MMBtu 24.84 (25.79)
Total 95.35 283.63
Commodity options
Cash flow hedges
Copper Sell 1375 MT 10.71 (0.80)
Total 10.71 (0.80)
Non-Designated Hedges
Copper Sell * 5300 MT 40.03 (9.84)
Aluminium Sell 3,660.00* -2,250 MT (14.49) (0.26)
Aluminium Buy 2803.03 1,188 MT 3.33 2.79
Total 28.87 (7.31)
Commodity Swaps
Cash flow hedges
Copper Sell 7664 1375 MT 10.54 (0.57)
Total 10.54 (0.57)
Non-Designated Hedges
Copper Sell 7271* 6050 MT 43.99 (15.07)
Aluminium Sell * 0 MT - (1.73)
Total 43.99 (16.80)
* Includes derivatives matured within 31-Mar-10 for which cash flow to happen on settlement date
during April, 2010, fair value of the same is Rs. 3.61 crores.
SCHEDULE ‘20’ (Contd.)
S C H E D U L E S F O R M I N G PA R T O F T H E
CONSOLIDATED FINANCIAL STATEMENTS

[141]
CO
NSO
LID
ATED
FIN
AN
CIA
L STATEM
EN
TS
Supe r Power i n Premium Me ta l s
The following table presents the outstanding position and fair value of various commodity derivative
financial instruments as of 31-Mar-2009:
As on 31-3-2009
Average Price Qty Unit Notional Fair Value
(USD / Unit) value (USD Gain/(Loss)
in Millions) (Rs. in Crores)
Commodity futures / forwards
Cash flow hedges
Electricity Buy 90.15 1,919,296 MWh 64.52 (91.61)
Total 64.52 (91.61)
Non-Designated Hedges
Mid-West Premium Buy 0.06 9,920 Lbs 0 10.67
Heating Oil Buy 2.35 3,402,000 Gal 7.99 (13.97)
Natural Gas Buy 7 3,860,000 MMBtu 25.42 (46.22)
Aluminium Buy 2397.95 653,080 MT 1,566.06 (2,393.61)
Aluminium Sell 2430.55 (422,322) MT (1,026.47) 570.33
Total 573.00 (1,872.80)
Commodity swaps
(Non-Designated hedges)
Copper Sell 5006 3,750 MT 18.77 18.70
Commodity options
(Non–Designated hedges)
Aluminium Sell * 2978.86 (57,716) MT (171.93) (351.66)
Aluminium Buy * 2369.22 108,800 MT 257.77 80.21
Copper Sell 1,625 MT 14.36 30.47
Total 100.20 (240.99)
Grand Total 756.49 (2,186.70)
* The “Sell” and “Buy” options include calls and puts.
(d) The following table presents the outstanding position and fair value of various interest rate derivative
financial instruments as of 31-Mar-2010:
As of 31-3-2010
Notional
Average value Fair value
price (USD in Gain/(Loss)
Fixed leg (USD/Unit) Millions) (Rs. In crores)
Interest rate swaps
Cash flow hedges
1M USD Libor Pay fixed 1.65% 520.00 (30.01)
3M Euribor Pay fixed 2.21% 60.00 (5.88)
3M USD Libor Pay fixed 2.15% 465.00 (34.99)
Total (70.88)
The following table presents the outstanding position and fair value of various interest rate derivative financial
instruments as of 31-Mar-2009:
As of 31-3-2010
Notional
Average value Fair value
price (USD in Gain/(Loss)
Fixed leg (USD/Unit) Millions) (Rs. In crores)
Interest rate swaps
Cash flow hedges
1M USD Libor Pay fixed 1.49% 300 (11.61)
3M USD Libor Pay fixed 4.00% 400 (53.68)
3M USD Libor Pay fixed 2.12% 360 (25.93)
Total (91.22)
SCHEDULE ‘20’ (Contd.)
S C H E D U L E S F O R M I N G PA R T O F T H E
CONSOLIDATED FINANCIAL STATEMENTS
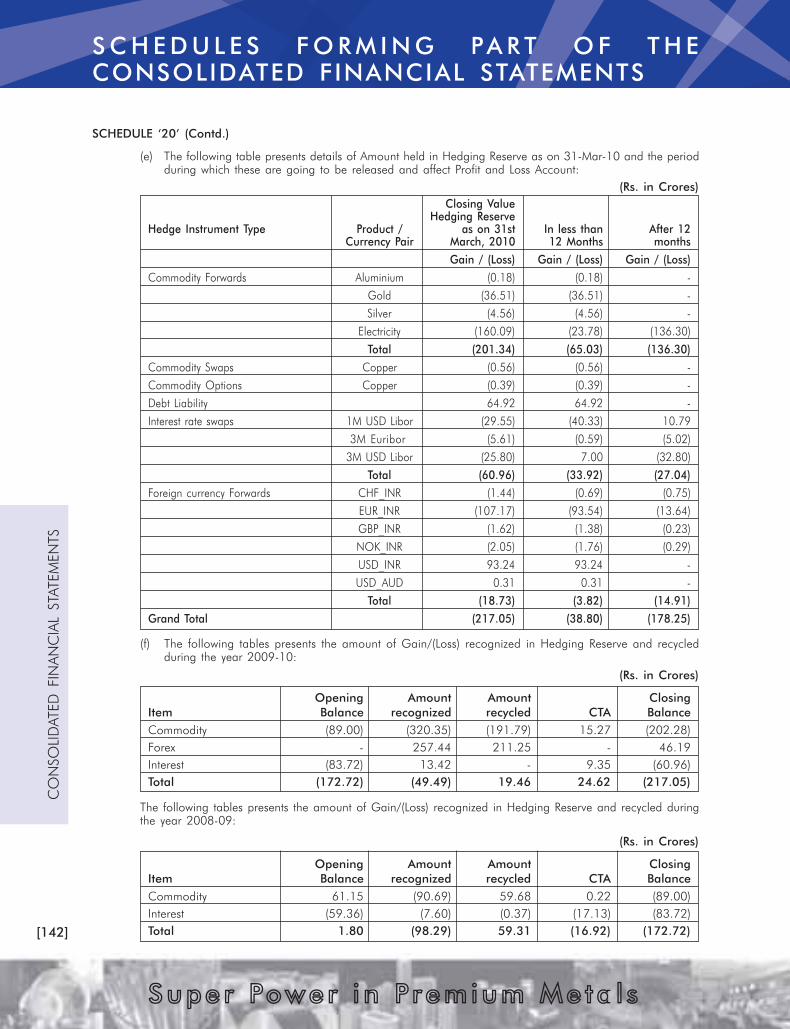
[142]
CO
NSO
LID
ATED
FIN
AN
CIA
L STATEM
EN
TS
Supe r Power i n Premium Me ta l s
(e) The following table presents details of Amount held in Hedging Reserve as on 31-Mar-10 and the period
during which these are going to be released and affect Profit and Loss Account:
(Rs. in Crores)
Closing Value
Hedging Reserve
Hedge Instrument Type Product / as on 31st In less than After 12
Currency Pair March, 2010 12 Months months
Gain / (Loss) Gain / (Loss) Gain / (Loss)
Commodity Forwards Aluminium (0.18) (0.18) -
Gold (36.51) (36.51) -
Silver (4.56) (4.56) -
Electricity (160.09) (23.78) (136.30)
Total (201.34) (65.03) (136.30)
Commodity Swaps Copper (0.56) (0.56) -
Commodity Options Copper (0.39) (0.39) -
Debt Liability 64.92 64.92 -
Interest rate swaps 1M USD Libor (29.55) (40.33) 10.79
3M Euribor (5.61) (0.59) (5.02)
3M USD Libor (25.80) 7.00 (32.80)
Total (60.96) (33.92) (27.04)
Foreign currency Forwards CHF_INR (1.44) (0.69) (0.75)
EUR_INR (107.17) (93.54) (13.64)
GBP_INR (1.62) (1.38) (0.23)
NOK_INR (2.05) (1.76) (0.29)
USD_INR 93.24 93.24 -
USD_AUD 0.31 0.31 -
Total (18.73) (3.82) (14.91)
Grand Total (217.05) (38.80) (178.25)
(f) The following tables presents the amount of Gain/(Loss) recognized in Hedging Reserve and recycled
during the year 2009-10:
(Rs. in Crores)
Opening Amount Amount Closing
Item Balance recognized recycled CTA Balance
Commodity (89.00) (320.35) (191.79) 15.27 (202.28)
Forex - 257.44 211.25 - 46.19
Interest (83.72) 13.42 - 9.35 (60.96)
Total (172.72) (49.49) 19.46 24.62 (217.05)
The following tables presents the amount of Gain/(Loss) recognized in Hedging Reserve and recycled during
the year 2008-09:
(Rs. in Crores)
Opening Amount Amount Closing
Item Balance recognized recycled CTA Balance
Commodity 61.15 (90.69) 59.68 0.22 (89.00)
Interest (59.36) (7.60) (0.37) (17.13) (83.72)
Total 1.80 (98.29) 59.31 (16.92) (172.72)
SCHEDULE ‘20’ (Contd.)
S C H E D U L E S F O R M I N G PA R T O F T H E
CONSOLIDATED FINANCIAL STATEMENTS

[143]
CO
NSO
LID
ATED
FIN
AN
CIA
L STATEM
EN
TS
Supe r Power i n Premium Me ta l s
(g) The following table presents the details of amount recycled from Hedging Reserve and reference of the
line item in Profit and Loss Account where those amounts are included in the year 2009-10:
Schedule No Schedule Line Item (Rs. in Crores)
15 Net Sales 187.92
18 Raw Materials Consumed 230.58
18 (Gain) / Loss in change in Fair value of derivatives (net) 73.97
The following table presents the details of amount recycled from Hedging Reserve and reference of the line
item in Profit and Loss Account where those amounts are included in the year 2008-09:
Item Schedule No Schedule Line Item (Rs. in Crores)
Commodity 18 (Gain) / Loss in change in Fair Value of derivatives (net) 59.68
Interest 18 (Gain) / Loss in change in Fair Value of derivatives (net) (0.37)
(h) Sensitivities
The following table presents the estimated potential changes in the fair values of the foreign currency
derivative financial instruments as of 31-Mar-2010 given a 10% changes in their respective indexes:
(Rs. in Crores)
Change in Change in
Change in Change in Profit & Loss Hedging
Currency Pair Rate/Price NPV Account CTA Reserve
USD_INR 10% 212.78 111.91 - 100.87
EUR_INR 10% 118.52 13.71 - 104.81
GBP_INR 10% 2.21 0.22 - 1.98
NOK_INR 10% 3.20 0.47 - 2.74
CHF_INR 10% 1.43 0.21 - 1.22
EUR _ USD 10% 178.15 95.67 82.49 -
BRL _ USD 10% 91.01 91.01 - -
KRW _ USD 10% 21.07 21.07 - -
CAD _ USD 10% 20.17 20.17 - -
GBP _ USD 10% 2.82 2.82 - -
CHF _ USD 10% 19.28 19.28 - -
USD_AUD 10% (4.16) - - 4.16
USD_AUD -10% 3.84 - - (3.84)
Debt 10% 297.46 28.53 - 268.93
The following table presents the estimated potential change in the fair values of the commodity derivative
financial instruments as of 31-Mar-2010, given a 10% change in their respective indexes (LME in case of
Aluminium and Copper, LBMA in case of Gold and Silver, NYMEX NYISO Zone, a Peak Rate in the case of
Electricity):
(Rs. in Crores)
Change in Change in
Change in Change in Profit & Loss Hedging
Types of Derivative Rate/Price NPV Account Reserve
Forwards 10% 198.31 90.95 101.77
Forwards -10% (17.10) (14.73) 2.36
Options 10% 14.45 10.51 (3.95)
Options -10% (13.44) (10.10) 3.34
SCHEDULE ‘20’ (Contd.)
S C H E D U L E S F O R M I N G PA R T O F T H E
CONSOLIDATED FINANCIAL STATEMENTS

[144]
CO
NSO
LID
ATED
FIN
AN
CIA
L STATEM
EN
TS
Supe r Power i n Premium Me ta l s
The following table presents the estimated potential change in the fair values of the interest rate derivative
financial instruments as of 31-Mar-2010, given a 10% change in their respective indexes (USD Libor in case
of Interest rate swaps):
(Rs. in Crores)
Change in
Change in Change in Hedging
Types of Derivative Rate/Price NPV Reserve
1M USD LIBOR 10% 2.94 2.94
3M USD LIBOR 10% 7.48 7.48
3M EURIBOR 10% 1.28 1.28
15. Additional Information:
(Rs. in Crores)
2009-10 2008-09
Shares in Joint
Ventures Consolidated Consolidated
(a) Estimated amount of contracts remaining to
be executed on capital account and not
provided for (Net of Advances) 1.08 12,852.26 4,211.75
(b) Contingent liabilities not provided for in respect of:
i. Claims against the Company not
acknowledged as debts - 792.13 762.43
ii. Bills discounted with Banks - 0.19 -
iii. Corporate Guarantees outstanding 16.71 108.85 84.36
iv. Custom duty on Capital goods and Raw
Materials imported under Advance License/
EPCG Scheme against which Export
obligations to be fulfilled - 168.46 187.78
16. Major components of Deferred Tax arising on account of temporary timing differences are as under:
(Rs. in Crores)
2009-10 2008-09
Deferred Tax Liability:
Depreciation 5,526.68 5,751.24
Others 935.26 731.87
6,461.94 6,483.11
Deferred Tax Assets:
Un-amortized Expenditure 34.63 19.83
Brought forward Business Loss 1,251.26 1,205.23
Others 1,237.85 2,447.49
2,523.74 3,672.55
Deferred Tax Liability (Net) 3,938.20 2,810.56
17. Exchange (gain)/loss have been accounted for under respective heads of account as under:
(Rs. in Crores)
2009-10 2008-09
Sales and Operating Revenues 9.39 55.96
Manufacturing and Other Expenses (278.40) 775.20
Interest and Finance Charges - 21.29
Total (269.01) 852.45
18. (a) Future obligation under non-cancelable operating leases are as under:
(Rs. in Crores)
2009-10 2008-09
Not later than one year 129.04 134.78
Later than one year and not later than five years 272.81 319.80
Later than five years 112.30 121.34
SCHEDULE ‘20’ (Contd.)
S C H E D U L E S F O R M I N G PA R T O F T H E
CONSOLIDATED FINANCIAL STATEMENTS
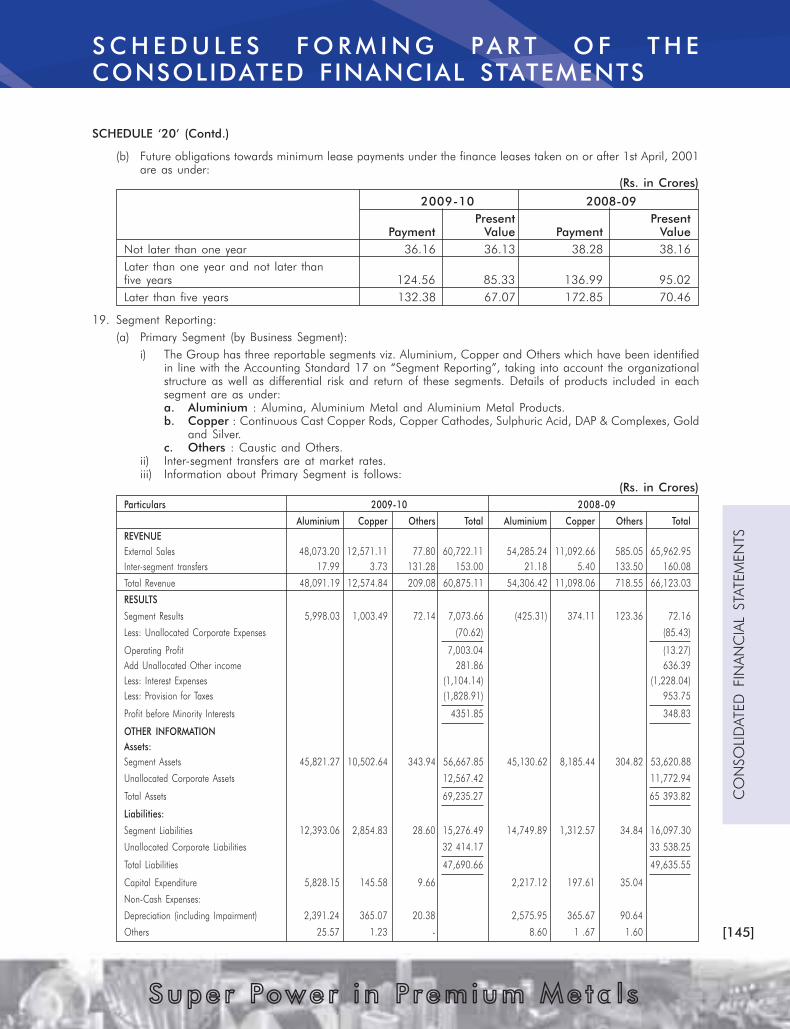
[145]
CO
NSO
LID
ATED
FIN
AN
CIA
L STATEM
EN
TS
Supe r Power i n Premium Me ta l s
(b) Future obligations towards minimum lease payments under the finance leases taken on or after 1st April, 2001
are as under:
(Rs. in Crores)
2009-10 2008-09
Present Present
Payment Value Payment Value
Not later than one year 36.16 36.13 38.28 38.16
Later than one year and not later than
five years 124.56 85.33 136.99 95.02
Later than five years 132.38 67.07 172.85 70.46
19. Segment Reporting:
(a) Primary Segment (by Business Segment):
i) The Group has three reportable segments viz. Aluminium, Copper and Others which have been identified
in line with the Accounting Standard 17 on “Segment Reporting”, taking into account the organizational
structure as well as differential risk and return of these segments. Details of products included in each
segment are as under:
a. Aluminium : Alumina, Aluminium Metal and Aluminium Metal Products.
b. Copper : Continuous Cast Copper Rods, Copper Cathodes, Sulphuric Acid, DAP & Complexes, Gold
and Silver.
c. Others : Caustic and Others.
ii) Inter-segment transfers are at market rates.
iii) Information about Primary Segment is follows:
(Rs. in Crores)
Particulars 2009-10 2008-09
Aluminium Copper Others Total Aluminium Copper Others Total
REVENUE
External Sales 48,073.20 12,571.11 77.80 60,722.11 54,285.24 11,092.66 585.05 65,962.95
Inter-segment transfers 17.99 3.73 131.28 153.00 21.18 5.40 133.50 160.08
Total Revenue 48,091.19 12,574.84 209.08 60,875.11 54,306.42 11,098.06 718.55 66,123.03
RESULTS
Segment Results 5,998.03 1,003.49 72.14 7,073.66 (425.31) 374.11 123.36 72.16
Less: Unallocated Corporate Expenses (70.62) (85.43)
Operating Profit 7,003.04 (13.27)
Add Unallocated Other income 281.86 636.39
Less: Interest Expenses (1,104.14) (1,228.04)
Less: Provision for Taxes (1,828.91) 953.75
Profit before Minority Interests 4351.85 348.83
OTHER INFORMATION
Assets:
Segment Assets 45,821.27 10,502.64 343.94 56,667.85 45,130.62 8,185.44 304.82 53,620.88
Unallocated Corporate Assets 12,567.42 11,772.94
Total Assets 69,235.27 65 393.82
Liabilities:
Segment Liabilities 12,393.06 2,854.83 28.60 15,276.49 14,749.89 1,312.57 34.84 16,097.30
Unallocated Corporate Liabilities 32 414.17 33 538.25
Total Liabilities 47,690.66 49,635.55
Capital Expenditure 5,828.15 145.58 9.66 2,217.12 197.61 35.04
Non-Cash Expenses:
Depreciation (including Impairment) 2,391.24 365.07 20.38 2,575.95 365.67 90.64
Others 25.57 1.23 - 8.60 1 .67 1.60
SCHEDULE ‘20’ (Contd.)
S C H E D U L E S F O R M I N G PA R T O F T H E
CONSOLIDATED FINANCIAL STATEMENTS
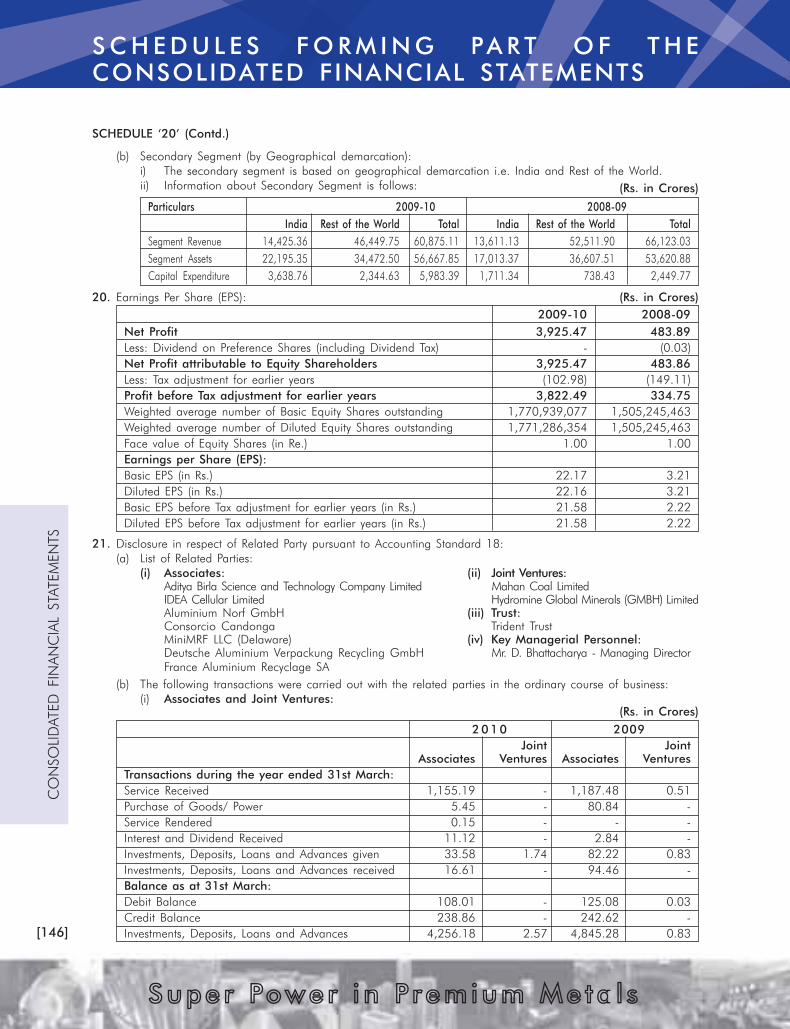
[146]
CO
NSO
LID
ATED
FIN
AN
CIA
L STATEM
EN
TS
Supe r Power i n Premium Me ta l s
(b) Secondary Segment (by Geographical demarcation):
i) The secondary segment is based on geographical demarcation i.e. India and Rest of the World.
ii) Information about Secondary Segment is follows: (Rs. in Crores)
Particulars 2009-10 2008-09
India Rest of the World Total India Rest of the World Total
Segment Revenue 14,425.36 46,449.75 60,875.11 13,611.13 52,511.90 66,123.03
Segment Assets 22,195.35 34,472.50 56,667.85 17,013.37 36,607.51 53,620.88
Capital Expenditure 3,638.76 2,344.63 5,983.39 1,711.34 738.43 2,449.77
20. Earnings Per Share (EPS): (Rs. in Crores)
2009-10 2008-09
Net Profit 3,925.47 483.89
Less: Dividend on Preference Shares (including Dividend Tax) - (0.03)
Net Profit attributable to Equity Shareholders 3,925.47 483.86
Less: Tax adjustment for earlier years (102.98) (149.11)
Profit before Tax adjustment for earlier years 3,822.49 334.75
Weighted average number of Basic Equity Shares outstanding 1,770,939,077 1,505,245,463
Weighted average number of Diluted Equity Shares outstanding 1,771,286,354 1,505,245,463
Face value of Equity Shares (in Re.) 1.00 1.00
Earnings per Share (EPS):
Basic EPS (in Rs.) 22.17 3.21
Diluted EPS (in Rs.) 22.16 3.21
Basic EPS before Tax adjustment for earlier years (in Rs.) 21.58 2.22
Diluted EPS before Tax adjustment for earlier years (in Rs.) 21.58 2.22
21. Disclosure in respect of Related Party pursuant to Accounting Standard 18:
(a) List of Related Parties:
(i) Associates: (ii) Joint Ventures:
Aditya Birla Science and Technology Company Limited Mahan Coal Limited
IDEA Cellular Limited Hydromine Global Minerals (GMBH) Limited
Aluminium Norf GmbH (iii) Trust:
Consorcio Candonga Trident Trust
MiniMRF LLC (Delaware) (iv) Key Managerial Personnel:
Deutsche Aluminium Verpackung Recycling GmbH Mr. D. Bhattacharya - Managing Director
France Aluminium Recyclage SA
(b) The following transactions were carried out with the related parties in the ordinary course of business:
(i) Associates and Joint Ventures:
(Rs. in Crores)
2 0 1 0 2009
Joint Joint
Associates Ventures Associates Ventures
Transactions during the year ended 31st March:
Service Received 1,155.19 - 1,187.48 0.51
Purchase of Goods/ Power 5.45 - 80.84 -
Service Rendered 0.15 - - -
Interest and Dividend Received 11.12 - 2.84 -
Investments, Deposits, Loans and Advances given 33.58 1.74 82.22 0.83
Investments, Deposits, Loans and Advances received 16.61 - 94.46 -
Balance as at 31st March:
Debit Balance 108.01 - 125.08 0.03
Credit Balance 238.86 - 242.62 -
Investments, Deposits, Loans and Advances 4,256.18 2.57 4,845.28 0.83
SCHEDULE ‘20’ (Contd.)
S C H E D U L E S F O R M I N G PA R T O F T H E
CONSOLIDATED FINANCIAL STATEMENTS

[147]
CMYK
CO
NSO
LID
ATED
FIN
AN
CIA
L STATEM
EN
TS
Supe r Power i n Premium Me ta l s
SCHEDULE ‘20’ (Contd.)
(ii) Trust: (Rs. in Crores)
2009-10 2008-09
Beneficiary Interest in Trust 34.45 34.45
(iii) Key Managerial Personnel: (Rs. in Crores)
2009-10 2008-09
Managerial Remuneration (including perquisites) * 13.15 11.09
* Excluding gratuity, leave encashment provisions and employee compensation under Employee Stock OptionScheme.
22. Figures of previous year have been regrouped/ rearranged wherever necessary.
S C H E D U L E S F O R M I N G PA R T O F T H ECONSOLIDATED FINANCIAL STATEMENTS
As per our report annexed.
For SINGHI & CO. For and on behalf of the BoardChartered Accountants
RAJIV SINGHI S. Talukdar Kumar Mangalam Birla – ChairmanPartner Group Executive President & CFO D. Bhattacharya – Managing DirectorMembership No. 53518 M. M. Bhagat – Director
Camp: Mumbai Anil MalikDated: The 4th day of June, 2010 Company Secretary
FINANCIAL INFORMATION RELATING TO SUBSIDIARY COMPANIES FOR THE YEAR ENDED 31ST MARCH, 2010
(Rs. in Crores)
Name of the Subsidiary Company Country Capital Reserves Total Total Invest- Turnover/ Profit/(Loss) Provision Profit/(Loss) Proposed
Assets Liabilities ments** Revenues before Tax for Tax after Tax Dividend
1 Indal Exports Limited India 0.14 0.36 0.50 0.01 0.46 0.01 (0.00) - (0.00) -
2 Minerals & Minerals Limited India 0.05 1.12 1.46 0.29 - 0.41 0.03 0.02 0.01 -
3 Renuka Investments & Finance Limited India 9.25 34.19 43.88 0.44 30.95 2.84 2.67 0.26 2.41 -
4 Renukeshwar Investments & Finance Limited India 4.80 24.61 29.44 0.03 24.83 1.41 1.38 0.48 0.90 -
5 Suvas Holdings Limited India 3.97 (0.00) 4.01 0.04 - - - - - -
6 Utkal Alumina International Limited India 1,050.24 (15.41) 2,034.48 999.65 101.82 13.33 (12.43) 2.98 (15.41) -
7 Aditya Birla Chemicals (India) Limited
(formerly known as Bihar Caustic & Chemicals Ltd.) India 23.39 265.97 402.50 113.14 30.94 243.48 71.22 10.48 60.74 3.51
8 Hindalco-Almex Aerospace Limited India 92.37 (21.90) 100.17 29.70 - 23.19 (6.60) - (6.60) -
9 HAAL (USA) Inc $ USA 0.00 0.12 0.19 0.07 - 1.21 0.13 - 0.13 -
10 Lucknow Finance Company Limited India 12.00 8.63 21.88 1.25 5.00 2.54 2.32 0.49 1.83 -
11 Dahej Harbour and Infrastructure Limited India 50.00 260.05 335.42 25.37 134.29 75.66 53.18 7.15 46.03 -
12 East Coast Bauxite Mining Company Private Limited India 0.01 (0.01) 0.01 0.01 - - (0.00) - (0.00) -
13 Tubed Coal Mines Limited India 4.95 (0.06) 5.02 0.14 - 0.05 (0.05) 0.01 (0.06) -
14 Mauda Energy Limited India 0.15 - 0.15 - - - - - - -
15 Aditya Birla Minerals Limited * Australia 1,852.64 (7.26) 1,904.91 59.53 - 18.68 17.01 (0.14) 17.15 -
16 Birla Nifty Pty Limited ^ * Australia 359.35 430.41 1,886.22 1,096.46 - 1,581.76 450.27 135.06 315.21 -
17 Birla Maroochydore Pty Limited ^ * Australia 41.11 (21.23) 53.54 33.67 - 4.00 1.28 0.38 0.89 -
18 Birla Mt Gordon Pty Limited ^ * Australia 98.66 (233.73) 295.39 430.46 - 72.60 (74.13) (22.24) (51.89) -
19 Birla Resources Pty Limited * Australia 2.67 (0.00) 2.71 0.04 - 0.15 0.00 - 0.00 -
20 A V Minerals (Netherlands) B.V. * Netherlands 12,733.48 (1,547.95) 15,773.80 4,588.27 - 0.97 (402.51) - (402.51) -
21 A V Metals Inc, Canada # * Canada 15,751.97 (16.74) 15,751.75 16.52 - - (0.92) - (0.92) -
22 A V Aluminium Inc, Canada ##* Canada 15,751.75 (159.03) 15,602.02 9.30 - - (9.82) - (9.82) -
STATEM
EN
T RELATIN
G TO
SU
BSID
IARY C
OM
PA
NIE
S

[148]
CMYK
CO
NSO
LID
ATED
FIN
AN
CIA
L STATEM
EN
TS
Supe r Power i n Premium Me ta l s
FINANCIAL INFORMATION RELATING TO SUBSIDIARYCOMPANIES FOR THE YEAR ENDED 31ST MARCH, 2010
(Rs. in Crores)
Name of the Subsidiary Company Country Capital Reserves Total Total Invest- Turnover/ Profit/(Loss) Provision Profit/(Loss) Proposed
Assets Liabilities ments** Revenues before Tax for Tax after Tax Dividend
23 Novelis Inc. ### * Canada - 3,210.97 11,856.59 8,645.62 - 4,021.49 (178.03) (116.36) (61.67) -
24 4260848 Canada Inc. @ * Canada 553.70 64.08 618.86 1.08 - - - 1.68 (1.68) -
25 4260856 Canada Inc. @ * Canada 830.54 88.72 920.87 1.61 - - - 2.52 (2.52) -
26 Novelis No. 1 Limited Partnership @ * Canada 0.00 509.61 514.54 4.93 - - (0.78) - (0.78) -
27 Novelis Brand LLC @ * USA 0.00 134.49 649.03 514.54 - - 94.69 - 94.69 -
28 Novelis South America Holdings LLC @ * USA 0.00 - 0.00 - - - - - - -
29 Aluminum Upstream Holdings LLC @ * USA 0.00 (0.00) - - - - - - - -
30 Novelis (India) Infotech Ltd. @ * India 21.16 (2.31) 21.43 2.58 - - 4.43 - 4.43 -
31 Novelis Corporation (Texas) @ * USA 0.00 728.98 11,412.64 10,683.66 2.43 15,841.09 1,396.44 541.92 854.52 -
32 Novelis de Mexico S.A. de C.V. @ * Mexico 0.03 0.18 0.32 0.11 - - (0.21) - (0.21) -
33 Novelis do Brasil Ltda. @ * Brasil 301.85 1,925.76 5,886.56 3,658.95 206.48 4,055.69 226.30 327.74 (101.44) 16.60
34 Novelis Madeira, Unipessoal, Lda @ * Portugal 5.58 64.47 305.69 235.64 - 824.40 55.14 - 55.14 -
35 Novelis Korea Limited @ * S. Korea 868.45 829.14 4,000.41 2,302.82 - 6,766.48 716.39 148.97 567.42 249.33
36 Alcom Nikkei Specialty Coatings Sdn BHD. @ * Malaysia 41.39 4.08 76.96 31.49 - 140.36 (0.87) (0.39) (0.48) -
37 Aluminum Company of Malaysia Berhad @ * Malaysia 249.98 24.85 316.63 41.80 - 336.32 3.19 0.07 3.12 -
38 Al Dotcom Sdn. BHD. @ * Malaysia - - - - - - - - - -
39 Novelis UK Ltd. @ * England 1,097.37 (1,114.91) 749.82 767.36 - 1,887.79 119.63 1.33 118.30 -
40 Novelis Services Limited @ * Wales 0.04 (4.56) 334.17 338.69 - - (4.14) 10.03 (14.17) -
41 Novelis Deutschland GmbH @ * Germany 283.72 1,565.94 4,911.48 3,061.82 2,967.74 10,005.72 907.09 271.79 635.30 -
42 Novelis Aluminium Beteiligungsgesellschaft mbH @ * Germany 0.10 0.20 0.30 0.00 - - (0.00) 0.00 (0.00) -
43 Novelis Switzerland SA @ * Switzerland 13.13 314.99 1,177.83 849.71 - 1,458.94 85.80 20.59 65.21 -
44 Novelis Laminés France SAS @ * France 16.33 18.51 39.57 4.73 - - 14.03 3.96 10.07 -
45 Novelis Italia SpA @ * Italy 693.42 (518.71) 667.54 492.83 - 1,126.92 13.07 3.37 9.70 -
46 Novelis Benelux NV @ * Belgium 6.40 6.05 13.06 0.61 - - (0.13) 0.02 (0.15) -
47 Novelis Aluminium Holding Company @ * Ireland 883.57 1,182.27 4,463.96 2,398.12 - - (191.79) (0.40) (191.39) -
48 Novelis Luxembourg SA @ * Luxembourg 501.37 (89.97) 685.09 273.69 - 724.96 19.79 5.96 13.83 -
49 Novelis Cast House Technology Ltd. @ * Canada - - - - - - - - - -
50 Eurofoil Inc. (USA) @ * USA - - - - - - - - - -
51 Novelis PAE Corporation @ * USA 1.46 0.15 1.61 - - - - - - -
52 Novelis PAE SAS @ * France 21.38 (40.30) 52.87 71.79 - 125.12 13.27 1.02 12.25 -
53 Novelis Foil France SAS @ * France 48.09 (293.24) 275.92 521.07 - 584.67 (24.50) 2.46 (26.96) -
54 Novelis Belgique SA @ * Belgium 111.29 (92.87) 22.28 3.86 - - 3.81 - 3.81 -
55 Novelis Europe Holdings Limited @ * Wales 985.74 2,577.90 3,691.36 127.72 - - (38.43) (3.33) (35.10) -
56 Novelis Technology AG @ * Switzerland 1.43 2.52 3.96 0.01 - - (0.05) 0.01 (0.06) -
57 Novelis AG @ * Switzerland 2.60 (163.25) 3,202.95 3,363.60 - - (13.47) 16.28 (29.75) -
58 Logan Aluminium Inc. @ * USA 1.00 (23.13) 582.20 604.33 - 1,663.76 8.77 3.71 5.06 -
59 Evermore Recycling LLC @ * USA - 1.46 2.61 1.15 - 0.05 (5.71) 0.00 (5.71) -
60 Albrasilis - Aluminio do Brasil Industria e
Comércio Ltda @ * Brasil - - - - - - - - - -
* Balance sheet items are translated at closing Exchange rate and Profit/(Loss) items are translated at Average exchange rate.
$ Subsidiary of Hindalco-Almex Aerospace Limited.
^ Subsidiary of Aditya Birla Minerals Limited.
# Subsidiary of AV Minerals (Netherlands) B.V.
## Subsidiary of AV Metals Inc, Canada.
### Subsidiary of AV Aluminium Inc, Canada.
@ Subsidiary of Novelis Inc.
** Excluding Investment in Subsidiaries.
STATEM
EN
T RELATIN
G TO
SU
BSID
IARY C
OM
PA
NIE
S
Note :
The Ministry of Corporate affairs, Government of India vide its order No. 47/326/2010-CL-III dated 6th August, 2010 issued under Section 212 (8) of the Companies Act, 1956, has exemptedthe Company from attaching the documents of Company’s subsidiaries, required to be attached under Section 212 (1) of the Companies Act, 1956, for the financial year ended on 31.03.2010.However annual accounts of the Subsidiary Companies and the related detailed information will be made available to the investors of the Company and subsidiaries of the Company, seekingsuch information at any point of time. The annual accounts of the subsidiary companies are available for inspection by any investor at the Registered Office of the Company and the concernedSubsidiary of the Company.

HINDALCO & ITS SUBSIDIARIES/JVs
Hindalco Industries Limited : Aluminium, Copper
Subsidiaries
• Novelis Inc., Canada : Aluminium Rolled Products
• Aditya Birla Chemicals (India) Limited : Caustic Soda, Liquid Chlorine, Hydrochloric Acid
• Aditya Birla Minerals Limited : Copper Mining
• Hindalco-Almex Aerospace Limited : Aerospace Alloy
• Utkal Alumina International Limited : Alumina
• Dahej Harbour & Infrastructure Limited : Handling of Captive Cargo (Copper Unit) and
Commercial Cargo
• Novelis (India) Infotech Ltd. : Information Technology Services
• Tubed Coal Mines Ltd. : Mining
Joint Ventures
• Mahan Coal Limited : Mining
Prin
ted
at
Info
med
ia 1
8 Li
mit
ed
VISION, MISSION & VALUES
Vision
“To be a premium Metals major, global in size and reach, with a
passion for excellence”
Mission
“To relentlessly purse the creation of superior shareholder value by exceeding
customer expectations profitably, unleashing employee potential and being a
responsible corporate citizen adhering to our values”
Values
Integrity Honesty in every action.
Commitment Doing whatever it takes to deliver, as promised.
Passion Missionary zeal arising out of an emotional engagement with work.
Seamlessness Thinking and working together across functional silos,
hierarchy levels, businesses and geographies.
Speed Responding to stakeholders with a sense of urgency.

Related Documents