by djoko soesilo (IRCS) Corporate Presentation PT Telekomunikasi Indonesia Tbk. INVESTOR SUMMIT

Welcome message from author
This document is posted to help you gain knowledge. Please leave a comment to let me know what you think about it! Share it to your friends and learn new things together.
Transcript

by djoko soesilo (IRCS)
Corporate Presentation
PT Telekomunikasi Indonesia Tbk.
INVESTOR SUMMIT
2
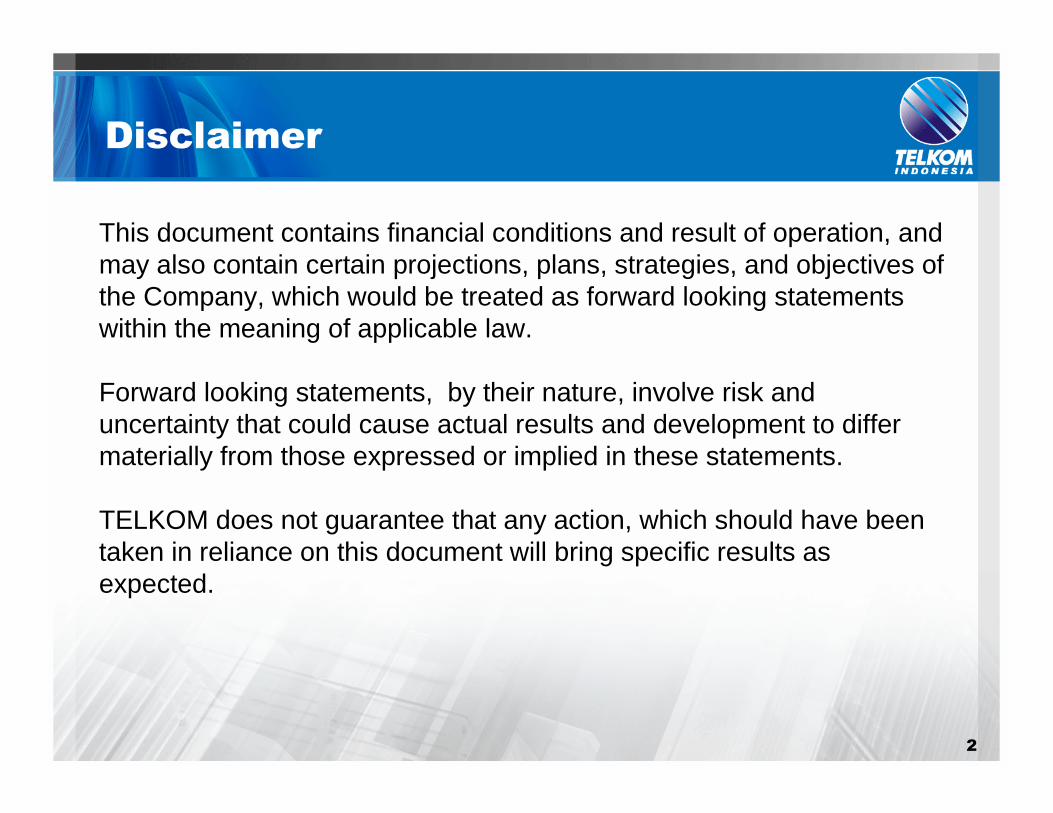
Disclaimer
This document contains financial conditions and result of operation, and may also contain certain projections, plans, strategies, and objectives of the Company, which would be treated as forward looking statements within the meaning of applicable law.
Forward looking statements, by their nature, involve risk and uncertainty that could cause actual results and development to differ materially from those expressed or implied in these statements.
TELKOM does not guarantee that any action, which should have been taken in reliance on this document will bring specific results as expected.

3
Content
A. TELKOM in Brief
B. Telco Industry in Indonesia
C. Share Price Performance
D. Operational Performances
E. Financial Performances
F. Recent Developments
4
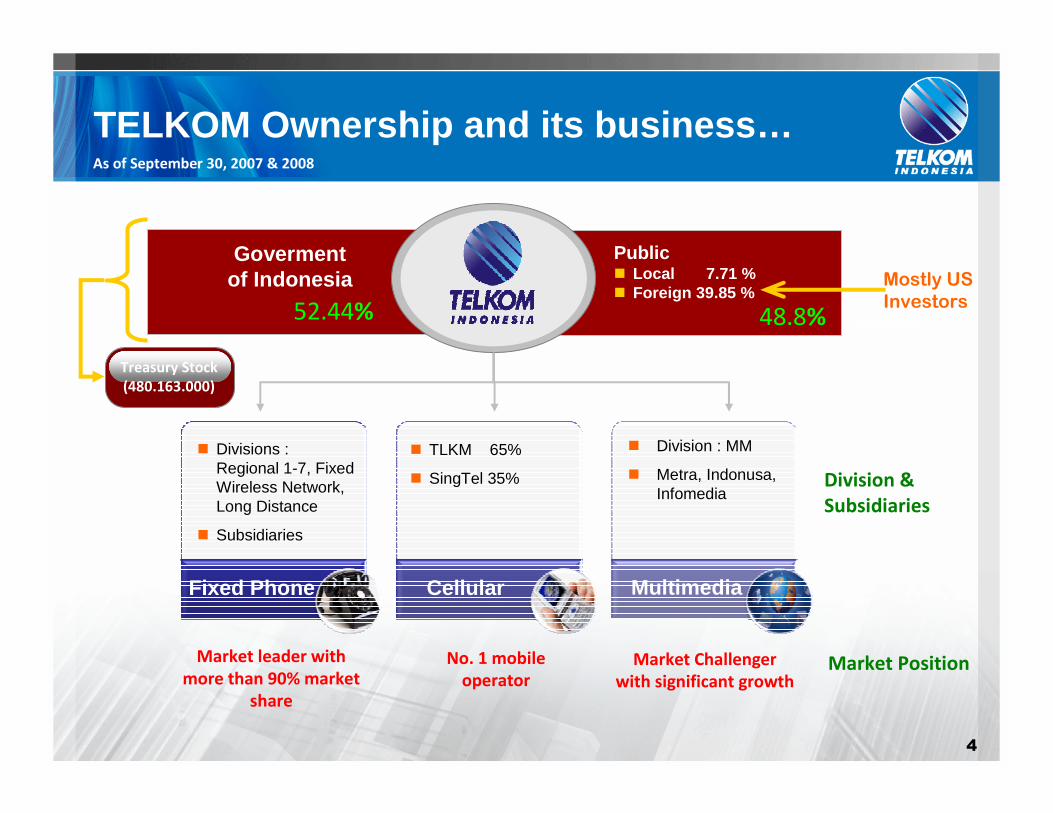
Goverment of Indonesia
Public� Local 7.71 %� Foreign 39.85 %
Mostly US
Investors
TELKOM Ownership and its business…
Division &
Subsidiaries
Market Position
52.44% 48.8%
Fixed Phone
� Divisions :Regional 1-7, Fixed Wireless Network, Long Distance
� Subsidiaries
Cellular Multimedia
� TLKM 65%
� SingTel 35%
� Division : MM
� Metra, Indonusa, Infomedia
Market leader with
more than 90% market
share
No. 1 mobile
operator
Market Challenger
with significant growth
As of September 30, 2007 & 2008
Treasury Stock
(480.163.000)

5
Board of Directors
PresidentDirector
Rinaldi Firmansyah
FinanceDirector
Sudiro Asno
Enterprise &WholesaleDirector
Arief Yahya
NetworkSolutionDirector
Ermady Dahlan
ConsumerDirector
I Nyoman G Wiryanata
HumanCapital &GeneralAffairs Director
Faisal Syam
InformationTechnology& CIODirector
Indra Utoyo
Compliance &RiskManagementDirector
Prasetio

6
Highly Performance Organization lead to Some Domestic and International Recognitions …
Until September 2008 :� Ranked 1 in the 2007 Annual Report Award (ARA) in
BUMN Non Financial – Listed of Indonesia
� Ranked 1 in ISRA (Indonesia Social Responsibility
Award) 2008
� The best in Indonesian Financial Reporting Award
(IFRA) for company which has a great loyalty to
Bapepam-LK Regulation
� Wealth Added Creator Award 2008, from SWA
Magazine, Stren & Co, SWANETWORK for Best Public
Companies Base on Wealth Added Index and Best
Public Companies
ARA ISRA
IFRA

7
Content
A. TELKOM in Brief
B. Telco Industry in Indonesia
C. Share Price Performance
D. Operational Performances
E. Financial Performances
F. Recent Developments

8
Indonesia : 4th populous country with steady economic growth
Wireless market grew at
5 times economic growth
3851
67
83
24%
31%34%31%
2005 2006 2007 2008E
Market Revenue(Rp. Tr)
Growth (%)
Wireless Market Revenue
4th most populous nation
■ Population: approx. 230 million +
■ Young dynamic population
2005 2006 2007
Economic Growth 5.32% 5.5% 6.32%
Population by Age

9
Subscribers growth shared among 11 players
116
133
151164
178
9 10 10 11 1218 2027
3543
2008E 2009E 2010E 2011E 2012E
Cellular
PSTN, ISDN, xDSL
Fixed Wireless
FWL,
FWA, BB Cellular
Cellular,
FWA, BB
Cellular,
BB Cellular FWA Cellular Cellular Cellular Cellular Satellite
11 Operators and Services
Subscribers (millions)
Source: Independent Analyst Reports

10
Content
A. TELKOM in Brief
B. Telco Industry in Indonesia
C. Share Price Performance
D. Operational Performances
E. Financial Performances
F. Recent Developments

TELKOM as a Biggest Market Cap at IDX
9.7 9.9
10.810.2
8.9 8.98.6
9.49.8
10.8
108.9
144.1
161.3155.2159.1
163.3
178.4
194.5197.6186.5
0
2
4
6
8
10
12
Jan'08 Feb'08 Mar'08 Apr'08 May'08 Jun'08 Jul'08 Agst'08 Sept'08 Oct'08
%
0
50
100
150
200
250
Rp.T
Market Cap (%)
Market Cap (Rp.T)
Composition of TLKM’s Market Cap from Total IDX (in % )

12
Content
A. TELKOM in Brief
B. Telco Industry in Indonesia
C. Share Price Performance
D. Operational Performances
E. Financial Performances
F. Recent Developments

13
Continued Growth in Operations...As of September 30, 2007 & 2008
Cellular
Business
Cellular Subscin milion
Fixed Wireless
Business
Fixed Wireless Subs.in milion
Data & Internet
Business
ADSL Speedy Subs.in ‘000
Fixed Wireline
Business
Fixed Wireline Subs.in milion
44.5
60.5
3Q/07 3Q/08
▲36%
8.7 8.6
3Q/07 3Q/08
▼2%
5.6
9.1
3Q/07 3Q/08
▲63%
209
593
3Q/07 3Q/08
▲184%

14
Cellular Business...
Subscriberin mn
MoUin bn minutes
BTS
Increasing MoU and
managing RPM
■ TSEL delivering price elasticity for both voice and sms
■ Different pricing strategy for different segment will
optimize elasticity factor
Better network deployment
■ Growth of BTS ’07-EoY 08: 26-31%
■ 2008 total BTS will be 25 – 28K
■ 2008 total TRX will be 300 K
44.5
60.5
3Q/07 3Q/08
▲36%
18
59
3Q/07 3Q/08
▲234%
19,767
25,089
3Q/07 3Q/08
▲27%
As of September 30, 2007 & 2008

15
Fixed Line Business
14.3
17.7
3Q/07 3Q/08
Total
Fixed Line
Subs.in milion
Fixed Wireline
Business
Fixed Wireline Subs.in milion
Fixed wireline business will focus on
enterprise market…
■ Despite the declining fixed-voice market revenue
pool, enterprise access & connectivity market
projected to grow
■ TLKM strategy to reduce declining wireline revenue
is by expanding on enterprise market
8.7 8.6
3Q/07 3Q/08
▼2%
▲24%
As of September 30, 2007 & 2008

16
Fixed Wireless Business
389
514
3Q/07 3Q/08
MoUin bn seconds
� Available in 321 cities
with 3,181 BTS
� ARPU (Blended)Rp. 40 K
TELKOM FlexiFixed Wireless
▲32%1,677
3,181
3Q/07 3Q/08
▲90%
BTS
(unit)
Fixed Wireless Subs.in milion
5.6
9.1
3Q/07 3Q/08
▲63%
As of September 30, 2007 & 2008
17
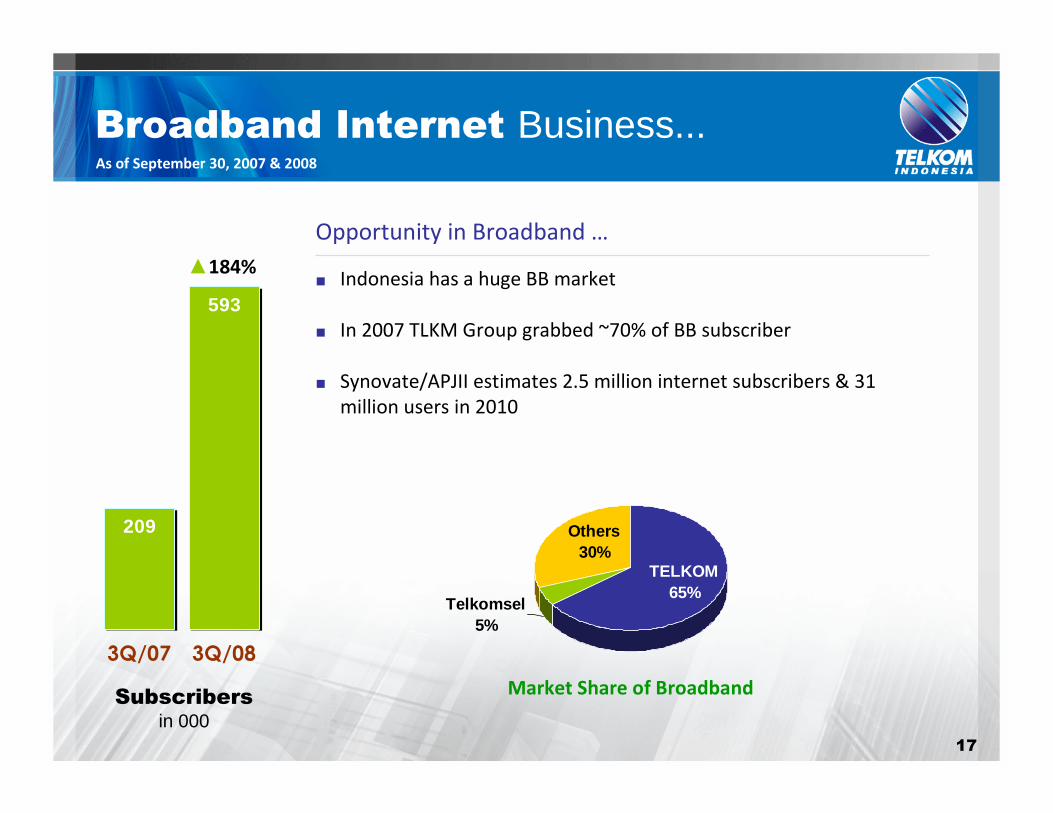
Broadband Internet Business...As of September 30, 2007 & 2008
Telkomsel5%
TELKOM65%
Others30%
Opportunity in Broadband …
■ Indonesia has a huge BB market
■ In 2007 TLKM Group grabbed ~70% of BB subscriber
■ Synovate/APJII estimates 2.5 million internet subscribers & 31
million users in 2010
Market Share of Broadband
209
593
3Q/07 3Q/08
Subscribersin 000
▲184%

18
Content
A. TELKOM in Brief
B. Telco Industry in Indonesia
C. Share Price Performance
D. Operational Performances
E. Financial Performances
F. Recent Developments

19
Financial HighlightsAs of September 30, 2007 & 2008
19191919
63.5% 58.3%
3Q/07 3Q/08
27.726.0
3Q/07 3Q/08
43.6 44.6
23.8
27.4
9.8 8.9
3Q/07 3Q/08
Operating
Revenues
▲2.2%
Operating
Expenses
▲15.5%
Net Income
▼9.2%
in Rp Tr.
EBITDA Margin
▼▼5.2%
NI / Share = Rp.451.1
EBITDA (Rp.T)
▼▼6.2%

20
Revenues DriversAs of September 30, 2007 & 2008
0.6
0.8
3Q/07 3Q/08
Operating
Revenue
43.6 44.6
3Q/07 3Q/08
10.210.8
3Q/07 3Q/08
Data &
InternetCellular Network
16.7
18.3
3Q/07 3Q/08
� Speedy subscriber (▲184%)
Data & Internet
� MoU (▲234%)
� Subscriber (▲36%)
Cellular
� Leased Line Revenue (▲231%)
Network
in Rp Tr.in Rp Tr.
▲2.2%
▲5.9%
▲9.4%
▲32.4%

21
Expense DriversAs of September 30, 2007 & 2008
7.0
8.0
3Q/07 3Q/08
Depreciation
6.8
8.7
3Q/07 3Q/08
O & M
1.21.6
3Q/07 3Q/08
Marketing
6.26.5
3Q/07 3Q/08
Personnel
23.8
27.4
3Q/07 3Q/08
Operating
Expense
� Telkomsel Network Infrastructure Growth
Depreciation
� Telkomsel’s BTS (▲27%)
� Telkomsel’s Capacity (▲30%)
Affected in increasing frequency fees and repair & maintenance cost for the network equipment
Operation, Maintenance
& Telecom. Service
� Due to increasing competition (cellular & wireless market)
Marketing
� Pension cost increased due to decreasing the discount rate for actuary calculation by 0.25%
Personnel
in Rp Tr. in Rp Tr.
▲15.5%
▲13.8%
▲27.7%
▲36.0%
▲4.9%

22
Capital ExpenditureAs of September 30, 2007 & 2008
� Optimizing Legacy
� New Wave
� Infrastructure
� Support
CAPEX Absorption in 3Q/08(Rp Tr)
14.8
3.9
10.7
TELKOM Group Telkom(Unconsolidated)
Telkomsel

23
Consolidated Debt
Yen1,141
IDR12,913
USD3,911
EuroYen1,095
Euro190
USD5,132
IDR7,434
3Q/2007Total Rp. 13,851 bn
3Q/2008Total Rp. 17,964 bn
TELKOM hedged its foreign currency exposures through time deposit placements,
mainly in US Dollars that covered 24.8% of foreign debts from October 1, 2008 to
September 30, 2009
54%37%
8%
72%
22%
6%
(0%)(1%)
As of September 30, 2007 & 2008
24
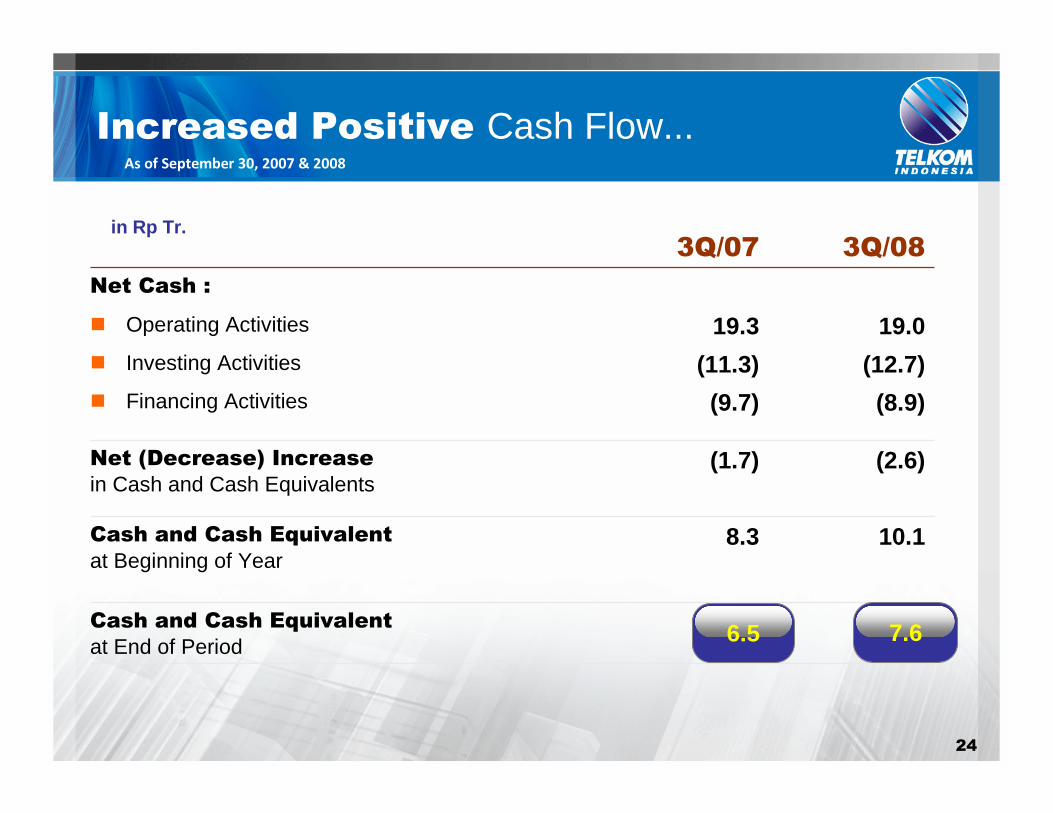
Increased Positive Cash Flow...As of September 30, 2007 & 2008
Cash and Cash Equivalent
at End of Period
10.18.3Cash and Cash Equivalent
at Beginning of Year
(2.6)(1.7)Net (Decrease) Increase
in Cash and Cash Equivalents
(8.9)(9.7)� Financing Activities
(12.7)(11.3)� Investing Activities
19.019.3� Operating Activities
Net Cash :
3Q/083Q/07in Rp Tr.
6.5 7.6

25
Content
A. TELKOM in Brief
B. Telco Industry in Indonesia
C. Share Price Performance
D. Operational Performances
E. Financial Performances
F. Recent Developments

26
Recent Developments
■ Approve Mr Bobby A.A. Nazief as Commissioner for 5 years
■ Approve the extension of the term of the Company’s Board of Commissioner (until the closing of the Company’s Annual General Meeting of Shareholders in 2009)
Resolution of the
Extraordinary General
Meeting of Shareholders
(September 19, 2008)
■ Total funds which be allocated is Rp. 3 Tr
■ The funds will be taken from un-appropriated retained earning as of December 31, 2007 (Rp. 22.2 Tr).
New Share Buyback
Program
(based on BAPEPAM Regulation)
■ Telkom and Indonusa Telemedia joined forces with PCCW to increase the business growth of Pay TV Services in Indonesia
● Available on 3 service delivery platform (broadband internet, Satellite TV and mobile content)
● Will service more than 230 million population of Indonesia
Bring world-class Pay
TV Services to
Indonesia

by djoko soesilo (IRCS)
Thank You
www.telkom-indonesia.com
Related Documents