Sponsored by the University of Colorado at Boulder, Leeds School of Business, and Compass Bank FORTY-THIRD ANNUAL COLORADO BUSINESS ECONOMIC OUTLOOK 2008

Welcome message from author
This document is posted to help you gain knowledge. Please leave a comment to let me know what you think about it! Share it to your friends and learn new things together.
Transcript

Sponsored by the University of Colorado at Boulder, Leeds School of Business,
and Compass Bank
F O R T Y - T H I R D A N N U A L
C OL OR A D OBUSINESS ECONOMIC
OUTLOOK2008

Price per copy: $75.00
Additional copies may be ordered from:
Business Research Division
University of Colorado at Boulder
420 UCB
Boulder, CO 80309-0420
303-492-8227
ISBN 0-89478-208-8
Copyright 2007 by the
Business Research Division
Leeds School of Business
University of Colorado at Boulder
Boulder, CO 80309-0420
Material contained within the accompanying tables is in the public domain and, with
appropriate credit, may be reproduced without permission. Please reference,
“Business Research Division, Leeds School of Business, University of Colorado at Boulder.”
Printed on recycled paper.

Introduction.............................................................................................................................................................. 2
Colorado Then and Now ........................................................................................................................................ 4
U.S. Economic Outlook............................................................................................................................................ 6
Colorado Economic Outlook .................................................................................................................................. 10
Colorado Labor Force and Employment................................................................................................................ 12
Agriculture.............................................................................................................................................. 14
Natural Resources and Mining ............................................................................................................ 18
Construction .......................................................................................................................................... 24
Manufacturing ...................................................................................................................................... 28
Trade, Transportation, and Utilities .................................................................................................... 33
Information............................................................................................................................................ 41
Financial Activities ................................................................................................................................ 49
Professional and Business Services ...................................................................................................... 58
Educational and Health Services .......................................................................................................... 64
Leisure and Hospitality.......................................................................................................................... 73
Other Services ........................................................................................................................................ 83
Government .......................................................................................................................................... 85
International Trade ................................................................................................................................ 89
Summary ................................................................................................................................................ 99
FromAround the State:Boulder County .................................................................................................................. 102La Plata County.................................................................................................................... 105Mesa County ........................................................................................................................ 107Northern Colorado.............................................................................................................. 108Pueblo County .................................................................................................................... 110Southern Colorado.............................................................................................................. 111
Appendix: North American Industry Classification SystemDescriptions and Concentrations.......................... 114
Steering Committee Members ................................................................................................................................ 116
Estimating Groups.................................................................................................................................................... 117
Business Research Division...................................................................................................................................... 121
Leeds School of Business: Services to Business and Industry.............................................................................. 123
Table of Contents

The Business Research Division (BRD)at the Leeds School of Business is
proud to present our 43rd annualColorado Business Economic Outlook. Thisyear’s outlook holds a special place in BRDhistory as it is the first forecast prepared inour new state-of-the-art home in theKoelbel Building. Just as funding for thebuilding was provided by a partnership ofstudents, private-sector donors, and theState of Colorado, we present the 2008Colorado Business Economic Outlook as aproduct of a similar partnership that relieson research conducted by our committeemembers from the public and private sec-tor, our research staff, and our students.
This forecast analyzes changes that havetaken place in all sectors of the economyduring the past year, and looks at theevents and activities that will shape thechanges in our population, employment,and overall economy for the coming year.The information in the book is presented
at the Forty-third AnnualOutlook Forum in Denver,as well as at 30 subsequentforecast speeches heldthroughout the state duringthe year to key industryorganizations, local andregional eocnomic development groups,and the Kansas City Federal Reserve Board.
MethodologyThe Colorado Business EconomicOutlook has evolved into a year-roundproject, with forecasts presented through-out the year and the BRD staff monitoringthe state and national economy on anongoing basis.
Preparation of the forecast and bookletbegins with a formal kickoff meeting inSeptember, when members from all esti-mating groups meet to discuss trends andissues that might affect economic growthduring the upcoming year.We are fortu-
nate to have more than 90 mem-bers from the business, education,and government communities whoserve on our estimating groups.During the second half ofSeptember and the month ofOctober, the 13 committees con-vene to apply this information totheir industry-specific issues. Fromthis series of meetings the sector
write-ups and forecasts are pre-pared and submitted to the BRDin early November, when they areedited and published in this book.In June of the following year, theSteering Committee, or sectorchairs, meets to review their fore-
casts and identify factors that may posi-tively or negatively drive change in theirindustry’s economic performance duringthe second half of the year. These updatesare published in the summer issue of ourquarterly newsletter, the Colorado BusinessReview.
The Colorado Business Economic Outlookis unique in that it provides forecasts andcommentary for each of the state’s NorthAmerican Industry Classification System(NAICS) sectors. This, along with the factthat the forecast is developed from a com-bination of detailed statistical analysis, ex-tensive survey research, and expert opinion,provides insight that is particularly rele-vant to the short-term forecasting process.
Related Economic ResearchThe BRD’s mission is to conduct quality,relevant, and meaningful business andeconomic research at the local, state, andregional level with the explicit purpose ofexpanding the knowledge base of decisionmakers. The annual Colorado BusinessEconomic Outlook provides the founda-
tion for much of the research the BRDconducts within the state.Within the pastfew years we have completed such projectsas a Roadmap for Colorado Nanotechnol-ogy, the Impact of the Federal Facilities onthe Denver Metro Area, and the Directoryand Industry Analysis of the ColoradoPhotonics Cluster.
Through a partnership with CompassBank, the BRD compiles the BusinessLeaders Confidence Index® (BLCI) forbusiness and government leaders whoneed quarterly up-to-date, relevant, andunderstandable information aboutColorado’s economic future. Since itsinception in early 2003, the index has cor-rectly tracked the concern of Coloradobusiness leaders about our entry into thewar in Iraq, improved confidence after theinitial phases of the war were completed,the improving strength of the Coloradoeconomy relative to the national economy,the recent impacts of hurricanes in theGulf Coast, housing, and the current eco-nomic slowdown. Additional informationabout participating on the panel andquarterly updates are available throughoutthe year at www.blci.com.
In addition, the BRD publishes theColorado Business Review (CBR) and con-ducts various contract research projects.The CBR highlights research conducted byBRD staff, Leeds School faculty, and key
2
2008 Colorado Business Economic Outlook
Introduction

business leaders. The CBR can be foundon the BRD web site: http://leeds.col-orado.edu/brd/.
AcknowledgmentsWe are humbled and gratified to have somany dedicated partners in the construc-tion of our new home, as well as the com-pilation of this forecast and the othercontract research conducted by our organ-ization. Additionally, if you have questionsabout the economic sectors or stateregions, we encourage you to contact theseindividuals. A complete list of contribu-tors appears at the back of this book. Andthe next time you are in Boulder, pleasestop by and see us in our new digs in theKoelbel building.
Finally, I would like to acknowledge thesupport of our primary sponsor, CompassBank, particularly Rafael Bustillo, DociaBaldridge, and Rene Meaux. In addition,I would like to recognize the hard workof the Leeds School of Business and Uni-versity of Colorado at Boulder personnelin preparing, presenting, and promotingthis project. My sincerest thanks go toGary Horvath,Managing Director; BrianLewandowski, Research Analyst; CindyDiPersio, Project Coordinator; Lynn Reed,Graphic Designer; KimWarner, ProjectManager; Terry Rosson, ProgramAssist-ant; and, Colin Hickey, Scott Vos, and
LukeWilloughby, Student ResearchAssistants, for their help in assembling andpresenting the 2008 Business EconomicOutlook Forum. The assistance providedby Greg Swenson and Dirk Martin, bothwith the Office of News Services, andDoug Nogami, Director of Communica-tions for the Leeds School of Business, isalso greatly appreciated.
Colorado Economic Forecastfor 2008The sections that follow provide a sum-mary of 2007, a forecast for 2008, andindustry specific data analysis and insightinto the key factors influencing each of thesectors.We trust this information willprove useful in your business and policydecision-making process.
Richard L.Wobbekind, Ph.D.Associate Dean of External Relationsand Executive Director
Business Research DivisionLeeds School of BusinessUniversity of Colorado at Boulderhttp://leeds.colorado.edu/brd
Compass Bank is pleasedto once again sponsor
the Business EconomicOutlook Forum.
Through the ongoing effortsof the Leeds School ofBusiness and the many committee mem-bers who share their industry experience,the Outlook Forum has been an invalu-able information source for 43 years.
Our Compass on Business partnershipwith the University of Colorado’s LeedsSchool of Business dates back to 2002and has allowed us to collaborate withthe Business Research Division on a vari-ety of initiatives aimed at helping localbusinesses monitor and respond tochanging economic trends.
One of these joint initiatives is theColorado Business Leaders ConfidenceIndex® (BLCI). The BLCI gathers opin-ions and experiences from business lead-ers across the state via input received in aquarterly online survey. The result is aglimpse into what business leaders andowners are expecting for the comingquarter.With the BLCI in its fifth year, wehave found that the survey participantscontinue to accurately predict keychanges in the economy.
We invite you to add your opinions toothers who are participating in the quar-
terly BLCI by joining online atwww.blci.com. Survey partici-pants are invited to access anexclusive BLCI Roundtable—an online community withlocal business and economicresources.
Compass Bank has a long-standing com-mitment to local businesses, and we arepleased to support the distribution of rel-evant information and importantinsights through our sponsorship of theOutlook Forum.
Thank you for your involvement in thisprogram and your support of the LeedsSchool of Business.
Rafael BustilloDenver PresidentCompass Bank
3
2008 Colorado Business Economic Outlook

1965 IBM opens
1958- Air ForceAcademy built in Colorado Springs
1954- NIST opens its doors in Boulder
1960- DenverBroncos football team created
1965- IBM opensfacility in Boulder
PercentageChange in
AnnualEmployment
1952 Rocky
1957- NORADbegins operations in Colorado Springs
1960-Colorado has 458,549skiers
1969- StorageTek founded in Louisville
1950- Yankeessweep Phillies in the World Series
1952- RockyFlats opens
skiers
1950 1955 1960 1965
1955- Merger of the AFL and the CIO
1965- Medicareestablished
1961- CubanMissile Crisis
1964- Civil RightsAct is passed
1956- PresidentEisenhower creates the Interstate system
In 1950 the population of the United States was about151 million, and approximately 1.3 million peopleresided in Colorado. The Dow Jones reached a monthlyhigh of 235, Colorado per capita personal income was$1,516, and the NewYork Yankees beat the PhiladelphiaPhillies 4-0 in theWorld Series. Since then, the U.S. popula-tion has grown to more than 300 million, and Colorado’spopulation is nearing 5 million. The Dow surged, passing14,000, and state per capita income has increased to almost$40,000. The United States has experienced periods of rela-tive peace, along with wars in Asia, the ColdWar, and nowthe war on terrorism. The state has endured floods anddroughts, economic booms and busts, as well as booms andbusts by its major sports teams.Most recently, fans of theColorado Rockies experienced the joy of sweeping our wayto theWorld Series, followed by the ticket sales fiasco andthe disappointing Fall Classic showing.
The adjacent timeline provides Colorado’s annual em-ployment changes expressed in percentages, along with aglimpse of some of the social, economic, educational, andpolitical changes that have occurred since 1950. These land-marks form the foundation for events that will affect oureconomy in the years ahead. Colorado events are listedabove the line, and national events are listed below.
The employment downturn in 2003 marked only thesixth time since 1939 (when records were first kept) thatColorado showed negative job growth. During this sameperiod, the United States recorded negative job growth on11 occasions.
This timeline emphasizes the importance of learning fromthe past. A historical perspective of earlier events can helpbusinesses make more effective decisions today and inthe future.�
Colorado Then and Now
4
2008 Colorado Business Economic Outlook

1970s- 1980s- Major population growth resulting in traffic problems and pollution 1990s- 2000s- LoDo is revitalized and technology booms and busts
Circa 1987-
1978- USOCheadquarters moves
1973- EisenhowerTunnel through
1993- Colorado Rockies come to town
2002- Stateexperiences negative job growth and
1999- Pepsi Center officially opens
Circa 1987-Peak of oil bust
to Colorado Springs
1987- S & Lcrisis involving Silverado
2007- Rockies sweep their way to first World Series
1995- DenverInternationalAirport opened
Tunnel throughContinental Divide
1977 NREL
2001- In March, economybegins to soften
j gbudget shortfalls
1992- TABORBill passed
1978- End of three-year drought
SilveradoSavings and Loan
2006- Employmentreaches pre-recession level of 20011977- NREL
startsoperations in Golden
1983- Colorado Advanced Technology
begins to soften
Circa 1998- SunMicrosystems and Level 3 Communicationscome to
Bill passed
2005-Referendum C passes
level of 2001
Advanced TechnologyInstitute created
come toBroomfield
p
1970 1975 1980 1985 1990 1995 2000 2005
1978 Ai li1973- OPEC oil
b
1986- Congress passes a comprehensive tax reform law
1999- Unemploymentat 4.2%, lowest level in 29 years
1971-NASDAQ
2003-War in I b i
2007-Subprimemortgage woes
1978- Airlinederegulation
1972- Dow-Jones passes1,000
embargo
1981- Birth of theIBM personalcomputer
tax reform law1993- NAFTApassed
2000- Dow Jones reaches all-time high of 11,722.98 and NASDAQ reaches 5,048
NASDAQopens 1987- Black
Friday stock market crash
Iraq beginswoes
2007-Dow passes 14,000 for the first time
5
2008 Colorado Business Economic Outlook

2008 Colorado Business Economic Outlook
66
The national economic outlook is critical to thefuture economic performance of Colorado.
Although the western states, including Colorado,have generally outperformed the national economyin recent years, strong linkages exist between whathappens regionally, nationally, and globally. This
U.S. Economic Outlook
section highlights the projected economic activityat the national level and lays the foundation for anexamination of the Colorado economy. A more in-depth discussion about global markets can befound in the International Trade section.
OutputIn 2008, real GDP is projected to increase at a rateof 2.4%, comparable to the annualized rate ofexpansion for the years 2000 through 2007. Saiddifferently, 2008 will mark the sixth time in the
Indicator 2003 2004 2005 2006 2007a 2008b
Gross Domestic ProductReal GDP (% change) 2.5% 3.6% 3.1% 2.9% 2.1% 2.4% Nominal GDP (% change) 4.7% 6.6% 6.4% 6.1% 4.7% 4.5%
ConsumptionReal Disposable Personal Income (% change) 2.2% 3.6% 1.7% 3.1% 3.4% 2.9% Real Personal Consumption (% change) 2.8% 3.6% 3.2% 3.1% 2.9% 2.4% National Consumer Confidence (December) 94.8 102.7 103.8 110.0 99.8c -Rocky Mountain Consumer Confidence (December) 105.1 121.4 114.4 127.8 130.7c -Consumer Credit ($ billions) $2,047.0 $2,191.3 $2,284.7 $2,388.5 $2,440.0 $2,525.0 Auto and Light Truck Sales (million units) 16.6 16.9 16.9 16.5 16.0 16.0 Retail Sales (% change) 4.2% 6.1% 6.6% 6.1% 6.5% 5.3%
InvestmentReal Business Investment (% change) 1.0% 5.8% 7.1% 6.6% 3.9% 4.2% Industrial Production (% change) 1.1% 2.5% 3.2% 4.0% 2.1% 2.7% Housing Starts (millions units) 1.85 1.95 2.07 1.81 1.39 1.15 Nominal Pre-Tax Profits (% change) 12.1% 24.0% 11.5% 13.2% 3.3% 3.6% Change in Business Inventories ($ billions) $14.3 $54.3 $133.3 $40.3 $7.8 $23.1
Government and ExportsReal Gov't. Consumption and Investment (% change) 2.5% 1.4% 0.7% 1.8% 1.8% 1.8% Real Net Exports ($ billions) -$519 -$594 -$618 -$624 -$580 -$540 aEstimated.bForecast.cSeptember 2007.
Sources: Consensus Forecasts, The Conference Board, Federal Reserve Board, Colorado Department of Local Affairs, Bureau of Labor Statistics, Bureau of Economic
Analysis, and Colorado Business Economic Outlook Committee.
GDP-RELATED NATIONAL ECONOMIC INDICATORS2003–2008

2008 Colorado Business Economic Outlook
7
past eight years that real GDP has grown below3%. By comparison, real GDP grew by an annual-ized rate of 3.1% for the period 1990 through 1999.
Even though growth is expected to remain belowpotential, the outlook for 2008 reflects an increasefrom the 2007 estimated rate of real growth, 2.1%.Real growth is projected to be in the 2.0% to 2.2%range during the first half of 2008, with improve-ment in the range of 2.6% to 2.8% expected in thesecond half.
The strongest deterrent to more robust GDPgrowth in 2008 is the continued fallout from thesubprime collapse and slumping housing markets.A review of the National Association of HomeBuilders Housing Market Index shows that themarket began to slowly decline in the fall of 2005.After reaching a high of 71 in June and August, theindex dropped to 57 by January 2006. At the time,this was not too disturbing because for most of thisdecade the index has moved between 47 and 71.
However, by the end of 2006 it had declined fur-ther, to 33. After an abbreviated uptick in early2007, the index plunged to 18 in October 2007.This sharp decline was accompanied by recordforeclosures, along with sharp decreases in housingprices, in many parts of the country.
The housing slump is not an overnight phenome-non; however, it only began to draw attention inlate 2006 and early 2007. At that time, it was
continued on page 8
Indicator 2003 2004 2005 2006 2007a 2008b
PricesConsumer Price Index (% change) 2.3% 2.7% 3.4% 3.2% 2.7% 2.3%Producer Prices (% change) 3.2% 3.6% 4.9% 2.9% 3.4% 2.0%Employment Costs (% change) 3.8% 3.7% 3.3% 3.1% 3.3% 3.3%
Money and Interest3-Month Constant Maturities (year-end rate) 0.9% 2.2% 4.0% 5.0% 4.1% 4.3%10-Year Constant Maturities (year-end rate) 4.2% 4.2% 4.4% 4.6% 4.7% 4.9%Fed Funds Rate (year-end) 1.00% 2.25% 4.25% 5.25% 4.50% 4.50%
Employment and PopulationPopulation (% change) 1.0% 0.9% 0.9% 0.9% 0.9% 0.9%Unemployment Rate 6.0% 5.5% 5.1% 4.6% 4.6% 4.9%Nonfarm Employment (% change) -0.3% 1.1% 1.7% 1.8% 1.3% 1.1%
Other IndicatorsCurrent Account ($ billions) -$522 -$640 -$755 -$811 -$780 -$755 Federal Budget Balance ($ billions for fiscal year) -$378 -$413 -$318 -$248 -$164 -$203 aEstimated.bForecast.
Sources: Consensus Forecasts, The Conference Board, Federal Reserve Board, Colorado Department of Local Affairs, Bureau of Labor Statistics,
Bureau of Economic Analysis, and Colorado Business Economic Outlook Committee.
NATIONAL ECONOMIC INDICATORS2003–2008

U.S. Economic Outlookcontinued from page 7
InvestmentBusiness investment accounts for about 16% ofGDP, but plays a critical role in income generationand future growth. The economy has experiencedstrong real business investment for the period2004-2006 as a result of strong profits, positive cashflows, and tax incentives. In 2007, corporate profitswill grow at a slower rate as a result of rising busi-ness costs and the slowing national economy. Realbusiness investment is projected to expand at a rateof about 4.2% in 2008.
This rate of investment in 2008 will result inmoderate growth in industrial production of 2.7%.Capacity utilization is expected to move down toits long-term average, which, in turn, lowers therisk of inflation. A sign of caution is evident inthe projected change in business inventories. Anincrease of only $7.8 billion is anticipated for 2007,followed by a more moderate increase of $23.1billion in 2008. The business inventory-to-salesratio is similar to the past two years, which suggeststhere may not be room for additional goods in theshort term, particularly given the forecast forbelow-potential growth.
After peaking at 2.07 million housing starts in2005, the housing market dropped abruptly, to 1.81million units, in 2006. The combination of thehousing slump, credit crunch, and subprime woeswill cause starts to plunge to 1.39 million in 2007and 1.15 million in 2008.
thought that the subprime loans and the housingslump would have a short-term impact on theeconomy. That impact has lasted longer and spilledover into more areas of the market than anyoneoriginally expected. At best, it appears that the ear-liest point at which the housing market will beginto turn around is the latter part of 2008.
In reaction to this situation, the FOMCmade a“bold” statement in September 2007 by loweringthe Fed Funds rate 50 basis points, to 4.75%. Thiswas followed by an additional cut of 25 basis pointsin October. As of November, there is no clear con-sensus regarding additional cuts in 2007 or 2008.
ConsumptionDuring the decade of the 2000s, the consumer hasbeen credited with sustaining economic growth ofthe economy. Personal consumption accounts forabout 70% of the GDP. Since 2001, personal con-sumption has been driven by a number of factors.Spending has been encouraged by accommodativemonetary and fiscal policies. Financial institutionshave reacted by providing consumers with a num-ber of creative financing programs.While this hasbenefited the economy in the short run, long-runfallout remains a concern.
Prior to 2007, these programs were supportedby a strong housing market in many parts of thecountry. Robust appreciation and solid gains inthe financial markets contributed to the increasedwealth effect of consumers. As a result, they re-mained confident, and consumption has remainedstrong through the third quarter of 2007.
The combination of the slump in the housing mar-ket, subprime woes, foreclosures, and volatility inthe financial markets will cause consumers to real-ize that the appreciation of their homes and stockportfolios is capable of moving in both directions,in some cases resulting in a negative wealth effect.Accordingly, consumers are likely to exercisegreater caution, and consumption will expandmore modestly, at 2.4%, in 2008.
At the time this publication was prepared inNovember 2007, nominal retail sales for 2008 areexpected to increase about 5.3%, the lowest rate ofgrowth since 2003. This decline will follow on theheels of a slower than normal 2007 holiday season,as projected by the National Retail Association.This slowdown will carry over into 2008 and intoother retail markets. Light truck and auto sales areprojected to remain flat, at 16.0 million. The automarket continues to remain sluggish as a functionof reduced demand brought about by the purchaseof autos through previous low-cost financing oremployee discount programs during the first halfof the decade.
Although e-commerce accounts for only 3.3% oftotal retail sales, annual sales are growing at a rateof about 20%. Increased high-speed access is a fac-tor contributing to this rise, as well as customers’confidence in ordering online.
Consumers are likely to exercise greatercaution, and consumption will expandmore modestly, at 2.4%, in 2008.
8
2008 Colorado Business Economic Outlook

Government Spending and Net ExportsReal government consumption and investmentaccount for about 19% of GDP, while net exportsaccount for approximately -5%. In 2004, the fed-eral budget deficit topped out at $413 billion.Improvements in the economy and higher tax rev-enues have resulted in deficits of $318 billion in2005 and $248 billion the following year. The 2007deficit will decline further, to $164 billion; however,with an imminent slowdown in economic activity,an increase is projected, to $203 billion, in 2008.The deficit will be driven higher by defense andhomeland security costs, as well as mounting costsassociated with healthcare and entitlement pro-grams. Real government consumption and invest-ment is projected to grow by 1.8% in 2007 and byroughly the same percentage in 2008.
During 2007, U.S. exports have benefited fromstrong global economic conditions, increasinglyfree and fair trade, and a continued decline in thetrade-weighted value of the dollar, which hasbumped up demand for U.S. products. This is par-ticularly good news because increased exports havehelped offset the adverse effects of the housingslump and the credit crunch.
At the time of this writing, the most current datashowed that U.S. exports had reached a record levelof $138 billion in August 2007.Major exportopportunities exist in parts of Asia Pacific, with the
strongest growth rates in China, Taiwan, and SouthKorea, although the trade balance with China is apolitically sensitive topic. High rates of growth arealso projected for Russia and select EasternEuropean countries. Some downside risk exists indoing business in these markets, however, givenconcerns about government stability and their abil-ity to sustain growth. The greatest area of concernis the key markets inWestern Europe, where manyeconomies have slowed.
The price for a barrel of oil and our foreign oil tabwill be a final factor that will play a major role inthe magnitude of the trade imbalance.Withoutmajor shocks to oil prices, net exports are expectedto drop to $580 billion in 2007, followed by a fur-ther decline to $540 billion in 2008.
PricesFear of inflation has been a driving force behindthe monetary policy of the Bernanke-led Fed.Inflation reached 3.4% in 2005 as measured by theCPI and has been on a steady decline since, drop-ping to 2.7% in 2007 and a projected 2.3% in 2008.Inflation will be kept in check by the lower costs ofhousing prices and the overall slow growth of theeconomy. Energy and fuel costs continue to influ-ence on the upside.
Producer prices, as measured by the Producer PriceIndex (PPI), have been most adversely impacted inrecent years by volatile energy prices. The projectedPPI growth rate for 2007 is 3.4%, with a lower rateof 2% projected for 2008.
Employment costs are projected to remain flat at3.3% through 2008. For the past couple of years,moderate employment growth has helped mini-mize upside wage pressures. This, in turn, hashelped offset increasing benefit and medical costs.Employment costs are likely to remain steady aslong as unemployment rates are in the range of thenatural rate of unemployment (4.5%–5.0%).
Population and EmploymentThe U.S. population is on track to grow at a rateof about 0.9%, or by approximately 3 millionpeople per year. In October 2006, the United Statessurpassed the 300 million population mark. The2008 U.S. population is projected to be roughly305 million.
Overall, the slow national economy will result inemployment growth of about 1.3% in 2007, fol-lowed by a slightly lower rate of 1.1% in 2008. As aresult of weak labor force growth in 2007, theunemployment rate dropped to 4.6%.With fewerjobs being added in 2008, the unemployment ratewill rise to 4.9%.�
Inflation will be kept in check by the lowercosts of housing prices and the overallslow growth of the economy.
9
2008 Colorado Business Economic Outlook

COMPONENTS OF COLORADO RESIDENT POPULATION1998–2008
(In Thousands)
Colorado Economic Outlook
Births Deaths Natural Net Population Totala
Year (Resident) (Resident) Increase Migration Change Population1998 57.7 26.3 31.4 75.1 106.6 4,102.51999 60.7 26.5 34.2 79.3 113.5 4,216.02000 63.9 27.0 36.9 73.5 110.4 4,326.42001 66.5 27.9 38.6 81.2 119.8 4,446.22002 67.8 28.8 38.9 34.9 73.8 4,520.02003 69.0 29.0 40.1 23.3 63.4 4,583.42004 68.5 29.0 39.4 26.8 66.3 4,649.72005 69.0 29.0 39.9 28.9 68.9 4,718.62006 69.4 29.2 40.2 54.8 95.0 4,813.5
2007b 70.6 29.4 41.2 55.3 96.5 4,910.0 2008c 71.0 29.7 41.3 62.5 103.8 5,013.8
aDue to rounding, the sum of the individual components may not equal the total.bEstimated.cForecast.Source: State Demography Office and Colorado Business Economic Outlook Committee.
2002 2003 2004 2005 2006Colorado
Real GDP ($ billions) 175.5 176.5 181.6 189.5 198.7Total Personal Income ($ billions) 153.1 154.8 163.8 175.8 188.2Per Capita Income ($) 34,014 34,059 35,621 37,702 39,587Employment (thousands) 2,184.2 2,152.8 2,179.6 2,226.0 2,278.8BLCI Expectations for State Economy (Q4) na 61.2 65.7 50.9 50.1
United StatesReal GDP ($ billions) 9,981.8 10,225.7 10,608.9 10,924.0 11,291.4Total Personal Income ($ billions) 8,872.9 9,150.3 9,711.3 10,284.4 10,966.8Per Capita Income ($) 30,795 31,466 33,072 34,685 36,629Employment (thousands) 130,341 129,999 131,435 133,703 136,174BLCI Expectations for National Economy (Q4) na 65.2 65.2 39.6 43.8
Colorado BLCI (www.blci.com).Sources: Bureau of Labor Statistics, Bureau of Economic Analysis, and Colorado Business Economic Outlook Committee,
2
STATE AND NATIONAL ECONOMIC COMPARISON2002–2006
PopulationIn 2008, approximately 103,800 people will beadded to the state population, bringing the total to
population and employment growth. Finally, the2006 per capita income registered $39,587, com-pared to $36,629 for the United States.
Colorado is a great place to live and work! Asa result, it has one of the country’s healthiest
and most highly educated populations and avibrant economy to match. This section high-lights some of the key state indicators that drivethe Colorado economy. Along with the data pro-vided about the national economy, this informa-tion further establishes the foundation for oursector-by-sector employment forecast. The para-graphs that follow briefly discuss Colorado’s out-put, income, population and employment growth,and inflation.
State GDP and IncomeDuring much of the 1990s, Colorado had arguablythe top performing state economy in the UnitedStates, driven by strong high-tech industry jobgrowth and net migration.While the state econ-omy has not regained the luster that it had prior tothe most recent recession, it is again recognized forits strong growth. The following rankings are themost current at the time of publication:
• Real State GDP Growth 10th
• Percentage Change in Personal Income 16th
• Percentage Change in Per Capita Income 33rd
• Value of Per Capita Income 9th
• Percentage Change in Employment 15th
• Percentage Change in Population 8th
Of note, the growth rate of Colorado’s real grossdomestic product was greater than the nationalrate in both 2005 and 2006. The rate of growthfor personal income was also greater than that forthe nation in both years, driven in part by solid
10
2008 Colorado Business Economic Outlook

approximately 5.0 million people. Colorado’s pop-ulation will increase at a rate of 2.1%, compared to0.9% nationally.
Colorado’s population is determined by changesin net migration and the natural increase. The lat-ter is the difference between resident births anddeaths and is directly related to the age and agestructure of the population. In 2008, a natural rateof increase of 41,300 is projected—71,000 birthsand 29,700 deaths.
For the period 1992–2001, about 70% of the changein population was a result of net migration.WhenColorado entered the 2001 recession, the percent-age reversed. Demands for jobs decreased and netmigration accounted for only 40% of change in thestate population for the 2002–05 period. Since 2006the percentages have reversed again and about 60%of the change in population is due to net migration.
InflationThe Denver-Boulder-Greeley CPI is the measure ofinflation that is most commonly used for the stateof Colorado.With the exception of 2003–05period, the Denver-Boulder-Greeley CPI has beenabove that of the nation since 1991. This trend isexpected to continue through 2008. The combina-tion of slower than anticipated appreciation inhousing prices and overall economic growth led tothe reversal in the trend in the above-mentionedthree-year period. Since then, Colorado consumershave faced significant increases in food, housing,medical care, and energy prices that have driventhe CPI to higher levels. The outlook for 2008 is forthe CPI to increase by 2.7%.
Business Leaders Confidence IndexThe Business Leaders Confidence Index® (BLCI) isa quarterly leading indicator series, published bythe Business Research Division in partnership withCompass Bank, that provides meaningful economicdata to the business community. The indicatormeasures expectations of Colorado business leadersvia an online survey and has accurately trackedchanges in economic performance relating tomajor
events such as the start of the IraqWar, the effectsof hurricane Katrina, and the current housingslump. The series has effectively forecasted therelationship between the performance of state andnational economies and is yet another indicatordemonstrating that the Colorado economy is out-performing the U.S. economy. Preliminary dataproject that this trend will continue into the firstpart of 2008.�
1998 163.0 1.6% 161.9 2.4%
1999 166.6 2.2 166.6 2.92000 172.2 3.4 173.2 4.0
2001 177.1 2.8 181.3 4.7
2002 179.9 1.6 184.8 1.9
2003 184.0 2.3 186.8 1.1
2004 188.9 2.7 187.0 0.1
2005 195.3 3.4 190.9 2.1
2006 201.6 3.2 197.7 3.62007b
207.1 2.7 203.4 2.9 2008c
211.8 2.3 208.9 2.7
aA Consumer Price Index (CPI-U) is not calculated for the state of Colorado.
This is the CPI-U for the Denver-Boulder-Greeley CMSA, often used as a
proxy for the inflation rate of Colorado (calculated semiannually).bEstimated.cForecast.
Source: Colorado Department of Labor and Employment, Bureau of Labor
Statistics; and Colorado Business Economic Outlook Committee.
C
U.S. C.P.IYearU.S. C.P.I
Rate
Denver-Boulder-
Greeley C.P.I
Denver-Boulder-Greeley C.P.I
Ratea
CONSUMER PRICE INDEX, U.S. AND DENVER-BOULDER-GREELEY(1982–1984=100)
11
2008 Colorado Business Economic Outlook
COLORADO RESIDENT LABOR FORCE2002–2008
(In Thousands)
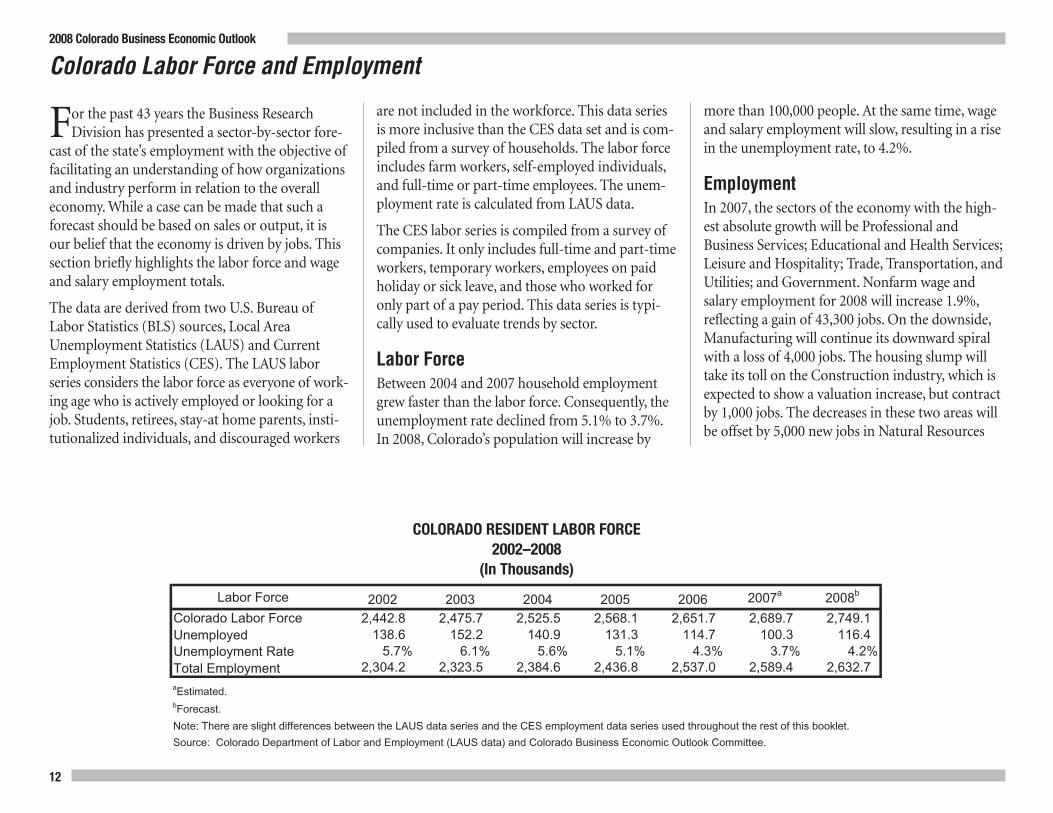
Labor Force 2002 2003 2004 2005 2006 2007a 2008b
Colorado Labor Force 2,442.8 2,475.7 2,525.5 2,568.1 2,651.7 2,689.7 2,749.1 Unemployed 138.6 152.2 140.9 131.3 114.7 100.3 116.4 Unemployment Rate 5.7% 6.1% 5.6% 5.1% 4.3% 3.7% 4.2%Total Employment 2,304.2 2,323.5 2,384.6 2,436.8 2,537.0 2,589.4 2,632.7
Source: Colorado Department of Labor and Employment (LAUS data) and Colorado Business Economic Outlook Committee.
aEstimated.bForecast.
Note: There are slight differences between the LAUS data series and the CES employment data series used throughout the rest of this booklet.
Colorado Labor Force and Employment
For the past 43 years the Business ResearchDivision has presented a sector-by-sector fore-
cast of the state’s employment with the objective offacilitating an understanding of how organizationsand industry perform in relation to the overalleconomy.While a case can be made that such aforecast should be based on sales or output, it isour belief that the economy is driven by jobs. Thissection briefly highlights the labor force and wageand salary employment totals.
The data are derived from two U.S. Bureau ofLabor Statistics (BLS) sources, Local AreaUnemployment Statistics (LAUS) and CurrentEmployment Statistics (CES). The LAUS laborseries considers the labor force as everyone of work-ing age who is actively employed or looking for ajob. Students, retirees, stay-at home parents, insti-tutionalized individuals, and discouraged workers
are not included in the workforce. This data seriesis more inclusive than the CES data set and is com-piled from a survey of households. The labor forceincludes farm workers, self-employed individuals,and full-time or part-time employees. The unem-ployment rate is calculated from LAUS data.
The CES labor series is compiled from a survey ofcompanies. It only includes full-time and part-timeworkers, temporary workers, employees on paidholiday or sick leave, and those who worked foronly part of a pay period. This data series is typi-cally used to evaluate trends by sector.
Labor ForceBetween 2004 and 2007 household employmentgrew faster than the labor force. Consequently, theunemployment rate declined from 5.1% to 3.7%.In 2008, Colorado’s population will increase by
more than 100,000 people. At the same time, wageand salary employment will slow, resulting in a risein the unemployment rate, to 4.2%.
EmploymentIn 2007, the sectors of the economy with the high-est absolute growth will be Professional andBusiness Services; Educational and Health Services;Leisure and Hospitality; Trade, Transportation, andUtilities; and Government. Nonfarm wage andsalary employment for 2008 will increase 1.9%,reflecting a gain of 43,300 jobs. On the downside,Manufacturing will continue its downward spiralwith a loss of 4,000 jobs. The housing slump willtake its toll on the Construction industry, which isexpected to show a valuation increase, but contractby 1,000 jobs. The decreases in these two areas willbe offset by 5,000 new jobs in Natural Resources
12
2008 Colorado Business Economic Outlook

Sector 1998 1999 2000 2001 2002 2003 2004 2005 2006 2007a 2008b
Natural Resources and Mining 13.4 12.3 12.2 12.9 12.9 13.2 14.4 17.2 20.8 24.8 29.8Construction 134.6 148.5 163.6 167.7 160.4 149.9 151.3 160.0 167.7 165.5 164.5 Manufacturing 191.4 187.4 188.9 179.5 163.8 153.9 151.8 150.4 149.1 144.7 140.7 Trade, Transportation, and Utilities 392.4 404.9 418.9 423.0 412.1 404.5 406.6 413.0 419.5 430.6 436.0 Information 86.4 97.0 108.4 107.3 92.9 84.6 81.2 76.9 75.6 75.7 76.6Financial Activities 142.8 147.4 147.0 148.3 149.5 154.1 154.6 158.5 160.7 161.9 162.3 Professional and Business Services 283.1 302.4 318.8 312.3 296.2 292.0 304.1 316.8 331.8 350.8 366.3 Educational and Health Services 182.9 186.9 192.8 200.8 208.5 213.0 218.5 224.6 230.9 240.0 248.0 Leisure and Hospitality 231.0 238.5 246.0 247.2 247.0 245.6 251.3 257.5 265.0 273.5 279.5 Other Services 77.3 79.0 80.2 83.8 85.6 85.9 87.4 88.5 90.9 92.9 94.9Government 322.3 328.4 337.0 344.1 355.4 356.2 358.5 362.6 367.3 374.0 379.1
Totalc,d 2,057.6 2,132.6 2,213.8 2,226.9 2,184.2 2,152.8 2,179.6 2,226.0 2,279.3 2,334.4 2,377.7aEstimated.bForecast.cNonagricultural self-employed, unpaid family workers, and domestics are excluded from the total.dDue to rounding, the sum of the individual sectors may not equal the total.
Source: Colorado Department of Labor and Employment (CES Data) and Colorado Business Economic Outlook Committee.
COLORADO NONAGRICULTURAL WAGE AND SALARY EMPLOYMENT1998–2008
(In Thousands)
andMining. As a result, job growth for the goods-producing sectors will remain flat in 2008, whilethe service-producing sectors will be strong, adding43,300 jobs.
If the 2008 projections hold true, state employmentwill have added 43,000–55,000 jobs in each of thelast four years.While this growth is slower thanthat of the 1990s, this moderate, yet consistent levelof growth is more manageable from both a fiscaland a structural perspective.
As the structure of the economy has evolved overthe past decade, there are concerns that the high-paying primary jobs that have been lost are beingreplaced by lower-paying jobs that do not use theskills and talents of Colorado’s workforce. From afiscal standpoint, this has numerous ramificationsfor the state and local governments. A simplisticanalysis of projected wages based on this forecastsuggests that these worries may be justified, basedon the projected composition of jobs that will beadded in 2008. In other words, it appears that totalwages for higher-paying sectors will be offset by
more rapid growth in total wages for lower-payingpositions.
A strong economy is a diverse economy that pro-vides job opportunities for people with varyingskill sets and backgrounds.Moreover, a resilienteconomy is driven by high-paying primary jobswith a higher than average multiplier effect. Theyear 2008 will be interesting, not only for thenumber of jobs added, but the sectors in whichthey are added.�
13
2008 Colorado Business Economic Outlook

Agriculture2008 Colorado Business Economic Outlook
14
Record Cash Receipts Not Translating toBottom Line for Agriculture
Looking back, 2007 will be remembered as thefirst time in many years that the agriculture
industry posted generally good showings across allsectors, with cash receipts from production andgovernment payments projected to increase morethan 7%, to a record $6.3 billion, with an addi-tional $790 million from services and forestry. Itwill also be remembered for the blizzards thatbrought much of the state, particularly southeastColorado, to a standstill and caused the death of anestimated 15,000 head of cattle. Nonetheless, asdevastating as these storms were to the livestocksector, the heavy snows provided the region withmuch-needed moisture that helped produceColorado’s largest wheat crop since the late 1990s.
Driven by record cash receipts from farm andranch marketings, net farm income for 2007 isexpected to increase to $771 million, about 5%more than 2006. Farmers and ranchers alsoincurred sharply higher feed, fuel, and fertilizercosts in 2007. Additionally, higher market prices forwheat and corn were partially offset by decreases ingovernment commodity program payments. Evenso, total farm program payments will remain rela-tively constant as payments to producers for con-servation programs increase. Look for net farmincome to rise in 2008, to $843 million.
The state’s ethanol industry will continue toimpact, both directly and indirectly, the net farmincomes of Colorado’s farmers and ranchers in2008. In general, the ethanol industry is currently
pushing against blend capacity limits, exertingdownward pressure on ethanol prices in the nearterm. Still, Colorado’s three large-scale ethanolplants will use an estimated 45 million bushels ofcorn in 2008—or about 30% of Colorado’s totalcorn production—to produce 130 million gallonsof ethanol. At that level, ethanol produced inColorado will displace more than three millionbarrels of imported oil a year. Less shifting ofacreage to corn production will occur in 2008 asmarket prices for all crops are expected to remainat generally high levels. Nevertheless, generally highcorn prices translate to increased profitability forfarmers and higher feed costs for livestock anddairy producers, keeping the corn and ethanolindustries squarely in the middle of the food-or-fuel debate.
Looking ahead to 2008, the agriculture industryis also facing uncertainty relating to water rightsand seasonal workers. Ongoing deliberations rela-tive to Colorado’s, and particularly agriculture’s,rights to waters in the South Platte and Republicanriver basins present considerable concern for pro-ducers who depend on those waters for irrigation.Additionally, shortages of seasonal workers areincreasingly having a negative impact onColorado’s more labor-intensive sectors (i.e., fruit,vegetable, and green industries). The federallysponsored H2A visa program has proven anadministrative quagmire, as well as a costly andunpredictable option, for producers seeking sea-sonal workers.
The livestock sector has historically been, and willcontinue to be, Colorado’s largest agricultural
sector, representing nearly two-thirds to three-quarters of all farm gate sales. Total livestock salesfor 2007 will fall, to $3.9 billion, and are expectedto decline further, to $3.8 billion, in 2008. Cashreceipts from livestock sales will drop below the$4 billion level in 2007 for the first time since 2003.The decrease is due primarily to fewer cattle beingmarketed, coupled with slightly lower prices, thanin recent years. The decline in cattle numbers is animportant concern for Colorado agriculture in thatcattle feeding is a major source of wealth creation.While Swift has attracted an international buyer forits beef operations, the reduced fed cattle numbersand imports of Canadian fed cattle create a con-cern for the long-term economic profitability ofColorado slaughter and processing facilities.Profitability problems in the beef packing industrycan only have a large negative impact on cattle pro-ducing, feed growing, and the agriculture economyin the state.Most of the livestock industry, how-ever, should experience favorable market condi-tions in 2008.
Within the livestock sector, cash receipts fromcattle and calves for 2007 are projected to declineabout 10%, to $3 billion, for 2007. Cash receiptswill continue to slip into 2008, stemming from asmaller calf crop in 2007 and fewer feeder cattlebeing imported for finishing in Colorado feedlots.Fed cattle prices are expected to remain strong in2008, at about $104 per 100 pounds, but marginswill continue to be squeezed by high corn andfeedstuff costs. Between 80 and 100 million bushelsof corn are used annually as feed for Colorado’scattle industry, so even small movements in corn

2008 Colorado Business Economic Outlook
15
Higher prices for feeder and slaughter lambs havehelped offset a roughly 2% decrease in lamb pro-duction during 2007. For the year, lamb prices havebeen as much as 10% higher than during 2006.Going into 2008, production is expected todecrease only marginally, with market pricesremaining steady to slightly higher. Sales of wooland lambs will total approximately $128 million in2008. Hog production and hog prices have experi-enced some gains nationally during 2007. However,with poultry continuing to make steady market
prices have a significant impact on the overall prof-itability of Colorado’s livestock sector.
Drought conditions in the southeast United Stateshave also thrown an interesting twist into the cattleand calves market. The U.S. industry should be inthe middle of an expansion phase, with more beefcattle in the herd in 2007 compared to 2006, andmore calves coming in the future. This expansionwould tend to moderate the high cattle prices seenfor the past five years but the drought in the south-east is expected to delay the industry expansion atleast one more year.
Dairy is becoming an increasingly important partof Colorado’s agricultural economy. Cash receiptsfrom dairy products are projected to be record-high for 2007, at more than $420 million, inresponse to highest-ever high milk prices that haveaveraged near $18 per 100 pounds. In particular,Colorado is experiencing significant growth inorganic dairy production, which, in turn, is helpingto drive organic hay and grain production. For2008, dairy cattle numbers are expected to climb byapproximately 3%, to about 118,000 head, withdairy prices weakening by as much as 10%, puttingthe value of statewide production at $390 million.
VALUE ADDED BY AGRICULTURAL SECTOR, COLORADO1999–2008
(In Millions of Dollars)
1999 $3,015.8 $1,341.8 $4,357.6 $578.7 $374.2 $5,310.5 $4,362.0 $948.52000 3,325.3 1,229.2 4,554.5 537.9 351.4 5,443.8 4,683.5 760.32001 3,303.5 1,417.9 4,721.4 584.3 320.1 5,625.8 4,366.6 1,259.22002 3,208.1 1,319.4 4,527.5 679.5 211.0 5,418.0 4,706.3 711.72003 3,445.8 1,442.7 4,888.5 643.6 319.9 5,852.0 4,871.4 980.62004 4,279.8 1,381.1 5,660.9 647.8 221.2 6,529.9 5,177.3 1,352.62005 4,126.1 1,477.6 5,603.7 736.1 382.0 6,721.8 5,416.9 1,304.92006 4,120.5 1,527.9 5,648.4 769.7 244.6 6,662.7 5,928.8 733.9
2007c 3,901.0 2,165.0 6,066.0 790.0 240.0 7,096.0 6,325.0 771.0
2008d 3,777.0 1,966.0 5,743.0 810.0 290.0 6,843.0 6,000.0 843.0
aIncludes sales of forest products, custom feeding fees, custom harvest fees, and other farm income.bIncludes farm program payments directly to producers.cEstimated.dForecast.
Source: Colorado Business Economic Outlook Agricultural Committee.
Net Farm Income
( )
Year Livestock CropsTotal Value of
Production
Value ofServices and
Forestrya
Government
PaymentsbGross Value of Farm Revenue
Total Farm Production Expenses
continued on page 16

Agriculturecontinued from page 15
In 2007, wheat producers, after multipleyears of drought, harvested one of thestate’s largest wheat crops since thelate ’90s.
Hay remains Colorado’s largest crop in terms ofvalue ($634 million in 2007), but due to on-farmuse, actual cash receipts are estimated at aboutone-half of that value. Production in 2007 willapproach 4.7 million tons and average $140 perton. Looking ahead to 2008, hay producers willcontinue to benefit from increasing demand fororganic hay arising from Colorado’s growingorganic dairy industry, as well as demand for hayfor supplemental feeding by livestock owners innearby states. Prices for hay are expected to remainstrong in 2008, at about $135 per ton, with totalcash receipts coming in at $318 million. Alfalfaproduction uses an estimated 30% of all water usedfor irrigation in Colorado and as such, producersare facing pressures to curb water use, much likecorn and potato producers.
Potato production in 2007 is estimated at 21.5 mil-lion hundredweight—roughly 10% below the 2006production level, with the decline largely due tolower yields stemming from frost damage in theSan Luis Valley and the continuing loss of acreage innorthern Colorado.With prices in 2007 expected tobe in the $8.00 per hundredweight range (4% lowerthan in 2006), cash receipts from the sale of pota-toes are expected to fall to $174 million. Prices arelikely to be slightly lower, but remain in the $8 perhundredweight range for 2008 and with produc-tion forecast at 23 million hundredweight, cashreceipts will total $167 million.
Colorado’s greenhouse and nursery industry willcontinue to expand in the near term but at a slowerrate due to the drop-off in new home construction.Since the early 1990s this industry has been one of
bushel, will yield 2007 cash receipts at an estimated$450 million, more than a 50% increase from 2006.Acreage in 2008 will remain relatively stable com-pared to 2007 when significant acreage shiftedfrom other crops to corn; however, producers willface considerable pressure to reduce irrigated acresin the face of tightening water restrictions. Drylandyields are anticipated to decrease slightly but withprices staying in the $3.40 to $3.50 per bushelvicinity, cash receipts for 2008 are projected atnearly $500 million.
Most Colorado agriculture program paymentshave historically been received by crop producers,especially wheat and corn producers. Due to highermarket prices, those specific price support pay-ments will be greatly reduced, if not eliminated,but payments for conservation programs areexpected to increase. Overall, government programpayments to Colorado producers are estimated at$240 million for 2007 and $290 million for 2008.The 2008 level is projected to increase, due in partto livestock disaster payments, but will still be 24%less than the $382 million in payments received byColorado producers as recently as 2005.
gains, there is little or no expectation of an increasein hog prices in 2008. Concerns for animal welfarehave significantly slowed, and in many instances,curtailed the expansion of confinement productionfacilities. Cash receipts from sales of hogs in 2008are expected to be on par with 2007, at about $189million. Egg production and prices will remainsteady and even rise slightly, with poultry and eggreceipts for 2008 projected at $120 million. Similarto the hog industry, egg producers are also con-fronted with animal welfare concerns relating tocage sizes.
In 2007, wheat producers, after multiple years ofdrought, harvested one of the state’s largest wheatcrops since the late ’90s, at an estimated 95 millionbushels. Additionally, due to low global wheatstocks and poor growing conditions in otherwheat-producing states and countries, Colorado’swheat producers were able to cash-in on record-high prices averaging $6.50 per bushel.With suchhigh market prices, producers will sell an estimated80% of this year’s wheat crop in the ’07 calendaryear, pushing cash receipts to an estimated $577million—more than three times the 2006 level of$184 million.When an average crop is achieved,producers traditionally market about half theircrop in the same year that it was harvested. As aresult, significantly less ’07 crop will be marketed in2008. This fact, coupled with lower yields andprices in the $4.50 per bushel range, will lower cashreceipts for 2008 to an estimated $330 million.
Corn production is expected to rise by more than15% in 2007, to 157 million bushels. Higher pro-duction levels, with average prices of $3.45 per
16
2008 Colorado Business Economic Outlook

trend is for continuing growth in the industry asgrape acres continue to expand to supply the state’sgrowing wine industry.
Colorado’s agriculture industry remains verydiverse and its profitability is subject to influencesbeyond the state’s borders. The opening and/orclosing of export markets, global economic growth,and agricultural trade and policy decisions are justa few of the factors that have the potential toimpact Colorado agriculture, both positively andnegatively. Agricultural policy for much of 2007has focused on developing a new federal farm billthat will direct significant resources to research andpromotion of Colorado’s $600 million specialtycrops industry for the first time. Nonetheless, thefate of Colorado’s agricultural complex will dependlargely on local growing conditions, with the onlyconstant being that every year will bring its ownunique set of challenges and opportunities.�
sorghum production more attractive. Cash receiptswill increase in 2008, with barley reaching $28 mil-lion and sorghum $17 million.
Colorado’s vegetable crops including cabbage, can-taloupe, lettuce, onions, and sweet corn are alsoexpected to continue to do well in 2008, providedthat the shortage of seasonal workers experiencedin 2007 can be mitigated. Producers of these cropscontinue to develop innovative marketing pro-grams with Colorado’s retailers, and benefit fromColorado’s expanding network of farmers marketsand consumer preferences to “buy local.” Sales ofthese crops are estimated at $100 million annually.Expect dry bean production to continue to slideas some acres are shifted to sunflower productionin southwest Colorado. Similarly, production ofsugar beets in both 2007 and 2008 will fall as pro-ducers confront increasing irrigation constraints.Although fruit production declined in 2007 due toearly season frosts that reduced yields, the overall
Colorado’s fastest-growing sectors, driven by growthin the turf grass and nursery segments. Still, cashreceipts will grow 1%–2% annually in both 2007and 2008, putting cash receipts at $320 million.
Sunflower production is estimated at 144 millionpounds in 2007 and is climbing after falling bynearly 60% from 2005 to 2006. Demand for sun-flower oil is currently strong because of its healthyattributes. Acreage is also increasing in southwestColorado in order to supply a new crushing andbiofuels facility scheduled to become operationalin 2008.With prices in the range of 15 to 17 centsper pound, production is forecast to increase to150 million pounds in 2008, with cash receiptspegged at $25 million.
Production of both barley and sorghum rose sig-nificantly in 2007, with barley climbing 50% andsorghummore than doubling. Key drivers to thesegains were increased market premiums for maltingquality barley and higher feed prices, making
17
2008 Colorado Business Economic Outlook

2008 Colorado Business Economic Outlook
18
Natural Resources and Mining
Colorado is an energy- and mineral-rich state.The U.S. Energy Information Agency (EIA)
annually publishes a list of the top 100 natural gasand oil fields in the country. Colorado is home toall, or part of, seven of the largest natural gas fieldsin the nation and two of the largest oil fields. Thestate is one of the nation’s largest coal producers,and the Henderson Mine is North America’s largestproducer of primary molybdenum.
Revenues generated by this supersector make it oneof the most significant contributors to Colorado’sGDP. Indications are that growth in productionand value will continue in the near term.
Oil, Gas, and Carbon DioxideColorado and the Rocky Mountain region con-tinue to experience a boom in the petroleum sec-tor, which is expected to extend through 2008.However, petroleummarkets are anticipated toundergo greater volatility in commodity prices forthe next year or two. The combination of pricevolatility, growing demand, tighter supplies, andinsufficient take-away capacity in the region mayadversely impact many business sectors in the state.
The total value of oil, gas, and carbon dioxide pro-duction in 2006 was $8.4 billion, a 14.2% decreasefrom the 2005 value of $9.7 billion. This drop in
the realized value of production in Coloradoresulted from a significant decline in natural gasprices. The value of oil, gas, and carbon dioxideproduction for 2007 is expected to fall an addi-tional 2.6%, to $8.1 billion, because of the excesssupply of natural gas in the region. Despite thesedecreases, total valuation is four times greater thanit was six years ago. The value of oil, gas, and car-bon dioxide production is forecast at $8.7 billion in2008, assuming modest production growth, areturn to more stable natural gas prices, and anincreased take-away capacity resulting from com-pletion of the Rockies Express Pipeline.
Year Crude Natural Carbon Percentage Percentage PercentageOil Gas Dioxide Subtotal Change Coal Minerals Subtotal Change Total Change
1999 $338 $1,567 $85 $1,990 16.1% $359 $557 $916 -13.0% $2,906 5.0%2000 560 2,825 99 3,484 75.1 437 597 1,034 12.8 4,518 55.52001 479 3,155 122 3,756 7.8 502 540 1,042 0.8 4,798 6.22002 480 2,220 62 2,762 -26.5 616 629 1,245 19.5 4,007 -16.52003 610 4,555 99 5,264 90.6 703 702 1,405 12.9 6,670 66.42004 865 5,897 130 6,892 30.9 796 951 1,747 24.3 8,639 29.52005 1,235 8,264 242 9,741 41.3 813 1,789 2,602 48.9 12,343 42.92006 1,405 6,667 291 8,363 -14.2 974 1,762 2,736 5.1 11,099 -10.1
2007a 1,528 6,321 300 8,148 -2.6 947 1,961 2,908 6.3 11,056 -0.4 2008b
1,659 6,701 308 8,668 6.4 932 2,039 2,971 2.2 11,639 5.3
bForecast.
Source: Colorado Geological Survey Mineral and Mineral Fuel Activity Reports, Colorado Oil and Gas Conservation Commission, Department of
Minerals and Geology, and Colorado Business Economic Outlook Committee.
Oil and Gas Extraction Mining
V
aEstimated.
VALUE OF COLORADO NATURAL RESOURCES AND MINING1999–2008
(In Millions of Dollars)
2008 Colorado Business Economic Outlook
19
continued on page 20
Although 2007 oil prices have recently peaked atover $90 per barrel, EIA projects that monthlyaverage oil prices nationally will remain in the$70–$80 per barrel range through 2008. Continuedlow surplus production capacity, weak petroleuminventories, and strong demand worldwide, par-ticularly from the United States and China, arecontributing factors to this comparatively highforecasted price. The Colorado Oil and GasConservation Commission reports that oil pricesin Colorado averaged $60 per barrel for the firstthree quarters of 2007, continuing the pricing trendfrom 2006. The average oil price for Colorado isexpected to be $65 per barrel by year-end and com-pete favorably with the national average of $70+per barrel through 2008.
The Commerce City refinery will increasingly beprocessing oil from the Canadian oil sands.Whatimpact this might have on price and volume forColorado producers is currently unknown.
EIA reports that the Colorado average retail priceof automotive gasoline has fallen from its May2007 high of $3.31 per gallon to $2.75 per gallonin early October, which is about $0.50 per gallonhigher than a year ago. The average price of gaso-line for the first 10 months of 2007 is $2.75 pergallon, $0.12 per gallon higher than the averageof $2.63 for the same period in 2006. Prices for theremainder of 2007 are expected to increase over$3.00 per gallon in response to recent peaks in theoil price. Gasoline prices should moderate some-what by January 2008 before rising again in thesummer. Colorado prices do not respond asquickly as the national price corrections primarily
because of a lack of local refining capacity. Localprices will continue to vary seasonally as a result ofmandated fuel requirements.
Nationwide, about 58% of all households dependon natural gas as their primary heating fuel; thisnumber is nearly 80% for the Midwest. EIA pre-dicts that the average household using natural gasfor heating can expect to pay 10%more in thewinter of 2007-08 than the previous winter. TheColorado Oil and Gas Conservation Commissionreports that natural gas prices in Colorado averaged$5.11 per thousand cubic feet (Mcf) for the first10 months of 2007. This is down from the $6.06per Mcf average for the same period in 2006. TheOctober 2007 price in Colorado fell to $3.21 perMcf, which is less than half of the benchmark pricefor natural gas in the nation (that is, the HenryHub price). This substantial differential in gas priceresults from the lack of adequate pipeline capacityto move Rockies gas to eastern markets. Naturalgas prices in Colorado are expected to remainabout $5.00 per Mcf for the 2007 and 2008 calen-dar years as pipeline capacity is fully developed.
As the growth in natural gas supply shifts to newsources, the Rocky Mountains are emerging as oneof the nation’s key regions. The limiting factor inexporting natural gas from Colorado, as well asother Rocky Mountain basins, is the lack of suffi-cient pipeline capacity. The Rockies exported 6.3billion cubic feet (Bcf) per day of natural gas in2004, and pipeline exports are forecast to increaseto 9.3 Bcf per day by 2009 and 10.7 by 2014. If real-ized, this export capacity would correspond to anunprecedented 70% growth in a decade. Rockies
Express Pipeline LLC is a $4.4 billion joint ventureproject between Kinder Morgan Energy Partners,Sempra Pipelines and Storage, and ConocoPhillips.Representing one of the largest natural gaspipelines envisioned for North America, the1,678-mile pipeline will have a capacity of approxi-mately 1.8 Bcf per day when completed and willlink production from Colorado and other RockyMountain-producing states with midwestern andnortheastern U.S. markets.
Beginning in gas-rich Colorado, the first 328-milesegment of the Rockies Express Pipeline runs fromthe Meeker Hub in Rio Blanco County, Colorado,to theWamsutter Hub in Sweetwater County,Wyoming, and continues on to the Cheyenne HubinWeld County, Colorado. This segment is in serv-ice and currently has a capacity of 500 billionBritish thermal units per day. Federal approval toextend the Rockies Express Pipeline from theCheyenne Hub to an interconnection located inAudrain County,Missouri, was received mid-April2007 for an in-service target date of January 1,2008. Subject to regulatory approval for the finalsegment connecting Audrain County withClarington, Ohio, interim pipeline service couldcommence as early as December 2008 and be fullyoperational by June 2009.
The Colorado Oil and Gas ConservationCommission reports that 5,904 drilling permitswere approved in 2006, representing a nearly 35%increase over the 4,363 permits approved the previ-ous year. The commission has already approved4,680 permits in the first three quarters of 2007

and expects to finish the year with 6,160 total per-mits approved, or a 4.3% increase over 2006. If thisactivity level continues, it is likely that about 6,500permits will be processed in 2008, assuming oil andgas prices remain strong and the state economycontinues to expand.
The weekly rig count in Colorado has exceeded 100since the beginning of the year, running between115 and 127 since early April 2007. This is in con-trast to 2006 during which time the weekly rigcount remained below 100 until December. Theresult of this intense drilling program is the highestactive well count ever reported for Colorado. The
Colorado Oil and Gas Conservation Commissionreports 33,319 active wells as of early October2007.Well operations and their associated support-ing infrastructure create high-paying jobs, whichare drawing labor away from other business sectorsin Colorado.
The accelerated pace of energy development inColorado brings into sharp focus the need toreview, and in some cases revise, the guidelines thestate and federal governments use to preserve andprotect its public lands. In 2007, the Kremmling(Jackson, Grand, and Summit counties) andGlenwood Springs (Garfield, Eagle, and Pitkin
counties) field offices of the Colorado Bureau ofLandManagement (BLM) started developing aresource management plan (RMP) for all the fed-eral surface and mineral estates managed by theirrespective field office areas. As part of the RMPrevision process, the field offices are preparing anenvironmental impact statement (EIS) to analyzethe impacts of the plan’s decisions. The affectedlands are currently being managed according to theRMP plans that were developed in 1984; however,land use in Colorado has changed a great deal inthe last 20+ years.
2008 Colorado Business Economic Outlook
20
Natural Resources and Miningcontinued from page 19
Coal Crude Crude Oil Natural Natural Gas Carbon Carbon DioxideCoal (Millions of Oil (Millions of Gas (Billions of Dioxide (Billions of
Year Index Short Tons) Index Barrels) Index Cubic Feet) Index Cubic Feet)1998 100.0 29.6 100.0 22.4 100.0 696.3 100.0 367.71999 101.4 30.0 87.1 19.5 103.2 718.6 82.8 304.62000 98.3 29.1 87.9 19.7 110.3 767.6 84.5 310.72001 112.8 33.4 89.3 20.0 116.5 811.1 82.8 304.42002 118.6 35.2 91.1 20.4 131.8 917.5 80.3 295.12003 120.9 35.8 95.5 21.4 144.1 1,003.4 83.8 308.22004 134.5 39.8 99.6 22.3 152.9 1,064.5 93.0 341.82005 127.7 37.8 102.2 22.9 160.6 1,118.3 98.3 361.52006 119.6 35.4 104.0 23.3 171.3 1,192.6 101.4 372.8
2007a 124.7 36.9 104.9 23.5 181.6 1,264.2 104.4 384.02008b 126.0 37.3 105.8 23.7 192.5 1,340.1 107.6 395.5
aEstimated.bForecast.
Source: Colorado Geological Survey Mineral and Minerals Fuel Activity Reports, Colorado Oil and Gas Conservation Commission, Department of
Minerals and Geology, and Colorado Business Economic Outlook Committee.
PHYSICAL OUTPUT OF FOSSIL FUELS1998–2008
(Base Year: 1998=100)

2008 Colorado Business Economic Outlook
21
continued on page 22
quarters of 2007, a 3% increase compared to thesame period the prior year. Thus, Colorado ranksas the seventh-most productive coal mining statein 2007, just ahead of Illinois and Indiana. TheColorado Geological Survey estimates that totalcoal production for the year will be 36.9 millionshort tons, the third-best year on record. Ten coalmines operate in eight Colorado counties. In 2006,Delta was the state’s top coal-producing county,with 9.2 million tons mined from the Bowie #3 andElk Creek Mines. No significant mining difficultiesor delays affected coal mining in 2007.
EIA tracks national spot coal prices by region. Theaverage spot price for Colorado coal has decreasedfrom a high of $37 per ton in May 2006 to just over$25 per ton in June 2007. Although most coal soldin the state has a long-term fixed-price contract, thespot price sets the tone for what short-term con-tracts yield. The average federal mineral lease rateranged from $25.60 to $27.44 per ton of Coloradocoal in 2006. The value of Colorado’s coal produc-tion that same year was $974 million. Despiteincreased coal production in 2007, the figure foryear-end is projected to be slightly lower in value,$947 million, due to a small decrease in coal price.
Increased demand for Colorado’s compliance coal isreflected in higher employment figures. As of June2007, a total of 2,121 coal miners were working atthe state’s 10 coal mines, the highest number of coalminers employed in Colorado since 1986. Thisincrease of 61 miners is 3%more than the previousyear, continuing a decade-long upward trend.
In February 2007, the Little Snake Field Office inMoffat, Routt, and Rio Blanco counties released adraft of their revised RMP and EIS for public com-ment. The plan provides a framework to guide sub-sequent management decisions on approximately1.3 million surface acres and 1.9 million subsurfaceacres in northwestern Colorado. The plan covers allaspects of BLM land and mineral management,including energy development, resource protec-tion, travel management, wildlife habitat, specialdesignations, grazing, and realty actions.
After nearly seven years of effort developing a RMPfor the Roan Plateau, the BLM issued the first oftwo Records of Decision in June 2007. This firstdecision, which covers about 70% of the 73,602acres in the Roan Plateau planning area, providescritical protections for fish and wildlife habitat,plants, special places, viewsheds, and traditionalrecreation and other uses of the plateau. The deci-sion also allows for very restricted and limitedenergy development that would require using thelatest directional drilling techniques. The seconddecision will address the 21,034 acres of planningarea designated as “Areas of Critical Environmen-tal Concern.”
In addition to the thorough review of guidelinesused to manage federal lands in Colorado, thelegislature reconstituted the Colorado Oil and GasConservation Commission in July 2007. As out-lined in House Bill 07-1341, the size of the com-mission was increased from seven to nine membersin order to provide a greater diversity of expertiseand broaden the panel’s mission. The expandedcommission is now tasked with considering
impacts to the environment, public health, andwildlife when decisions are made about exploringand developing Colorado’s oil and gas resources. Inaddition, the commission has increased the milllevy to 0.0007 of a mill per dollar value effectiveSeptember 30, 2007, for levy payments assessed forthe third quarter 2007.
CoalAfter two years of declining coal production,Colorado increased its production in 2007. EIAreports that Colorado coal mines produced 27.7million short tons of coal through the first three
YearTotal Natural Resourcesand Mining Employment Percentage Change
1998 13.4 1.5%1999 12.3 -8.22000 12.2 -0.82001 12.9 5.72002 12.9 0.02003 13.2 2.32004 14.4 9.12005 17.2 19.42006 20.8 20.9
2007a 24.8 19.2 2008b
29.8 20.2aEstimated.bForecast.
Source: Colorado Department of Labor and Employment and Colorado
Business Economic Outlook Committee.
COLORADO NATURAL RESOURCES ANDMINING EMPLOYMENT
1998–2008(In Thousands)

2008 Colorado Business Economic Outlook
22
The largest employer of coal miners in the state isPeabody Energy Company’s Foidel Creek Mine inRoutt County. The mine now employs 497 minersin its underground mine. Foidel Creek Mine oper-ates a state-of-the-art longwall that can mine wellover one million tons of coal per month. FoidelCreek is currently installing a new preparationplant that will be the largest in Colorado.
Colorado’s 10 coal mines are all located on theWestern Slope, but the customer base is mainlyalong the Front Range urban corridor and in stateseast of Colorado. Nearly 90% of the coal producedin Colorado is shipped by rail to 28 other statesas far away as Massachusetts and Florida. Colo-rado coal is blended with higher sulfur coal fromAppalachia and Illinois basins to reduce air pollu-tion. The majority of Colorado coal exports are topower plants in Tennessee, Kentucky, Texas, Utah,Mississippi, andWisconsin. In addition to steamcoal, more than 3.1 million tons of coal are shippedannually to Texas,Michigan, Arkansas, and Iowafor cement manufacturing and other industrialuses. Four million tons are exported to electricutilities and industrial plants in Arizona, Nevada,Utah, and NewMexico.
Approximately 37.5 million megawatt-hours ofgross electric power are generated by Colorado’scoal-fired power plants annually. The stateconsumes about half (19 million tons average) asmuch as it produces (38 million tons average). Butonly one-third of the coal produced in-state isactually consumed in Colorado because FrontRange power plants and industrial plants consumecoal from both Colorado andWyoming.
Colorado Geological Survey estimated a total valueof nonfuel mineral production in Colorado of $1.8billion. Nonfuel mineral production and employ-ment should remain stable in 2008 as competingforces affect the industries. Prices for metals anduranium remain high, but the slowdown in con-struction across the state will impact those indus-tries supplying natural materials for construction,such as cement, aggregate, and gypsum. The totalvalue of nonfuel mineral production is expected totop $1.96 billion in 2007 and $2.0 billion the fol-lowing year, breaking the previous record of $1.78billion set in 2005.
The price of molybdenum peaked in 2005,retracted in 2006, and reached a steady level,around $33 per pound, in 2007. Phelps DodgeCorporation, acquired by Freeport-McMoranCopper and Gold, Inc., operates the HendersonMine in Clear Creek County—North America’slargest primary producer of molybdenum. Themine and ore processing mill employs approxi-mately 500 people. In 2006, the mine produced 37million pounds of molybdenum, with a value ofabout $982 million. In 2007, Henderson is forecastto produce 40 million pounds, with an estimatedvalue of $1.3 billion. It is anticipated that produc-tion in 2008 will remain at this level. Freeport-McMoran is studying the possibility of reopeningthe Climax Mine near Leadville by 2009, whichwould produce an additional 20 million poundsof molybdenum per year. Unless a worldwiderecession affects other sectors of the economy,molybdenum prices should remain high as themetal is widely used in the energy and construction
Natural Resources and Miningcontinued from page 21
The Colorado coal industry is forecast to continueaveraging about 1% annual growth in output. TheColorado Geological Survey predicts that coal pro-duction will be around 37.3 million tons in 2008,valued at $932 million. Newmine openings sched-uled in 2008, including Northfield Coal in FremontCounty, will increase production.
Minerals and UraniumThe minerals industry has been a positive sectorfor both the Colorado and the national economiesfor the last four years. Rising commodity priceshave boosted Colorado producers of gold, molyb-denum, and industrial minerals. In 2006, the
Year Nonfuel Minerals Uranium Total1998 $604 $4.9 $608.91999 555 2.4 557.42000 596 0.5 596.52001 540 0.0 540.02002 629 0.0 629.02003 702 0.4 702.42004 949 2.0 951.02005 1,782 7.3 1,789.32006 1,762 0.0 1,762.0
2007a 1,961 0.0 1,961.0 2008b
2,033 6.3 2,039.3aEstimated.bForecast.
Source: U.S. Geological Survey, Mineral Survey Reports.
VALUE OF COLORADO NONFUEL MINERALS AND
URANIUM PRODUCTION1998–2008
(In Millions of Dollars)

2008 Colorado Business Economic Outlook
23
industries, and demand for molybdenum stainlesssteel continues to increase in China and India.
Gold prices continued to rise in 2007. ThroughOctober, the average 2007 price was $680 perounce, with a peak of $750 per ounce. This com-pares to an average price in 2006 of $610 per ounce.Production remains steady at the Cripple CreekandVictor Mine in Teller County, the state’s onlymajor gold mine. The mine, which employs 320people, produced 303,484 ounces of gold in 2006.Gold production is expected to decline slightly tothe 280,000 ounce-per-year level in 2007 and 2008.Global Minerals, Ltd. has generated an additional600 ounces of gold and 3,000 ounces of silver fromthe Cash Mine property in Boulder County.
Concern about global energy supply has broughtabout a renewed look worldwide at nuclear power.
As a result, spot prices for uranium spiked at $135per pound in 2007, then dropped back to whatmost consider a sustainable level of $90 per pound.After years of prices in the single digits, the changein market fundamentals has caused a new rush inColorado uranium country.Many old mines areundergoing renovation, and thousands of claimshave been staked in preparation for resumption ofproduction of uranium and vanadium.As of late2007, a bottleneck exists because of a lack of con-ventional mills to process uranium ore. Thus,despite the tremendous increase in activity, no rev-enue will be realized in 2007 and little in 2008 untilthe milling situation can be resolved. Once ore isflowing to the mills, significant contribution to thestate’s economy will be recognized from both ura-nium and vanadium, a ferrous metal that occurscommonly with uranium.
Construction aggregates include crushed stone,gravel, and sand. In 2006, aggregate mines inColorado produced 63.6 million tons, with an esti-mated value of $388.7 million, a 5.3% increasefrom 2005. However, the slowdown in the con-struction industry has negatively impacted thissector, with production sliding 15% in 2007.
Centex Construction Products provides gypsumfor wallboard and other products from its plant inEagle County, and Holcim (U.S.), Inc., operates atwo million ton per year Portland cement manu-facturing plant near Florence. The operations atthese plants reflect the activity in the regional con-struction sector. Therefore, the value of Colorado’scement and gypsum production is predicted to slipby 15% in 2007, with the decrease continuing in2008. These industrial minerals sectors somewhatoffset the increase in production value of the met-als in both 2007 and 2008. �

2008 Colorado Business Economic Outlook
24
It is an understatement to say that the big story inthe construction industry in 2007 is the decline inhome building. Given all the attention to the woes ofthe residential markets, the business communitymaybe generally unfocused on the continuing strength ofthe nonresidential building.Nonresidential has onceagain enjoyed a strong year in 2007 and will see asignificant increase in 2008. This forecast is basedon the overall projection of a healthy economy, andthe Construction Committee recognizes that slid-ing into even a weak and brief recession wouldpostpone or cancel a large number of proposednew projects. Infrastructure work will be downslightly for 2007 but pick up modestly in 2008.
Construction permit and valuation data arerecorded at the time projects are booked. As aresult, many of the permits and valuation formultiyear projects, such as the Xcel power plant,are pulled in the first year (2006), and actual activ-ity is understated in subsequent years (2007–10).Consequently, valuation data will be skewed whilesuch large projects are being completed. There arecurrently about 1,300 construction employeesworking on the Xcel facility, and it is estimated thatvaluation is about $300 million for each of the firstyears of the project.
As a result of this statistical aberration, it is pro-jected that the overall dollar volume work in 2007was down, to just under $12 billion. The 2008 fig-ures are expected to improve by 4.3%, to $12.5 bil-lion, which represents a small recovery in realterms, especially since construction inflation willbe muted. A smoothing average for number ofworkers employed pulls down the 2008 figure by
Construction
a small amount. A slightly more notable declinewill occur in 2007.
Residential Building
Single-Family HousingAlong with most of the United States, Colorado’snew housing activity declined throughout 2007.The number of single-family residential permits hasfallen across the state, down 24% in 2006 and 26%through Q3 2007. The committee projects a declineof 34% at year-end 2007. In comparison with thepeak years of 2004 and 2005, when new housing
growth reached a 20-year high of more than 40,000single family permits, 2007 will see half that—only20,000 permits—for single-family homes. TheWestern Slope, primarily the resort areas andGrand Junction, will be spared the sharp declinesin single-family permit activity, and growth willremain essentially flat for the year. This will haveminimal impact on the state growth rate becauseof the relatively small volumes in these areas.
In late 2007, supply in most U.S. housing marketsexceeded demand as prospective homeowners facedhigher interest rates on their adjustable-rate orinterest-only mortgages, often forcing them into
Year Residential Nonresidential Total Building NonbuildingaTotal
Construction1998 $5,486.1 $2,879.7 $8,365.8 $1,490.9 $9,856.71999 6,229.1 3,782.9 10,012.0 1,590.3 11,602.32000 7,028.6 3,476.1 10,504.7 1,835.4 12,340.12001 6,593.3 3,500.0 10,093.3 1,686.6 11,779.92002 6,357.3 2,787.4 9,144.7 2,161.5 11,306.22003 6,258.2 2,712.9 8,971.1 1,731.8 10,702.92004 8,050.3 3,291.4 11,341.7 1,753.8 13,095.52005 8,803.4 4,221.2 13,024.6 1,787.8 14,812.42006 7,770.0 4,310.2 12,080.2 2,967.1 15,047.3
2007b 5,974.0 4,400.0 10,374.0 1,600.0 11,974.0 2008c
5,867.0 4,900.0 10,767.0 1,720.0 12,487.0aData reflect permit for construction of Xcel power plant in Pueblo, a $1.3B project over four years.bEstimated.cForecast.
Source: Department of Census, F.W. Dodge Company, Division of McGraw-Hill, the Colorado Contractors
Association, and Colorado Business Economic Outlook Committee.
VVALUE OF CONSTRUCTION IN COLORADO BY TYPE1998–2008
(In Millions of Dollars)

2008 Colorado Business Economic Outlook
25
continued on page 26
Rental markets throughout the state remained inrecovery mode, although some striking differencesbecame apparent in 2007. The Denver area vacancyrate is quickly decreasing, to 6%, and will likely fin-ish the year below that level. MostWestern Slopeand mountain areas are back to crisis mode asvacancy rates have returned to very low levels. Incontrast, the nascent recovery in northernColorado has stalled, and ongoing troop deploy-ments from Fort Carson have delayed a full recov-ery of the rental market in Colorado Springs.
While the cutback in for-sale multifamily construc-tion during 2007 has not been as severe as that forsingle-family detached units, the condominiumsector has definitely shared the pain of the “creditcrunch”with the single-family detached sector. Inthe Denver area, new attached-home inventory isup 15% from 2006, representing more than fivemonths of sales. Condominium production con-tinued to prop up the multifamily constructionindustry during the past two years but the propor-tion of sales units in multifamily projects during2006 and 2007 fell to about 75% in major markets,down from 90% in 2005. A continued contractionin condominium construction will likely drop thisproportion further in 2008 and subsequent years.
Future gains in multifamily permit activity willincreasingly rely on the strength of rental marketsand the feasibility of developing apartments inmajor markets. Since a growing share of multifam-ily activity in the state is in the Metro Denver area,the sustained recovery in the rental market in thatregion is good news for multifamily construction.While most other rental markets are not ready for amajor surge in apartment construction and contin-ued cutbacks in for-sale multifamily product will
default and foreclosure. These problems were exac-erbated as the secondary mortgage markets tight-ened credit standards.With the soaring number ofhomes listed for sale, the high level of foreclosureactivity is providing a significant drag on new andresale housing activity.
Although Colorado’s new housing markets faceforeclosure-related supply excesses, along with therest of the country, the situation in this state is fun-damentally different.Weak demand caused by thestate’s employment losses in 2002 and 2003 heldhome price appreciation to 2%–6% through 2007.With such comparatively low price appreciation,there was relatively little speculative activity.Meanwhile, many “hot”markets in other parts ofthe country experienced home price appreciationof 20%–30% from 2004 through 2006, and wereheavily influenced by speculative activity, with newhome construction outpacing true housing needs.
Although these price increases of existing homeshave been modest in Colorado since 2001, a grow-ing share of the new home construction continuesto be for larger homes at higher prices. The moreaffluent baby boomers and others who were leastaffected by the poor economy of the early 2000swere also most confident in the region’s recoveryand returned to the market to purchase moreexpensive new homes, resulting in a sharp increasein single-family permit valuations in 2007.Most ofthis impact has now been realized, and this trendwill moderate in 2008. Labor and material costswill continue to push average valuations somewhathigher in 2008.
While single-family permits in Grand Junction willpost a healthy increase in 2007, and the state’s resortcounties will see little overall change, Front Range
metropolitan areas and other parts of Coloradowill be down significantly, by 20%–40%, from 2006to 2007.
Colorado’s Front Range homebuilders generallymatched construction to new home sales in 2007,so inventory levels remain manageable and will notsignificantly suppress new permit activity in 2008.However, the high volume of resale homes on themarket will continue to act as a drag on the marketas move-up buyers will need more time to sell theirhomes before buying a new one.
The new single-family housing market, whichhelped sustain the Colorado economy following themassive job loss years 2002 and 2003, is experiencingan overdue correction. The benefits of economicand employment growth in nonhousing sectors willbe offset by the continued high rate of foreclosuresand an oversupply of existing homes on the marketin most parts of the state. After the decline in 2007,the committee forecasts 19,000 single-family per-mits for 2008, for an additional 5% drop.
MultifamilyTotal multifamily permit activity changed little in2007 as a small increase in apartment constructionwas offset by a cutback in new condominiumstarts. The total for the year is expected to be about8,000 units, virtually unchanged from the 7,978multifamily permits issued in 2006. Activity in2006 and 2007 was up considerably from thetrough of multifamily construction during the2003–05 period, but a major expansion was stalledby the deteriorating market for condominiums. Arecovery in the apartment market gained some legsin 2007; however, the weakening of sales markets inmost of the state caused builders to curtail expan-sion of for-sale multifamily product.

2008 Colorado Business Economic Outlook
26
Constructioncontinued from page 25
Nonresidential BuildingThe robust growth rate of recent years for con-struction of institutional, medical, commercial,retail, and industrial buildings continued during2007. The outlook for 2008 is for yet anothervaluation increase, in the range of 10%.
Several large projects in the medical sector arewrapping up, including the $143 million InpatientPavilion at Fitzsimons and the relocated Children’sHospital. Other medical projects around the stateare multiyear efforts, such as those in GrandJunction, Brighton, and Colorado Springs. A num-ber of new projects will begin or are being plannedstatewide in 2008. Of particular note is St. Anthony
Central’s move from its facility in Denver to theFederal Center site in Lakewood. In addition,St. Joseph will redevelop the recently vacatedChildren’s site, and the VA hospital will move toFitzsimons.
Retail construction is expected to be flat, due to itsdirect link to new housing activity. No major newdevelopments are in the works, althoughBuckingham Square in Aurora is in the early stagesof a major redevelopment. By contrast, hotels andmountain resort work will increase, with signifi-cant projects in Vail, Snowmass, Aspen, SteamboatSprings, and Crested Butte. The total volume inredevelopment of the Vail Valley alone is calculated
YearSingleFamily Multifamily
Total HousingUnits
1998 36,107 15,049 51,1561999 38,410 10,903 49,3132000 38,588 16,008 54,5962001 36,437 18,570 55,0072002 34,993 12,878 47,8712003 33,837 5,732 39,5692004 40,753 5,746 46,4992005 40,140 5,751 45,8912006 33,000 7,978 40,9782007a 20,000 8,000 28,0002008b
19,000 8,500 27,500aEstimated.bForecast.
Source: Department of Census and Colorado Business
Economic Outlook Committee.
RESIDENTIAL BUILDING PERMITS BY TYPE1998–2008
detract from a major surge in multifamily activity,this sector is poised for a modest increase in 2008.Renewed interest in apartment development, partic-ularly in theMetro Denver area, coupled with con-tinued development of new senior and low-incomehousing tax credit projects, will support construc-tion of about 8,500 multifamily units in 2008, a 6%rise over 2007. This modest level of building will beaccompanied by continued tightening of rentalmarkets and higher rents throughout 2008, settingthe stage for more growth in rental production in2009.As apartment production accounts for anincreasing share of multifamily production infuture years, per unit values will drift downwardfrom $120,000 in 2007 to $118,000 in 2008.
Percentage PercentageYear Number Index Change Index Change1998 134.6 100.0 11.7% 100.0 3.9% 1999 148.5 110.3 10.3 103.6 3.6 2000 163.6 121.5 10.2 107.6 3.8 2001 167.7 124.6 2.5 108.2 0.6 2002 160.4 119.2 -4.4 106.2 -1.9 2003 149.9 111.4 -6.5 104.6 -1.4 2004 151.3 112.4 0.9 105.9 1.2 2005 160.0 118.9 5.8 108.2 2.1 2006 167.7 124.6 4.8 110.8 2.4 2007a 165.5 123.0 -1.3 113.5 2.4 2008b
164.5 122.2 -0.6 115.6 1.9 aEstimated.bForecast.
Source: U.S. Department of Labor, Colorado Department of Labor and Employment, Bureau of
Labor Statistics, and Colorado Business Economic Outlook Committee.
All IndustriesConstruction
CONSTRUCTION EMPLOYMENT, COLORADO AND STATE TOTAL, 1998–2008(In Thousands)
(Base Year: 1998=100)

2008 Colorado Business Economic Outlook
27
at about $1 billion, which will be spent over thenext five years.
Even the speculative office market is reappearingafter being moribund for years. Lease rates havereturned to pre 9/11 numbers, and absorptionallows a few new projects to pencil out. A large cor-porate office has just been completed in Golden,and the project at 1515Wynkoop in downtownDenver is well underway.
Institutional work has been robust in past years,including the impressive push for new buildings atthe University of Denver. That work is essentiallycomplete and is being replaced by an array of otherprojects. Valor Christian High in Highlands Ranchwas scheduled for completion in fall 2007. The CU-Boulder campus saw the completion of KoelbelBuilding, which is the new home of the LeedsSchool of Business. Ongoing work on the CSUcampus will add significant activity for 2008.
An increase in state and municipal projects willinclude the relocation of the Colorado HistoryMuseum, the City of Denver jail and courthouseproject, as well as the new state prison in FremontCounty. Past bond issues have funded a significantnumber of schools, including those in New Castle,Commerce City, Falcon, and Parker.With theapproval of Denver Initiatives A–I, a number ofimprovement projects will begin in 2008, as well.Expect a pause in all types of work, however, dur-ing the crucial weeks that the Democratic NationalConvention will be in Denver. City leaders willwant to avoid traffic snarls caused by cone zones.
NonbuildingThe nonbuilding sector covers infrastructure, suchas roads, land development, dams, airports, andpower plants.As mentioned earlier, the data for 2007and 2008 likely understate true construction activityin the state owing to the methodology used torecord permits.Actual industry data are also under-stated because work on federal properties, such asmilitary bases, is exempt from permitting for rea-sons of national security. The committee is awarethat Colorado companies were very active on thebases and believe that many tens of millions dollarsof construction activity went on in 2007 but will notbe apparent in the data sets used in this forecast.Asimilar situation will occur in 2008.
The flow of government spending at the state andlocal level in 2007 remained relatively stable in2007. Federal funds for transportation were essen-tially unchanged in 2007 and are expected toremain comparatively flat in 2008. The state gov-ernment is expected to release highway and bridgefunds under the monikers of Senate Bill 1 and HB1310 funds. The result is that CDOT’s 2008 con-struction activity will increase approximately $100million over 2007. Any legislative action related tothe Governor’s Transportation Finance andImplementation Panel would occur beyond thetime horizon of this forecast.
The slowdown in housing has meant that contrac-tors working on the private side experienced fallingdemand to develop housing subdivisions. A recov-ery in nonbuilding activity connected with homebuilding is not anticipated in 2008, but neither arefurther declines.
The multibillion dollar tax increase for public tran-sit, FasTracks, will finally break ground, initiating
theWest Line construction, with expenditures ofapproximately $75 million in 2008. Local ballotmeasures, including those in Denver and Bouldercounties, if passed, will increase transportationfunding in the out years. The Pikes Peak RegionalTransportation Authority in El Paso County isexpected to provide $75 million for transportationimprovements in 2008.
The Corps of Engineers will, in all likelihood, issuethe needed permits for the Rueter-Hess Reservoirexpansion, which will contribute about $20 millionto activity in 2008. Improvements at DIA are likelyto be light, although a good chance exists thatexpansion of the interterminal trains will proceed,adding about $20 million–$25 million to 2008activity.
In contrast to most economists’ predictions, thecommittee’s forecasted employment number is farless gloomy for the following reasons:
• Contractors performing nonresidential work hirecraftsmen from homebuilders virtually as theyleave the sites. Some of the reduction in employ-ment activity is real but not tracked in the data.
• Colorado is now a state where illegal immigrantlaborers have a difficult time finding work, andas a result, the number of immigrant job seekershas declined. Losses of employment that nevershowed up on the government reports in the firstplace are losses never recognized.
• It is believed that the true strength of construc-tion economic activity is not captured because ofthe manner in which data are collected.
It is believed that 2007 will finish with a smoothedaverage of 165,500 total workers, and will slip justslightly in 2008, to 164,500. �
2008 Colorado Business Economic Outlook
28
Manufacturing
Manufacturing in Colorado is a $15 billionindustry, representing about 6.5% of the
value of all goods and services produced in the state.Colorado was the home of about 6,000 manufac-turing companies employing about 149,100 work-ers in 2006, which represented about 6.7% of thetotal employment base.Most of these manufactur-ing companies are small businesses. Indeed, nearly80% of the manufacturing companies employfewer than 20 workers, whereas only about 35 com-panies have 500 employees or more.
In addition, another 5,900 manufacturing busi-nesses are classified as “nonemployer businesses,”which are self-employed individuals. About one-quarter of these businesses fall into the miscella-neous manufacturing category, which includes adiverse range of products, including medicalequipment and supplies, jewelry, sporting goods,toys, and office supplies. Fabricated metal manu-facturing, apparel manufacturing, printing andrelated support activities, and wood product man-ufacturing round out the five largest nonemployermanufacturing categories.While these nonem-ployer businesses provide an important entre-preneurial base for the manufacturing industry inColorado, it is important to note that the nonem-ployer businesses are not included in the employ-ment statistics described in detail below.
Numerous indices that are compiled at thenational and regional level attempt to forecastfuture manufacturing activity. Some of the mostwidely cited indices are put together by theInstitute for Supply Management, including thePurchasing Managers Index (PMI) and about 10
other indices that focus on specific aspects of themanufacturing industry, such as new orders, pro-duction, inventories, exports, and imports. ThePMI is the broad measure of manufacturing pur-chasing managers’ expectations of business activityfor the next 12 months. The nation’s manufacturingsector saw its ninth consecutive month of expansionin October 2007, but at a slower pace. The Institutefor Supply Management’s Purchasing ManagersIndex registered 50.9 in October, down from itsSeptember reading of 52.0. A reading over 50 pre-dicts economic expansion, so October’s result sug-gests the nation’s manufacturing sector maintainsa positive, albeit downgraded, outlook. Analystsclaim the slowdown in housing and transportationis affecting manufacturing, and many industryrespondents believe the market has not recoveredas quickly as they expected.
Several indices focus on manufacturing activity inColorado and the Rocky Mountain region. Thesereveal a mixed outlook for Coloradomanufacturers:
• The Denver Manufacturing PMI registered 52.8in September 2007, up from 51 in August. Com-piled by the College of Business at the Universityof Colorado Denver, the index points to improv-ing conditions when it registers more than 50.The September reading forecasts a slight uptickin the growth of Metro Denver manufacturing,but index subcomponents suggest that laboravailability is an ongoing challenge.
• The Creighton University Business ConditionsIndex for the Mountain States region saw a thirdconsecutive decline when it dropped from 65.3 in
May 2007 to 61.2 in June. A reading greater than50 points to expansionary conditions, so June’sresult suggests that economic growth may con-tinue at a reduced pace. Comments from some ofthe purchasing managers surveyed included con-cerns about rising fuel prices and the availabilityof skilled labor.
• The manufacturing survey by the FederalReserve Bank of Kansas City that includesColorado and six Midwestern states reveals thatmanufacturing output expanded modestly inOctober 2007, and producers remained largelypositive about future activity. However, ordersand employment indices were sluggish, and firmscontinued to trim inventories. Most price indicesin the survey edged up slightly.
These indices point to continued challenges forColorado’s manufacturing industry. Althoughemployment has slid each year starting in 2001,the rate of job loss in the industry has declined.Employment in the manufacturing industry fell anaverage of 3.6% per year from 2001 to 2006, repre-senting a contraction of 30,500 jobs over the five-year period. In contrast, this forecast calls for joblosses averaging 2.9% per year in 2007 and 2008,a decline of 8,400 jobs over the two years.
Nondurable GoodsAbout one-third of the employment in the manu-facturing industry is found in the nondurablegoods sector, which includes the production ofgoods that generally last for less than one year. Thenondurable goods sector will employ about 47,400

continued on page 30
2008 Colorado Business Economic Outlook
29
people in 2008, representing an average decline inemployment of 2.1% per year in 2007 and 2008.
The largest nondurable goods group is food manu-facturing, of which about two-thirds of Colorado’sfood processing is in beef production. Followinginternational concerns about the quality of U.S.beef in 2004 reduced national exports by 7%, to323,000 metric tons, the USDA projects beef exportswill rise, to 776,000 metric tons, by 2008. This isgood news for the Colorado beef industry.While itvaries by year, Colorado usually ranks no lowerthan 10th in domestic beef production. Beefexports could be significantly better if Japan andSouth Korea were to purchase U.S. beef at their pre-2004 levels. Currently, the two countries importapproximately $154 million less Colorado beefthan they did before the 2004 mad cow disease dis-ruption in the market.
After a slight improvement in food manufacturingin 2006, competitive pressures and advances inproduction techniques are expected to reduceemployment in 2007 by 200 workers. The down-ward trend is anticipated to continue in 2008 whenthe sector’s employment is expected remain flat.
Colorado’s beverage industry produces soft drinks/bottling (33 firms), bottled water (9 firms), beer(23 firms), and wine (28 firms). Boulder, Denver,and Mesa counties host 42% of the companies.Employment is concentrated among major brew-eries and soft drink bottlers. Large producers haveyielded significant market share as consumer pref-erences shift away frommass-market goods, towardspecialty beverages. This trend is prominent in thebrewing sector, where small microbreweries andcraft labels have seen strong growth despite stag-nant sales in the mass market. A recent study iden-
tified Colorado as the nation’s third-largest pro-ducer of craft beers. The same study ranked thestate first overall in total beer production for 2006.Beer production uncertainties from the proposedMolson Coors and SABMiller merger could impactemployment in the sector. Barring significantchanges at Molson Coors in 2007 and 2008, grow-ing employment among the microbreweries andboutique wineries is expected to offset modestlosses among the larger employers for no change inemployment in 2007. Increased competition andmanufacturing efficiencies in the sector areexpected to lead to a loss of 100 jobs in 2008.
The printing and publishing industry has contin-ued to undergo revisions to its traditional businessmodel. Two factors explain the sector’s evolution.First, advances in the capabilities of software andlaser printers have shifted traditional printing jobsto limited runs of customized materials to hardcopy and electronic desktop publishing. Second,increased competition among commercial printersfor the reduced number of print jobs acceleratedthe need for technical innovation and increasedefficiency. These trends are expected to continue.Inefficient print shops will not be able to compete.Increased efficiencies will reduce the number ofemployees in the sector. The lack of strong growthin the economy will aggravate the sector’s businessenvironment. As a result, the sector is expected tolose 200 jobs in 2007 and 300 jobs in 2008.
The other nondurable goods sector includes tex-tiles, apparel, and leather goods; paper manufac-turing; petroleum and coal products; chemicals;and plastics and rubber products.With the excep-tion of the latter two categories, these sectors have asmall, yet stable, presence in Colorado. The textiles,
apparel, and leather sector employs about 3,400people, but the sector continues to face stiff over-seas competition. The weak dollar may helpexports in this sector. Roughly 2,100 people areemployed in paper manufacturing in the state,including cardboard containers, packaging, andpaper products. This sector has been contractingby more than 100 workers per year during the lastfive years. Another 900 people are employed in thepetroleum and coal products sector, mainly withinpetroleum refining operations. This sector has
Durable Nondurable
Year Employment Index Employment Index1998 129.6 100.0 61.8 100.01999 127.0 98.0 60.4 97.72000 128.8 99.4 60.1 97.22001 122.5 94.5 57.0 92.22002 109.9 84.8 53.9 87.22003 102.0 78.7 51.9 84.02004 101.0 77.9 50.8 82.22005 100.5 77.5 49.9 80.72006 99.3 76.6 49.8 80.62007a 96.4 74.4 48.3 78.22008b
93.3 72.0 47.4 76.7aEstimated.bForecast.
Source: Colorado Department of Labor and Employment, Bureau of Labor Statistic
and Colorado Business Economic Outlook Committee.
1
MANUFACTURING EMPLOYMENT,DURABLE AND NONDURABLE
1998–2008(In Thousands)
(Base Year: 1998=100)

remained relatively stable during the past year inresponse to rising energy costs.
Chemical manufacturing and plastics/rubber pro-duction are the largest other nondurable goodssectors, providing two-thirds of all employment inthe other nondurable goods category. Exports inboth sectors have more than doubled since 2001and increased approximately 70% since 2004. Thechemical manufacturing sector includes petro-chemical manufacturing, industrial gases, biotech-nology, pharmaceuticals, household chemicals, andrelated industries. This is a very volatile sector, withwide swings in individual company employment
resulting from the success or failure of medicalclinical trials and changes in the price of oil.Biotechnology is an important emerging sectorthat has been targeted in state economic develop-ment efforts. The former Fitzsimons ArmyMedicalCenter is being converted into a state-of-the-art,integrated life sciences community. The 578-acresite in Aurora is undergoing a $4.3-billion transfor-mation into one square mile dedicated to excel-lence in patient care, education, basic science, andapplied research, as well as bioscience research anddevelopment. Chemical manufacturing employsroughly 7,000 Colorado workers.
The plastics and rubber products sector includescompanies producing plastic film, plastic foamproducts, and other miscellaneous products.Rubber companies have a limited presence inColorado, while the plastics industry has continuedto grow. This sector includes injection-moldingcompanies, which are closely tied to the biotechand electronics industries. Employment in the rub-ber and plastics sector will decline slightly from itscurrent level of 5,400 workers due to weakness inthe electronics industries.
The other nondurable goods sector is expected todecrease by about 1,500 positions in 2007 and lose
Manufacturingcontinued from page 29
COLORADO MANUFACTURING EMPLOYMENT BY INDUSTRY1998–2008
(In Thousands)
Industry 1998 1999 2000 2001 2002 2003 2004 2005 2006 2007a 2008b
Food 19.6 19.3 19.8 19.8 19.3 18.3 17.8 17.1 16.7 17.0 17.0Beverage and Tobacco 6.3 5.9 5.9 6.0 5.9 5.8 5.9 5.7 5.8 5.7 5.6Printing and Related 12.4 11.8 11.4 10.4 9.2 8.6 8.1 8.0 7.8 7.6 7.3Other Nondurables 23.5 23.4 23.0 20.8 19.5 19.2 19.0 19.1 19.5 18.0 17.5
Subtotal, Nondurable Goods 61.8 60.4 60.1 57.0 53.9 51.9 50.8 49.9 49.8 48.3 47.4
Nonmetallic Minerals 9.7 10.3 10.8 10.4 9.8 9.1 9.1 9.5 9.8 9.4 9.1Fabricated Metals 17.9 17.6 18.3 17.2 15.8 15.1 15.4 14.9 14.9 15.0 14.9Computer and Electronics 45.3 44.3 46.0 45.2 38.1 33.6 31.6 30.1 28.3 25.8 23.9Transportation Equipment 13.9 13.2 12.3 11.3 10.4 9.7 10.0 10.7 10.3 10.3 10.0Other Durables 42.8 41.6 41.4 38.4 35.8 34.5 34.9 35.3 36.0 35.9 35.4
Subtotal, Durable Goods 129.6 127.0 128.8 122.5 109.9 102.0 101.0 100.5 99.3 96.4 93.3
Total, All Manufacturing 191.4 187.4 188.9 179.5 163.8 153.9 151.8 150.4 149.1 144.7 140.7aEstimated.bForecast.
Source: Colorado Department of Labor and Employment and Colorado Business Economic Outlook Committee.
C
30
2008 Colorado Business Economic Outlook
another 500 jobs in 2008 due to the volatility of thesectors tied to the energy, bioscience, and electronicsindustries. This brings the total nondurable goodsemployment forecast to 48,300 positions in 2007, adecrease of 1,500 positions from 2006. Total employ-ment in nondurable goods will continue to contractin 2008, dropping by another 900 jobs to 47,400.
Durable GoodsAbout 99,300 people were employed in the durablegoods industry in 2006. Challenges continue formany of the durable goods sectors, especially thosethat are tied to the construction and computermanufacturing industries.
There is great product diversity in the nonmetallicminerals sector, but outputs from the sector areclosely tied to construction activity of all types—residential, commercial, and industrial, and heavyconstruction. This sector includes everything frompottery, plumbing fixtures, and glass products tobrick and tile to concrete and stone products, aswell as high-tech porcelain electrical products. Dueto its strong ties to the construction industry, thissector contracted by about 400 jobs in 2007 andended the year with average employment of 9,400.An additional 300 jobs are expected to be lost in2008.
Output from the fabricated metals sector providesmaterials for many other sectors, everything fromsteel beams for construction to component partsfor a myriad of other products—virtually anythingwith metal content. Employment in this sectorfluctuates with demand from other industries.Manyof the firms in this category are small suppliers toproducers of industrial machinery. Employment inthis sector held steady in 2007, with a projected
average employment of 15,000 at year-end. Higherdemand for fabricated metal products from indus-tries such as energy exploration and productionand aerospace drove the need for more equipment.Nevertheless, this is a sector where productivityadvancements has allowed manufacturers to useless labor per unit of output in the productionprocess. Substitution of capital for labor will allowoutput to increase with fewer workers. This sectorwill likely see a minimal loss of 100 jobs in 2008,for a total of 14,900 positions.
The largest durable goods sector in Colorado iscomputer and electronics products. After peakingat 46,000 workers in 2000, this manufacturing sec-tor has dwindled to 28,300 positions in 2006, rep-resenting a loss of 17,700 jobs.While the computerand electronics sector has declined throughout theUnited States over the last few years, Colorado hasexperienced even faster declines. As computer hard-ware comes down in price and becomes more of acommodity, production has shifted to less expen-sive off-shore locations. Furthermore, consumersno longer feel the need to buy the latest and great-est computer and electronic devices, further ham-pering domestic production.While the mainstay ofthe U.S. computer and electronics sector remainsin research and development, even these opera-tions have not been immune to job losses. Overall,the high-tech markets are in transition as most seg-ments mature into modest, but stable growth pat-terns. Companies in this sector are investing to bemore competitive globally by focusing on fasterproduct introduction times, more efficient saleschannels, and tighter supplier partnerships. Still,expect Colorado employment to decline by 2,500workers in 2007 and another 1,900 in 2008.
The transportation sector includes the manufac-ture of everything from aircraft parts to missilesand satellites to mountain bike frames. Increaseddefense and aerospace spending since late 2001have provided the state’s six prime contractors(Lockheed Martin, Boeing, Raytheon, NorthropGrumman, ITT Industries, and Ball Aerospace)with new clients and new contracts. A new playerin this sector is United Launch Alliance (ULA), ajoint venture of LockheedMartin and Boeing, head-quartered in Metro Denver. ULA will build the nextgeneration of launch vehicles combining the Atlasand Delta rocket operations. The new facility hasalready brought more than 1,500 new aerospacejobs to Colorado, although assembly operationswill be located in Decatur, Alabama. Colorado alsohas a small niche in personal jet aircraft manufac-turing, with several models having recently wonFAA approval. In spite of growth in some areaswithin this group, employment in 2007 held itsown, at 10,300.With continued productivity gainsand shifting of manufacturing operation locations,this sector is projected to lose 300 jobs in 2008.
The other durable goods sector includes woodproducts, primary metals, machinery, electricalequipment and appliances, furniture, and miscella-neous manufacturing. This diverse group of sectorsis faced with varying demand issues, ranging fromthe decline in new home construction to the grow-ing demands of the healthcare industry.
Employment in the wood products and furnituresectors has increased steadily during the last coupleof years. This contraction will continue in 2007and 2008 as home construction declines and con-sumer spending levels remain more conservative.
continued on page 32
31
2008 Colorado Business Economic Outlook
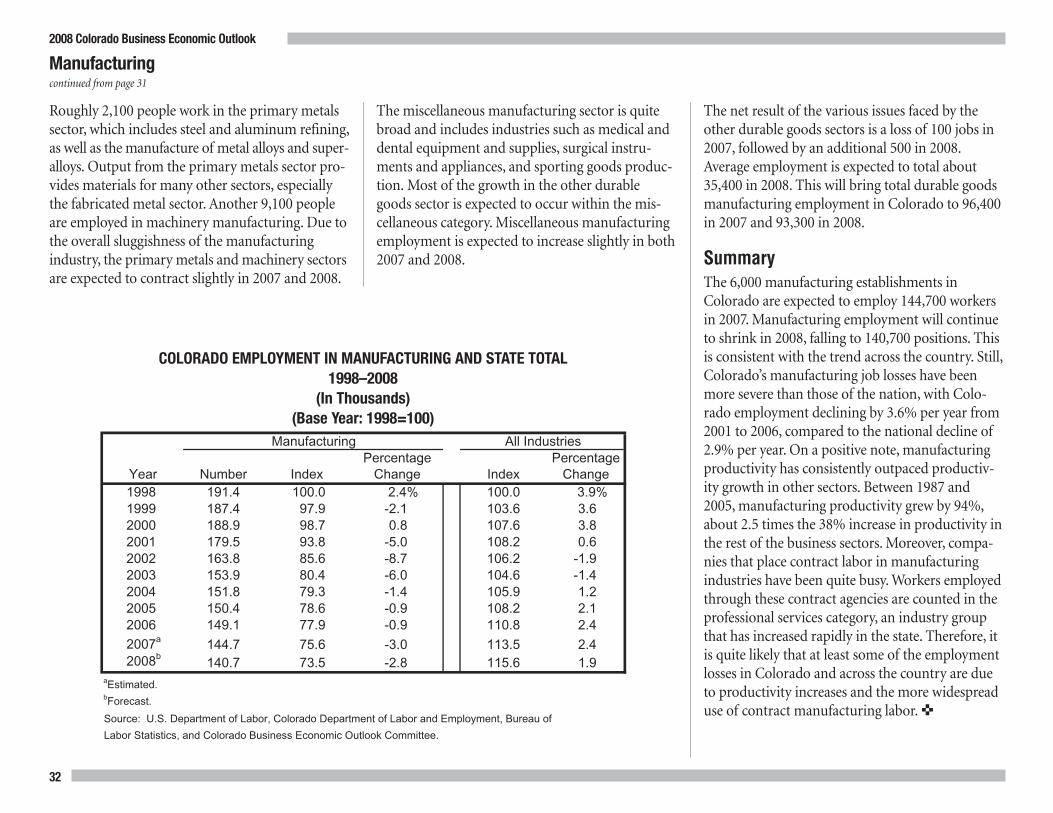
Manufacturingcontinued from page 31
Roughly 2,100 people work in the primary metalssector, which includes steel and aluminum refining,as well as the manufacture of metal alloys and super-alloys. Output from the primary metals sector pro-vides materials for many other sectors, especiallythe fabricated metal sector. Another 9,100 peopleare employed in machinery manufacturing. Due tothe overall sluggishness of the manufacturingindustry, the primary metals and machinery sectorsare expected to contract slightly in 2007 and 2008.
The miscellaneous manufacturing sector is quitebroad and includes industries such as medical anddental equipment and supplies, surgical instru-ments and appliances, and sporting goods produc-tion. Most of the growth in the other durablegoods sector is expected to occur within the mis-cellaneous category.Miscellaneous manufacturingemployment is expected to increase slightly in both2007 and 2008.
The net result of the various issues faced by theother durable goods sectors is a loss of 100 jobs in2007, followed by an additional 500 in 2008.Average employment is expected to total about35,400 in 2008. This will bring total durable goodsmanufacturing employment in Colorado to 96,400in 2007 and 93,300 in 2008.
SummaryThe 6,000 manufacturing establishments inColorado are expected to employ 144,700 workersin 2007.Manufacturing employment will continueto shrink in 2008, falling to 140,700 positions. Thisis consistent with the trend across the country. Still,Colorado’s manufacturing job losses have beenmore severe than those of the nation, with Colo-rado employment declining by 3.6% per year from2001 to 2006, compared to the national decline of2.9% per year. On a positive note, manufacturingproductivity has consistently outpaced productiv-ity growth in other sectors. Between 1987 and2005, manufacturing productivity grew by 94%,about 2.5 times the 38% increase in productivity inthe rest of the business sectors.Moreover, compa-nies that place contract labor in manufacturingindustries have been quite busy.Workers employedthrough these contract agencies are counted in theprofessional services category, an industry groupthat has increased rapidly in the state. Therefore, itis quite likely that at least some of the employmentlosses in Colorado and across the country are dueto productivity increases and the more widespreaduse of contract manufacturing labor.�
ManufacturingPercentage Percentage
Year Number Index Change Index Change1998 191.4 100.0 2.4% 100.0 3.9% 1999 187.4 97.9 -2.1 103.6 3.6 2000 188.9 98.7 0.8 107.6 3.8 2001 179.5 93.8 -5.0 108.2 0.6 2002 163.8 85.6 -8.7 106.2 -1.9 2003 153.9 80.4 -6.0 104.6 -1.4 2004 151.8 79.3 -1.4 105.9 1.2 2005 150.4 78.6 -0.9 108.2 2.1 2006 149.1 77.9 -0.9 110.8 2.4 2007a 144.7 75.6 -3.0 113.5 2.4 2008b
140.7 73.5 -2.8 115.6 1.9 aEstimated.bForecast.
Source: U.S. Department of Labor, Colorado Department of Labor and Employment, Bureau of
Labor Statistics, and Colorado Business Economic Outlook Committee.
All Industries
COLORADO EMPLOYMENT IN MANUFACTURING AND STATE TOTAL1998–2008
(In Thousands)(Base Year: 1998=100)
32
2008 Colorado Business Economic Outlook

Trade, Transportation, and Utilities
worker in 2006 were more than 40% above that forall private-sector workers. Colorado wholesaletrade is dominated by merchant wholesalers, thatis, firms that sell to retail outlets. These firms pro-vide 90% of all wholesale jobs. The subset of firmsselling durable goods, particularly computers,peripherals, and electronic equipment, account for60% of merchant wholesaler employers.
The largest number of jobs among nondurablewholesalers is with businesses selling groceries andrelated products. The remaining wholesale jobs arewith business-to-business sellers, electronic mar-keters, and agents and brokers.
Historically, wholesale employment in Coloradohas been cyclical. The number of jobs in this sub-sector fell sharply in 2002 and 2003 but has sincerebounded with the state and national economicrecoveries. A gain of 2,600 jobs is expected in 2007.With slower growth in both the Colorado and U.S.economies, only 1,000 new jobs are forecast in2008, an increase of 1%.
RetailRetail trade employs more people than any othersubsector of the Colorado economy; over one-tenth of the state workforce or roughly one-quartermillion workers hold jobs with retail firms. Threeof the state’s largest private-sector employers areretailers. Overall, wages in the retail sector are rela-tively low, with average weekly earnings less than60% of those for all private-sector workers.Manyof the state’s retail jobs are part-time.
Employment in the retail subsector rebounded asthe state economy recovered. However, job gainshave fallen short of those achieved during thestrong growth years of the 1990s. Between 1993and 2000, the sector averaged more than 10,000 netnew jobs per year, while only 15,000 total jobs havebeen added between 2003 and 2007. A portion ofthe pattern of slower job growth can be explainedby more moderate overall economic growth andsmaller sales gains. However, it also reflects fasterproductivity gains, that is, fewer workers per dollarof sales due to such changes as increased use oflabor-saving technology and management prac-tices and a trend toward more self-service. The
Wholesale Trade Wholesale Trade Other Percentage Year Durable Goods Nondurable Goods Wholesale Total Change
1998 53.6 32.4 6.5 92.5 3.1% 1999 55.9 33.1 5.5 94.5 2.2 2000 60.0 33.8 5.6 99.4 5.2 2001 60.4 33.9 5.5 99.8 0.4 2002 56.0 33.3 5.8 95.1 -4.7 2003 52.7 32.3 7.1 92.1 -3.2 2004 51.5 31.9 8.5 91.9 -0.2 2005 52.4 32.0 9.1 93.5 1.7 2006 53.5 32.7 10.2 96.4 3.1
2007a 54.5 33.6 10.9 99.0 2.7 2008b
55.0 34.0 11.0 100.0 1.0aEstimated.bForecast.
Source: Colorado Department of Labor and Employment and Colorado Business Economic Outlook Committee.
WHOLESALE TRADE EMPLOYMENT1998–2008
(In Thousands)
The Trade, Transportation, and Utilities Super-sector is the largest provider of jobs in Colorado.
In 2007, the strongest job growth occurred in thewholesale and retail sales sector, driving totalsupersector employment to 430,600, an increase of2.6%. Slower sales should post lower gains in 2008,pushing employment up by 1.3%, to 436,000.
Trade
WholesaleColorado’s wholesale trade subsector employsnearly 100,000 workers at a relatively high averagewage. Average weekly earnings per wholesale
continued on page 34
33
2008 Colorado Business Economic Outlook

figure is inflated by a shift of last Christmas’s salesinto January. Food and beverage stores reported18% of total retail sales. The final category, build-ing materials stores and nurseries, make up morethan 9% of sales. Sales in this area have fallen morethan 5% in this period due to the drop in homeconstruction.
Retail sales for 2007 should increase around 5%,which is similar to that recorded in 2006. The 2007figure presents an overly optimistic picture of themarket as it is inflated by the effect the two bliz-
2008 Colorado Business Economic Outlook
state minimum-wage measure that took effect inJanuary 2007 may have discouraged hiring in theretail sector. Slower sales growth and a reasonablytight labor market will translate into only modestjob gains through 2008. Some 6,300 new retail jobsare expected in 2007, with another 3,000 added tothe Colorado economy in 2008.
Sales by Colorado retailers will approach $65 bil-lion in 2007. Sales by auto dealers account for morethan 21% of the total retail sales in Colorado. Autosales in the state have been surprisingly strong in
Bldg. Material and General
Motor Vehicle Garden Eqpt. and Food and Merchandise Other Percentage Year and Parts Dealers Supplies Dealers Beverage Stores Stores Retail Total Change 1998 29.2 19.1 44.4 39.2 98.9 230.8 3.3% 1999 30.5 20.7 45.1 40.8 102.2 239.3 3.7 2000 31.9 21.3 44.7 42.6 104.7 245.2 2.5 2001 32.7 21.6 44.2 43.4 103.8 245.7 0.2 2002 33.0 22.2 42.7 44.0 100.8 242.7 -1.2 2003 32.4 21.5 42.2 44.2 99.2 239.5 -1.3 2004 32.4 22.4 42.4 45.0 99.1 241.3 0.8 2005 32.0 23.1 43.9 46.7 100.1 245.8 1.9 2006 31.5 23.8 44.2 46.9 101.9 248.3 1.0
2007a 31.7 24.1 44.2 51.6 103.0 254.6 2.5 2008b
31.7 24.1 44.4 53.1 104.3 257.6 1.2aEstimated.bForecast.
Source: Colorado Department of Labor and Employment and Colorado Business Economic Outlook Committee.
RRETAIL TRADE EMPLOYMENT1998–2008
(In Thousands)
2007, with a gain of 7% in the first seven monthsversus the corresponding timeframe in 2006. Thiscompares to a 2.5% increase nationally for thesame period. Possible explanations include replace-ment demand resulting from weak sales over theprevious four years and from the need to replacedamaged vehicles after the severe 2006–07 winter.General merchandise stores, which include depart-ment stores, discount stores, warehouse clubs, andsuperstores, account for 17% of all sales. This cate-gory climbed 4.7% in the first seven months of2007 over the same period in 2006, although this
34
Trade, Transportation, and Utilitiescontinued from page 33

35
2008 Colorado Business Economic Outlook
continued on page 36
and home heating fuel. Housing prices in the stateare less likely to experience sharp declines thanthose in many other parts of the nation. However,mortgage rate resets for many homeowners will cutinto funds available for discretionary spending. Joband income growth is likely to slow somewhat fur-ther, depressing spending. Sales for 2008 are fore-cast to grow by 3.6%, although the growth ratepresents an excessively dismal picture as it is dis-torted by the unusually strong sales in January2007. Auto sales are unlikely to sustain the briskgrowth of 2007. Building materials will see furtherweakness, while the dollar value of food store saleswill record robust gains due to higher prices.
Front Range retail real estate markets have sloweddue to the large amount of new space that hascome on the market in recent years. In MetroDenver, some 6 million square feet is currentlyunder construction, with an increasing share ofnew facilities in downtown redevelopment projectsrather than in the suburbs.Major new openingsinclude the Nordstrom store in Cherry Creek.
Transportation and WarehousingThe transportation and warehousing sectorincludes air, railroad, and water transportation;trucking; taxi service; urban transit; couriers; ware-housing; and pipeline companies. These industriesare expected to contribute 68,700 jobs in 2007 and69,900 in 2008. Gains in air and truck transporta-tion boosted hiring in this sector in 2007. Slowergrowth is expected in 2008, with continued highfuel prices.
zards that hit the state in late December 2006.These storms caused many shoppers to postponepurchases from December to January.
The outlook in 2007 for holiday sales for both thestate and nation is cloudy. Consumers’ concernsabout the credit crunch and rising fuel prices haveled the National Retail Federation to project thesmallest gain in holiday retail sales since 2002.Wal-Mart Stores announced large price cuts on itsbest-selling toys 12 weeks before Christmas and sig-naled more reductions are coming. This move will
pressure other retailers to make similar discounts.Although Colorado consumers are confronted withthese same problems, sales over the holiday periodshould show a reasonably healthy year-to-year gainbecause of the effects of last December’s blizzard.This statistical anomaly, however, will provide littlehelp to retailers’ balance sheets.
In 2008, Colorado’s consumers will be adverselyaffected by several factors, including a depressedhousing market; overstretched budgets; higher bor-rowing costs; and the rising cost of food, gasoline,
YearMotor Vehicle
and PartsGeneral
MerchandiseOtherRetail
Total RetailTrade Salesa
PercentageChange
1998 $10.0 $6.2 $26.9 $43.1 6.7%1999 11.8 6.9 28.7 47.4 10.02000 13.0 7.6 31.6 52.2 10.12001 13.9 7.9 31.1 52.9 1.32002 13.5 8.2 31.2 52.9 0.02003 13.7 8.5 30.6 52.8 -0.22004 14.0 9.1 32.7 55.8 5.72005 13.6 9.8 35.3 58.7 5.22006 13.3 10.3 38.1 61.7 5.12007b 14.1 10.8 39.8 64.7 4.92008c
14.5 11.1 41.4 67.0 3.6aThe total does not include food services.bEstimated.cForecast.
Source: Colorado Department of Revenue and Colorado Business Economic Outlook Committee.
RETAIL SALES1998–2008
(In Billions of Dollars)

National Air TransportationThe national aviation economy primarily centerson the activity of air carriers and the hub airportsthat serve them. In 2007, air carriers continued tofocus on costs and revenues as related to revenuepassenger miles (RPM). The Air TransportAssociation Cost Index is a metric that tracks quar-terly and annual trends of the expense of inputs toairline production. Key ratios from the Airline CostIndex identify the largest expenses as fuel (25.4%),labor (23.6%), and transport-related costs (13.7%).
Year-over-year highlights include:
• The composite cost index is estimated to rise to185.7 in 2007, up 2.9% from 2006.
• The 2007 fuel cost component is expected todecline to 25.4% from 25.5% in 2006.
• The 2007 labor cost component is expected todecrease to 23.6% from 23.8% in 2006.
• Cents per RPM for domestic travel year-to-date2007 dipped slightly below 2006 levels, at 12.87¢per mile, while Atlantic, Latin America, andPacific travel increased substantially over 2006,with yields at 12.71¢ per mile, 13.60¢ per mile,and 11.78¢ per mile, respectively.
• Airline operating revenues for 2006 were $163.8billion, up 8.3% from $151.3 billion the previ-ous year.
In 2006, air carrier passenger boardings grew to716.8 million from 690.2 million in 2005 (3.9%).This trend is expected to last through 2007 andinto 2008. However, the air transportation systemis experiencing substantial flight delays, and noimmediate improvements can be expected. It is yetto be determined at what point the “hassle factor”will deter people from flying. An overhaul of the airtraffic control system and increased airport capac-ity, which the air carriers claim is the root of theproblem,may be on the horizon within the nextthree to five years.
Trade, Transportation, and Utilitiescontinued from page 35
Truck Couriers and Warehousing Air Other Percentage Year Transportation Messengers and Storage Transportation Transportation Total Change 1998 17.3 9.9 7.8 14.1 11.6 60.7 1.8%1999 17.2 10.0 8.2 15.5 11.9 62.8 3.5 2000 17.7 10.5 8.9 17.0 12.2 66.3 5.6 2001 17.3 10.4 9.0 16.1 16.7 69.5 4.8 2002 16.9 9.7 8.7 14.2 16.7 66.2 -4.7 2003 16.5 9.7 8.0 13.7 17.1 65.0 -1.8 2004 16.9 9.4 7.4 14.1 17.7 65.5 0.8 2005 17.8 9.3 7.0 13.6 18.0 65.7 0.3 2006 18.3 9.5 7.2 13.3 18.4 66.7 1.5
2007a 18.7 9.8 7.0 14.3 18.9 68.7 3.0 2008b
18.9 10.1 6.8 14.8 19.3 69.9 1.7aEstimated.bForecast.
Source: Colorado Department of Labor and Employment and Colorado Business Economic Outlook Committee.
(In Thousands)
TRANSPORTATION AND WAREHOUSING EMPLOYMENT1998–2008
(In Thousands)
36
2008 Colorado Business Economic Outlook

Colorado Air TransportationAir transportation in Colorado is a major contrib-utor to the state’s economy, both in terms of directemployment and transportation infrastructure.
In 2006, Denver International Airport’s (DIA)enplanements grew to 23.7 million from 21.7
million, an increase of 9.1%. The facility nowenplanes approximately 3.3% of total nationalboardings. Airline economic efficiency has beensubstantially improved in 2007 through greatlyimproved on-time performance.
Colorado Springs Municipal Airport’s enplane-ments and deplanements slid 1.3% in 2006, but the
airport moved from the nation’s 90th busiest air-port to 88th, according to FAA statistics.
In 2006, Grand JunctionWalker Field’s enplane-ments increased by 0.4%. The facility moved upone place in the ranking of U.S. airports, from194th to 193rd.
Airport Activity 2000 2001 2002 2003 2004 2005 2006 2007b 2008c
Passengers (In Thousands)a
Denver Internatinal Airport (DIA) 38,751.7 36,092.8 35,651.9 37,505.1 42,393.8 43,387.4 47,325.0 49,302.3 51,088.5Colorado Springs Airport (COS) 2,424.7 2,131.8 2,136.4 2,023.3 2,069.5 2,061.7 2,034.0 1,906.0 1,786.0Walker Field Airport (Grand Junction) (GJT) 273.2 240.1 250.9 255.2 288.1 319.4 320.6 326.1 331.8Eagle County Regional Airport (EGE) 369.1 331.3 339.5 336.7 388.3 426.5 434.1 445.0 456.2Aspen/Pitkin County Airport (ASE) 430.2 375.7 376.7 379.8 368.5 387.9 403.3 399.7 396.1Yampa Valley Regional Airport (HDN) 229.5 201.5 214.0 204.8 240.6 259.5 262.9 268.4 273.9Durango-La Plata County Airport (DRO) 182.6 182.8 204.4 172.4 194.2 203.5 227.0 234.9 243.1Montrose Regional Airport (MTJ) 134.5 137.5 141.6 138.8 144.9 157.3 164.6 169.9 175.3Gunnison-Crested Butte Regional Airport (GUC) 110.3 88.5 81.9 75.4 76.8 89.7 96.1 94.4 92.7Fort Collins-Loveland Municipal Airport (FNL) na na na 20.6 63.9 69.3 65.7 87.6 116.8Telluride Regional Airport (TEX) 34.2 38.4 35.0 30.8 37.0 36.3 32.9 32.7 32.5Cortez Municipal Airport (CEZ) na 16.5 12.3 13.5 15.7 16.4 18.5 18.9 19.4San Luis Valley Regional/Bergman Field (ALS) na 9.4 7.8 7.7 10.4 10.9 10.9 11.2 11.6Pueblo Memorial Airport (PUB) na 8.4 7.0 7.8 9.0 8.1 9.9 10.3 10.7
Total Passengers 42,940.0 39,854.5 39,459.4 41,171.7 46,300.7 47,433.9 51,405.6 53,307.5 55,034.6
Cargo, Freight, and Air Mail (In Millions)DIA Freight and Express 676.3 563.6 636.3 610.1 621.0 615.6 580.2 577.3 574.4DIA Air Mail 363.4 227.2 95.6 107.4 78.8 67.6 41.4 35.0 29.6
DIA Total 1,039.7 790.8 731.9 717.5 699.8 683.2 621.6 612.3 604.0Colorado Springs Freight and Cargo 39.5 39.7 40.6 36.3 35.5 33.1 32.6 31.6 30.6Colorado Springs Air Mail 4.4 4.4 3.0 1.1 1.0 0.3 0.0 0.0 0.0
Colorado Springs Total 44.0 44.1 43.6 37.4 36.5 33.5 32.6 31.6 30.6aPassengers include enplanements and deplanements.
cForecast.
Sources: Denver International Airport, Colorado Springs Municipal Airport, Grand Junction Walker Field, Federal Aviation Administration, and the Colorado Business Economic Outlook Committee.
C
bEstimated.
COLORADO AIRPORT STATISTICS2000–2008(In Millions)
continued on page 38
37
2008 Colorado Business Economic Outlook

The major ski resort airports, such as EagleCounty, Aspen/Pitkin County, and YampaValley,rank 165th, 175th, and 206th, respectively, in thenumber of boardings.
Denver International Airport
DIA is owned and operated by the City andCounty of Denver. Approximately 1,000 people areemployed by the city’s Department of Aviation.
In 2006, DIA served more than 47.3 million pas-sengers, finishing the year as the 5th-busiest airportin the United States and the 10th-busiest in theworld. The facility appears headed for a fourthstraight record in 2007, with nearly 38 million pas-sengers through September.
DIA’s major carrier, United Airlines, accounts forapproximately 51% of the airport’s total passengertraffic.United provides nonstop service tomore than100 destinations from Denver, the second-largesthub in the carrier’s network. Frontier Airlines, whichserves more than 50 destinations nonstop fromDenver, is the second-largest carrier at DIA, han-dling about 24% of the airport’s passengers. South-west Airlines, which returned to the Denver marketin January 2006, is DIA’s third-busiest carrier, withjust under 6% of the total passenger traffic.
Nearly 30 other airlines, including regional carriers,also serve DIA. In addition to Frontier and South-west, other low-cost carriers (LCCs) in Denverinclude AirTran, AmericaWest/US Airways, andJetBlue. The growth of LCCs in Denver continuesto put downward pressure on fares and increaseairline choices for travelers.
DIA has completed several capital improvementsprojects in recent months, including a new regionaljet facility on the east end of Concourse B, and anew aircraft deicing pad to serve the 16/34 runwaycomplex.
In addition, a number of projects are underway,some of which will be completed in the near future:
• Construction of 10 new jet gates on the east endof Concourse C (to be finished within threeyears)
• Mod 4West parking structure (1,700 spaces,complete in late 2007)
• Phase 1 of Landscape Master Plan
• First phase of commercial-use development pro-gram at Peña and Gun Club Road, which willprovide retail and services to passengers andemployees
DIA has been profitable every year since it opened,and revenue is shared with the airport’s signatorycarriers. Moreover, DIA continues to receiveawards for efficiency and overall customer experi-ence. In 2005 and 2006, Business Traveller Magazinerated DIA as the “Best Airport in North America.”
Motor Freight Transportation andWarehousingNationwide, the trucking industry is comprisedprimarily of small carriers. American TruckingTrends estimated that 87% of trucking firms oper-ate six or fewer trucks, and data show the 10 largestpublic transportation companies represent lessthan 5% of the market. This is primarily due to the
low barriers to entry, making it relatively easy forindividuals to become over-the-road drivers—allthey basically need is a commercial driver’s license,a truck, and insurance. Although demand is driv-ing the market, there is a shortage of drivers. Inaddition, rising fuel, capital (truck), maintenance,and insurance costs are forcing many of the smalleroperators out of the market in Colorado.
Why the driver shortage? Assume that a driverreceives $0.40 per mile. The individual must drive120,000 miles per year to earn $48,000. Driving 60miles per hour translates into 2,000 hours of workbefore loading time and down time. Increased reg-ulation capping the allowable hours driven, cou-pled with empty hauls and soaring fuel prices, onlyadd greater challenges to the business. Nationally,diesel prices have increased more than 6% fromSeptember 2006 to September 2007, and more than109% from 2002 to 2007. No wonder large carriersreported 116% employee turnover, and small carri-ers noted 90% turnover in the second quarter of2006. One owner of a large freight company com-mented, “Turnover rates in our drivers is a very realproblem across the industry in Colorado; quitefrankly it is out of control, we have been lucky tokeep 73% of our drivers, most others have it worseoff than we do.We are about equal in pay scale butwe find the additional benefits (health, dental, life),flexible scheduling, and hiring bonuses paid outover 3–5 year periods, has been the key to our rela-tive stability.”
Colorado carriers have one additional compoundingfactor—more freight is coming into the state than
2008 Colorado Business Economic Outlook
38
Trade, Transportation, and Utilitiescontinued from page 37

2008 Colorado Business Economic Outlook
39
continued on page 40
Wholesale Retail Total Transportation Percentage Year Trade Trade Trade and Warehousing Utilities Total TTU Change 1998 92.5 230.8 323.3 60.7 8.4 392.4 2.9% 1999 94.5 239.3 333.8 62.8 8.2 404.9 3.2 2000 99.4 245.2 344.6 66.3 8.0 418.9 3.5 2001 99.8 245.7 345.5 69.5 8.0 423.0 1.0 2002 95.1 242.7 337.8 66.2 8.1 412.1 -2.6 2003 92.1 239.5 331.6 65.0 7.9 404.5 -1.8 2004 91.9 241.3 333.2 65.5 7.9 406.6 0.5 2005 93.5 245.8 339.3 65.7 8.0 413.0 1.6 2006 96.4 248.3 344.7 66.7 8.1 419.5 1.6
2007a 99.0 254.6 353.6 68.7 8.3 430.6 2.6 2008b
100.0 257.6 357.6 69.9 8.5 436.0 1.3aEstimated.bForecast.
Source: Colorado Department of Labor and Employment and Colorado Business Economic Outlook Committee.
T TRADE, TRANSPORTATION, AND UTILITIES EMPLOYMENT1998–2008
(In Thousands)
going out. Colorado’s lowmanufacturing base andstrong high-tech base results in fewer goods beingshipped out of Colorado, and hence lower prices onoutbound goods.A discount on outbound goods iscaused by carriers’ need to fill trucks. Polling a few ofthe major Colorado trucking firms found that theaverage outbound price in Colorado is $1.05 permile compared to inbound at $1.95.At first glance,the low cost on out-bound shipments may sparkinterest for luringmanufacturers to the state; how-ever, the inbound cost of rawmaterials is higherthan average. Therefore, locating near to suppliers orcustomers is a strategy for industry competitiveness.As one trucking company CEO explained,“We aregetting paid nearly double for an inbound load vs.an outbound load, sometimes you just feel lucky ifyou even get an outbound load.”
In Colorado, retail fuel prices have increased nearly7% over 2006 (September to September), andmore than 98% since 2002. To an extent, costs arebeing passed along to the customer, but pricescharged do not react as quickly as fuel prices,which depend on the market and can change daily.In fact, in some cases fuel surcharges can be a profitcenter for larger companies that can buy fuel withvolume discounts. Ironically, it is also the same fuelcharges that are driving out the smaller “mom andpop” businesses because they cannot compete onvolume, and if they pass on charges to the cus-tomer, they lose out to larger competitors.
With the first half of 2007 pointing to a strong yearfor Colorado’s trucking industry employment, theyear is expected to finish 2.2% higher than in 2006.Employment should grow in 2008, but at a slower
rate, approximately 1%. Transportation companyexpansion plans range from 2% to 9%. The head ofone of Colorado’s largest trucking firms com-mented, “It’s not that we are not growing, it’s thatwe can’t find enough drivers to meet that growth.”Watch the retail trade and wholesale trade activityin Colorado as an indicator of the trucking indus-try, given the correlation between the sectors (0.81and 0.66, respectively).
UtilitiesColorado’s utilities are a key component of thestate’s plan to reduce carbon emissions and addressenvironmental issues. Demand for electricity and
natural gas continues to grow, however, drivingdemand for new production and more conserva-tion efforts.
In 2007, the Colorado legislature increased therenewable energy standard from 10% by 2015 to20% by 2020 and established energy-savings andpeak-reduction goals for utility energy efficiencyand demand-side management programs. At thesame time, the governor proposed the ColoradoClimate Action Plan that calls for a 20% reductionin carbon emissions by 2020.

2008 Colorado Business Economic Outlook
40
Xcel Energy, Colorado’s largest utility, is deter-mined to be a utility industry leader in providingsolutions to concerns about global climate changeand regional environmental issues. As a result, thecompany has proposed a resource plan built aroundsignificant renewable energy and demand-sidemanagement additions that go above and beyondthe levels required to meet the minimum goals ofthe legislature and governor. The utility plans toachieve these reductions through a combination ofadditional coal plant retirements, increased levelsof conservation, and more carbon-free generatingresources to serve customer growth.
Colorado’s natural gas producers have outpacednew pipeline additions, keeping prices much lowerin the state when compared to national levels.Whole-sale natural gas prices averaged $3.85 in Coloradoin the first 10 months of 2007, compared to $6.94nationally. Lower wholesale natural gas prices haveheld down both retail natural gas prices and elec-tricity prices in the state. However, Colorado’s rela-tively cheap natural gas prices are expected to movetoward market levels as new pipeline capacitycomes online starting in early 2008.
Electricity consumption has continued to increasewith population and economic growth. Electric
consumption in Colorado grew from 49,734 mil-lion Kwh in 2006 to an estimated 51,502 millionKwh in 2007, and is expected to climb to 52,633million Kwh in 2008. The state’s rate of electricityconsumption growth rose from 2.9% in 2006 to3.6% in 2007.
Natural gas consumption has also continuedto grow along with the economy and increaseddemand from gas-fired combustion turbines. Therate of growth is anticipated to slip, with morecoal-fired and renewable generation coming onlinein 2008 and 2009. �
Trade, Transportation, and Utilitiescontinued from page 39
Year Nonresidential Residential Total Percentage
Change1998 26,922 12,652 39,574 4.0%1999 27,440 13,131 40,571 2.52000 28,991 14,029 43,020 6.02001 29,766 14,470 44,236 2.82002 30,512 15,425 45,937 3.82003 30,770 15,725 46,495 1.22004 31,192 15,532 46,724 0.52005 31,917 16,436 48,353 3.52006 32,782 16,952 49,734 2.9
2007a 33,871 17,631 51,502 3.6 2008b
34,681 17,952 52,633 2.2aEstimated.bForecast.
Source: Edison Electrical Institute Statistical Yearbook, Xcel Energy, and Colorado Business
Economic Outlook Committee.
1
COLORADO ELECTRIC POWER CONSUMPTION1998–2008
(In Millions of Kilowatt Hours)
YearTotal Gas
ConsumptionPercentage
Change1998 330.2 5.0%1999 333.1 0.92000 367.9 10.42001 463.7 26.02002 459.4 -0.92003 436.3 -5.02004 439.6 0.82005 470.7 7.12006 442.8 -5.9
2007a 462.9 4.5 2008b
466.1 0.7aEstimated.bForecast.
Source: Colorado Business Economic Outlook Committee.
COLORADO NATURAL GAS CONSUMPTION1998–2008
(In Billions of Cubic Feet)

2008 Colorado Business Economic Outlook
41
OverviewInformation infiltrates our daily lives and workroutines through newspapers, Internet, television,cell phones, movies, and radio. Comprised of adiverse assemblage of Colorado companies, theInformation Supersector is involved in the compi-lation, transmission, and distribution of informa-tion and cultural products, including data andcommunications. This includes publishing, motionpicture, broadcasting, telecommunications, anddata processing, hosting, and related services.
After years of industry contraction, impacted by in-dustry consolidation and advances in productivity,the Information Supersector has shown convincingsigns of stability, with employment expected toremain nearly flat for 2007 and increase marginallyin 2008. Information employment, which peakedat 108,400 in 2000, bottomed at 75,600 in 2006.
Information’s contribution to Colorado’s GDP,which was 10.6% in 2000, held steady at 8.5% in2005 and 2006.Most impressive are industrywages, which grew more than 11% from 2005–06,compared to 4.6% for all industries in Colorado.
In 2006, Colorado had a greater concentration ofInformation jobs than the national economy, 3.4%compared to 2.3%, respectively. Additionally, thesupersector represented 1.6% of all establishments,3.5% of earnings, and 4.4% of GDP of the nationaleconomy, while it accounted for 2.6% of establish-ments, 5.9% of earnings, and 8.5% of GDP inColorado. Roughly 66% of GDP earned in Colo-rado’s Information Supersector is earned in thetelecommunications and broadcasting industries,27% in the publishing industry, 6% in the informa-tion and data processing industries, and 1% in themotion picture and sound recording industries.
PublishingAs the second-largest Information subsector, pub-lishing employed nearly 28,600 people in 1,227establishments during 2006. The publishing indus-try includes any firm that issues print or electroniccopies of original works for which they own acopyright. Products include newspapers, periodi-cals, books, directories, databases, calendars, greet-ing cards, software, and Internet material. Theindustry is increasingly producing material in for-mats other than traditional print, such as audio,downloadable files, and CD-ROM.
Publishing has undergone substantial increasesin efficiencies over the last seven years.While thenumber of publishing jobs in Colorado, excludingInternet, fell by 19.2% between 2000 and 2005, the
Information
continued on page 42
COLORADO GROSS DOMESTIC PRODUCT: CONTRIBUTION OF INFORMATION SUPERSECTOR1998–2006
(In Millions of Current Dollars)
Sector 1998 1999 2000 2001 2002 2003 2004 2005 2006Information Sector Total $12,971 $15,845 $18,222 $17,737 $17,547 $17,408 $17,896 $18,164 $19,534 Publishing 2,866 3,474 3,777 3,793 3,835 3,959 4,330 4,867 n/a Motion Picture/Sound Recording 184 353 637 763 256 230 190 196 n/a Broadcasting/Telecommunications 9,546 11,533 12,937 12,261 12,491 12,247 12,356 11,986 n/a Information/Data Processing Services 375 485 870 920 965 972 1,020 1,115 n/a
Colorado Total GSP (All Industries) $143,160 $156,284 $171,862 $178,078 $182,154 $187,397 $198,407 $214,337 $230,478
Information as Percentage of Colorado Total 9.1% 10.1% 10.6% 10.0% 9.6% 9.3% 9.0% 8.5% 8.5%
Source: U.S. Department of Commerce, Bureau of Economic Analysis.

While many readers continue to demand aprint edition, circulation of the print edi-tions and local advertising revenue aregradually diminishing each year as peopleincreasingly turn to the Internet for newsand to post and respond to classifiedadvertisements.
Informationcontinued from page 41
administrators; most authors are freelance workersand are classified in the services industry. Authorswho publish their own books have an ever-increas-ing presence in Colorado, and are not representedin the establishment figures above. Employment inColorado’s book publishing industry is expected tocontinue to decrease in 2007 and 2008.
Periodical PublishersColorado’s periodical publishers employed 2,874people in 280 establishments during 2006. Afterfalling steadily between 2001 and 2004, employ-ment in Colorado’s periodical publishing industrystabilized in 2005 and grew slightly in 2006.Employment in this sector is expected to continueto increase at rates lower than 1% in 2007 and2008.
Directory PublishersColorado’s directory publishers are thriving. Thesefirms, which include DexMedia, one of the largestdirectory publishers in the nation, are enjoyingstrong growth in advertising revenue. Indeed,DexMedia sold a record 1,365 pages of advertisingin its 2007 directory, up 14.3% from the 2006directory. Directory and mailing list publishersemployed 2,318 people in 64 establishments inColorado during 2006; it is the only sector inColorado’s publishing industry in which more peo-ple were employed in 2006 than in 2001.Employment in the industry has risen each yearsince 2002, and is expected to continue that trendin 2007 and 2008.
Denver Newspaper Agency generates revenue fromthe platform by licensing it to other newspaperpublishers.
Newspapers in Colorado employed close to 7,000employees in 2006 in 191 establishments.Newspaper employment decreased 2% in 2006,and is expected to continue to slide in 2007 andremain flat in 2008.
Book PublishersThe U.S. book publishing industry is dominated bya handful of large firms, most of which are head-quartered in NewYork City. Book publishers inColorado tend to be fairly small firms that special-ize in certain subjects. The number of book pub-lishing establishments in the state has increasedfrom 115 establishments in 2001 to 126 in 2006.Meanwhile, employment in these firms has fallenevery year since 2001, from 1,439 jobs in 2001 to1,188 in 2006. Jobs in these firms tend to includeeditors, marketers, production staff, and general
industry’s contribution to the state’s real GDP in-creased 67%, to $5.1 billion. Employment in tradi-tional publishing industries has continued to declinein 2007, though at much slower rates. Publishingfirms are facing the challenge of new competitors,both locally and globally, entering the fray in everypart of the industry owing to the low entrancebarriers presented by the Internet. Employmentis expected to decrease 0.9% in 2007 and riseslightly in 2008.
Newspaper PublishersNewspapers in Colorado and nationwide are facinga marketing dilemma.While many readers con-tinue to demand a print edition, circulation of theprint editions and local advertising revenue aregradually diminishing each year as people increas-ingly turn to the Internet for news and to post andrespond to classified advertisements. Coloradonewspapers have responded by providing free websites with partial coverage and selling subscriptionsto online versions of their print editions.
The Denver Newspaper Agency has addressed thispredicament by developing YourHub.com, a trulyinnovative community-level platform that providesspecialized web sites to 44 Colorado communitiesand publishes 15 print editions on a weekly basis.The large majority of the work published onYourHub.com is written by individuals in the com-munity. Not only has the site allowed the DenverNewspaper Agency to generate additional revenuefrom individuals and businesses that otherwisemay not have advertised in the print editions of theDenver Post and the Rocky Mountain News, the
42
2008 Colorado Business Economic Outlook

The convergence of technology continues,along with the trend toward consolidationof companies and assets within the tele-com sector.
continued on page 44
Federal ContractsNationally, the Government Services Administra-tion has named Qwest,Verizon, and AT&T as thefinalists in the federal government’s NetworxUniversal program, which is intended to revampand completely upgrade the government’s voice,data, video, satellite, IP, and wireless capabilities.These three companies will compete for a series ofcontracts, currently valued between $20 billion and$48 billion, to provide telecom service to 135 out of184 federal agencies globally over the next 10 years.In addition, both Qwest and Level 3 have qualifiedto participate in the federal government’s NetworxEnterprise contract program, a group of upgradeprojects worth a combined $20 billion over thenext 10 years.
TelephoneTwo companies this year filed letters of intent withthe Colorado Public Utilities Commission (PUC)to provide local exchange service in rural parts ofthe state, and a third has sought expanded access tofederal and state high-cost funds in order to extendits reach within rural Colorado. The commissionhas granted an application by 360networks (USA),Inc. to provide local exchange service throughoutthe service areas of CenturyTel of Colorado andCenturyTel of Eagle. Sprint Communications hasfiled for similar authority; its application is stillpending. As well, N.E. Colorado Cellular, Inc.,doing business as Viaero, has applied to expand itscurrent eligibility for state and federal high-cost
FiberLevel 3 Communications benefited from industryconsolidation by acquiring additional miles offiber, as well as connections to office buildings dueto the required AT&T divestiture following themerger with SBC. The Broomfield-based com-pany’s aggressive growth strategy has led it toacquire seven companies since 2005. Its latestacquisition is Texas-based Broadwing Corp., whichcould reduce Level 3’s Colorado workforce by100–200 employees. The company is expected toprofit from the coming bandwidth boom, espe-cially with expanded use of the Internet for trans-ferring and downloading video files that will likelyboost demand for its services.
A new Colorado-based entrant in the “last mileof fiber”market began operations in 2007. ZayoBroadband, based in Louisville, Colorado, provideshigh-speed Internet access and related services tobusinesses in the Northeast andMidwest. The com-pany has 8,400 miles of fiber and 830 connectedoffice buildings. It currently has 20 employees at itsLouisville headquarters, and plans to expand thatnumber to 300.
Software PublishersSoftware publishing companies design, providedocumentation, install, offer support services, anddistribute software. The U.S. Bureau of LaborStatistics is projecting the software publishingindustry to be the third-fastest growing industryin the U.S. economy, with a 68% increase between2004 and 2014, almost five times the growth rateprojected for all industries. Nationwide, employ-ment in the software publishing industry has beengrowing at modest rates since mid-2005 as technol-ogy continues to drive efficiencies. In Colorado,however, employment in the software publishingindustry decreased through 2006. The softwarepublishing sector, the largest sector in Colorado’spublishing industry, employed 12,672 people in539 firms in 2006. Employment in this sector isexpected to stabilize in 2007 and 2008.
TelecommunicationsSince 2001, employment in the telecommunica-tions sector in Colorado has been sliding. However,given increased capital investment and industrygrowth in niche areas, the sector should see a rever-sal, showing modest job growth of 0.5% in 2008.On the national level, the convergence of technol-ogy continues, along with the trend toward consol-idation of companies and assets within the telecomsector. Regulation and competition will also con-tinue to affect companies and customers, withadditional impacts deriving from infrastructuredevelopment, federal contracts, and private equityinvestment.
43
2008 Colorado Business Economic Outlook

Executives say the reason Comcast isdoing so well is due, in part, to the factthat it has been able to enter the tele-phone market faster than telephone com-panies such as Verizon and AT&T havebeen able to enter the video market.
Informationcontinued from page 43
of vouchers in order to assist viewers in makingthat transition, but so far the program has beenplagued by disorganization and a lack of publicawareness.
Simultaneously, the federal government is alsoattempting to transition cable providers from exist-ing, pre-programmed set-top boxes to units thataccommodate external circuit cards with securityfeatures to block certain channels and prevent pro-gramming theft. The rules are intended to allowconsumers to buy a standard box off the shelf anduse it with any cable service, instead of renting abox from the cable company.
Speculation exists about the consolidation in thesatellite sector between DirecTV and Echostar. Thishas been tempered, however, by the realization thata merger between the two companies would leaverural customers of each carrier without a competi-tive choice. In 2007, Denver-basedWildBlue acti-vated its own satellite, a move that will greatlyexpand its customer capacity, increasing its sub-scriber numbers from about 130,000 to approxi-mately 750,000.
Cable provider Comcast grew significantly in 2007,reporting a 31% increase in revenue in the first halfof the year relative to the same period in 2006. Thecompany will boost its capital spending in 2008 bynearly 24%. Executives say the reason Comcast isdoing so well is due, in part, to the fact that it hasbeen able to enter the telephone market faster thantelephone companies such as Verizon and AT&Thave been able to enter the video market. In thesecond quarter of 2007 Comcast added 671,000
require localities to consider franchise applicationswithin 90 days and prohibit implementation of“build-out” requirements by cities. Such require-ments could potentially require new entrants tomake their services available to all citizens in agiven franchise area.
In the wake of that order, cities such as Arvada,Glendale,Wheat Ridge, Northglenn, and Brightonhave passed emergency rules requiring franchiseapplicants to supply additional informationbeyond what has been considered normal and rea-sonable in evaluating a franchise application,including the time tables, locations, and specifica-tions for the applicant’s build-out plans. Qwest isexpected to push for a new law in Colorado thatwould move franchising authority from the citiesto a state agency, most likely the PUC.
The struggle over franchising authority hasbrought additional uncertainty to the industry, andwill likely have a restraining effect on employmentand economic development.
Video distributors are also faced with a February2009 deadline for converting analog signals to digi-tal. The federal government has envisioned a system
funds to include additional areas in southern andeastern Colorado.
In 2007, Qwest marked its sixth consecutive quar-ter of profitability, largely credited to the com-pany’s cost-cutting moves and sales of bundledservices. The fact that Qwest has turned the cornerfinancially, coupled with large inflows of privateequity investment, has fueled rumors that the com-pany could be a take-over target by a private equityfirm. Qwest is currently the only Regional BellOperating Company that has not embarked on amajor overhaul of its plant. At year-end, the com-pany still has nearly $15 billion in debt on itsbooks, and this, in turn, has led some analysts toconclude that any new investment by the companywill be slow and targeted to those markets in whichQwest is already feeling competitive pressure, suchas Phoenix and Omaha. Qwest laid off 100 infor-mation technology workers in 2007—roughly 10%of its IT staff in Colorado. The firm now employsabout 38,000, with 9,400 of those in Colorado.
TelevisionAmajor legislative battle is brewing in 2008 overthe concept of statewide video franchises.Complexity arises from county and municipal gov-ernments at risk of losing their traditional author-ity, cable companies defending existing franchises,and competition from new entrants, such as tele-phone providers.
In December 2006, the FCC voted to preempt localvideo franchise restrictions for AT&T,Verizon, andother cable competitors. The new FCC regulations
44
2008 Colorado Business Economic Outlook

continued on page 46
Percentage Percentage Percentageof Total Info of Total Info 2005 Average 2006 Average Change in
Category Employees FirmsaAnnual Wages Annual Wages Wages
Telecommunications 36.8% 22.6% $77,163 $91,947 19.2%Publishing Industries, except Internet 37.7 34.4 67,373 72,879 8.2ISPs, Search Portals, and Data Processing 9.4 17.1 77,074 79,686 3.4Broadcasting, except Internet 8.7 5.7 55,344 57,149 3.3Motion Picture and Sound Recording 5.8 14.1 22,294 23,719 6.4Internet Publishing and Broadcasting 1.4 5.2 70,015 71,776 2.5Other Information Services 0.2 1.0 49,135 53,458 8.8Total Information 100.0% 100.0% $68,641 $76,267 11.1%
Information in Denver Metro Area 63.1% 51.6% $73,847 $83,638 13.3%Information in Rest of State 36.9% 48.4% $59,954 $63,673 6.2%
Total All Industries $41,600 $43,506 4.6%aDue to rounding, the sum of the individual items may not equal the total.
Note: Differences occur between ES202 data and CES data series.
Source: Colorado Employment and Wages (ES202) and Colorado Business Economic Outlook Committee.
2006 INFORMATION EMPLOYMENT, WAGES, AND ESTABLISHMENTS
Comcast opened a new business services customersupport center in Centennial, employing about 100workers at the time of start-up. The firm intends todouble that by the end of 2007 and eventually hirean additional 150, bringing the center’s total to 350workers. Comcast has about 4,000 employees inColorado.
Nippon Telephone and Telegraph (NTT) opened aconsulting business office in Douglas County thatreportedly will employ 200 workers when fullystaffed. The facility will serve as headquarters forNTT subsidiary The Revere Group, a business andtechnology consulting firm now based in Chicago.
rather than managing the operational complexitiesof being a telecom provider.
Call CentersSeveral companies opened new call centers in thestate in 2007. AT&T dedicated a new call center inPueblo, initially employing about 400 and slated toincrease that number to 500 by year-end 2007. TheCity of Pueblo gave tax incentives of $5.6 million toattract the center, which will provide customerassistance to wireless service subscribers. AT&Talso plans to launch a new high-speed wireless net-work in Colorado in 2007.
new telephone subscribers, for a total of 3.0 mil-lion. Its high-speed Internet business grew by anadditional 330,000 subscribers, to 12.4 million.
VoIPThe introduction of VoIP service by independentcompanies has been fraught with difficulties rang-ing from patent infringement lawsuits to techno-logical problems. However, Golden-based NewGlobal Telecom (NGT) introduced a Private LabelVoIP Service in 2007, which includes core VoIPpackages among other products and services. Thecompany reports Private Label is targeted atproviders who prefer to focus on selling services
45
2008 Colorado Business Economic Outlook

Occupational Title Employment Estimates Average Hourly WageComputer and information scientists, research 450 $42.45Computer and information systems managers 4,460 52.29Computer hardware engineers 3,140 48.81Computer programmers 6,010 35.07Computer science teachers, postsecondary 640 NAComputer software engineers, applications 13,590 41.14Computer software engineers, systems software 10,640 41.07Computer specialists, all other 5,710 33.47Computer support specialists 14,040 23.37Computer systems analysts 11,360 35.5Database administrators 2,370 33.74Network and computer systems administrators 7,100 33.96Total 79,510 NA
Source: Colorado Department of Labor and Employment.
COLORADO INFORMATION TECHNOLOGY LABOR MARKET BY OCCUPATIONAL TITLE, 2006
However, an important issue that remains unad-dressed is how to foster and encourage broadbanddeployment in a more ubiquitous manner. In themain, lawmakers agree that the United States lagsfar behind other developed nations in the numberof high-speed Internet subscribers, service afford-ability, and download speeds, and that the federalgovernment still lacks a solid plan to change thatsituation. A solution remains unclear.
Furthermore, a great deal of uncertainty exists onhow to reform and reinvigorate the federal univer-sal service fund that provides assistance to compa-nies serving rural and insular areas of the country.
WirelessColoradoWireless Communities is a consortiumof 10 cities, including Arvada, Boulder, Broomfield,Golden, Thornton, andWheat Ridge, that plans toconstruct a wireless broadband network covering200 square miles. The service will cover more than600,000 people.
A joint privately funded wireless broadband proj-ect by Sprint Nextel, and Clearwire, usingWiMaxtechnology was scrapped in November 2007. TheDenver network would have been part of a $5 bil-lion push by Sprint to complete a nationwide wire-less broadband network. Separately, Qwest is alsopartnering with Sprint Nextel to provide a mobilebroadband service.
As of the fourth quarter of 2007,WisperTel hasalmost completed expansion of its wireless broad-band network to include Breckenridge, Dillon,Frisco, Keystone, and Silverthorne.
Companies (BOCs) and their independent incum-bent local exchange carrier (incumbent LEC) affili-ates. The old framework included requirementsthat the BOCs separate their local telephone andlong-distance operations, which is at odds with amarket environment where local and long-distanceservices are increasingly provided and marketed ona bundled basis. The new framework replaces thosemore burdensome regulations with less intrusivemeasures that, according to the agency, “protectimportant customer interests while allowing theBOCs and their independent incumbent LEC affili-ates to respond to marketplace demands efficientlyand effectively.”
The group is developing a customer base by target-ing U.S. subsidiaries of Japanese corporations.
Other call center highlights include the openingin 2007 of a Denver office by the Internet domainregistration and web-hosting firm GoDaddy.com.The office employs about 16 software engineers.On the other hand, the Safe Auto InsuranceCompany closed its call center in Sterling, leaving60 employees without jobs.
Federal RegulationsThis year the FCC established a new, lighter regu-latory framework to govern the provision of in-region, long-distance services by the Bell Operating
Informationcontinued from page 45
46
2008 Colorado Business Economic Outlook
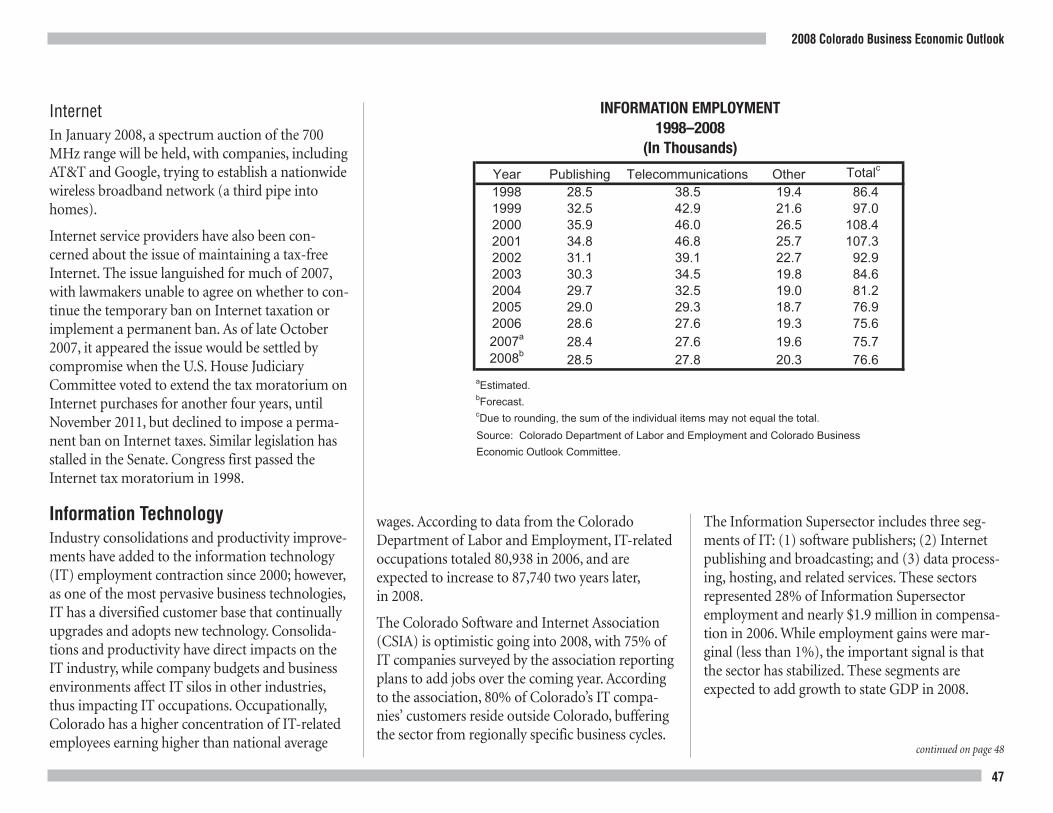
Year Publishing Telecommunications Other Totalc
1998 28.5 38.5 19.4 86.41999 32.5 42.9 21.6 97.02000 35.9 46.0 26.5 108.42001 34.8 46.8 25.7 107.32002 31.1 39.1 22.7 92.92003 30.3 34.5 19.8 84.62004 29.7 32.5 19.0 81.22005 29.0 29.3 18.7 76.92006 28.6 27.6 19.3 75.62007a 28.4 27.6 19.6 75.72008b
28.5 27.8 20.3 76.6aEstimated.bForecast.cDue to rounding, the sum of the individual items may not equal the total.
Source: Colorado Department of Labor and Employment and Colorado Business
Economic Outlook Committee.
INFORMATION EMPLOYMENT1998–2008
(In Thousands)
continued on page 48
The Information Supersector includes three seg-ments of IT: (1) software publishers; (2) Internetpublishing and broadcasting; and (3) data process-ing, hosting, and related services. These sectorsrepresented 28% of Information Supersectoremployment and nearly $1.9 million in compensa-tion in 2006.While employment gains were mar-ginal (less than 1%), the important signal is thatthe sector has stabilized. These segments areexpected to add growth to state GDP in 2008.
wages. According to data from the ColoradoDepartment of Labor and Employment, IT-relatedoccupations totaled 80,938 in 2006, and areexpected to increase to 87,740 two years later,in 2008.
The Colorado Software and Internet Association(CSIA) is optimistic going into 2008, with 75% ofIT companies surveyed by the association reportingplans to add jobs over the coming year. Accordingto the association, 80% of Colorado’s IT compa-nies’ customers reside outside Colorado, bufferingthe sector from regionally specific business cycles.
InternetIn January 2008, a spectrum auction of the 700MHz range will be held, with companies, includingAT&T and Google, trying to establish a nationwidewireless broadband network (a third pipe intohomes).
Internet service providers have also been con-cerned about the issue of maintaining a tax-freeInternet. The issue languished for much of 2007,with lawmakers unable to agree on whether to con-tinue the temporary ban on Internet taxation orimplement a permanent ban. As of late October2007, it appeared the issue would be settled bycompromise when the U.S. House JudiciaryCommittee voted to extend the tax moratorium onInternet purchases for another four years, untilNovember 2011, but declined to impose a perma-nent ban on Internet taxes. Similar legislation hasstalled in the Senate. Congress first passed theInternet tax moratorium in 1998.
Information TechnologyIndustry consolidations and productivity improve-ments have added to the information technology(IT) employment contraction since 2000; however,as one of the most pervasive business technologies,IT has a diversified customer base that continuallyupgrades and adopts new technology. Consolida-tions and productivity have direct impacts on theIT industry, while company budgets and businessenvironments affect IT silos in other industries,thus impacting IT occupations. Occupationally,Colorado has a higher concentration of IT-relatedemployees earning higher than national average
47
2008 Colorado Business Economic Outlook

audio and video productions. U.S. employment inthis industry has been growing at a brisk pace sinceearly 2005, culminating in double-digit rates sincelate 2006. Employment in Colorado’s Internetpublishing sector grew 12.1% in 2005 and 2.7%the following year. The number of establishmentsincreased from 95 in 2001 to 185 in 2006. Internetpublishing employed 1,078 people in Colorado in2006, and is expected to grow at moderate rates in2007 and 2008.
SummaryAfter nearly flat employment in 2007, theInformation Supersector is expected to add 900jobs in 2008. Growth in software publishing,Internet publishing, telecommunications, andmotion pictures will reverse a multiyear industrycontraction, driven in part by consolidations andproductivity gains. Colorado’s Information Super-sector concentration makes the state an exporterof related products and services.With higher thanaverage wages and a strong employment base, sta-bility in this industry is good for Colorado.�
interest as a location for commercials and anincrease in feature films.
In addition, after almost a decade of proposals tocreate a film incentive in Colorado, the ColoradoLegislature passed Colorado’s first-ever film incen-tive legislation in 2006 and expanded it in 2007. Anon-going conversation is taking place aboutexpanding the incentive program again in 2008,and if this occurs, Colorado could see a significantincrease in feature film production and the poten-tial to generate local jobs across a wide spectrum ofindustries. This incentive program is resulting inproduction companies looking at Colorado as afilm destination again, especially for low- to mid-budget productions. Film production incentivesare one of the leading reasons production compa-nies decide where to film their movies. The contin-ued growth of cable and satellite televisionproduction and related services will also lead toadditional job growth.
Internet PublishingCompanies in the Internet publishing sector pro-duce corporate web sites, blogs, online periodicals,online directories, electronic books, and digital
Other
Motion Picture and Television IndustryThe motion picture, television, and commercialproduction industry is evolving as a global indus-try. Locally, the industry has recently experiencedmodest growth, which should continue through2008.
The Colorado Film Commission has emerged as astabilizing influence in the statewide productioncommunity, leading the way to better communica-tion to communities about production opportuni-ties and other resources about potential productionprospects across the state.Moreover, it is once againmarketing Colorado as a production destination.The film commission is creating a more proactiveresponse to feature television and commercial pro-ducers, which is resulting productions being filmedin Colorado. For example, about $3.25 million wasspent in Denver in fall 2007 by a production com-pany filming a small segment of a major film to abe released in 2008. In addition, Colorado Springswill be the principle location for a feature film thattakes place on the Air Force Academy during thelate spring of 2008. Colorado is seeing continued
Informationcontinued from page 47
48
2008 Colorado Business Economic Outlook

Financial Activities
The Financial Activities Supersector is comprisedof two sectors: (1) Finance and Insurance and
(2) Real Estate and Rental and Leasing.
About 47% of the employees in the Finance andInsurance Sector work at credit intermediaries,such as banks, credit unions, and other consumersavings and lending organizations. Approximately36% of the workers in this sector are employed atinsurance carriers. The remainder work at securi-ties or investment firms or other miscellaneousfinance-related firms.
The Real Estate and Rental and Leasing Sectorincludes real estate-related payroll jobs and compa-nies that lease anything from real estate to equip-ment to formal wear.
Between 1997 and 2006, the Financial ActivitiesSupersector grew at an annualized rate of 1.9%compared to 1.6% for the state. Employment inthe Insurance and Securities Sectors increased at anaverage rate of 1.9%. Real estate and rental andleasing employment grew at a 2% annualized rate.
In 2007, the Finance and Insurance Sector isexpected to add approximately 800 jobs, while theReal Estate and Rental and Leasing Sector shouldgain 400 positions. In 2008, employment in theFinance and Insurance Sector will remain flat,while the Real Estate and Rental and Leasing Sectorshould add roughly 400 jobs.
Finance and Insurance
Commercial BankingThe commercial banking sector was certainly chal-lenged in 2007, with the subprime mortgage crisisseverely impacting bank balance sheets and prof-itability. Large banks typically hold more thanone-third of their assets in residential mortgagesecurities. On the whole, mortgage portfolios atcommercial banks tend to be more highly rated, sothese institutions largely avoid the solvency troubles
that have beset subprime lenders such as Country-wide Financial and New Century Financial.However, the broader shocks of the subsequentcredit crunch were inescapable, and many commer-cial banks were forced to substantially increase theirprovisions for loan losses. Combined, the world’slargest banks and securities firms announced morethan $30 billion of third quarter charges. Citigroup,for example, announced that third quarter 2007earnings fell 57%, largely a result of fixed incomewritedowns and losses.
Finance and Real Estate and
Year Insurance Rental and Leasing Totala
1998 100.2 42.6 142.81999 103.1 44.3 147.42000 101.9 45.1 147.02001 102.3 46.0 148.32002 103.5 46.1 149.52003 107.1 47.1 154.12004 107.3 47.3 154.62005 110.3 48.3 158.52006 111.5 49.2 160.7
2007b112.3 49.6 161.9
2008c112.3 50.0 162.3
aDue to rounding, the sum of the individual items may not equal the total.bEstimated.cForecast.
Source: Colorado Department of Labor and Employment and Colorado Business
Economic Outlook Committee.
FINANCIAL ACTIVITIES EMPLOYMENT1998–2008
(In Thousands)
continued on page 50
49
2008 Colorado Business Economic Outlook

In the longer term, the commercial banking land-scape continues to be dramatically transformed byconsolidation stemming from the industry deregu-lation that took place during the late 1980s andearly 1990s. For the foreseeable future, the numberof commercial banks in the United States is antici-pated to continue declining.Moreover, technologydevelopments remain an important influence oncommercial banking operations.With services suchas online banking, direct deposit, remote depositcapture, and automatic bill pay, the business ofbanking has become truly “on-demand,” and ques-tions about the future of traditional “brick andmortar” banking have begun to surface.
Savings and LoansAfter the savings and loan (S&L) industry crisis inthe late 1980s, and the extensive consolidation thatfollowed during the 1990s, the number of S&Ls inthe country, and their relative importance to theoverall economy, has been dramatically dimin-ished. Depository credit intermediation firms totalabout 28,000 in Colorado. For the sake of compari-son, about 1,500 are S&Ls, 4,400 are credit unions,and 22,000 are commercial banks.
In 2007, S&Ls have struggled mightily againstmortgage market malaise.Washington Mutual, thelargest U.S. S&L, recently announced a 72% declinein third quarter 2007 net income and plans to in-crease reserves as high as $1.3 billion to coveranticipated loan losses in the fourth quarter. Similarto commercial banking, poor financial performanceat S&Ls is expected to impede expansion and jobgrowth in the sector.
2008 Colorado Business Economic Outlook
50
The subprime mortgage collapse also spawnedilliquidity in markets for asset-backed commercialpaper, further affecting balance sheets at commer-cial banks. Unable to reissue commercial paper,companies increasingly turned to banks for credit.As a result, the volume of commercial and indus-trial loans has surged by nearly $100 billion sincelate July 2007.
While the October 2007 interest rate cuts by the Fedshould help to alleviate immediate credit concerns,
widened credit spreads—reflecting a more realisticpricing of risk throughout the economy—will havecontractionary impacts in the near term.Withhousing prices remaining depressed and an enor-mous number of adjustable rate mortgage loansfacing the first payment reset over the next twoquarters, financial woes are expected to persist forcommercial banks well into 2008. Diminished prof-itability will certainly inhibit bank expansion initia-tives and could potentially result in labor cutbacks.
Year
CreditIntermediationand Related
Activities
Securities,Commodities, and
Other Activities
Insurance Carriersand Related
Activities
Other Financeand Insurance
Activities Total
1998 44.1 13.9 38.7 3.5 100.21999 45.3 15.3 40.2 2.3 103.12000 43.5 17.9 38.9 1.6 101.92001 45.0 17.4 39.0 0.9 102.32002 47.4 15.1 39.3 1.7 103.52003 50.7 13.9 39.5 3.0 107.12004 51.5 13.4 39.5 2.9 107.32005 53.3 13.7 40.2 3.1 110.32006 53.7 14.6 40.0 3.2 111.5
2007a 53.1 15.2 40.2 3.8 112.3 2008b
52.7 15.2 40.3 4.1 112.3aEstimated.bForecast.
Source: Colorado Department of Labor and Employment and Colorado Business Economic Outlook Committee.
FINANCE AND INSURANCE EMPLOYMENT1998–2008
(In Thousands)
Financial Activitiescontinued from page 49

51
continued on page 52
2008 Colorado Business Economic Outlook
niche financial solutions. Successfully filling a voidin members’ financial needs, as well as providingsmall businesses affordable financial alternatives,leaves Colorado credit unions healthy. The not-for-profit, financial cooperative structure of creditunions remains well-capitalized.
Financial MarketsThe classic central banker axiom that the punchbowl of easy monetary policy needs to be removedjust when the party has gotten started is prescientnow. The Federal Reserve drove the fed funds tar-get rate up from 1% in 2004 to 5.25% in 2006.
Credit UnionsAs anticipated, consolidations in credit unionscontinued in 2007. This trend is primarily drivenby tight interest margins, increasing costs, and theneed to create sustainable economies of scale.These pressures are not expected to ease muchin 2008.
Intense competition and easy access for consumersto rate shop means that tight interest margins arehere to stay. Like many small businesses, higher costsare felt in technology and personnel. Providing andmaintaining secure electronic access to productsand services is essential in today’s marketplace.
Although demand for, and usage of, electronicdelivery is high, the need to maintain convenientlylocated brick and mortar has not dropped.
Providing health insurance benefits to employeeshas been a challenge for credit unions.Many haveexperienced annual double-digit increases, leadingthem to continually investigate affordable options.Another expense burden credit unions face today isthe cost of complying with stricter regulatoryrequirements.
Fortunately for members, these pressures have ledcredit unions to look closely at their current andpotential membership for opportunities to develop
Year S&P 500 Dow Jones NASDAQBloomberg
Colorado Index S&P 500 Dow Jones NASDAQBloomberg
Colorado Index
1997 970.4 7,908.3 1,570.4 148.0 100.0 100.0 100.0 100.01998 1,229.2 9,181.4 2,192.7 143.7 126.7 116.1 139.6 97.11999 1,469.3 11,497.1 4,069.3 230.6 151.4 145.4 259.1 155.92000 1,320.3 10,788.0 2,470.5 228.2 136.1 136.4 157.3 154.32001 1,148.8 10,021.6 1,950.4 204.4 118.4 126.7 124.2 138.12002 879.8 8,341.6 1,335.5 167.2 90.7 105.5 85.0 113.02003 1,111.9 10,453.9 2,003.4 237.0 114.6 132.2 127.6 160.22004 1,211.9 10,783.0 2,175.4 278.9 124.9 136.4 138.5 188.52005 1,248.3 10,717.5 2,205.3 326.0 128.6 135.5 140.4 220.42006 1,418.3 12,463.2 2,415.3 382.5 146.2 157.6 153.8 258.5
Source: Free Lunch (Economy.com), Bloomberg, and Colorado Business Economic Outlook Committee.
Value Index (1997=100)
FINANCIAL MARKETS: STOCKS1997–2006
(Year-End Close)

2008 Colorado Business Economic Outlook
Financial Activitiescontinued from page 51
From June 29, 2006, through most of 2007,monetary policy was left unchanged. Exuberantparty goers began to sober up and notice that thepunch bowl was gone, and some of them had athrobbing headache. At the September 18, 2007,Federal OpenMarkets Committee (FOMC) meet-ing, the fed funds target rate was cut 50 basispoints, from 5.25% to 4.75%. This rate was cutanother 25 basis points, to 4.50%, at the October31, 2007, FOMCmeeting.
When money is too cheap it is deployed inefficient-ly, and sometimes risks are ignored or mispriced.The signs were there, just as they were there whenstocks ran up in the late 90s. In the late 90s onecould surf the channels on television and find anynumber of programs touting the quick path towealth was via the stock market. Seven years laterthe NASDAQ has yet to revisit the lofty levels ittraded at in 2000.
More recently, one could surf television channelsand find any number of programs touting the quickpath to wealth was in the residential real estate mar-ket. It seemed as if anybody could get a mortgage.The percentage of homeowners in the UnitedStates surged to record highs.Many seemed tobelieve that home price appreciation would alwaysbe positive and as long as it was, subprime lending,minimally documented loans, teaser rates, and neg-ative amortization seemed tomake sense (cents?).
An alphabet soup of financial wizardry was createdto fund the insatiable demand for what now appearsto be poorly underwritten mortgages. Asset-backedcommercial paper (ABCP) conduits purchasedmortgages and funded those acquisitions by issu-ing short-term, 270 days or less, obligations—aclassic long-term/short-termmismatch. Asinvestors realized that some of the collateral back-ing these ABCPs was performing poorly, theyrefrained from purchasing ABCP in general. Thisaction forced some conduits into default.
Collateralized debt obligations, or CDOs, pur-chased a host of debt instruments, includingsubprime mortgage collateral. Similar to collateral-ized mortgage obligations, CDOs carve up the col-lateral cash flows to create securities with differentrisk and duration profiles. The leverage inherent inthese CDO transactions has amplified the impactof poorly performing loans.
As residential loan delinquencies and foreclosurerates have reached record levels, the securitiescreated by the related cash flows have droppedin value. Numerous originators of subprime
Month End3-Month Treasury(Monthly Rates)
10-Year Treasury(Monthly Rates) Spreada
December 2000 6.00% 5.24% -.76%June 2000 3.57 5.28 1.71December 2001 1.72 5.09 3.37June 2002 1.73 4.93 3.20December 2002 1.21 4.04 2.83June 2003 0.94 3.33 2.39December 2003 0.91 4.27 3.36June 2004 1.29 4.73 3.44December 2004 2.22 4.23 2.01June 2005 3.04 4.00 0.96December 2005 3.97 4.47 0.50June 2006 4.92 5.11 0.19December 2006 5.00 4.60 -0.40June 2007 4.75 4.35 -0.40December 2007b 4.10 4.70 0.60June 2008b 4.20 4.70 0.50December 2008b
4.30 4.90 0.60aSpread=10-year rate minus 3-month rate.bForecast.
Source: Federal Reserve Board, Consensus Forecasts, and Colorado Business Economic Outlook Committee.
FINANCIAL MARKETS: INTEREST RATES2000–2008
52

continued on page 54
to occur, and the process of its deflation is slow tooccur as well. The concern of the Federal Reserve isthe orderly functioning of the capital markets. Ifthere is a perceived threat to the broader economythat can be mitigated through an ease in monetarypolicy, the Fed has said it will respond. However, ifrisk has been mispriced by the market, then throw-ing more money at it by way of easier monetarypolicy will not resolve the problem. Sometimesthere isn’t an easy fix.
Locally things look brighter. Through November15, 2007, the Bloomberg Colorado Index was upmore than 16%. In contrast, the Dow was up morethan 5% and the S&P was up more than 2%.Colorado may not be able to totally shake off theeffects should the national economy have a greaterthan expected slowdown, but perhaps Coloradowill be an economic high point.
InsuranceMost insurance buyers and brokers expect propertyand casualty premiums to remain at or below cur-rent levels. Premiums have been falling for sometime now, a reflection of the adequacy of reservelevels and investment returns.Most risk managersare willing to maintain or increase retention levels,despite the availability of cheaper coverage. TheTerrorism Risk Insurance Act, which created a fed-eral program to share risk between the public andprivate sector for insured losses resulting from actsof terrorism, is due to expire at the end of 2007.According to a recent survey of risk managers,
mortgages have gone into bankruptcy.Wall Streethas reported multibillion dollar write-downs, sev-eralWall Street CEOs have lost their jobs, andnumerous hedge funds have had to wind down.
All of which leads to a discussion of liquidity issueswithin the capital markets, economic imbalances,contagion, and systemic risk. The housing sectorhas many touch points within the economy.Increased foreclosure rates have resulted in anoticeable decrease in tax revenues for somemunicipalities; foreclosures reduce property values,degrade the balances sheets of consumers, andreveal the double-edged sword of leverage, be it inthe securities derived from home mortgages or the100% financing at the consumer level.
Leverage is the aphrodisiac of capitalism and bullmarkets.When prices are appreciating, leverage is awonderful thing as it amplifies returns. Conversely,when prices depreciate, those falling returns aremultiplied. As the current credit cycle unfolds, weare discovering how broadly leverage was applied—from your next door neighbor’s use of 100%financing to purchase a home, or those who used a125% home equity credit line to purchase the latestand greatest gadgets and toys, to the hedge fund orCDO that purchased some securitized version ofthat same loan on margin. As long as home priceskept appreciating, everyone was happy and the sys-tem continued to function.
Like any financial bubble, price appreciation isfueled by cheap money. The Fed gradually tight-ened monetary policy, but those drinking deeplyfrom the punch bowl were too focused on the
punch and oblivious to the signs the party waswinding down. Some institutions found it difficultto finance themselves, prompting the Fed to reas-sure the markets by easing policy.
Howmuch financial stress can the U.S. consumerwithstand? Falling home values, tighter lendingstandards, and oil prices approaching $100 perbarrel would seem to be sufficient to stress theconsumer’s balance sheet.Will that be sufficientto restrain consumer spending? If that is the case,then a significant economic slowing would bethe result.
The national unemployment rate, while trendinghigher, is still considered low. The unemploymentrate of 4.7% is up from its 2007 low of 4.4%, butthe labor market is still generally viewed as tight, aclear concern of the FOMC.Will there be a shed-ding of jobs that will further impact the psyche, aswell as the wallets of consumers?
The economic headwinds we are facing today wereevident at this time last year. The process of inflat-ing an economic bubble built on real estate is slow
Leverage is the aphrodisiac of capitalismand bull markets. When prices are appre-ciating, leverage is a wonderful thing asit amplifies returns. Conversely, whenprices depreciate, those falling returnsare multiplied.
53
2008 Colorado Business Economic Outlook

Financial Activitiescontinued from page 53
fewer than 20% consider terrorism coverage to behighly important. Climate-based exposures, suchas emission-reduction protection, and exposuresrelating to offshore outsourcing are also lessimportant. Greater interest exists in covering expo-sure related to corporate governance and supplychain and trade disruption, and protecting intellec-tual property.
Most corporate buyers do not believe that theirfirms have benefited from the fact that major bro-kers stopped accepting contingency fees followingprobes by former NewYork attorney general EliotSpitzer. They believe that insurers are retaining themoney saved rather than passing it along in theform of lower premiums. Losses related to naturaldisasters, such as the recent fires in southern Califor-nia, are pooled across the country. Fire is typicallyan insured loss, and when claims reach multibilliondollar levels, re-insurance pools are tapped and willneed to be replenished.While the cost of coverageis important, risk managers are concerned withbreadth of coverage, financial strength/health ofthe insurer, and service. Risk mitigation and losscontrol are integral to the services insurance agentsand brokers provide to their clients.
This concept has traction on the benefits side aswell. Employers are increasingly interested in pro-moting wellness and providing disease manage-ment services for employees with ongoing medicalconditions. Improving the health of a group trans-lates to fewer sick days, better productivity, happieremployees, and lower claims.More employers arestructuring benefits to encourage employees to
make “better” choices regarding their healthcare,such as using ER facilities appropriately, establish-ing a relationship with a primary care physician,and asking for generic drugs. This is generallyaccomplished by shifting additional financial riskto the patient at point of service. Employers arealso looking for ways to assist employees in payingfor future healthcare expenses. A variety of toolsare used for this purpose, including flexible spend-ing accounts, health reimbursement arrangements,and health-saving accounts (HSA). The ability tomake better decisions is based on better informa-tion, so resources continue to be allocated at thecarrier level toward providing transparency formedical costs and hospital outcomes, and onlineaccess to personal benefits and claims information.Insurance agents and brokers are working harderto assist employers in effectively communicatingbenefits to employees. Services include individualmeetings with employees, bilingual materials, andpersonalized benefit statements. A real need existsfor bilingual enrollers with a good understandingof insurance programs.
Legislation continues to impact the health insur-ance market. Balance billing for services receivedduring an in-network hospital stay from out-of-network physicians, like radiologists andanesthesiologists, is now banned in Colorado.Unmarried children who financially depend ontheir parents can be covered under their parent’splan until the age of 25, regardless of whether ornot they are full-time students. The rating bandscurrently in place for small group (fewer than 50employees) medical plans are being dismantledover the next two years. In 2008, small groups cannot be charged more than standard rates, althoughdiscounts will still be permitted for healthiergroups. The discounts will disappear in 2009, andColorado will return to rating based on age,dependent status, and geographic location only.The majority of small groups currently enjoy dis-counted rates; they can expect higher renewals.
A Blue Ribbon Commission for Health CareReform was created to study current coverage andsolicit and evaluate reformmodels, and to return arecommendation to the General Assembly in Janu-ary 2008. The goal is to increase coverage, especiallyfor the uninsured and underinsured, and decreasehealthcare costs for all Colorado residents. Formore information on this commission, see theEducational and Health Services section.
Most corporate buyers do not believe thattheir firms have benefited from the factthat major brokers stopped accepting con-tingency fees following probes by formerNew York attorney general Eliot Spitzer.
54
2008 Colorado Business Economic Outlook

continued on page 56
Real Estate and Rental and Leasing
Real Estate
Commercial Real Estate
Colorado’s commercial real estate (CRE) industryis benefiting from several robust economic sectorsin the state, such as mining and healthcare, thatattract significant external investment. Regionally,Colorado is experiencing strong levels of populationand economic growth. New development has beenconstrained to keep pace with demand but thepressures of a declining residential market willinevitably slow demand for commercial space.
In general, the first half of 2007 for Metro DenverCRE was very strong; however, activity in the sec-ond half slowed tremendously. This has been attrib-uted to the performance of the overall economyand the “credit crunch.”According to Ross Researchand Bitzer Real Estate Partners, the office marketsegment of the CRE industry has rebounded nicely,and speculative construction has begun in somemarkets. Overall, office vacancy fell to 15.8% in Q32007 from 17% at year-end 2006. The metro retailmarket has cooled from 2006, shifting from newconstruction to negative absorption. Overall, retailvacancy ticked up, to 6.4% from 5.7%, during Q32006. A large amount of new retail space is underconstruction through 2009, and absorption willstrongly depend on the economy, the real estatecycle, and consumer demand. The metro industrialmarket activity has been robust, even thoughabsorption levels are on pace to eclipse 4 millionsquare feet, the highest level in the past seven years.
Vacancy has remained relatively unchanged, at7.6% from 7.9% at midyear 2006. Continuedabsorption of commercial space in 2008 will hingegreatly on a healthy consumer economy.
Many magazines and polls rank northern Coloradoas one of the top areas in the country in which tolive and work, which has caught the attention ofmany national and international employers, retail-ers, and investors. New construction has been cen-tered on I-25 and US Hwy 34 (Loveland/Greeley).As a result, growth and development is filling in thesurrounding area. Realtec notes that industrial,retail, and office vacancy rates have increased yearover year 2007 versus 2006. Fort Collins, Loveland,and Greeley remain the dominant players, but
smaller communities are becoming the beneficiariesof changing development patterns.
Strong growth in housing and jobs has helped thesouthern Colorado, mainly Colorado Springs,economy for the past three years. The oversupplyof commercial space that once plagued ColoradoSprings has been absorbed. In general, SierraCommercial Real Estate notes that tight supplies ofall commercial product and continued demand forspace should keep vacancy rates low and lease ratesrising. This has proved to be favorable, especiallyfor retailers, given the pressures of a declininghousing market. Office vacancies rose slightly, to11.3% from just under 8% at year-end 2006.Industrial vacancy rates improved, to 8.9%, as aresult of impressive absorption and no new con-struction. Retail vacancy rose slightly, to 9.7%, butlease rates have reached an all-time high, currentlyaveraging $13.81 per square foot NNN (triple netlease), because of high demand for new generationspace. New jobs and housing should continue toslow in 2008, which will have a similar trickle downeffect on CRE activity.
The western Colorado economy continues toboom as a result of increased mining activity.Western Slope population, employment, retailsales, and housing are experiencing remarkablegrowth due to the price and demand for Colorado’senergy and mineral resources. However, as FirstAmerican Heritage Title Company reports, realestate secured loans (residential and commercial)decreased by 11%, to 3,962 in Q3 2007, from the
VACANCY RATES IN COLORADOCOMMERCIAL REAL ESTATE MARKETS
2006a 2007a
Fort Collins Industrial 4.9% 4.5%Retail 5.9 7.2
Office 12.5 11.8 GreeleyIndustrial 9.1 8.1
Retail 6.0 9.3 Office 13.0 17.1 Loveland Industrial 3.7 4.3 Retail 3.2 7.1 Office 6.4 8.0aAs of Q3.
Source: Ross Research, Sierra Commercial Real Estate,
Realtec, and Colorado Business Economic Outlook Committee.
V
55
2008 Colorado Business Economic Outlook

previous year. This is primarily attributable to alack of available land and the tightening of creditstandards. First American notes that residentialforeclosures in 2007 are mostly flat compared to2006.Mesa County foreclosure rates are amongthe lowest in the state, according to the MesaCounty Public Trustee. So long as the high demandfor gas, oil, and molybdenum continues, theWestern Slope real estate industry will remaincommercially active.
Since 2002 CRE activity has trended upward,demonstrated by a new generation of commercialspace, recovering vacancy rates, rising rental rates,and positive absorption. However, commercialactivity will begin to slow through 2010, until thepace of residential absorption increases and fore-closures reach average levels.
Residential Real Estate
The existing and new residential markets inColorado remain sluggish due, in part, to a relent-less foreclosure problem primarily along the FrontRange. On the other hand, the Metro Denver rentalmarket relished its lowest quarterly vacancy rate inmore than six years in Q3 2007. Overall, the pullback in single-family construction has temperedthe recent market lolls, while the slowdown inhome price appreciation is another problematicindicator.
For-Sale Existing Homes
U.S. existing homes sales in September 2007 were19.1% lower versus the comparable period in 2006,according to the National Association of Realtors.
Home price depreciation reflects the overall slow-down, with a 4.2% decline in the national medianhome price from September 2006 to September2007. In theWestern United States, existing homesales in September 2007 were 27.8% belowSeptember 2006 sales, while the median homeprice posted an 8.8% drop.
Existing home sales in Colorado slowed 8.6% fromfirst quarter to second quarter 2007 (preliminaryfigures), and second quarter 2007 home sales were4.8% lower relative to the same period in 2006.Colorado posted a modest 0.6% gain in existinghome sales during the first half of 2007. On a posi-tive note, Colorado’s increase was the 12th largestgain in the United States and considerably strongerthan negative 8.9% national average. Furthermore,median sales price appreciation has slowed inrecent periods. From Q2 2006 to Q2 2007, theDenver-Aurora MSA saw flat prices comparedto a 2.3% gain in the Boulder-Longmont MSA.Appreciation in both regions is weaker than the2005 and 2006 annual gains.
New Home Sales
The drop-off in Colorado’s new home market issimilar to the existing market slowdown. New
home sales in Metro Denver and northernColorado fell 33% during the first half of 2007, fol-lowing a 21% annual decline in 2006, according tothe Genesis Group. Developers have responded toweaker demand by pulling back on construction.Building permits for residential units in Coloradoduring the first three quarters of 2007 were 26%below the same period in 2006. Comparatively,Metro Denver construction activity through July2007 has decreased by double-digits in all producttypes except for apartment units, which saw histor-ically low activity in 2005 and 2006. Year-to-dateapartment construction is up 154.9% in MetroDenver as of July 2007.
Foreclosures
Foreclosures in Colorado continue to be a drag onthe for-sale residential real estate market because ofhigh inventory levels and price reductions.Foreclosures in the state reached 28,435 in 2006, a30.5% increase over 2005. The latest report fromthe Colorado Division of Housing reveals thatforeclosures through the first half of 2007 represent68.4% of 2006 figures, suggesting that 2007 will beanother year of record foreclosures.
The Front Range continues to lead the state inforeclosure activity with Adams, Denver,Weld,Arapahoe, and Pueblo counties reporting the fivehighest rates of foreclosure in the first half of 2007.On a year-to-date basis, foreclosures in the seven-county Metro Denver region are up about 43%through August. High foreclosure activity is likelyto remain a thorn in the state’s residential marketover the next couple years given the collapse of the
2008 Colorado Business Economic Outlook
56
Financial Activitiescontinued from page 55
So long as the high demand for gas, oil,and molybdenum continues, the WesternSlope real estate industry will remaincommercially active.

2008 Colorado Business Economic Outlook
57
subprime mortgage market and higher mortgagepayments due to adjustable-rate mortgages.
Rental Market
The rental market continues to benefit from risingforeclosures in Colorado and population and jobgrowth. In addition, apartment construction inMetro Denver prompted the third quarter apart-ment vacancy rate to fall from 6.7% in 2006 to5.3% in 2007, the lowest quarterly vacancy rate inthe region since Q1 2001. Fewer than 20,000 apart-ment units are expected to be added to the seven-county market in 2007. A new statewide vacancyrate survey that excludes Metro Denver pegs the
overall apartment vacancy rate at 8.8% in Q2 2007,up from 7.5% in Q1 2007.
Real Estate Employment
Overall employment in the real estate sector willreach 35,800 jobs in 2008, reflecting an addition of300 jobs. Strong growth in the residential marketwill occur along theWestern Slope as a result oflow and relatively stable interest rates. In spite ofthe housing slump and credit crunch, someemployment growth will be necessary to deal withtransactions related to record level foreclosuresover the past year.
Rental and LeasingRental and Leasing is one of the more diverse sec-tors in the NAICS structure. Because NAICS cate-gories are defined by process, it includes an array ofcompanies tied together by their renting/leasingfunction, but otherwise unrelated. The sector isconsumer-driven and tends to mirror general eco-nomic and population growth trends. Companiesclassified within the sector include companies thatrent or lease equipment, videos, cars, and formalwear. The sector is expected to add roughly 100jobs in 2008.�
Year Real Estate Rental and Leasing Total
1998 27.9 14.7 42.61999 28.8 15.5 44.32000 29.7 15.4 45.12001 32.0 14.0 46.02002 32.2 13.9 46.12003 32.9 14.2 47.12004 33.3 14.0 47.32005 34.4 13.9 48.32006 35.2 14.0 49.2
2007a 35.5 14.1 49.6 2008b
35.8 14.2 50.0aEstimated.bForecast.
Source: Colorado Department of Labor and Employment and Colorado Business
Economic Outlook Committee.
REAL ESTATE AND RENTAL AND LEASING EMPLOYMENT1998–2008
(In Thousands)
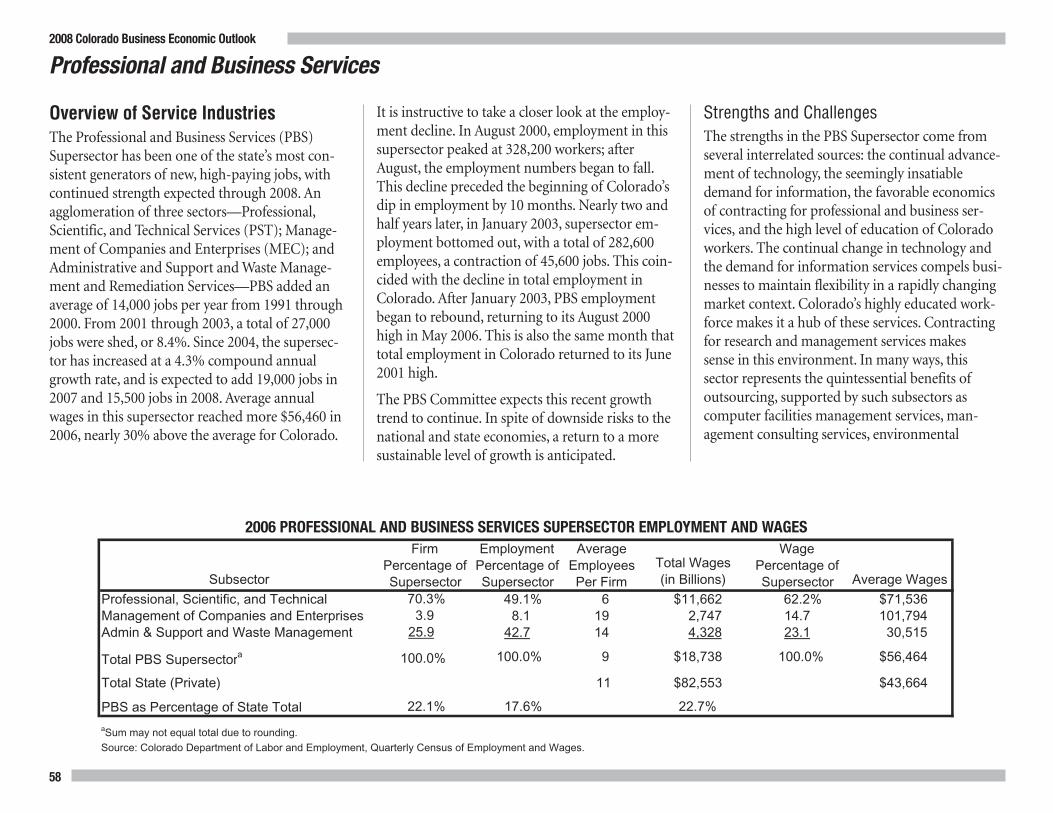
Overview of Service IndustriesThe Professional and Business Services (PBS)Supersector has been one of the state’s most con-sistent generators of new, high-paying jobs, withcontinued strength expected through 2008. Anagglomeration of three sectors—Professional,Scientific, and Technical Services (PST); Manage-ment of Companies and Enterprises (MEC); andAdministrative and Support andWaste Manage-ment and Remediation Services—PBS added anaverage of 14,000 jobs per year from 1991 through2000. From 2001 through 2003, a total of 27,000jobs were shed, or 8.4%. Since 2004, the supersec-tor has increased at a 4.3% compound annualgrowth rate, and is expected to add 19,000 jobs in2007 and 15,500 jobs in 2008. Average annualwages in this supersector reached more $56,460 in2006, nearly 30% above the average for Colorado.
It is instructive to take a closer look at the employ-ment decline. In August 2000, employment in thissupersector peaked at 328,200 workers; afterAugust, the employment numbers began to fall.This decline preceded the beginning of Colorado’sdip in employment by 10 months. Nearly two andhalf years later, in January 2003, supersector em-ployment bottomed out, with a total of 282,600employees, a contraction of 45,600 jobs. This coin-cided with the decline in total employment inColorado. After January 2003, PBS employmentbegan to rebound, returning to its August 2000high in May 2006. This is also the same month thattotal employment in Colorado returned to its June2001 high.
The PBS Committee expects this recent growthtrend to continue. In spite of downside risks to thenational and state economies, a return to a moresustainable level of growth is anticipated.
Strengths and ChallengesThe strengths in the PBS Supersector come fromseveral interrelated sources: the continual advance-ment of technology, the seemingly insatiabledemand for information, the favorable economicsof contracting for professional and business ser-vices, and the high level of education of Coloradoworkers. The continual change in technology andthe demand for information services compels busi-nesses to maintain flexibility in a rapidly changingmarket context. Colorado’s highly educated work-force makes it a hub of these services. Contractingfor research and management services makessense in this environment. In many ways, thissector represents the quintessential benefits ofoutsourcing, supported by such subsectors ascomputer facilities management services, man-agement consulting services, environmental
Professional and Business Services
2006 PROFESSIONAL AND BUSINESS SERVICES SUPERSECTOR EMPLOYMENT AND WAGES
Subsector
FirmPercentage of Supersector
EmploymentPercentage of Supersector
AverageEmployeesPer Firm
Total Wages(in Billions)
WagePercentage of Supersector Average Wages
Professional, Scientific, and Technical 70.3% 49.1% 6 $11,662 62.2% $71,536Management of Companies and Enterprises 3.9 8.1 19 2,747 14.7 101,794Admin & Support and Waste Management 25.9 42.7 14 4,328 23.1 30,515
Total PBS Supersectora 100.0% 100.0% 9 $18,738 100.0% $56,464
Total State (Private) 11 $82,553 $43,664
PBS as Percentage of State Total 22.1% 17.6% 22.7%
aSum may not equal total due to rounding.Source: Colorado Department of Labor and Employment, Quarterly Census of Employment and Wages.
58
2008 Colorado Business Economic Outlook

consulting services, and telephone call centers—aslong as the jobs stay in the local economy.
Yet, the sector has several challenges. The outsourc-ing of services to other states, or to other countries(offshoring), remains a difficulty for the PBSSupersector and for Colorado’s economy. Techno-logical advancements often make it economicallyappealing to outsource work to other countries,where labor is comparatively cheaper and govern-ment regulation is softer. For instance, the verytechnology that made the outsourcing of call cen-ters in Colorado viable also made the offshoring ofcall centers to India viable. Offshoring is far fromlimited to call centers, and includes highly skilledjobs, such as architects and engineers.
The retiring baby boomers will strain PBS witha shortage of knowledgeable, skilled employees.Some experts say the number of employees eligiblefor retirement may be as high as one in four inparts of the sector. Companies will have to be cre-ative and flexible in order to develop new talent inthe field and retain current workers. The strengthof Colorado’s colleges and universities will benefitthe sector.
In addition to workforce challenges, PBS is subjectto copyright infringement challenges. Intellectualproperty rights are especially vulnerable for com-puter software. Patent infringement is costly tofight, and it is difficult to track down internationalculprits.
Professional, Scientific, and TechnicalServicesThe Professional, Scientific, and Technical Services(PST) Sector accounted for more than 49% ofsupersector employment in 2006. Roughly 25% ofPST is architectural and engineering services, andcomputer systems design services accounted for23%. Between 1990 and 2006 architectural servicesgrew at an annualized rate of 4.4%, compared to5.7% for computer systems design. State employ-ment expanded at a rate of 2.6% during this period.
The PST Sector has a positive impact on Colorado,with high-skill, high-wage jobs averaging $71,536in 2006, more than 64% above the Colorado aver-age. In addition, many of the sectors have close tiesto the high-tech clusters in the state, with growthpartly a function of research and tech transfer fromthe state’s universities and federal labs. To drawattention to the importance of this linkage, theBoulder Economic Council and the State of Colo-rado established CO-LABS to educate the public
PROFESSIONAL, SCIENTIFIC, AND TECHNICAL SERVICES SECTOR EMPLOYMENT1998–2008
(In Thousands)
YearLegal
Services
Architectural andEngineering
Services
ComputerSystems Design
Services
OtherProfessional,Scientific, and
TechnicalServices Totala
PercentageChange
1998 14.6 31.0 33.1 55.5 134.2 4.9%1999 14.8 33.2 39.0 58.0 145.0 8.02000 15.1 34.3 45.4 59.0 153.8 6.12001 15.5 37.5 42.7 58.3 154.0 0.12002 15.8 36.0 35.9 56.8 144.5 -6.22003 16.3 35.4 33.1 57.0 141.8 -1.92004 16.6 36.8 34.1 60.6 148.1 4.42005 17.2 39.0 35.7 64.1 156.0 5.32006 17.4 41.4 36.9 67.2 162.9 4.4
2007b 17.8 43.5 38.2 74.9 174.4 7.1 2008c
18.2 44.4 39.5 81.1 183.2 5.0
aDue to rounding, the sum of the individual items may not equal the total.bEstimated.cForecast.Source: Colorado Department of Labor and Employment and Colorado Business Economic Outlook Committee.
1
continued on page 60
59
2008 Colorado Business Economic Outlook
about the value of the labs to the state and to pro-vide a forum to help facilitate collaborationbetween federally funded research facilities inColorado and the private sector. It commissioned areport to be completed in the first half of 2008 thatdefines the impact of the federal research labs onColorado.
Growth is expected to continue in this sector, withan additional 11,500 jobs at year-end 2007, and8,800 additional jobs in 2008.
The remainder of this section examines the emerg-ing technologies of photonics, nanotechnology,biology, as well as aerospace. In addition, sustain-able technologies and architectural services will bebriefly discussed.
Emerging Technologies
During the 1980s the Colorado Advanced Tech-nology Institute identified a series of technologiesthat were considered crucial to the development ofthe Colorado economy. As a result, clusters havedeveloped in the areas of photonics, nanotechnol-ogy, biotech, software, environmental sciences, andaerospace. These high-tech clusters cross variousNAICS categories but are mentioned in this sectionbecause of their ties to the research and develop-ment companies included in the services sector.(A brief discussion of software is included in theInformation Sector.) These and other importanthigh-tech clusters are supported and marketed bystrong trade associations.
The photonics, nanotechnology, and biotechclusters include a total of about 600 companies in
Colorado, which are concentrated primarily alongthe Front Range. Boulder County has the highestpercentage of high-tech workers in the state. Allthree clusters are interdependent and rely onresearch conducted at CU, CSU, and the ColoradoSchool of Mines to further their growth. For exam-ple, more than 20 companies were spawned out ofthe CU-CSU Optoelectronic Computing SystemsCenter and a half-dozen nanotechnology compa-nies are the product of the University of ColoradoTechnology Transfer group.
The Colorado Photonics Industry Association(CPIA) reported a 14.5% increase in the optoelec-tronics markets worldwide in 2006. Estimates arethat this market will double in size in the next 10years. Also, Colorado companies play a key role inthe design and/or manufacturing of componentsand products related to LCD displays, solar, com-puting/processing, and consumer displays/televi-sion. All of these areas are projected to experiencelarge growth.
The optical components market is currently show-ing a temporary decline as inventories adjust withchanging product demand. In the long term, thismarket, which is served by approximately 30
companies in Colorado, is expected to see slow butsteady growth.
In recent years the environmental cluster hasexpanded its base to include “sustainable” compa-nies. This is proving more than a passing trend asan increasing number of schools, businesses, andgovernmental agencies are addressing economic,social, and environmental issues as they serve theneeds of their customers and community.
Aerospace
Aerospace companies that provide information,research, or management services are counted inthe PBS Supersector. Companies predominatelyengaged in aerospace manufacturing are includedin the Manufacturing Supersector rather thanPBS. Although high-technology companies oftenprovide both manufactured products and researchand development services, they are categorizedby NAICS according to their predominant lineof business.
The aerospace industry in Colorado has a longhistory of industry-university collaboration. TheUnited Launch Alliance is based in Colorado.Lockheed Martin won the Space ExplorationVehicle contract in 2007. Lt. Gov. Barbara O’Brienco-chairs the Colorado Space Coalition. ColoradoSchool of Mines created the Eighth ContinentProject (“space” being another continent), and theUniversity of Colorado continues to receive themost NASA grants of any U.S. university. At theNational Space Symposium held in ColoradoSprings, attendees could step from a satellite, to a
2008 Colorado Business Economic Outlook
60
Professional and Business Servicescontinued from page 59
Colorado companies play a key role in thedesign and/or manufacturing of compo-nents and products related to LCD dis-plays, solar, computing/processing, andconsumer displays/television.

2008 Colorado Business Economic Outlook
61
continued on page 62
rocket engine, to a space suit.With governmentfacilities, large defense contractors, and engineeringfirms all located in the state, Colorado continues tobe a major force in the aerospace industry.
Architectural, Engineering, andRelated ServicesThe Architectural, Engineering, and RelatedServices Sector, represented by such heavy hittersas CH2MHill, Raytheon, and Lockheed Martin, isexpected to experience another healthy increase inemployment in 2007, adding 2,100 jobs, a gain of5.1%. It is anticipated to rise another 2.1%—900jobs—in 2008. Englewood-based CH2MHill, afirm that specializes in construction, environmen-tal planning, and engineering and architecturaldesign, is a prime example of growth in the sector.In mid-2007, CH2MHill announced plans toacquire the oil and gas firm Alaska-based Vecoin order to diversify the company’s portfolio ofengineering expertise.
Demand for engineering and design servicescontinues to grow in both the public and privatesectors. However, the availability of experiencedpersonnel has become tight again, mirroring con-ditions encountered in 1999 and 2000.
The offshoring of work in this sector continues.A recent survey by Harvard University and theAmerican Institute of Architects found that 20%of U.S. firms report they are offshoring, whilean additional 30% are considering doing so.According to Science & Engineering Indicators2006, a report published by the National Science
Board, the total number of science and engineeringdegrees earned from 1980 to 2000 grew at anannual rate of 1.4%, far below the 4.2% increase inthe number of science and engineering jobs.Additionally, nearly 30% of all science and engi-neering degree holders currently in the labor forceare age 50 or older.
The passage of Referendum C in November 2005provided a boost to the construction of state high-way and bridge projects. However, this funding isstill not adequate to make up for road and bridge
projects delayed during the 2002–2004 economicslowdown. During that period, the condition ofroads, highways, and bridges deteriorated signifi-cantly due to increased use by Colorado’s growingpopulation. Costs to renew the state’s infrastruc-ture have climbed considerably due to rising globaldemand for construction materials.
Moving forward, demand for architectural serviceswill remain strong due to the aging of Colorado’sinfrastructure. Interstate 70 is a case in point.
ADMINISTRATIVE AND SUPPORT AND WASTE MANAGEMENT SERVICES SECTOR1998–2008
(In Thousands)
YearEmployment
ServicesServices to Buildings
and Dwellings
Other Adm.Services and Waste Mgmt. Total
PercentageChange
1998 48.2 29.3 55.3 132.8 2.1%1999 51.2 31.4 57.1 139.7 5.22000 54.5 33.0 58.4 145.9 4.42001 46.9 34.4 57.2 138.5 -5.12002 39.0 34.1 57.7 130.8 -5.62003 36.2 35.0 56.4 127.6 -2.42004 38.5 36.9 56.2 131.6 3.12005 40.2 37.9 57.4 135.5 3.02006 42.4 39.2 60.2 141.8 4.62007a 44.5 40.6 62.2 147.3 3.9
2008b 46.5 41.8 64.2 152.5 3.5
aEstimated.bForecast.Source: Colorado Department of Labor and Employment and Colorado Business Economic Outlook Committee.
A
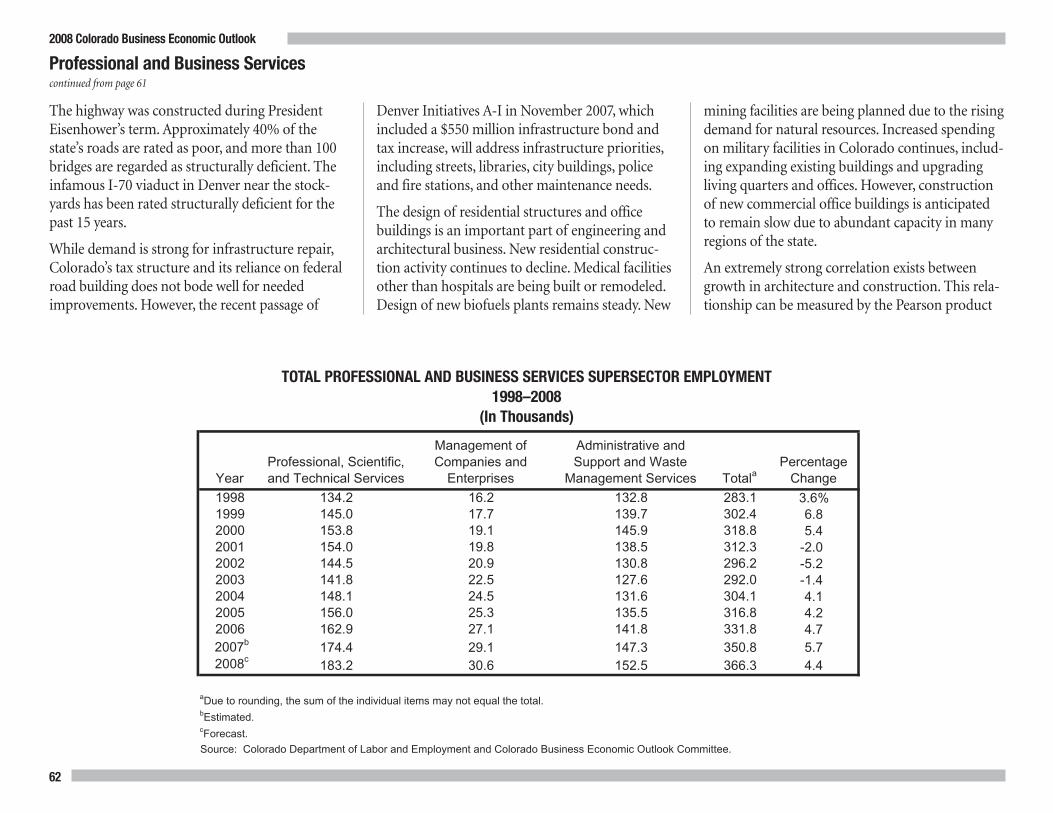
Professional and Business Servicescontinued from page 61
The highway was constructed during PresidentEisenhower’s term. Approximately 40% of thestate’s roads are rated as poor, and more than 100bridges are regarded as structurally deficient. Theinfamous I-70 viaduct in Denver near the stock-yards has been rated structurally deficient for thepast 15 years.
While demand is strong for infrastructure repair,Colorado’s tax structure and its reliance on federalroad building does not bode well for neededimprovements. However, the recent passage of
Denver Initiatives A-I in November 2007, whichincluded a $550 million infrastructure bond andtax increase, will address infrastructure priorities,including streets, libraries, city buildings, policeand fire stations, and other maintenance needs.
The design of residential structures and officebuildings is an important part of engineering andarchitectural business. New residential construc-tion activity continues to decline.Medical facilitiesother than hospitals are being built or remodeled.Design of new biofuels plants remains steady. New
mining facilities are being planned due to the risingdemand for natural resources. Increased spendingon military facilities in Colorado continues, includ-ing expanding existing buildings and upgradingliving quarters and offices. However, constructionof new commercial office buildings is anticipatedto remain slow due to abundant capacity in manyregions of the state.
An extremely strong correlation exists betweengrowth in architecture and construction. This rela-tionship can be measured by the Pearson product
TOTAL PROFESSIONAL AND BUSINESS SERVICES SUPERSECTOR EMPLOYMENT1998–2008
(In Thousands)
YearProfessional, Scientific, and Technical Services
Management ofCompanies and
Enterprises
Administrative andSupport and Waste
Management Services TotalaPercentage
Change1998 134.2 16.2 132.8 283.1 3.6%1999 145.0 17.7 139.7 302.4 6.82000 153.8 19.1 145.9 318.8 5.42001 154.0 19.8 138.5 312.3 -2.02002 144.5 20.9 130.8 296.2 -5.22003 141.8 22.5 127.6 292.0 -1.42004 148.1 24.5 131.6 304.1 4.12005 156.0 25.3 135.5 316.8 4.22006 162.9 27.1 141.8 331.8 4.72007b 174.4 29.1 147.3 350.8 5.7 2008c
183.2 30.6 152.5 366.3 4.4
aDue to rounding, the sum of the individual items may not equal the total.bEstimated.cForecast.Source: Colorado Department of Labor and Employment and Colorado Business Economic Outlook Committee.
62
2008 Colorado Business Economic Outlook

moment, which ranges from 0 to 1. The value is0.92, which means that about 92% of the change inconstruction employment can be explained bychange in employment in the architectural services.As a result, architectural services is thought to be aharbinger of growth in construction employment.
Management of Companies andEnterprisesManagement of Companies and Enterprises (MCE)represents company headquarters or regional com-pany offices that either finance, oversee, or managecompanies from a strategic, organizational, andoperational front.Many of the companies repre-sented in this sector put Colorado on the nationaland even global business map, with such high-profile firms as the recently acquiredWild Oats,Ball Aerospace, Newmont Mining Corporation,Sports Authority, and Rock Bottom Restaurants.Colorado is known as a highly educated, entrepre-neurial state, with a desirable quality of life. Thestate is on the radar for angel investors and ven-ture capitalists, and is known for firm creation.Geographically, Colorado provides easy access tothe rest of the nation and world, facilitated byDenver International Airport and the largenational and international carriers that use thefacility. MCE’s major benefit to Colorado rests inthe companies with operations outside the state,effectively making them service exporters.
Accounting for approximately 8% of the Profes-sional and Business Services Supersector,MCE hasbeen growing at a 6% compound annual growthrate since 2000, outpacing both supersector andtotal Colorado employment.MCE wages areamong the highest in the state, with average em-ployee earnings topping $100,000 annually. Thesector’s workforce is expected to climb by morethan 7% in 2007, ending the year with 29,100employees.MCE employment gains will be briskagain in 2008, albeit at a slower pace than in 2007,ending the year with 30,600 employees.
Administrative Support and WasteManagement and Remediation ServicesAccounting for approximately 43% of the PBSSupersector employment, Administrative SupportandWaste Management and Remediation Servicesincludes companies that provide services to otherbusinesses. This sector employed 141,800 in 2006,with average wages estimated at $30,515. Theseactivities include everything from waste manage-ment and cleaning services to temporary agenciesand call centers.
Of particular interest is the employment servicessubsector because of its strong correlation withoverall employment. Recent trends in this categorysupport projections for moderate growth in overallstate employment.
Looking ForwardBusinesses and government will continue to out-source professional and business services. So far,higher energy prices have not rippled through theeconomy as much as expected. However, withenergy prices continuing to climb, negative effectson employment for this sector may appear early in2008 if prices do not fall.
The increasing cost of employer-provided healthinsurance is affecting the mobility of the laborforce. This makes employers reluctant to hire andworkers hesitant to leave current employment. Inspite of this, increasing fuel costs may lead workersto shift to companies located closer to their resi-dences. Use of newer technologies that provide effi-cient telecommuting will also be used more byservice firms.
The current issue of immigration control affectsthe way Colorado companies conduct business. Itmay be more difficult to attract people from over-seas to work for service companies in the UnitedStates. The universities in Eastern Europe, Asia, andMexico are approaching the point of graduatingmore professionals than their local industries canabsorb. It remains to be seen how state andnational immigration policies will address thisaspect of migration in the future.�
63
2008 Colorado Business Economic Outlook
2008 Colorado Business Economic Outlook
64
The Educational and Health Services (EHS)NAICS supersector includes private educa-
tional services and healthcare companies andorganizations. Total employment growth willincrease 3.3%—or by 8,000 workers—for a total of248,000 employees in 2008.
Healthcare and Social AssistanceServicesThe healthcare sector comprises four subsectors:ambulatory care, hospitals, nursing care, and socialassistance.
The ambulatory care subsector includes approxi-mately 75% of healthcare companies and 41% ofemployees. About two-thirds of the ambulatorycare employees are medical professionals, or workin physician offices, dental offices, or in home-health agencies. The remainder of this subsectorincludes such medical services as specialists, med-ical labs, blood banks, and dialysis centers.
Approximately 84 hospitals, including psychiatricand specialty hospitals, are located in Colorado.These represent less than 1% of the companies inthe healthcare sector, but about 25% of the sector’semployees.
Approximately 17% of the employees are includedin the nursing care subsector, which includes nurs-ing homes and other residential care facilities. Thefinal subsector is social assistance, which encom-passes community food and housing groups, andchild care centers, accounting for 16% of the totalworkers in the healthcare sector.
Health Insurance Premiums andCoverageAccording to a 2007 report by the Kaiser FamilyFoundation and the Health Research andEducation Trust, the national average annual pre-mium for employer-sponsored health insurance is$4,479 for single coverage and has now topped$12,000 for a family policy. Premiums increased6.1% in 2007, the lowest rate of increase since1999. Nevertheless, health insurance premiumsrose 78%, about four times the increases in wagesand consumer prices between 2002 and 2007.Despite the moderation in premium increases, theaverage worker contribution continues to increase,averaging $694 for single coverage and $3,281 forfamily coverage. The study found that 60% of com-panies offer health benefits to at least some of theirworkers, a decrease from 69% in 2000.While virtu-ally all firms with 200 or more employees offerhealth insurance, only 59% of small firms (fewerthan 200 employees) do. The average worker con-tribution is less in small firms than large firms—$561 versus $759 for single coverage. The oppositeis true for family coverage, where workers in smallfirms contribute $4,236 compared to $2,831 foremployees in large firms.
A 2007 Mountain States Employers Council(MSEC) survey of members found average health-care premium rates in Colorado similar to thenational levels reported by Kaiser ($4,488 for singlecoverage and $13,152 for family coverage).MSECrespondents report somewhat slower recent pre-mium growth than the Kaiser report: from 2003 to2007 premiums increased 31% for single coverage
and 43% for families. As with the national figuresreported by Kaiser, Colorado premium costs areexpected to continue to outpace all other economicindicators such as inflation and growth of the over-all economy. For 2008,MSEC estimates that pre-miums will increase by around 8%, which is belowhistoric levels.
Frequently cited cost drivers include increased uti-lization of services, the aging population, cost ofnew technology, hospital and pharmacy reimburse-ment rate increases, and the cost of litigation and“defensive medicine.”Additionally, as the ranks ofthe uninsured and underinsured swell, and govern-ment reimbursements for Medicaid andMedicarefall short of costs, these uncompensated costs willcontinue to be shifted to privately insured employ-ers and their employees. According to a FamiliesUSA study in 2005, treatment costs for uninsuredadults increase private health insurance premiumrates by an average of 8.5%. Lastly, expansion ofambulatory surgical centers and inpatient capacityin new and expanded hospitals creates additionalsupply, which fulfills increased demand and drivesspending for services.
The rate of Coloradans without health insurancehas remained fairly constant since 2003-04, at 17%.According to the Colorado Health Institute’s (CHI)analysis of the Census Bureau’s Current PopulationSurvey in 2003-05, roughly 14% of children and20% of adults were without any form of healthinsurance. A recent study conducted by the LewinGroup for the Blue Ribbon Commission forHealthcare Reform found that 70% of the unin-sured were in families with at least one person
Educational and Health Services

2008 Colorado Business Economic Outlook
65
continued on page 66
employed. Colorado currently ranks 38th amongstates in the percentage of adults without insurancecoverage.While uninsurance rates have been rela-tively stable for the last few years, the absolutenumber of uninsured has grown along with popu-lation growth.
Types of CoverageIndividuals and businesses increasingly switch toeither the “high-deductible” plans (usually pre-ferred provider organizations, or PPOs) or the
consumer-driven health plans that allow for mod-eration of premium cost, while exposing individu-als to greater risk of out-of-pocket expenses. Thesteady increase nationally in PPO coverage since theearly 1990s has mirrored the increases in overallhealthcare benefit costs. Research by HealthLeaders–InterStudy suggests that HMOs lost some of theirgains in 2006 from the prior year. Nationally, 71million people are in traditional HMOs comparedto 74 million in 2006 and 68 million people in2005, when traditional HMOs had 23% of themarket. In 2006, HMO penetration in Colorado
was 28% (1.3 million members), an increase ofsome 200,000 over 2005 but below the high point1.5 million members in 2002. HMO enrollment asof mid-2007 stood at just over 1 million members.
High-deductible health plans, paired with flexiblespending accounts, have sparked the interest ofemployers nationally, yet introduction by employ-ers and adoption by employees remains low.According to the 2007 Kaiser Family Foundation,10% of firms are offering high-deductible healthplans with a savings option (HDHP/SO) in 2007but the difference from the 7% reported in 2006 isnot statistically significant. About 4 million coveredworkers are now enrolled in HDHP/SO plans. Atotal of 73% of firms with 200 or more workersoffer HDHP/SO, while only 20% of small firms(3–199 workers) provide this option.
Insurance carriers are also rewarding employeeswho take responsibility for their own health status.United HealthCare recently introduced to the Colo-rado market healthcare plans designed to allowemployees to offset portions of their deductible byrewarding individuals for health results in lifestylecategories such as tobacco use, body mass index,LDL cholesterol and blood pressure levels, andhealth assessment participation. Colorado insurersare also rolling out specific benefit healthcare planswith creative design options targeting small business,part-time workers, and the uninsured population.These include hospital-only plans, preventativebenefit-only plans, and so-called “schedule of ben-efits’ plans” that reimburse the patient a flatamount per doctor visit or per hospital day.
Educational Healthcare PercentageYear Services Services Totala Change1998 20.4 162.6 182.9 2.7%
1999 21.3 165.6 186.9 2.2 2000 22.7 170.1 192.8 3.2 2001 23.7 177.2 200.8 4.1 2002 24.6 183.9 208.5 3.8 2003 25.0 188.0 213.0 2.2 2004 26.1 192.4 218.5 2.6 2005 27.5 197.1 224.6 2.8 2006 28.5 202.4 230.9 2.8
2007b 29.9 210.1 240.0 3.9 2008c 31.1 216.9 248.0 3.3
aDue to rounding, the sum of the individual items may not equal the total.bEstimated.cForecast.
Source: Colorado Department of Labor and Employment and Colorado Business Economic
Outlook Committee.
COLORADO EDUCATIONAL AND HEALTHCARE SERVICES EMPLOYMENT1998–2008
(In Thousands)
One critique is that many of these plans with fewerbenefits or higher cost-sharing expose individualsto greater financial risk. Studies indicate that overhalf the personal bankruptcies in the United Statesare caused by “healthcare costs,” especially if cata-strophic illness or injury strikes. Yet many of theseindividuals have or did have some level of healthinsurance. Colorado healthcare providers are alsoconcerned. Colorado hospital respondents reporta 50% increase in bad debt expense from 2003 to2006, some of which may be attributable to new“affordable” plan designs. These plans are forcinghospitals and physicians to invest resources to col-lect directly from patients, increasing healthcareoverhead costs.
Colorado Small Group Coverage
The impact of rising healthcare costs on smallgroup firms (50 or fewer employees) is especiallychallenging. The 2007 Colorado Division ofInsurance’s survey shows that the small group mar-ket stabilized in 2006 after five years of continuousdecline. This market experienced a 0.4% loss(1,600 lives) in 2006 as opposed to the 4% (15,000lives) decline the prior year. Kaiser Permanente(84,000), United Healthcare (76,000), andAnthem/Wellpoint (57,000) dominate the small-carrier market, with 61% of total covered lives.From 2000 to year-end 2006, the Division ofInsurance reported a 34% decline in covered livesin the small-group market, from nearly 538,000 to357,000. Less than 40% of Colorado businesseswith 50 or fewer employees are offering healthinsurance. The small businesses in Colorado thatdo offer healthcare coverage typically have more
than 10 employees and have a larger proportion offull-time workers. They also occupy higher incomeindustry segments that must compete with largebusinesses for employees.
At the end of 2006, a total of 21 small group carri-ers were actively engaged in the Colorado market.Small group carriers indicated increases of morethan 8% in both “business group-of-one” andsmall group plans from 2005. Carriers operating inthe small group market reported 48,288 groupscovered, up from the 46,368 groups reported theprevious year. The number of “business group-of-one” policies continues to climb for the secondconsecutive year, with 13,942 policies as ofDecember 31, 2006, but that total is still in sharpcontrast to the 28,805 policies in 2000. Coloradoremains one of the few states to offer limited guar-anteed issue to business groups-of-one.
The small group marketplace continues to migratetoward lower benefited deductible and catastrophicproducts. The market perception of low-cost prod-ucts has shifted. Once HMOs dominated the lowprice segment; however, carriers have built largerproduct portfolios to offer plans at much lowerprice points, and these plans have become
extremely popular. In Colorado, HMO and indem-nity plan types continue to decline, whereas PPOplan types have increased. Health savings accounts(HSAs) continue to grow, with 15 carriers offeringHSA-compliant plans covering more than 33,000individuals, a 28% increase from 2005.
Even though the small group market is subject tolegislative rate regulations, the Bell Policy Centerconcluded in their 2007 Issue Brief that Colorado’srate regulations did not have a unique impact on atotal average premium cost in the small groupmarket. Rather, Colorado’s experience mirroredthat of other states and the nation as a wholethrough the 1990s and 2000s.Many in the smallgroup market are continuing to look at theColorado legislature and the Blue RibbonCommission on Health Care Reform to providethe needed relief for the small group market andthe Colorado healthcare system.
Legislative InitiativesThe 2006 General Assembly created a Blue RibbonCommission for Health Care Reform.While signedinto law by former Governor Owens, GovernorRitter supported the Commission and added 3members to the existing 24 commissioners. Thepurpose of the commission is to study and estab-lish healthcare reformmodels to expand healthcarecoverage and to decrease healthcare costs forColorado residents. “Previous models for healthcare reform fail to sufficiently involve the citizenswho pay for and are dependent on the health caresystem,” said bill sponsor Representative AnneMcGihon.“The Blue Ribbon Commission shifts
2008 Colorado Business Economic Outlook
66
Educational and Health Servicescontinued from page 65
Colorado hospital respondents report a 50%increase in bad debt expense from 2003 to2006, some of which may be attributableto new “affordable” plan designs.

For 2008, the General Assembly will see a numberof bills that emanate from the recommendations ofthe Blue Ribbon Commission. The most likely top-ics are expansions of public programs, support of asingle-payer system, and efforts for increased effi-ciencies to restrain the cost spiral.
Employment and Workforce IssuesEmployment in the health industry continues tobe limited by a national desperation for healthcareworkers, including physicians, nurses, and otherallied health professionals. By 2020, the pharma-ceutical industry is projecting a shortage of 157,000pharmacists nationwide.Major factors behind theincreasing demand for healthcare workers includepopulation growth, the aging of the populationand the nursing workforce, increased per capitademand for healthcare services, and new construc-tion of hospitals.
Registered nurses (RNs) account for 25% of theentire healthcare workforce, but only 7% are age 30or younger. According to the Colorado Center forNursing Excellence, two-thirds of the practicingregistered nurses in Colorado are older than 45,and of those, about 27% plan to leave nursing inthe next 10 years. The federal government projectsthat Colorado will have 17% fewer nurses than itneeds by 2010. By 2014, available RN positions areexpected to total more than 47,120, compared tothe 32,371 positions reported in 2004. Approxi-mately 2,200 new positions will be created in thenext two years to serve the aging population.
2008 Colorado Business Economic Outlook
67
continued on page 68
course and aims to lower and contain health carecosts by consulting consumers, businesses andother members of the community.” The committeerequested input from Coloradans and received 31proposals. Commission members selected fourproposals to model. The Lewin Group, the model-ing contractor, has estimated the increase (ordecrease) in the number of persons covered, theoverall costs, and where the burden of the costswould fall according to each plan. The commissionhas also constructed a fifth proposal that combinesmany of the elements in the other proposals, andthis will also be modeled. Six proposals call for a“single payer” and “universal access” approach.Nearly all proposals suggested expansion ofColorado’s Medicaid and ChildrenHealth Plan Plus(CHP+) programs, noting that Colorado’s pro-grams are leaner than those of most other states.Public input in all seven Congressional Districtsoccurred in October 2007. The committee’s recom-mendations to the legislature are due January 2008.Full proposal details and cost impacts can beaccessed at www.colorado.gov/208commission.
In 2007, the General Assembly passed HB-07-1355,which ends a practice of insurance rating flexibilitythat includes health status in the premium calcu-lation for small group insurance. All other bandrates, that is, the use of age, geography, industry,tobacco use, and family composition, remain.According to the insurance industry, health statusrating creates an environment where businessincentives are aligned with healthy behaviors,and 60% of small groups experienced premiumdiscounts of up to 25%.Advocates for the bill
supported a “more fair” community rating basis,pointing out that small businesses should not bepenalized for hiring persons with medical condi-tions and cited a Division of Insurance fact thatmany of the small groups that received the largerdiscounts had seen their rates go up the followingyear. The immediate impact will be on businessesthat were taking advantge of rating discounts. Theywill experience both the erosion of discounts andnormal premium increases. Both sides dispute theultimate impact on the number of lives that thesmall group market will cover and whether thenumber of carriers who offer small group policieswill change.
Another 2007 bill, SB-07-79, was passed as a sec-ond-year effort supported by the Colorado MedicalSociety to clarify contracting “rules of the road”between physicians and health plans. Some of theseprovisions include the rights of physicians toreceive timely notice of material changes to reim-bursements and to refuse to be included in othernetworks or other health plan products withoutpenalty. Similar legislation is being proposed in theOhio legislature in 2007.
By 2020, the pharmaceutical industryis projecting a shortage of 157,000pharmacists nationwide.

2008 Colorado Business Economic Outlook
Educational and Health Servicescontinued from page 69
68
A large number of qualified applicants for nursingschools are turned away every year as the numberand size of nursing programs are inadequate. Inaddition, nursing faculty positions are difficult tofill. Nursing schools are expensive to operate,receive no federal funding, and usually lose money.In Colorado, the annual number of nursing gradu-ates has increased to approximately 1,600 per year.However, the four-year nursing schools still reporta 15% shortage in faculty members.
The turnover rate for licensed nurses is high acrossthe industry, but its peak is in the first two years ofemployment.When surveyed, nurses cite increasedadministrative requirements, increased workloaddue to the acuity of the patient mix, inadequatestaffing and compensation, and disrespectful physi-cian behavior as the reason for the high turnover.The global economy is responding to this need.While Colorado-specific data were not available, arecent study by the PricewaterhouseCoopersHealth Institute reports that 13% of newly licensednurses in the United States graduate from interna-tional nursing programs.
A major shortage of physicians is also predicted. Inthe United States, the number of medical schoolgraduates has remained relatively stable through-out the past 25 years. However, demand is growingas the population ages. The Association ofAmerican Medical Colleges has called for a 30%increase in graduates to meet the demand by 2020,and has responded with plans to open a number ofnew medical schools in the next few years.
According to the Colorado Health Institute, 35% ofthe physicians in the state of Colorado are over theage of 55, and will reach retirement age within 10years.Medicare and Medicaid patients often facedifficulty in finding a physician practice that isaccepting new patients.
Compounding the problem is a shortage of newphysicians that are choosing to practice in primarycare specialties. More primary care physicians areneeded throughout the state, especially in ruralareas. However, newly graduated MDs are oftendeeply in debt with student loans, and thus choosehigher paying specialties than primary care.
The shortage of primary care physicians hasalready precipitated some market response. Anappointment with a physician extender (nursepractitioner or physician assistant) is becoming amainstream alternative to a primary care physicianvisit. A number of retail outlet stores, most notablyWal-Mart, have introduced “retail clinics” in theirstores. Consumers can choose to see a nurse practi-tioner in one of these retail locations to meet theirneeds for basic medical care. (For additional infor-mation on this topic, see page 70.)
The trend has also led to an influx of foreignmedical professionals who received their trainingin other countries. A recent study by the Price-waterhouseCoopers Health Institute reports that26% of the physicians entering residency programsin the United States in 2005 were graduates ofinternational medical programs. The 6,500 foreignphysicians entering residency programs in theUnited States in 2005 accounted for 42% of theinternal medicine positions, 37% of family medi-cine positions, and 25% of pediatric positions.
Colorado is expanding capacity to help meet thisprovider shortage. There are plans to open a newschool for doctors of osteopathy, the Rocky VistaUniversity College of Osteopathic Medicine, inParker. The school proposes to admit 150 studentsfor the first academic class, beginning fall 2008.Also admitting its first class for the fall semester of2008 is Regis University’s new school of pharmacy,located in the Rueckert-Hartman School for HealthProfessions.
There is positive news in the dental educationarea. CU’s School of Dental Medicine has increasedcapacity and is now training more than 300 stu-dents a year as a result of its relocation to theFitzsimons campus. It currently has four classes of50 students each in the dental school and capacityfor 25 students in each of two dental hygiene pro-grams. Additionally, it has added an InternationalStudent Program for foreign dentists and peri-odontal and orthodontics residency programs.
Medicare and Medicaid patients oftenface difficulty in finding a physicianpractice that is accepting new patients.

2008 Colorado Business Economic Outlook
69
Healthcare Drives Spending inConstruction and InformationTechnologyConstruction of new hospitals and renovation ofexisting institutions continues apace, includingnew construction, renovations, and replacementfacilities. An informal sampling of projects includes16 new facilities and 11 renovations completedwithin the last four years and 15 facilities underconstruction or in the planning stage.
Facilities in the planning stages or under construc-tion include new hospitals in Pagosa Springs,Castle Rock, Lakewood, Colorado Springs, andTelluride. Replacement facilities are in the planningor construction phase in many communities.Hospital-, medical-, and biotechnology-relatedcapital construction continues at Fitzsimons inAurora, where two hospitals have recentlymoved—the University of Colorado HospitalAnschutz campus and The Children’s Hospital—and the Veterans Administration Hospital is in theplanning stage of moving to Fitzsimons.
Construction is driven by two major forces: thegrowth in Colorado’s population and the need toupgrade facilities and technology to provideincreasingly sophisticated medical and healthcareservices. According to Thomas R. Prince, Professorof Accounting and Information Systems atNorthwestern University, one way to measure thefinancial health of a hospital is to consider theaverage age of the hospital’s physical plant andequipment. Of 37 Colorado hospitals reporting, 17are classified as being at the point where strategic
planning for updated medical technology and facil-ities is needed.
Hospital construction is a boon for the Coloradoeconomy in two ways. First, the construction putsmillions of dollars into the economy, both directlyand indirectly, with an economic multiplier effectof greater than two times the actual cost of con-struction. Second, as hospitals rebuild and newhospitals are opened, additional employmentopportunities become available.Many of the jobscreated are high-paying positions with benefits,averaging $60,000 per year. The multiplier effectfrom employment is 2.26 for salary and benefits,and each position supports itself and 1.46 otherpositions (multiplier of 2.46) in the community.
Unlike the hospital facility sector, the ColoradoDepartment of Public Health and Environmentreports continued flat to very low rates of newlicenses for long-term care facilities (nursinghomes) and assisted living facilities.
Federal, state, and local agencies are drivingnumerous health information exchange (HIE) ini-tiatives related to a broad agenda to “transform”healthcare through improved efficiency, better
quality of care, and more information (“trans-parency”) for consumers. Through executivebranch actions, legislative mandates, and otherpublic-private partnerships, states are increasinglyactive in establishing targets for healthcare infor-mation technology (HIT) adoption, setting upleadership and oversight entities, and, in somecases, providing resources and incentives for HITand HIE adoption.
Colorado’s efforts to develop statewide interoper-ability continue through numerous avenues. Theseinclude the $5 million Agency for HealthcareResearch and Quality-funded Colorado HealthInformation Exchange project (COHIE) that isdeveloping technical architecture. There arenumerous local HIE “nodes,” including healthcareproviders in Mesa County, El Paso County, andWeld County. A multistakeholder coalition calledthe Colorado Regional Health Information Organi-zation (CORHIO) incorporated in March 2007 asa 501(c) nonprofit organization.Working to buildColorado’s capacity for a statewide health informa-tion exchange based on a federated, web-basedmodel, CORHIO will lead the development and beresponsible for the ongoing operation of this net-work linking an array of providers, organizations,and networks throughout the state and eventuallybridging other state’s networks. CORHIO is therecipient of a subcontract from the University ofColorado Denver (an extension of the AHRQ con-tract terms) to operate the exchange on behalf ofthe community.
continued on page 70
Construction of medical facilities is drivenby the growth in Colorado’s population andthe need to upgrade facilities and technol-ogy to provide increasingly sophisticatedmedical and healthcare services.

Retail clinics are an emerging trend forhealthcare consumers who are assumingall or some of their healthcare costs.
diagnosis and treatment of common acute healthproblems, including sore throats, immunizations,and preventive care. Clinics follow evidence-basedguidelines when treating conditions.
Minneapolis-St. Paul was the location of the firstCCC in 2000, and it is estimated that there are cur-rently approximately 700 across the country, in-cluding 15 in Colorado, all in the Denver/Boulderarea. Expansion of CCCs is expected to tripleacross the country within the next few years. Eventhough a small percentage of the population useCCCs at this time, it is reported that the majorityof users were “very satisfied”with their experience.CCCs offer expanded geographical access, in-creased available hours, and reduced wait times.Concerns have been raised that CCCs may under-mine a patient’s quality, continuity, and coordina-tion of care with their primary care physician.Others believe CCCs fill a gap for consumers seek-ing alternative healthcare pathways that encouragethem to receive early care that may prevent use ofemergency departments for nonemergent care andprevent lengthy absences from work.Many physi-cians have partnered and collaborated with CCCsby their inclusion in the CCC’s referral network.
It is too early to understand the impact CCCs willhave on medical visit and prescription utilization.Demand most likely will continue to increase asconsumers become aware, accept, and use thismodel and payers provide incentives to directpatients to receive basic health services in a lowercost setting. CCCs also have the potential to pro-vide affordable basic quality healthcare services tothe underinsured and uninsured populations.
a range of plan designs to promote this type ofbehavior. It is hoped that high-deductible plans,health savings accounts, and changes to rolloverprovisions of flexible spending accounts may com-pel individuals to look for comparative cost andquality among providers of services. Studies indi-cate that before an aggressive consumer attitudetakes hold, access to information is necessary, alongwith motivation and education. However, informa-tion to enable this level of informed decision mak-ing is not necessarily readily available.
Convenient care clinics (CCCs), sometimesreferred to as retail clinics are an emerging trendfor healthcare consumers who are assuming all orsome of their healthcare costs. Defined by theindustry trade group Convenience Care Associationas “small health facilities located in convenient set-tings accessible to the public, these clinics providenon-emergency care services to walk-in patients,regardless of insurance coverage status, at afford-able prices, seven days a week.” These clinics havethe ability to provide consumers with affordable,accessible, and quality healthcare in a retail hostsetting (typically grocery, pharmacy, and massmerchandise chain stores). Staffed primarily bynurse practitioners with remote physician over-sight, services provided on a walk-in basis include
This federated model is neither a data repositorynor a comprehensive medical electronic record.Data will reside at the source and be sharedthrough a CORHIO hub by a secure and confiden-tial process when needed. CORHIO provides theinitial patient search, a master patient index, andthe transfer mechanism, including the ability toaggregate the data into meaningful information forpoint of care decision making. The initial dataexchange will allow clinical users to query anddisplay medical history for a single patient whena patient presents for treatment. The first releasewill display laboratory results, medication history,radiology text reports, and a simple “problem list”by mid-2008. Subsequent versions will include theability to send imaging, and future functionalitymay include clinical messaging, population healthservices, and public health measures andsurveillance.
For Coloradans, the ability to exchange healthinformation electronically is expected to improvepatient safety by decreasing medical errors, increaseefficiency by avoiding redundant or unnecessarytreatments or actions, and enhance public healthby monitoring potential health hazards.
Consumerism and ConsumerEngagement in HealthcareMany industry watchers claim that consumers havebeen insulated too long from the actual costs andutility of visits, procedures, and medicines, leadingto inappropriate utilization. “Consumerism” isviewed as a potential solution to the healthcarecost predicament, and employers are introducing
Educational and Health Servicescontinued from page 69
70
2008 Colorado Business Economic Outlook

continued on page 72
Disease management programs are considered tobe a “very effective” or “somewhat effective” tacticto reduce costs, according to 82% of benefit man-agers in the 2006 Kaiser Family Foundation study.These programs seek to provide patient education,coordinate between patients and physicians, andcoach for adherence to recommended treatmentgoals such as control of blood pressure and choles-terol. Disease management programs do not offerquick and substantial savings, especially whenpoorly implemented, but will be attractive toemployers who seek to manage their human capitaland get in front of healthcare costs by managingdirect healthcare expenditures, long- and short-term disability, productivity, and absenteeism.
Healthcare and Social AssistanceEmploymentIt is possible to track employment data back to 1990using the current NAICS categories. Between 1990and 2007, healthcare and social assistance employ-ment expanded at an annualized rate of 3.6%. Jobgrowth has occurred every year, even during reces-sionary cycles. As a point of reference, total stateemployment expanded at an annualized rate of2.5% and included jobs losses on two occasions.
During 1990-2007 ambulatory healthcareincreased by 3.5%, and hospital employment roseby 3.6%. The smaller subsectors also grew fasterthan the state average as nursing care employmentincreased 3.0% and social assistance employmentclimbed 4.4%.
outcomemetrics related to patient care. The prem-ise is that improved quality of care, combined withpublicly disclosed performance data, will result inbetter care and lower costs. TheMedicare PremierProject, which has both financial rewards andpenalties at stake for participating hospitals, is nowdemonstrating dramatic quality of care improve-ments, while other projects are still in evaluationphases.
It is estimated that lifestyle behaviors contribute upto 50% of an individual’s health status. For exam-ple, the epidemic of obesity leads to diabetes, andsmoking leads to heart disease.While Coloradoboasts the lowest rate of obesity in the nation, bal-looning from less than 10% of the state in 1990 to arate of 15%-20% in 2002. By 2002, none of the 50states were reporting obesity rates of less than 10%.
Ways to creatively improve the health of the popu-lation will be one of the only options to combat thecosts and complications of early or avoidablechronic diseases. Companies are more seriousabout improving the health of their workers byoffering prevention and wellness programs tar-geted to specific populations for behavior modifi-cation that can change employers medical costtrends. Additionally, more employers are providingonsite vaccinations, weight-loss programs, andgymmembership subsidies to combat the prob-lems. Large corporations are also empowering theiremployees by paying for the availability of patientadvocates who navigate the intricate healthcare sys-tem, identifying specialists, translating “doctorese,”and negotiating insurance claims for patients.
However, it remains uncertain if CCCs represent aviable business model, and their overall impact onhealthcare cost drivers is yet to be determined.
In 2005, Colorado hospitals released quality indi-cators to the public through the Colorado HospitalAssociation Performance and Quality Group, whosemembers represent healthcare, business, and gov-ernmental organizations. Colorado consumersnow have available 11 risk-adjusted mortality indi-cators and 4 volume indicators to gauge Coloradofull-service hospitals. More information will beavailable in November 2007 due to enacted Colo-rado legislation requiring a “hospital report card,”and in 2008 with the publication of hospital infec-tion rate reports. A Presidential Executive Orderissued in 2006 requires the federal government torelease hospital and physician data fromMedicare,Department of Defense, and the Federal EmployeeBenefits programs on costs and quality of care.Over the past three years,Medicare has requiredparticipating hospitals, nursing homes, renal dialy-sis centers, and home health agencies to post qualityof care data on theWeb through reimbursementpenalties for failing to report. Looking to the future,Medicare is planning on reducing reimbursementfor eight selected conditions, such as certain typesof surgical errors or hospital acquired infections ifthey are acquired in the hospital care setting,beginning in October 2008.
Other efforts, dubbed “Pay for Performance,”adopted byMedicare, private purchasers, and payers,will pay financial rewards to hospitals and physicianswhose data reflect that they are improving qualitythrough improved performance on process and
71
2008 Colorado Business Economic Outlook

2008 Colorado Business Economic Outlook
72
Educational and Health Servicescontinued from page 71
Healthcare and social assistance employment willgrow by 3.2%, or 6,800 jobs, in 2008. The impres-sive growth of this subsector over the past 18 yearshas been a driver of the state economy, and it hascreated an infrastructure that has allowedColorado to maintain a healthy population. It mustbe noted that not all of the employment growth inthe sector has been for medically trained workers.Much of the growth has been for IT workers todevelop and manage computer networks andinsure network security, office staff to collect billsand reduce bad debts, and food service and main-tenance personnel.
Educational Services (Private)The private education sector includes about 2,100organizations that will employ approximately30,000 employees in 2008. As a point of reference,about 177,000 public sector education employeesare recorded in the state and local government sec-tions. (Elementary and secondary educators areincluded in local government, while higher educa-tion is included in state government.)
The top employers include the University ofDenver, Regis University, Colorado College, theUniversity of Phoenix, Naropa Institute, and
Colorado Christian University. Other organizationsinclude companies that provide instruction in avariety of areas, including, for example, tennis andvolleyball camps, horseback riding academies, anddriver training institutes.
The growth in private education has most likelybeen a direct result of increased state population.In addition, as the general economy and the vari-ous industries go through their normal businesscycles, higher demand for training occurs duringexpansionary cycles, and outsourcing for educa-tional programs may occur during recessionarycycles. Growth in the sector has been driven byboth business demand for continuing educationprograms and consumer demand for training thatimproves quality of life. Approximately 1,200 jobswill be added in private education in both 2008.�
1998 66.1 41.2 30.0 25.3 162.6 2.4% 1999 66.1 42.4 30.6 26.6 165.6 1.82000 68.4 42.6 31.5 27.6 170.1 2.72001 71.0 44.4 32.6 29.1 177.2 4.22002 74.7 45.4 33.8 30.0 183.9 3.82003 77.4 46.4 33.9 30.3 188.0 2.22004 78.7 48.1 34.3 31.3 192.4 2.32005 80.7 49.1 35.1 32.3 197.1 2.42006 82.8 50.2 35.6 33.8 202.4 2.7
2007b 85.7 52.7 36.3 35.4 210.1 3.8 2008c
88.2 55.0 36.9 36.8 216.9 3.2aDue to rounding, the sum of the individual items may not equal the total.bEstimated.cForecast.
Source: Colorado Department of Labor and Employment and Colorado Business Economic Outlook Committee.
YearAmbulatory
Care HospitalsNursing
CareSocial
Assistance TotalaPercentage
Change
HEALTHCARE SERVICES EMPLOYMENT1998–2008
(In Thousands)

continued on page 74
Overview
This NAICS supersector includes performingarts, spectator sports, and related industries;
museums, historical sites, and similar institutions;amusement, gambling, and recreation industries;accommodations; and food services and drinkingplaces. Thus, the Leisure and Hospitality Super-sector of the Colorado economy encompasses abroad spectrum of businesses and activities. Itincludes not only the recreational and entertain-ment activities of both Colorado residents and thetourists who visit the state, but also the effects ofbusiness travel to and within Colorado.Moreover,much of Colorado’s leisure and hospitality busi-nesses exist and depend on the natural environ-ment that is such a central part of our state’s imageand lifestyle.
One of the economic contributions of the leisureand hospitality industry is its central role in attract-ing businesses and residents to Colorado. Each yearcompanies from all economic sectors move to thestate because of the environment. Indeed, recre-ational opportunities and quality of life offered bythe state enticed several major outdoor recreationalequipment and clothing manufacturers to establishtheir headquarters here. Finally, it is easy to forgetthat shopping is by far the most popular touristactivity; numerous Colorado shopping and outletstore malls depend heavily on tourism.
Good things happened to the Leisure andHospitality Supersector in 2007:
• The Colorado Tourism Office continued toreceive funding to promote tourism. This $19million+ investment will enable the state to becompetitive with other states.
• The Colorado Rockies won the National LeaguePennant and went to theWorld Series!
• The Museum of Contemporary Art opened inits new building.
• The Colorado ski industry posted its secondstraight record season with 12.56 million skiervisits in 2006–07.
• Lufthansa launched nonstop service betweenDenver and Munich, Germany.
• DIA continued to set air traffic records, and isnow the fourth busiest airport in the nation.
• It was announced that the 2008 DemocraticNational Convention will be held in Denver,putting the world spotlight on Colorado.
• Colorado’s ski and snowboard season openedOctober 10, 2007.
Leisure and Hospitality
Year
Arts,Entertainment,and Recreation Accommodations Food Service
TotalAccommodationsand Food Servicea
Total Leisure and
Hospitalitya
1998 38.5 40.1 152.5 192.6 231.01999 40.4 41.1 157.1 198.2 238.52000 42.5 41.6 161.9 203.5 246.02001 42.1 40.4 164.8 205.1 247.22002 41.1 39.8 166.2 205.9 247.02003 40.5 39.3 165.8 205.1 245.62004 42.2 39.1 170.0 209.1 251.32005 43.3 39.8 174.4 214.2 257.52006 44.3 41.1 179.6 220.7 265.0
2007b 47.0 41.0 185.5 226.5 273.5 2008c
47.9 42.0 189.6 231.6 279.5aDue to rounding, the sum of the individual items may not equal the total.bEstimated.cForecast.
Source: Colorado Department of Labor and Employment and Colorado Business Economic Outlook Committee.
LLEISURE AND HOSPITALITY EMPLOYMENT
1998–2008(In Thousands)
2008 Colorado Business Economic Outlook
73
Data presented at the Travel Industry Associationof America’s (TIA) Travel Marketing OutlookForum in Charlotte, North Carolina, in lateOctober 2007 indicate that the annual rate ofgrowth in travel spending has been declining,reflecting more stabilization in prices, softerdemand, and a general slowdown in consumerspending. Travel expenditures in the United Statesrose 7.8% in 2006, and are expected to slow to5.7% in 2007 and increase 5.2% in 2008 whenspending reaches $778 billion.
Leisure travel continues to be the bright spot in thetravel picture. Overall growth of 1.5% in U.S.domestic travel is forecast for 2007, with leisuretravel again taking the lead with a gain of 2.5%,while business travel declines modestly again. Theforecast for 2008 is for a modest recovery in busi-ness travel and stability in leisure travel, leading toan overall increase of 1.6%.
The Office of Travel and Tourism Industries proj-ects international travel to the United States willrise 5% in 2007, to 53.6 million visitors, and willreach 61.4 million by 2011.
The airline sector has returned to profitability andairlines are posting record passenger levels. The AirTransport Association is projecting continued slowgrowth in domestic and international airline trafficfor 2008.
It is a great time to be in the lodging business.Room demand, occupancy, and rates are up, whileroom supply increases are low. Aggressive pricing istaking place with the average daily rate (ADR) up6% in 2007, producing revenue per available room
tious consumer, visitation is expected to increasemodestly, while receipts will grow by 5.2%. Growthwill be led by the lodging, transportation, and foodand beverage sectors.
Colorado’s projected leisure tourism growth in2008 will affect the seven state tourism regions dif-ferently. The Denver Metro, Front Range, andNorthwest regions will experience the strongestgrowth. The South Central, Southwest, Southeast,and Northeast regions should expect moderategrowth over 2007.
The following paragraphs focus on specific areas inthe sector and are followed by a discussion of chal-lenges facing the leisure and hospitality industry.
EmploymentSince 2003 the Leisure and Hospitality Supersectorhas recorded strong performances with consistentgrowth. A total of about 19,400 jobs were addedbetween 2004 and 2006. Continued growth willoccur in 2007 as the sector is expected to increaseby 8,500 jobs, followed by a 2.1% rise in 2008, or6,000 jobs.
Food service dominates the employment picturefor this supersector.While the number of foodservice employees will increase by 4,100, the per-centage increase is relatively small, due to the largebase in this area.
AccommodationsAccording to the Rocky Mountain Lodging Report,statewide lodging occupancies are up 1.6 percent-age points from 2006 (66.6% compared to 65%),
(RevPAR) gains of 6.2%. These trends will con-tinue in 2008. Supply will rise 2% and demand willclimb 2%, resulting in relatively flat occupancygains. Room rates are forecast to be up 5.2%, pro-ducing RevPAR gains of 5.2% in 2008. Lodging willcontinue to enjoy increased profitability in 2008.
In summary, TIA expects to see modest growth intravel during 2008 as the economy slows and con-sumers become more cautious with their spending.Leisure person trips are expected to grow only0.4%.
The outlook for Colorado leisure tourism activityin 2008 is bright. During 2006, the state experi-enced record growth in the tourism economic sec-tors. So far in 2007, the state leisure tourismindustry is on pace to exceed 2006.
The state’s aggressive advertising and marketingprogram will stimulate additional consumer inter-est in visiting Colorado. However, extreme shifts incertain external factors can affect consumer deci-sions on where to vacation. In Colorado, those fac-tors can be consumer confidence in the economy,economic conditions, climate conditions, travelcost, and consumer debt.
The impact of the weak dollar makes Colorado anincreasingly attractive destination for internationaltravelers, especially Canadians and Europeans, andprovides an incentive for Americans to view a U.S.holiday as more economically favorable.
Under normal conditions, the leisure travel marketin Colorado will continue to grow in 2008, but at aslower rate than in the previous two years.Withslower national economic growth and a more cau-
Leisure and Hospitalitycontinued from page 73
74
2008 Colorado Business Economic Outlook

and ADRs increased 9.1% ($124.45 from $114.06)through September 2007. The data show goodimprovement in 2007, which is consistent withnational trends. Both the leisure and business travelsegments have grown, and most areas of the lodg-ing market report occupancy gains year-to-date. Acloser examination of the data indicates that occu-pancy increases have been accompanied by strongroom-rate growth in the Denver metro market, theresort market, and higher-end properties. Thus, theoutlook is quite promising for these segments.
The Colorado lodging and hospitality forecast tableon this page displays data for many areas in the stateby the key lodging variables of occupancy, ADR,and RevPAR. Strong revenue growth is anticipatedin most regions. For the state as a whole, occu-pancy rates are expected to increase slightly; ADRwill rise 6.7%, from $135 to $144; and RevPAR willincrease 8.3%, from $86.40 to $93.60 in 2008.
Colorado’s lodging market fundamentals areexpected to remain robust through 2008, withanticipated growth in the demand for the leisure,individual commercial, and group traveler seg-ments. It is projected that demand growth will out-pace supply, due to construction costs. This willlead to increased occupancy pressure, which, inturn, will result in aggressive ADR growth in mostmarkets. Those markets with lower average ratesand those in interstate and small town areasmaylag behind the higher-rated urban, airport, andresort areas, but will still experience healthy rev-enue gains. An increase in capital availability for
2007 2008Average Revenue per Average Revenue per
Occupancy Daily Rate Available Room Occupancy Daily Rate Available Room
Denver Metro AreaSouth and SE 65% $103.00 $67.00 66% $107.00 $70.62Midtown 63 82.00 51.66 65 85.00 55.25Downtown 70 154.00 107.80 69 168.00 115.92Northeast 73 97.00 59.08 71 102.00 72.42West 65 93.50 60.78 67 96.00 64.32North 60 77.00 46.20 61 81.00 49.41Hwy 36 Corridor 69 107.00 73.83 71 115.00 81.65Boulder 68 115.00 78.20 69 124.00 85.56Subtotal 67 108.00 72.36 69 115.00 79.35
Colorado Springs 60 92.00 55.20 62 99.00 61.38
Resort AreasVail 57 280.00 159.60 59 299.00 176.41Aspen 65 385.00 250.25 69 410.00 282.90Steamboat 60 154.00 92.40 61 165.00 100.65Winter Park 36 145.00 52.20 35 152.00 53.20Other resorts 53 243.00 128.79 54 260.00 140.40Subtotal 55 238.00 130.90 59 253.00 149.27
Other Colorado CitiesDurango 70 106.00 73.67 70 112.00 78.40Grand Junction 75 78.00 58.50 75 82.00 61.50Glenwood Springs 70 108.00 75.06 70 112.00 78.40Estes Park 53 151.00 80.03 54 158.00 85.32Fort Collins 60 94.50 56.70 63 100.00 63.00
Other Colorado Areas 61 90.00 54.90 62 95.00 58.90
Colorado Total 64% $135.00 $86.40 65% $144.00 $93.60
COLORADO LODGING AND HOSPITALITY FORECASTS
Source: Hospitality Valuation Services, Inc., Rocky Mountain Lodging Report , and Colorado Business Economic Outlook Committee.
COLORADO LODGING AND HOSPITALITY FORECASTS
continued on page 76
75
2008 Colorado Business Economic Outlook
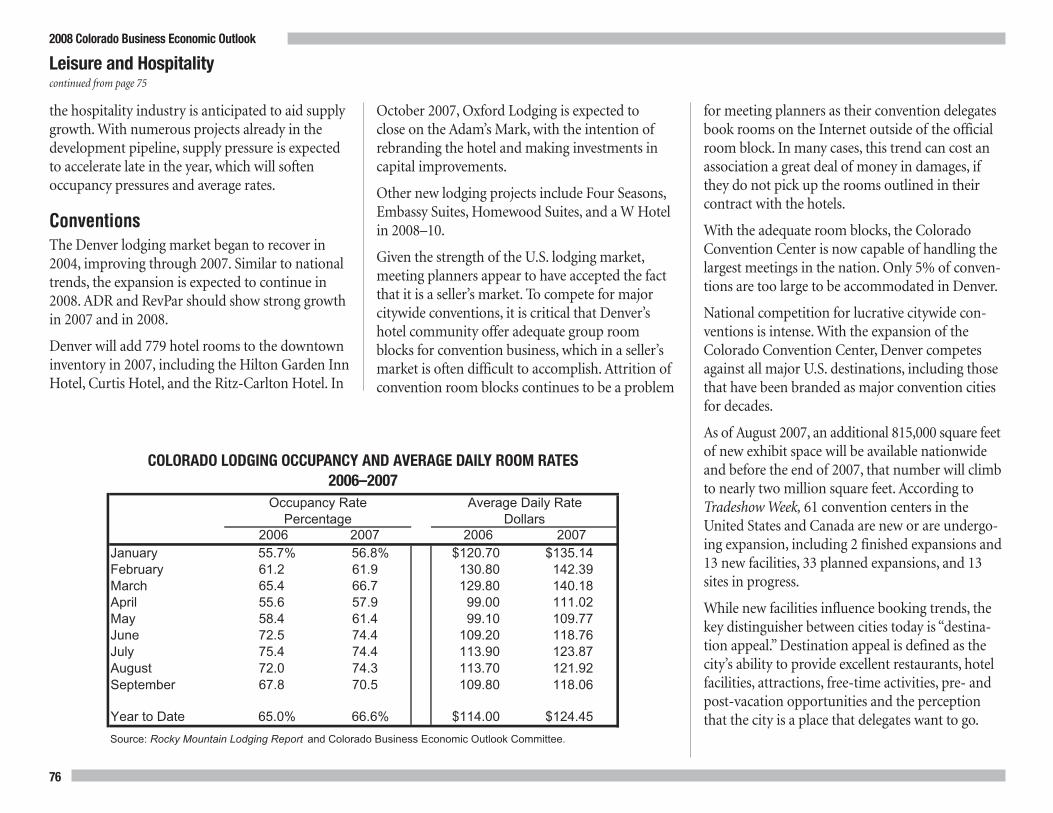
for meeting planners as their convention delegatesbook rooms on the Internet outside of the officialroom block. In many cases, this trend can cost anassociation a great deal of money in damages, ifthey do not pick up the rooms outlined in theircontract with the hotels.
With the adequate room blocks, the ColoradoConvention Center is now capable of handling thelargest meetings in the nation. Only 5% of conven-tions are too large to be accommodated in Denver.
National competition for lucrative citywide con-ventions is intense.With the expansion of theColorado Convention Center, Denver competesagainst all major U.S. destinations, including thosethat have been branded as major convention citiesfor decades.
As of August 2007, an additional 815,000 square feetof new exhibit space will be available nationwideand before the end of 2007, that number will climbto nearly two million square feet. According toTradeshowWeek, 61 convention centers in theUnited States and Canada are new or are undergo-ing expansion, including 2 finished expansions and13 new facilities, 33 planned expansions, and 13sites in progress.
While new facilities influence booking trends, thekey distinguisher between cities today is “destina-tion appeal.”Destination appeal is defined as thecity’s ability to provide excellent restaurants, hotelfacilities, attractions, free-time activities, pre- andpost-vacation opportunities and the perceptionthat the city is a place that delegates want to go.
2008 Colorado Business Economic Outlook
76
Leisure and Hospitalitycontinued from page 75
the hospitality industry is anticipated to aid supplygrowth.With numerous projects already in thedevelopment pipeline, supply pressure is expectedto accelerate late in the year, which will softenoccupancy pressures and average rates.
ConventionsThe Denver lodging market began to recover in2004, improving through 2007. Similar to nationaltrends, the expansion is expected to continue in2008. ADR and RevPar should show strong growthin 2007 and in 2008.
Denver will add 779 hotel rooms to the downtowninventory in 2007, including the Hilton Garden InnHotel, Curtis Hotel, and the Ritz-Carlton Hotel. In
October 2007, Oxford Lodging is expected toclose on the Adam’s Mark, with the intention ofrebranding the hotel and making investments incapital improvements.
Other new lodging projects include Four Seasons,Embassy Suites, Homewood Suites, and aWHotelin 2008–10.
Given the strength of the U.S. lodging market,meeting planners appear to have accepted the factthat it is a seller’s market. To compete for majorcitywide conventions, it is critical that Denver’shotel community offer adequate group roomblocks for convention business, which in a seller’smarket is often difficult to accomplish. Attrition ofconvention room blocks continues to be a problem
2006 2007 2006 2007January 55.7% 56.8% $120.70 $135.14February 61.2 61.9 130.80 142.39March 65.4 66.7 129.80 140.18April 55.6 57.9 99.00 111.02May 58.4 61.4 99.10 109.77June 72.5 74.4 109.20 118.76July 75.4 74.4 113.90 123.87August 72.0 74.3 113.70 121.92September 67.8 70.5 109.80 118.06
Year to Date 65.0% 66.6% $114.00 $124.45
Source: Rocky Mountain Lodging Report and Colorado Business Economic Outlook Committee.
Percentage Dollars
C
Occupancy Rate Average Daily Rate
COLORADO LODGING OCCUPANCY AND AVERAGE DAILY ROOM RATES2006–2007

2008 Colorado Business Economic Outlook
77
continued on page 78
and dining) continues to evolve.Meeting plannersare not always aware of what Denver has to offer.
Meeting planners looking for convention centersare witnessing a “buyers’market,” because manynew centers have been added to the mix. This situ-ation is reversed with hotels, where it is a “sellersmarket” owing to the fact that few new hotels havebeen added since 9/11.
Casinos and GamingColorado’s casino and gaming industry is on astrong growth pattern again after a pause in 2003.Adjusted gross proceeds (AGP) increased $29.6million in 2005 over 2004 and $26.6 million in
The best convention year in Denver’s history was2006, and 2007 will be even stronger. This trend isexpected to continue in 2008 and 2009.
A total of 74 conventions used the ColoradoConvention Center in 2007, a 34% increase over2006. As of fall 2007, the Denver Metro Convention&Visitors Bureau confirmed 470 meetings at indi-vidual hotel properties for a total of 544 bookingsin 2007. Together, these bookings will generate614,930 room nights in 2007, a 17% increase overthe 523,325 room nights in 2006.
Currently, 2008 is on pace with 2007 from a totalroom night standpoint, excluding the DemocraticNational Convention (DNC). The total number ofconvention bookings in 2008 is up 16%, but roomnights are comparable to 2007.
One of Denver’s strongest and highest profile con-vention years will be in 2008.
Elite conventions include the Frozen Four HockeyTournament in April; the National Performing ArtsConvention, which will attract the top media andleaders from all segments of the performing arts onJune 11–14; the American Association of Museums,which will bring all of the nation’s museum direc-tors to Denver fromApril 28–30; and the very pres-tigious Congressional Medal of Honor Society,which will celebrate America’s greatest militaryheroes, on September 14–19.
In addition to the 35,000 people coming to the DNCAugust 25–29, Denver will host 15,000 attendeesfor the International Association of Fire Chiefs con-ference fromAugust 15–18, and 30,000 at CustomElectronic Design and Installation Association
meeting on September 4–7, for a grand total of80,000 visitors in about a three-week period.
SummaryDenver is a strong convention city that is increas-ingly perceived by meeting planners as a first-tierdestination. The industry’s opinion of Denver’sinfrastructure, airport, hotels, attractions, sportsvenues, cultural amenities, and convention centeris among the very best in the country.
Denver’s “bricks and mortar”meeting infrastruc-ture rates high with meeting planners; however, theperception of Denver’s experiential and destinationappeal (attractions, nightlife, culture, shopping,
Colorado ColoradoYear Casinos Open Devices (000s) Black Hawk Central City Cripple Creek Total1998 49 13.4 $272.0 $94.0 $113.2 $479.21999 48 14.0 354.9 73.8 122.6 551.32000 45 14.6 433.8 63.5 134.6 631.92001 44 14.6 478.3 59.7 139.5 676.72002 43 15.6 524.5 52.8 142.4 719.72003 44 15.5 505.9 49.9 142.5 698.32004 45 15.7 524.0 53.2 148.7 725.92005 46 16.4 531.9 72.6 151.0 755.52006 46 17.1 554.5 74.5 153.1 782.1
2007b 44 16.9 578.3 82.0 154.6 814.9
2008c 44 16.8 595.7 84.5 156.1 836.3
aAGP calculated on an annual basis, hence different from the state fiscal year.bEstimated.cForecast.
Source: Colorado Division of Gaming and Colorado Business Economic Outlook Committee.
1Adjusted Gross Proceedsa (In Millions)
COLORADO CASINOS1998–2008

2006 over 2005, and are projected to climb another$32.8 million in 2007 and $21.4 million in 2008.July 2007 was a notable month as revenues atColorado casinos reached an all-time monthlyrecord of $76.5 million in AGP, breaking the previ-ous record of $74.5 million AGP in March 2007.
Black Hawk continues to dominate the Coloradocasino sector. It is clearly the leader with 20 casinos,more than 10,000 gaming devices, and over 70% ofthe industry’s AGP.
Since the completion of the new road from I-70 toCentral City in 2005, casino revenues in that cityhave shown steady growth. Cripple Creek is alsoexperiencing steady, consistent growth. It is antici-pated that the Colorado gaming industry willremain strong in 2008, with adjusted gross revenueincreasing by 2.6%, to $836.3 million.
In addition to the state-regulated casinos, Indiantribe casinos are located in the southwest part ofthe state. The Sky Ute Casino in Ignacio and theUte Mountain Casino in Towaoc make importanteconomic contributions, although their data arenot available and are not included in this analysis.
RestaurantsThe food service sector has been one of thestrongest performing segments in the Coloradoeconomy. According to the National RestaurantAssociation, for every $1 spent in restaurants inColorado an additional $1.36 in sales in otherindustries in the state is generated. Each additional$1 million spent in eating and drinking places inColorado generates another 41.7 jobs. Eating anddrinking establishments in Colorado number an
estimated 10,436, and 2007 restaurant sales willtotal $8.0 billion.
Since business conditions within the industry mir-ror general economic conditions, it is necessary tounderstand how the economy will perform in 2008.Real GDP growth of around 2% is anticipated;consequently, this expansion signals growth in therestaurant industry. The rate of increase in the dis-posable income is another strong indicator of res-taurant sales. Advances in real disposable incomein 2008 are expected to be in the 3% range. Thus,continued positive advances in restaurant sales areanticipated, although higher energy and food costswill pose challenges. Colorado is expected to con-tinue to outperform the nation again in 2008, bothin terms of restaurant sales and the overall economy.
Income growth will be moderate in Colorado,which is an important indicator of restaurant sales.Population will continue to grow at a solid rate,which provides the needed demographic boost forrestaurant sales and expansion. Total restaurantsales in Colorado are expected to grow in the 6%range in 2008, topping $8.5 billion and puttingColorado in the top 10–15 states in the nation interms of sales growth.
On the economic side, job growth in the restaurantindustry will likely be slower in 2008 as comparedto 2007, due to the constitutional minimum wageincrease that takes place every January 1. This putsa damper on job expansion, especially at entry-level positions. Job growth will also be negativelyaffected by the migration of immigrant families toother states owing to the passage of laws denyingsocial services to certain immigrants.
Almost half of Colorado citizens eat meals inrestaurants on a typical day. Half also report thatrestaurants are essential to their lifestyle. Up toone-third of sales come from travelers and tourists.Four out of five consumers agree that going out toa restaurant is a better way to use their leisure timethan cooking and cleaning up.
Parks and Outdoor RecreationColorado has an incredible outdoor recreation sys-tem anchored by premier national parks. Yet, visi-tation to state parks, national forests, Bureau ofLandManagement lands, and various county andcity park and open space areas exceeds the visita-tion to National Park Service facilities in the state.All these sites highlight the vast opportunities forrecreation in Colorado. NPS visitation of morethan 5 million is an important component oftourism and the overall outdoor recreation systemin Colorado.While NPS visits have been decliningin recent years, data for the first nine months of2007 show national park visits are reboundingnicely, with growth of 4.7%.Visits to RockyMountain National Park climbed 4.8%.
Leisure and Hospitalitycontinued from page 77
Visitation to state parks, national forests,BLM lands, and various county and citypark and open space areas exceeds thevisitation to National Park Service facili-ties in the state.
78
2008 Colorado Business Economic Outlook

Colorado state park visits are on the rise. Colorado’s41 state parks attract more than 11 million visitorseach year. Colorado State Parks manages morethan 4,000 camp sites, and 57 cabins and yurtsencompassing 246,000 land and water acres. It hasregistered more than 98,000 water vessels, 34,000snowmobiles, and 93,000 off-highway vehicles.Estimated expenditures by Colorado state parkvisitors, as measured by purchases made withina 50-mile radius of the parks, total more than$200 million.
In addition to public lands, an immense amountof outdoor recreational activity in Colorado takesplace on privately owned lands. Unfortunately, reli-able visitation data for these areas are unavailable.Moreover, the outdoor recreation sector, both
summer and winter, is extremely sensitive toweather and natural hazards, particularly wildfiresand floods. Taking all this into account, it is pro-jected that outdoor recreation behavior inColorado will grow essentially in conjunction withthe overall growth in state tourism. Thus, outdoorrecreation visitation is forecast to increase by1.5%–2%, and spending is projected to climbapproximately 5% in 2008.
Skiing IndustryColorado Ski Country USA (CSCUSA) resortshosted more than 12.56 million skier visits in the2006–07 season and set a new record for thesecond consecutive year. Skier visits are the meas-ure used to track participation in skiing and
snowboarding. A skier visit represents a personparticipating in the sport of skiing or snowboard-ing for any part of one day at a mountain resort.
While national industry numbers were down,Colorado’s 2006–07 visits show continued growth,with an addition of approximately 30,000 skiervisits over the previous season. According to fig-ures released by the National Ski Areas Associa-tion, the nation posted 55.1 million skiers duringthe 2006–07 season. Consequently, Colorado seta record in overall market share by capturingnearly 23% of the ski business market share inthe United States.
Parks 1998 1999 2000 2001 2002 2003 2004 2005 2006 2007a
Bent's Old Fort NHS 41.1 36.8 30.5 31.0 29.8 31.2 31.0 27.8 26.5 24.4Black Canyon of the Gunnison NP 193.5 200.1 191.5 181.0 173.7 167.2 175.6 180.8 160.5 208.1 Colorado NM 291.7 297.1 269.3 237.6 294.0 336.6 352.6 347.1 332.7 382.7 Curecanti NRA 973.7 1,044.5 1,022.3 879.8 732.7 1,008.8 1,006.1 882.8 936.4 959.4 Dinosaur NMb 311.0 303.9 293.8 241.5 221.4 214.5 240.7 266.8 206.1 177.7 Florissant Fossil Beds NM 79.8 81.5 82.1 79.7 62.5 67.5 61.3 59.5 56.1 54.8Great Sand Dunes NM 279.8 286.7 260.8 277.5 234.8 251.4 267.2 279.6 258.7 280.2 Hovenweep NMb 10.4 20.9 19.1 16.5 13.6 13.1 11.8 11.7 11.6 11.7Mesa Verde NP 604.6 635.7 452.3 513.4 406.4 438.6 446.8 498.3 557.3 546.4 Rocky Mountain NP 3,035.4 3,186.3 3,185.4 3,139.7 2,988.5 3,067.3 2,781.9 2,798.4 2,743.7 2,862.0Total Visitors to Parks and Sites 5,820.9 6,093.8 5,807.0 5,597.6 5,157.4 5,596.3 5,374.9 5,352.8 5,289.6 5,507.5 aEstimated.bDinosaur NM and Hovenweep NM cross into Utah, but the number of visitors reported in this table is only for the Colorado portion of the parks.
Source: National Park Service and Colorado Business Economic Outlook Committee.
C COLORADO PARKS VISITS1998–2007
(In Thousands)
continued on page 80
79
2008 Colorado Business Economic Outlook

COLORADO SKIER VISITS BY TYPE OF SKI AREA1997–2008(In Millions)Front Range
Destination Destination Gems/Front
Season Resortsa Resortsb RangecTotal
1997-98 4.08 6.68 1.22 11.981998-99 3.83 6.44 1.12 11.391999-00 3.47 6.30 1.12 10.892000-01 3.58 6.95 1.14 11.672001-02 3.38 6.71 1.03 11.122002-03 3.46 6.85 1.30 11.612003-04 3.52 6.56 1.17 11.252004-05 3.64 6.91 1.26 11.812005-06 3.72 7.47 1.33 12.532006-07 3.81 7.37 1.38 12.56
2007-08d 3.82 7.41 1.39 12.62
dForecast.
Source: Colorado Ski Country USA and Colorado Business Economic Outlook Committee.
cResorts either within a two-hour drive from Denver and/or with no bed base. This includes: Arapahoe Basin,Eldora, Loveland, Monarch, Powderhorn, Ski Cooper, SolVista, and Sunlight.
aResorts more than a two-hour drive from Denver with a bed base. This includes: Aspen Highlands, Aspen Mountain, Buttermilk, Crested Butte, Durango Mountain Resort, Howelson Hill, Silverton Mountain,Snowmass, Steamboat, Telluride, and Wolf Creek.bResorts within a two-hour drive of Denver with a bed base. This includes: Beaver Creek, Breckenridge,Copper Mountain, Keystone, Vail, and Winter Park.
periods, these six resorts still enjoyed their second-best season ever, exceeded only by the previousseason. By hosting a combined 7.3 million guests,not only does this category have the largest skiingmarket share in Colorado, but it serves more gueststhan most states do.
After its second consecutive record season,Colorado continues to be the nation’s premier win-ter ski destination, with more than 39,000 acres,311 lifts, 2,229 trails, and 40 terrain parks with 23pipes, 150 tables, and over 300 rails. The state’s skiresorts once again dominated SKI Magazine’sannual ranking of North America ski resorts. SixColorado resorts were in the top 10, led by Vail,which ranked #2. The top 10 resorts, according toSKI Magazine’s readers, are:
1. Deer Valley, Utah
2. Vail
3. Whistler/Blackcomb, British Columbia
4. Aspen
5. Snowmass
6. Park City, Utah
7. Breckenridge
8. Beaver Creek
9. Steamboat
10. SunValley, Idaho
The 2007–08 ski season will be helped by the invest-ment of millions of dollars in on-and off-mountainimprovements by the resorts. These enhancementsinclude new restaurants, gondolas, terrain, villages,snowmaking equipment, high-speed lifts, groom-ing machines, children’s centers, conference cen-ters, lodges, and guest service and green initiatives.
consecutive year, with more than 1.3 million guestsduring the 2006–07 winter season, an increase of3.3%, or 43,776 guests.While both the Front RangeGems and Destination Resorts saw good growthyears, Front Range Destination Resorts slid 1.3%from the previous record season. Despite highwayclosures and challenging intrastate travel from lateDecember through February, including key holiday
CSCUSA reports and distributes skier visit num-bers in three overall categories: destination resorts,Front Range destination resorts, and gems/FrontRange resorts. Hosting over 84,000 more gueststhan last season, Colorado’s destination resorts sawthe largest numerical increase of the three cate-gories. The Colorado Gems/Front Range resortscontinued their growth trend for the fourth
Leisure and Hospitalitycontinued from page 79
80
2008 Colorado Business Economic Outlook

TotalYear Enplanements Deplanements Passengersa
1998 18.4 18.4 36.81999 19.0 19.0 38.02000 19.4 19.4 38.82001 18.0 18.0 36.12002 17.8 17.8 35.72003 18.7 18.8 37.52004 21.1 21.1 42.42005 21.6 21.7 43.42006 23.7 23.7 47.3
2007b 24.7 24.7 49.3
2008c 25.5 25.5 51.1
1(In Millions)
2008aDue to rounding, the sum of the individual items may not equal the total.bEstimated.cForecast.
Source: Denver International Airport and Colorado Business Economic
Outlook Committee.
DENVER INTERNATIONAL AIRPORT PASSENGERS1998–2008(In Millions)
continued on page 82
in the same month of 2006 and the second-busiestmonth on record.
September 2007 set another record for that month,with 3.95 million passengers and a 5.1% increaseover the 3.76 million passengers posted the samemonth the previous year.
Through the first nine months of 2007, DIArecorded almost 38 million passengers, a 4.7%increase compared to the corresponding period in
will set a new record if Mother Nature cooperatesand produces the needed snow.
Air TravelAir travel is very important to the Leisure andHospitality Supersector. DIA posted its third-con-secutive record year in 2006, with 47.3 million pas-sengers. A total of 4.77 million passengers usedDIA in July 2007, making it the busiest month ever.The August total was 4.69 million, 7% higher thanthe 4.38 million travelers who passed through DIA
Upcoming events will also help boost ski visits,including:
• ESPNWinter X Games 12 and the Bud LightSpring Jam at Aspen/Snowmass.
• Charles Schwab Birds of PreyWorld Cup RaceWeek, NewYear’s Eve Fireworks and TorchlightSki-down, Beaver Creek and Bon AppétitCulinary andWine Focus, and the SnowshoeShuffle at Beaver Creek.
• Snow Daze, Carnival, the Honda snowboardcompetition session, Taste of Vail, Film Festivaland the American Ski Classic at Vail.
• The Hartford Ski Spectacular, Chevrolet U.S.Snowboard Grand Prix at Breckenridge.
• USSA NorAM Super SeriesWomen’sSlalom/Giant Slalom, Rock Mountain Free StyleCompetition, 33rd AnnualWells Fargo Cup,Coca-Cola Spring Splash atWinter Park.
• The 34th Annual Cowboy Downhill atSteamboat.
• U.S. Freeskiing Open Championships, ColoradoSpecial OlympicsWinter Games, and theUSASA Nationals at Copper, all at CopperMountain.
• 17th Annual U.S. Extreme FreeskiingChampionships at Crested Butte.
With the momentum of the record-breaking2006–07 season, multimillion-dollar resortimprovements, key events, excellent early reserva-tions, and a strong international market, it is pro-jected that skier visits will increase by 60,000. This
81
2008 Colorado Business Economic Outlook

highways, including bumper to bumper traffic onI-70, make visitors and locals ask if travel is still afun, rewarding experience or if they should juststay at home.
Increased competition from in-home entertain-ment providers presents another obstacle. U.S.households spend billions annually on home elec-tronics. Computers, HD and giant flat-screen LCDtelevisions, high-tech audio systems, CDs, DVDs,cable services, and NetFlix provide a multitude ofleisure pursuits, making it less expensive to stay athome than to go out for entertainment.
Finally, national trends indicate that travel is nowbecoming a slow-growth industry.While revenueshave risen sharply for most travel providers, it isbecause of increases in price rather than in trip vol-ume and visitor counts. It is becoming an increas-ing challenge for travel marketers to convince theconsumer to spend discretionary income on travelrather than on competing products.�
ChallengesVolatile energy prices will impact the Coloradoeconomy and be a special challenge to the Leisureand Hospitality Supersector. Since Colorado is amajor drive vacation market, the price of gasolineremains a concern.While most consumers think interms of gasoline prices, of equal importance is theprice of diesel, jet fuel, and other refined products.These inputs have cost impacts throughout theeconomy and on the consumer’s ability or desire tospend. The effect of volatile energy prices on dis-cretionary income will influence funds available fortravel expenditures.
Another concern is the current mortgage situation,along with the high level of debt that is currentlycarried by consumers and its impact on their abil-ity to travel.
The “hassle factor” has become a real challenge.Waits in security lines, late flights, airplanes packedto capacity, congestion in the skies and on the
2006. This makes it nearly certain that anotheryearly record will be set in 2007, with 49.3 millionpassengers.
The airport’s master plan sets its phase one capacityat 50 million passengers a year. It is expected thatthis total will be reached in 2008 with a projectionof 51.1 million passengers.
Colorado Springs Municipal Airport enplanementsand deplanements totaled just over 2 million pas-sengers in 2006—about the same number as 2005.Traffic was up 9% in September 2007. Two newcarriers, ExpressJet and Midwest Airlines, beganserving the airport in 2007.
In addition to DIA and Colorado Springs, sevenmountain airports provide service to many resorts.
Refer to the Trade, Transportation, and Utilities sec-tion for more information on air transportation.
Leisure and Hospitalitycontinued from page 81
82
2008 Colorado Business Economic Outlook

Year
Repair andMaintenance
ServicesPersonal and
Laundry Services
Religious, Grantmaking,Civic, Professional, and Similar Organizations Totala
PercentageChange
1998 22.0 19.4 36.0 77.3 2.1%1999 22.8 19.7 36.5 79.0 2.2 2000 23.1 20.3 36.8 80.2 1.5 2001 23.5 21.0 39.3 83.8 4.5 2002 23.5 21.1 41.0 85.6 2.1 2003 22.8 21.1 41.9 85.9 0.4 2004 22.7 21.5 43.2 87.4 1.7 2005 22.7 21.9 44.0 88.5 1.3 2006 22.7 22.3 45.9 90.9 2.7
2007b 22.7 22.9 47.3 92.9 2.2
2008c 22.7 23.5 48.7 94.9 2.2 aDue to rounding, the sum of the individual items may not equal the total.bEstimated.cForecast.Source: Colorado Department of Labor and Employment, and Colorado Business Economic Outlook Committee.
OTHER SERVICES EMPLOYMENT1998-2008
(In Thousands)
Other Services
TheOther Services Supersector comprises threesectors: Repair and Maintenance; Personal and
Laundry Services; and Religious, Grantmaking,Civic, Professional, and Similar Organizations.These are the personal service businesses that keepour cars running, clothes clean, hair cut, and pro-mote causes for the greater public good. Althoughmany of the companies in this supersector are largeand nationally recognizable, such as Jenny Craig,the Sierra Club, and Martinizing Dry Cleaning,many businesses are unique to Colorado, including
Bud’s Muffler, Bob’s Fine Furniture Refinishing,Mountain Cuts, Bighorn Center for Public Policy,and Busy-Bee Apparelmaster.
Colorado has had a higher annualized rate ofgrowth in this supersector compared to the nationfor the period 1997–2006, 2% versus 1.3%. Becausethese companies focus on personal services, thissector’s growth rate often parallels the rate of pop-ulation growth rather than overall employmentincreases.
In Colorado, 90,800 people were employed atnearly 12,700 firms in the Other Services Super-sector in 2006. This represented 3.5% of the totalstate employment, while nationally the OtherServices sector accounted for about 4% of allworkers. In 2006, the average annual pay in thissupersector in Colorado was nearly $33,000,slightly lower than the national average of approxi-mately $33,800. About 2,000 jobs will be added inthis sector in 2008.
OTHER SERVICES EMPLOYMENT1998–2008
(In Thousands)
continued on page 84
83
2008 Colorado Business Economic Outlook

Personal and Laundry ServicesThis second sector grew at a compound annualgrowth rate of 1.9% between 1997 and 2006, abouttwice the rate of national growth. This categoryincludes a wide array of employers, ranging fromnail salons to parking garages and dry cleaning tocemeteries. Over the past five years the followingareas showed steady increases: hair, nail, and skincare services; barber shops; beauty salons; deathservices; diet and weight reduction centers; andgarages and parking services. The most notableincrease has been in pet services.
Only two areas showed declines: dry cleaning ser-vices and photofinishing services. The advent ofdigital photography has almost eliminated com-panies that exclusively offer film development ser-vices. In 2006, approximately 3,500 firms providedpersonal and laundry services, and workers earnedaverage annual wages of $20,455. Employment inthe sector is projected to increase by 600 jobs, to23,500, in 2008.
Religious, Grantmaking, Civic,Professional, and Similar OrganizationsReligious, Grantmaking, Civic, Professional, andSimilar Organizations, the largest sector withinOther Services, includes organizations that areengaged primarily in nonprofit work. Theyaccount for about half of the total sector employ-ment. Nationally, grantmaking and social advocacyorganizations have shown the strongest growth inemployment, while labor unions have experienceda decline. The following four groups underwentstrong growth during the later part of the 1990sand early 2000s, but have been relatively flat overthe past five years: professional organizations, vol-untary health organizations, human rights groups,and business associations. Employment in thissubsector is projected to increase by about 1,400jobs in 2008.
Repair and Maintenance ServicesThis third and smallest sector has been decliningin employment since the start of the decade. How-ever, the number of businesses has been increasingsteadily, growing to about 4,600 firms in 2006. Thissituation is most likely a result of improved tech-nology and repair and diagnostic equipment, andgreater population over a larger geographical area.Average annual wages for the subsector were$34,319 in 2006.
Almost 80% of the employment in this sector is inautomotive repair and services, which includes oilchange and lube services, glass repair, and carwashes. Improved production of automobiles hasresulted in fewer trips to the repair shop. Otherareas of decline include employment in electronicequipment and furniture businesses and firms thatrepair computers. Offsetting increases have beenseen in the areas of home and garden equipmentand commercial machinery repair. The outlook isfor employment to remain flat, at 22,700 employees,in 2007 and 2008.�
2008 Colorado Business Economic Outlook
84
Other Servicescontinued from page 83

Government
Industry Group 1998 1999 2000 2001 2002 2003 2004 2005 2006 2007a 2008b
Total Governmentc 322.3 328.4 337.0 344.1 355.4 356.2 358.5 362.6 367.3 374.0 379.1 Federal 54.5 54.1 54.8 52.9 53.2 53.5 52.9 52.7 52.1 52.4 52.5 State 75.9 77.1 78.6 80.0 81.9 80.3 81.5 82.3 82.5 84.7 86.3 General 28.6 29.5 30.6 31.3 31.9 30.1 29.7 30.0 30.3 31.2 31.9 Education 47.3 47.6 48.0 48.7 50.0 50.2 51.8 52.3 52.2 53.5 54.4 Local 191.9 197.1 203.6 211.2 220.3 222.4 224.2 227.6 232.7 236.9 240.3 General 91.7 94.6 98.4 102.3 106.5 107.2 108.4 109.9 113.2 114.8 115.7 Education 100.2 102.5 105.2 108.9 113.8 115.2 115.8 117.7 119.5 122.1 124.6aEstimated.bForecast.cDue to rounding, the sum of the individual may not equal the total.
Source: Colorado Department of Labor and Employment and Colorado Business Economic Outlook Committee.
GOVERNMENT EMPLOYMENT IN COLORADO1998–2008
(In Thousands)
continued on page 86
2008 Colorado Business Economic Outlook
85
Trailing only Trade, Transportation and Utilities,Government is the second-largest supersector
in the Colorado economy, with 367,300 employeesin 2006, or 16.1% of total nonfarm employment.Total governmental employment in Colorado isexpected to increase to 373,400 in 2007 and 379,100the following year, for growth of 1.8% and 1.4%,respectively. Employment in government subsectorsis driven by diverse factors. Gains and losses in totalfull-time equivalent (FTE) federal employment canbe affected by base closures, funding levels for sci-entific research at various institutes and laboratories,and the budget for the state’s national parks. Stategovernment employment is propelled by healthygrowth in income and sales taxes, which are posi-tively correlated. County budgets, which dependmostly on property taxes and fees, are somewhat
more stable and predictable.Municipal budgetshinge on local sales taxes that may be volatile, lead-ing to layoffs and furloughs in years of slow rev-enue growth.
Federal GovernmentFederal government employment in Colorado hasgenerally been on a downward trend since 1994,with the exception of the 1.3% growth in 2000 as aresult of hiring to conduct the U.S. Census. From2001 to 2006, federal government employmentdeclined at an average annual rate of 0.3%, withnational federal employment levels exhibiting simi-lar trends. In 2006, Colorado’s federal governmentpayrolls fell 1.1%, compared to a smaller 0.2%decline at the national level.
Federal employment in the state is currently domi-nated by the state’s two largest federal employers—the U.S. Postal Service and the Department ofDefense. The U.S. Postal Service employs almost11,000 workers in Colorado and is showing flatemployment growth. Although urban and ruralareas in the state continue to experience popula-tion increases, these are offset by an overall declinein mail volume.
The Department of Defense accounted for approx-imately 10,400 workers throughout Colorado in2007, a 1.4% rise over 2006. The combination ofhiring in both large and small aerospace companiesand high-profile deals is contributing to thisemployment increase. In particular, Lockheed

Martin Space Systems recently announced an $8.2billion contract to design and build NASA’s newOrion spacecraft. The company is hiring 25–50new employees a month to help design. In addi-tion, the new Lockheed-Boeing joint rocket ven-ture, United Launch Alliance, is headquarteredin Colorado.
In 2007, the Business Research Division completedan economic impact study of the federal facilitieson the Metro Denver area. The study found anestimated 40,000 employees and contractors areemployed at metro area facilities. The federal oper-ations have a $6.7 billion impact on the MetroDenver region and an $8.4 billion impact onColorado. Average wages for jobs at the facilitiesare higher than the state average wage and requirea diverse set of skills.
Rebounding slightly, federal employment isexpected to increase 0.6% in 2007 and 0.2%, fora total of 52,500, in 2008.
State GovernmentThe state government’s budget picture has im-proved markedly since the economic downturnthat began in 2001. After a 2% decline in 2003,employment turned around in 2004 as the econ-omy and tax revenue rebounded. The current fore-cast calls for continued growth in 2007 and 2008.With an improving revenue outlook, restoration ofservices that had been cut has led to the hiring ofpersonnel to maintain pace with the growth in thecaseload of the state’s core programs. State govern-ment employment is expected to climb 2.7% byyear-end 2007, the largest gain in more than 10
years, and rise again by 1.9% in 2008. Over thepast decade, state government employment hasincreased by an average of 1.3% per year.
Due to Referendum C, it is estimated that thestate will retain about $1.3 billion in revenue in FY2007 that otherwise would have been returned totaxpayers under the provisions of TABOR. Theimproved budgetary flexibility provided by Refer-endum C, coupled with growth in state tax revenue,contributed to the 2007 employment increase that isexpected to carry into 2008.Although state tax rev-enue continues to grow, the 6% general fund appro-priations growth limit constrains the state’s ability toexpand current programs or create new ones.
One of the largest contributors to recent state gen-eral government employment growth (excludinghigher education) is the addition of personnel inthe state’s judicial system. The judicial system’scaseload is expected to increase about 19% fromFY 2003 to FY 2008. Legislation that passed in 2007increases the number of judges and associated staffin Colorado for the first time in several years tohelp keep pace with the caseload growth. Othersubstantial employment growth derives from again in personnel working in the state’s correc-tional system to help support the growing inmate
and parolee populations. The number of inmatesis expected to climb almost 30% from FY 2003 toFY 2008, while the parolee population is projectedto increase 75% during the same time period. Incontrast, the state’s population is estimated to riseonly about 9%. Personnel growth for the state’scorrectional and judicial systems represents abouthalf of the total personnel growth in the FY 2008state budget, excluding higher education.
Over time, general state government employment(excluding higher education) is highly correlatedwith the change in the state’s population. Govern-ment revenue and the growth in the caseload of thestate’s programs are also primary drivers of stategovernment employment. After tepid growth in2005 and 2006, state general government employ-ment will increase by 900 workers in 2007 and by700 employees in 2008.
Employment in the state’s institutions of highereducation currently accounts for approximately62% of total state government employment.Current and expected enrollment growth, coupledwith an improvement in the state higher educationbudget situation, should result in a rise in the num-ber of higher education employees. However, en-rollment growth is not expected to be substantialenough to drive significant personnel increases.Although the higher education budget picture hasimproved, state support for higher education is stillconstrained by the state’s general fund 6% spend-ing limit and the fact that spending in other partsof the general fund is mandated by statute and bythe state constitution. After a slight decline in state
Although state tax revenue continues togrow, the 6% general fund appropriationsgrowth limit constrains the state’s abilityto expand current programs or createnew ones.
Governmentcontinued from page 85
86
2008 Colorado Business Economic Outlook

higher education employment in 2006, employ-ment will rebound in 2007, with an estimated 2.5%growth rate. Higher education employment is alsoexpected to increase in 2008, though at a slowerrate than for general state government, 1.7%.
Local Government
GeneralLocal government comprises municipalities,counties, school districts, and special districts. Asof October 2007, active local governments in Colo-rado totaled 2,985, including 64 counties and 270municipalities. Special districts range from firedistricts to urban drainage and flood districts tometropolitan districts.
From 2001 through 2006, local governmentemployment in Colorado increased at an averageannual rate of 2%. Total local government grew2.1% in 2006 after posting only a 1.5% gain theprior year. Local government at the national levelincreased 0.9% from 2005 to 2006. A closer look atlocal government employment in Colorado revealsthat noneducational employment climbed 2.9% in2006, while local educational services employment,which accounts for 51% of local governmentemployment, rose 1.4%.
Strong retail sales tax receipts and robust residen-tial construction activity supported municipal gov-ernment employment in 2005 and 2006. Countygovernment employment also benefited fromresidential building activity, as well as increasedproperty tax revenues due to high levels of homesales in 2004 and 2005.
In 2007, Front Range municipalities reportedhigher employment figures than originally esti-mated in their budgets, but appear not to be plan-ning major hiring increases in 2008. For example,the City and County of Denver will expand its pay-rolls by only 0.8%, to 11,372, in 2008. After twoyears of robust gains in sales taxes, growth in retailtaxable activity has slowed and will impact thecity’s staffing patterns. At the same time, Aurorawill enlarge its public safety department to complywith the 1993 charter amendment requiring twopublic safety employees per 1,000 residents. Totalfull-time equivalent (FTE) growth will only be 19,or 0.7%. In a final example, Lakewood will incre-mentally extend its operations by 19 FTE, or 2%,mostly as a result of expanding part-time positionsinto full-time ones, bringing its total FTE countto 870.
Small municipalities depend heavily on a fewretailers for their tax base, and the opening of alarge retail store in a neighboring town can dentlocal public finances. For example, the City ofArvada will only add two positions to its 700-member municipal workforce. Double-digitgrowth in health insurance costs will dampen theemployment outlook in local governments for theforeseeable future. The City of Wheat Ridge hasmade a conscious effort to be conservative in itsmunicipal workforce growth after cutting staff by35.5 positions, or roughly 10%, in 2003 and 2004.The city has 222 FTE, and growth will be flat in2008. Broomfield will be similarly cautious, prelim-inarily planning on only one new position in its725-member staff.
Overall, municipal and county employment willincrease by only 900 positions statewide in 2008,to 115,700. This growth of 0.8% over 2007 is wellbelow the 10-year compound average annualgrowth rate of 2.4%.
EducationChanges in the local education subsector employ-ment are projected using information on schooldistrict enrollment. The Colorado LegislativeCouncil is estimating a 1.9% enrollment increasefrom the 2006–07 school year to the 2007–08school year, a gain of 13,805 FTE students. Thisgrowth is slightly above the 1.5% rise in the2006–07 school year enrollment, which was thelargest increase in several years.
Salaries paid to school district employees and pro-jected population changes also impact the localeducation subsector employment forecast. In theFY2005–06, total salaries paid to district employeesincreased 3.8%. Employee benefits account for alarge and growing fraction of school district per-sonnel expenditures, making up 19% of compen-sation paid in 2005–06, compared to 16% in2002–03. Total compensation increased nearly 5%in 2005–06, while employment rose 1.8%. In2004–05, salaries and benefits climbed 4.2%, whileemployment went up 1.5%.
In the fall of 2006, a total of 794,026 students wereenrolled in Colorado public schools, a gain of 4%over the previous year. The state demographer’soffice is projecting an increase of 2% between 2007
continued on page 88
87
2008 Colorado Business Economic Outlook

According to the National Center for EducationStatistics’ Projections of Education Statistics to2015, total enrollment in elementary and second-ary schools across the nation is expected to rise 6%between 2003 and 2015, compared to 12.7% esti-mated growth for Colorado. Colorado ranks 9thin projected growth among the 32 states thatforecasted an enrollment increase between 2003and 2015.
Overall, school district employment will grow 2.1%in Colorado in 2008, to 124,600 employees.�
During the 2006–07 school year, nearly 7% ofColorado’s public school students attended 142charter schools, with 52,000 enrolled students.Charter school employees are public employees bylaw and are included in the local government edu-cation subsector.
Colorado ranked 17th in the nation in the per-centage of residents with a high school degree,at 88% of residents, according to the U.S. CensusBureau’s 2006 American Community Survey. In2005, 88.7% of Colorado residents had earned atleast a high school diploma, ranking the state 13thnationally.
and 2008 in the population of school-age children.Still, many districts face decreasing enrollmentamong their traditional public schools. Most nota-bly, Denver Public Schools recently proposed theclosure of eight underenrolled schools. Accordingto the Rocky Mountain News, about one-quarterof children ages 5–17 in Denver did not attend thecity’s traditional public schools, and officials expectthat number to increase through 2016. Charterschool enrollment in Denver has soared 300% inthe last five years. Between 2000 and 2006, enroll-ment in Denver charter schools grew by 6,846students, while it fell by 4,028 in traditional Denverpublic schools.
Governmentcontinued from page 87
88
2008 Colorado Business Economic Outlook

International Trade
Export Outlook and Forecast
Despite an overall rise in U.S. exports promptedby global market conditions favoring U.S.
goods and services, Colorado’s merchandise exportsare expected to decline in 2007. Following a strong17.3% increase in 2006, Colorado exports fell by6% through the first eight months of 2007. In par-ticular, the loss of manufacturing jobs in Colorado,caused by the closure of high-tech manufacturingoperations in the state, has contributed to thedownturn in merchandise exports. Based on gen-eral market conditions, the 6% decline alreadyexperienced, and a history of weak exports in thefourth quarter, Colorado merchandise exports areexpected to fall 11% in 2007. A more competitiveU.S. dollar and continued growth in Coloradoagricultural exports will lead to a slight reboundin 2008. Accordingly, the International TradeCommittee is forecasting Colorado exports willrise 1.5% in 2008.
Global, National, and State BackdropAlthough global economic expansion remainssound, albeit slowing slightly, there are downsiderisks to growth in 2008. For the first half of 2007,global growth remained above 5%, led by China,India, and Russia. However, financial market tur-moil spilling over from the U.S. mortgage marketdifficulties into emerging markets, slower growthin Europe as a result of currency appreciation, andthe trade impact of diminished U.S. spending areall expected to lower 2008 global growth to 4.8%,down from the IMF forecast of 5.2% for 2007.Trends in commodity prices represent another
potential risk to global growth, particularly if oilprices continue to move upward.
The U.S. economy is expected to slow in 2008,owing to the crisis in the subprime mortgagemarket that is affecting housing, construction,and consumer spending in both the U.S. and globalfinancial markets. Disposable income is taking ahit from higher resets on subprime adjustable ratemortgages and job losses in residential construc-tion and mortgage-related financial services. Theimmediate impact on overseas markets is the rever-sal in risk appetite while other factors—lower U.S.imports, investor losses, and the potential negativeimpact on newly developing mortgage markets inemerging market economies—may have extendedeffects on global markets. Nonetheless, lower U.S.consumption could also positively impact exportsas suppliers shift sales overseas to make up forreduced domestic consumption.
Theoretically, the weak U.S. dollar could lead tohigher exports of U.S. products, providingexporters with more competitive pricing. The U.S.dollar (interbank market rate) has declined 12.9%in nominal terms against the euro for the 12-monthperiod through late October 2007. Indeed, thedecline in the value of the dollar against othermajor trading currencies appears to have had anoverall positive impact on U.S. exports, which grewmore than twice as fast as imports in the first halfof 2007. For the year through August 2007, the U.S.trade deficit for goods and services declined 10%relative to the same period in 2006, according to aU.S. Census Bureau report. As further evidence, thePort of Long Beach—the second largest in the
nation—reported a 4.5% decline in the numberof unfilled containers leaving the port over the 11months ending September 30, 2007.
Unfortunately, Colorado merchandise exports havenot realized the benefits of the more competitivecurrency due to other factors impacting the state’sperformance.Most significant is the loss in manu-facturing jobs in the state, which has negativelyimpacted the export of high-tech components. TheManufacturing Committee estimates that 4,400jobs in this sector (NAICS 334) will be lost in 2007and an additional 4,000 will disappear in 2008.Exports of computers and data storage devices and
Year Total ExportsPercentage
Change
2002 $5,521.7 -9.9%
2003 6,109.1 10.6
2004 6,651.0 8.9
2005 6,783.6 2.0
2006 7,956.0 17.3
2007a 7,080.8 -11.0 2008b
7,187.0 1.5aEstimated.bForecast.
Source: World Institute for Strategic Economic Research and Colorado Business Economic Outlook Committee.
F
VALUE OF COLORADO EXPORTSFISCAL YEARS 2002–2008(In Millions of Dollars)
continued on page 90
89
2008 Colorado Business Economic Outlook

electronic integrated circuits (HS 8471 and HS8542) declined a combined 33.4% through August2007 as they were hit hard by the closure of a largemanufacturing facility.
Export Trends with Free Trade PartnersWith theWTO Doha round of negotiations at astandstill and U.S. national elections on the horizonin 2008, little progress is expected in global tradenegotiations and the rati�cation of pending bilat-eral free trade agreements. This could be unfortu-nate for Colorado exporters as the International
Trade Administration notes that “FTAs [free tradeagreements] have proved to be one of the best waysto open up foreign markets to U.S. exporters. Lastyear, trade with U.S. FTA partners was signi�cantlygreater than their relative share of the global econ-omy” (ITA, US Export Fact Sheet, August 2007Export Statistics, released October 11, 2007).
Description 2005 2006 Aug 2007 YTD
PercentageChange
2005- 2006
PercentageChange
2006- 2007 YTDElectronic Integrated Circuits and Micro assemblies $763.0 $1,296.6 $612.3 69.9% -26.7%Automatic Data Process Machines; Magn Reader Etc. 983.1 936.6 343.6 -4.7 -42.7Print Machinery, Machines Ancillary to Printing 10.7 12.4 212.9 15.6 2,247.3Medical, Surgical, Dental or Vet Inst, No Elec, Pts 176.9 221.7 209.8 25.3 43.7Parts Etc for ADP and Other O�ce Machines 654.5 656.7 169.5 0.3 -60.1Meat of Bovine Animals, Fresh or Chilled 152.2 263.1 166.1 72.9 -1.9Photo Plates and Film, Flat, Sensitized, Unexposed 124.2 166.4 132.8 34.0 26.5Animal Parts 29.2 51.7 120.7 76.9 304.4Instruments for Measure or Check Flow, Level Etc., Pts 117.1 126.4 107.6 7.9 29.6Electric Apparatus for Line Telephony Etc., Parts 230.7 239.3 101.9 3.7 -37.9Instruments for Physical Analysis Etc.; Microtome; Pts 100.1 122.6 90.8 22.5 22.6Raw Hides and Skins of Bovine or Equine Animals 85.9 98.4 90.7 14.5 50.3Parts of Balloons Etc., Aircraft, Spacecraft Etc. 142.2 126.6 90.6 -11.0 -0.5Molybdenum Ores and Concentrates 43.9 48.6 87.3 10.7 136.4Photo Film in Rolls Sensitized, Unexposed 171.3 211.4 73.9 23.4 -45.8Meat of Swine (Pork), Fresh, Chilled or Frozen 92.7 74.8 62.1 -19.2 28.4Orthopedic Appl; Artif Body Pts; Hear Aid; Pts Etc. 61.2 73.5 60.8 20.1 29.6Beryllium, Chrom, Germ, Vanad, Gallium, Hafnm, Etc. 11.5 64.1 57.3 455.0 59.4TV Receivers, Including Video Monitors and Projectors 155.5 10.9 55.3 -93.0 610.5Oscilloscopes, Spectrum Analyzers Etc., Parts Etc. 117.5 210.3 49.7 78.9 -65.8Total All Commodities $6,783.6 $7,956.0 $4,932.5 17.3% -6.0%
TOP 20 COLORADO EXPORTS(In Millions of Dollars)
Source: Foreign Trade Division of the U.S. Census Bureau and WISER.
TOP 20 COLORADO EXPORTS(In Millions of Dollars)
International Tradecontinued from page 89
90
2008 Colorado Business Economic Outlook
FTAs have been signed with Panama, Peru,Colombia, and South Korea, and they are grand-fathered under the President’s Trade PromotionAuthority. Political concerns overshadow theColombian treaty, and South Korea is likely to beheld up owing to the lack of access for U.S. beefexports, an important export market for Coloradoranchers. Upcoming elections could change thedynamics of FTA policies in the United States,while public sentiment is also drifting away fromsupport for free trade. A recent Pew ResearchCenter poll showed that five years ago 78% ofAmericans thought world trade was having apositive impact; today only 59% agree.
After a record year in 2006, Colorado’s exportshave dropped among five of the state’s nine freetrade partners. The top five free trade partners(Canada,Mexico, Australia, Singapore, and Israel)together declined 7% in exports from Colorado,with significant decreases in machinery and me-chanical appliances, and the electrical machineryequipment industries. However, the other fourfree trade partners (Chile, Jordan, Bahrain, andMorocco) combined showed an increase of 19%in exports from Colorado. The industries thataccounted for this proliferation are more diverseand reveal no specific pattern or product trends.
Colorado Exports to Foreign TradeAgreement Markets
Colorado’s Manufacturing ExportsWhile the state’s exports of agricultural products,minerals, and a number of key manufactured
products, such as medical equipment, instrumen-tation, industrial photographic products, andprinters, continued to grow through August 2007,the two largest manufactured product categories,electronic integrated circuits (HS 8542) and com-puters and data storage devices (HS 8471) declinedby 26.7% and 42.7%, respectively. These decreases,combined with a 60.1% decline in exports of partsfor computers and other office machines (HS8473), overshadowed the growth seen in manyother manufactured product categories.WhileU.S. exports for these same three categories (HS8542, HS8471, and HS 8473) also fell, Coloradobusinesses in these industry sectors experiencedlarger declines.
In some cases, the manufacture of these compo-nents has moved closer to the markets where thefinal assembly work is done, while in other casesthe manufacturing was consolidated at anotherU.S. location. Future growth in these key productcategories is questionable, although Coloradoremains the location of choice for most of thedesign and engineering support services.
Colorado’s Services Exports—The Great UnknownDiscerning the full economic importance ofColorado’s exports is hampered by a lack of sta-tistical data for services sector exports at the statelevel. This is particularly important for Coloradobecause services represents a large portion of thestate economy. In Colorado, 43.1% of GDP in 2006could be attributed to services, whereas agriculture,mining, and manufacturing represented a com-
bined total of 12.8% of GDP. If the definition ofthe services sector is narrowed to the traditionalexport services—information, and professionaland technical services—it still represented 16.5%of Colorado’s GDP in 2006—3.7%more than thetraditional merchandise export sectors.
According to anecdotal evidence, including pressreports regarding the operations of large servicecompanies in Colorado and reports from localexport assistance programs, revenues from foreigncontracts are important. No system exists to trackforeign tourists visiting Colorado and estimate theamount of revenues they contribute to the econ-omy. Large revenues are also generated from theinflux of foreign students within the Colorado uni-versity system and foreign student spending in thestate’s economy. Nonetheless, it can be concludedthat the importance of this export sector is muchmore significant than the picture portrayed byexisting data.
Top Export Markets by Region
AmericasShipments to Canada, Latin America, and theCaribbean made up approximately 40% of allColorado exports through August 2007, an increaseof 2% from 2006. However, total exports to thecountries of theWestern hemisphere fell 1.7%from the same period last year. For Colorado,Canada continued to be the dominant market inthe Americas, totaling $1.18 billion through August2007, also down slightly from 2006.Mexico held its
continued on page 92
91
2008 Colorado Business Economic Outlook

International Tradecontinued from page 91
Country Commodities (sorted by Aug. 2007 YTD) 2002 2003 2004 2005 20062006 Aug
YTD2007 Aug
YTD
NAFTA Total All Commodities $1,795.8 $2,002.1 $2,349.8 $2,656.4 $2,869.4 $1,877.0 $1,826.3 1) Industrial Machinery, Including Computers 766.9 904.5 1,148.2 1,178.4 1,304.3 825.0 627.4 2) Meat and Edible Meat Offal 164.6 202.9 178.5 241.5 339.1 221.6 208.1
Australia Total All Commodities 117.5 112.7 140.7 222.8 217.6 156.0 102.2 1) Pharmaceutical Products 1.8 1.1 6.5 18.6 34.1 24.6 25.9 2) Industrial Machinery, Including Computers 40.1 40.1 33.5 50.6 51.9 38.7 24.9
Singapore Total All Commodities 237.2 236.7 187.2 156.1 177.8 119.2 81.9 1) Industrial Machinery, Including Computers 45.9 56.8 52.3 49.6 38.1 27.4 23.3 2)Optic, Photo, Etc.; Medical Instruments, Etc. 68.3 68.8 28.7 29.5 24.4 18.9 15.7
Israel Total All Commodities 21.1 38.1 24.9 39.4 56.1 39.6 30.2 1) Electric Machinery Etc.; Sound, TV Equip and Parts 2.9 2.4 4.4 5.3 8.8 5.1 8.2 2) Natural Pearls, Prec Stones, Prec Met, Etc; Coin 2.7 7.1 7.3 17.1 19.5 14.9 7.1
Chile Total All Commodities 10.5 9.4 12.9 14.5 20.1 14.1 15.1 1) Industrial Machinery, Including Computers 3.9 2.6 5.0 4.6 3.6 2.6 6.4 2) Optic, Photo, Etc.; Medical Instruments, Etc. 1.0 0.8 1.4 1.3 4.1 2.8 2.3
Jordan Total All Commodities 1.1 0.6 1.3 1.7 1.2 0.7 1.8 1) Oil Seeds, Etc.; Misc Grain, Seed, Fruit, Plant, Etc. 0.1 0.1 0.0 0.1 0.0 0.1 0.4 2) Special Classification Provisions, NESOI 0.0 0.1 0.0 0.0 0.0 0.0 0.4
Bahrain Total All Commodities 0.4 0.8 0.3 0.8 1.1 0.7 1.4 1) Optic, Photo, Etc.; Medical Instruments, Etc. 0.1 0.3 0.0 0.1 0.1 0.0 0.6 2) Electric Machinery, Etc.; Sound, TV Equip and Parts 0.1 0.1 0.1 0.1 0.6 0.2 0.3
Morocco Total All Commodities 0.6 0.4 0.9 0.8 0.4 0.2 0.3 1) Optic, Photo, Etc.; Medical Instruments, Etc. 0.1 0.1 0.6 0.2 0.3 0.1 0.1 2) Oil Seeds, Etc.; Misc Grain, Seed, Fruit, Plant, Etc. 0.2 0.2 0.1 0.1 0.0 0.0 0.1
Note: 1 and 2 represent top product categories for each FTA market.Source: Foreign Trade Division of the U.S. Census Bureau and WISER.
EXPORT TRENDS WITH FREE TRADE PARTNERS
(In Millions of Dollars)2002-2007 YTD
EXPORT TRENDS WITH FREE TRADE PARTNERS2002–2007 YTD
(In Millions of Dollars)
92
2008 Colorado Business Economic Outlook

continued on page 94
place behind Canada in Colorado exports throughthe same period, with $641 million. This is downsomewhat from 2006—a record year in whichexports to Mexico topped $1 billion for the firsttime. The next largest Latin American market,Brazil, has seen positive export growth in the firstthree quarters of 2007, with more than $63 millionrecorded through August.
Although the region as a whole is affected by thedownturn in the U.S. economy, Latin America has
continued to expand, with an average of 16% GDPgrowth per capita in the past four years. Chinacontinues to invest heavily in Latin America, bothin natural resources and other sectors. Bilateraltrade between Latin America and China reachedmore than $70 billion in 2006.Much foreign directinvestment in Mexico has gone to the services sec-tor instead of manufacturing, and emphasis hasbeen placed on the need for reform at PEMEX, thestate-run oil company. This could affect the future
economic stability of the country, due to the impor-tance of PEMEX to the overall Mexican economy.
With real GDP growth for 2007 forecasted todecline, U.S. exports to the Americas are expectedto remain stagnant or decrease slightly owing tothe reduced forecasted growth.
Asia-PacificTotal Colorado merchandise exports to Asia-Pacific/Oceania through August 2007 were $1.74billion, a decrease of 17% over the same period in2006. The leading markets for Colorado in thisregion, in order of value of shipments, are China,Taiwan, Japan, the Philippines, Hong Kong,Malay-sia, the Republic of Korea, Australia, Singapore,India, Thailand, Indonesia, New Zealand, andVietnam. Only the Philippines, India, and Vietnamregistered 2007 YTD export gains over 2006—95%,26%, and 117%, respectively. Export markets hard-est hit in the eight months of 2007 versus the com-parable timeframe in 2006 include Taiwan (-42%),Singapore (-31%),Malaysia (-27%), Korea (-19%),and Japan (-10%). In addition, exports to China,Taiwan, and Japan accounted for almost half ofColorado’s merchandise shipments to the regionduring this same period.
Exports to the Asia-Pacific/Oceania region in 2006represented 26% of Colorado’s worldwide mer-chandise exports. The strongest U.S. products soldto this region in 2006 were electric machinery,including sound and TV equipment; nuclear reac-tors, boilers, etc.; aircraft, spacecraft, and parts; andoptic, photo, medical, or surgical instruments.
Country 2003 2004 2005 2006Percentage of
TotalCanada $1,431.7 $1,660.4 $1,807.5 $1,849.3 23.2%Mexico 570.4 689.4 849.0 1,020.1 12.8China (Taiwan) 237.0 255.1 205.7 706.7 8.9China (Mainland) 213.2 356.2 355.7 583.7 7.3Japan 443.1 411.3 384.3 399.5 5.0Germany 282.0 272.1 277.9 370.7 4.7Malaysia 302.0 309.5 246.1 242.0 3.0Korea, Republic of 424.6 341.9 273.8 240.0 3.0United Kingdom 237.3 253.5 240.5 221.0 2.8France 267.1 250.1 224.9 219.0 2.8Australia 112.7 140.8 222.8 218.0 2.7Hong Kong 202.4 228.0 204.5 217.0 2.7Netherlands 245.6 236.7 243.5 181.0 2.3Singapore 236.7 187.2 156.1 178.0 2.2Switzerland 80.9 75.8 78.9 147.3 1.9All Other Countries 882.4 982.7 1,012.5 1,162.7 14.6Total All Countries $6,109.1 $6,651.0 $6,783.6 $7,955.9 100.0%
M
Source: Foreign Trade Division of the U.S. Census Bureau and WISER.
MAJOR DESTINATIONS FOR COLORADO EXPORTS OFMANUFACTURED GOODS, MINERALS, AND AGRICULTURAL PRODUCTS
(In Millions of Dollars)
93
2008 Colorado Business Economic Outlook

Economic growth projections in Asia remain favor-able. Baseline forecasts showmarginal slowing, to8.2%.Asian Development Outlook projects 10.8%growth for China; 8.5% for India and most of theother Asian economies; 6.5% for Indonesia; and2% for Japan. Asia’s private and public sectors, withChina and India being the most aggressive, areexpanding their global influence in traditional andnontraditional markets outside of Asia. They areundertaking massive programs in subsidies, foreign
aid, infrastructure, technology transfer, concession-ary loans, and cultural promotions to numerousAfrican and South American countries in exchangefor access to oil, minerals, other raw materials, andmarkets for low-cost goods.
EuropeColorado exports to Europe totaled $1.1 billionthrough August 2007, up 6% over 2006. Europe’soverall percentage as a regional market for
Colorado exports increased to 22% in Augustcompared to 19% in 2006. The leading markets forColorado products in Europe in 2007 were (in rankorder) Germany, the Netherlands, the UnitedKingdom, and France. A factor that has helpedincrease Colorado exports to Europe has been thefurther depreciation of the U.S. dollar against theeuro, which has also slowed European exports.
2008 Colorado Business Economic Outlook
94
International Tradecontinued from page 93
2001 2002 2003 2004 2005 2006 2007a 2008b
Asia Pacific 1.6% 2.3% 3.0% 4.5% 5.1% 5.5% 5.6% 5.3%Australia 2.7 3.6 3.3 3.5 2.7 2.7 4.2 3.7China 7.3 9.1 10.0 10.1 9.9 11.1 11.4 10.7Japan 0.4 0.1 1.8 2.3 2.6 2.2 2.0 1.9South Korea 3.8 7.0 3.1 4.7 4.0 5.0 4.8 5.1Taiwan -2.2 4.2 3.4 6.1 4.1 4.7 4.6 4.6
Eastern Europe 1.7 4.6 5.7 7.2 6.0 6.8 6.7 6.1Russia 5.1 4.7 7.3 7.2 6.4 6.7 7.4 6.8
Western Europe 1.5 1.1 0.9 2.3 1.6 2.9 2.7 2.2France 2.1 1.1 1.1 2.0 1.2 2.2 1.8 1.9Germany 0.8 0.1 -0.2 1.6 1.0 2.9 2.6 2.2Italy 1.7 0.3 0.1 0.9 0.1 1.9 1.8 1.4United Kingdom 2.3 2.1 2.7 3.3 1.9 2.8 2.9 2.0
North America 0.4 2.5 2.9 4.1 3.2 2.9 2.0 2.4Canada 1.8 2.9 1.8 3.3 2.9 2.8 2.5 2.4Mexico -0.1 0.8 1.4 4.2 3.0 4.8 2.9 3.4United States 0.8 1.6 2.5 3.9 3.0 2.9 2.1 2.4
aEstimated.bForecast.
Source: Consensus Forecasts and Colorado Business Economic Outlook Committee.
INTERNATIONAL REAL GDP PERCENTAGE INCREASE2001–2008

2008 Colorado Business Economic Outlook
95
continued on page 96
An economic deceleration is underway inWesternEurope, partially due to the prospect of furthercurrency appreciation, rising administered interestrates, and an overall shift to a more restrictive fiscalstance across Europe. Projected GDP forWesternEurope in 2008 will be 2.2%. Some of Colorado’sstrongest European export markets will experiencemore robust growth, such as the United Kingdom,which is projected to have output growth of 2%,and Germany, with 2.2%.
Five percent of Colorado’s exports to Europe goto Eastern Europe. Shipments to this region in-creased by 28% from 2005 to 2006, and are up anadditional 92% through August 2007. The leadingmarkets for Colorado are Russia, Poland, andHungary, and top products include machine tools,parts for machinery, and automatic data processingmachines. Real GDP growth in Eastern Europe isexpected to climb 6.1%, higher than that expectedinWestern Europe.
Middle East and AfricaCombined sales to the Middle East and Africamade up just over 2% of Colorado’s exports. Forthe first eight months of 2007, exports to theMiddle East fell 3%. Colorado’s largest market inthe region, Israel, reached $30 million in sales,down 23% over the same period last year. Colo-rado companies sold $25 million in products toAfrica through August 2007, an increase of 5%.
AGRICULTURAL EXPORTS FROM THE STATE OF COLORADOFISCAL YEARS 2004–2008(In Millions of Dollars)
Commodity 2004 2005 2006 2007a 2008b
Live Animals and Meat, exc. Poultry $236.4 $317.9 $431.0 $551.7 $676.7Hides and Skins 157.3 141.1 159.7 177.3 177.3Wheat, Flour and Products 200.6 122.5 148.6 200.7 208.1Feedgrains and Products 106.1 92.4 115.8 127.4 130.9Vegetables and Preparations 73.3 78.8 80.9 86.5 89.5Feeds and Fodders 54.6 59.9 73.3 80.6 82.8Fats, Oils, and Greases 36.5 27.2 28.1 30.9 30.9Dairy Products 6.8 6.1 15.5 20.2 20.2Seeds 13.4 15.4 14.6 14.9 14.9Sunflower Seed and Oil 12.2 9.4 9.7 11.9 10.9Poultry and Products 3.5 4.4 4.3 5.2 5.1Fruits and Preparations 1.9 2.3 2.5 2.6 2.6Other 62.7 66.9 75.2 86.5 86.5Totalc $965.2 $944.3 $1,159.2 $1,396.4 $1,536.4aEstimated.bForecast.cTotals may not add due to rounding.
Source: U.S. Department of Agriculture Economic Research Service (ERS), ERS Forecast, and Colorado Business Economic
Outlook Committee.

International Tradecontinued from page 95
Colorado’s largest African market was the Republicof South Africa, at $9.4 million.
The continuing boom in world commodity mar-kets remains a key support for growth in theMiddle East and Africa. GDP growth in theseregions is expected to remain above 5% in 2008.However, as the economic impact of ongoinggeopolitical uncertainties and regional conflictscannot be excluded, risks in these regions continueto be high.
Prospects for Colorado AgriculturalExportsColorado’s agricultural exports grew 23% in 2006,to $1.16 billion, with the export markets for meatproducts leading the growth. Agricultural exportsnow represent 14% of Colorado’s total exports, upfrom 13.3% in 2005. Colorado’s 2007 forecast isfor agricultural exports to climb 20% over 2006,with the strong demand for Colorado beef and therising harvest and market prices for wheat repre-senting 73% of increased agricultural exports.Colorado’s 2008 agricultural sector should con-tinue to grow in 2008 by 10% from 2007 levels,building on beef exports.
Colorado’s leading export sector (beef, livestock,and meat products) continues to rebound frommarket losses in 2004 when markets closed to beefshipped from the United States.While Colorado’sagricultural exports have rebounded to pre-2003levels, meat exports to Japan and South Korea havenot returned, and represent lost sales of $170 mil-lion each year the markets remain closed.
The U.S.Meat Export Federation (USMEF)reports that while global trends are up, Coloradoand U.S. beef exporters continue to face barriers inkey markets.
“Beef (including variety meat) exports to ‘open’markets have increased 33% in value and 17%in volume compared to 2003. This growthincludes exports to all markets except Japan,South Korea, China/Hong Kong and Russia.Although countries representing 75% of the2003 volumes are considered ‘open’ in varyingdegrees, only 51% of the 2003 monthly volumesare currently being exported. The lower exportvolumes are the result of trade restrictions(under 21 months of age in Japan, under 30months of age in most other markets, bonelessbeef, and no variety meat) imposed by many ofthese ‘open’markets.
U.S. beef exports are projected to continue toincrease, especially with anticipated marketaccess to China and Russia, as well as increasedaccess to Japan and South Korea. Globaldemand for beef will continue to grow, fueled byincreasing incomes, but limited by higher costsof production and continued restrictions due toanimal diseases.”
Colorado’s wheat exports will grow in 2007 and2008, building on record state harvest levels (thehighest in 10 years), as well as high export com-modity prices.
Produce exports are growing in Colorado as themarket in Mexico opens to U.S. produce. In 2006,Colorado shipped more than 1,100 loads of
potatoes and 237 loads of onions to Mexico. Colo-rado’s growing season blends well with Mexico. Astudy in 2006 revealed that over 64% of the fruitsand vegetables imported fromMexico are shippedduring the December to May winter months, pro-viding products that are not available in the UnitedStates and not competing with any Colorado agri-cultural production.
With the ending of import quotas effective Jan-uary 1, 2008, Colorado’s access to the Mexicanpinto bean market should improve in 2007 andbeyond. This will fulfill obligations within theNAFTA accord that requires the elimination ofimport barriers on pinto beans no later than 2008.
Region 2004 2005 2006Mexico $243.5 $275.0 $356.9Canada 142.8 168.3 235.3Japan 86.3 90.9 109.5Hong Kong and China 87.2 63.0 76.0Taiwan 52.0 49.1 67.2EU 25 44.1 39.0 41.0Korea 46.6 34.8 39.6Other 263.2 224.8 229.5Totala $965.2 $944.3 $1,155.0aTotal may not equal sum due to rounding.
Source: WISER, U.S. Bureau of Census.
Exports
C
(In Millions of Dollars)
COLORADO’S TOP AGRICULTURAL EXPORTSREGIONAL DESTINATIONS(In Millions of Dollars)
96
2008 Colorado Business Economic Outlook

continued on page 98
Top Markets for Agriculture ExportsMexico continues as the top destination for agricul-tural products, growing 30% in 2006 to more than$356 million. Canada remains Colorado’s secondlargest market, at $235 million, followed by Japan.
Mexico and Canada accounted for more than 51%of Colorado’s 2006 agricultural exports, while thesetwomarkets represented 32% of agricultural exportsfor the United States. The growing market for beefin both countries dominates increases in exports.
Colorado’s export volumes to Asia remain below2003 levels because of delays in the reopening ofthe markets after the bovine spongiform encepha-lopathy scare. Japan fell from 16% of Coloradoagricultural exports in 2003 to 9% in 2006, whileKorea dropped from 11% 2003 to 3.4% in 2006.The Asian market in general and the Chinesemarket in particular have grown much faster thanColorado’s agricultural exports to these markets.China has become the major importer of U.S. cot-ton and soybeans, which represents 70% of theirtotal agricultural product imports. China hasstrong growth potential for Colorado and U.S.beef.While China declared its market open to U.S.beef in 2006, no agreement has been reached ontrade resumption conditions. Therefore, no beefhas been exported to China.
The first U.S. beef shipments to South Korea illus-trate the challenges to reopening beef markets inAsia. Strict enforcement of boneless import require-ments has caused problems for U.S. companiesexporting beef to Korea. The continuing trade bar-riers for beef are a point of contention as the U.S.
Senate considers ratification of the Korean-U.S.(KORUS) Free Trade Agreement.
International StudentsDuring the 2005–06 academic year, the numberof international students enrolled in U.S. highereducation institutions remained fairly steady, at564,766, down about 1% from the previous year’stotal. Colorado had 5,183 international studentsduring this period, a decline of 5.7%, according tothe Institute of International Education’s annualreport on international academic mobility.International students’ expenditures in Coloradototaled an estimated $122.8 million for 2005–06.
The leading countries of origin for internationalstudents in Colorado for 2005–06 were India, with478 students (9.2%); Korea, with 477 students(9.2%); China, with 394 students (7.6%); Taiwan,with 354 students (6.8%); and Japan, with 323 stu-dents (6.2%).
International students brought more than $13.49billion to the U.S. economy last year in moneyspent on tuition, living expenses, and related costs,according to NAFSA: Association of InternationalEducators. U.S. Department of Commerce datacontinue to rank U.S. higher education among thefive largest service sector exports.
Difficulties attracting international students to U.S.colleges and universities can be attributed to sev-eral factors, including real and perceived difficultiesin obtaining student visas (especially in scientificand technical fields), rising U.S. tuition costs, vig-orous recruitment activities by other English-
speaking nations, and perceptions abroad that it ismore difficult for international students to come tothe United States. In addition, universities in stu-dents’ home countries have been increasing theircapacity to provide a high-quality education to agreater number of students, at both the undergrad-uate and graduate levels.
Preliminary figures for 2007–08 for internationalstudents enrolled in Colorado higher educationinstitutions show that the University of Coloradoat Boulder was again the only university to breakthe 1,000-student mark, with 1,135 internationalstudents out of a total of 28,624 (up 167 studentsfrom the previous year). The Boulder campus isfollowed by Colorado State University, with 839international students (down 145 students); theUniversity of Denver, with 742 international stu-dents (down 140); University of Colorado Denver,with 513 international students (down 137); andthe Colorado School of Mines, with 425 interna-tional students (up 136). Aims Community Collegeis an example of a community college with a com-mitment to international students, with 63 inter-national students (up 46). These figures were com-piled from the international admissions office ofeach institution.
International Visitors to ColoradoAn established methodology does not exist toaccurately measure foreign visitors to Colorado;however, some assumptions can be made by look-ing at overall U.S. trends. The U.S. Department ofCommerce projects record arrivals and receipts
97
2008 Colorado Business Economic Outlook

from international travelers to the United States in2007. The forecast exceeds the previous recordarrival year of 2000, when more than 51.2 millioninternational travelers visited the United States. In2007, the United States is projected to host almost54 million international visitors, a 5% increase over2006. In 2006, the United States hosted 51 millioninternational visitors, a 4% gain over the prior year.
The arrivals forecast for 2007–11 predicts that by2011, international arrivals will reach 61 million,an increase of 20% between 2006 and 2011.
Forecast Highlights by RegionNorth America—Canada andMexico are the toptwo markets generating visitors to the UnitedStates. They are forecasted to grow by 4% and 3%,respectively, in 2007, and by 19% and 15%, respec-tively, from 2006 to 2011. In addition,Mexico seta record for arrivals and spending in 2001–2005.
Europe—Visitors from Europe are expected togenerate 8%more visitors in 2007 and 25%morefrom 2006 to 2011, to reach 12.6 million visitors.The United Kingdom is projected to post a 5%growth rate in 2007, securing its position as the topoverseas market. Germany, France, and Italy are thenext largest arrival markets within the region.France is forecasted to lead the growth amongthese three markets in 2007.
Asia Pacific—Asia is projected to generate annualvisitation growth averaging 3% to 6% each yearfrom 2006 to 2011. The largest Asian market andsecond-largest overseas market, Japan, is forecastedto increase by 17%, reaching nearly 4.2 million vis-itors by 2011. Stronger growth is predicted to comefrom the Republic of Korea (+27%), Australia(+26%), India (+66%), the Peoples Republic ofChina (+81%), and Taiwan (+23%).
South America—The number of visitors fromSouth America is projected to expand by 33% from2006 to 2011, the highest regional growth rate. Thelargest single source market from the region, Brazil,is expected to be up 39% by 2011 compared with2006 levels. Double-digit growth is also projectedfor Venezuela (41%) and Argentina (38%) over theforecast period.�
2008 Colorado Business Economic Outlook
98
International Tradecontinued from page 97
1996 1997 1998 1999 2000 2001 2002 2003 2004 2005
Visitation to U.S. (000s) 22,658.0 24,194.0 23,698.0 24,466.0 25,975.0 21,866.0 19,117.0 18,026.0 20,322.0 21,679.0Visitation to CO (000s) 566.0 532.0 261.0 269.0 286.0 240.0 249.0 180.0 224.0 303.0Inbound to U.S. na 6.8% -2.1% 3.2% 6.2% -15.8% -12.6% -5.7% 12.7% 6.7%Inbound to CO na -6.0% -50.9% 3.1% 6.3% -16.1% 3.8% -27.7% 24.4% 35.3%Source: United States Department of Commerce, Office of Travel and Tourism Industries.
C COMPARISON OF OVERSEAS VISITORS TO THE UNITED STATES AND TO COLORADO1996–2005
(excludes Canada and Mexico)

2008 Colorado Business Economic Outlook
99
Summary
The consensus of the 2008 Business EconomicOutlook estimating committees is that
Colorado will experience moderate growth, in therange of 43,000–56,000 new jobs, for the fourthconsecutive year. The state economy, along withother western states, will be at the forefront ofemployment, population, and productivity growth.The outlook is for Colorado’s employment to growat a rate of 1.9% in 2008, adding 43,300 jobs, com-pared to 1.1% for the United States. This projectedgrowth is above the 10-year average of 37,800 jobsper year. State population will increase by morethan 100,000 as it approaches 5 million people.
During the 10-year period 1997–2006, total stateemployment climbed by nearly 300,000 jobs.About 54% of these jobs were in the Professionaland Business Services, Educational and HealthServices, and Government Supersectors, and two-thirds of the projected growth for 2008 will be inthe same three areas.Manufacturing is the onlysector to show a loss during this period. Nearly38,000 high-paying manufacturing jobs were lostor reclassified to other NAICS categories.
As the structure of the economy has evolved overthe past decade, apprehension has been expressedabout the types of jobs that are being added. Thisconcern has centered on the jobs that are replacingprimary jobs, notably in the Manufacturing andInformation Supersectors. A simple analysis ofprojected wages based on this forecast suggests thatthis consternation may be justified. In other words,it appears that total wages for higher paying sectorswill be countered by more rapid growth in totalwages for lower paying jobs.
Total Percentage ofJobs Added Total Jobs Added
Industry 2007a 2008b1997-2006 1997-2006
Natural Resources and Mining 4,000 5,000 7,600 2.5%
Construction -2,200 -1,000 47,200 15.8
Manufacturing -4,400 -4,000 -37,800 -12.6
Durable Goods -1,500 -900 -27,300 -9.1
Nondurable Goods -2,900 -3,100 -10,500 -3.5
Trade, Transportation, and Utilities 11,100 5,400 38,200 12.8
Wholesale Trade 2,600 1,000 6,700 2.2
Retail Trade 6,300 3,000 24,900 8.3
Transportation and Utilities 2,200 1,400 6,600 2.2
Information 100 900 1,900 0.6
Financial Activities 1,200 400 25,500 8.5
Professional and Business Services 19,000 15,500 58,500 19.6
Educational and Health Services 9,100 8,000 52,700 17.6
Leisure and Hospitality 8,500 6,000 38,400 12.8
Other Services 2,000 2,000 15,200 5.1 Government 6,700 5,100 51,700 17.3
Totalc 55,100 43,300 299,100 100.0%
aEstimated.bForecast.cDue to rounding, the sum of the individual items may not equal the total.
Note: 2005 employment change includes the effect of 2,500 jobs being reclassified from Computer and Electronics
Manufacturing to Scientific Research and Development Services (a subsector of Professional and Business Services).
Source: Colorado Business Economic Outlook Committee.
Jobs Added
NEW JOBS CREATED IN NONAGRICULTURAL WAGE AND SALARY EMPLOYMENT SECTORS
continued on page 100

In 2008, the rapid rate of growth in the NaturalResources andMining Supersector will add 5,000positions, while 1,000 Construction jobs and 4,000Manufacturing jobs will be cut. As a result, therewill be no jobs added in the goods-producingsectors.
In 2007, the service-producing sectors added57,700 jobs, followed by another 43,300 in 2008.Only the Financial Activities and InformationSupersectors will show weak job growth in 2008.
The consistent job growth that has occurred since2004 has caused Colorado’s population to increaseat a more rapid pace. This growth is brought aboutby a higher level of net migration. The state’s popu-lation is expected to climb 2.1% compared to 0.9%for the United States. Colorado’s population willincrease by 103,500 persons and will exceed 5 mil-lion. Net migration will account for about 60% ofthe growth, or about 62,500 people.
Looking ahead, committee members believe thefollowing events will shape future growth andprosperity of the national and state economy:
International and National• Overall, the global economy will record solidbut slower GDP growth. On the upside, NorthAmerica is the only major area expected torecord higher GDP growth in 2008. Despitelower expectations, solid growth will occur inChina, Australia, Taiwan, South Korea, and someEastern European countries. The greatest areaof concern is weak growth in keyWesternEuropean countries and Japan.
• Global financial markets have experiencedvolatility as a result of the upheaval in the creditmarkets.
• At home, one of the primary worries is a deeperthan expected housing slump accompanied by acredit crunch. Concerns about inflation con-tinue to exist, due, in part, to rising oil pricesand the falling value of the dollar. The fear isthat foreign investors will be less interested inholding dollar-denominated stocks and bondsbecause their value has decreased against othercurrencies. The sinking dollar will put limitedinflationary pressure on imported goods.
• The Federal Reserve will remain focused onmaintaining a balance between the threat of weakgrowth and higher inflation.Many Fed watchersbelieve that the Federal Reserve will spend mostof 2008 observing from the sidelines, although agreat diversity of opinion exists.
• Time will tell whether the November 2008 elec-tions will result in political gridlock for most ofthat year as members of both parties remaincautious about playing their hand until after theelection. At the same time, the current adminis-tration is determined to do whatever is possibleto improve the economy as a means of persuad-ing the electorate.
• Real GDP growth in the United States willimprove in 2008, but remain well below poten-tial. Personal consumption, business investment,and government spending will show solidgrowth.
• The twin deficits (trade balance and budgetdeficit) will remain risks.
• Finally, the consumer must remain engaged inthe economy in a sensible manner. In manyparts of the country, individuals’ wealth effecthas been affected by falling housing prices andvolatile financial markets.
Colorado• Colorado’s economy will outperform thenation’s; however, because Colorado is closelylinked to the national economy, the state willcontinue to feel the ill effects of the housingslump and the subprime credit woes.
• Growth in renewable and traditional energy willplay an ever-changing role in the developmentof the state economy. Consequently, severancetax collection and distribution will become ahotter topic of discussion.
• In January 2007, Denver was selected as the siteof the Democratic National Convention (DNC)to be held in August 2008. Approximately 35,000delegates, political enthusiasts, politicians, andmedia will visit the city. It is estimated thatDenver will reap more than $150 million in eco-nomic benefits from the event and draw atten-tion to the area.
• Colorado stands to benefit from the positiveexposure gained from the DNC and other majorconventions, as well as the successful seasons ofits professional sports teams, particularly theRockies, Avalanche, and Nuggets.
Summarycontinued from page 99
100
2008 Colorado Business Economic Outlook

• The Governor’s Office of State Planning andBudgeting projects gross general fund increasesof 3% in FY 2008 and an increase of 4% in thefollowing fiscal year. Because TABOR restric-tions are on hold, the legislature can continue toprovide more and better services as a result ofincreased state tax revenues. Results of a surveyconducted in late 2007 indicated that if a votewere held, it would be unlikely that a continua-tion of Referendum C would pass, which meansthat the state legislature must be judicious withfiscal decisions. Discussions have also been held
on the subject of asking voters to approve astatewide tax increase in 2008 for education,transportation, and healthcare.
• In a poll conducted as part of the BusinessLeaders Confidence Index,® the top three issuesfacing the state according to Colorado businessand government leaders are the same as the2006 responses, although the order is different.In 2007, the top issues facing the state are fund-ing and maintaining quality education, immi-gration, and water availability/drought. New to
the 2007 list are the real estate slowdown andforeclosures, and healthcare and insurance costs.A final issue is transportation funding and traf-fic congestion. The top issue facing Coloradobusinesses is the availability of qualified work-force and workforce training. Two of the topthree issues are the same as last year: energy/fuelcosts and business costs (materials, labor, andbenefits). Other issues are government control,tax reform, and regulation, along with thedownturn of the real estate market.�
2007 Percentage 2008 Percentage
Sector 2006 2007a 2008b New JobsaChange New Jobsb
Change
Natural Resources and Mining 20.8 24.8 29.8 4.0 19.2% 5.0 20.2%Construction 167.7 165.5 164.5 -2.2 -1.3 -1.0 -0.6 Manufacturing 149.1 144.7 140.7 -4.4 -3.0 -4.0 -2.8 Trade, Transportation, and Utilities 419.5 430.6 436.0 11.1 2.6 5.4 1.3 Information 75.6 75.7 76.6 0.1 0.1 0.9 1.2 Financial Activities 160.7 161.9 162.3 1.2 0.7 0.4 0.2 Professional and Business Services 331.8 350.8 366.3 19.0 5.7 15.5 4.4 Educational and Health Services 230.9 240.0 248.0 9.1 3.9 8.0 3.3 Leisure and Hospitality 265.0 273.5 279.5 8.5 3.2 6.0 2.2 Other Services 90.9 92.9 94.9 2.0 2.2 2.0 2.2 Government 367.3 374.0 379.1 6.7 1.8 5.1 1.4Total 2,279.3 2,334.4 2,377.7 55.1 2.4% 43.3 1.9%aEstimated.bForecast.
( )
Note: Due to rounding, the sum of the individual sectors may not equal the total.
Source: Colorado Department of Labor and Employment and Colorado Business Economic Outlook Committee.
CHANGES IN COLORADO NONAGRICULTURAL WAGE AND SALARY EMPLOYMENT(In Thousands)
101
2008 Colorado Business Economic Outlook

AsBoulder County continues to recover fromthe economic downturn of 2002–03, the area’s
economy is showing strength in many sectors.
Population, Employment, and IncomeBoulder County’s population growth has slowedto a sustainable pace of approximately 1% a year.While more than one-third of the county’s esti-mated 297,000 residents live in the City of Boulder,much of the population growth has occurred inother communities. The largest increases have beenin Longmont and Erie, areas with the greatestamount of residential construction activity.Population growth in the county is expected tocontinue at current levels.
Employment in Boulder County has increased, andjob growth is expected to continue. The number ofjobs in the county rose an estimated 3% in 2007,outpacing employment growth for the nation(1.3%) and Colorado (2.4%). In May, the numberof Boulder County jobs reached the peak employ-ment level previously seen in 2001, and theInformation Sector had a net increase in jobs forthe first time since 2000.
According to 2006 Denver Regional Council ofGovernment estimates, nearly three-fourths of thecounty’s jobs were with employers located inBoulder (54%) or Longmont (20%). Boulder’seconomic vitality program has helped the City ofBoulder retain primary employers and foster jobgrowth. Longmont has continued to attract newcompanies and jobs through its ongoing economicdevelopment activities. Other municipalities in the
county also have economic development programs,and most experienced job growth in 2007.
Unemployment in Boulder County continues to below, falling from 3.8% at mid-year 2006 to 3% atmid-year 2007.
Boulder County has a high concentration of pro-fessional and scientific jobs, supported by the pres-ence of the University of Colorado; major federallyfunded research facilities; and companies in theaerospace, bioscience, information, and manufac-turing clusters. Jobs that pay higher than averagewages, along with a well-educated and highlyskilled labor force, have contributed to the higherthan average income levels for county residents. In2006, per capita income in Boulder County was$48,324, significantly higher than the per capitaincome for Colorado ($39,587) and the UnitedStates ($36,629).
Real Estate, Housing, and ConstructionThe local commercial real estate market hasimproved, with lower vacancy rates and higherlease rates. Although the number and dollar valueof nonresidential building permits in Boulder
County were down frommid-year 2006 to mid-year 2007, there was the cyclical increase from firstto second quarter 2007.
The number of residential building permits issuedin Boulder County shows similar pattern, with adecrease from 2006 to 2007 and an increase fromfirst to second quarter 2007.
Housing prices have continued to rise in thecounty, but at a slower rate than for the state. Officeof Federal Housing Enterprise Oversight (OFHEO)House Price Index data show homes in BoulderCounty appreciated an average of 2.25% frommid-year 2006 relative to the corresponding timeframein 2007. During the same period, the House PriceIndex for Colorado grew approximately 3%. From2002 to 2007, housing prices in Boulder Countyrose 15.5% compared to 20.2% for the state.
The number of foreclosures in late 2007 hit arecord high in Boulder County, reflecting anational trend related to the housing downturnand tighter credit markets. In August 2007, 103foreclosures were filed, nearly two-thirds of whichwere for properties located in Longmont. The totalnumber of foreclosures filed in the county throughAugust was 611, an increase of 17% over last year.Foreclosures nationwide also hit a record high inAugust, soaring 115% over the August 2006 level.
Financial Services and InvestmentBoulder County has 32 FDIC-insured financialinstitutions, with 114 offices and deposits totaling$5.6 billion, representing 6.9% of the state’s FDIC-insured deposits. Frommid-year 2006 to mid-year
2008 Colorado Business Economic Outlook
102
From Around the State: Boulder County
The number of jobs in the county rose anestimated 3% in 2007, outpacing employ-ment growth for the nation (1.3%) andColorado (2.4%).

2008 Colorado Business Economic Outlook
103
continued on page 104
2007, deposits in Boulder County’s banks rose$191.5 million, or 3.5%, compared to an increaseof 6.4% for the state.
According to the MoneyTree™ Report, Coloradocompanies received $549.7 million of venture capi-tal investment between midyear 2006 and 2007. Ofthat amount, $241.8 million, or 44%, was investedin companies located in Boulder County. Thecounty’s high concentration of software develop-ment and biotechnology firms has helped fuel highlevels of venture capital investment.
Retail SalesRetail sales in Boulder County have significantlyincreased in the past year and are expected to con-tinue their upward trend. Between midyear 2006and midyear 2007, retail sales in the countyincreased 14%, from $1.75 billion to $2 billion.Much of the increase is a result of new retail devel-opment and redevelopment around the county.
Key IndustriesAerospace—Continued growth in the aerospaceindustry is expected in response to new space ex-ploration projects and programs to commercializeaerospace technology. Colorado ranks secondnationwide in aerospace employment, with 26,650workers in the private sector. From 2006 to 2007, thenumber of aerospace workers in the state remainedflat, reflecting productivity gains and changes in theindustry. In addition to major aerospace-relatedprograms at the University of Colorado, BoulderCounty is home to a significant number of thestate’s aerospace firms and employees. Of the
approximately 300 aerospace or related companiesin the state, roughly one-third are located inBoulder County.
Bioscience—Boulder County is likely to play akey role in the continued growth expected in thebioscience industry. According to the ColoradoBioScience Association, bioscience companies totalnearly 380 in the state, with approximately 16,000employees. Roughly 80% of these jobs are locatedalong the Front Range. From 2005 to 2006, bio-science employment climbed by approximately 3%in the Metro Denver area.
According to a 2006 report compiled for theBiotechnology Industry Organization, among allmedium-sized metropolitan areas in the nation,Boulder County has the highest concentration ofcompanies in the medical devices and equipmentsector. It also has high concentrations in theresearch, testing, and medical laboratories, anddrug and pharmaceutical sectors.
Information Technology—Since 2001, em-ployment in the computer hardware sector hasdecreased at the national and local level. Between2001 and 2006, the number of companies fell anaverage of 0.4% annually in the metro Denver areaand 1.2% nationally. According to the most recentstate labor department data available, BoulderCounty is home to 27% of the state’s employersand 33% of Colorado’s jobs in computer and elec-tronic product manufacturing. The number ofemployers in the sector increased 3% between firstquarter 2006 and first quarter 2007, while thenumber of employees dropped 15%.
In 2006, an estimated 3,430 companies employed44,100 workers in the software industry in theMetro Denver area. Between 2005 and 2006, metroarea employment in the industry grew by 9.5%.Approximately 80% of the state’s software industryemployment is in the Metro Denver area, and anestimated 30% of these jobs are in Boulder County.
Natural and Organic Products—Boulder Countyis at the center of the estimated $56 billion naturaland organic products industry, which includescompanies that produce natural or organic prod-ucts, or provide marketing or other support. Theindustry has experienced significant growth that isexpected to continue. Nationwide, sales of naturaland organic foods climbed 13.9% between 2005and 2006, compared to growth of 2.4% in sales ofall foods. Industry experts estimate retail sales oforganic foods and beverages will double in the nextfive years from the 2006 level of $17 billion.
Outdoor—According to the Outdoor IndustryFoundation, the outdoor industry generated $289billion in retail sales and services nationwide. Salesof outdoor equipment in the United States reached$6.9 billion in 2006, an increase of 9% from 2005.Boulder is widely recognized as a center for theexpanding industry and is home to more than 100companies in the outdoor recreation area, includ-ing manufacturers; distributors; retailers; market-ing and media companies; medical, event, andother service providers; and national nonprofitorganizations.
Renewable Energy—Boulder County is expectedto experience continued growth in the renewable

energy and energy research sectors. In 2006,approximately 5,600 individuals were directlyemployed in renewable energy in the Metro Denverarea; an estimated 24% of those jobs were locatedin Boulder County. Companies that provide energyusing solar, wind, biomass, fuel cells, and hydroresources are included in the renewable energysector. Renewable energy employment in the metroarea increased 1.3% from 2005 to 2006.
The Metro Denver area also has a high concentra-tion of employment in the energy research sector,which includes laboratory testing; scientific and
technical consulting services; and environmental,energy, natural resource, and institutional research.Direct employment in the energy research sector in2006 was 6,300 in Metro Denver, with approxi-mately 17% of the jobs in Boulder County. From2005 to 2006, energy research employment rose8.6% in the metro area.
Tourism—Tourism is the second-largest industryin the state and a significant contributor to theBoulder County economy. According to theBoulder Convention andVisitors Bureau, tourismin the county has grown at a steady pace from 2002
to 2007, and the trend is expected to continue.From 2006 to 2007, hotel occupancy in the city ofBoulder increased 4%, average hotel room ratesclimbed 7.5%, and accommodations tax collectionsrose 13%. During the same period, restaurant andfood service tax collections grew 9%, and sales taxrevenues increased in the historically high touristtraffic areas of Downtown Boulder (2%) and PearlStreet (2.9%).
Note: Sources used to compile this report are avail-able from the Business Research Division.�
2008 Colorado Business Economic Outlook
104
Boulder Countycontinued from page 103

2008 Colorado Business Economic Outlook
105
TheOffice of Economic Analysis and BusinessResearch in the School of Business Adminis-
tration at Fort Lewis College measures and reportson economic activity in La Plata County. The LaPlata County economy is highly seasonal owing totourism’s impact on the local economy. Althoughsignificant tourism is associated with winter sports,most La Plata County tourism occurs during thesummer. This summer concentration causes anannual third quarter seasonal upswing in economicindicators such as retail sales and employment.
However, La Plata County is the home of FortLewis College, which provides seasonal stability tothe local economy.Most of the college’s studentsattend classes from September through April, whentourist activity is relatively low. The presence of thestudents and their expenditures moderates the sea-sonal decline in the local economy.
Employment and UnemploymentOn average, La Plata County had a lower unem-ployment rate (3.4%) in 2006 than both the UnitedStates (4.6%) and Colorado (4.3%). The county’srate remained below both the national and stateunemployment rates in 2007.
The La Plata County labor force averaged 30,510persons during 2006 (an increase of 6.7% over2005), with average total employment of 29,479(7.2% over 2005). In August 2007, the labor forcetotaled approximately 33,000, about 3.6% higherrelative to the corresponding period the previousyear and similar to the average annual labor forcegrowth rate since 2000. Employment growth in
La Plata averaged 4.5% fromAugust 2006 toAugust 2007, and 3.6% over the 2000–07 period.
Interestingly, employment patterns within La PlataCounty are somewhat different from those foundin the state and national economies. Employmentis less concentrated in manufacturing than Colo-rado and the nation. In 2006, construction (about17% of total income in La Plata County) and retailand tourism (21%) remained the strongest sectorsin the county, though retail and tourism as a per-centage of county income has fallen since 2001.With the loss of ValleyWide Health and others, thehealthcare industry has also declined, though it stillrepresents approximately 15% of total income,similar to the national average. Natural gas hasroughly doubled from 2000 to 2006, to about 6%of county income, particularly due to rising prices.The impact of this sector remains significant givenits contribution to county tax revenues. Other sec-tors, such as transportation and public utilities;wholesale trade; management; and finance, insur-ance, and real estate sales, have decreased in signifi-cance during the same period. Employment in
services, retail trade, and government are moreimportant providers of employment in La PlataCounty than in Colorado or the United States.
Given continued strength in the local economy,particularly the construction sector and the highprice of natural gas, it is anticipated that unem-ployment will remain low in 2008, below 3.5%.Similarly, employment growth should remainstrong, between 2% and 2.5% growth per year inthe foreseeable future, assuming no further nega-tive shocks to the housing market.
IncomePer capita income in La Plata County has increasedduring the last few years, both in absolute termsand relative to national per capita personal income.Per capita personal income in La Plata was $34,029in 2006, the highest in Region 9. This representsapproximately 78% of the Colorado state average,an increase from about 70% in 2001. In otherwords, since 2001, income has been growing at afaster rate in La Plata County than in the state,5.1% compared to 2.7%.
Real EstateLike many Colorado resort communities, La PlataCounty’s economy is closely tied to real estate.Although there are numerous real estate indicators,the number of residential building permits providesinsight into the condition of the market.Whendemand is strong, builders pull more buildingpermits so they can build and sell homes. Unwillingto be stuck with homes they cannot sell in a soft
continued on page 106
From Around the State: La Plata County
Given continued strength in the localeconomy, particularly the constructionsector and the high price of natural gas,it is anticipated that unemployment willremain low in 2008, below 3.5%.

Population growth will continue to fuel the con-struction and real estate sectors of the economy.Comparing Q2 2006 to Q2 2007, population in LaPlata County increased 2.5% (as measured by thenumber of new residential electric metersinstalled). Although it appears that the housingmarket in La Plata County is cooling off fromrecent years, it is still relatively strong, with medianresidential housing prices rising 9.7% from Q22006 to Q2 2007 (adjusted for inflation).
Energy, in particular natural gas, remains a strongcontributor to the local economy. Even with pricevolatility (energy prices fell 0.3% from Q2 2006 toQ2 2007—after adjusting for inflation), rents, roy-alties, and property tax revenues associated withnatural gas production are significant sources ofincome to La Plata County and should remain sofor some time.�
For example, according to the Federal DepositInsurance Corporation (FDIC), La Plata County’sbanking deposits increased by 1.4% from $1.020billion to $1.034 billion, not accounting for infla-tion. The FDIC information indicates a total of 9commercial banks in La Plata County, with 19branch offices.
All of the tourism indicators for the county eitherincreased or remained fairly constant through Q22007. Comparing Q2 2007 to the correspondingperiod the previous year, ridership on the railroad(not including special events) increased 1.2%, visitstoMesaVerde National Park fell 2.7%, enplanementsclimbed 9.4%, and lodger’s tax revenue (adjustedfor inflation) surged 32.6%.AlthoughMesa VerdeNational Park is in Montezuma County, many ofthe tourists who visit the park stay in La PlataCounty. Furthermore, retail sales in La PlataCounty increased by 3.3% (adjusted for inflation).
market, builders reduce the number of permitswhen demand drops.
After a peak in the number of permits in the springof 2002, Durango building activity has been in aslight downward trend, with the largest percentagedrop (season over season) occurring in 2006. Thistrend mirrors the national real estate cycles.
After steadily increasing since 2000, the medianhome price in Durango has remained relativelyflat, in the $350,000 range.With sales volumesdecreasing and inventories remaining high, 2008will be a critical year for local real estate.
Recent and Future TrendsThe most recent economic indicators of La PlataCounty show continued growth. Comparing Q22007 data to Q2 2006, most La Plata County eco-nomic sectors improved or remained fairly steady.
La Plata Countycontinued from page 105
106
2008 Colorado Business Economic Outlook
From Around the State: Mesa County
The Heat Is On
Thewatchful eye of the Fed continues to moni-tor a retracting national economy that has
resulted from the fallout in the subprime market,a declining auto industry, and escalating oil prices.Meanwhile, the Grand Junction area economy isstill as hot as ever. The Grand Junction GDP grew80% over the past decade, and it was recently desig-nated as the 15th fastest-growing economy in thenation. The Grand Junction MSA also ranked nearthe top of the Milken Institute’s best-performingsmall cities list, placing 18th out of 179.
With energy extraction as its primary driver, fol-lowed by energy service industries and construc-tion, the Grand Junction economy is projected toremain very strong. An estimated 43,000 wells areexpected to be drilled in Colorado from 2006 to2010. Concomitant to this are increases in overallgas production and the partnering of energy giantsKinder Morgan Energy Partners, Sempra, andConocoPhillips on the construction of a 1,678-mile transmission pipeline capable of transporting1.8 billion cubic feet of gas per day.When com-pleted, the pipeline will extend from northernColorado to eastern Ohio, with a 713-mile stretchreaching from Colorado into Cheyenne,Wyoming.It is expected to be in full service by mid-2009. Todate, this equates to a $25 million infusion of capi-tal investment into the economy. (Source:www.kindermorgangas.com)
To feed the insatiable global appetite for gas andoil, all indicators point to ongoing upward trendsand continued economic growth. The developmentof the Piceance Basin alone is expected to generatea total of $3.4 billion in revenues and create morethan 6,500 jobs, with labor earnings of $398 mil-lion. (Source: Colorado Energy Research Institute)
The rapid growth in the Grand Junction MSA hasincreased the average hourly wage to $16.10, whichin past years has lagged behind national averages.At the same time, labor force and job growth ratesare the highest in Colorado. In fact, in both 2006and 2007 the number of jobs in the area is antici-pated to increase by approximately 5%. Not sur-prisingly, one of the immediate issues is the lowunemployment rate. After falling to 2.8% in May,it held steady at 3% in August and September of2007. Even though the MSA’s overall workforceclimbed a staggering 42% over the previous 10years, with an increase of 12.3% from January 2006to September 2007, this growth still does not meetthe demand for qualified workers. At the fiscalyear-end in June 2007, the Mesa CountyWorkforceCenter recorded 8,000 open positions, a rise of21% over the previous year. In an effort to findworkers, the center has initiated recruitment effortsto hire workers from other parts of the countrythat are experiencing soft economic conditions.They are also tapping into military returnees andretirees, and are even recruiting in places likePuerto Rico.
This rapid growth has also reduced housing andfacility vacancy rates to all-time lows and driven upthe costs of land and construction. Single-familyhousing, with a median price of $209,783 in thefirst quarter of 2007, has appreciated so quicklythat Grand Junction now has the fourth-fastesthome appreciation rate in the country. Industrialland prices have tripled in just two years. Theaffordability and availability of housing is nowa factor in workforce recruitment.
Communities and economic development organi-zations are working together to devise strategicplans to meet current needs and formulate long-term plans to ensure sustainable, balanced eco-nomic growth in the future. The Grand JunctionMSA is poised for continued growth and changewell into the next decade. Energy companies areworking on 20-25 year plans that take the develop-ment of the industry from the ramp-up period,where the drilling and infrastructure are put intoplace, to the extraction, production, and mainte-nance mode.While this transition will likely be feltas an economic leveling off, the energy industryshould remain a strong economic driver.�
107
2008 Colorado Business Economic Outlook

2008 Colorado Business Economic Outlook
108
From Around the State: Northern Colorado
The northern Colorado economy continuesto grow slowly but steadily. In 2005–06, the
region’s job total increased by 5,730 jobs, or 2.8%.Over the past six years, employment growth inLarimer andWeld counties has averaged 1.4% peryear. Although this is down substantially from the4.2% annual average in the 1990s, it has generallybeen in-line with or outpaced the Colorado andU.S. economies. Plus, unemployment will remainwell below the natural rate.
Growth in services continues to drive the regionaleconomy. According to Quarterly Census ofEmployment andWages data for 2005–06, the topfive growth sectors in the region were: accommo-dation and food services (878 jobs); administrative,support, waste management, and remediation ser-vices (816 jobs); healthcare and social assistance(785 jobs); retail trade (527 jobs); and mining (508jobs). This continues long-term trends as these sec-tors have accounted for about 61% of the net newjobs in the region since 2001. In terms of job losses,only the manufacturing (252 jobs); agriculture,forestry, fishing, and hunting (168 jobs); and trans-portation and warehousing (28 jobs) sectorsshowed declines.
Disaggregating the jobs data, some notable differ-ences emerge between Larimer andWeld counties.Since 2001, Larimer County employment grew bya total of 5,449 workers, a 4.4% increase.Morerecently, Larimer County added 2,329 jobs between2005 and 2006, a rise of 1.8%.AlthoughWeldCounty is smaller in terms of employment, it has
recently added more jobs than Larimer County.Since 2001, the number of total jobs inWeldCounty has grown by 8,822 positions, an 11.6%gain. Between 2005 and 2006, it rose by 3,401 jobs,or 4.3%. By comparison, Colorado’s employmenthas climbed only 1.8% since 2001, and U.S.employment has grown 3.2%.
Perhaps the most troubling aspect of the region’seconomy in the past few years is the relatively poorperformance of wages and per capita incomes.Between 2001 and 2006, inflation-adjusted earn-ings per worker have grown by only 5%, and percapita incomes have fallen 2%. This is due largelyto losses of a number of high-paying jobs in thewake of the crash of the high-tech manufacturingsector, especially inWeld County. Unfortunately,negative real income growth has had importantadverse consequences for a number of families innorthern Colorado, and the region has seenincreases in poverty rates and housing foreclosures.
One outcome of the modest employment growthhas been a slowdown in population increases.While the region’s population continues to swell,both through natural growth and in-migration,recent increases are notably lower than in the1990s.Moreover, the concentration of the growthin southwestWeld County shows the latest changesare as much due to Metro Denver’s steady outwardcreep as it is to the performance of northernColorado’s major economic hubs.
The effects of this growth are felt most directly inthe regional housing market, which has witnessed adramatic decline in new housing starts near the
major cities and is weighed down by a large inven-tory of unsold new homes and general malaiseabout the national housing market.While regionalhousing market troubles have not been as severe asthose at the national level, construction has slowedsignificantly. After averaging around 6,300 newpermits per year from 2000 to 2005, single-familybuilding permits declined markedly in 2006 (4,000new permits). At the time of this writing, final 2007figures are not yet available; however, year-to-datepermits are substantially down from 2006.
Despite the slowdown in building permits, thevalue of these permits continues to increase. From2000 to 2006, the average real cost (in 2006 dollars)per single-family building permit along the north-ern Front Range increased from $160,000 to$208,308.
2008 Regional Economic OutlookConsistent with the overall mixed signals aboutboth national and Colorado economies, employ-ment growth in northern Colorado is expected toslow somewhat during 2008. Employment fore-casts for 2008 indicate sluggish growth of 1.9%, or4,000 new jobs. However, the region is expected toadd a substantial number of jobs in high-payingsupersectors, such as Professional, Scientific, andTechnical Services; Financial Activities; andHealthcare. Additionally, models project an endto the slide in Manufacturing, with the sectorforecasted to show positive employment growthin 2008.

While overall regional growth is expected to slow,emerging clean-energy technologies offer uniqueopportunities to help stem recent manufacturingjob losses. In a recent study conducted by ColoradoState University, several clean-energy sectors wereidentified in which the region currently has a sub-stantial presence.
First, the region boasts international companiesthat are developing core renewable energy tech-nologies, including wind power, solar photovoltaics(PV), and biomass. Additionally, northern
Colorado is home to a variety of businesses focus-ing on the efficient utilization, distribution, andend uses of clean energy—from smart electric gridsto more efficient engine controls to green buildingapplications.
Together, these sectors have a substantial impact onthe regional economy. In 2006, a total of 33 firmsand organizations employed 2,132 workers innorthern Colorado’s clean-energy cluster. This isan increase of 53 jobs (2.5%) from 2001 and 152jobs compared to 2005 (7.4%).
In 2008, the region is slated to add two substantialclean-energy businesses.Vestas Blades America, asubsidiary of Denmark’s VestasWind Systems A/S,will open a new blade manufacturing facility inWindsor, which is expected to employ more than600 workers. As well, AVA Solar, a manufacturer ofsolar photovoltaics and a Colorado State Universityspinoff, is expected to break ground on a projectthat will employ up to 500 workers.�
2008 Colorado Business Economic Outlook
109

In the coming year, Pueblo County may see theonset of several events that could have a far-reaching impact on its future development. His-torically, Pueblo County has experienced low tomoderate population growth. This trend may bechanging as Pueblo becomes more fully integratedinto the regional economy.
One manifestation of the change is the announceddevelopment of the Pueblo Springs Ranch, a 23,000-acre subdivision in northeast Pueblo County,located between Pueblo and Colorado Springs. Atbuild-out, this project is projected to have about75,000 households, translating into nearly 200,000people—more than the present population ofPueblo County. The initial phase of the projectcalls for the building of 5,400 single-family homes.Construction could begin as early as summer 2008.The City of Pueblo has taken the initial stepstoward annexing the property by accepting a deedon a 370-acre ribbon of land that surrounds theproperty. Once annexed, the property would nearlydouble the total area of the city. A major challengeposed by the project will be to ensure that adequatewater rights exist to sustain a potential PuebloCounty population in excess of 300,000. The devel-opers of Pueblo Springs Ranch appear to be count-ing on its proximity to both the Colorado Springs
and Pueblo markets to ensure its success. The Cityof Pueblo Department of Community Develop-ment has also received inquiries from several otherdevelopers that have expressed an interest inannexing areas north of the present city limits.
In terms of more tangible current trends, down-town Pueblo is experiencing a renaissance thatenhances its viability as the cultural, financial, and,to some extent, retail hub of the community. TheHistoric Arkansas Riverwalk Project (HARP) hasbegun to pay the economic dividends its creatorsintended. The Cingular Call Center is now fullyoperational, adding a workforce of nearly 500 todowntown Pueblo. In August 2007, the new44,000-square-foot headquarters of theProfessional Bull Riders Association was dedicated.The facility presently has a staff of 70, with anadditional 100 potential positions becoming avail-able over the next few years. The City of Pueblocontributed more than $5.2 million from its half-cent sales tax for economic development to makethis project a reality. Restaurants and coffee shopsare opening near HARP, and an upscale residentialdevelopment, located adjacent to Lake Elizabeth,has been completed.
Pueblo’s first Best Buy retailer opened for businessin September. This store, located in the Pueblo
Crossings Shopping Center, is a welcome sight tolocal shoppers wanting to buy the basic electronicproducts previously unavailable in Pueblo. Itpresently employs 75 workers. Demand for thesepositions was intense, and the store managerreported receiving more than 1,400 applicationsfor the initial hires.
On a more somber note, Pueblo continues to placevery high in the rate of home foreclosures. A recentreport from the Colorado Division of Housingshows the county ranking fifth highest of ColoradoFront Range counties in foreclosures per occupieddwelling: 1 out of 78 occupied homes. Statewide,the Division of Housing is projecting the numberof foreclosures in 2007 to be more than 30% higherthan the 2006 level.
New residential construction in Pueblo has seena marked slowdown. The 572 single-family startsissued through the first nine months of 2007 com-pares to 980 for the same period last year, about a42% decrease. If the housing slowdown in Pueblois of short duration, the community seems likely toexperience continuing, even expanding, growth ofits economy over the next several years.�
From Around the State: Pueblo County
110
2008 Colorado Business Economic Outlook

Five local and national issues are strongly influ-encing the El Paso County economy:
• Rising foreclosures and stagnating home values
• Low residential building permit activity
• Wage increases that are barely keeping up withinflation
• Deployments from Fort Carson to Iraq
• A restrictive Federal Reserve monetary policyresulting from concerns about inflation
These factors directly affect employment andwages, retail and wholesale activity, residentialhousing, commercial activity, and the economicoutlook of the region.
Employment and UnemploymentOn average, the monthly labor force in El PasoCounty through 2006 was estimated to be 298,840,an increase of 9,043 (3.1%) over the 2005 total of289,797. Preliminary June 2007 figures from theColorado Department of Labor put the El PasoCounty labor force at 301,015, compared to290,905 in June 2006. Total private-sector employ-ment, based on the Quarterly Census of Employ-ment andWages, averaged 202,789 in 2006, a gainof 4,208 jobs over 2005 levels. For the first timesince 2001, private-sector employment exceeded202,000 jobs. This increase followed similar gainsin 2005 of 1.7%, or 4,087 jobs. This was the thirdconsecutive year of positive job growth in the pri-vate sector for El Paso County after three successiveyears of declines.
The largest employment gains were in administra-tive and waste services (1,504 jobs), construction(994 jobs), accommodations (978 jobs), profes-sional and technical services (754 jobs), healthcare(533 jobs), and retail (422 jobs). The employmentgains in construction came from strong activity inthe commercial sector, the Colorado Springs MetroInterstate Expansion (COSMIX), and housing onFort Carson. These are not expected to be sustain-able into 2008.
Job losses in information technology and manu-facturing that began in 2001 continued into 2006.Information technology lost 975 jobs, whilemanufacturing fell by 386.Wholesale trade slidby 338 jobs.
The unemployment rate continued a downwardtrend, albeit at a slower rate. The average unem-ployment rate in El Paso County was 4.6% in 2006,a decrease from 5.4% the year before. Unemploy-ment rates are expected to be 4.4% in 2007 and4.6% in 2008.
When El Paso County is compared to Colorado asa whole, three employment and wage patternsstand out. First, the number of firms in El PasoCounty is growing at a faster rate than in Colorado.
Second, wages are increasing at much slower pacethan the state average, which is expected to lead toslower income gains in El Paso County. Third, thelower wage gains for El Paso County compared toColorado is attributed to the change in the numberof employees per firm and the loss of primary jobs.In 2001, El Paso County averaged 13.9 employeesper firm versus 12.4 employees for the state as awhole. By 2006, the averages had dropped to 11.8for El Paso County and 11.0 for Colorado. In addi-tion, between 2001 and 2006 El Paso County lost adisproportionate number of highly paid jobsamong larger firms, including manufacturing andtechnology employers.
Wages and IncomeThe overall average wage for El Paso Countyincreased in 2006 and stood at $38,584, an increaseof $1,092, or 2.9%, over 2005. This follows a 2.6%increase in 2005 and a 3.3% gain in 2004. By com-parison, the average wage in Colorado was $43,524in 2006 and $41,600 in 2005. El Paso Countyremains well below the state average wage. The2006 data indicate the average wage in El PasoCounty is 11.4% below the average wage inColorado.
Of the 20 two-digit NAICS classifications, 19 hadwage increases in 2006. Agriculture was the onlysector to decline, -6.8%. Significant wage gainswere realized in Management of Companies, 8.5%;Construction, 5.2%,Wholesale Trade, 5.1%;Manufacturing, 4.9%; Information, 4.6%; andEducational Services, 4.5%.
From Around the State: Southern Colorado
The lower wage gains for El Paso Countycompared to Colorado is attributed to thechange in the number of employees perfirm and the loss of primary jobs.
continued on page 112
111
2008 Colorado Business Economic Outlook

The extensive commercial construction inhigh residential growth corridors appearsto be matched with demand.
Industrial vacancies fell to 6.6% in 2006, a signifi-cant drop from 8.3% in 2005. Similar to 2005 leas-ing and absorption rates, almost 2 million squarefeet were absorbed in 2006. Leasing plus absorp-tion for 2007 should be about 1.2 million squarefeet. Rents increased to $7.15 a square foot in 2006,compared to $6.80 the previous year.
Through June 2007, it appears industrial rents havedecreased. Industrial rents are expected to average$7.00 per square foot for 2007, although a slightdecrease is possible if the economy slows furtherand new industrial construction takes place, espe-cially among owner-occupied properties. If theIntel and SCI facilities are left vacant, industrialvacancy rates will be higher.
Aggregate shopping center lease rates rose 2.6% in2006, to $13.30, while vacancy rates declined again,to 6.4%. Large facilities are either completed orunder construction in Monument, Falcon,Fountain, and along Powers Boulevard andWoodmen. The extensive commercial constructionin these high residential growth corridors appearsto be matched with demand. Leasing plus absorp-tion totaled almost 1.6 million square feet in 2006,an increase of 40,000 square feet.
Shopping center commercial activity in 2006showed little sign of letting up. Leasing plusabsorption should be close to 1.4 million squarefeet in 2007. As of fall 2007, rents are running$13.61 per square foot. Commercial activity trendsare expected to continue through 2007 before theydecline slightly in 2008 as the economy slows.
emerged as the entry-level price point for single-family construction.
Permits for a total of 289 multifamily units wereissued in 2006, down 50.4% from the 2005 total.The decline, which was expected, reflects investorreluctance to get into a market that averagedapproximately 11.7% vacancy during 2006.Averagerents were $683 per month.Multifamily permitactivity is expected to increase modestly in 2008.
Central business district (CBD) office vacanciesdecreased to 5.5% in 2006, compared to 7% in2005. Leasing plus absorption totaled 143,492square feet, which is typical of an average year’sactivity. Class A office space vacancies in the CBDslid to 6.7% in 2006, and vacancies were down 8.5points since 2001.Metro office market vacancyrates fell to 6.9% in 2006 from 8.6% the prior year.
Along with the general decrease in vacancy ratesamong all classes of office space, leasing rates rosein 2006. The metro market increased to $10.86 asquare foot from $10.29 in 2005, Triple Net(NNN). The CBD climbed to $11.41 a square foot,compared to $11.37 in 2005. Downtown Class Aoffice space decreased to $14.17 a square foot from$14.34 in 2005.
Retail and WholesaleRetail sales in El Paso County climbed 6% in 2006compared to a stronger 6.6% in 2005. After adjust-ing for inflation and population growth in El PasoCounty, real retail sales fell 0.3% in 2006 versus anincrease of 2% in 2005 and 9.1% in 2004.
Wholesale sales in El Paso County rose 6% in 2006.Wholesale activity growth in 2005 was more brisk,increasing 8.1%. The modest growth in wholesalesales is attributed to the loss of basic manufactur-ing firms since 2000.
Housing Construction andCommercial ActivityNew single-family, detached residential construc-tion declined 35.2% in 2006 relative to 2005. Atotal of 3,446 permits were pulled, compared to5,314 in 2005. An unexpected increase in permitvalue occurred in 2006. The average permit valuewas $178,983—$30,000 higher than in 2005. This,along with other evidence, indicates that althoughfewer homes were built in 2006, those that werebuilt were larger and had more options relative tothose built the previous year.
Townhome construction also declined in 2006.Townhome permits totaled 682 in 2006, a declineof 249 units, or 26.4%. Permit values also fell,despite a 13% increase in construction costreported by RSMeans. The average townhome per-mit value was $114,786 in 2006, compared to$116,922 in 2005 and $123,836 in 2004. Currenttownhome construction, which is dominated bysmaller, less accessorized housing units, has
Southern Coloradocontinued from page 111
112
2008 Colorado Business Economic Outlook

The silver lining to the cloud-covered economy isthat interest rates have been reduced by 50 basispoints as of September 30, 2006, and an additional15 points in October 2007. Corrections to capitalmarkets will follow. Foreclosure problems willimprove as variable rate mortgages benefit slightlyfrom interest rate cuts, and subprime mortgagesbegin to work their way out of the economy. Asthese factors evolve, the demand for new residentialhousing will increase. These events could accelerateif the EDC continues to be successful at attractingand keeping clusters of key basic employers. Onefinal positive to the southern Colorado economy isthe anticipated arrival of 5,200 troops and theirfamilies in 2009, which will have a significant, posi-tive impact. The problem with the expected posi-tive turns is that it will take 12 to 18 months forthem to be realized. As a result, modest economicgrowth, at best, is projected for 2008.�
technology. Of these 1,545 new jobs that wereannounced, 1,515 are expected to be filled byworkers in the community; 30 are anticipated tobe people who will relocate to El Paso County. Theability and success of the EDC is predicated oncontinued growth of the economy.
Growth prospects for the economy are, to a point,in the hands of the Federal Reserve and its mone-tary policy. Locally, foreclosures are expected toapproach an all-time record for El Paso County in2007. The problem is expected to abate somewhatin 2008, if the actions of the Federal Reserve instillconfidence in financial markets.
A somewhat improved financial market and adecline in local foreclosures will not be sufficient torestore strength in the El Paso County new residen-tial construction market. This sector is expected tofall slightly in 2008 and will be 1,100 new unitsbelow its equilibrium level. This will slow downemployment growth by approximately 4,000 jobs.As a result, income growth will also be limited.
Where Is the Southern ColoradoEconomy Headed in 2008?The future of the southern Colorado economyappears to depend on five factors:
• Better job and income growth from basic indus-try employers
• Reduced interest rates
• A reduction in foreclosures and spiraling prob-lems related to them
• A rebound in residential construction
• The arrival of BRAC05 troops at Fort Carson
To move forward, the community must attractwell-paying jobs in basic industries that, ideally,add to the diversification of the economic base, agoal of the Economic Development Corporation(EDC). Through July 2006, the EDC announced1,545 jobs in a mix of sectors, including medicaltechnology, financial services, and information
113
2008 Colorado Business Economic Outlook

114
Beginning with the 2004 forecast, theeconomic sectors analyzed in this
book reflect the new North AmericanIndustry Classification System, adoptedin January 2001. The system was recentlyupdated for the United States and Canada,and revisions are scheduled to go into effectin 2009 in Mexico. These modificationswere made to account for NAFTAmem-bers’ rapidly changing economies. Thesystem will allow the United States todirectly compare its economic data withthat of Canada andMexico. A brief sum-mary of the composition of each super-sector appears below, followed by a dis-cussion of each area’s concentration inthe economy.
Natural Resources and Mining
Crop production; animal production;forestry and logging; fishing, hunting, andtrapping; support activities for agricultureand forestry; oil and gas extraction, min-ing (except oil and gas); and support activ-ities for mining.
Construction
Construction of buildings, heavy and civilengineering construction, and specialtytrade contractors.
Manufacturing
Food manufacturing; beverage andtobacco product manufacturing; textilemills; textile product mills; apparel manu-facturing; leather and allied product
manufacturing; wood product manufac-turing; paper manufacturing; printing andrelated support activities; petroleum andcoal products manufacturing; chemicalmanufacturing; plastics and rubber prod-ucts manufacturing; nonmetallic mineralproduct manufacturing; primary metalmanufacturing; fabricated metal productmanufacturing; machinery manufactur-ing; computer and electronic productmanufacturing; electrical equipment,appliance, and component manufactur-ing; transportation equipment manufac-turing; furniture and related productmanufacturing; and miscellaneousmanufacturing.
Trade, Transportation, andUtilities
Merchant wholesalers, durable goods;merchant wholesalers, nondurable goods;wholesale electronic markets and agentsand brokers; motor vehicle parts and deal-ers; furniture and home furnishing stores;electronics and appliance stores; buildingmaterial and garden equipment and sup-plies dealers; food and beverage stores;health and personal care stores; gasolinestations; clothing and clothing accessoriesstores; sporting goods, hobby, book, andmusic stores; general merchandise stores;miscellaneous store retailers; nonstore
retailers; air transportation; rail transpor-tation; water transportation; truck trans-portation; transit and ground passengertransportation; pipeline transportation;scenic and sightseeing transportation; sup-port activities for transportation; postalservice; couriers and messengers; andwarehousing and storage.
Information
Publishing industries (except Internet);motion picture and sound recordingindustries; broadcasting (except Internet);telecommunications; data processing ser-vices, hosting, and related services; andother information services.
Appendix: North American Industry Classification System Descriptions and Concentrations2008 Colorado Business Economic Outlook
114
Sector Firms Employment Wages Firms Employment WagesAgriculture, Forestry, Fishing, Hunting 0.8% 0.8% 0.5% 0.70 0.76 0.78Mining 0.7 1.1 2.1 2.16 2.00 2.09Construction 12.6 8.9 8.8 1.22 1.32 1.24Manufacturing 3.5 7.9 9.9 0.81 0.63 0.65Wholesale Trade 7.2 5.1 7.2 1.00 0.98 1.01Retail Trade 11.0 13.1 7.8 0.89 0.96 0.95Transportation and Warehousing 2.1 3.3 3.2 0.84 0.88 0.88Utilities 0.2 0.4 0.9 1.20 0.88 1.01Information 2.0 4.0 7.0 1.20 1.48 1.67Finance and Insurance 6.5 5.8 8.6 1.16 1.08 0.87Real Estate and Rental and Leasing 5.9 1.8 2.4 1.37 1.35 1.26Professional and Technical Services 15.2 8.6 14.1 1.37 1.32 1.33Management of Companies and Enterprises 0.8 1.4 3.3 1.55 0.90 1.00Administrative and Waste Services 5.6 7.5 5.2 1.08 1.02 1.03Educational Services 1.2 1.4 1.0 1.25 0.70 0.59Health Care and Social Assistance 7.1 10.7 9.9 0.84 0.82 0.82Arts, Entertainment, and Recreation 1.5 2.3 1.6 1.04 1.39 1.33Accommodation and Food Services 6.9 11.7 4.2 1.00 1.18 1.14Other Services 7.2 3.5 2.4 0.55 0.90 0.97
Percentage of Total Location Quotient2
aTotal private industries were used as the base for LQ calculations.
Source: Colorado Department of Labor and Employment, Bureau of Labor Statistics.
2006 SECTOR CONCENTRATIONS OF COLORADO FIRMS, EMPLOYMENT, AND WAGES

115
Financial Activities
Monetary authorities—central bank;credit intermediation and related activi-ties; securities, commodity contracts, andother financial investments and relatedactivities; insurance carriers and relatedactivities; funds, trusts, and other financialvehicles; real estate; rental and leasing ser-vices; lessors of nonfinancial intangibleassets (except copyrighted works).
Professional and BusinessServices
Professional, scientific, and technical ser-vices; management of companies andenterprises; administrative and supportservices; waste management and remedia-tion services.
Educational and Health Services
Educational services; ambulatory healthcare services; hospitals; nursing and resi-dential care facilities; and social assistance.
Leisure and Hospitality
Performing arts, spectator sports, andrelated industries; museums, historicalsites, and similar institutions; amusement,gambling, and recreation industries;accommodation; and food services anddrinking places.
Other Services
Repair and maintenance; personal andlaundry services; religious, grantmaking,civic, professional, and similar organiza-tions; and private households.
Government
Executive, legislative, and other generalgovernment support; justice, public order,and safety activities; administration ofhuman resource programs; administrationof environmental quality programs;administration of housing programs,urban planning, and community develop-ment; administration of economic pro-grams; space research and technology; andnational security and international affairs.
Sector Concentration/Location QuotientA useful tool for examining an industry’srelative concentration in an economy is thelocation quotient (LQ). The LQ is a ratiocomparing and industry’s share of a total(can be number of firms, employment,wages, etc.) at a local level to that indus-try’s share of the total at a national level.Therefore, an employment LQ greaterthan 1 means the industry has a higherthan average share of employment in agiven area, or is relatively more concen-trated in that area. For example, if manu-facturing makes up 20% of employmentin a state and 10% of total U.S. employ-ment, that state would have an LQ of 2.0for manufacturing (20/10 = 2). In otherwords, this means that manufacturing istwice as heavily concentrated in that staterelative to the United States. Two of thetables in this section explore this concept.
The other table in this section examinesaverage wages by sector for both Coloradoand the United States. �
Industry Firms Employment WagesFood Manufacturing 0.92 0.70 0.68Beverage and Tobacco Product Mfg 0.97 1.76 2.05Chemical Manufacturing 0.68 0.48 0.39Computer and Electronic Product Mfg 1.28 1.30 1.27Transportation Equipment Mfg 0.62 0.35 0.44Software Publishers 2.66 3.11 2.71Telecommunications 0.93 1.71 2.27Scientific Research and Development Services 1.45 1.36 1.54
Location Quotient22006 CONCENTRATION OF SELECT SUBSECTORS IN COLORADO
Sector Colorado UAgriculture, Forestry, Fishing, HuntingMiningUtilities 92,480 78,341ConstructionManufacturingWholesale Trade 61,632 58,046Retail Trade 25,849 25,567Transportation and Warehousing 42,012 40,848InformationFinance and Insurance 65,095 78,566Real Estate and Rental and Leasing 41,071 41,952Professional and Technical Services 71,544 68,469Management of Companies and Enterprises 101,806 88,823Administrative and Waste Services 30,516 29,332Educational Services 33,093 37,880Health Care and Social Assistance 40,205 39,301Arts, Entertainment, and Recreation 29,592 29,950Accommodation and Food Services 15,561 15,701Other ServicesGovernmentTotal
2006 AVERAGE ANNUAL WAGES BY SECTORCOLORADO AND UNITED STATES
Colorado United Statesa
$25,357 $24,132M 84,346 78,224U 92,480 78,341C 43,215 44,496M 54,865 51,427W 61,632 58,046R 25,849 25,567T 42,012 40,848I 76,257 65,962F 65,095 78,566R 41,071 41,952P 71,544 68,469M 101,806 88,823A 30,516 29,332E 33,093 37,880H 40,205 39,301A 29,592 29,950A 15,561 15,701O 30,104 26,923G 42,657 48,664T $43,506 $42,414
A
aTotal private industries were used as the base for LQ calculations.
Source: Colorado Department of Labor and Employment, Bureau of Labor Statistics.
L
aAverage annual pay, Quarterly Census of Employment and Wages.
Source: Colorado Department of Labor and Employment, Bureau of Labor Statistics.
Dr. Jim BurnellMinerals GeologistColorado Geological Survey1313 Sherman Street, Room 715Denver, CO [email protected]
Mr. Patrick ByrneEconomistGovernor’s Office of State Planning and
Budgeting200 East ColfaxDenver, CO [email protected]
Dr. Steve FisherEconomist68 Benthaven PlaceBoulder, CO [email protected]
Ms. Elizabeth GarnerState DemographerState Demography OfficeColorado Department of Local Affairs1313 Sherman Street, Room 521Denver, CO [email protected]
Dr. Charles GoeldnerProfessor Emeritus of Marketing and TourismLeeds School of Business420 UCB, University of ColoradoBoulder, CO [email protected]
Mr.Mark Hamouz, P.E.LONCO, Inc.1700 Broadway, Suite 1512Denver, CO [email protected]
Mr. Gary HorvathManaging DirectorBusiness Research DivisionLeeds School of Business420 UCB, University of ColoradoBoulder, CO [email protected]
Mr.Wilson KendallPresidentCenter for Business and Economic Forecasting1544 York Street, Suite 220Denver, CO [email protected]
Mr. Brian LewandowskiResearch AnalystBusiness Research DivisionLeeds School of Business420 UCB, University of ColoradoBoulder, CO [email protected]
Mr. Tom LipetzkyDirectorDepartment of Agriculture700 Kipling Street, Suite 4000Lakewood, CO [email protected]
Ms. Donna MarshallExecutive DirectorColorado Business Group on Health200 South Sheridan Boulevard, Suite 105Denver, CO [email protected]
Dr.Vince MatthewsDirectorMineral and Mineral Fuels SectionColorado Geological Survey1313 Sherman Street, Room 715Denver, CO [email protected]
Ms. Sandi MoilanenInternational Trade and Investment Director for
Europe,M.E. and AfricaColorado Office of Economic Development and
International Trade1625 Broadway, Suite 2700Denver, CO [email protected]
Mr. Richard MorganVice PresidentCommercial Real Estate GroupColorado State Bank & Trust1600 Broadway, 3rd FloorDenver, CO [email protected]
Ms. Natalie MullisEconomistLegislative Council200 East Colfax, Room 029Denver, CO [email protected]
Mr. Penn PfiffnerConsulting EconomistConstruction Economics, LLC720 Kipling Street, Suite 12Lakewood, CO [email protected]
Ms. Pam ReichertDivision Director, International TradeColorado Office of Economic Development and
International Trade1625 Broadway, Suite 2700Denver, CO [email protected]
Mr. Reid ReynoldsSenior Research FellowColorado Health Institute1576 Sherman Street, Suite 300Denver, CO 80203303-831-4200, ext. [email protected]
Mr. Tim SheesleyChief EconomistXcel Energy1225 17th Street, Suite 1000Denver, CO [email protected]
Ms. Patty SilversteinPresidentDevelopment Research Partners10184West Belleview Avenue, Suite 100Littleton, CO [email protected]
Mr. JosephWinterProgramManager CES/LAUSLabor Market InformationColorado Department of Labor and
Employment633 17th Street, Suite 600Denver, CO [email protected]
Dr. RichardWobbekindAssociate Dean of External Relations andDirector, Business Research DivisionLeeds School of Business420 UCB, University of ColoradoBoulder, CO [email protected]
Steering Committee Members
116
Population and LaborForce
Ms. Elizabeth Garner (Co-Chair)State DemographerColorado Department of Local AffairsDivision of Local Government1313 Sherman Street, Room 521Denver, CO [email protected]
Mr. JosephWinter (Co-Chair)ProgramManager CES/LAUSColorado Department of Labor and
EmploymentLabor Market Information633 17th Street, Suite 600Denver, CO [email protected]
Mr. Chris AkersColorado Department of Labor and
EmploymentLabor Market Information633 17th Street, Room 600Denver, CO [email protected]
Ms. Cindy DeGroenProjections DemographerColorado Department of Local AffairsDivision of Local Government1313 Sherman Street, Room 521Denver, CO [email protected]
Dr. Richard LinDemographerColorado Department of Local AffairsDivision of Local Government1313 Sherman Street, Room 521Denver, CO [email protected]
Agriculture
Mr. Tom Lipetzky (Chair)DirectorDepartment of AgricultureDivision of Markets700 Kipling Street, Suite 4000Lakewood, CO [email protected]
Mr. Steve AndersonDeputy DirectorUSDA, NASS-CO FO645 Parfet Street, RoomW201Lakewood, CO [email protected]
Mr. Lewis FrankState Executive DirectorFarm Service Agency, USDA655 Parfet StreetLakewood, CO [email protected]
Mr. Darrell HanavanExecutive DirectorColoradoWheat Administration7100 South Clinton Street, Suite 120Centennial, CO [email protected]
Mr. Steve KoontzAssociate ProfessorColorado State UniversityAg & Resource EconomicsB306 Andrew G. ClarkFort Collins, CO [email protected]
Ms. Renee PicansoDirectorUSDA, NASS-CO FO645 Parfet Street, RoomW201Lakewood, CO [email protected]
Mr. Jim RobbCenter DirectorLivestock Marketing Information655 Parfet Street, Room E310Lakewood, CO [email protected]
Natural Resources andMining
Dr. Jim Burnell (Co-Chair)Minerals GeologistColorado Geological Survey1313 Sherman Street, Room 715Denver, CO [email protected]
Dr.Vince Matthews (Co-Chair)DirectorColorado Geological SurveyMineral and Mineral Fuels Section1313 Sherman Street, Room 715Denver, CO [email protected]
Mr. Bob BurnhamHill and Associates, Inc.16357West 76th AvenueArvada, CO [email protected]
Mr. Chris CarrollCoal GeologistColorado Geological Survey1313 Sherman Street, Room 715Denver, CO [email protected]
Mr. Stuart SandersonPresidentColorado Mining Association216 16th Street, Suite 1250Denver, CO [email protected]
Mr. John TobinExecutive DirectorEnergy Literacy Project2528 Medinah DriveEvergreen, CO [email protected]
Ms. Genevieve YoungPetroleum GeologistColorado Geological Survey1313 Sherman Street, Room 715Denver, CO [email protected]
Construction
Mr. Penn Pfiffner (Chair)Consulting EconomistConstruction Economics, LLC720 Kipling Street, Suite 12Lakewood, CO [email protected]
Mr. Jim CoilPrincipalJames Coil Research & Consulting,
LLC247 Red Rim DriveGrand Junction, CO [email protected]
Mr. Tom PetersonColorado Asphalt Pavement
Association6880 South Yosemite CourtCentennial, CO [email protected]
Mr.Michael RinnerMAIThe Genesis Group100 Inverness Terrace East, Suite 220Englewood, CO [email protected]
Mr.Mark ShawSr.Managing EditorMcGraw Hill Construction1114West 7th, Suite 100Denver, CO [email protected]
Mr. Gary ThornamSr.Vice PresidentHaselden Construction6950 South PotomacEnglewood, CO [email protected]
Estimating Groups
continued on page 118
117

Estimating Groupscontinued from page 117
Manufacturing
Ms. Patty Silverstein (Chair)PresidentDevelopment Research Partners10184West Belleview Avenue, Suite
100Littleton, CO [email protected]
Dr. Fred CrowleySenior Economist and Senior
InstructorUniversity of Colorado at Colorado
SpringsCollege of Business and
AdministrationP.O. Box 7150Colorado Springs, CO [email protected]
Ms. Jo AnnMiabella GalvanDirector, Industry Alliances and
ProgramsColorado Association for
Manufacturing and Technology(CAMT)
1625 Broadway, Suite 950Denver, CO [email protected]
Ms. Sue PiattResearch ManagerColorado Office of Economic
Development & InternationalTrade
1625 Broadway, Suite 2700Denver, CO [email protected]
Dr. Tom ZwirleinProfessor of Finance and Faculty
Director of the SouthernColorado Economic Forum
University of Colorado at ColoradoSprings
College of Business andAdministration
P.O. Box 7150Colorado Springs, CO [email protected]
Trade, Transportation,and Utilities
Mr.Wilson Kendall (Co-Chair)PresidentCenter for Business and Economic
Forecasting1544 York Street, Suite 220Denver, CO [email protected]
Mr. Tim Sheesley (Co-Chair)Chief EconomistXcel Energy1225 17th Street, Suite 1000Denver, CO [email protected]
Mr. Chuck CannonDirector of Public AffairsDenver International Airport8500 Pe a BoulevardDenver, CO [email protected]
Ms. Susan ConwellStatistical AnalystColorado Department of RevenueOffice of Tax Analysis1375 Sherman StreetDenver, CO [email protected]
Mr. John FergusonManaging PrincipalExcel Consulting, Inc.P.O. Box 351793Westminster, CO [email protected]
Mr. Gregory FultonPresidentColorado Motor Carriers Association4060 Elati StreetDenver, CO [email protected]
Mr. Frank GrayVice President, Business ExpansionAdams County Economic
Development12050 Pecos Street, Suite 200Westminster, CO [email protected]
Mr. Philip PrinziDirector, Ball CorporationPackaging Logistics & Strategic
Services9300West 108th CircleBroomfield, CO [email protected]
Mr. Arne RayPartner, Szymanski/Ray901 Acoma StreetDenver, CO [email protected]
Ms. Rachel ThompsonEconomic AnalystDenver Regional Council of
Governments4500 Cherry Creek Drive South, Suite
800Denver, CO [email protected]
Information
Mr. Brian Lewandowski (Co-Chair)Research AnalystUniversity of Colorado-BoulderBusiness Research Division420 UCBBoulder, CO [email protected]
Ms. Natalie Mullis (Co-Chair)EconomistLegislative Council200 East Colfax, Room 029Denver, CO [email protected]
Ms. Su HawkPresidentCSIA1625 Broadway, Suite 950Denver, CO [email protected]
Mr. Kevin ShandDirectorColorado Film Commission1625 Broadway, Suite 950Denver, CO [email protected]
Mr. GaryWittExecutive Vice PresidentColorado Telecommunications
Association225 East 16th Avenue, Suite 260Denver, CO [email protected]
Financial Activities
Mr. Richard Morgan (Chair)Vice PresidentColorado State Bank & TrustCommercial Real Estate Group1600 Broadway, 3rd FloorDenver, CO [email protected]
Ms. Lynn BeshanyVice President - Employee BenefitsCompass InsuranceOlson & Olson Division750West Hampden Avenue, #440Englewood, CO [email protected]
Ms.Melia HeimbuckDirector of Member ServicesColorado Credit Union Association4905West 60th AvenueArvada, CO [email protected]
Mr. Brendan HickeyAnalystQ Advisors1324 15th StreetDenver, CO [email protected]
118

Ms. Jessica Morgan OstermickReal Estate [email protected]
Mr. Ron NewVice PresidentStifel, Nicolaus & Company Inc.Institutional Fixed Income1125 17th Street, Suite 1500Denver, CO [email protected]
Professional andBusiness Services
Dr. Steve Fisher (Co-Chair)Economist68 Benthaven PlaceBoulder, CO [email protected]
Mr.Mark Hamouz, P.E. (Co-Chair)LONCO, Inc.1700 Broadway, Suite 1512Denver, CO [email protected]
Ms. Benita DuranVice President and Director, SWRCH2MHill9193 South Jamaica StreetEnglewood, CO [email protected]
Ms. Barbara IhdeExecutive DirectorColorado Photonics Industry
Association1625 Broadway, Suite 950Denver, CO [email protected]
Mr. BudMcGrathExecutive DirectorCORE1625 Broadway, Suite 950Denver, CO [email protected]
Ms. Phyllis ResnickManaging DirectorR. Squared Analysis, LLCP.O. Box 3345Boulder, CO [email protected]
Ms. Lisa ShadeNorthrop-Grumman CorporationElectronic Systems500 Ridge View DriveLouisville, CO [email protected]
Educational and HealthServices
Ms. Donna Marshall(Co-Chair)Executive DirectorColorado Business Group on Health200 South Sheridan Boulevard,
Suite 105Denver, CO [email protected]
Mr. Reid Reynolds (Co-Chair)Senior Research FellowColorado Health Institute1576 Sherman Street, Suite 300Denver, CO 80203303-831-4200 ext. 204reynoldsr@coloradohealthinstitute
.org
Ms.Michele AlmendarezSenior Manager, Strategic PlanningKaiser Foundation Health Plan -
Colorado10350 East Dakota AvenueDenver, CO [email protected]
Mr. Scott AndersonDirector of Data Policy and ResearchColorado Health and Hospital
Association7335 East Orchard Road, #100GreenwoodVillage, CO [email protected]
Ms. Jackie DriscollVice President, Payer RelationsCentura Health188 Inverness DriveWest, Suite 500Englewood, CO [email protected]
Leisure and Hospitality
Dr. Charles Goeldner (Chair)Professor Emeritus of Marketing and
TourismUniversity of ColoradoLeeds School of Business420 UCBBoulder, CO [email protected]
Mr. Don BrunsRecreation PlannerU.S. Department of Interior Bureau
of LandManagementColorado State Office2850 Youngfield StreetLakewood, CO [email protected]
Mr. Eugene DilbeckSenior Vice PresidentLongwoods International8101 East Dartmouth Avenue, #14Denver, CO [email protected]
Dr. Tucker Hart AdamsPresidentThe Adams Group, Inc.4822 Alteza DriveColorado Springs, CO [email protected]
Mr. Gregory HartmannManaging DirectorHVS International-Boulder2229 BroadwayBoulder, CO [email protected]
Mr. Bill HoppingPresidentW.R. Hopping & Co.5773 Shasta CircleLittleton, CO [email protected]
Mr. Peter M.MersmanPresident and CEOColorado Restaurant Association430 East 7th AvenueDenver, CO [email protected]
Mr. Rob PerlmanPresident and CEOColorado Ski Country USA1507 Blake StreetDenver, CO [email protected]
Mr. RichardW. ScharfPresident and CEODenver Metro Convention &Visitors
Bureau1555 California Street, Suite 300Denver, CO [email protected]
Dr. John SnyderPresidentStrategic Studies, Inc.1789 East Otero AvenueLittleton, CO [email protected]
Other Services
Mr. Gary Horvath (Chair)Managing DirectorLeeds School of BusinessBusiness Research Division420 UCB, University of ColoradoBoulder, CO [email protected]
Mr. Scott VosStudent Research AssistantLeeds School of BusinessBusiness Research Division420 UCB, University of ColoradoBoulder, CO [email protected]
Government
Mr. Patrick Byrne (Chair)EconomistGovernor’s Office of State Planning
and Budgeting200 East ColfaxDenver, CO [email protected]
continued on page 120
119

Mr. Greg McBoatResearch EconomistDevelopment Research Partners10184West BelleviewAvenue, Suite 100Littleton, CO [email protected]
Ms. Allyson ReedyEconomistColorado Department of Labor and
EmploymentLabor Market Information - Training
and Outreach633 17th Street, Suite 600Denver, CO [email protected]
Mr. Jason SchrockEconomistColorado Legislative Council200 East ColfaxDenver, CO [email protected]
Ms. Lisa StrunkAnalyst, Department of Health Care
Policy and FinancingChild Health Plan Plus1570 Grant StreetDenver, CO [email protected]
International Trade
Ms. Sandi Moilanen (Co-Chair)International Trade & Investment
Director for Europe,M.E. andAfrica
Colorado Office of Economic Devel-opment and International Trade
1625 Broadway, Suite 2700Denver, CO [email protected]
Ms. Pam Reichert (Co-Chair)Division Director, International TradeColorado Office of Economic Devel-
opment and International Trade1625 Broadway, Suite 2700Denver, CO [email protected]
Mr. Paul Bergman, Jr.Director, Colorado &WyomingU.S. Department of CommerceU.S. Export Assistance Center1625 Broadway, Suite 680Denver, CO 80202303-844-6001 ext. [email protected]
Mr. Tom CarterInternational Trade & Investment
Director for Asia-PacificColorado Office of Economic Devel-
opment and International Trade1625 Broadway, Suite 2700Denver, CO [email protected]
Ms. Leah KlassDirector, Trade & Investment, South
America and the CaribbeanColorado Office of Economic
Development and InternationalTrade
1625 Broadway, Suite 2700Denver, CO [email protected]
Mr. Tim LarsenSenior International Marketing
SpecialistColorado Department of AgricultureMarkets Division700 Kipling Street, Suite 4000Lakewood, CO [email protected]
Ms. Amy ReichertDirector, Trade & Investment, NAFTA
and Central AmericaColorado Office of Economic Devel-
opment and International Trade1625 Broadway, Suite 2700Denver, CO [email protected]
Mr. Jim ReisPresidentWorld Trade Center Denver1625 Broadway, Suite 680Denver, CO [email protected]
Around the State
Mr. David CockrellPueblo Area Council of GovernmentsUrban Transportation Planning
Division223 North Santa Fe AvenuePueblo, CO [email protected]
Dr. Fred CrowleySenior Economist and Senior
InstructorUniversity of Colorado at Colorado
SpringsCollege of Business and
AdministrationP.O. Box 7150Colorado Springs, CO [email protected]
Ms. Frances DraperDirectorBoulder Economic Council2440 Pearl StreetBoulder, CO [email protected]
Ms. Ann DriggersPresident and CEOGrand Junction Economic
Partnership122 North 6th StreetGrand Junction, CO [email protected]
Mr. David KeyserResearch EconomistColorado State University1771 EconomicsFort Collins, CO [email protected]
Dr. Luke MillerCo-DirectorFort Lewis CollegeOffice of Economic Analysis and
Business Research1000 Rim DriveDurango, CO [email protected]
Ms. Jennifer PinsonneaultProject ManagerBoulder Economic Council2440 Pearl StreetBoulder, CO 80302303-938-2081jennifer.pinsonneault@bouldercham-
ber.com
Dr.Martin ShieldsAssociate Professor of EconomicsColorado State University1771 EconomicsFort Collins, CO [email protected]
Dr. Robert SonoraCo-DirectorFort Lewis CollegeOffice of Economic Analysis and
Business Research1000 Rim DriveDurango, CO [email protected]
Mr. DonVestPueblo Area Council of GovernmentsUrban Transportation Planning
Division223 North Santa Fe AvenuePueblo, CO [email protected]
Dr. DeborahWalkerCo-DirectorFort Lewis CollegeOffice of Economic Analysis and
Business Research1000 Rim DriveDurango, CO [email protected]
Dr. Tom ZwirleinProfessor of Finance and Faculty
Director of the SouthernColorado Economic Forum
University of Colorado at ColoradoSprings
College of Business andAdministration
P.O. Box 7150Colorado Springs, CO [email protected]
Estimating Groupscontinued from page 119
120

For over 90 years, the Business Research Division(BRD) of the Leeds School of Business has
been providing business, economic, and marketresearch that contributes to the efficient use ofColorado’s resources. Through its annual ColoradoBusiness Economic Outlook Forum, the BRD hasestablished a base of knowledge that adds value tothe division’s work in other areas. In addition toproviding research to public and private organiza-tions, the division is the umbrella organization forColorado Association of Manufacturing andTechnology (CAMT) and the Rocky MountainTrade Adjustment Assistance Center (RMTAAC).
Purposes of UnitThe BRD provides business, economic, and marketresearch that contributes to the efficient use ofColorado’s resources and increases interest in andawareness of the Leeds School of Business. TheBRD provides support to the Colorado businesscommunity in the following areas:
Industry Support—Through research conductedwith companies, associations, nonprofit organiza-tions, educational institutions, and state and localgovernmental agencies throughout the world, the
BRD has developed primary competencies in theareas of the impact of government and govern-ment policy, the role and impact of technology inColorado, manufacturing issues and trends, andissues in the health-care industry. Secondary com-petencies have been developed as a result ofresearch conducted in the construction, trade, ser-vices, and finance sectors.
Research for the State of Colorado—EachDecember the BRD presents its annual forecast ofthe Colorado state economy. Subsequent presenta-tions are made during the year throughout thestate. Selected summaries or research reports areavailable on the BRD’s web site (www.leeds.col-orado.edu/brd/). In addition, the BRD compilesthe Colorado Business Leaders Confidence Index®(BLCI) on a quarterly basis. More informationabout the BLCI is available at www.blci.com.
Faculty and Center Research—The BRD cooper-ates with other centers in the Leeds School ofBusiness and faculty members to assist them withconducting applied, relevant research that benefitsthe business community and the Leeds School ofBusiness.
Student Research—The BRD provides opportuni-ties for students to gain practical business experi-ence by involving them in business andeconomic-related research projects.
U.S. Census Research—The division providesassistance to the business community in findingrelevant information from U.S. census reports byobtaining and using statistical data and relatedproducts. The division is an affiliate in the StateData Center System.
Areas of ExpertiseThe Business Economic Outlook Forum providesan excellent base of knowledge for the BRD to con-duct local, national, and international research fora diverse set of clients. In addition to supplyingcompanies and state agencies with information tohelp themmake better-informed business and pol-icy decisions, this research provides the BRD withexpertise in a number of areas. Through a varietyof research tools (direct mail surveys, telephonesurveys, focus groups, and personal interviews), theBRD has conducted research in:
Business Research DivisionLeeds School of Business
University of Colorado at Boulder420 UCB
Boulder, CO 80309-0420303-492-8227 • Fax: 303-492-3620http://leeds.colorado.edu/brd/
continued on page 122
121
2008 Colorado Business Economic Outlook

2008 Colorado Business Economic Outlook
122
Technology• Prepared a roadmap for nanotechnology inColorado
• Conducted trend and issue analysis of biomed-ical, photonics, and renewable energy industries
• Compiled industry and sector directories
• Estimated impact of technology on Colorado
Manufacturing• Investigated employment trends and issues
• Identified management and operational issues
• Prepared competitive intelligence and industryneeds assessment
• Published industry and niche directories
• Identified methods for service providers to pro-vide better service to manufacturers
• Determined the impact of key manufacturers onlocal economies
Healthcare• Performed analyses of drug usage patterns forstate Medicaid program
• Conducted customer satisfaction surveys ofpublic and private health plans
• Conducted a comparative analysis of health plans
• Prepared a study of the appropriate informationto provide clients using health plans
State and Local Policy Decision-MakingOrganizations• Calculated fiscal impact of state agency on itsclients
• Conducted customer satisfaction with stateagency programs
• Prepared potential fiscal impact of retail store oncity economy
• Identified city and county issues and trends withcity and county employees
• Conducted customer satisfaction programs withfederal programs to mitigate employmentreduction because of defense layoffs
• Calculated fiscal impact of agricultural compo-nent on county economy
• Prepared analysis of issues and opinions regard-ing county growth trends
• Conducted public safety satisfaction/needsassessment study
Real Estate• Analyzed real estate activity and value inColorado, as well as eight Colorado regions
• Calculated the impact of commercial real estateon the state of Colorado in a collaborated studywith the University of Colorado Real EstateCenter and the University of Denver, Franklin L.Burns School of Real Estate and ConstructionManagement
• Collaboratively analyzed the current affordablehousing program in the City of Boulder with theUniversity of Colorado Real Estate Center
Other Areas• Conducted name recognition study for interna-tional financial services company
• Collected competitive intelligence and needsassessment to help company determine feasibil-ity of moving to Colorado
• Prepared association membership satisfactionand needs assessment
General Economic Information• Prepared local leading economic indicator series
• Collected local economic data for various cityand county organizations
Business Economic Outlook Forum• Make targeted presentations of the business eco-nomic forecast annually to more than 30 local,regional, and national organizations
StaffRichardWobbekind, Executive DirectorGary Horvath,Managing DirectorCindy DiPersio, Project CoordinatorBrian Lewandowski, Research AnalystMiles Light, Research EconomistTerry Rosson, ProgramAssistant
For More InformationBusiness Research DivisionUniversity of Colorado at Boulder420 UCBBoulder, CO 80309-0420Telephone: 303-492-8227Fax: 303-492-3620E-mail: [email protected]://leeds.colorado.edu/brd/
Business Research Divisioncontinued from page 121

2008 Colorado Business Economic Outlook
123
continued on page 124
Leeds School of Business: Services to Business and Industry
Richard M. Burridge Center forSecurities Analysis and ValuationThe mission of the Richard M. Burridge Center forSecurities Analysis and Valuation is to encourage and sup-port the creation and dissemination of new knowledgeabout financial markets, with an emphasis on U.S. finan-cial markets. The center
• Facilitates the exchange of ideas and knowledge amongstudents, professional investment managers, financescholars, policymakers, and the investing public;
• Identifies critical research issues in the theory and prac-tice of security analysis and valuation; and
• Encourages and supports vigorous qualitative andquantitative research on topics relevant and useful tomoney managers, valuation experts, and financeacademics.
Michael Stutzer, DirectorLeeds School of BusinessUniversity of Colorado at Boulder419 UCBBoulder, CO 80309-0419Telephone: 303-492-4348E-mail: [email protected]://leeds.colorado.edu/burridge
University of Colorado Real Estate CenterThrough the dedicated efforts of a committed Universityof Colorado faculty collegium, the CU Real Estate Centerprovides a world-class real estate curriculum at both thegraduate and the undergraduate levels that prepares stu-dents to be leaders in the real estate industry.
The CU Real Estate Center was created in 1996 throughthe efforts of the CU Real Estate Council. The council con-sists of more than 350 real estate professionals contribut-ing time, expertise, and financial support to educate thenext generation of industry leaders. The partnershipbetween the University of Colorado and the University ofColorado Real Estate Council creates a dynamic relation-ship that offers beneficial opportunities to further researchand student involvement in real estate issues such as landuse, growth management, sustainability, capital markets,and other related topics.
Through the CU Real Estate Council, the center provides arewarding mentorship program designed to benefit boththe students and council members. In addition, the centerdevelops meaningful internship opportunities for studentsthrough the council network, requiring on-the-job experi-ences as part of the learning process for all students, withjob placement opportunities as the ultimate goal of theprogram.
In August of 2002, the University of Colorado Real EstateFoundation (CUREF) was created by the University andCU Real Estate Council members to be an independentsupporting organization to the University of Colorado.CUREF’s mission is to maximize financial returns to theuniversity by creating, managing, and growing a highincome-producing real estate portfolio and to assist theuniversity in implementing campus master plans. CUREFutilizes the resources of the CU Real Estate Center andprovides support to the center through sponsorship of theCU Real Estate Council.
Byron R. Koste, Executive DirectorCU Real Estate CenterLeeds School of BusinessUniversity of Colorado at Boulder419 UCBBoulder, CO 80309-0419Telephone: 303-492-3258E-mail: [email protected]://leeds.colorado.edu/realestate/
The Robert H. and Beverly A. DemingCenter for EntrepreneurshipContinued national recognitions affirm the quality of theDeming Center for Entrepreneurship’s Program and itssuccess creating innovative new areas of entrepreneurialopportunity. The Center’s work in sustainable venturing,natural and organic products, and renewable energy keepit at the forefront of entrepreneurship education.
Collaborations cross-campus, in the business community,and with national government labs have established amodel for the intersection of entrepreneurial creativity,technology, and innovation. Our students benefit fromunparalleled access to world renowned faculty and re-searchers, and the Boulder region’s diverse entrepreneurs,venture capitalist, and start-up resources. The area’svibrant, supportive entrepreneurial community is at thefoundation of our success.
Successful collaborations include CU-Boulder’sTechnology Transfer Office, Renewable Energy Initiative,Entrepreneurial Law Clinic,Music EntrepreneurshipProgram, Silicon Flatirons Telecommunications Program,and College of Engineering and Applied Science.Partnerships have been built with CTEKVenture Centers,

2008 Colorado Business Economic Outlook
124
Services to Business and Industrycontinued from page 123
Boulder Innovation Center, Naturally Boulder ProductsTask Force, National Renewable Energy Laboratory(NREL), and the National Center for AtmosphericResearch (NCAR), among others.
Sustainable Venturing InitiativeThe Sustainable Venturing Initiative began in 2005 to offertomorrow’s entrepreneurial leaders an entrée into the fast-changing world of sustainable business opportunities,with a focus on the growing fields of clean technology andrenewable energy. Students build on a rigorous foundationof skills and a network of creative entrepreneurs to helpthem put their ideas into practice.
Center Events and ProgramsThe Center’s forward-thinking initiatives include theCleantech Venture Challenge international business plancompetition. A student competition showcasing emergingopportunities in the cleantech sector, this event promotesthe development of venture-grade business ideas thataddress pressing environmental problems and increasingglobal demand for energy. The annual SustainableOpportunities Summit is a conference that brings togethercorporate leaders, entrepreneurs, and venture capitalistsfrom Colorado and the nation in a unique forum to assessthe growing opportunities created by climate change.
The center’s internal business plan competitions andexisting programs continue to grow and thrive. Includedamong those are the undergraduate Certificate ofExcellence in Entrepreneurial Studies, the CollegiateEntrepreneurs Organization, the annual Evening withEntrepreneurs event, and the new TREP Café student-runbusiness that is housed in the Leeds School of Business. Atthe MBA level, the Graduate Entrepreneurs Associationsupports activities to encourage and promote studentactivity in entrepreneurship, including Learn from the Best
and the annual Entrepreneurship Retreat. MBAs also con-tinue the legacy of Entrepreneurial Solutions, a for-profit,student-run consulting firm staffed by a select group ofMBA students. It serves the business community by pro-viding high-value solutions that rely on the expertise ofeach year’s team.
Robert H. and Beverly A. Deming Center forEntrepreneurship
Leeds School of BusinessUniversity of Colorado at Boulder419 UCBBoulder, CO 80309-0419Telephone: [email protected]://leeds.colorado.edu/entrep/
Evening MBA ProgramThe Leeds School of Business Evening MBA programoffers working professionals the opportunity to advancetheir careers and accelerate their professional growth byearning an MBA degree while maintaining full-timeemployment. The opportunity to immediately apply con-cepts learned in the MBA classroom to the work environ-ment is a powerful tool to advance individual careers andmaximize the value of the educational experience. Taughtby the same nationally renowned faculty who teach in theLeeds School’s full-time MBA program, the Evening MBAProgram gives students and their companies access to thelatest cutting-edge business knowledge and practices.Students in the evening program attend classes two nightsper week for eight consecutive semesters. The program’sdedication to superior administrative support providesevening students the ability to focus on the educationalexperience.
Anne SandoeDirector of MB A ProgramsMBA Programs OfficeLeeds School of BusinessUniversity of Colorado at Boulder419 UCBBoulder, CO 80309-0419Telephone: 303-492-8397E-mail: [email protected]://mbaep.colorado.edu/index.html
Executive Development ProgramsExecutive Development Programs (EDP) at the LeedsSchool of Business is an executive education provider witha national presence. EDP specializes in business programsfocused on the adult learner. From intense seven-monthmanagement courses to three-day basic business topics,our programs deliver high-impact education.
The faculty and the EDP staff can work with you todevelop a custom program that will provide specific toolsto help your organization achieve its unique goals. Led byour internationally recognized faculty, your organizationwill be better able to assess corporate strategies and to ana-lyze the gaps in performance. Our customized solutionsprovide education with an emphasis on change manage-ment, finance and accounting, and a number of otherbusiness topics.
Come explore the many opportunities that EDP offers.

2008 Colorado Business Economic Outlook
125
continued on page 126
Robin Miglarese, Associate DirectorNeda Zanganeh, Program CoordinatorExecutive Development ProgramsUniversity of Colorado at Boulder419 UCBBoulder, CO 80309-0419Telephone: 303-735-0183E-mail: [email protected]://leeds.colorado.edu/execed
Colorado Association of Manufacturingand Technology (CAMT)The Colorado Association for Manufacturing andTechnology (CAMT) is a statewide manufacturing assis-tance center, partially funded by the NISTManufacturingExtension Partnership and hosted by the University ofColorado. CAMT encourages the global competitivenessof Colorado manufacturers through on-site technicalassistance and support; collaboration-focused industryprograms; and the leverage of government, university, andeconomic development partnerships. CAMT hosts myriadprograms in support of its mission.
• Through on-site support and technical assistance,CAMT works to boost the competitiveness of Coloradomanufacturers. CAMT’s experienced engineers andbusiness professionals, with skills in manufacturing,management, process, and technology, work closelywith manufacturers to provide company assessments,customized training and workshops, and hands-onfacilitation and implementation.
• CAMT has developed a web portal designed tostrengthen the supply chain through enabling compa-nies to search for local suppliers, collaborate on largernational and international opportunities, and pool sell-ing capabilities (similar to the concept of a co-op).
• By partnering with Colorado universities and nationallaboratories, CAMT helps manufacturers access aca-demic resources and find technology that is available tointegrate with their product development.
• CAMT offers workforce development on-site trainingand workshops to provide employees with education inworld-class manufacturing. In addition, programs areoffered to high school students to foster greater aware-ness of, and appreciation for, career opportunities inmanufacturing.
• Business networks are imperative to achieving regionalindustry growth, and CAMT has been a key driver inthe initiation of manufacturing taskforces across thestate. These taskforces provide a platform for businessleaders to learn from other successful business leaders,share technical knowledge and innovations, anduncover strategic partnership opportunities.
• As a statewide manufacturing advocate, CAMTmakesresearch and policy recommendations on issues such asOSHA, the environment, and healthcare that have asignificant impact on manufacturing costs.
Elaine Thorndike, CEOCAMT1625 Broadway, Suite 950Denver, CO 80202Telephone: 303-592-4087Fax: 303-592-4061E-mail: [email protected]://www.camt.com/
Rocky Mountain Trade AdjustmentAssistance Center (RMTAAC)RMTAAC is an independent, nonprofit organization offer-ing technical and professional assistance to small andmedium-size manufacturers adversely affected by importcompetition.
The center is staffed by professionals with extensive pri-vate-sector experience in marketing, management, andengineering. RMTAAC project managers work closely withmanufacturers to identify cost-effective strategies thatenable them to compete with foreign producers.
In addition, project managers locate outside technical con-sultants to implement projects that require specializedexpertise. Up to 50% of the total project cost is funded bythe U.S. Department of Commerce.
Since 1981, RMTAAC has helped hundreds of manufac-turers in a number of industries, including circuit boardassembly, recreational equipment, material handling, test-ing equipment, building materials, apparel, and jewelry.
Edvard Hag, DirectorRocky Mountain Trade Adjustment Assistance Center5353 Manhattan Circle, Suite 200Boulder, CO 80303Telephone: 303-499-8222Fax: 303-499-8298www.rmtaac.org

2008 Colorado Business Economic Outlook
126
Services to Business and Industrycontinued from page 125
Center for Business IntegrationThe Center for Business Integration (CBI) at the LeedsSchool of Business creates opportunities to bring togetherlocal business people, business students, and faculty to col-laborate in solving business problems. Through project-based learning, CBI is connecting the experience providedby local companies, the knowledge created by the Univer-sity, and the work conducted by students in the LeedsSchool. The center brings real-world projects to the class-room by assisting students and faculty in identifying,selecting, and executing projects for local companies. Afterthe project has been selected, CBI provides support to fac-ulty and students during project planning and execution.
CBI looks for projects that provide students with experi-ence that will help them get better jobs. In addition, CBIseeks out employers who would like to test students on a
real project before making hiring decisions. Successful pastprojects include: supply-chain audits and recommenda-tions for improvement;Web site design; software selection;information system review and recommendations forimprovement; new product design; business processreview; internal control review; database design; productcosting; business report design; and business intelligence.
One of the benefits to companies is that they can use thisexperience to infuse project management principles intheir own operations.Managers who are chosen to workwith the students are encouraged to participate in theproject management components of the coursework. Thislearning, along with the skills gained through managing anactual company-related project, can have an impact on theeffectiveness of internal project-management skills.
Projects are selected based on their value to our student’seducational experience and relevance to our faculty’sresearch. CBI prefers to receive projects prior to the begin-ning of the fall and spring semesters. If the opportunity tosolve a real problem, to gain additional exposure to projectmanagement principles for your staff, and to work withstudents is appealing, CBI would be pleased to provideadditional details.
James MarlattCenter Director, Senior InstructorLeeds School of BusinessSystems Division419 UCBUniversity of Colorado at BoulderBoulder, CO [email protected]: 720-933-5541
Related Documents