Mansfield Independent School District Mansfield, Texas 2008 Schools FIRST - Annual Financial Management Report For the Year Ended August 31, 2007 Mr. Vernon Newsom, Superintendent of Schools Ms. Lou Spiegel, Associate Superintendent of Business

Welcome message from author
This document is posted to help you gain knowledge. Please leave a comment to let me know what you think about it! Share it to your friends and learn new things together.
Transcript
Mansfield Independent School District Mansfield, Texas
2008 Schools FIRST - Annual Financial Management Report
For the Year Ended August 31, 2007
Mr. Vernon Newsom, Superintendent of Schools Ms. Lou Spiegel, Associate Superintendent of Business
2
MANSFIELD INDEPENDENT SCHOOL DISTRICT
SCHOOLS FIRST REPORT FOR 2006-07
Table of Contents Page Introduction 3 Financial Accountability Ratings Worksheet for 2006-07 4 - 8 Overview of the Worksheet’s Criteria: Critical Indicators 9 Academic Rating 9 Fiscal Performance 9 Staffing Patterns 9-10 Cash Management Practices 10 Other Data Concerning the District’s Financial Operations: Financial Strength 10 Operating Cost Management 10-11 Personnel Management 11-12 Debt Management 12 Facility Acquisition and Construction Management 12 Cash Management 12-13 Tax Collections 13
Budgetary Planning & Financial Allocations 13 -14 Other Issues 14 Summary 14
Education Code, Chapter 39, Financial Accountability 15-16 Exhibits 17-26

3
Introduction
During the 77th regular session of the Texas Legislature (2001), Senate Bill 218 was passed and Governor Perry signed it into law shortly thereafter. This law requires each school district to prepare an annual financial accountability report, effective no later than September 1 each year. TEA issued the preliminary and final financial accountability ratings for the 2006-07 fiscal year in August of 2008. The District’s final rating of “Superior Achievement” is included in this report.
Many business-related issues are covered in this report. The primary reporting tool, however, is the Financial Accountability Ratings Worksheet. This worksheet was developed by representatives of the Texas Education Agency (TEA), the Texas Business & Education Council (TBEC), the Comptroller’s office and the Texas Association of School Business Officials (TASBO). It is administered by TEA and calculated on information submitted to the Agency via our PEIMS submission each year and other documentation procured by TEA. The accuracy of PEIMS data has always been critical on the student side of the submission, and this reporting requirement adds a high degree of importance to our finance submission each year. The worksheet consists of 24 indicators, each weighted with numeric values with the exception of the Critical Indicators. A “No” response to one of indicators 1-6 will automatically result in a rating of Substandard Achievement, so these six indicators are of utmost importance. Currently, the District enjoys a rating of “Superior Achievement”, scoring an 85 and having “Yes” to all indicators on the financial accountability worksheet. The worksheet itself and a discussion of its salient points follow.
4
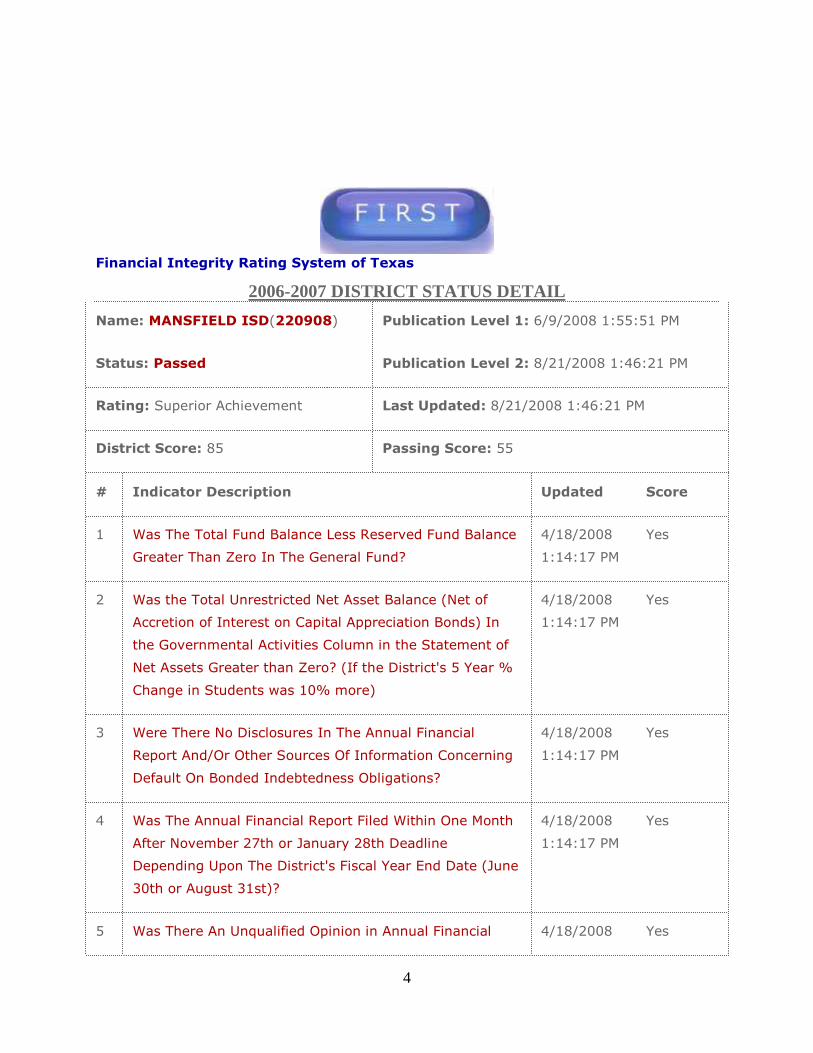
Financial Integrity Rating System of Texas
2006-2007 DISTRICT STATUS DETAIL
Name: MANSFIELD ISD(220908) Publication Level 1: 6/9/2008 1:55:51 PM
Status: Passed Publication Level 2: 8/21/2008 1:46:21 PM
Rating: Superior Achievement Last Updated: 8/21/2008 1:46:21 PM
District Score: 85 Passing Score: 55
# Indicator Description Updated Score
1 Was The Total Fund Balance Less Reserved Fund Balance
Greater Than Zero In The General Fund?
4/18/2008
1:14:17 PM
Yes
2 Was the Total Unrestricted Net Asset Balance (Net of
Accretion of Interest on Capital Appreciation Bonds) In
the Governmental Activities Column in the Statement of
Net Assets Greater than Zero? (If the District's 5 Year %
Change in Students was 10% more)
4/18/2008
1:14:17 PM
Yes
3 Were There No Disclosures In The Annual Financial
Report And/Or Other Sources Of Information Concerning
Default On Bonded Indebtedness Obligations?
4/18/2008
1:14:17 PM
Yes
4 Was The Annual Financial Report Filed Within One Month
After November 27th or January 28th Deadline
Depending Upon The District's Fiscal Year End Date (June
30th or August 31st)?
4/18/2008
1:14:17 PM
Yes
5 Was There An Unqualified Opinion in Annual Financial 4/18/2008 Yes

5
Report? 1:14:17 PM
6 Did The Annual Financial Report Not Disclose Any
Instance(s) Of Material Weaknesses In Internal Controls?
4/18/2008
1:14:18 PM
Yes
1
Multiplier
Sum
7 Did the Districts Academic Rating Exceed Academically
Unacceptable?
4/18/2008
1:14:18 PM
5
8 Was The Three-Year Average Percent Of Total Tax
Collections (Including Delinquent) Greater Than 98%?
4/18/2008
1:14:18 PM
5
9 Did The Comparison Of PEIMS Data To Like Information
In Annual Financial Report Result In An Aggregate
Variance Of Less Than 3 Percent Of Expenditures Per
Fund Type (Data Quality Measure)?
4/18/2008
1:14:18 PM
5
10 Were Debt Related Expenditures (Net Of IFA And/Or EDA
Allotment) < $250.00 Per Student? (If The District's Five-
Year Percent Change In Students = Or > 7%, Or If
Property Taxes Collected Per Penny Of Tax Effort >
$200,000 Per Student)
4/18/2008
1:14:18 PM
5
11 Was There No Disclosure In The Annual Audit Report Of
Material Noncompliance?
4/18/2008
1:14:19 PM
5
12 Did The District Have Full Accreditation Status In Relation
To Financial Management Practices? (e.g. No Conservator
Or Monitor Assigned)
4/18/2008
1:14:19 PM
5
13 Was The Percent Of Operating Expenditures Expended
For Instruction More Than 65%? (Functions 11, 36, 93,
95) (Phased in over three years, 55% for 2006-2007;
60% for 2007-2008; and 65% for 2008-2009)
4/25/2008
1:08:36 PM
3
6
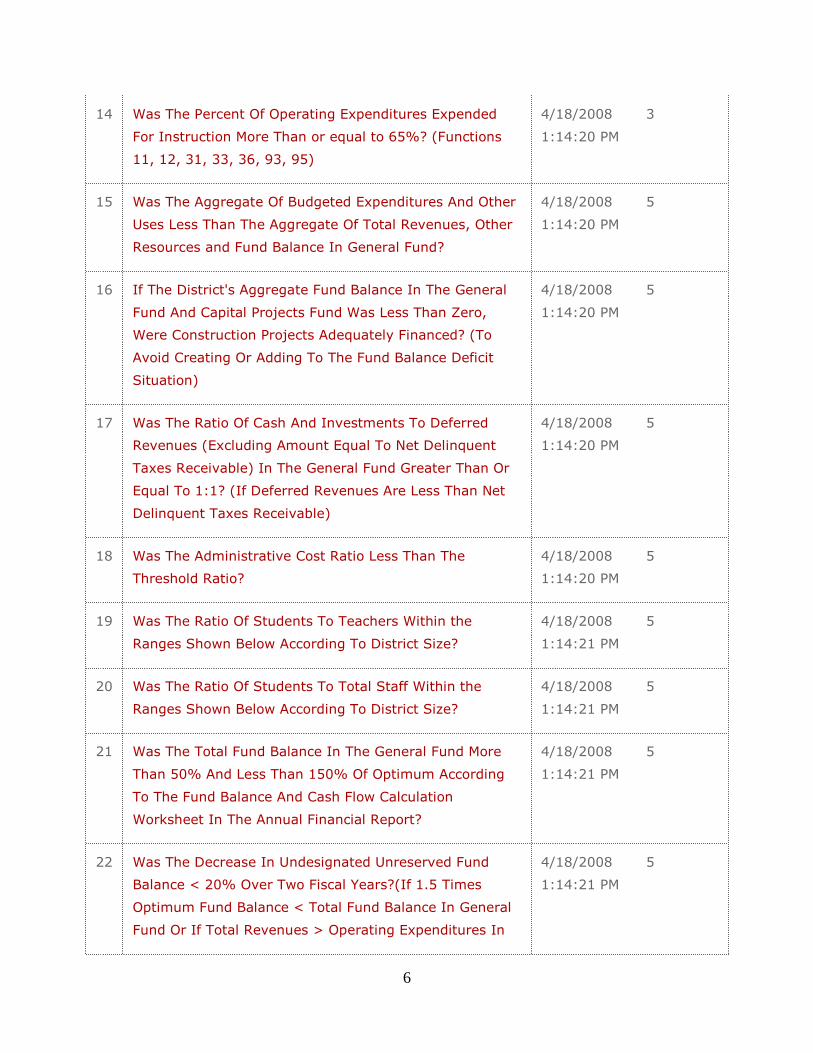
14 Was The Percent Of Operating Expenditures Expended
For Instruction More Than or equal to 65%? (Functions
11, 12, 31, 33, 36, 93, 95)
4/18/2008
1:14:20 PM
3
15 Was The Aggregate Of Budgeted Expenditures And Other
Uses Less Than The Aggregate Of Total Revenues, Other
Resources and Fund Balance In General Fund?
4/18/2008
1:14:20 PM
5
16 If The District's Aggregate Fund Balance In The General
Fund And Capital Projects Fund Was Less Than Zero,
Were Construction Projects Adequately Financed? (To
Avoid Creating Or Adding To The Fund Balance Deficit
Situation)
4/18/2008
1:14:20 PM
5
17 Was The Ratio Of Cash And Investments To Deferred
Revenues (Excluding Amount Equal To Net Delinquent
Taxes Receivable) In The General Fund Greater Than Or
Equal To 1:1? (If Deferred Revenues Are Less Than Net
Delinquent Taxes Receivable)
4/18/2008
1:14:20 PM
5
18 Was The Administrative Cost Ratio Less Than The
Threshold Ratio?
4/18/2008
1:14:20 PM
5
19 Was The Ratio Of Students To Teachers Within the
Ranges Shown Below According To District Size?
4/18/2008
1:14:21 PM
5
20 Was The Ratio Of Students To Total Staff Within the
Ranges Shown Below According To District Size?
4/18/2008
1:14:21 PM
5
21 Was The Total Fund Balance In The General Fund More
Than 50% And Less Than 150% Of Optimum According
To The Fund Balance And Cash Flow Calculation
Worksheet In The Annual Financial Report?
4/18/2008
1:14:21 PM
5
22 Was The Decrease In Undesignated Unreserved Fund
Balance < 20% Over Two Fiscal Years?(If 1.5 Times
Optimum Fund Balance < Total Fund Balance In General
Fund Or If Total Revenues > Operating Expenditures In
4/18/2008
1:14:21 PM
5
7
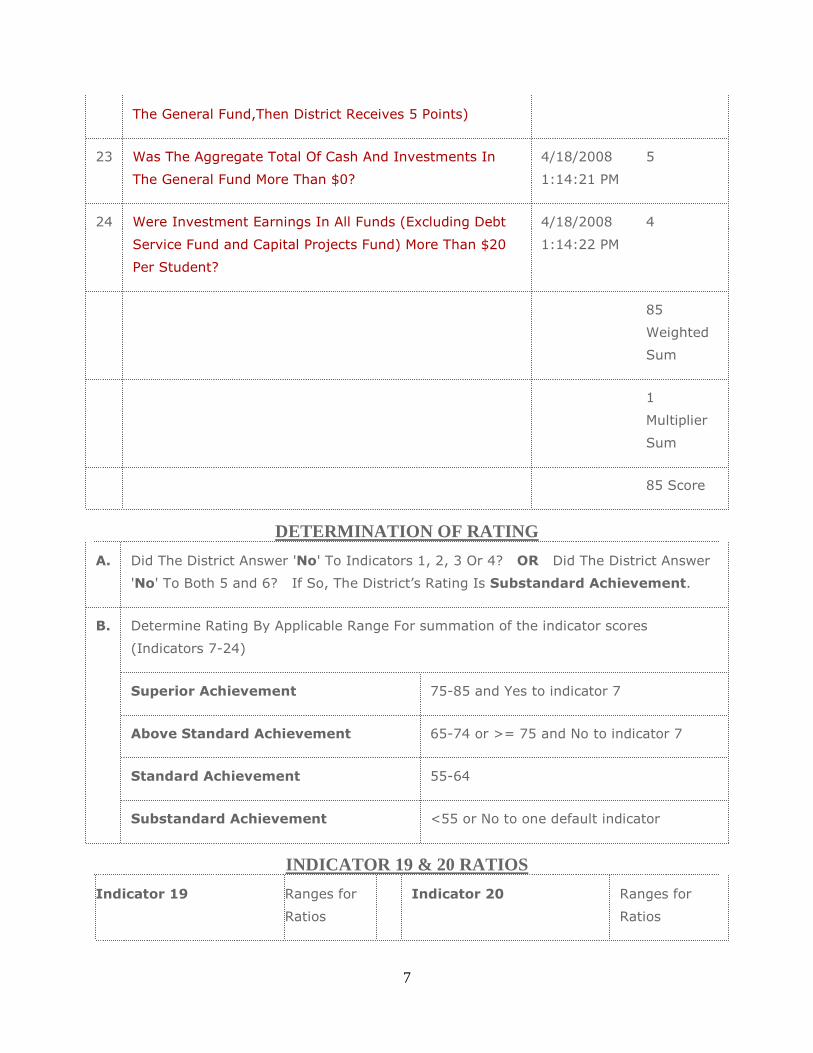
The General Fund,Then District Receives 5 Points)
23 Was The Aggregate Total Of Cash And Investments In
The General Fund More Than $0?
4/18/2008
1:14:21 PM
5
24 Were Investment Earnings In All Funds (Excluding Debt
Service Fund and Capital Projects Fund) More Than $20
Per Student?
4/18/2008
1:14:22 PM
4
85
Weighted
Sum
1
Multiplier
Sum
85 Score
DETERMINATION OF RATING
A. Did The District Answer 'No' To Indicators 1, 2, 3 Or 4? OR Did The District Answer
'No' To Both 5 and 6? If So, The District’s Rating Is Substandard Achievement.
Determine Rating By Applicable Range For summation of the indicator scores
(Indicators 7-24)
Superior Achievement 75-85 and Yes to indicator 7
Above Standard Achievement 65-74 or >= 75 and No to indicator 7
Standard Achievement 55-64
B.
Substandard Achievement <55 or No to one default indicator
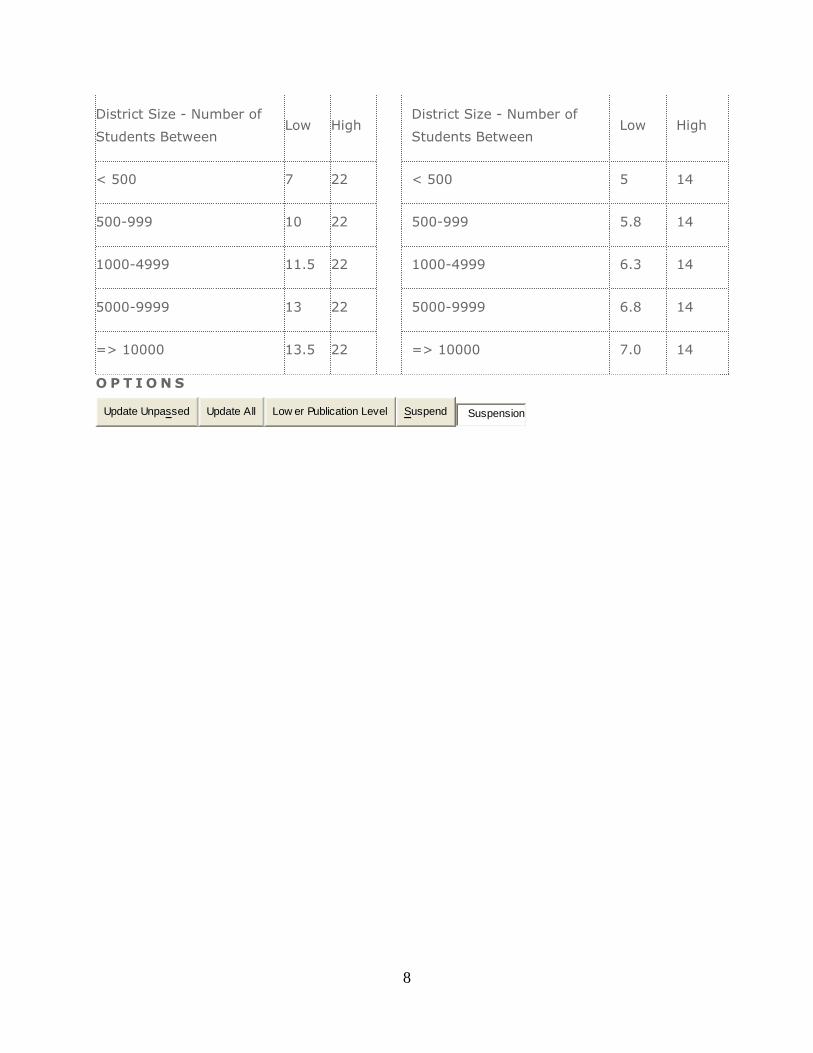
INDICATOR 19 & 20 RATIOS
Indicator 19 Ranges for
Ratios
Indicator 20 Ranges for
Ratios
8
District Size - Number of
Students Between Low High
District Size - Number of
Students Between Low High
< 500 7 22 < 500 5 14
500-999 10 22 500-999 5.8 14
1000-4999 11.5 22 1000-4999 6.3 14
5000-9999 13 22 5000-9999 6.8 14
=> 10000 13.5 22
=> 10000 7.0 14
O P T I O N S
Update Unpassed Update All Low er Publication Level Suspend Suspension
9
Overview of the Worksheet Criteria
Critical Indicators Criteria #1 through #6 are the critical indicators. Any “NO” response in this category is a signal indicator of fiscal distress. These six criteria revolve around the audit report, fund balance, the auditor’s findings and a new indicator for the total unrestricted net asset balance. If General Fund Balance and total unrestricted net asset balance is greater than zero and the auditors issue a “clean” opinion, a District will pass the critical indicators. For the 2006-07 fiscal year, Mansfield ISD had a General Fund Balance of $64,366,403 million, a Total Unrestricted Net Asset Balance of $67,645,616 million and passed all other critical indicator criteria.
Academic Rating Criteria #7 concern academic rating. A district must have a rating above academically unacceptable to be in the Superior Achievement category and a numeric score 75-85. A numeric score of 65-74 and a “No” on this indicator will receive Above Standard Achievement. Mansfield ISD has a rating of academically acceptable and we received a numeric score of 85.
Fiscal Performance
Criteria #8 through #17 concern fiscal performance. Mansfield ISD’s percentage of tax collections easily exceeds the new minimum standard of 98% over a three year average. For the year under review, taxes were collected at a three year average rate of 101.60 the prior year was 101.28%. The District is essentially exempt from Criterion #10 due to its percentage change in students over five years of 46.28% is greater than 2% and the property taxes collected of $691,054 per penny of tax effort is greater than $200,000. Criteria #11 and #12 are very similar to the Critical Indicators and Mansfield easily passed these two on audit and full financial accreditation status. Items #13 through #17 concerns budgeting, management and cash flow practices. The District budgets slightly more than 61.22% of its operating expenditures for direct classroom instruction, easily exceeding the 55% requirement. This criteria will increase over the next two years until it reaches a required 65%. The District adequately funds its budget and capital projects. Most importantly, as addressed in Criterion #16, the District does not spend cash it cannot afford to spend or cannot recognize as revenue.
Staffing Patterns Items #18 through #20 address staffing patterns. For the 2006-07 year, the District’s administrative cost ratio was well below that of the State standard of 11.05% at 5.07%. This item is addressed in more detail later in the report. Items #19 and #20 deals with staffing
10
patterns, specifically students to classroom teachers and students to total staff. A District must fall into a certain range to meet these criteria, which means understaffing or overstaffing can trigger a “NO” response. The District falls safely within the prescribed ranges for each criterion at 16.2854 students per classroom teacher and 8.8019 students per employee for 2006-07 compared to 16.5179 and 8.8578 for 2005-06 respectively.
Cash Management Practices
The final four criteria deal with cash management practices. #21 concerns the fund balance figure and whether it is too high or low. Mansfield’s General Fund Balance for the 2005-06 year was $43,330,149 and $64,366,403 for 2006-07 which falls well within the range for the TEA-Calculated optimum fund balance, so we easily meet this criterion. Item #22 deals with any decrease in General Fund Balance over two years. Since our fund balance increased, the District met this criteria easily also. Cash and Investments were greater than $0, so Criterion #23 was easily surpassed, and investment earnings were approximately $164.51 per student, easily exceeding the minimum standard of $20 per student as set forth in Criterion #24.
Other Data Concerning the District’s Financial Operations
The purpose of this section of the report is to discuss other aspects of our business operations not covered by the worksheet, but suggested by law as items of significance meriting discussion. We should view the worksheet as a good basic tool with which to assess our primary business practices. However, we should not stop there! We should always be working towards improvement in all aspects of our operation to maximize funds available to campuses for educational purposes and to our ancillary departments that support our campuses. Briefly, we review a number of business practices not covered by the Financial Accountability Worksheet directly.
Financial Strength The state of Texas recommends we discuss financial strength in this report. This is a difficult topic to address because there are many measures of financial strength, some are better than others, and it’s hard to tell which one is the best measure. For Mansfield ISD, we believe the most significant financial indicator of strength is our ability to meet our cash flow needs from September to December each year without borrowing money. In the past thirteen years, we have not had to borrow funds for operating purposes prior to tax collection season, which tells us that we have adequate financial strength and liquidity at this time.
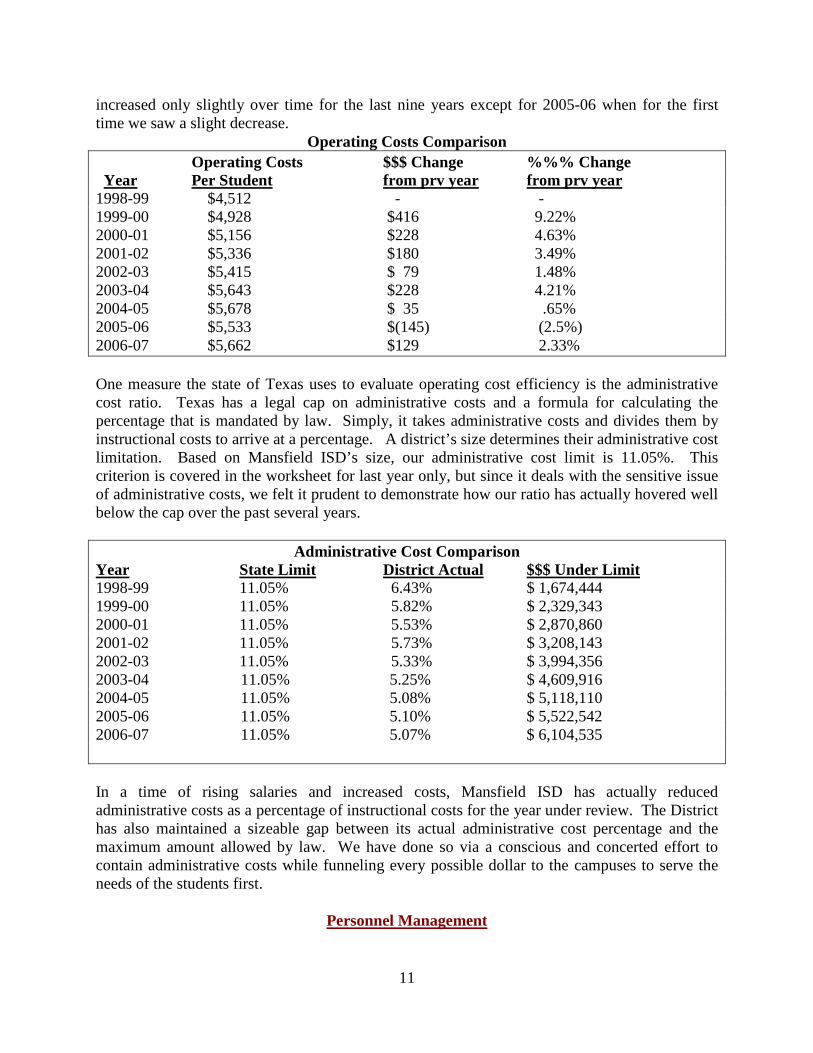
Operating Cost Management Only a small portion of our total General Fund expenditures are flexible or variable in nature. Salaries and benefits comprise the biggest expenditure each year. Utility payments fluctuate greatly from year to year, but still make up a large single expenditure. Once you remove these large expenditures from the equation, you are left with a small portion of our budget that retains some semblance of control for us. Supplies, materials, travel and training and a few contracted services comprise this remaining balance. We consider these costs to be our controllable operating costs. The chart below demonstrates how our total operating costs per student have
11
increased only slightly over time for the last nine years except for 2005-06 when for the first time we saw a slight decrease.
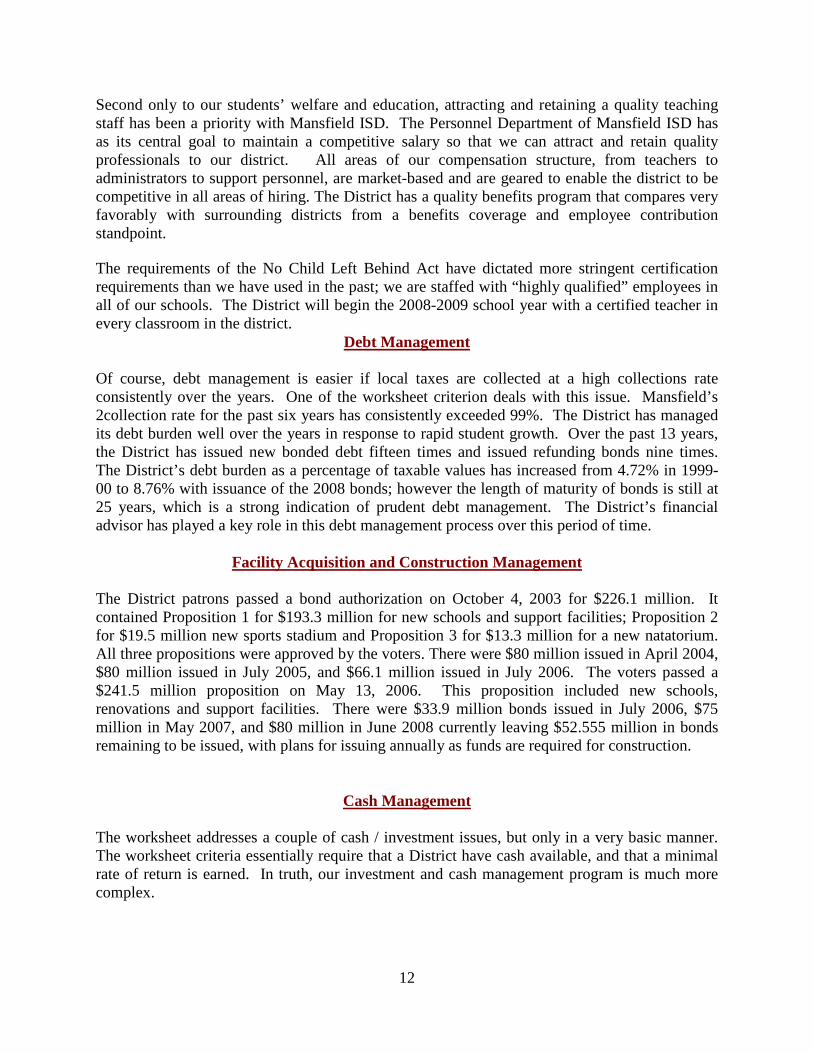
Operating Costs Comparison Operating Costs $$$ Change %%% Change Year Per Student from prv year from prv year 1998-99 $4,512 - - 1999-00 $4,928 $416 9.22% 2000-01 $5,156 $228 4.63% 2001-02 $5,336 $180 3.49% 2002-03 $5,415 $ 79 1.48% 2003-04 $5,643 $228 4.21% 2004-05 $5,678 $ 35 .65% 2005-06 $5,533 $(145) (2.5%) 2006-07 $5,662 $129 2.33% One measure the state of Texas uses to evaluate operating cost efficiency is the administrative cost ratio. Texas has a legal cap on administrative costs and a formula for calculating the percentage that is mandated by law. Simply, it takes administrative costs and divides them by instructional costs to arrive at a percentage. A district’s size determines their administrative cost limitation. Based on Mansfield ISD’s size, our administrative cost limit is 11.05%. This criterion is covered in the worksheet for last year only, but since it deals with the sensitive issue of administrative costs, we felt it prudent to demonstrate how our ratio has actually hovered well below the cap over the past several years.
Administrative Cost Comparison Year State Limit District Actual $$$ Under Limit 1998-99 11.05% 6.43% $ 1,674,444 1999-00 11.05% 5.82% $ 2,329,343 2000-01 11.05% 5.53% $ 2,870,860 2001-02 11.05% 5.73% $ 3,208,143 2002-03 11.05% 5.33% $ 3,994,356 2003-04 11.05% 5.25% $ 4,609,916 2004-05 11.05% 5.08% $ 5,118,110 2005-06 11.05% 5.10% $ 5,522,542 2006-07 11.05% 5.07% $ 6,104,535 In a time of rising salaries and increased costs, Mansfield ISD has actually reduced administrative costs as a percentage of instructional costs for the year under review. The District has also maintained a sizeable gap between its actual administrative cost percentage and the maximum amount allowed by law. We have done so via a conscious and concerted effort to contain administrative costs while funneling every possible dollar to the campuses to serve the needs of the students first.
Personnel Management
12
Second only to our students’ welfare and education, attracting and retaining a quality teaching staff has been a priority with Mansfield ISD. The Personnel Department of Mansfield ISD has as its central goal to maintain a competitive salary so that we can attract and retain quality professionals to our district. All areas of our compensation structure, from teachers to administrators to support personnel, are market-based and are geared to enable the district to be competitive in all areas of hiring. The District has a quality benefits program that compares very favorably with surrounding districts from a benefits coverage and employee contribution standpoint. The requirements of the No Child Left Behind Act have dictated more stringent certification requirements than we have used in the past; we are staffed with “highly qualified” employees in all of our schools. The District will begin the 2008-2009 school year with a certified teacher in every classroom in the district.
Debt Management Of course, debt management is easier if local taxes are collected at a high collections rate consistently over the years. One of the worksheet criterion deals with this issue. Mansfield’s 2collection rate for the past six years has consistently exceeded 99%. The District has managed its debt burden well over the years in response to rapid student growth. Over the past 13 years, the District has issued new bonded debt fifteen times and issued refunding bonds nine times. The District’s debt burden as a percentage of taxable values has increased from 4.72% in 1999-00 to 8.76% with issuance of the 2008 bonds; however the length of maturity of bonds is still at 25 years, which is a strong indication of prudent debt management. The District’s financial advisor has played a key role in this debt management process over this period of time.
Facility Acquisition and Construction Management The District patrons passed a bond authorization on October 4, 2003 for $226.1 million. It contained Proposition 1 for $193.3 million for new schools and support facilities; Proposition 2 for $19.5 million new sports stadium and Proposition 3 for $13.3 million for a new natatorium. All three propositions were approved by the voters. There were $80 million issued in April 2004, $80 million issued in July 2005, and $66.1 million issued in July 2006. The voters passed a $241.5 million proposition on May 13, 2006. This proposition included new schools, renovations and support facilities. There were $33.9 million bonds issued in July 2006, $75 million in May 2007, and $80 million in June 2008 currently leaving $52.555 million in bonds remaining to be issued, with plans for issuing annually as funds are required for construction.
Cash Management The worksheet addresses a couple of cash / investment issues, but only in a very basic manner. The worksheet criteria essentially require that a District have cash available, and that a minimal rate of return is earned. In truth, our investment and cash management program is much more complex.

13
First, we have a state and local board policy that requires us to invest funds with six objectives in mind. In order of importance, they are: safety, liquidity, diversity, yield, suitability, and marketability. Suitability, safety and liquidity are almost redundant. If a security is suitable and safe, it’s probably pretty liquid. If it’s liquid and suitable, it’s safe. State and local policy specify what types of securities we can purchase, and virtually all of them fall within these restrictions. We do not purchase securities that do not fall within our interpretation of these policy restrictions. There are a few investments that are legal for us to purchase, but they aren’t very marketable. Consequently, we don’t buy them. Bonds of the state of Israel are a good example. We strive to maintain diversity in our portfolio, balancing cash in our bank accounts with money invested in three different investment pools. To enhance the diversity of our portfolio, we directly purchase some government agency issued securities. Additionally, we benchmark our portfolio’s yield each month to the Federal Funds rate, and 90-day Treasury bill rate. We use these as a comparison only to determine if our portfolio is yielding a comparable market rate of return each month. Lastly, we perform a quarterly review of investment activity and performance, submitting these quarterly reports to the Board of Trustees for review, as required by law.
Tax Collections Criterion #8 discusses tax collections as a three year average which is a new requirement for the 2006-07 data. As important as this criterion is from year to year, we felt additional discussion was warranted. The minimum criterion for the three year average has been set at 98% compared to 96% on a year to year basis, which our District had exceeded each year for the prior eight years. For Year Total Tax
Ended Collections 1999 99.86% 2000 101.26% 2001 99.99%
2002 100.50% 2003 101.91% 2004 102.53% 2005 102.26% 2006 101.28% 2007 101.60% 3 year average
Total tax collections include delinquent collections from previous years, which is why the District can collect in total more than the current year’s levy. Mansfield ISD is continuously working with the delinquent tax attorneys to collect those taxes that are delinquent in the District.
Budgetary Planning & Financial Allocations
14
The District’s budget process begins usually in January each year. During the first month of planning, budget allocations are developed for each campus and department; a budget manual is updated for the new year and distributed to all budget managers. Most school districts have some rational basis for allocating funds to campuses and operating departments. In Mansfield ISD, we allocate funds to campuses based on their number of students in attendance. Support departments get funds based on previous year’s budgets adjusted (up or down) for future years’ needs. In March, we begin attempting to calculate state and local tax revenues and the budget starts to take on some form. June is the month we are first able to give the Board and the public a preliminary view of how the next year’s budget looks. In odd-numbered years, the legislature is in session, and that complicates and delays our budgeting process. Summer is busy fine-tuning the budget and finalizing revenue estimates in time for August adoption by the Board of Trustees. Our budget process is a proactive and highly participatory one, and campuses and departments are given a great deal of discretion as to how to budget their funds. After the budget is adopted, each campus or department is given equal latitude regarding amending their budget when their plans or needs change. This decentralized style of budget management is required by the state of Texas to a certain degree. We call it site-based decision making. It’s our version of campus empowerment. Most importantly, it is a system that works best in the long run for all of us by allocating resources where they are needed, even when those needs change.
Other Issues The District is always looking for new and innovative ways to improve our overall business management practices. Occasionally we codify new ideas into formal Board goals. More often, we make changes to our practices based on what we learn from our school business peers, who struggle daily with many of the same issues as us. The Texas Association of School Business Officials (TASBO) has provided many of our learning opportunities through various workshops, clinics and conferences during the year. Our external auditors also provide us with an annual check-up on our practices and procedures, suggesting improvements during the course of their audit procedure. For a number of years now, Texas has been a leader in data management, collection and quality of comparability. Texas’ Public Education Information Management System (PEIMS) is far ahead of other state’s data collection and comparability modules for financial, student, staffing, attendance and academic achievement data. The quality of the financial data collected in PEIMS has taken on a new significance now that it is incorporated into one of the FIRST criteria, covered earlier in the report. Financial data submitted via the PEIMS system must closely match that in the audit report in order to satisfy the requirement in criterion #9. We will continue to pay close attention to our data submissions in recognition of the importance of this state requirement.

15
Summary Although it is difficult to find fault with the top ranking on this important ratings worksheet, we know we always have some room for improvement. We will continually seek improvement in our practices and procedures. We will adapt to changing circumstances and strive to overcome obstacles in pursuit of our mission – maximizing educational opportunities for all students. The Mansfield ISD School Board, administration and the community have worked hard to maintain and improve the financial position and condition of the District over the past 13 years, despite the continued rapid student growth. This report demonstrates our commitment to all concerned.
EDUCATION CODEEDUCATION CODEEDUCATION CODEEDUCATION CODE
SUBTITLE H. PUBLIC SCHOOL SYSTEM ACCOUNTABILITYSUBTITLE H. PUBLIC SCHOOL SYSTEM ACCOUNTABILITYSUBTITLE H. PUBLIC SCHOOL SYSTEM ACCOUNTABILITYSUBTITLE H. PUBLIC SCHOOL SYSTEM ACCOUNTABILITY
CHAPTER 39. PUBLIC SCHOOL SYSTEM ACCOUNTABILITYCHAPTER 39. PUBLIC SCHOOL SYSTEM ACCOUNTABILITYCHAPTER 39. PUBLIC SCHOOL SYSTEM ACCOUNTABILITYCHAPTER 39. PUBLIC SCHOOL SYSTEM ACCOUNTABILITY
SUBCHAPTER I. FINANCIAL ACCOUNTABILITYSUBCHAPTER I. FINANCIAL ACCOUNTABILITYSUBCHAPTER I. FINANCIAL ACCOUNTABILITYSUBCHAPTER I. FINANCIAL ACCOUNTABILITY § 39.201. DEFINITIONS. In this subchapter:
(1) "Parent" includes a guardian or other person having lawful control of a student. (2) "System" means the financial accountability rating system. Added by Acts 2001, 77th Leg., ch. 914, § 1, eff. Sept. 1, 2001. § 39.202. DEVELOPMENT AND IMPLEMENTATION. (a) The commissioner shall, in
consultation with the comptroller, develop and implement a financial accountability rating system for school districts in this state. (b) The system must include uniform indicators adopted by the commissioner by which to measure a district's financial management performance. Added by Acts 2001, 77th Leg., ch. 914, § 1, eff. Sept. 1, 2001.
§ 39.203. REPORTING. (a) The commissioner shall develop, as part of the system, a reporting procedure under which: (1) each school district is required to prepare and distribute an annual financial management each school district is required to prepare and distribute an annual financial management each school district is required to prepare and distribute an annual financial management each school district is required to prepare and distribute an annual financial management reportreportreportreport; and (2) the public is provided an opportunity to comment on the report at a hearing.the public is provided an opportunity to comment on the report at a hearing.the public is provided an opportunity to comment on the report at a hearing.the public is provided an opportunity to comment on the report at a hearing. (b) The annual financial management The annual financial management The annual financial management The annual financial management report must includereport must includereport must includereport must include:::: (1) a description of the district's financial management performance based on a a description of the district's financial management performance based on a a description of the district's financial management performance based on a a description of the district's financial management performance based on a comparison, provided by the agency, of the district's performance on the indicatorscomparison, provided by the agency, of the district's performance on the indicatorscomparison, provided by the agency, of the district's performance on the indicatorscomparison, provided by the agency, of the district's performance on the indicators adopted
16
under Section 39.202(b) to: (A) state-established standards; and (B) the district's previous performance on the indicators; and
(2) any descriptive information required by the commissioner. (c) The report may include:The report may include:The report may include:The report may include: (1) information concerning the district's: (A) financial allocations; (B) tax collections; (C) financial strength;
(D) operating cost management; (E) personnel management; (F) debt management; (G) facility acquisition and construction management; (H) cash management;
(I) budgetary planning; (J) overall business management; (K) compliance with rules; and (L) data quality; and (2) any other information the board of trustees determines to be necessary or usefulany other information the board of trustees determines to be necessary or usefulany other information the board of trustees determines to be necessary or usefulany other information the board of trustees determines to be necessary or useful. (d) The board of trustees of each school districThe board of trustees of each school districThe board of trustees of each school districThe board of trustees of each school district shall hold a public hearing on the report.t shall hold a public hearing on the report.t shall hold a public hearing on the report.t shall hold a public hearing on the report. The
board shall give notice of the hearing to owners of real property in the district and to parents of district students. In addition to other notice required by law, notice of the hearing must be provided: (1) to a newspaper of general circulation in the district; and (2) through electronic mail to media serving the district. (e) After the hearing, the report shall be disseminated in the district in the manner prescribed
by the commissioner. Added by Acts 2001, 77th Leg., ch. 914, § 1, eff. Sept. 1, 2001.
philtr
Text Box
EXHIBIT 1

MANSFIELD INDEPENDENT SCHOOL DISTRICTSummary Schedule of Total Reimbursements Received by Superintendent and Each Board Member
For Twelve-Month Period Ended August 31, 2007
Exhibit 2
For the Twelve- Month Period ended August 31, 2007Description of Reimbursements
Vernon Newsom Superintendent
Dan Phillips
Gale Moericke
Sandra Vatthauer
Mike Leasor
Terry Moore
Beth Light
Michael Evans Joy Keller
Meals $704.37 $3.00 $0.00 $36.00 $0.00 $0.00 $0.00 $0.00 $0.00Lodging 3,956.95 209.32 286.38 281.61 0.00 0.00 0.00 0.00 0.00Transportation 2,170.20 202.50 202.50 216.26 0.00 0.00 0.00 0.00 0.00Registration 1,660.00 535.00 710.00 725.00 285.00 600.00 285.00 300.00 0.00Other 2,342.00 108.30 160.00 182.00 59.00 134.00 57.00 75.00 57.00Total $10,833.52 $1,058.12 $1,358.88 $1,440.87 $344.00 $734.00 $342.00 $375.00 $57.00
Note - The schedule above reflects total reimbursements paid to and expenditures paid on behalf of the Superintendent and each Board member.The expenditures were incurred for travel and other functions directly related to official school district business.
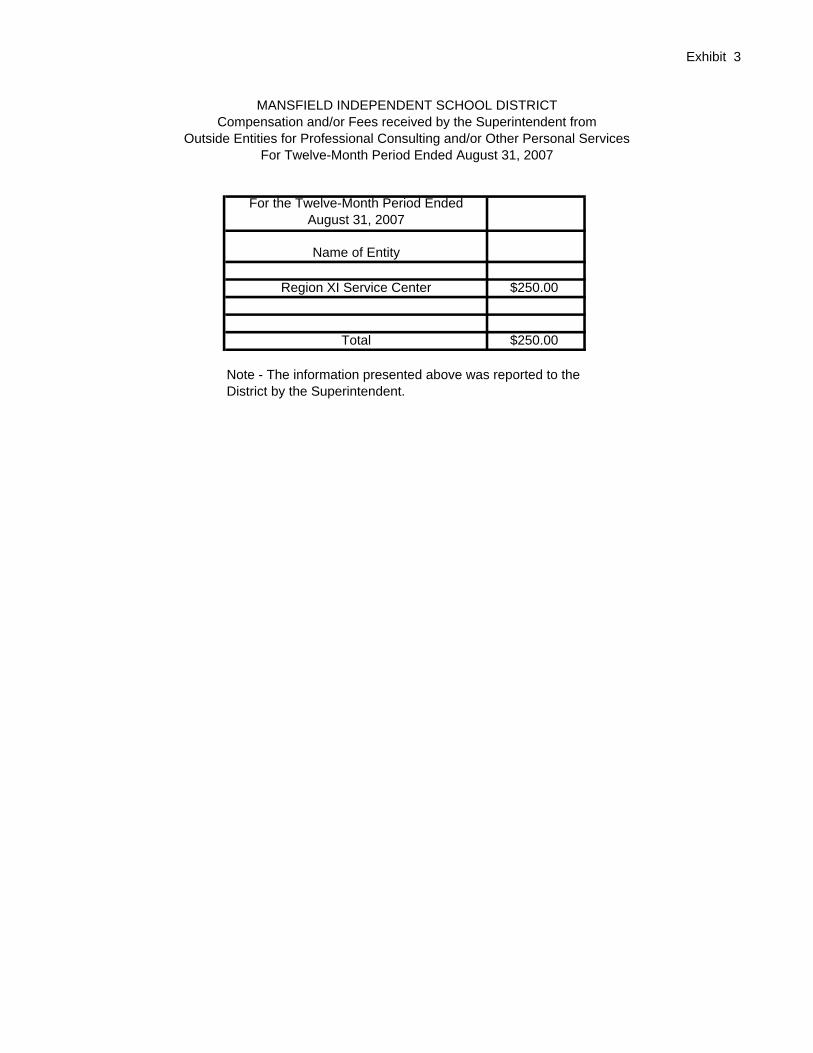
MANSFIELD INDEPENDENT SCHOOL DISTRICTCompensation and/or Fees received by the Superintendent from
Outside Entities for Professional Consulting and/or Other Personal ServicesFor Twelve-Month Period Ended August 31, 2007
Exhibit 3
For the Twelve-Month Period Ended August 31, 2007
Name of Entity
Region XI Service Center $250.00
Total $250.00
Note - The information presented above was reported to the District by the Superintendent.
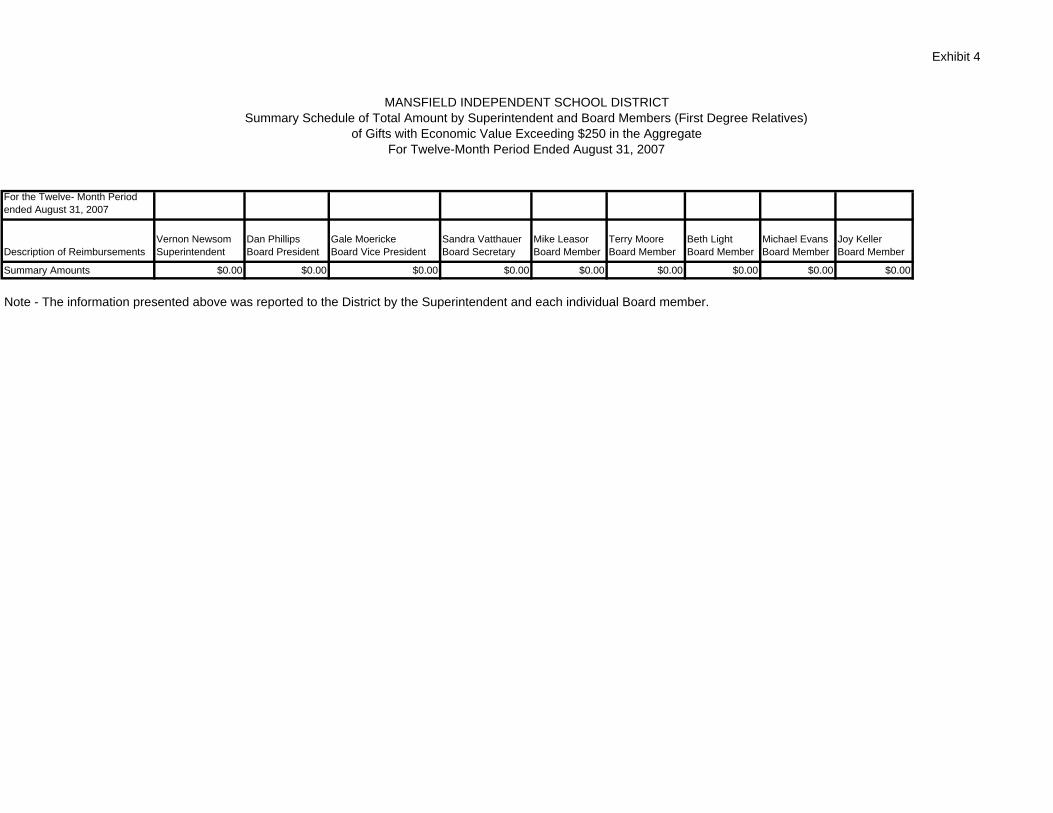
MANSFIELD INDEPENDENT SCHOOL DISTRICTSummary Schedule of Total Amount by Superintendent and Board Members (First Degree Relatives)
of Gifts with Economic Value Exceeding $250 in the AggregateFor Twelve-Month Period Ended August 31, 2007
Exhibit 4
For the Twelve- Month Period ended August 31, 2007
Description of ReimbursementsVernon Newsom Superintendent
Dan Phillips Board President
Gale Moericke Board Vice President
Sandra Vatthauer Board Secretary
Mike Leasor Board Member
Terry Moore Board Member
Beth Light Board Member
Michael Evans Board Member
Joy Keller Board Member
Summary Amounts $0.00 $0.00 $0.00 $0.00 $0.00 $0.00 $0.00 $0.00 $0.00
Note - The information presented above was reported to the District by the Superintendent and each individual Board member.
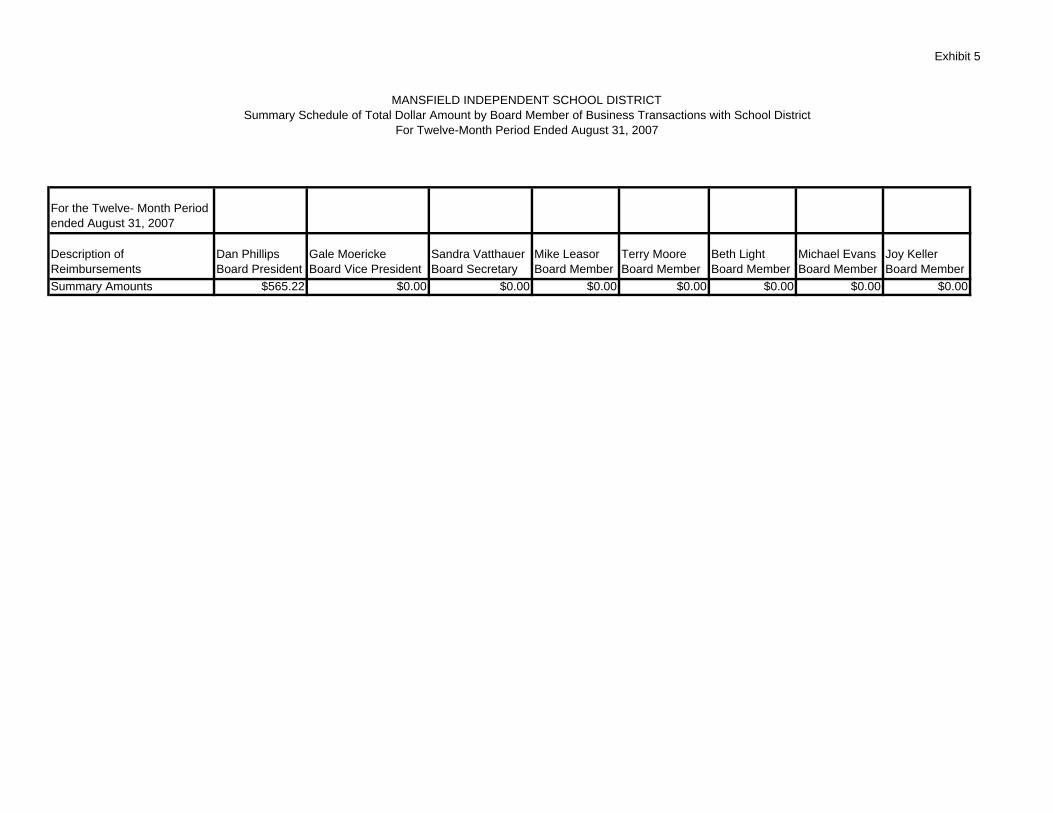
MANSFIELD INDEPENDENT SCHOOL DISTRICTSummary Schedule of Total Dollar Amount by Board Member of Business Transactions with School District
For Twelve-Month Period Ended August 31, 2007
Exhibit 5
For the Twelve- Month Period ended August 31, 2007
Description of Reimbursements
Dan Phillips Board President
Gale Moericke Board Vice President
Sandra Vatthauer Board Secretary
Mike Leasor Board Member
Terry Moore Board Member
Beth Light Board Member
Michael Evans Board Member
Joy Keller Board Member
Summary Amounts $565.22 $0.00 $0.00 $0.00 $0.00 $0.00 $0.00 $0.00
Related Documents