ISBN Number: 978-979-8575-05-1 P P P R R R O O O C C C E E E E E E D D D I I I N N N G G G T T T H H H E E E 2 2 2 n n n d d d I I I N N N T T T E E E R R R N N N A A A T T T I I I O O O N N N A A A L L L C C C O O O N N N F F F E E E R R R E E E N N N C C C E E E O O O N N N O O O P P P T T T I I I C C C S S S A A A N N N D D D L L L A A A S S S E E E R R R A A A P P P P P P L L L I I I C C C A A A T T T I I I O O O N N N S S S I I C C O O L L A A ’ ’ 0 0 7 7 Yogyakarta, INDONESIA September 5-7, 2007 Organized by: The Study Program on Opto-Electrotechniques and Laser Applications Dept. of Electrical Engineering, University of Indonesia Indonesia Section

Welcome message from author
This document is posted to help you gain knowledge. Please leave a comment to let me know what you think about it! Share it to your friends and learn new things together.
Transcript

ISBN Number: 978-979-8575-05-1
PPPRRROOOCCCEEEEEEDDDIIINNNGGG
TTTHHHEEE 222nnnddd IIINNNTTTEEERRRNNNAAATTTIIIOOONNNAAALLL CCCOOONNNFFFEEERRREEENNNCCCEEE OOONNN OOOPPPTTTIIICCCSSS AAANNNDDD LLLAAASSSEEERRR AAAPPPPPPLLLIIICCCAAATTTIIIOOONNNSSS
IICCOOLLAA’’0077
Yogyakarta, INDONESIA September 5-7, 2007
Organized by:
The Study Program on Opto-Electrotechniques and Laser Applications
Dept. of Electrical Engineering, University of Indonesia
Indonesia Section

© PS-OEAL The Study Program on Opto-Electrotechniques and Laser Applications
Dept. of Electrical Engineering, University of Indonesia
All right reserved. No part of this publication may be reproduced, stored in a retrieval system, or transmitted in any form or by any means, electronics, mechanical, photocopying, recording or otherwise, without the prior permission ot the copyright owner.
PS-OEAL, Dept of Electrical Engineering, University of Indonesia Jl. Salemba Raya 4, Jakarta Pusat 10430, Indonesia
Phone (62) 21 330188, Fax. (62) 21 391115, Email: [email protected] http://opto.eng.ui.ac.id
ii

Preface Dear the ICOLA 2007 Participants On behalf of the Committee of International Conference on Optics and Laser Applications, ICOLA’07 allow me to express my gratitude to all of you, who participate in this conference. The Study Program on Opto-Electrotechniques and Laser Applications, Dept. Electrical Engineering, University of Indonesia organizes this conference in conjunction with the 30th anniversary of the study program. The ICOLA’07 is technically supported by the International Commission for Optics (ICO), International Society for Optical Engineering (SPIE), and the Abdul Salam International Center for Theoretical Physics (ICTP), in cooperation with other professional society like: HFI, HAI, IEEE Indonesia Section, etc. We would like to warmly welcome the participants from USA, Japan, South Korea, P.R. China, Taiwan, Thailand, Singapore, Malaysia, Bangladesh, India, Iran, Yemen, Algiers, Moldova, Ukraine, the Netherlands, etc., especially the distinguished professors from the well known and recognized institutions as invited speakers. The time of conference is remarked by a significant progress in science and technology, especially in the field opto-electronics and laser applications. Although our country is facing with political and economical problems, in fact, there are still some researchers, young engineers, students --who are working in their own fields-- wishing to present their works in this conference. We received around 81 extended abstracts (invited, overseas, and domestic) but only about 55 selected or reviewed papers will be presented in the conference. These are divided into three categories:
A: Nanotechnology, Biomedical Optics, and Optical Communication B: General Optics, Holography, and Laser Technology C: Photonic Devices/Materials, Design, and Applications
We would like to thank to all Committee members, to all organizations and sponsors who have provided their supports and efforts to make this conference become a success. In addition, thanks also are forwarded to all individuals for their valuable time and supports to the conference. Finally, have intensive discussions in the conference and enjoyable stay in Yogyakarta ! Prof. Dr. Sar Sardy General Chairman of ICOLA2007
iii

ICOLA2007 Committee Members
Organizer The Study Program on Opto-electrotechnique and Laser Applications (OEAL)
Department of Electrical Engineering, Faculty of Engineering, University of Indonesia
Sponsor (technical) ICO, SPIE, ICTP, IEEE Indonesia Section, Indonesian Physical Society, Indonesian Astronomical Society
International Program Committee Prof. Dr. Suganda Jutamulia, Chair, Univ. of Nothern California, USA
Prof. Dr. Yashuhiru Suematsu, The Past President Tokyo Institute of Technology Prof. Dr. Jumpei Tsujiuchi, Prof. Emeritus Tokyo Institute of Technology
Prof. Dr. Toshimitsu Asakura, Prof. Emeritus Hokkaido University Prof. Dr. Guoguang Mu, Nankai University, China
Prof. Dr. Lambertus Hesselink, Stanford Univ. USA Prof. Dr. Mohammad S. Alam, Univ. of South Alabama, USA
Prof. Dr. Francis Yu, Pennsylvania State University, USA Prof. Dr. Cardinal Warde, Massachusetts Inst. Tech. USA
Prof. Dr. Pochi Yeh, Univ. of California Santa Barbara, USA Prof. Dr. Alexander Sawchuck, SIPI, Univ. of Southern California, USA
Prof. Dr. Kehar Singh, Indian Inst. Tech. Delhi, India Prof. Dr. Rene Dandliker, President SATW, Switzerland
Prof. Dr. Gallieno Denardo, ICTP, Trieste, Italy Prof. Dr. Min Gu, Swinburne Univ. of Technology, Australia Prof. Dr. Arthur Chiou, National Yang Ming Univ., Taiwan
Prof. Dr. Joewono Widjaja, Suranaree Univ. of Technology, Thailand Prof. Dr. Anand Krishna Asundi, Nanyang Technological Univ. Singapore
Prof. Dr. Yoshizumi Yasuda, Tokyo University for Information Science, Japan Prof. Dr. Yoshihisa Aizu, Muroran Inst. Tech. Japan
Prof. Dr. Byoung Yoon Kim, Novera Optics, KT Second Research Center, South Korea Prof. Dr. Feijun Song, China Daiheng Coorp., P.R. China
Prof. Dr. Kazuhiko Ohnuma , Chiba University, Japan Prof. Dr. A.N. Chumakov, National Academy of Science, Belarus
Dr. Yoshiji Suzuki, Hamamatsu Photonics KK, Japan
Advisory Committee Prof. Dr. Rinaldy Dalimi, Chair, Dean Fac. of Engineering, University of Indonesia
Prof. Dr. Eko Tjipto Rahardjo, University of Indonesia Prof. Dr. Bambang Hidayat, Chairman Indonesian Academy of Science
Prof. Dr. Zuhal, President Indonesian Al-Azhar University Prof. Dr. Budi Santoso, Indonesian Atomic Energy Agency
Prof. Dr. Tjia May On, Bandung Institute of Technology
General Chairman Sar Sardy, Professor, Head of OEAL-FTUI, Univ. of Indonesia
Technical Program Committee
Dr. Gunawan Witjaksono, Chair, University of Indonesia Prof. Dr. Dadang Gunawan, IEEE-Indonesia Section
iv

Prof. Dr. Anung Kusnowo, Indonesian Institute of Science Dr. Ary Syahriar, Indonesian Al-Azhar University
Dr. Henri Putra Uranus, University of Twente, the Netherlands Dr. Ir. Sekartedjo, Sepuluh Nopember Institute of Technology
Dr. Hendrik Kurniawan, University of Indonesia Prof. Dr. Masbach R. Siregar, Indonesian Physical Society
Dr. Hakim L. Malasan, Indonesian Astronomical Society
Local Organizing Committe Dr. Ir. Purnomo Sidi Priambodo, MSEE, Chair, University of Indonesia
Dr. Ir. Dodi Sudiana, MEng, University of Indonesia Dr. Ir. Retno Wigajatri MEng, University of Indonesia Dr. Abdul Muis, ST. MEng, University of Indonesia Dr. Ir. Feri Yusivar, MEng, University of Indonesia Fitri Yuli Zulkifli, ST. MSc, University of Indonesia
Arief Udhiarto, ST. MT, University of Indonesia Budi Sudiarto, ST. MT, University of Indonesia
Muhammad Suryanegara, ST. MSc, University of Indonesia F. Ashta Ekadiyanto, ST. MSc, University of Indonesia
Aji Nur Widyanto, ST, University of Indonesia
v
CONTENT
Invited-Planery Papers
Scientists and Their Society: Between Advocacy and Arbitration Bambang Hidayat
1
Angular Division Multiplexing in Pulsed Digital Holography for Recordings of High Resolution
Hongchen Zhai, Xiaolei Wang, CaojinYuan and Guoguang Mu
7
Design and analysis for laser beaming devices using surface plasmon resonance
Byoungho Lee, Hwi Kim, and Seyoon Kim
12
Phase Singularity Distribution of Fractal Speckles Jun Uozumi
17
Laser Aided Golf Trainer – Product and Business Development Suganda Jutamulia
22
Quality of Images Reconstructed from In-Line Fresnel Holograms Joewono Widjaja and Phacharawadee Raweng
25
Three-dimensional computer-generated holographic display of biological tissue
Toyohiko Yatagai�, Yusuke Sando��, Ken-ichi Miura�� and Masahide Itoh��
30
Application of VIS-NIR Spectral Imaging to Skin Tissue Measurements
Yoshihisa Aizu, Takaaki Maeda, and Izumi Nishidate
34
On-demand optical tweezers by time-division multiplexing of computer-generated holograms
Toshiaki IWAI and Johtaro YAMAMOTO
39
Digital holography a new paradigm for imaging, microscopy and measurement
Anand Asundi and Vijay Raj Singh
43
Encrypted Content-addressable Holographic Memories Kehar Singh, Renu John, and Joby Joseph
48
vi

Three-Dimensional Microscopic Imaging Colin J.R. Sheppard
53
Contributed Papers : Overseas
Enhancing the Performance of Integrated Optical Sensor by Slow-light: Theoretical Study on Ring-Resonator Based Structures
Henri P. Uranus, and Hugo J. W. M. Hoekstra
56
Electro-Optical Studies Of Chemically Deposited Znxcd1-X Nanocrystalline Films
Shashi Bhushan and Ayush Khare
61
Compact Optical Sensor for Soil Nutrients Analysis by using LEDs Masayuki Yokota
66
Precision Dynamic Force Measurement Using Mass Levitation and Optical Interferometer
Yusaku FUJII
70
Optical properties of vanadium doped ZnTe thin cermet films for selective surface applications
M. S. Hossain, R. Islam and K. A. Khan
74
Improved 90° Bend Transmission Defined in a Triangular Lattice Photo nic Crystals
Leila DEKKICHE, and Rafah NAOUM
79
Dual Ball Lenses for Relaxed Alignment Tolerances in Pigtailing of a Laser Diode Transmitter
Mohamed Fadhali, Saktioto,Jasman Zainal, Yusof Munajat, Jalil Ali and Rosly Abdul Rahman
83
Normalized Frequency Gradient of Coupled Fibers as a Function of Coupling Ratio
Saktioto, Jalil Ali, Jasman Zainal, Mohamed Fadhali
88
Experimental studies on the short wave transmission characteristics of a laser protection filter coating used in the laser optical systems
Nimmagadda Rama Murthy, and A.S. Murthy
93
Two-Photon Lasing Controlled by Resonator Losses Vitalie Eremeev, Marina Turcan, Nicolae Enaki
98
Incoherent Light Depolarization by Multiple Reflections Yaroslav Aulin
103
vii

Influence of Filters on Recognition of Noisy Objects Seyed Mohsen Mirsadri, Hosein Bolandi, Farhad Fani Saberi
107
Design and Development of Holographic Sighting System used for small arm weapons in Close Quarter Battle situations
Nimmagadda Rama Murthy, P.Rajesh Kumar, and N. Raghavender
113
Contributed Papers : Domestic The Effects of Substitution on the Optical Properties of
poly(p-phenylenevinylene) Derivatives A. Bahtiar and C. Bubeck
117
Possible use of formaldehyde as fluorescence tracer to examine the state of mixture formation in Spark Ignited (SI) engines
A.M.T Nasution1, V. Beushausen, R. Mueller
122
The Parameter Modeling of Grating Reflector for External Cavity Tunable Lasers as light sources in DWDM System
Supriyanto
127
Surface Roughness Measurement by Electronics Speckle Pattern Interferometry (ESPI) Method
A.S. Pramono, Rakiman, D. Ardiansyah , H. Setijono
131
Generalized Linear Dispersion Relation for Symmetrical Directional-coupler of Five-layer Waveguide
Sekartedjo, and Ali Yunus Rohedi
135
Design of Multimode Interference Structure for 1x2 Optical Waveguide Filter for 1.3 and 1.55 μm
Sekartedjo, and Agus Muhamad Hatta
140
Phase Unwrapping Applied to Digital Holography D. Ardiansyah and Sekartedjo
143
Introducing Stable Modulation Technique for Solving an Inhomogeneous Bernoulli Differential Equation
Ali Yunus Rohedi
147
High Temperature Annealing effects on Silica based Optical Waveguides
Ary Syahriar
152
viii
Dr Nasution
Highlight
Dr Nasution
Highlight
Dr Nasution
Rectangle

Simple Model of Design 1.55μm and 1.31μm VCSEL’s for High Speed Modulation Optical Interconnections
Gunawan Witjaksono, Ucuk Darusalam, Gunady Haryanto, Arum Setyowati
158
Simulation GaInAsP/InP Surface Emitting Distributed Feedback Laser for Radio Over Fiber Application
Gunawan Witjaksono, Irma Saraswati
163
Optical Waveguide Directional Fiber Coupler Design Method Based on Numerical Analysis
Ucuk Darusalam, Gunady H., Arum Setyowati, Purnomo Sidi Priambodo, V. Vekky R. R
167
Gain Characteristics Analysis of Distributed Raman Amplifier on CWDM Band Based on Numerical Simulation
V. Vekky R. Repi, Ucuk Darusalam, Purnomo Sidi Priambodo
172
Design of Multimode Interference (MMI) Couplers Using Method of Lines
Helmi Adam, Ary Syahriar
177
Design of Three Parallel Waveguide Using Coupled Mode Theory and Method of Lines
Helmi Adam, Dwi Astharini, Ary Syahriar
181
Laser Micromachining of Silicon and Its Application for the Fabrication of Micro Gas Sensor Device
Goib Wiranto,Gandi Sugandi, I Dewa P. Hermida, and Edy Supriyanto
185
Edge-element based finite element analysis of leaky modes of photonic crystal microcavities
Ardhasena Sopaheluwakan
189
Measurement of the nonlinear susceptibility of the third order dielectric materials by means of Z-scan technique
Freddy Susanto Tan
193
Optical Fibre Biosensor Based on Enzymatically Doped Sol-Gel Glasses for Monitoring of Pesticides in Flow System
Bambang Kuswandi, Chulaifah Indah Fikriyah, Agus Abdul Gani and Anak Agung Istri Ratnadewi
197
Simulations of rib waveguide structure with trapezoidal cross-section using Finite Difference Method
Suwasti Broto, N. Mohd Kassim, M.H. Ibrahim
202
ix

Achieving gain flatness in C-band Erbium Doped Fiber Amplifiers
Sholeh Hadi Pramono, Sar Sardy, Ary Syahriar, Irwan R.Hc, Sasono R
207
Design and Implementation of Knowledge-Based Expert Systems GIS for Fishing Ground Prediction Models: a preliminary results
Muhamad Sadly, and Yoke Faisal
210
The Assessment of Fish Abundance by using Modis Satellite Data of SSC and SST (Case Study : In the South Kalimantan)
Suhendar I Sachoemar, Muhamad Sadly and Fanny Meliani
214
Fitting of Linear Transducer Characteristic using Genetic Algorithm and Segmented by Golden Ratio
Purwowibowo, Sar Sardy, and Wahidin Wahab
219
Visible to Near Infrared Spectrum Reflectance Ratios in Cancer Detection
Hamdani Zain, Anwar S. Ibrahim, Aryo Tedjo and Kusmardi
224
Speech Recognition for Controlling Movement of the Wheelchair Thiang
227
A Comparison of Discrete Cosine Transform and Discrete Wavelet Transform Techniques in Audio Compression
Endra
232
Face Identification with Multi-resolution Method Indra Riyanto, and Wihartini
235
Splice Loss: Estimated Value Versus OTDR Measurement Dwi Bayuwati, Tomi Budi Waluyo, Imam Mulyanto
238
The Spectral Reflectance Characteristic of Coral and Its Relation to The Optic Properties of Waters
Nurjannah Nurdin, Muhamad Sadly, Indra Jaya, Vincentius Siregar
242
Introducing “OPTO”: Portal for Optical Communities in Indonesia Tomi Budi Waluyo and Laksana Tri Handoko
245
x

Proc. of the 2nd International Conf. on Optics and Laser Applications ICOLA’07, September 5-7, Yogyakarta, Indonesia
122
Possible use of formaldehyde as fluorescence tracer to examine the state of mixture formation
in Spark Ignited (SI) engines
By: A.M.T Nasution1, V. Beushausen2, R. Mueller2
1) Photonics Engineering Laboratory, Department of Engineering Physics,
Institut Teknologi Sepuluh Nopember (ITS), Surabaya, Indonesia. Email: [email protected] 2) Optical Diagnostics Group, Laser Laboratorium Goettingen, Goettingen, Germany
Abstract– The correct state of mixture-formation
condition in spark-ignited engines will determine the combustion performance as well as the quality of emitted emission gases. Many factors, such as the amount of fuel as well as its time-of-injection, amount of supply air, piston and combustion-room’s configuration, will influence effectivity of the mixture formation process. The equivalence fuel-to-air ratio (φ) distribution is one of the quantity that is usually used to quantify the state of mixture formation inside the automotive combustion engine.
Since the detected intensity of the fluorescence is strongly influenced by quenching (loss of detectable signal by non-radiative deactivation process), it will consequently result an improper determination of the mixture-formation state. Temperature is one of the primary contributors of the quenching effects.
In this paper, a measurement strategy is proposed, i.e. temperature measurement using two-line formaldehyde thermometry which is done simultaneously with intensity measurement for fuel/air – ratio determination. A calibration set of formaldehyde fluorescence intensities against fuel/air – ratio values (0.6 ≤ φ ≤ 1.2) are done at temperatures of 120 – 200 °C, which reflects ones of pre-ignition stage in which the mixture-formation process being accomplished.
It is demonstrated that the increasing temperature will reduce the intensity of the fluorescence at certain φ value . Measuring temperature distribution, it can be used to correct the detected intensity, which is used for the fuel/air ratio distribution determination.
This measurement strategy would be useful in the field of engine development process. Keywords– mixture formation, fuel-air ratio, Laser Induced
Fluorescence, formaldehyde
I. INTRODUCTION
aser Induced Fluorescence (LIF) using tracer is now already extensively used as an accurate diagnostic tool
in combustion engine development. Several tracer materials, which is suitable for certain diagnostic application, have already being widely used for this purpose. Recognizing spectroscopic properties of the tracer as well as the behavior of these properties against environmental conditions, the respective physical variables can then be inferred from the fluorescence intensity measurement. Extensive review on this theme can be found in [1]. Measurement of the state of mixture-formation inside a spark ignition engine is important in order to get an insight into the correctness of pre-combustion process. The distribution of fuel-air ratio (φ) across the combustion room is usually being used for quantifying this state. An LIF based measurement method, known as Fuel Air Ratio Laser Induced Fluorescence (FARLIF), is already widely implemented for this purpose. One prominent problem of measurement based on fluorescence intensity detection is due to quenching, i.e. loss of detectable signal by non-radiative deactivation process. Temperature is considered to be one of the primary contributors for this process. It is important to quantify the temperature distribution, for recovering the loss of detectable signal, in order to get a more accurate measurement. Formaldehyde is considered to be potential fluores-cence tracer material for the above purpose. It is advantageous characteristics, i.e. solvable to be mixed into transparent fuel isooctane and has a low boiling temperature. Possibility to simultaneously measure the distribution of temperature and fuel-air ratio (φ) is assessed in this work.
II. BASIC THEORY 2.1 Laser Induced Fluorescence (LIF) LIF signals come from emission of radiation that accompany the decay from upper high energy quantum states to the quantum states with lower energy.
L

Proc. of the 2nd International Conf. on Optics and Laser Applications ICOLA’07, September 5-7, Yogyakarta, Indonesia
123
It is generated by first populating upper energy states of fluorescing molecules, using a laser source with the emission frequency being tuned to the optically allowed resonance between the ground state and discrete excited states. After excitation, this so called laser-populated upper-state may undergo subsequent processes, which reflect the dynamics of the state-to-state transfer processes. Interpretation of a LIF signal in relation to specific properties of the absorbing species ( like concentration and temperature) is achieved by modelling these transfer processes. Detection is carried out by temporally integrating the decaying fluorescence signal after the laser pulse. Assuming that fluorescence is emitted equally into all direction, and only part of it that will be captured by the detector after passing through collection optics, the fluorescence signal intensity (in terms of number of photons) is given by:
2121
21121 )(
4 QAABTfnIVN mcf +
Ω= νχ
πη (1)
The η ,Ω , cV are quantities that related to efficiency of the collection optics, collection solid-angle, and collection volume, respectively. While mχ , n , and υI are mole fraction of the absorbing species, total gas number density, and laser intensity, respectively. The quantity of )(1 Tf represents the fraction of molecules that belong to the absorber species, which are in a specific electronic-vibrational-rotational energy level excited by the laser and typically given by a Boltzmann distribution. The factor
2121
21
QAA+
represents the fluorescence quantum yield, i.e. ratio
of the fluorescence emitted for the incoming excitation photon. 2.2 Formaldehyde Spectroscopy The spectroscopy of formaldehyde is already thoroughly been investigated for many years. Absorption spectrum: Its banded UV spectrum is spread from 250 nm – 550 nm, and is characterised as an electronic transition from the ground state singlet 1A to the first excited state singlet 2A . The transitions were assigned as
11
21 ~~ AXAA ← band. The spectrum has very dense
absorption peaks and is dominated by two progressions of bands that spread over the wavelength range of 270 – 360 nm. The dominant progression bands are 1
04 and 304 . The
absorption spectrum of formaldehyde is given in Figure-1. Eventhough some strong features are shown in the absorption spectrum, dissociation, which results in very small fluorescence intensity at shorter wavelengths, becomes faster at excitation wavelengths shorter than 290 nm. And due to predissociation, it makes the lowest energy of vibronically allowed one-photon transition, i.e. the band of 1
04 , to be the strongest fluorescence band. This band becomes the most favourite for diagnostics purposes [2].
Figure-1: Absorption spectrum of formaldehyde
The excitation at 355 is related to the lowest end transition of the corresponding band, i.e. lower absorption. Although it yields lower efficiency, this transition attracts strong interest. This is due to the strongly reduced interferences from other bands [3], as well as easily accessible through the use of 3rd harmonics of Nd:YAG lasers. This kind of laser is one of the most popularly used lasers in combustion diagnostic experiments, due to its practicability and superior temporal characteristics. This laser was also used throughout this work. Emission spectrum: A typical emission spectrum ( →2
1A
11A ) of formaldehyde fluorescence is shown as follow:
Figure-2: Emission spectrum of formaldehyde
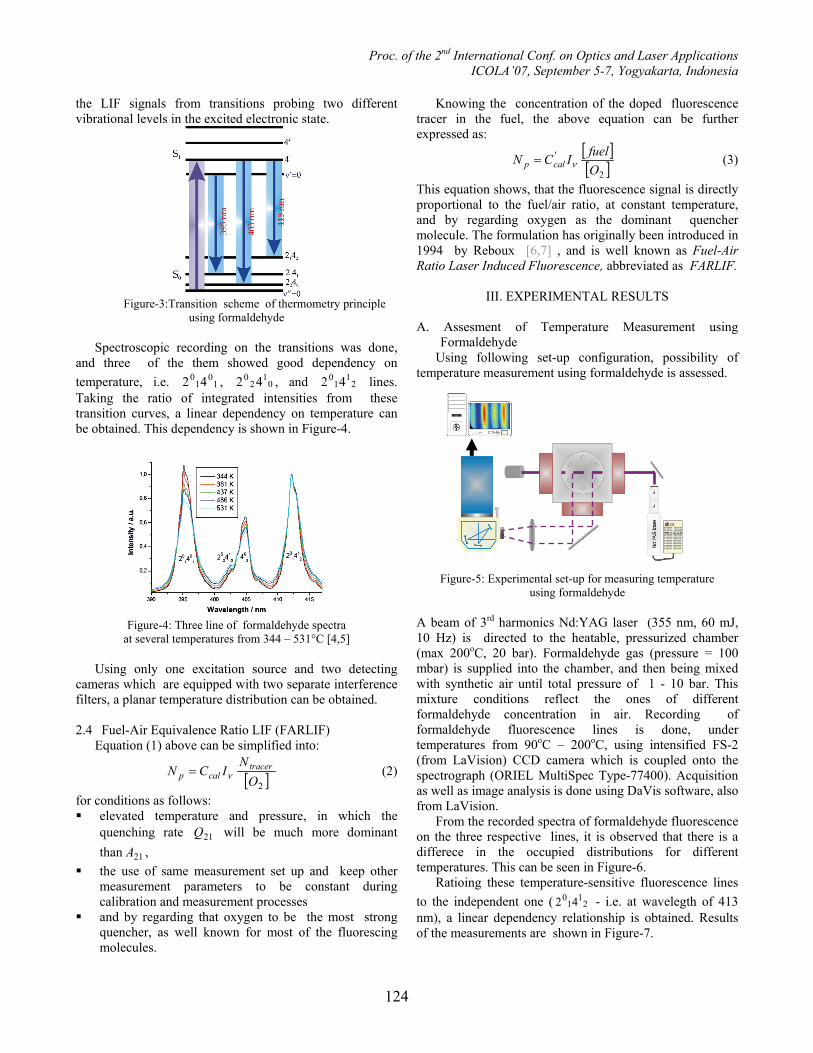
The peaks of the spectrum are labelled with respective emission transitions. 2.3 Two-line Thermometry using Formaldehyde The detection principle of the two-lines thermometry using formaldehyde is schematically shown in Figure-3. It was first proposed by Burkert and Triebel [4,5] Due to the fast relaxation, in about period of 100 ns, a thermalization of the vibrational / rotational population of the electronically excited state occurs. Thermalization is most dominated by collisions, which yield a Boltzmann distributions of the excited populations. The population distributions reflect the local gas temperature. Different gas temperatures will lead to different relative population distributions in the 04 and 14 levels. After thermalization it is possible to probe the temperature distribution by taking
Proc. of the 2nd International Conf. on Optics and Laser Applications ICOLA’07, September 5-7, Yogyakarta, Indonesia
124
the LIF signals from transitions probing two different vibrational levels in the excited electronic state.
Figure-3:Transition scheme of thermometry principle
using formaldehyde
Spectroscopic recording on the transitions was done, and three of the them showed good dependency on temperature, i.e. 1
01
0 42 , 01
20 42 , and 2
11
0 42 lines. Taking the ratio of integrated intensities from these transition curves, a linear dependency on temperature can be obtained. This dependency is shown in Figure-4.
Figure-4: Three line of formaldehyde spectra
at several temperatures from 344 – 531°C [4,5] Using only one excitation source and two detecting cameras which are equipped with two separate interference filters, a planar temperature distribution can be obtained. 2.4 Fuel-Air Equivalence Ratio LIF (FARLIF) Equation (1) above can be simplified into:
[ ]2ON
ICN tracercalp ν= (2)
for conditions as follows: elevated temperature and pressure, in which the
quenching rate 21Q will be much more dominant than 21A ,
the use of same measurement set up and keep other measurement parameters to be constant during calibration and measurement processes
and by regarding that oxygen to be the most strong quencher, as well known for most of the fluorescing molecules.
Knowing the concentration of the doped fluorescence tracer in the fuel, the above equation can be further expressed as:
[ ][ ]2
'
OfuelICN calp ν= (3)
This equation shows, that the fluorescence signal is directly proportional to the fuel/air ratio, at constant temperature, and by regarding oxygen as the dominant quencher molecule. The formulation has originally been introduced in 1994 by Reboux [6,7] , and is well known as Fuel-Air Ratio Laser Induced Fluorescence, abbreviated as FARLIF.
III. EXPERIMENTAL RESULTS
A. Assesment of Temperature Measurement using Formaldehyde
Using following set-up configuration, possibility of temperature measurement using formaldehyde is assessed.
Figure-5: Experimental set-up for measuring temperature
using formaldehyde
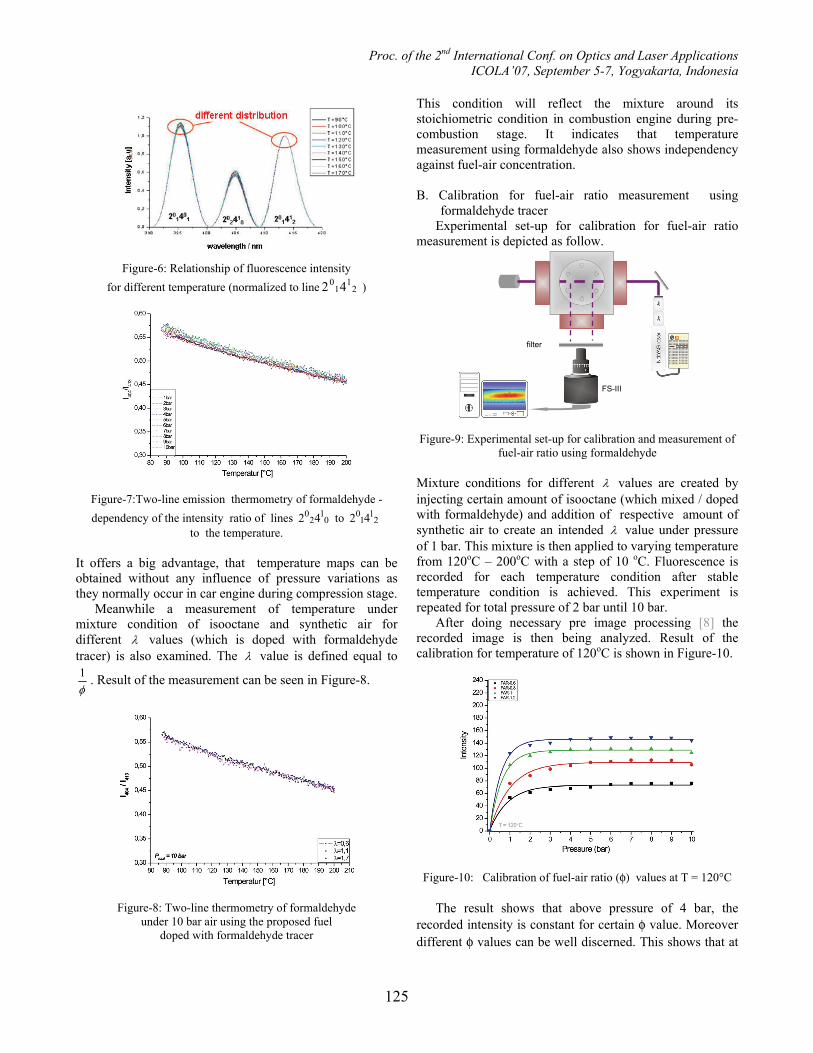
A beam of 3rd harmonics Nd:YAG laser (355 nm, 60 mJ, 10 Hz) is directed to the heatable, pressurized chamber (max 200oC, 20 bar). Formaldehyde gas (pressure = 100 mbar) is supplied into the chamber, and then being mixed with synthetic air until total pressure of 1 - 10 bar. This mixture conditions reflect the ones of different formaldehyde concentration in air. Recording of formaldehyde fluorescence lines is done, under temperatures from 90oC – 200oC, using intensified FS-2 (from LaVision) CCD camera which is coupled onto the spectrograph (ORIEL MultiSpec Type-77400). Acquisition as well as image analysis is done using DaVis software, also from LaVision. From the recorded spectra of formaldehyde fluorescence on the three respective lines, it is observed that there is a differece in the occupied distributions for different temperatures. This can be seen in Figure-6. Ratioing these temperature-sensitive fluorescence lines to the independent one ( 2
11
0 42 - i.e. at wavelegth of 413 nm), a linear dependency relationship is obtained. Results of the measurements are shown in Figure-7.
Proc. of the 2nd International Conf. on Optics and Laser Applications ICOLA’07, September 5-7, Yogyakarta, Indonesia
125
Figure-6: Relationship of fluorescence intensity
for different temperature (normalized to line 21
10 42 )
Figure-7:Two-line emission thermometry of formaldehyde - dependency of the intensity ratio of lines 0
12
0 42 to 21
10 42
to the temperature. It offers a big advantage, that temperature maps can be obtained without any influence of pressure variations as they normally occur in car engine during compression stage. Meanwhile a measurement of temperature under mixture condition of isooctane and synthetic air for different λ values (which is doped with formaldehyde tracer) is also examined. The λ value is defined equal to
φ1 . Result of the measurement can be seen in Figure-8.
Figure-8: Two-line thermometry of formaldehyde
under 10 bar air using the proposed fuel doped with formaldehyde tracer
This condition will reflect the mixture around its stoichiometric condition in combustion engine during pre-combustion stage. It indicates that temperature measurement using formaldehyde also shows independency against fuel-air concentration. B. Calibration for fuel-air ratio measurement using
formaldehyde tracer Experimental set-up for calibration for fuel-air ratio measurement is depicted as follow.
Figure-9: Experimental set-up for calibration and measurement of fuel-air ratio using formaldehyde
Mixture conditions for different λ values are created by injecting certain amount of isooctane (which mixed / doped with formaldehyde) and addition of respective amount of synthetic air to create an intended λ value under pressure of 1 bar. This mixture is then applied to varying temperature from 120oC – 200oC with a step of 10 oC. Fluorescence is recorded for each temperature condition after stable temperature condition is achieved. This experiment is repeated for total pressure of 2 bar until 10 bar. After doing necessary pre image processing [8] the recorded image is then being analyzed. Result of the calibration for temperature of 120oC is shown in Figure-10.
Figure-10: Calibration of fuel-air ratio (φ) values at T = 120°C
The result shows that above pressure of 4 bar, the recorded intensity is constant for certain φ value. Moreover different φ values can be well discerned. This shows that at
FS-III
filter

Proc. of the 2nd International Conf. on Optics and Laser Applications ICOLA’07, September 5-7, Yogyakarta, Indonesia
126
all pressures range that simulates the pre-ignition com-bustion conditions, the fuel-air ratio can be best measured and shows a good linearity. Similar calibration for other temperatures are also done, and the difference to the temperature of 120oC is shown here for one of 180oC. Points in the graph is plotted from values at pressure above 4 bar, in which the independency of pressure to the fuel-air ratio measurement takes place.
Figure-11: Linearity of formaldehyde FARLIF
for different temperatures. The graph clearly shows that temperature has a prominent effect on the fuel-air ratio determination from fluorescence measurement.
IV. CONCLUSIONS 1. This work summarizes that it is possible to use
formaldehyde as a fluorescence tracer for determining the state of mixture formation during the pre-ignition stage.
2. Since the thermalized formaldehyde thermometry can be realized by simultaneous measuring fluorescence intensity using two separate filter, i.e. w.r.t. 0
12
0 42 and
21
10 42 lines and taking their ratio, planar distribution of
temperature can be obtained. 3. Based on measurement measurement of temperature
distribution using thermalized formaldehyde thermo-metry as well as a calibration set of fuel-air ratio distribution values at several temperature, a more correct fuel-air ratio determination can be obtained
ACKNOWLEDGEMENT
I would like herewith to thank to all members of Optical Diagnostics Group, LLG Goettingen for the warmth of scientific and working atmosphere. A gratitude is also directed to DAAD for granting a scholarship to study in Germany.
REFERENCES [1] Schulz, C., Sick, V., 2005, Tracer - LIF diagnostics :
quantitative measurements of fuel concentration, temperature, and fuel / air ratio in practical combus-tion systems, Progress in Energy and Combustion Science, 31, 75 – 121.
[2] Harrington, J. E. , Smyth K. C., 1993, Laser-Induced fluorescence measurements of formaldehyde in methane/air diffusion flame, Chem. Phys. Letters, 202 (3,4), p. 196 – 202.
[3] Birss, F.W., Gordon, R. M., Ramsay, D. A., Till, S. M., 1979, High Resolution Studies of the
11
21 ~~ AXAA → System of Formaldehyde C-13,
Canadian Journal of Physics, 57 ( 10), p. 1676 – 1680. [4] Burkert, A. , Triebel, W., Stafast, H., 2002, Single
shot imaging of gas temperatures in low-temperature combustion based on laser-induced fluorescence of formaldehyde, Proc. of the Combus-tion Institute, 29, p. 2645 – 2651.
[5] Burkert A., Triebel W., 2003, Temperaturemessung bis 800 K in Modellapparaturen und Verbren-nungsmotoren basierend auf Laser-induzierter Fluoreszenz von Formaldehyde, VI. Tagung zur Motorischen Verbrennung, Haus der Technik e.V., 18./19. März, München, p. 263-271.
[6] Reboux, J., Puechberty, D., 1994, A New Approach of Planar Laser Induced Fluorescence Applied to Fuel/Air Ratio Measurement in the Compression Stroke of an Optical S.I. Engine, SAE Technical Paper Nr. 941988.
[7] Reboux, J., Puechberty, D., 1996 , Study of Mixture Inhomogeneities and Combustion Develompment in an S.I. Engine Using a New Approach of Laser Induced Fluorescence (FARLIF), SAE Technical Paper Nr. 961205.
[8] Nasution, AMT, 2006, Formaldehyde as a Tracer to examine Mixture – Formation in Spark Ignited Engines, Cuvillier Verlag, ISBN:978‐3‐86727‐065‐6.
Related Documents