The 2007 Report Card on Child Well-Being for Austin/Travis County

2007 Report Card on Child Well-Being
Mar 07, 2016
This report offers an examination of community conditions in Austin/Travis County that affect the development of young children and their early school success.
Welcome message from author
This document is posted to help you gain knowledge. Please leave a comment to let me know what you think about it! Share it to your friends and learn new things together.
Transcript
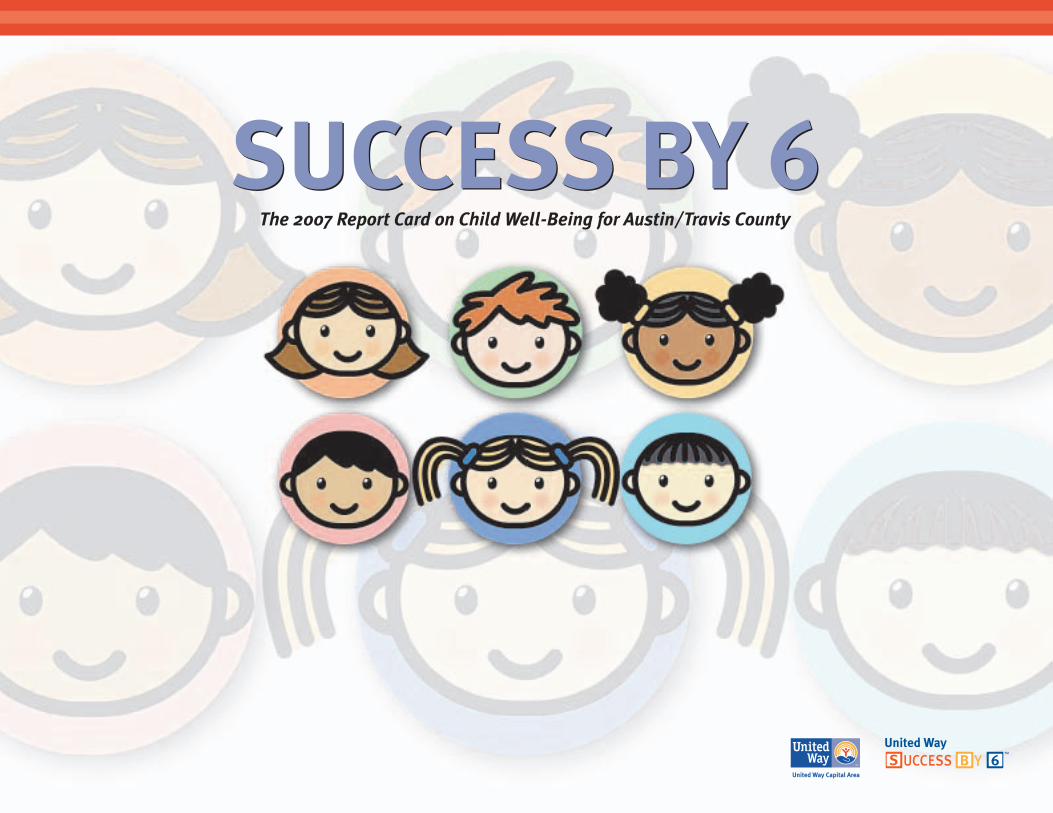
The 2007 Report Card on Child Well-Being for Austin/Travis County
Healthy Happy SmartWith this report, we issue you a challenge.Make early childhood learning a priority in the policy decisions you make, the issues you champion and the programs you support.
Share the data provided in this report and refer to it when you need accurate, reliable information. This knowledge is power: it can improve our decision-making on how best to support the positive development of children, and help us create the kind of community in which we all want to live.
An Introduction to the Work and Report Card . . . . . . . . . . . . . . . . . . . . . . . . . . . . . . . . . . . . . . . . . . . . . . . . . . . . . . . . . . . . . . . . . . . . . . . . . . . . . . . . . 1
Success Stories . . . . . . . . . . . . . . . . . . . . . . . . . . . . . . . . . . . . . . . . . . . . . . . . . . . . . . . . . . . . . . . . . . . . . . . . . . . . . . . . . . . . . . . . . . . . . . . . . . . . . . . . 2
The Report Card Grades . . . . . . . . . . . . . . . . . . . . . . . . . . . . . . . . . . . . . . . . . . . . . . . . . . . . . . . . . . . . . . . . . . . . . . . . . . . . . . . . . . . . . . . . . . . . . . . . . . 4
The Report Card Trends . . . . . . . . . . . . . . . . . . . . . . . . . . . . . . . . . . . . . . . . . . . . . . . . . . . . . . . . . . . . . . . . . . . . . . . . . . . . . . . . . . . . . . . . . . . . . . . . . . 5
White Paper: Healthy Indicators . . . . . . . . . . . . . . . . . . . . . . . . . . . . . . . . . . . . . . . . . . . . . . . . . . . . . . . . . . . . . . . . . . . . . . . . . . . . . . . . . . . . . . . . . . . 6
White Paper: Happy Indicators . . . . . . . . . . . . . . . . . . . . . . . . . . . . . . . . . . . . . . . . . . . . . . . . . . . . . . . . . . . . . . . . . . . . . . . . . . . . . . . . . . . . . . . . . . . . 9
White Paper: Smart Indicators . . . . . . . . . . . . . . . . . . . . . . . . . . . . . . . . . . . . . . . . . . . . . . . . . . . . . . . . . . . . . . . . . . . . . . . . . . . . . . . . . . . . . . . . . . . 12
Success By 6: A Theory of Change . . . . . . . . . . . . . . . . . . . . . . . . . . . . . . . . . . . . . . . . . . . . . . . . . . . . . . . . . . . . . . . . . . . . . . . . . . . . . . . . . . . . . . . . 16
Listing of Report Card Supporters . . . . . . . . . . . . . . . . . . . . . . . . . . . . . . . . . . . . . . . . . . . . . . . . . . . . . . . . . . . . . . . . . . . . . . . . . . . . . . . . . . . . . . . . . 18
A Call to Action . . . . . . . . . . . . . . . . . . . . . . . . . . . . . . . . . . . . . . . . . . . . . . . . . . . . . . . . . . . . . . . . . . . . . . . . . . . . . . . . . . . . . . . . . . . . . . . . . Back Cover
2007 Report Card on Child Well-BeingTable of Contents

Why is that so important?
For every child, the first six years are the critical years.
Amazingly, 90% of the brain’s growth occurs by age 5. This is when a young child is developing emotional and social attachment, language and motor skills.
Studies done at Georgetown University show that by age 5, children in high-risk environments can already be two years behind developmentally. The gap tends to persist over time, adversely impacting school readiness and lifelong success.
The good news is that research also shows that every $1 invested in quality early childhood development saves society up to $17 in remedial education, welfare costs, court expenses and prison expenses. Children who experience high quality child care education programs are more likely to stay in school, get and maintain good jobs, and earn higher wages during their adult years.
Nobel prize-winning economist James Heckman said it best, “The real question is how to use the available funds wisely. The best evidence supports this policy prescription: invest in the very young.”
The work of United Way Success By 6.
That long-term investment in our young children – with a guarantee of high returns – is exactly what Success By 6 is all about.
We are a community-based initiative of public and private partners — child advocates, business leaders, government officials, educators, parents, and caregivers — working together to attain broad, community-level change. In order to help all young children succeed in school and in life, we address system barriers that negatively affect children and families in areas such as health, safety, and early childhood education.
We believe it is essential that we provide children with a good start in life, so that they can be “Healthy, Happy and Smart.” Aligning with those ideals, United Way Success By 6 has set the following objectives for 2007:
Healthy: Increase linkages between Success By 6 collaborative partners and existing health organizations to more effectively promote community healthcare programs and services for young children.
Happy: Increase the number of parents and early childhood educators who have the understanding and skills they need to nurture the social and emotional development of our children.
Smart: Increase the quality of learning environments in early childhood development programs and in the homes of families with very young children.
Success By 6 is achieving these goals by bringing together the public, private, and nonprofit sectors in new and exciting ways. Perhaps most importantly, these partnerships form the solid foundation needed to create systemic change in the months and years ahead.
About this report.
As evidenced by the grades on our 2007 Report Card on Child Well-Being, there is still much work to be done.
We would be remiss, however, if we did not acknowledge at least some of the substantial progress that has been made over the past year.
So this year, we are presenting a “bigger picture” report to our community. Included in this booklet are Success Stories that highlight significant improvement in key areas; the Report Card on Child Well-Being with the grades for 2007; and the White Papers, which include not only important background information on each of the Report Card indicators, but now also show trend data for those indicators.
It is easy to feel discouraged by the fact that our Report Card grades are still low. But the truth is that every one of our 30-plus collaborative partners holds a vision for the day when we in Austin/Travis County become a “straight-A community.” On that day, we will all know that we gave our best to our young children, and invested wisely in our future. If any group of people can create that day for our community, it is the many partners of Success By 6.
This report offers an examination of community conditions in Austin/Travis County that affect the development of young children and their early school success.
1

In some Austin schools serving low-income families, the percentage of kindergartners who are held back each year is almost 21 percent.
Research shows that children are often held back not because they lack the cognitive skills to progress, but rather, because of behavioral problems.
Adults know that when they are gripped by intense feelings, such as grief, or joy, or fear, it is difficult to concentrate on the task at hand. Likewise, when children are upset, they are far less receptive to what adults are trying to teach them. A child’s learning can be adversely affected by everyday stresses – or major challenges such as parental divorce, economic hardship, or family moves.1
One proven best practice to support children’s emotional development is universal access to behavioral health consultation through child care centers.
This means that child care centers are able to call on behavioral consultants to work with children as needed. The result? When behavioral consultants are able to reach children with emotional problems and help them express feelings and learn self-control, the children are then much more likely to succeed in school.
In 2006, only 4.5% of early childhood child care centers in Austin had access to any type of psychological support services. This year, the number of child care centers with access to a behavioral consultant more than tripled, in large part due to a new collaboration initiated and funded by United Way Success By 6.
The Social/Emotional Learning Collaboration is a project of The Austin Child Guidance Center, the YWCA of Greater Austin, and Raising Austin. Collectively, the project partners provide consultation, training, technical assistance, and psychological support services to child care center staff, teachers, parents, and children. And when families, teachers and behavioral consultants work together, the benefits for children are magnified.
1 Fredericks, Linda, Roger Weissberg, Hank Resnick, Eva Patrikakou, Mary Utne O’Brien, “Schools, Families, and Social and Emotional Learning.” 2005. University of Illinois at Chicago. P. 2.
Promoting Children’s Success through Improved Behavioral Health
2
Compelling evidence has mounted over many years that high-quality early childhood programs help young children, especially disadvantaged children, become better prepared to enter and succeed in school.1 Evidence from long-term studies also suggests that the positive results from high-quality early childhood programs last for many years. Low-income children who experienced early childhood programs when they were 3 and 4 years old were more likely to finish high school, avoid teen pregnancy, and become employed after high school or college.2 Leading economists have estimated that every $1.00 invested in quality preschool programs can save society as much as $17.003 in remedial education, welfare costs, and court and prison expenses.
Over half of the families in Travis County with children ages 3- 5 need full-time child care.4 Furthermore, we know that the availability of high quality child care in any community helps businesses recruit and retain a quality workforce.
Clearly, high-quality child care is a wise investment in many ways.
Here in Texas, all child care centers have to meet minimal health and safety licensing standards set by the State. High-quality programs strive to meet more rigorous standards that have been demonstrated to promote optimal child development and school readiness. The City of Austin Child Care Council has recognized two systems for identifying these programs: NAEYC accreditation and Texas/Austin Rising Star. NAEYC Accreditation sets the highest professional standards, and is the ultimate goal for most programs.5 Because this credential is very challenging to attain, however, the Council strongly supports the Texas/Austin Rising Star system as a
vehicle for centers to move up the quality scale in measurable ways. Texas/Austin Rising Star, which is administered by WorkSource, is a four-tiered quality rating system that monitors programs three times a year. Financial supports and technical assistance are provided to participating centers. Centers earn a rating of one- to four-stars based on their quality assessment. Four-star centers are then encouraged to pursue NAEYC accreditation.
Until this year, less than 14% of centers met any standards for quality beyond basic licensing standards. Today, almost 19% of centers serving children ages 0-5 years meet quality standards. This jump ahead is in large part due to an innovative collaboration of agencies determined to improve child care in our community – a collaboration initiated by United Way Success by 6.
WorkSource Child Care Solutions, FamilyConnections, and Austin Community College have created the Quality Child Care Mentoring Collaboration, which creatively aligns high quality support services with child care centers that are seeking to make improvements. Through this collaboration, child development and accreditation specialists mentor center directors on an individualized basis. The child care center directors develop a program improvement plan with the mentors’ support, and WorkSource provides additional resources – such as funding for teacher scholarships, equipment funding, and training – for eligible programs. In the first year of the mentoring project, over 20 child care programs started working on the quality improvement standards.
The Quality Child Care Mentoring Collaboration has received funding from the WorkSource Board, The City of Austin, Travis County, and United Way
Success By 6. In 2007-08, over 30 additional centers – or another 8% of our child care centers – will work with the Collaboration and move through the Texas/Austin Rising Star quality rating system, so we can look forward to improved care for more children in our community.
1 Karoly, Lynn A., Rebecca Kilburn, Jill S. Cannon, Early Childhood Interventions: Proven Results, Future Promise (2005). RAND Corporation.2 J. Shonkoff and D. Phillips. From Neurons to Neighborhoods: The Science of Early Childhood Development (2000). National Academy Press. 3 See footnote 1. RAND Corporation. 4 Academic Research Associates, “The Status of Child Care in Travis County, Texas 2005”, Austin: FamilyConnections. January 2006. 5 National Association for the Education of Young Children.
Helping Children Succeed by Improving the Quality of Child Care Centers
3


Nation Texas Travis County
Immunization Rates – % children immunized (4:3:1) by 24 months 80.4% 78.3% 79%Source: National Immunization Survey, CDC, 20054:3:1 refers to at least four doses of diphtheria/tetanus vaccine (DTaP), three doses of poliovirus vaccine (IPV), and one dose of a measles-containing vaccine (MMR or MCV).
Low Birth Weight – % infants born with a low birth weight Graders noted the disparities between ethnic groups. 8.2% 8.0% 7.2%Source: 2005 CDC National Vital Statistics Report; Texas Department of State Health Services, 2003 Vital Statistics Annual Report Low birth weight is defined as weighing less than 2,500 grams or 5.5 pounds.
Mothers and Children Enrolled in WIC Nutrition Program – % of income eligible mothers and children enrolled in the 57.0% 77.9% 92.8%WIC Nutrition ProgramSource: USDA, Office of Analysis, Nutrition, and Evaluation, 2003; TX Dept. of State Health Services, 2006; TX State Data Ctr., 2004; US Census Bureau, 2000
CHIP/Medicaid Enrollment – % of income eligible children enrolled in CHIP/Medicaid program (18 and under) n/a 67.5% n/aSource: Texas Health and Human Services Commission, Nov 2006, Dec 2006; National Center for Children in Poverty, 2006
4
2007 Report Card on Child Well-BeingAn explanation of the grading process. Grades for the 2007 Report Card on Child Well-Being were assessed by early childhood care and education advocates, professionals, and providers, using a process that considered data and group discussion, measured against acknowledged benchmarks whenever possible. To learn more about the grading process and see a list of graders for 2007, visit sb6centraltexas.org.
Happy Indicators
Final Grade: D
Smart Indicators
Final Grade: D
Healthy Indicators
Final Grade: C
Kindergarten Retention – % retention rate of Kindergarteners n/a 2.9% 2.9% Source: Texas Education Agency, 2005-2006 AEIS Reports
Confirmed Victims of Child Abuse and Neglect – per 1000 children who are confirmed victims of child abuse and neglect 11.9 10.8 11.5 Source: U.S. Department of Health and Human Services, Child Maltreatment for 2004; Texas Department of Family and Protective Services, 2006 Legislative Data Book
Early Childhood Mental Health – % of child care centers that have access to a mental health consultant n/a n/a 14.6%Source: Texas Department of Family and Protective Services as of March 2007; Austin Child Guidance Center; Child, Inc.; Open Door Preschools; Healthy Child Care Austin
Families in Poverty – % of all families and people with children under 5 whose income in the past 12 months is below the poverty level 17.1% 21.3% 18.2% Source: U.S. Census Bureau, 2005 American Community Survey
Child Care Facilities meeting Quality Standards – % of licensed, regulated child care centers for children under 5 n/a n/a 18.54% recognized by NAFCC, NAEYC or Texas Rising Star in Travis County, January 2007 Source: NAEYC, WorkSource, NAFCC and TX DFPS
Child Care Worker Wages – Average wage for child care workers $8.74/hr $7.26/hr $9.06/hrSource: United States Bureau of Labor Statistics, Child Day Care Services, May 2005
Education Level of Child Care Workers – % of child care workers with at least a Bachelors degree 33% n/a 19% Source: Center for the Child Care Workforce, 2002; Child Care Survey for Travis County, SB6, September 2006
Cost of Quality Care Reimbursed by Child Care Subsidy – % of the average cost of child care at NAEYC Accredited Centers n/a n/a 67.1% reimbursed by Child Care SubsidySource: FamilyConnections 2007; WorkSource Child Care Solutions, 2007
Children in Publicly Funded Child Development Programs – % of income eligible 3-4 year olds enrolled in Head Start n/a 55.2% 43.8% and/or public pre-kindergarten programs Source: Texas KIDS COUNT 2006, Calculation from 2000 U.S. Census and 2005 Texas Population Estimates Program
Local Funding for Quality Early Care and Education per Capita – per child 5 and under on funding for child development n/a n/a $26.02 by Austin/Travis CountySource: Austin/Travis County HHSD, WorkSource, Texas Population Estimates Program 2005 Estimates - The University of Texas San Antonio

Healthy Indicator Final Grade: C Happy Indicator Final Grade: D Smart Indicator Final Grade: D5
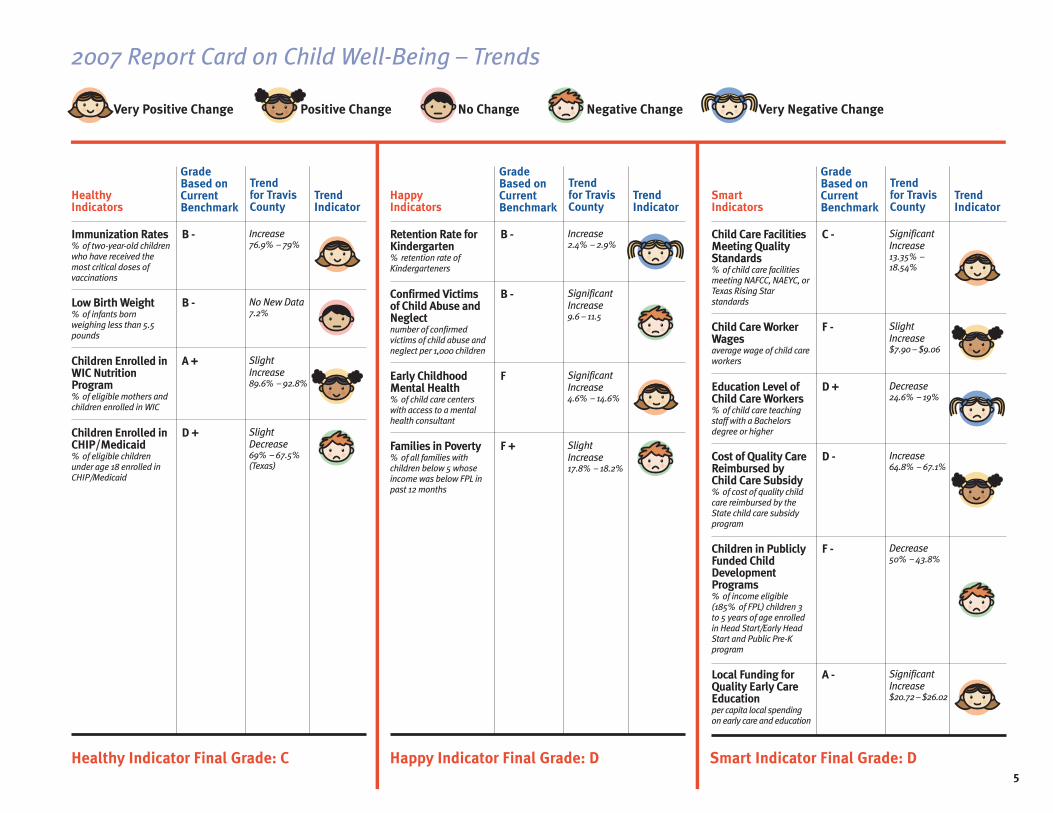
2007 Report Card on Child Well-Being – Trends
Very Positive Change Positive Change No Change Negative Change Very Negative Change
Healthy Indicators
Grade Based on Current Benchmark
Trendfor Travis County
Immunization Rates% of two-year-old children who have received the most critical doses of vaccinations
Increase76.9% – 79%
B -
Trend Indicator
Low Birth Weight% of infants born weighing less than 5.5 pounds
No New Data7.2%
B -
Children Enrolled in WIC Nutrition Program% of eligible mothers and children enrolled in WIC
Slight Increase89.6% – 92.8%
A +
Children Enrolled in CHIP/Medicaid% of eligible children under age 18 enrolled in CHIP/Medicaid
Slight Decrease69% – 67.5% (Texas)
D +
Happy Indicators
Grade Based on Current Benchmark
Trendfor Travis County
Retention Rate for Kindergarten% retention rate of Kindergarteners
Increase2.4% – 2.9%
B -
Trend Indicator
Confirmed Victims of Child Abuse and Neglectnumber of confirmed victims of child abuse and neglect per 1,000 children
Significant Increase9.6 – 11.5
B -
Early Childhood Mental Health% of child care centers with access to a mental health consultant
Significant Increase4.6% – 14.6%
F
Families in Poverty% of all families with children below 5 whose income was below FPL in past 12 months
Slight Increase17.8% – 18.2%
F +
Smart Indicators
Grade Based on Current Benchmark
Trendfor Travis County
Child Care Facilities Meeting Quality Standards% of child care facilities meeting NAFCC, NAEYC, or Texas Rising Star standards
Significant Increase13.35% – 18.54%
C -
Trend Indicator
Child Care Worker Wagesaverage wage of child care workers
Slight Increase$7.90 – $9.06
F -
Education Level of Child Care Workers% of child care teaching staff with a Bachelors degree or higher
Decrease24.6% – 19%
D +
Cost of Quality Care Reimbursed by Child Care Subsidy% of cost of quality child care reimbursed by the State child care subsidy program
Increase64.8% – 67.1%
D -
Children in Publicly Funded Child Development Programs% of income eligible (185% of FPL) children 3 to 5 years of age enrolled in Head Start/Early Head Start and Public Pre-K program
Decrease50% – 43.8%
F -
Local Funding for Quality Early Care Educationper capita local spending on early care and education
Significant Increase$20.72 – $26.02
A -

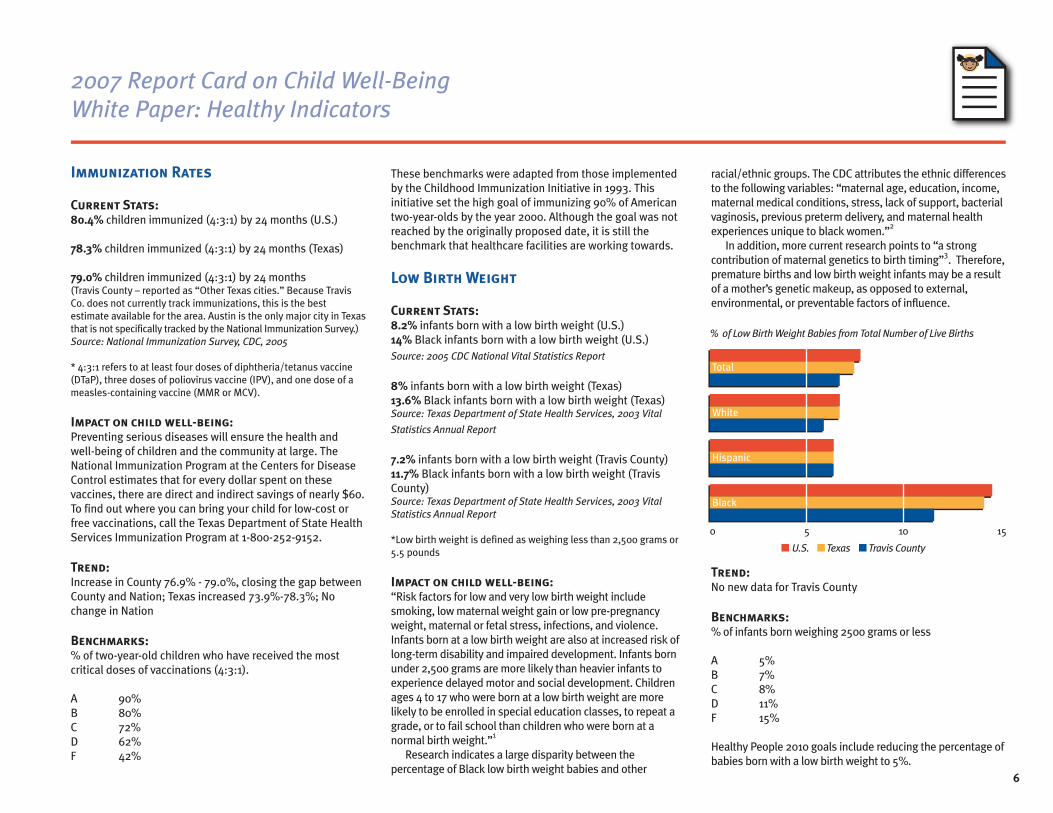
Immunization Rates
Current Stats:80.4% children immunized (4:3:1) by 24 months (U.S.)
78.3% children immunized (4:3:1) by 24 months (Texas)
79.0% children immunized (4:3:1) by 24 months(Travis County – reported as “Other Texas cities.” Because Travis Co. does not currently track immunizations, this is the best estimate available for the area. Austin is the only major city in Texas that is not specifically tracked by the National Immunization Survey.)Source: National Immunization Survey, CDC, 2005
* 4:3:1 refers to at least four doses of diphtheria/tetanus vaccine (DTaP), three doses of poliovirus vaccine (IPV), and one dose of a measles-containing vaccine (MMR or MCV).
Impact on child well-being:Preventing serious diseases will ensure the health and well-being of children and the community at large. The National Immunization Program at the Centers for Disease Control estimates that for every dollar spent on these vaccines, there are direct and indirect savings of nearly $60. To find out where you can bring your child for low-cost or free vaccinations, call the Texas Department of State Health Services Immunization Program at 1-800-252-9152.
Trend:Increase in County 76.9% - 79.0%, closing the gap between County and Nation; Texas increased 73.9%-78.3%; No change in Nation
Benchmarks:% of two-year-old children who have received the most critical doses of vaccinations (4:3:1).
A 90%B 80%C 72%D 62%F 42%
These benchmarks were adapted from those implemented by the Childhood Immunization Initiative in 1993. This initiative set the high goal of immunizing 90% of American two-year-olds by the year 2000. Although the goal was not reached by the originally proposed date, it is still the benchmark that healthcare facilities are working towards.
Low Birth Weight
Current Stats:8.2% infants born with a low birth weight (U.S.)14% Black infants born with a low birth weight (U.S.)Source: 2005 CDC National Vital Statistics Report 8% infants born with a low birth weight (Texas)13.6% Black infants born with a low birth weight (Texas)Source: Texas Department of State Health Services, 2003 Vital
Statistics Annual Report
7.2% infants born with a low birth weight (Travis County)11.7% Black infants born with a low birth weight (Travis County)Source: Texas Department of State Health Services, 2003 Vital Statistics Annual Report
*Low birth weight is defined as weighing less than 2,500 grams or 5.5 pounds
Impact on child well-being:“Risk factors for low and very low birth weight include smoking, low maternal weight gain or low pre-pregnancy weight, maternal or fetal stress, infections, and violence. Infants born at a low birth weight are also at increased risk of long-term disability and impaired development. Infants born under 2,500 grams are more likely than heavier infants to experience delayed motor and social development. Children ages 4 to 17 who were born at a low birth weight are more likely to be enrolled in special education classes, to repeat a grade, or to fail school than children who were born at a normal birth weight.”1
Research indicates a large disparity between the percentage of Black low birth weight babies and other
racial/ethnic groups. The CDC attributes the ethnic differences to the following variables: “maternal age, education, income, maternal medical conditions, stress, lack of support, bacterial vaginosis, previous preterm delivery, and maternal health experiences unique to black women.”2 In addition, more current research points to “a strong contribution of maternal genetics to birth timing”3. Therefore, premature births and low birth weight infants may be a result of a mother’s genetic makeup, as opposed to external, environmental, or preventable factors of influence.
Trend: No new data for Travis County
Benchmarks:% of infants born weighing 2500 grams or less
A 5%B 7%C 8%D 11%F 15%
Healthy People 2010 goals include reducing the percentage of babies born with a low birth weight to 5%.
2007 Report Card on Child Well-BeingWhite Paper: Healthy Indicators
6
% of Low Birth Weight Babies from Total Number of Live Births
Total
White
Hispanic
Black
0 5 10 15
U.S. Texas Travis County
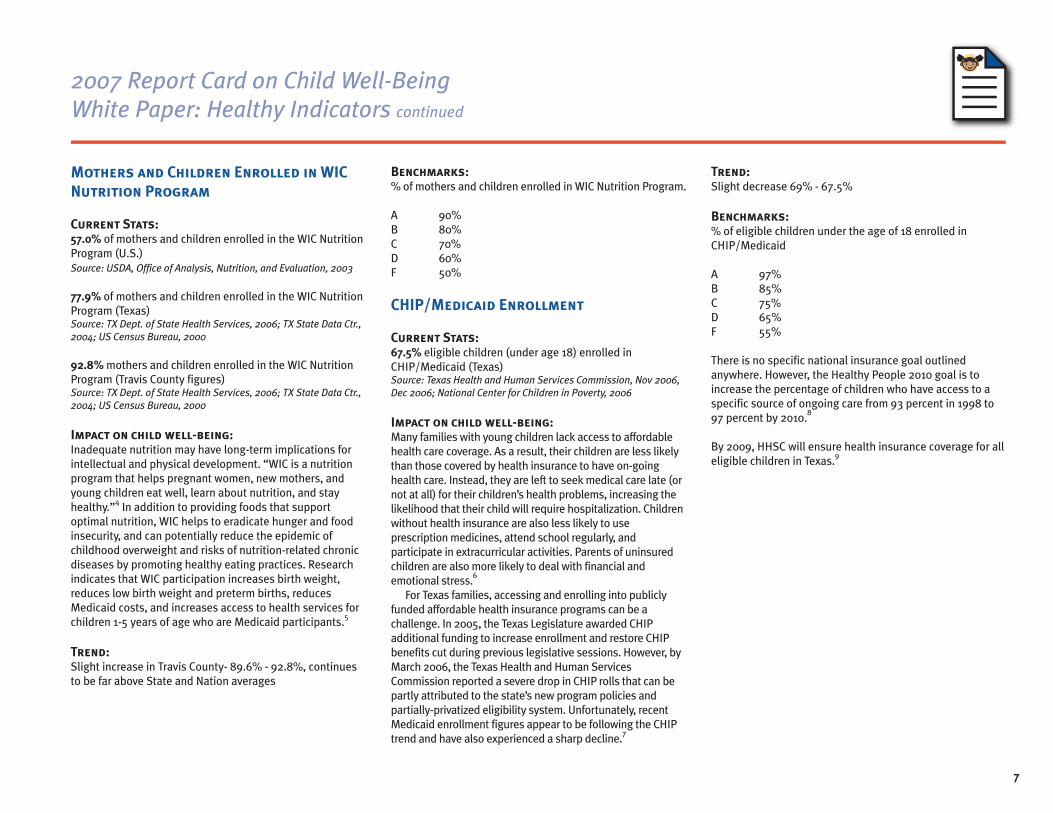
Mothers and Children Enrolled in WIC Nutrition Program
Current Stats:57.0% of mothers and children enrolled in the WIC Nutrition Program (U.S.)Source: USDA, Office of Analysis, Nutrition, and Evaluation, 2003 77.9% of mothers and children enrolled in the WIC Nutrition Program (Texas)Source: TX Dept. of State Health Services, 2006; TX State Data Ctr., 2004; US Census Bureau, 2000
92.8% mothers and children enrolled in the WIC Nutrition Program (Travis County figures)Source: TX Dept. of State Health Services, 2006; TX State Data Ctr., 2004; US Census Bureau, 2000
Impact on child well-being:Inadequate nutrition may have long-term implications for intellectual and physical development. “WIC is a nutrition program that helps pregnant women, new mothers, and young children eat well, learn about nutrition, and stay healthy.”4 In addition to providing foods that support optimal nutrition, WIC helps to eradicate hunger and food insecurity, and can potentially reduce the epidemic of childhood overweight and risks of nutrition-related chronic diseases by promoting healthy eating practices. Research indicates that WIC participation increases birth weight, reduces low birth weight and preterm births, reduces Medicaid costs, and increases access to health services for children 1-5 years of age who are Medicaid participants.5
Trend:Slight increase in Travis County- 89.6% - 92.8%, continues to be far above State and Nation averages
Benchmarks:% of mothers and children enrolled in WIC Nutrition Program.
A 90%B 80%C 70%D 60%F 50%
CHIP/Medicaid Enrollment
Current Stats:67.5% eligible children (under age 18) enrolled in CHIP/Medicaid (Texas)Source: Texas Health and Human Services Commission, Nov 2006, Dec 2006; National Center for Children in Poverty, 2006
Impact on child well-being:Many families with young children lack access to affordable health care coverage. As a result, their children are less likely than those covered by health insurance to have on-going health care. Instead, they are left to seek medical care late (or not at all) for their children’s health problems, increasing the likelihood that their child will require hospitalization. Children without health insurance are also less likely to use prescription medicines, attend school regularly, and participate in extracurricular activities. Parents of uninsured children are also more likely to deal with financial and emotional stress.6 For Texas families, accessing and enrolling into publicly funded affordable health insurance programs can be a challenge. In 2005, the Texas Legislature awarded CHIP additional funding to increase enrollment and restore CHIP benefits cut during previous legislative sessions. However, by March 2006, the Texas Health and Human Services Commission reported a severe drop in CHIP rolls that can be partly attributed to the state’s new program policies and partially-privatized eligibility system. Unfortunately, recent Medicaid enrollment figures appear to be following the CHIP trend and have also experienced a sharp decline.7
Trend: Slight decrease 69% - 67.5%
Benchmarks:% of eligible children under the age of 18 enrolled in CHIP/Medicaid
A 97%B 85%C 75%D 65%F 55%
There is no specific national insurance goal outlined anywhere. However, the Healthy People 2010 goal is to increase the percentage of children who have access to a specific source of ongoing care from 93 percent in 1998 to 97 percent by 2010.8
By 2009, HHSC will ensure health insurance coverage for all eligible children in Texas.9
2007 Report Card on Child Well-BeingWhite Paper: Healthy Indicators continued
7
1 Child Trends Databank. (2003). Low and very low birth weight infants. Retrieved from http://www.childtrendsdatabank.org/indicators/57LowBirthweight.cfm
2 Centers for Disease Control and Prevention. (2002, July). Infant mortality and low birth weight among Black and White infants --- United States, 1980—2000. Morbidity and Mortality Weekly Report, 51(27), 589-592.
3 American Journal of Obstetrics and Gynecology. (2006, December). Genetic influence on parturition in a twin sample: examination of parental effect on birth timing. Retrieved from http://.ajog.org/article/ PIIS0002937806019624/fulltext
4 Texas Department of Health and Human Services. (2006). WIC – Women, Infants and Children Program. Retrieved from http://www.dshs.state.tx.us/wichd/default.shtm
5 American Public Health Association. (2003). Support for WIC and child nutrition programs. Retrieved from http://www.apha.org/legislative/policy/2003/2003-019.pdf
6 Child Trends Databank. (2003). Health care coverage. Retrieved from http://www.childtrendsdatabank.org/ indicators/26HealthCareCoverage.cfm
7 The Center for Public Policy and Priorities (2006). CHIP Is Not Alone: Medicaid Numbers Also Drop Statewide (press release). Retrieved from www.cppp.org
8 Healthy People. (2000). Access to quality health services: Primary care. Retrieved from http://www.health.gov/ healthypeople/document/HTML/Volume1/01Access.htm#_Toc489432816
9 Texas Health and Human Services Commission. (2004). HHS system strategic plan for FY 2005-2009: Goals, objectives, and strategies. Retrieved from http://www.hhsc.state.tx.us/StrategicPlans/HHS05-09/final/Chpt10.html
2007 Report Card on Child Well-BeingWhite Paper: Healthy Indicators continued
8

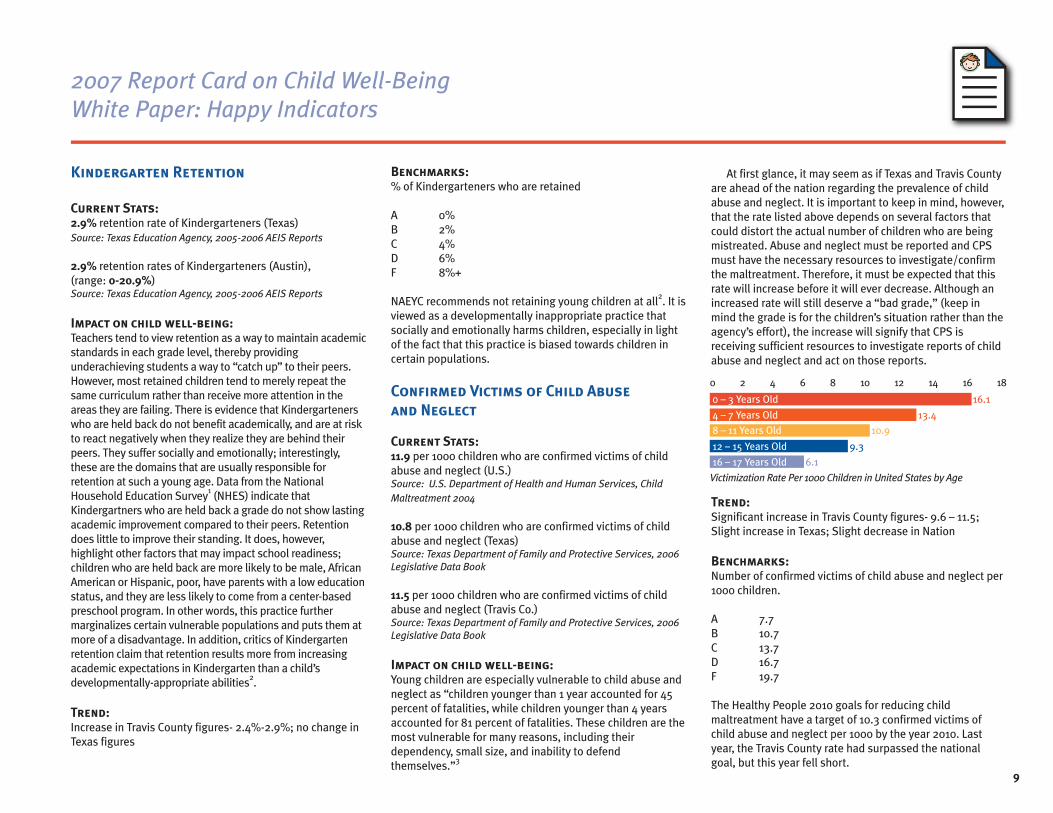
Kindergarten Retention
Current Stats:2.9% retention rate of Kindergarteners (Texas) Source: Texas Education Agency, 2005-2006 AEIS Reports 2.9% retention rates of Kindergarteners (Austin), (range: 0-20.9%)Source: Texas Education Agency, 2005-2006 AEIS Reports
Impact on child well-being:Teachers tend to view retention as a way to maintain academic standards in each grade level, thereby providing underachieving students a way to “catch up” to their peers. However, most retained children tend to merely repeat the same curriculum rather than receive more attention in the areas they are failing. There is evidence that Kindergarteners who are held back do not benefit academically, and are at risk to react negatively when they realize they are behind their peers. They suffer socially and emotionally; interestingly, these are the domains that are usually responsible for retention at such a young age. Data from the National Household Education Survey1 (NHES) indicate that Kindergartners who are held back a grade do not show lasting academic improvement compared to their peers. Retention does little to improve their standing. It does, however, highlight other factors that may impact school readiness; children who are held back are more likely to be male, African American or Hispanic, poor, have parents with a low education status, and they are less likely to come from a center-based preschool program. In other words, this practice further marginalizes certain vulnerable populations and puts them at more of a disadvantage. In addition, critics of Kindergarten retention claim that retention results more from increasing academic expectations in Kindergarten than a child’s developmentally-appropriate abilities2.
Trend:Increase in Travis County figures- 2.4%-2.9%; no change in Texas figures
Benchmarks:% of Kindergarteners who are retained
A 0%B 2%C 4%D 6%F 8%+
NAEYC recommends not retaining young children at all2. It is viewed as a developmentally inappropriate practice that socially and emotionally harms children, especially in light of the fact that this practice is biased towards children in certain populations.
Confirmed Victims of Child Abuseand Neglect
Current Stats:11.9 per 1000 children who are confirmed victims of child abuse and neglect (U.S.)Source: U.S. Department of Health and Human Services, Child Maltreatment 2004
10.8 per 1000 children who are confirmed victims of child abuse and neglect (Texas)Source: Texas Department of Family and Protective Services, 2006 Legislative Data Book
11.5 per 1000 children who are confirmed victims of child abuse and neglect (Travis Co.)Source: Texas Department of Family and Protective Services, 2006 Legislative Data Book
Impact on child well-being:Young children are especially vulnerable to child abuse and neglect as “children younger than 1 year accounted for 45 percent of fatalities, while children younger than 4 years accounted for 81 percent of fatalities. These children are the most vulnerable for many reasons, including their dependency, small size, and inability to defend themselves.”3
At first glance, it may seem as if Texas and Travis County are ahead of the nation regarding the prevalence of child abuse and neglect. It is important to keep in mind, however, that the rate listed above depends on several factors that could distort the actual number of children who are being mistreated. Abuse and neglect must be reported and CPS must have the necessary resources to investigate/confirm the maltreatment. Therefore, it must be expected that this rate will increase before it will ever decrease. Although an increased rate will still deserve a “bad grade,” (keep in mind the grade is for the children’s situation rather than the agency’s effort), the increase will signify that CPS is receiving sufficient resources to investigate reports of child abuse and neglect and act on those reports.
Trend: Significant increase in Travis County figures- 9.6 – 11.5; Slight increase in Texas; Slight decrease in Nation
Benchmarks:Number of confirmed victims of child abuse and neglect per 1000 children.
A 7.7B 10.7C 13.7D 16.7F 19.7
The Healthy People 2010 goals for reducing child maltreatment have a target of 10.3 confirmed victims of child abuse and neglect per 1000 by the year 2010. Last year, the Travis County rate had surpassed the national goal, but this year fell short.
2007 Report Card on Child Well-BeingWhite Paper: Happy Indicators
9
Victimization Rate Per 1000 Children in United States by Age
0 2 4 6 8 10 12 14 16 18
0 – 3 Years Old 16.1
4 – 7 Years Old 13.4
8 – 11 Years Old 10.9
12 – 15 Years Old 9.3
16 – 17 Years Old 6.1

Early Childhood Mental Health
Current Stats:14.6% of child care centers have access to a mental health consultant (86 qualifying centers divided by the 588 total centers)Source: Texas Department of Family and Protective Services as of March 2007; Austin Child Guidance Center; Child, Inc.; Open Door Preschools; Healthy Child Care Austin
Impact on child well-being:Early detection and intervention of developmental problems are important to prevent long-term negative outcomes including school expulsion, excessive absences, disruptive behavior problems, and cognitive delays. Child care settings are optimal locations for this assessment to occur due to the fact that many children are spending up to 10 hours per day away from their primary caregivers. There are three main roles of a mental health consultant in a child care setting according to Deborah Phillips4:1) to provide information to teachers about preventative social-emotional support2) to provide information to teachers and parents about early detection of mental health issues3) to provide services to the staff. “If [the teachers] are depressed or are very anxious, they are not providing good care to the children nor are they good role models for them.” Currently, mental health consultation is being provided to selected centers by The Social/Emotional Learning Collaboration, a new project of Austin Child Guidance Center, YWCA, and Raising Austin. In addition, Child Inc., Open Door preschools, and MainSprings offer services to children and families in their care.
Trend:Very significant increase- 4.5% – 14.6%
Benchmarks:% of child care centers that have access to a mental health consultant
A 95%B 80%C 60%D 40%F <20%
No national goal for this indicator.
Children Living in Poverty
Current Stats:17.1% of families with children under 5 whose income in the past year is below the poverty level (U.S.)
21.3% of families with children under 5 whose income in the past year is below the poverty level (Texas)
18.2% of families with children under 5 whose income in the past year is below the poverty level (Travis County)Source: U.S. Census Bureau, 2005 American Community Survey
Impact on child well-being:Poverty affects all aspects of child well being. This indicator is under the “Happy” goal because children are at risk for not getting their basic needs met if they are living in poverty. This can mean that they are not receiving basic resources, such as those measured as “Healthy” or “Smart” indicators, thus affecting their social and emotional health. In particular, “children in low-income families are almost twice as likely to suffer from high levels of emotional-disorder anxiety as are children whose family incomes are $30,000 or greater.”5 Also, children in poor families are twice as likely to have scores within the top 10 percent in terms of frequency of delinquent behaviours, compared to children in modest-income families, and they are nearly three times as likely to have high delinquency scores as children in high-income families.”5 Children should receive basic services in order to prevent serious emotional and social problems from developing.
Trend: Slight increases; consistent among County, State, and Nation
Benchmarks:% of families with children under 5 whose income in the past year is below the poverty level.
A 10%B 12%C 14%D 16%F 20%
2007 Report Card on Child Well-BeingWhite Paper: Happy Indicators continued
10

1 Zill, N., Loomis, L. S., & West, J. (1997). The Elementary School Performance and Adjustment of Children Who Enter Kindergarten Late or Repeat Kindergarten: Findings from National Surveys, NCES 98–097. Washington, DC: U.S. Department of Education, National Center for Education Statistics. 2 National Association for the Education of Young Children. (2001). STILL unacceptable trends in Kindergarten entry and placement: A position statement developed by the National Association of Early Childhood Specialists in State Departments of Education. Washington, D.C.: Author.
3 Department of Health and Human Services, Administration on Children, Youth, and Families. (2006). Child Abuse and Neglect Fatalities: Statistics and Interventions. Retrieved on March 12, 2007, from www.childwelfare.gov/pubs/factsheets/fatality.otm. Washington, D.C.: Child Welfare Information Gateway. 4 Child Care Bureau. (2002). Promoting mental health through child care and mental health linkages. Child Care Bulletin, 25. Retrieved from http://www.nccic.org/ccb/issue25.pdf
5 Ross, D. P., & Roberts, P. (n.d.). Income and child well being: A new perspective on the poverty debate. Canadian Council on Social Development. Retrieved from http://www.ccsd.ca/pubs/inckids/outcomes.htm
2007 Report Card on Child Well-BeingWhite Paper: Happy Indicators continued
11

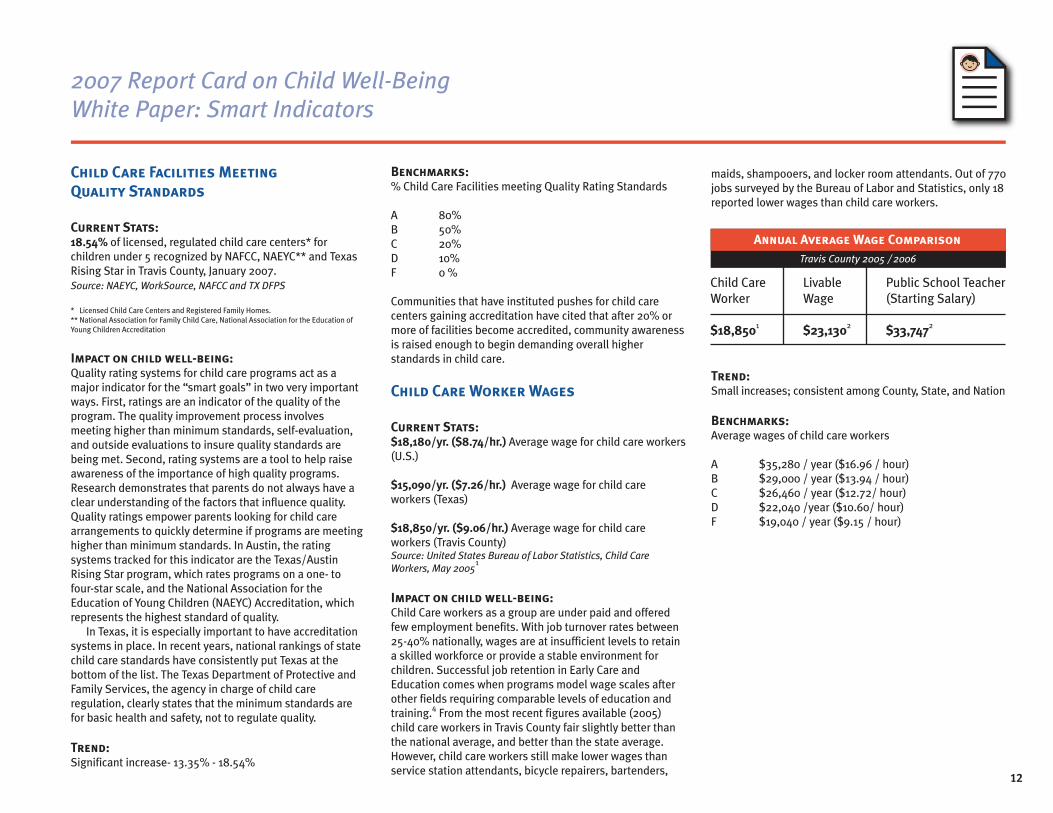
Child Care Facilities MeetingQuality Standards
Current Stats:18.54% of licensed, regulated child care centers* for children under 5 recognized by NAFCC, NAEYC** and Texas Rising Star in Travis County, January 2007.Source: NAEYC, WorkSource, NAFCC and TX DFPS * Licensed Child Care Centers and Registered Family Homes.** National Association for Family Child Care, National Association for the Education of Young Children Accreditation
Impact on child well-being:Quality rating systems for child care programs act as a major indicator for the “smart goals” in two very important ways. First, ratings are an indicator of the quality of the program. The quality improvement process involves meeting higher than minimum standards, self-evaluation, and outside evaluations to insure quality standards are being met. Second, rating systems are a tool to help raise awareness of the importance of high quality programs. Research demonstrates that parents do not always have a clear understanding of the factors that influence quality. Quality ratings empower parents looking for child care arrangements to quickly determine if programs are meeting higher than minimum standards. In Austin, the rating systems tracked for this indicator are the Texas/Austin Rising Star program, which rates programs on a one- to four-star scale, and the National Association for the Education of Young Children (NAEYC) Accreditation, which represents the highest standard of quality. In Texas, it is especially important to have accreditation systems in place. In recent years, national rankings of state child care standards have consistently put Texas at the bottom of the list. The Texas Department of Protective and Family Services, the agency in charge of child care regulation, clearly states that the minimum standards are for basic health and safety, not to regulate quality.
Trend:Significant increase- 13.35% - 18.54%
Benchmarks:% Child Care Facilities meeting Quality Rating Standards
A 80%B 50%C 20%D 10%F 0 %
Communities that have instituted pushes for child care centers gaining accreditation have cited that after 20% or more of facilities become accredited, community awareness is raised enough to begin demanding overall higher standards in child care.
Child Care Worker Wages
Current Stats:$18,180/yr. ($8.74/hr.) Average wage for child care workers (U.S.)
$15,090/yr. ($7.26/hr.) Average wage for child care workers (Texas)
$18,850/yr. ($9.06/hr.) Average wage for child care workers (Travis County)Source: United States Bureau of Labor Statistics, Child Care Workers, May 2005
1
Impact on child well-being:Child Care workers as a group are under paid and offered few employment benefits. With job turnover rates between 25-40% nationally, wages are at insufficient levels to retain a skilled workforce or provide a stable environment for children. Successful job retention in Early Care and Education comes when programs model wage scales after other fields requiring comparable levels of education and training.4 From the most recent figures available (2005) child care workers in Travis County fair slightly better than the national average, and better than the state average. However, child care workers still make lower wages than service station attendants, bicycle repairers, bartenders,
maids, shampooers, and locker room attendants. Out of 770 jobs surveyed by the Bureau of Labor and Statistics, only 18 reported lower wages than child care workers.
Trend: Small increases; consistent among County, State, and Nation
Benchmarks:Average wages of child care workers
A $35,280 / year ($16.96 / hour)B $29,000 / year ($13.94 / hour)C $26,460 / year ($12.72/ hour)D $22,040 /year ($10.60/ hour)F $19,040 / year ($9.15 / hour)
2007 Report Card on Child Well-BeingWhite Paper: Smart Indicators
12
Annual Average Wage ComparisonTravis County 2005 / 2006
Child Care Worker
$18,8501
Livable Wage
$23,1302
Public School Teacher (Starting Salary)
$33,7472
Education Level of Child Care Workers
Current Stats:33% of child care workers with at least a Bachelors degree (U.S.)Source: Center for the Child Care Workforce, 2002 19% of child care workers with at least a Bachelors degree (Travis County)Source: 2006 Child Care Survey for Travis County, SB6, September 2006
Impact on child well-being:In Texas, education and training requirements for child workers are very low. Workers only need a minimum of a High School Diploma or its equivalent and 8 hours of pre-service training. Each year a child care worker must obtain 15 hours of continuing education. Currently there are no mandated requirements about who can train child care workers to fulfill continuing education requirements. In addition, few child care programs have a formal wage ladders to encourage academic investment. The competency and education levels of child care teachers are the most significant indicators of quality care.5
Trend:Decrease in County- 24.6%-19%; no new data for Nation
Benchmarks:% of child care staff with Bachelors degree or higher
A 40% B 30% C 25% D 15%F 5%
The National Association for the Education of Young Children recommends that 75% of lead teaching staff at a child care center hold a Bachelors degree or higher. Head Start standards require at least 50% of all staff hold an Associates degree or higher.
Cost of Quality Care Reimbursed by Child Care Subsidy
Current Stats:67.1% of the average cost of child care at NAEYC Accredited Centers reimbursed by Child Care Subsidy in Travis CountySource: FamilyConnections 2007; WorkSource Child Care Solutions, 2007
Impact on child well-being:Although child care subsidies are a workforce support that allows parents to work, train for work or find employment, subsidies also act as a safety net program, insuring low-income families have access to child care. Quality child care has proven a crucial intervention for ensuring children at risk succeed in school. Quality child care has long term positive impacts for children, and children from economically disadvantaged homes show even more dramatic benefits from high quality care, and are more negatively affected by low quality care.6 Without access to quality care, children receiving subsidized care are going to remain at risk for failure. Although plans to raise the maximum reimbursement rates will soon go into effect, current local child care subsidies do not cover the real cost of quality child care in Travis County. Because these rates are well below the actual costs of most high-quality programs, many child care centers cannot afford
to accept children requiring child care subsidies. The child care reimbursement rates effectively drive low income families eligible for child care subsidy assistance to low cost centers, and often low quality centers, who will accept the payment rates offered. The WorkSource Greater Austin Area Workforce Board sets local market rates for the federal child care subsidy program in Travis County. The Texas Workforce Commission (TWC) sets performance goals for the Board, including the number of children that must be served by subsidy funding. These goals increase yearly without an increase in funding. Therefore, the local Board has not increased local market reimbursement rates.
Trend: Increase from 64.8%-67.1%
Benchmarks:% Cost of quality child care reimbursed by the State child care subsidy program.
A 90%B 85%C 80%D 70%F 60%
Advocates for quality child care state that the real cost of providing quality care is high – averaging $10,000 per year. This money is considered an investment in the future.
2007 Report Card on Child Well-BeingWhite Paper: Smart Indicators continued
13
Child Care Staff Education LevelTravis County
Bachelors degree or higher 19%
Associates degree 4%
Some College 24%
CDA 13%
High School Diploma / GED 37%
Newborn – 11 mos $844.00 $549.03 65.1%
12 mos – 18 mos $779.00 $549.03 70.5%
18 mos – 23 mos $756.00 $473.63 62.6%
2 yrs $717.00 $473.63 66.1%
3 yrs $667.00 $456.95 68.5%
4 yrs – 5yrs $657.00 $456.95 69.6%
NAEYC Accredited Center Average Tuition / MonthAge of Child
Maximum Reimbursment Rates / Month %

Children in Publicly FundedDevelopment Programs
Current Stats:55.2% of income eligible 3-4 year olds enrolled in Head Start and/or public pre-kindergarten programs (Texas)
43.8% of income eligible 3-4 year olds enrolled in Head Start and/or public pre-kindergarten programs (Travis County) Source: Texas KIDS COUNT (Selected County Data; The State of Texas Children 2006), Calculation from 2000 U.S. Census and 2005 Texas Population Estimates Program
7
Impact on child well-being:Three and four year olds attending high-quality programs benefit from the effects in kindergarten and into the second grade. Children who are “at-risk” for school failure showed even greater benefit from positive child care experiences, but were also more negatively impacted by low or poor quality programs.8 Programs such as Head Start and Public Pre-Kindergarten are in place to help children become ready for school. Head Start provides children and families with comprehensive services that include early childhood education, medical, dental, nutritional and mental health. Research shows that participation in Head Start positively impacts children’s pre-reading, pre-writing, literacy and vocabulary skills.9 To qualify for services, families must meet income eligibility requirements (near 100% of the Federal Poverty Level) as well as work requirements to qualify for full-day care. Children receiving Medicaid, Food Stamps, TANF are automatically qualified for the Head Start Program. Public Pre-Kindergarten programs require the family to meet the National School Lunch & Child Nutrition Programs Income Eligibility Guidelines (185% FPL), or the child to speak and comprehend English as a second language, or the family meets the criteria of “homeless.” In Travis County, most eligible 4-year-olds attend public Pre-K programs, but relatively few three-year-olds have access to high-quality, publicly funded child development programs.
Trend:Increase in Texas figures: 34.6% – 55.2%; decrease in Travis County: 50% – 43.8%
Benchmarks:% income eligible (185% FPL) children 3 to 5 years of age enrolled in Head Start or Early Head Start and Public Pre-Kindergarten in Travis County
A 80%B 70%C 60%D 50%F 45%
Local Funding for Quality Early Care and Education per Capita
Current Stats:$26.02 per child 5 and under on funding for child development by Austin/Travis County Source: Austin/Travis County HHSD, WorkSource, Texas Population Estimates Program 2005 Estimates – The University of Texas San Antonio
Impact on child well-being:The City of Austin and Travis County dedicates funding to improving early care and education of its youngest citizens. For fiscal year 2006-2007 The City and County invested a combined total of $1,815,599 on social service contracts regarding child development. Additionally, The City of Austin and Travis County has spent $83,000 this year in the Child Care Facility Improvement Project. Investment of this kind shows an understanding of the importance of investing in our children. The WorkSource – Greater Austin Area Workforce Board dedicates a portion of their Child Development Block Grant funding for quality improvement activities including much needed equipment and resources and training for child development programs. Federal Requirements for the matching grant require the State to spend at least 4% of its funding on quality related activities. Texas allocates its 4%
to Family and Protective Services - Child Care Licensing division to regulate child care facilities. Although technically allowable through the Federal guidelines, TDFPS clearly states its function is to ensure basic health and safety for children in care, NOT to monitor the quality of care. WorkSource has made quality funding a priority, ensuring $250,455 goes to quality projects.
Trend: Significant increase- $20.72 - $26.02
Benchmarks:Per capita local spending on early care and education
A $30B $20C $15D $10F $5
The Austin and Travis County area is one of the few communities dedicating substantial funding toward improving the quality of early care and education.
2007 Report Card on Child Well-BeingWhite Paper: Smart Indicators continued
14

1 Quarterly Census of Employment and Wages, United States Bureau of Labor Statistics, Child Care Workers. Based on average weekly wage.
2 House the Homeless, Inc., estimated salary need to afford basic efficiency apartment housing in Austin, Texas in 2006
3 Texas Education Agency, AEIS Reports 2005-2006
4 Center for Child Care Workforce. (2004). Current data on the salaries and benefits of the U.S. Early Childhood Education Workforce. Retrieved from http://www.ccw.org/pubs/2004Compendium.pdf
5 Peisner-Feinberg, E. S., Burchinal, M. R., Clifford, R. M., Culkin, M.L., Howes, C., Kagan, S. L., Yazejian, N., Byler, P., Rustici, J., & Zelazo, J. (2000). The children of the cost, quality, and outcomes study go to school: Technical report. Chapel Hill: University of North Carolina at Chapel Hill, Frank Porter Graham Child Development Center. Retrieved from http://www.fpg.unc.edu/~NCEDL/PDFs/CQO-tr.pdf
6 Peisner-Feinberg, E. S., Burchinal, M. R., Clifford, R. M., Culkin, M.L., Howes, C., Kagan, S. L., Yazejian, N., Byler, P., Rustici, J., & Zelazo, J. (1999). The children of the cost, quality, and outcomes study go to school: Executive summary. Chapel Hill: University of North Carolina at Chapel Hill, Frank Porter Graham Child Development Center.
7 Population estimates for children 3-5 year old (Texas Population Estimates Program – University of Texas San Antonio) less than 185% of the Federal Poverty Level. Poverty level estimated from % of children 5 and under at 184% or under from the 2000 U.S. Census.
8 Peisner-Feinberg, E. S., Burchinal, M. R., Clifford, R. M., Culkin, M.L., Howes, C., Kagan, S. L., Yazejian, N., Byler, P., Rustici, J., & Zelazo, J. (2000). The children of the cost, quality, and outcomes study go to school: Technical report. Chapel Hill: University of North Carolina at Chapel Hill, Frank Porter Graham Child Development Center. Retrieved from http://www.fpg.unc.edu/~NCEDL/PDFs/CQO-tr.pdf
9 U.S. Department of Health and Human Services, Administration for Children and Families. (2005). Head Start Impact Study: First year findings. Washington, D.C.: Retrieved from http://www.acf.hhs.gov/programs/ opre/hs/impact_study/reports/first_yr_finds/first_yr_finds.pdf
2007 Report Card on Child Well-BeingWhite Paper: Smart Indicators continued
15


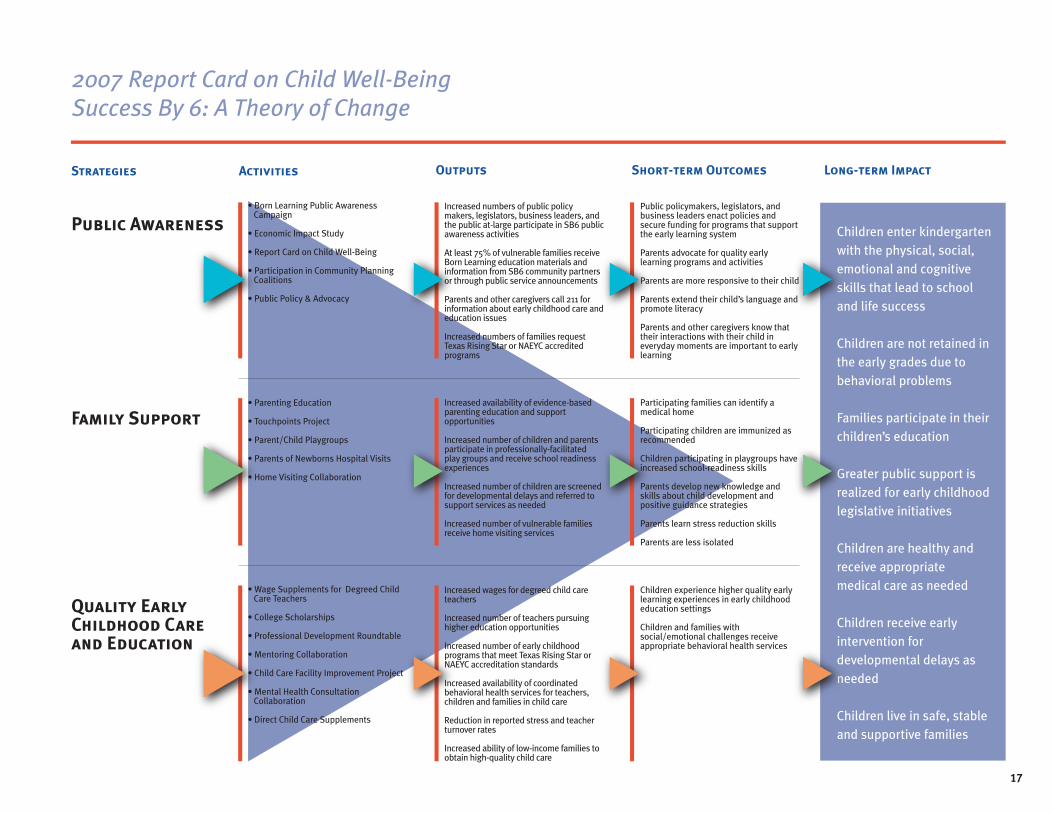
The model on the following page charts the course for the work of United Way Success By 6 and our many partners, linking the activities we have planned with the changes and results we hope to achieve.
Vision
The Success By 6 vision is that every young child will be “Healthy, Happy and Smart”—ready for success in school and in life.
Core Values/Assumptions
1. The first five years of life are a critical developmental period.
2. Early experiences provide the foundation for optimal growth and development.
3. Child development occurs across important and interrelated domains – physical, social/emotional, cognitive, language.
4. All young children deserve opportunities that help them succeed, regardless of any demographic or economic consideration.
5. The family plays the most important and influential role in a child’s life.
6. Research-based early intervention can significantly improve educational, physical, social and emotional outcomes for children and families.
Success By 6 Objectives
Healthy ChildrenCreate formal linkages with health organizations to further community health and safety outcomes for young children
Happy ChildrenIncrease the number of parents and early childhood educators who have the understanding and skills they need to nurture the social and emotional development of children
Smart ChildrenIncrease the quality of early care and education programs in Central Texas
Increase the quality of early learning environments in the homes of families with young children
16
2007 Report Card on Child Well-BeingSuccess By 6: A Theory of Change
17
Public Awareness
Strategies Activities Outputs Short-term Outcomes Long-term Impact
Family Support
Quality Early Childhood Care and Education
Increased wages for degreed child care teachers
Increased number of teachers pursuing higher education opportunities
Increased number of early childhood programs that meet Texas Rising Star or NAEYC accreditation standards
Increased availability of coordinated behavioral health services for teachers, children and families in child care
Reduction in reported stress and teacher turnover rates
Increased ability of low-income families to obtain high-quality child care
Children experience higher quality early learning experiences in early childhood education settings
Children and families with social/emotional challenges receive appropriate behavioral health services
• Wage Supplements for Degreed Child Care Teachers
• College Scholarships
• Professional Development Roundtable
• Mentoring Collaboration
• Child Care Facility Improvement Project
• Mental Health Consultation Collaboration
• Direct Child Care Supplements
Increased numbers of public policy makers, legislators, business leaders, and the public at-large participate in SB6 public awareness activities
At least 75% of vulnerable families receive Born Learning education materials and information from SB6 community partners or through public service announcements
Parents and other caregivers call 211 for information about early childhood care and education issues
Increased numbers of families request Texas Rising Star or NAEYC accredited programs
Public policymakers, legislators, and business leaders enact policies and secure funding for programs that support the early learning system
Parents advocate for quality early learning programs and activities
Parents are more responsive to their child
Parents extend their child’s language and promote literacy
Parents and other caregivers know that their interactions with their child in everyday moments are important to early learning
• Born Learning Public Awareness Campaign
• Economic Impact Study
• Report Card on Child Well-Being
• Participation in Community Planning Coalitions
• Public Policy & Advocacy
Increased availability of evidence-based parenting education and support opportunities
Increased number of children and parents participate in professionally-facilitated play groups and receive school readiness experiences
Increased number of children are screened for developmental delays and referred to support services as needed
Increased number of vulnerable families receive home visiting services
Participating families can identify a medical home
Participating children are immunized as recommended
Children participating in playgroups have increased school-readiness skills
Parents develop new knowledge and skills about child development and positive guidance strategies
Parents learn stress reduction skills
Parents are less isolated
Children enter kindergarten with the physical, social, emotional and cognitive skills that lead to school and life success
Children are not retained in the early grades due to behavioral problems
Families participate in their children’s education
Greater public support is realized for early childhood legislative initiatives
Children are healthy and receive appropriate medical care as needed
Children receive early intervention for developmental delays as needed
Children live in safe, stable and supportive families
• Parenting Education
• Touchpoints Project
• Parent/Child Playgroups
• Parents of Newborns Hospital Visits
• Home Visiting Collaboration
2007 Report Card on Child Well-BeingSuccess By 6: A Theory of Change

We’d like to thank those who supported the 2007 Report Card on Child Well-Being. Your good work makes all the difference.
Any Baby CanAustin Association for the Education of Young ChildrenAustin Child Guidance CenterAustin Community CollegeAustin Independent School DistrictAustin Learning AcademyAustin Partners in EducationAVANCE- AustinCenter for Child ProtectionCentral Texas Sustainability Indicators ProjectChild Inc. (Head Start)Children’s Hospital/ AISD Student Health ServicesCity of Austin Child Care CouncilCommunities In SchoolsCommunity Action NetworkDell Inc.E3 AllianceEl Buen SamaritanoFamilyConnectionsGrissom and AssociatesHealthy Child Care AustinIBMLiveable CityLower Colorado River AuthorityMainspring SchoolsNational InstrumentsOpen Door PreschoolsRaising AustinReading Is Fundamental of AustinRosewood Oaks PrimarySt. David’s Community Health FoundationSt. James’ Episcopal SchoolTexas Association of Child Care Resource and Referral AgenciesTexas Association for the Education of Young ChildrenTexas Early Childhood Education Coalition
Texas Inmate Families AssociationThe Austin ProjectTravis County Medical AllianceUnited Way Capital AreaUnited Ways of TexasWorkSource Child Care SolutionsYWCA of Greater Austin
2007 Report Card on Child Well-BeingOur Supporters
18

Healthy Happy Smart
2000 E. MLK Jr. Blvd. / Austin, Texas 78702-1340
Phone: 512-472-6267 / Fax: 512-482-8309 / www.unitedwaycapitalarea.org
Help Write More Success By 6 Stories.
With this report, we issue you a challenge. Make early childhood learning a priority in the policy decisions you make, the issues you champion and the programs you support.
Share the data provided in this report and refer to it when you need accurate, reliable information. This knowledge is power: it can improve our decision-making on how best to support the positive development of children, and help us create the kind of community in which we all want to live.
To learn more about how you can support the work of Success By 6, contact us at [email protected], or visit our website at www.sb6centraltexas.org.
Related Documents