2007-01-30 The SKF Group Year-end result, 2006 Tom Johnstone, President and CEO

2007-01-30 The SKF Group Year-end result, 2006 Tom Johnstone, President and CEO.
Dec 13, 2015
Welcome message from author
This document is posted to help you gain knowledge. Please leave a comment to let me know what you think about it! Share it to your friends and learn new things together.
Transcript
2007-01-30
The SKF Group
Year-end result, 2006
Tom Johnstone, President and CEO

2
2007-01-30
MSEK 2006 2005
Net sales 13,895 12,648
Operating profit 1,858 1,268
Operating margin 13.4% 10.0%
Profit before taxes 1,846 1,275
Net profit 1,257 862
Basic earnings per share, SEK 2.67 1.85
Cash flow after investments before
financing
1,627* 529
Fourth quarter 2006
* including acquisitions of MSEK 461 and Ovako Cash proceeds of MSEK 1,217
3
2007-01-30
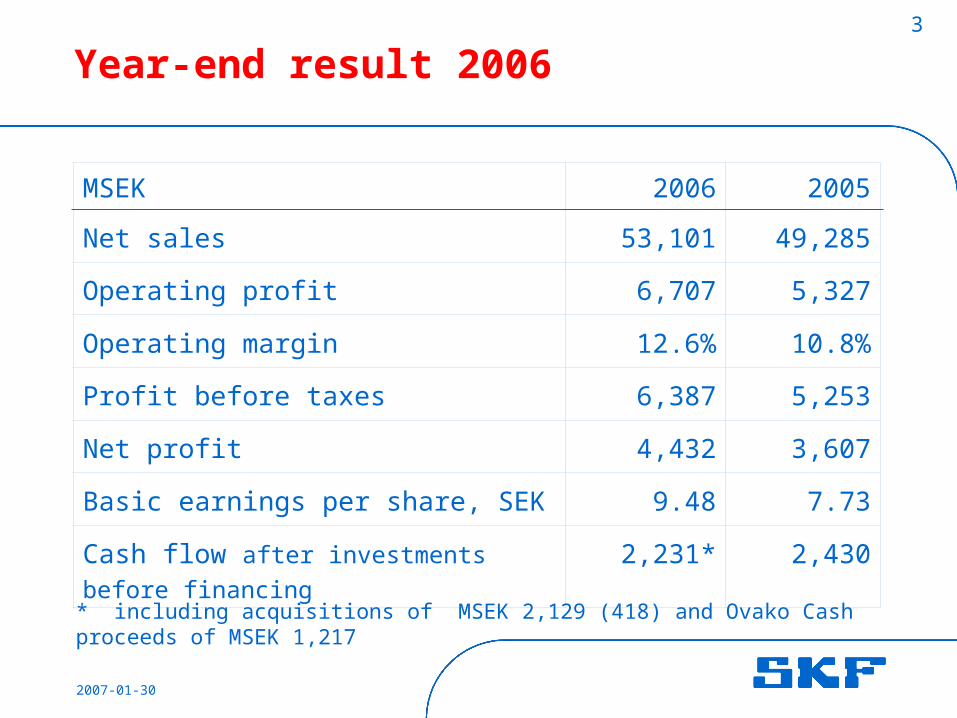
MSEK 2006 2005
Net sales 53,101 49,285
Operating profit 6,707 5,327
Operating margin 12.6% 10.8%
Profit before taxes 6,387 5,253
Net profit 4,432 3,607
Basic earnings per share, SEK 9.48 7.73
Cash flow after investments before
financing
2,231* 2,430
Year-end result 2006
* including acquisitions of MSEK 2,129 (418) and Ovako Cash proceeds of MSEK 1,217
4
2007-01-30
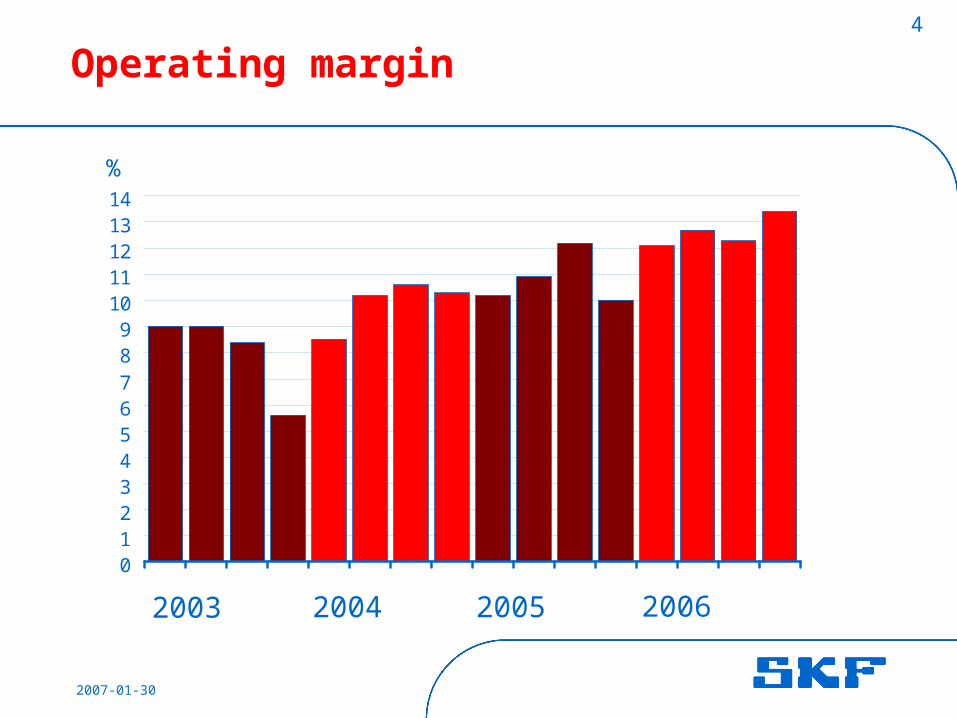
Operating margin
%
2003 2004
0123456789
1011121314
2005 2006
5
2007-01-30
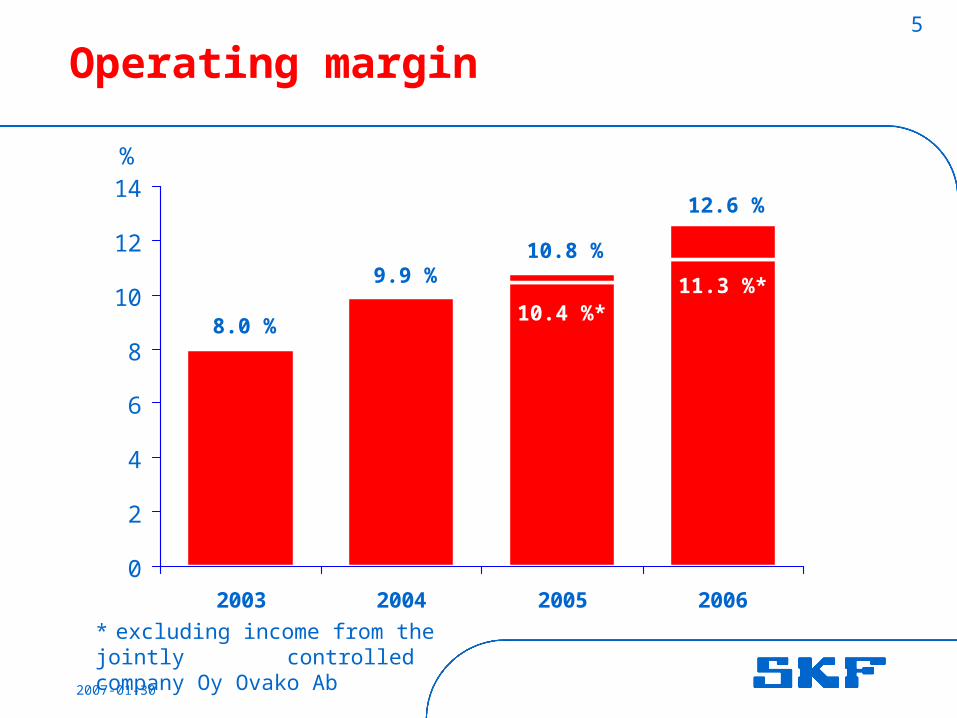
Operating margin
0
2
4
6
8
10
12
14
2003 2004 2005 2006
%
10.4 %*11.3 %*
* excluding income from the jointly controlled company Oy Ovako Ab
8.0 %
12.6 %
10.8 %9.9 %
6
2007-01-30
0
2
4
6
8
10
12
14
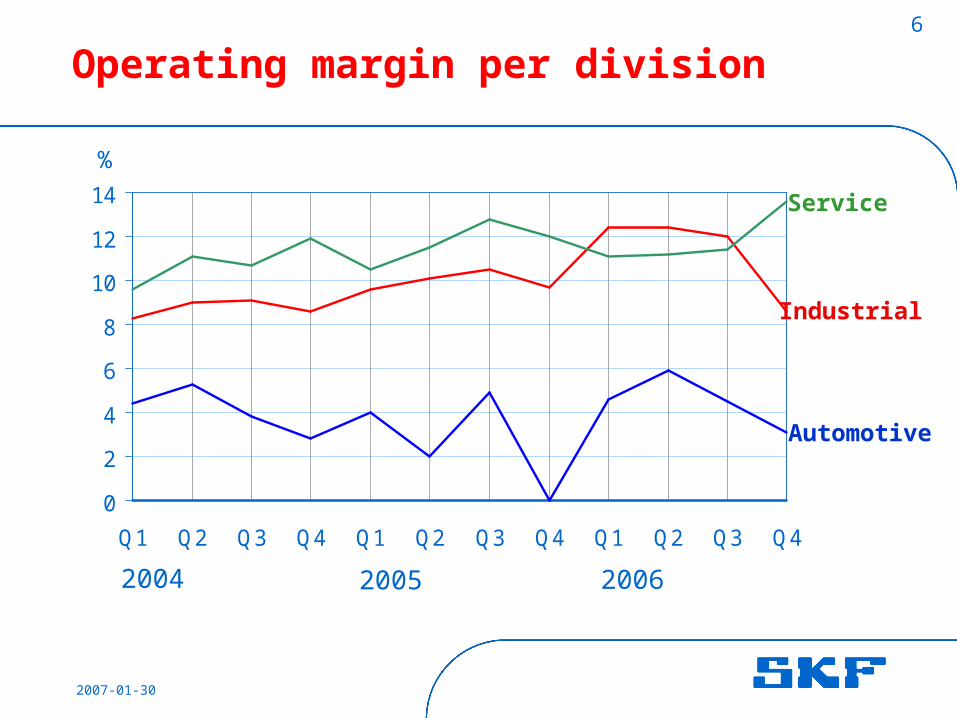
Q1 Q2 Q3 Q4 Q1 Q2 Q3 Q4 Q1 Q2 Q3 Q4
Operating margin per division
Industrial
Service
Automotive
%
2004 2005 2006
7
2007-01-30
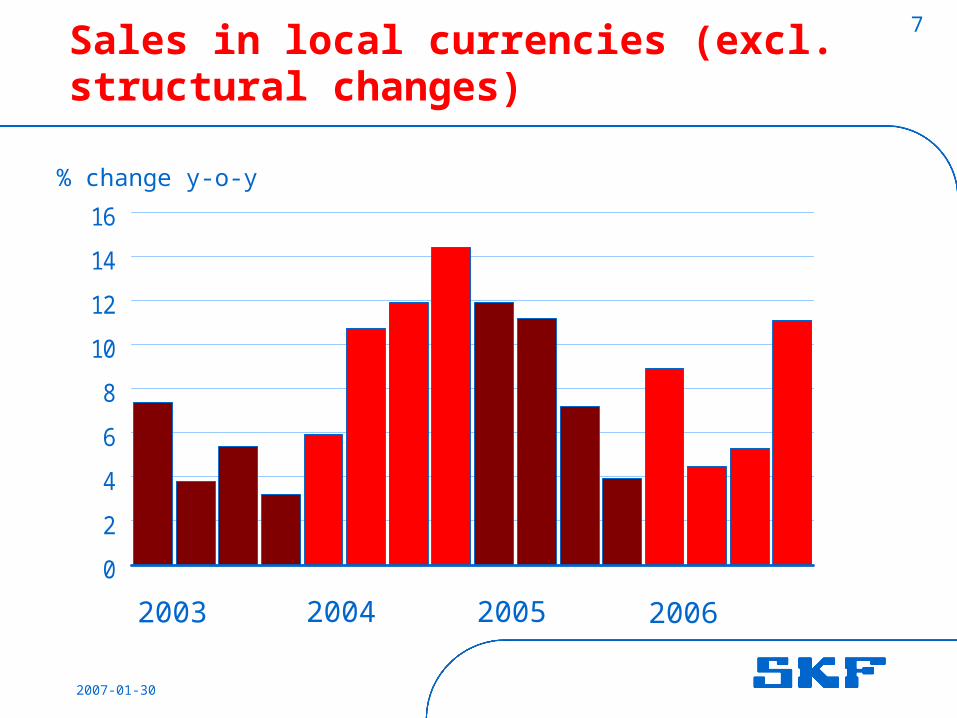
Sales in local currencies (excl. structural changes)
0
2
4
6
8
10
12
14
16
% change y-o-y
2003 2004 2005 2006

8
2007-01-30
Growth development / local currency
% Y-o-Y
0
2
4
6
8
10
12
2003 2004 2005 2006Acquisitions / DivestmentsOrganic growth
7.3
5.2
11.8
7.5

9
2007-01-30
Net sales development per quarter
Q1 Q2 Q3 Q4 Q1 Q2 Q3 Q4 Q1 Q2 Q3 Q4
4.8 8.9 9.6 10.2 8.3 7.6 5.1 1.3 6.0 2.5 3.3 8.8
0.1 0.0 2.2 2.0 2.3 0.2 -2.9 -3.7 -4.9 -0.5 1.1 4.6
1.1 1.8 2.3 4.2 3.6 3.6 2.1 2.6 2.9 2.0 2.0 2.3
6.0 10.7 14.1 16.4 14.2 11.4 4.3 0.2 4.0 4.0 6.4 15.7
-4.6 -2.3 -2.9 -3.8 -3.2 0.2 3.2 9.4 8.0 1.0 -2.1 -5.8
1.4 8.4 11.2 12.6 11.0 11.6 7.5 9.6 12.0 5.0 4.3 9.9
Percent y-o-y
2004
Volume
Structure
Price / Mix
Sales in local currency Currency
Net sales
2005 2006
10
2007-01-30
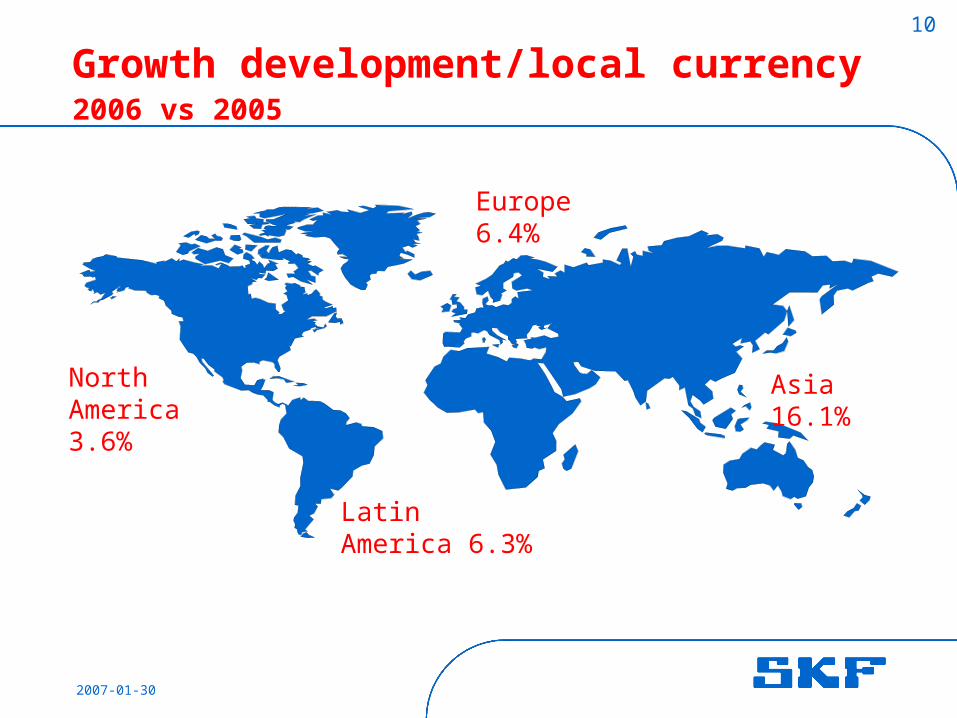
Growth development/local currency2006 vs 2005
Europe 6.4%
North America 3.6%
Asia 16.1%
Latin America 6.3%

11
2007-01-30
Industrial Division
Acquisitions
• SNFA• John Crane's lubrication systems business (SKF Safematic Inc.)
MSEK 2006 2005
Net sales 17,083
14,750
Sales incl. intra-Group sales
26,600
23,616
Operating profit 3,008 2,354
Operating margin 11.3% 10.0%
Net sales growth 15.8%organic growth 11.9% structure 4.0%currency effects -0.1%
New factories• Dalian, China - large size bearings• Pinghu, China - electromechanical
actuators and actuation systems
Restructuring charges, impairments and write-offs
• In Q4 2006, MSEK 210

12
2007-01-30
Service Division
Acquisitions• Precision Balancing & Analyzing (PB&A)• Monitek Australia• RC DEI Norge AS• PMCI (in January 2007)
MSEK 2006 2005
Net sales 17,678
16,115
Sales incl. intra-Group sales
19,344
17,653
Operating profit 2,316 2,072
Operating margin 12.0 11.7
Restructuring charges and write-offs
• In Q4 2006, MSEK 20
Net sales growth 9.7%organic growth 9.6% structure 0.2%currency effects -0.1%

13
2007-01-30
Automotive Division
Acquisitions
• Economos• Macrotech Polyseal Inc.
MSEK 2006 2005
Net sales 18,255
17,423
Sales incl. intra-Group sales
21,919
20,990
Operating profit 999 560
Operating margin 4.6 2.7New factories• Jakarta, Indonesia - small deep groove ball bearings• Shanghai, China - bearing• Busan and Taegu, Korea - bearing and seals
Net sales growth 4.8%organic growth 2.2% structure 1.9%currency effects 0.7%
Restructuring charges, impairments and write-offs
• In Q4 2006, MSEK 170

14
2007-01-30
Six Sigma
3 Dimensions: ”Standard” Six Sigma, Design for Six Sigma, Lean Six Sigma
2006 status:
• 205 Black Belts• 1,135 Green Belts• 400 + projects (total 760 projects)
Savings in 2006: approximately MSEK 200

15
2007-01-30
Cash flow, after investments before financing
-200
0
200
400
600
800
1 000
1 200
1 400
1 600
1 800
MSEK
2004 2005 2006
Cash out from acquisitions: 2006 MSEK 2,129 2005 MSEK 418 2004 MSEK 644
Cash from Ovako in Q4:2006 MSEK 1,217

16
2007-01-30
Cash flow, after investments before financing excl. acquisitions and cash effects from Ovako sale
0
200
400
600
800
1 000
1 200
1 400
1 600
MSEK
2004 2005 2006

17
2007-01-30
Net cash
-1 500
-500
500
1 500
2 500
3 500
4 500
5 500
MSEK
2003
AB SKF, dividend paid:
2003 Q2, MSEK 911
2004 Q2, MSEK 1,138
2005 Q2, MSEK 1,366
2006 Q2, MSEK 1,821
2004 Q2, Pension: MSEK 3,100
2005 Q2, Redemption, MSEK 2,846
2004
(Short-term financial assets - loans)
2005 2006
18
2007-01-30
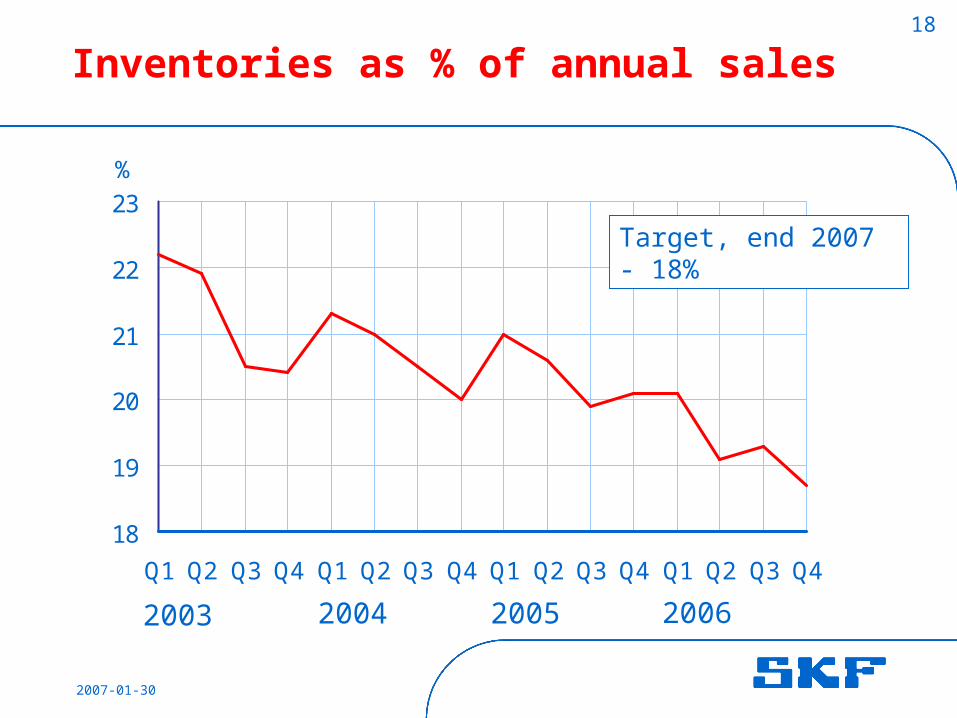
Inventories as % of annual sales
%
2003 2004
18
19
20
21
22
23
Q1 Q2 Q3 Q4 Q1 Q2 Q3 Q4 Q1 Q2 Q3 Q4 Q1 Q2 Q3 Q4
2005
Target, end 2007 - 18%
2006

19
2007-01-30
SKF capital structure
The AB SKF Board proposes the AGM to decide on:
1. a 12.5% increase in the dividend,SEK 4.50 per share
2. a share split 2:1 combined with anautomatic redemption procedureof one share for SEK 10
3. a mandate to the Board to repurchase up to 5% of the company's share
Adding up to a total distribution to shareholders ofSEK 6.6 billion
21
2007-01-30
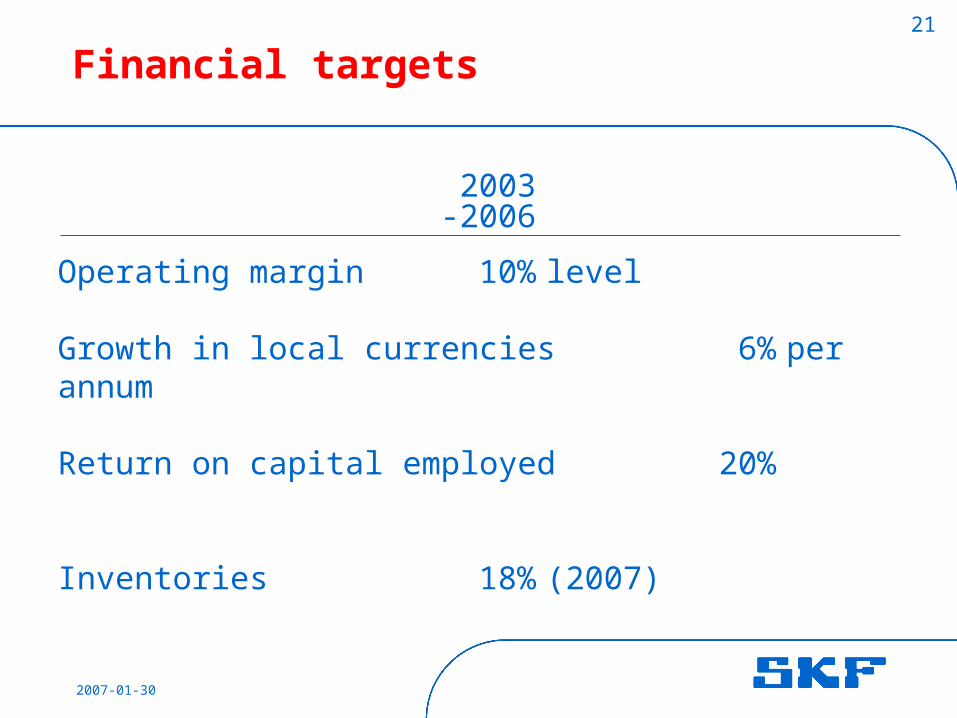
Financial targets
2003-2006
Operating margin 10% level
Growth in local currencies 6%per annum
Return on capital employed20%
Inventories 18% (2007)

22
2007-01-30
Financial targets
2003-2006
Operating margin 10% level
Growth in local currencies 6%per annum
Return on capital employed20%
Inventories 18% (2007)on plan
23
2007-01-30
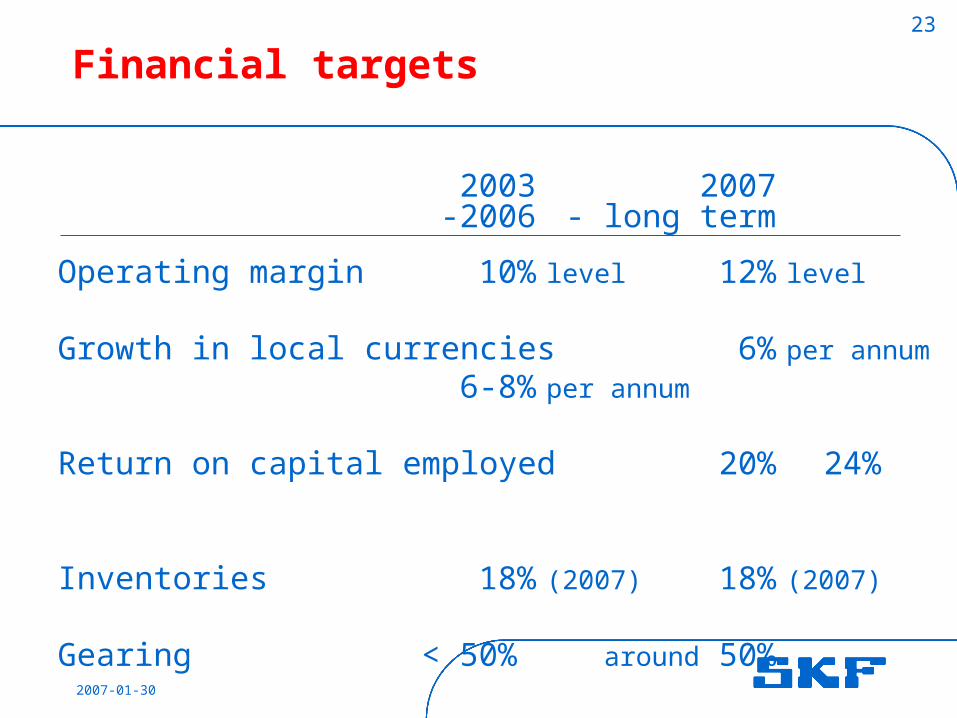
Financial targets
2003 2007-2006 - long term
Operating margin 10% level 12% level
Growth in local currencies 6%per annum6-8% per annum
Return on capital employed20% 24%
Inventories 18% (2007) 18% (2007)
Gearing < 50% around 50%

24
2007-01-30
Financial targets
Operating margin level 12%
• Focus on positive price mix- new products and solutions- eliminate loss making business
• Operational efficiency, utilisation and flexibility
• Increased production in best cost countries
• Reduced purchasing cost
• Six Sigma

25
2007-01-30
Operating margin - a longer perspective
-4-202468
101214
1993
1994
1995
1996
1997
1998
1999
2000
2001
2002
2003
2004
2005
2006
%1993 - 2003
Excluding income from Ovako
26
2007-01-30
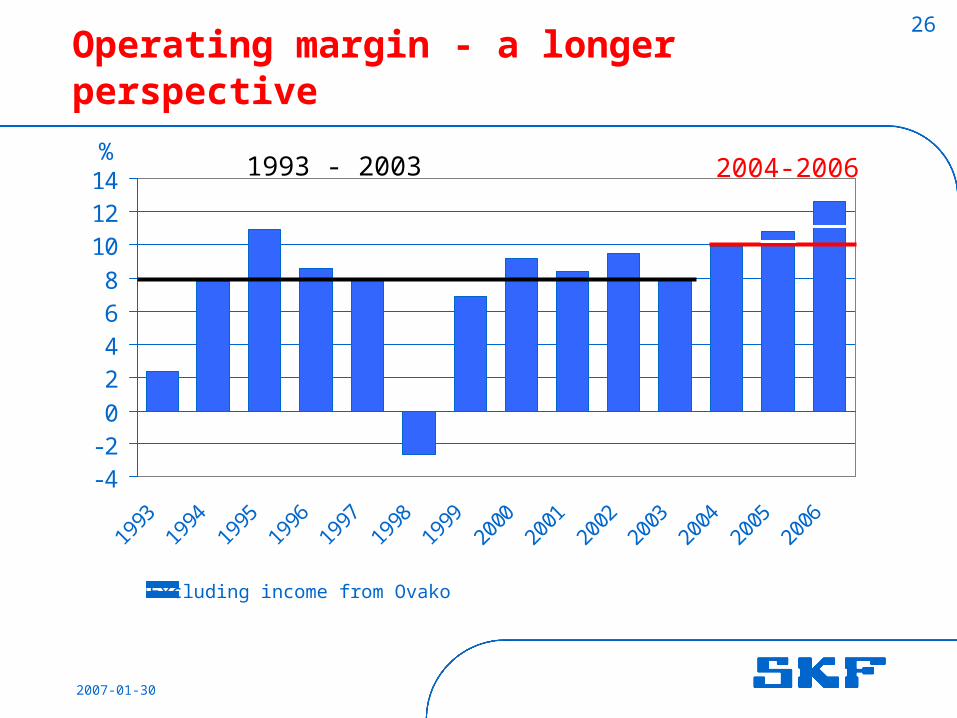
Operating margin - a longer perspective
-4-202468
101214
1993
1994
1995
1996
1997
1998
1999
2000
2001
2002
2003
2004
2005
2006
%2004-2006
Excluding income from Ovako
1993 - 2003

27
2007-01-30
Operating margin - a longer perspective
-4-202468
101214
1993
1994
1995
1996
1997
1998
1999
2000
2001
2002
2003
2004
2005
2006
2007
2008
2009
%2004-2006New target level
Excluding income from Ovako
1993 - 2003
28
2007-01-30
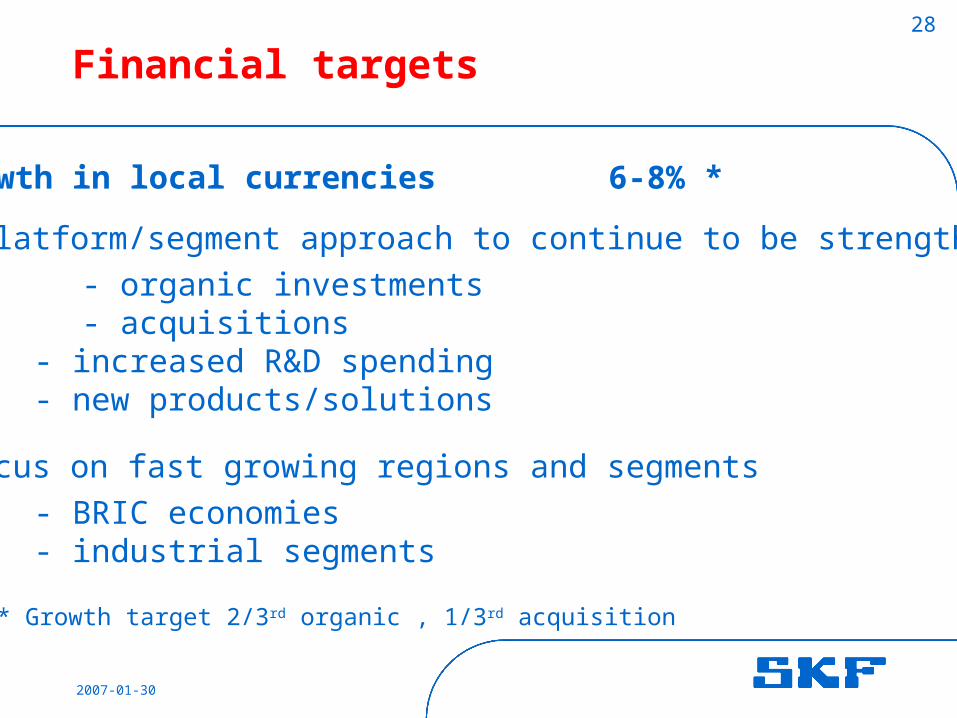
Financial targets
Growth in local currencies 6-8% *
• Platform/segment approach to continue to be strengthened- organic investments- acquisitions
- increased R&D spending- new products/solutions
•Focus on fast growing regions and segments- BRIC economies- industrial segments
* Growth target 2/3rd organic , 1/3rd acquisition

29
2007-01-30
Growth in local currencies – a longer perspective
-6
-4
-2
0
2
4
6
8
10
12
1996 1997 1998 1999 2000 2001 2002 2003 2004 2005 2006
%
30
2007-01-30
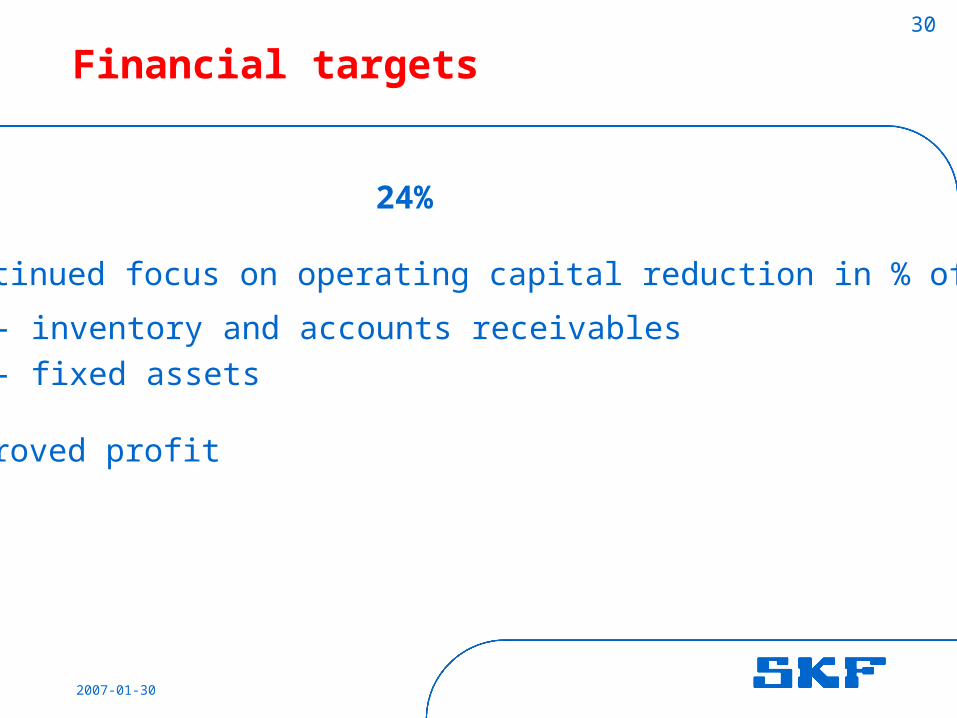
Financial targets
ROCE 24%
• Continued focus on operating capital reduction in % of sales
- inventory and accounts receivables- fixed assets
• Improved profit

31
2007-01-30
ROCE – a longer perspective
-5
0
5
10
15
20
25
30
1996 1997 1998 1999 2000 2001 2002 2003 2004 2005 2006
%
As from 2003, restated according to IFRS except for financial instrumentsAs from 2005, financial instruments accounted for in accordance with IFRS

32
2007-01-30
Financial targets
2003 2007-2006 - long term
Operating margin 10% level 12% level
Growth in local currencies 6%per annum6-8% per annum
Return on capital employed20% 24%
Inventories 18% (2007) 18% (2007)
Gearing < 50% around 50%

33
2007-01-30
January 2007: Outlook for the first quarter 2007(compared to the fourth quarter 2006)
The market demand for SKF's products and services in the first quarter 2007 is expected to be slightly higher. The demand is expected to be higher in Europe and Latin America, significantly higher in Asia and to be unchanged in North America. The demand for the Industrial and Service Division's products and services is expected to be higher and for the Automotive Division is expected to be slightly lower.
The manufacturing level for the first quarter of 2007 will be unchanged compared with the fourth quarter 2006 and higher compared with the first quarter 2006.
34
2007-01-30
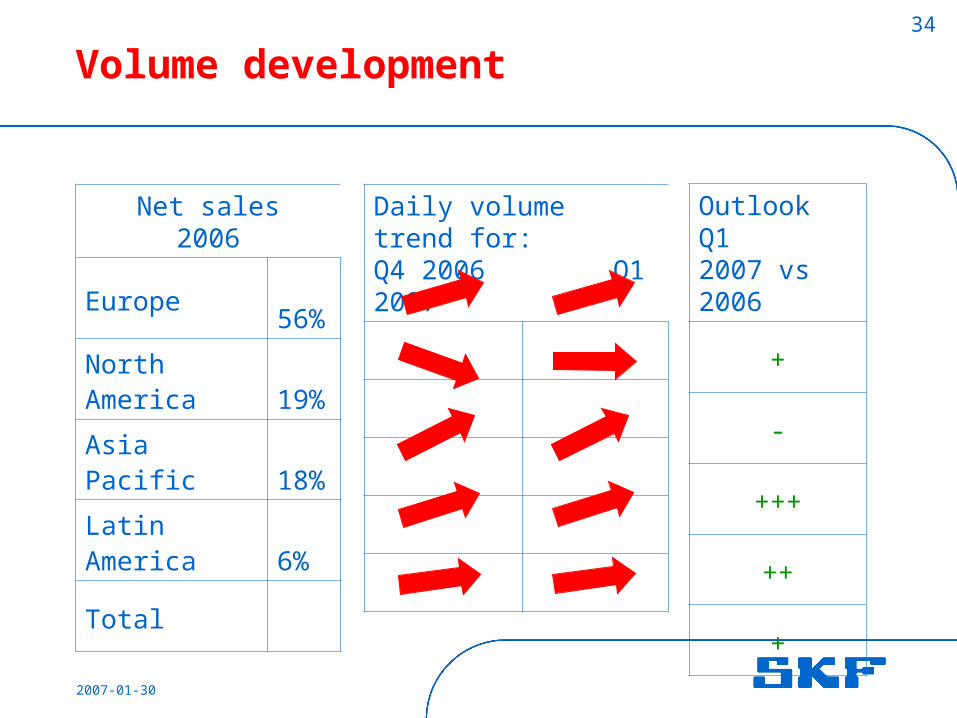
Volume development
Daily volume trend for: Q4 2006 Q1 2007
Net sales2006
Europe 56%
North America
19%
Asia Pacific 18%
Latin America
6%
Total
Outlook Q12007 vs 2006
+
-
+++
++
+
35
2007-01-30
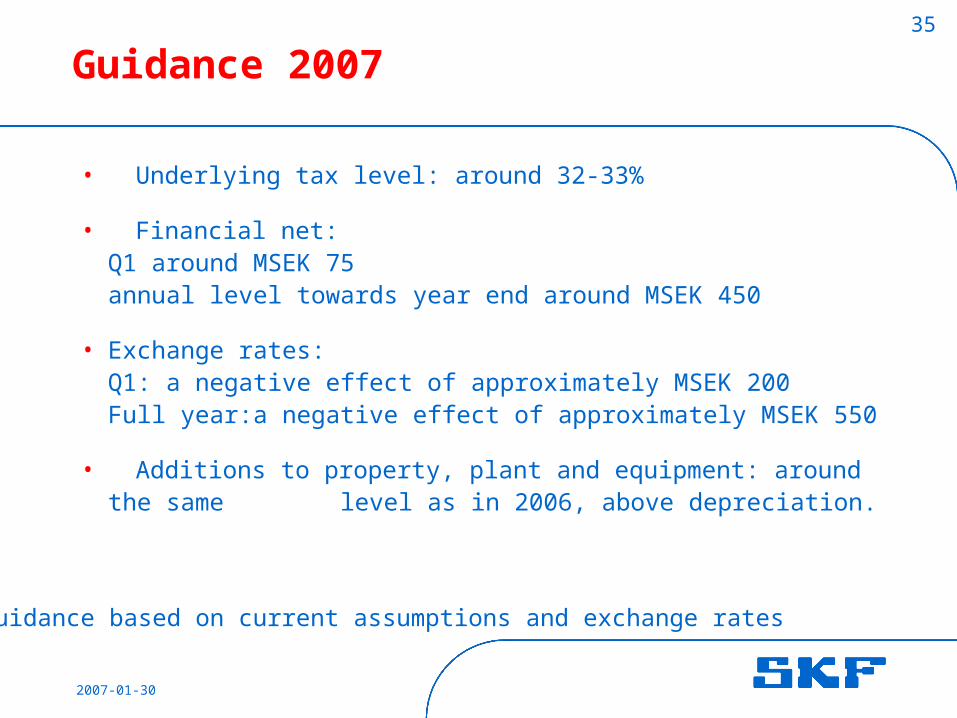
Guidance 2007
• Underlying tax level: around 32-33%
• Financial net:Q1 around MSEK 75annual level towards year end around MSEK 450
• Exchange rates:Q1: a negative effect of approximately MSEK 200 Full year:a negative effect of approximately MSEK 550
• Additions to property, plant and equipment: around the same level as in 2006, above depreciation.
Guidance based on current assumptions and exchange rates
36
2007-01-30
Cautionary statement
This report contains forward-looking statements that are based on the current expectations of the management of SKF.
Although management believes that the expectations reflected in such forward-looking statements are reasonable, no assurance can be given that such expectations will prove to have been correct. Accordingly, results could differ materially from those implied in the forward-looking statements as a result of, among other factors, changes in economic, market and competitive conditions, changes in the regulatory environment and other government actions, fluctuations in exchange rates and other factors mentioned in SKF's latest 20-F report on file with the SEC (United States Securities and Exchange Commission) under "Forward-Looking Statements" and "Risk Factors".

Related Documents