2006 Air Quality Summary Report Pima County Board of Supervisors Ann Day Ramon Valadez Sharon Bronson Raymond Carroll Richard Elías Pima County Administrator Charles H. Huckelberry Pima County Department of Environmental Quality Ursula Kramer Director Air Quality Technical Operations and Monitoring Division Wayne Byrd Program Manager Data Collection Group Data Management Group Ted Gould, Supervisor Tom Coffin, Supervisor Jim McDonnell, Sr. Instrument Technician Deborah Jentoft, Air Quality Analyst Ray Felix, Sr. Instrument Technician Sergio Martinez, Info. Sys. Coordinator Quality Assurance Group Mike Draper, Program Coordinator July 2007 AQ-357

Welcome message from author
This document is posted to help you gain knowledge. Please leave a comment to let me know what you think about it! Share it to your friends and learn new things together.
Transcript
2006 Air Quality Summary Report
Pima County Board of Supervisors
Ann Day
Ramon Valadez Sharon Bronson Raymond Carroll
Richard Elías
Pima County Administrator Charles H. Huckelberry
Pima County Department of Environmental Quality Ursula Kramer
Director
Air Quality Technical Operations and Monitoring Division Wayne Byrd
Program Manager
Data Collection Group Data Management Group Ted Gould, Supervisor Tom Coffin, Supervisor Jim McDonnell, Sr. Instrument Technician Deborah Jentoft, Air Quality Analyst Ray Felix, Sr. Instrument Technician Sergio Martinez, Info. Sys. Coordinator Quality Assurance Group Mike Draper, Program Coordinator
July 2007
AQ-357
2
Table of Contents List of Figures / Tables 3 List of Abbreviations / Acronyms 4 Executive Summary 5-8 2006 Air Quality Summary Chart 8 Introduction 9-16
Criteria Pollutants Chart 10 National Ambient Air
Quality Standards Chart 11 EPA’s Revisions to the NAAQS 12 and Regulatory Requirements Tucson area Topography and Meteorology 12 Tucson area Status of Criteria Pollutants 13-14 Air Quality Monitoring
Locations & Site Map 15-16 2006 Data Summary 17-20 Carbon Monoxide & Ozone 17- 18 Particulate Matter (PM10) & (PM2.5) 19 Nitrogen Dioxide & Sulfur Dioxide 20 Air Quality Trends 21-24 Air Quality Index 25-27 Technical Operations Division 28-29
Air Quality Information Web Sites & Phone Numbers 29
3
List of Figures / Tables
List of Figures
Figure 1 – Air Quality Monitoring Locations Map ………………………………………..16 2 – 22nd & Craycrift, 2006 Carbon Monoxide Hourly Average Values………...... 21 3 – 22nd & Craycroft, 2006 Ozone Hourly Average Values ………………..……...21 4 – 22nd & Alvernon, 2005 – 2006 Carbon Monoxide Season Values ..…………..22 5 – Children’s Park, 2006 Ozone Season Values …………………………………22 6 – 1992-2006 PM10 Annual Averages …………………………………………… 23 7 – 1995-2006 Carbon Monoxide 8-Hour Average Values ..…………………...…23 8 – 1990-2006 Ozone Annual Averages.….……………………….…………...….24 9 – 1999 -2006 PM2.5 98th Percentile Values...……………………………………..24 10 – 2006 AQI Pollutant Percentages………………………………………………25
List of Tables Table 1 – Criteria Pollutants ..…………………………………………………..………10
2 – National Ambient Air Quality Standards (NAAQS) ...………………………..11 3 – Air Quality Monitoring Locations ……..……………………………………...15 4 – Carbon Monoxide Summary Values for 2006 …..……………………………17 5 – Ozone One Hour Average Summary Values for 2006……………………….. 17 6 – Ozone Eight Hour Average Summary Values for 2006 ………………………18 7 – Particulate Matter PM10 Summary Values for 2006 …………………………..19 8 – Particulate Matter PM2.5 Summary Values for 2006 .……...………………….19 9 – Nitrogen Dioxide Summary Values for 2006………………………………… 20 10 – Sulfur Dioxide Summary Values for 2006 …………………………………..20 11 – AQI Reporting Table for Ozone and Carbon Monoxide …………………….26 12 – AQI Reporting Table for Particulate Matter …………………………………27

4
List of Abbreviations / Acronyms ADEQ Arizona Department of Environmental Quality AQI Air Quality Index, an index used to report air pollutant concentrations and associated
health effects to the public. CO The chemical symbol for carbon monoxide, one of the criteria air pollutants. EPA United States Environmental Protection Agency FRM Federal Reference Method NAAQS National Ambient Air Quality Standards, the levels of pollutant concentration which are
established to protect human health and welfare. Currently, there are six principal pollutants, which are called “criteria” air pollutants, with established levels.
NAMS National Air Monitoring Stations NO2 The chemical symbol for nitrogen dioxide, one of the criteria air pollutants. NOx Total oxides of nitrogen (NO + NO2) O3 The chemical symbol for ozone, one of the criteria air pollutants. Pb The chemical symbol for lead, one of the criteria air pollutants. PDEQ Pima County Department of Environmental Quality PM10 Particulate Matter with an aerodynamic diameter of 10 micrometers or less, one of the
criteria air pollutants. PM2.5 Particulate matter with an aerodynamic diameter less than or equal to 2.5 micrometers, one
of the criteria air pollutants. ppm Parts per million, a unit of concentration, commonly used to express gaseous
concentrations. ppb Parts per billion, a unit of concentration 1000 ppb = 1 ppm. Used to express gaseous
concentrations. SLAMS State and Local Air Monitoring Stations SO2 The chemical symbol for sulfur dioxide, one of the criteria air pollutants. SP Special Purpose site TSP Total Suspended Particulates. A former criteria air pollutant which was replaced by PM10. µg/m3 Micrograms per cubic meter, a metric unit used to express concentration. VOC Volatile Organic Compound

5
Executive Summary The Pima County Department of Environmental Quality (PDEQ) monitors air pollutants in eastern Pima County. The National Ambient Air Quality Standards (NAAQS) are followed for the monitoring and analysis of “criteria” pollutants which are: carbon monoxide (CO), ground level ozone (O3), particulate matter (PM2.5, PM10), nitrogen dioxide (NO2), sulfur dioxide (SO2) and lead (Pb). There were no violations of the NAAQS in Pima County in 2006. Violations and exceedances of the standard are explained on page 11 of this document.
Two sizes of particulate matter are monitored in Pima County. PM10 is particulate
matter with an aerodynamic diameter of 10 microns or less and PM2.5 is particulate matter with an aerodynamic diameter of 2.5 microns or less. Particulate matter is a health concern because when inhaled, the particles are able to pass through the body’s protective filtration system and enter the lungs. In 1999, Pima County violated the PM10 standard set by the Environmental Protection Agency (EPA). After this violation, PDEQ provided technical documentation that showed the exceedances to be the result of natural events. A Natural Events Action Plan (NEAP) was adopted, allowing Pima County to remain in attainment status for PM10 by following the Best Available Control Measures outlined in the NEAP. The NEAP was put in place in an effort to protect public health and welfare on days with high ambient levels of PM10. The 24-hour NAAQS for PM10 is 150 micrograms per cubic meter (µg/m3). The highest level recorded in Pima County in 2006 was 144 µg/m3 at the Corona de Tucson location on July 4th.
Number of PM10 Exceedances 1995-2006
0
1
2
3
4
5
6
7
1995 1996 1997 1998 1999 2000 2001 2002 2003 2004 2005
Year
# of
Exc
eeda
nces
1998
1999
Natural Events
Exceedances
Forest Fire Santa Catalina Mountain Range
Drought conditions with high winds
Pima County monitors PM2.5 at 6 locations. PM2.5 has been linked to health problems including respiratory and heart problems, and can also contribute to poor visibility and urban haze. There have been no exceedances of the NAAQS for PM2.5 since monitoring began in 1999. The 24-
PM
6
hour NAAQS for PM2.5 is 65 µg/m3. The highest 24-hour PM2.5 concentration in 2006 in Pima County was 35 µg/m3 at the Rose Elementary location.
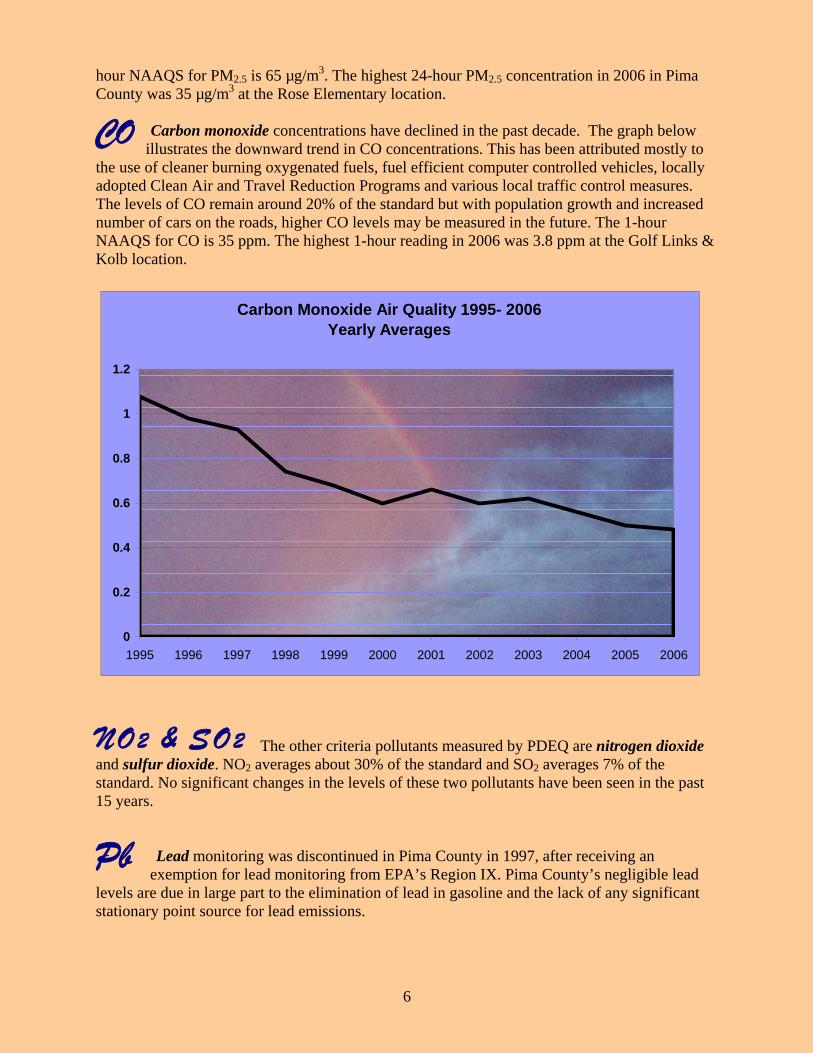
Carbon monoxide concentrations have declined in the past decade. The graph below
illustrates the downward trend in CO concentrations. This has been attributed mostly to the use of cleaner burning oxygenated fuels, fuel efficient computer controlled vehicles, locally adopted Clean Air and Travel Reduction Programs and various local traffic control measures. The levels of CO remain around 20% of the standard but with population growth and increased number of cars on the roads, higher CO levels may be measured in the future. The 1-hour NAAQS for CO is 35 ppm. The highest 1-hour reading in 2006 was 3.8 ppm at the Golf Links & Kolb location.
Carbon Monoxide Air Quality 1995- 2006 Yearly Averages
0
0.2
0.4
0.6
0.8
1
1.2
1995 1996 1997 1998 1999 2000 2001 2002 2003 2004 2005 2006
The other criteria pollutants measured by PDEQ are nitrogen dioxide
and sulfur dioxide. NO2 averages about 30% of the standard and SO2 averages 7% of the standard. No significant changes in the levels of these two pollutants have been seen in the past 15 years.
Lead monitoring was discontinued in Pima County in 1997, after receiving an
exemption for lead monitoring from EPA’s Region IX. Pima County’s negligible lead levels are due in large part to the elimination of lead in gasoline and the lack of any significant stationary point source for lead emissions.
CO
NO2 & SO2
Pb
7
Ozone Air Quality 1995 - 20064th Highest 8- Hour Average Concentration
0.010.015
0.020.025
0.030.035
0.040.045
0.050.055
0.060.065
0.070.075
0.080.085
0.09
1995 1996 1997 1998 1999 2000 2001 2002 2003 2004 2005 2006
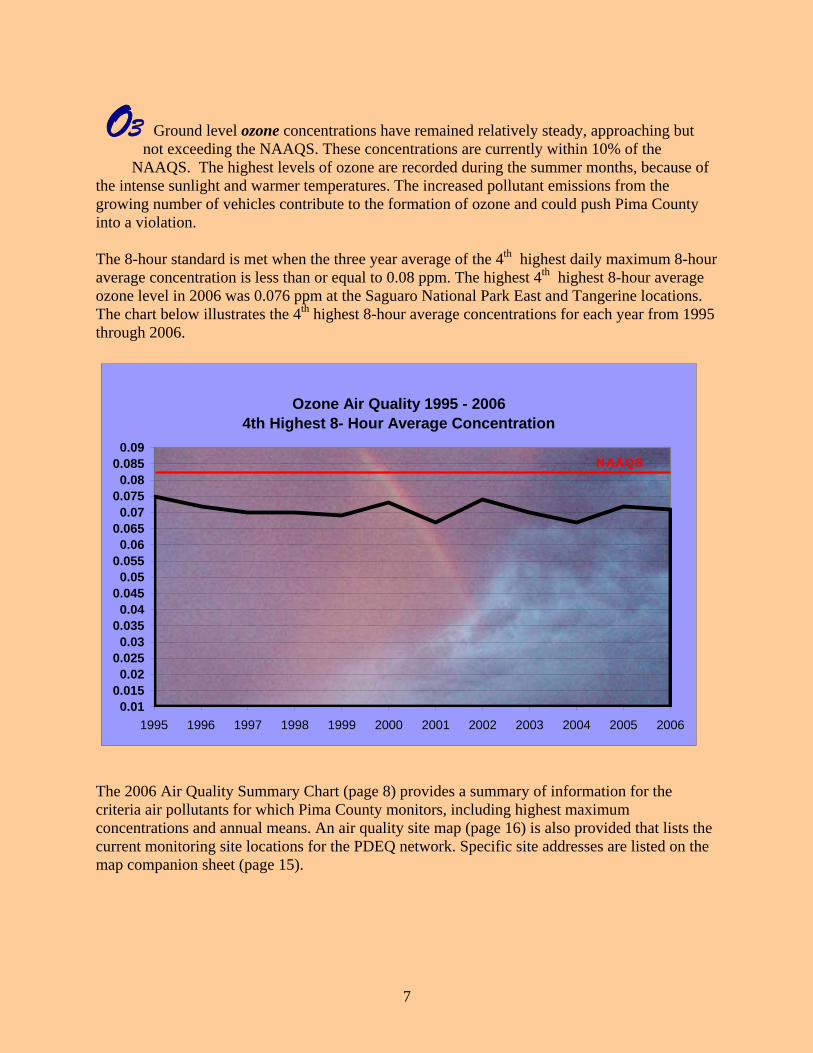
Ground level ozone concentrations have remained relatively steady, approaching but not exceeding the NAAQS. These concentrations are currently within 10% of the
NAAQS. The highest levels of ozone are recorded during the summer months, because of the intense sunlight and warmer temperatures. The increased pollutant emissions from the growing number of vehicles contribute to the formation of ozone and could push Pima County into a violation. The 8-hour standard is met when the three year average of the 4th highest daily maximum 8-hour average concentration is less than or equal to 0.08 ppm. The highest 4th highest 8-hour average ozone level in 2006 was 0.076 ppm at the Saguaro National Park East and Tangerine locations. The chart below illustrates the 4th highest 8-hour average concentrations for each year from 1995 through 2006.
The 2006 Air Quality Summary Chart (page 8) provides a summary of information for the criteria air pollutants for which Pima County monitors, including highest maximum concentrations and annual means. An air quality site map (page 16) is also provided that lists the current monitoring site locations for the PDEQ network. Specific site addresses are listed on the map companion sheet (page 15).
O3
NAAQS

8
Pima County Department of Environmental Quality 2006 Air Quality Summary Chart
Carbon
Monoxide (CO) ppm
Ozone (O3) ppm
Particulate Matter (PM10)
µg/m3
Particulate Matter
(PM2.5)µg/m3
Nitrogen Dioxide (NO2)
ppm
Sulfur Dioxide (SO2) ppm
Map No.
Location of Monitoring Stations NAAQS
Max Conc. 1 Hr 35 ppm
Max Conc. 8 Hr 9 ppm
Max Conc. 1 Hr 0.12 ppm
4th Highest Conc. 8 Hr 0.08 ppm
Max Conc. 24 Hr 150 µg/m3
Arith. Annual Mean 50 µg/m3 *
Max Conc. 24 Hr 65 µg/m3
**
Arith. Annual Mean 15 µg/m3
Max Conc. 1 Hr None
Arith. Annual Mean 0.053 ppm
Max Conc. 3 Hr 0.5 ppm
Max Conc. 24 Hr 0.14 ppm
Arith. Annual Mean 0.03 ppm
1 Downtown 2.9 1.4 .082 .073 2 22nd & Craycroft 3.2 1.6 .082 .069 .051 .0157 .009 .004 .0011 3 22nd & Alvernon 3.4 2.0 4 Geronimo 23 8.50 5 South Tucson 109 34.3 6 Prince Road 72 35.2 7 Broadway &
Swan 60 26.8
8 Corona de Tucson
144 22.6
9 Santa Clara 104 35.5 10 Green Valley .083 .070 81 16.8 9 2.79 11 Children’s Park 1.7 1.1 .082 .072 16 5.79 .054 .0148 12 Orange Grove 101 31.8 19 5.80 13 Tangerine .088 .076 104 22.9 14 Rose Elementary .075 .067 35 9.02 15 Coachline .083 .071 20 7.95 16 Cherry & Glenn 3.4 2.3 17 Fairgrounds .083 .068 18 Saquaro National
Park East .087 .076
23 Golf Links & Kolb
3.8 1.8
Conc. -Concentration ppm - Parts per Million Parts of Air, by Volume Empty Spaces - The pollutant is not monitored at this site Arith.- Arithmetic µg/m3 - Micrograms per Cubic Meter of Air * December 17, 2006 Standard revoked **December 17, 2006 standard changed to 35 ug/m3
9
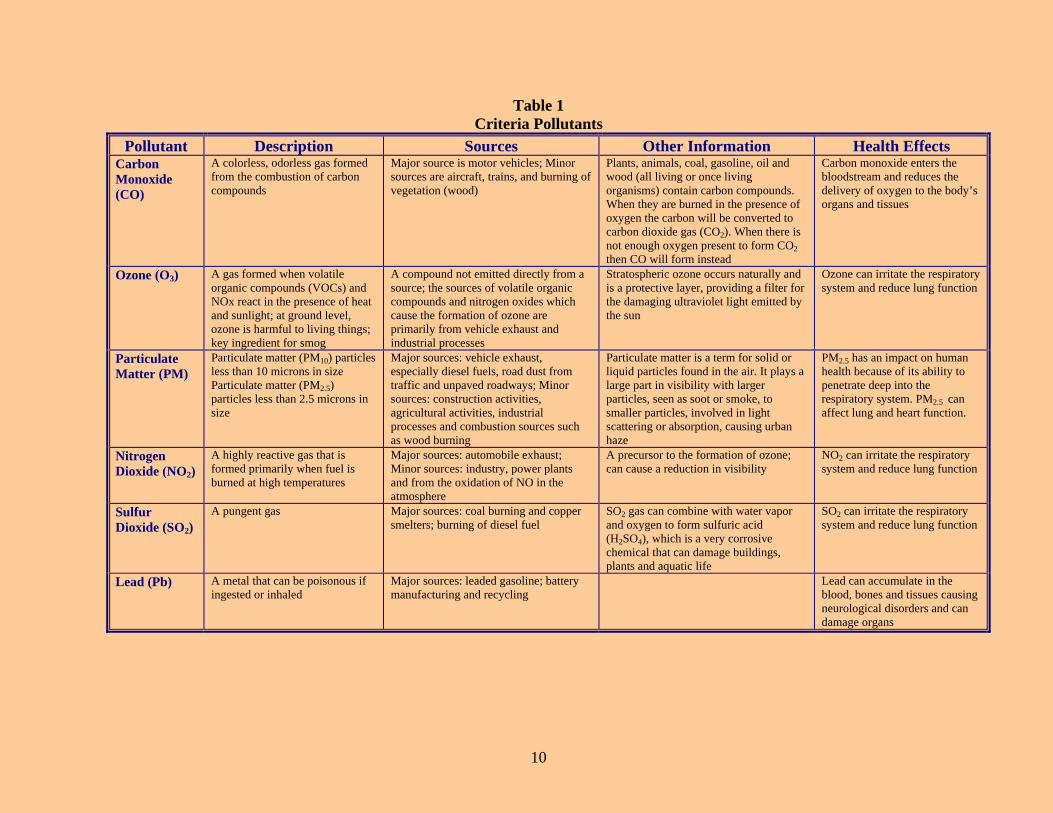
Introduction Pima County Department of Environmental Quality monitors ambient (outdoor) air pollutants throughout eastern Pima County, including the Tucson metropolitan area and Green Valley. Monitoring for five of the six principal pollutants, called “criteria” pollutants, is performed in accordance with the National Ambient Air Quality Standards (NAAQS) set by the Environmental Protection Agency (EPA) to comply with the Federal Clean Air Act. The five air pollutants monitored by PDEQ are: carbon monoxide (CO), ozone (O3), particulate matter (PM10, PM2.5), nitrogen dioxide (NO2), and sulfur dioxide (SO2). Locations of these monitors are based on emission source distribution and population exposure (40 CFR, Part 58, App. D). Table 1 includes a description of the criteria pollutants and the potential health effects. Lead monitoring in Pima County was discontinued in March of 1997. The Environmental Protection Agency regulations allowed for the cessation of ambient lead monitoring in Pima County since the levels were so low. The reduction of lead readings below a detectable level is due primarily to the federal regulation eliminating lead in automobile gasoline.
10
Table 1 Criteria Pollutants
Pollutant Description Sources Other Information Health Effects Carbon Monoxide (CO)
A colorless, odorless gas formed from the combustion of carbon compounds
Major source is motor vehicles; Minor sources are aircraft, trains, and burning of vegetation (wood)
Plants, animals, coal, gasoline, oil and wood (all living or once living organisms) contain carbon compounds. When they are burned in the presence of oxygen the carbon will be converted to carbon dioxide gas (CO2). When there is not enough oxygen present to form CO2 then CO will form instead
Carbon monoxide enters the bloodstream and reduces the delivery of oxygen to the body’s organs and tissues
Ozone (O3) A gas formed when volatile organic compounds (VOCs) and NOx react in the presence of heat and sunlight; at ground level, ozone is harmful to living things; key ingredient for smog
A compound not emitted directly from a source; the sources of volatile organic compounds and nitrogen oxides which cause the formation of ozone are primarily from vehicle exhaust and industrial processes
Stratospheric ozone occurs naturally and is a protective layer, providing a filter for the damaging ultraviolet light emitted by the sun
Ozone can irritate the respiratory system and reduce lung function
Particulate Matter (PM)
Particulate matter (PM10) particles less than 10 microns in size Particulate matter (PM2.5) particles less than 2.5 microns in size
Major sources: vehicle exhaust, especially diesel fuels, road dust from traffic and unpaved roadways; Minor sources: construction activities, agricultural activities, industrial processes and combustion sources such as wood burning
Particulate matter is a term for solid or liquid particles found in the air. It plays a large part in visibility with larger particles, seen as soot or smoke, to smaller particles, involved in light scattering or absorption, causing urban haze
PM2.5 has an impact on human health because of its ability to penetrate deep into the respiratory system. PM2.5 can affect lung and heart function.
Nitrogen Dioxide (NO2)
A highly reactive gas that is formed primarily when fuel is burned at high temperatures
Major sources: automobile exhaust; Minor sources: industry, power plants and from the oxidation of NO in the atmosphere
A precursor to the formation of ozone; can cause a reduction in visibility
NO2 can irritate the respiratory system and reduce lung function
Sulfur Dioxide (SO2)
A pungent gas Major sources: coal burning and copper smelters; burning of diesel fuel
SO2 gas can combine with water vapor and oxygen to form sulfuric acid (H2SO4), which is a very corrosive chemical that can damage buildings, plants and aquatic life
SO2 can irritate the respiratory system and reduce lung function
Lead (Pb) A metal that can be poisonous if ingested or inhaled
Major sources: leaded gasoline; battery manufacturing and recycling
Lead can accumulate in the blood, bones and tissues causing neurological disorders and can damage organs

11
Table 2 below lists the Primary and Secondary NAAQS for each pollutant in terms of pollutant level and averaging time used to evaluate compliance. The primary standard is intended to protect public health, in particular, the health of the most susceptible individuals, such as children, elderly and those with respiratory illnesses. The secondary standard is to protect against damage to crops and vegetation, decreased visibility, and harm to animals and ecosystems. The averaging times, such as a 24-hour average or an annual average, protect the population from adverse health effects associated with peak short term exposure or long term exposure to these air pollutants. An exceedance of the standard occurs when a recorded pollutant concentration is greater than the standard level concentration. A violation of the standard is when the recorded pollutant levels exceed the standard the number of times indicated in the NAAQS.
Table 2
National Ambient Air Quality Standards (NAAQS)
Pollutant Primary (Health Related)
Secondary (Welfare Related)
Type of Average Standard Level Concentration a
Type of Average
Standard Level Concentration
8-Hour b 9 ppm (10 µg/m3) No Secondary Standard CO 1-Hour b 35 ppm (40 µg/m3) No Secondary Standard 1-Hour c 0.12 ppm (235 µg/m3) Same as Primary O3 8-Hour d 0.08 ppm (157 µg/m3) Same as Primary Annual Arithmetic Mean e 50 µg/m3 Same as Primary PM10 24-Hour e 150 µg/m3 Same as Primary Annual Arithmetic Mean f 15 µg/m3 Same as Primary PM2.5 24-Hour f 65 µg/m3 Same as Primary
NO2 Annual Arithmetic Mean 0.053 ppm (100 µg/m3) Same as Primary Annual Arithmetic Mean 0.03 ppm (80 µg/m3) SO2 24-Hour b 0.14 ppm (365 µg/m3)
3-Hour b 0.50 ppm (1,300 µg/m3)
Pb Calendar Quarter 1.5 µg/m3 Same as Primary
a Parenthetical value is an approximately equivalent concentration (40 CFR, Part 50). b Not to be exceeded more than once per year. c The standard is met when the expected number of days per year with maximum hourly average concentrations above 0.12 ppm is equal to or less than one (App. H). d The standard is met when the three year average of the annual fourth highest daily maximum concentration is less than or equal to 0.08 ppm. e The 24-hour standard is met when the expected number of exceedances in a year averaged over three years is less than or equal to one (App. K). The annual standard (revoked December 17, 2006) is met when the three year average of the expected annual arithmetic mean concentration is less than or equal to 50 µg/m3. f The 24-hour standard is met when the three year average of the 98th percentile value is less than or equal to 65 µg/m3(revised December 17, 2006 to 35 µg/m3 ). The annual standard is met when the annual average of the quarterly concentrations is less than or equal to 15 µg/m3, when averaged over 3 years. Reference: Http://www.epa.gov/air/criteria.html
12
EPA’s Revisions to the NAAQS and Regulatory Requirements
• EPA revised the Particulate Matter standards effective December 17, 2006. The revisions
include: revoking the PM10 annual standard due to lack of evidence linking long term exposure to health problems and lowering the PM2.5 24 hour standard from 65ug/m3 to 35ug/m3. The 2007 Pima County DEQ Air Quality Summary Report will reflect these changes.
• EPA revised the minimum monitoring network requirements (40 CFR 58, Appendix D). There is no longer a minimum number of required monitors for SO2, CO and NO2. Pima County DEQ anticipates no changes to the air monitoring network and will remain at or above the required number of monitors for each of the criteria pollutants.
• There will no longer be National Air Monitoring Stations (NAMS) designated monitors, consequently, Pima County will only have State and Local Air Monitoring Stations (SLAMS) and Special Purpose Monitors (SPM). Pima County is in the process of changing the designation of the NAMS monitors to SP and SLAMS, which will not take effect until approval from USEPA, Region IX. The 2007 Pima County DEQ Air Quality Summary Report will reflect these changes.
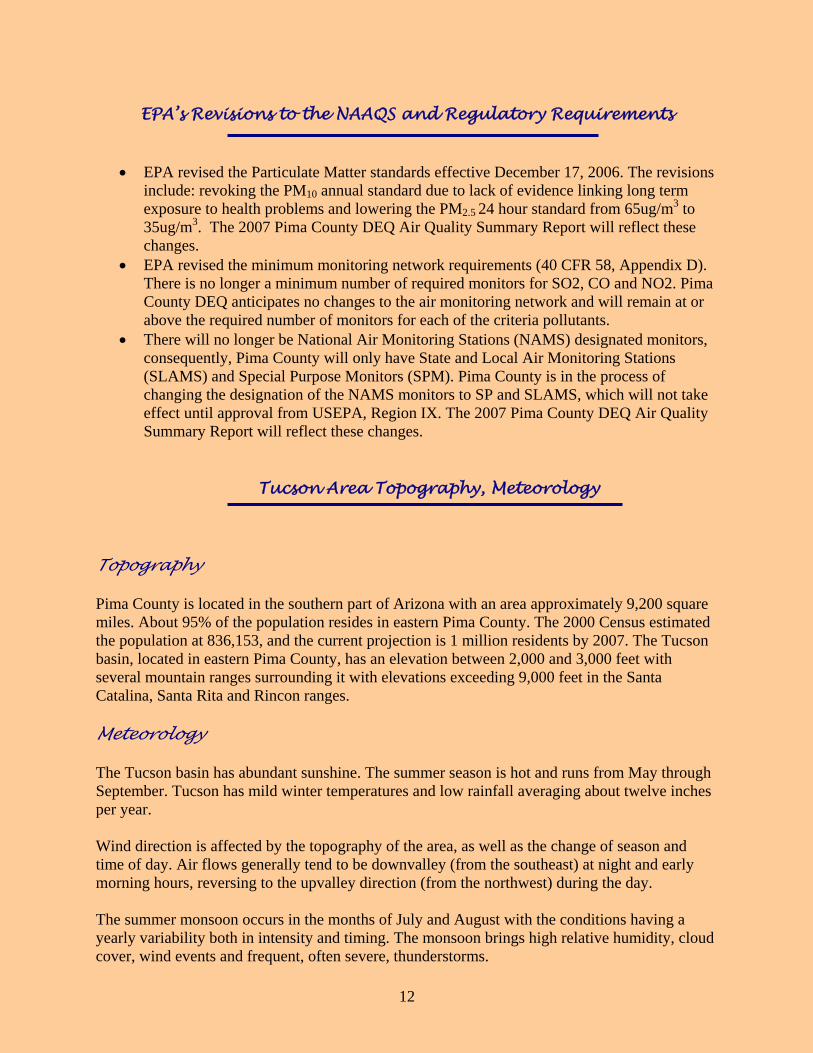
Tucson Area Topography, Meteorology Topography Pima County is located in the southern part of Arizona with an area approximately 9,200 square miles. About 95% of the population resides in eastern Pima County. The 2000 Census estimated the population at 836,153, and the current projection is 1 million residents by 2007. The Tucson basin, located in eastern Pima County, has an elevation between 2,000 and 3,000 feet with several mountain ranges surrounding it with elevations exceeding 9,000 feet in the Santa Catalina, Santa Rita and Rincon ranges. Meteorology The Tucson basin has abundant sunshine. The summer season is hot and runs from May through September. Tucson has mild winter temperatures and low rainfall averaging about twelve inches per year. Wind direction is affected by the topography of the area, as well as the change of season and time of day. Air flows generally tend to be downvalley (from the southeast) at night and early morning hours, reversing to the upvalley direction (from the northwest) during the day. The summer monsoon occurs in the months of July and August with the conditions having a yearly variability both in intensity and timing. The monsoon brings high relative humidity, cloud cover, wind events and frequent, often severe, thunderstorms.
13
Higher levels of pollution can occur in the winter when the air is calmest. Under these conditions, especially during winter mornings, pollutants become trapped by temperature inversions. The temperature inversions begin after the sun goes down and the air closest to the ground is cooled rapidly by heat radiating out through the clear dry air of the desert. As the sun rises in the morning, the upper air is heated rapidly and becomes warmer than the air closest to the ground. This traps the cold air next to the ground and holds it there until the sun is able to heat the ground and slowly raise the temperature of the trapped air. Once heated, the trapped air is able to rise and mix with the layers of air above and disperse the built up pollutants. These conditions are common during the winter, and are less severe in the summer months.
Tucson Area Status of Criteria Pollutants
Carbon Monoxide
The Tucson area generally has higher CO readings in the winter months due to stagnant air conditions in the colder mornings, as demonstrated by Figure 4 in the seasonal trends section (page 23). The CO cannot mix due to stagnant air and tends to build up, especially near congested intersections. CO concentrations have decreased considerably over the past ten years, primarily due to newer, cleaner burning vehicles and the use of oxygenated fuels. There were no exceedances of the NAAQS for carbon monoxide in 2006. The national health standard for ambient CO specifies the 1-hour level at 35 ppm and the 8-hour level at 9 ppm. These levels cannot be exceeded more than once per year without incurring a violation of the NAAQS. PDEQ monitors CO at six locations. Table 4 lists all the CO sites in the network and the maximum concentrations.
Ozone
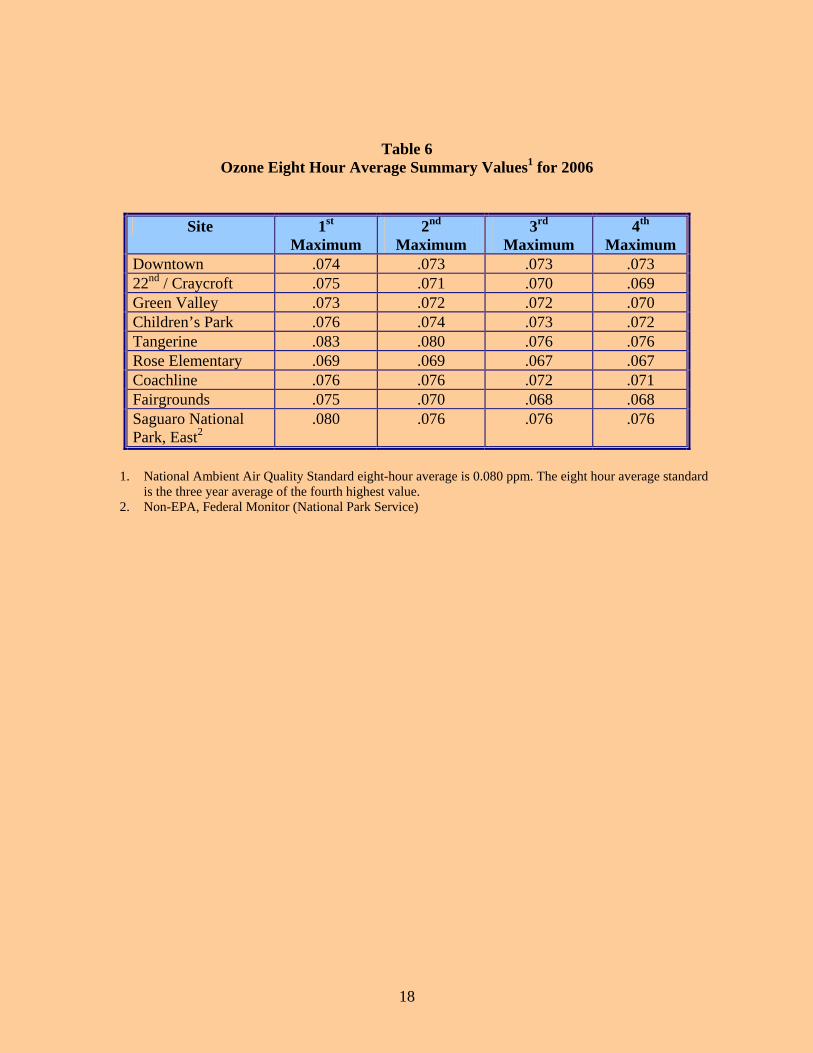
Ground level ozone concentrations are the highest in the summer months due to the intense sunlight and heat, as demonstrated by Figure 5 in the seasonal trends section (page 22). Oxides of nitrogen (NOx) and volatile organic compounds (VOCs) are the “precurser” pollutants that react in the presence of sunlight to form ozone. In the Tucson area, ozone levels generally decline after sunset as the photochemical reactions cease. The highest ozone levels generally are not found near major intersections. Instead they are found when precursor pollutants are released and travel, due to wind or simple dispersion, away from the area of concentration before reacting with sunlight to form ozone. The Saguaro National Park East site, generally records the highest ozone levels. There were no violations of the NAAQS for ozone in 2006. When two or more of the monitoring sites exceed 70% of the old one hour ozone standard of 0.120 ppm, Pima County Department of Environmental Quality and the American Lung Association issue a joint ozone advisory to the media to protect very sensitive members of our population. There were no advisories issued in 2006. Tables 5 and 6 list the maximum concentrations for ozone and the locations of the nine PDEQ ozone monitors.
CO
O3
14
Particulate Matter (PM
10, PM
2.5)
Particulate matter concentrations are often higher near unpaved roads, during localized activities such as construction, during extended dry periods, and when strong winds are present. Pima County violated the PM10 standard in 1999 with four recorded exceedances of the standard at the Orange Grove location. High winds and unusually long periods without rain are considered factors contributing to the high particulate readings for that year. A Natural Events Action Plan (NEAP) was submitted to ADEQ and EPA June, 2001. The resulting ordinance was adopted December 3, 2002. This policy includes measures to minimize contributing controllable sources using the best available control measures (BACM), increased enforcement and education to help protect public health and welfare on days with high levels of PM10. There were three exceedances of the PM10 NAAQS in 2002, one at the Orange Grove location and two at the South Tucson location. There was one exceedance in 2003 at the Orange Grove location, this exeedance was considered a Natural Event due to the forest fires in the nearby Catalina Mountain Range. There were no exceedances of the NAAQS in 2006. Table 7 lists the eight PM10 sites in the network and their maximum concentrations. Pima County and the American Lung Association issue joint particulate matter advisories when there are elevated levels recorded. There were two advisories issued in 2006. Particulate matter 2.5 microns or smaller (PM2.5) travels deeper into the lungs and can be more harmful than PM10. It can also be composed of toxic substances such as metals and organic compounds. There were no exceedances of the PM2.5 NAAQS in 2006 at any of the six monitoring sites. Table 8 contains the PM2.5 information for 2006.
Nitrogen Dioxide and Sulfur Dioxide
Nitrogen dioxide is measured at the Children’s Park and 22nd Street & Craycroft locations. Nitrogen dioxide levels remain low during the summer but act as a precursor to ozone formation. Most noticeable during wintertime temperature inversions, NO2 is a contributing factor to urban haze, the “brown cloud” that limits visibility in the Tucson basin. Motor vehicles are a major source of NO2 in Pima County. There were no exceedances of the NO2 standard. Table 9 contains the nitrogen dioxide information for 2006. Sulfur dioxide is measured at the 22nd Street & Craycroft location. Tucson has no significant sources of SO2 and the levels continue to be extremely low. Table 10 contains the sulfur dioxide information for 2006.
PM
NO2 & SO2
15
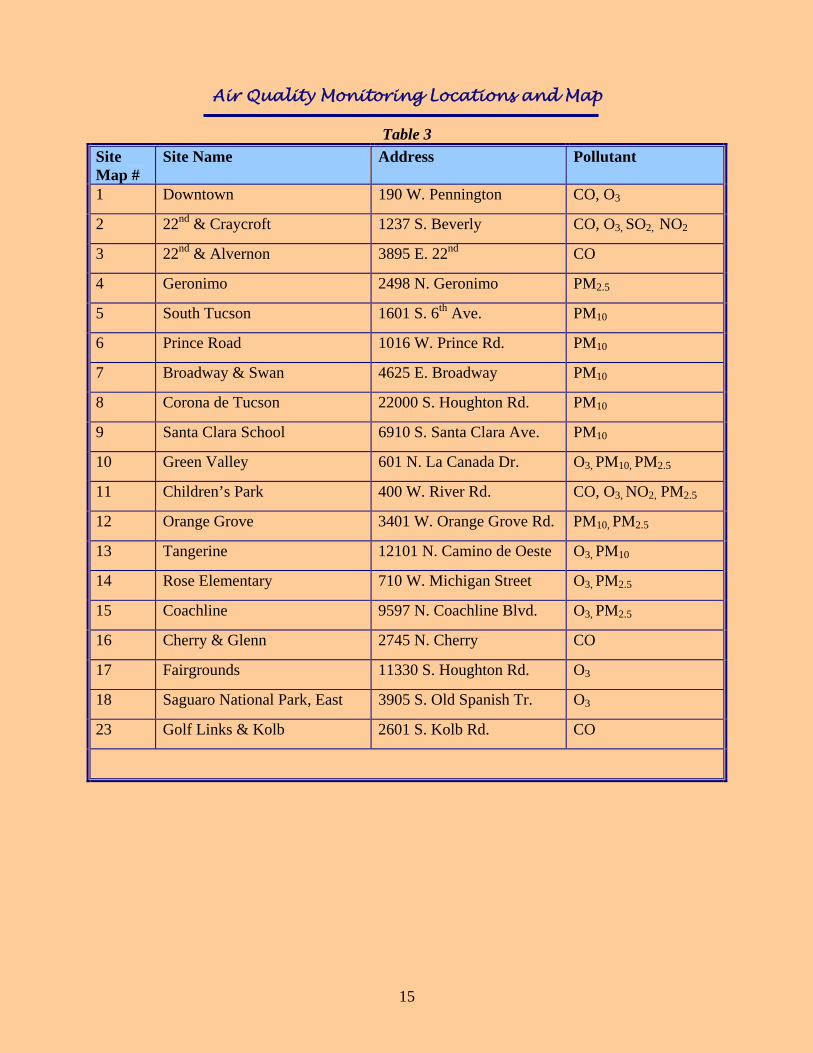
Air Quality Monitoring Locations and Map
Table 3
Site Map #
Site Name Address Pollutant
1 Downtown 190 W. Pennington CO, O3
2 22nd & Craycroft 1237 S. Beverly CO, O3, SO2, NO2
3 22nd & Alvernon 3895 E. 22nd CO
4 Geronimo 2498 N. Geronimo PM2.5
5 South Tucson 1601 S. 6th Ave. PM10
6 Prince Road 1016 W. Prince Rd. PM10
7 Broadway & Swan 4625 E. Broadway PM10
8 Corona de Tucson 22000 S. Houghton Rd. PM10
9 Santa Clara School 6910 S. Santa Clara Ave. PM10
10 Green Valley 601 N. La Canada Dr. O3, PM10, PM2.5
11 Children’s Park 400 W. River Rd. CO, O3, NO2, PM2.5
12 Orange Grove 3401 W. Orange Grove Rd. PM10, PM2.5
13 Tangerine 12101 N. Camino de Oeste O3, PM10
14 Rose Elementary 710 W. Michigan Street O3, PM2.5
15 Coachline 9597 N. Coachline Blvd. O3, PM2.5
16 Cherry & Glenn 2745 N. Cherry CO
17 Fairgrounds 11330 S. Houghton Rd. O3
18 Saguaro National Park, East 3905 S. Old Spanish Tr. O3
23 Golf Links & Kolb 2601 S. Kolb Rd. CO

16

17
Data Summary
Table 4
Carbon Monoxide Summary Values1 for 2006
Site Map No.
Site Type
Annual Mean
Max 1-Hr Value2
Max 8-Hr Value3
% Data Recovery4
Downtown 1 SLAMS 0.4 2.9 1.4 100 22nd / Craycroft 2 NAMS 0.4 3.2 1.6 100 22nd / Alvernon 3 NAMS 0.6 3.4 2.0 99 Children’s Park 11 NAMS 0.4 1.7 1.1 99 Cherry / Glenn5 16 SP6 0.6 3.4 2.3 99 Golf Links / Kolb5 23 SP6 0.5 3.8 1.8 100
1. Measured in parts per million (ppm) 2. National Ambient Air Quality Standard one hour average for carbon monoxide is 35 ppm 3. National Ambient Air Quality Standard eight hour average for carbon monoxide is 9 ppm 4. Percent data recovery rounded to the nearest whole number. 5. Seasonal monitor, no sampling from 05/01/2006 through 09/30/2006. 6. Special Purpose site
Table 5
Ozone One Hour Average Summary Values1 for 2006
Site Map No.
Site Type
Annual Mean
Max 1-Hr Value2
2nd Max 1-Hr Value
% Data Recovery3
Downtown 1 SLAMS .025 .082 .082 99 22nd / Craycroft 2 NAMS .028 .082 .079 99 Green Valley 10 SP4 .034 .083 .079 99 Children’s Park 11 SLAMS .027 .082 .081 99 Tangerine 13 NAMS .039 .088 .086 99 Rose Elementary 14 SP4 .026 .075 .075 99 Coachline 15 SP4 .026 .083 .082 99 Fairgrounds 17 SP4 .033 .083 .082 99 Saguaro National Park, East
18 OTHER5 .042 .087 .086 99
1. Measured in parts per million (ppm) 2. National Ambient Air Quality Standard one hour average for ozone is 0.120 ppm 3. Percent data recovery rounded to the nearest whole number. 4. Special Purpose site 5. Non-EPA, Federal Monitor (National Parks Service)
18
Table 6 Ozone Eight Hour Average Summary Values1 for 2006
Site 1st Maximum
2nd Maximum
3rd Maximum
4th Maximum
Downtown .074 .073 .073 .073 22nd / Craycroft .075 .071 .070 .069 Green Valley .073 .072 .072 .070 Children’s Park .076 .074 .073 .072 Tangerine .083 .080 .076 .076 Rose Elementary .069 .069 .067 .067 Coachline .076 .076 .072 .071 Fairgrounds .075 .070 .068 .068 Saguaro National Park, East2
.080 .076 .076 .076
1. National Ambient Air Quality Standard eight-hour average is 0.080 ppm. The eight hour average standard
is the three year average of the fourth highest value. 2. Non-EPA, Federal Monitor (National Park Service)
19
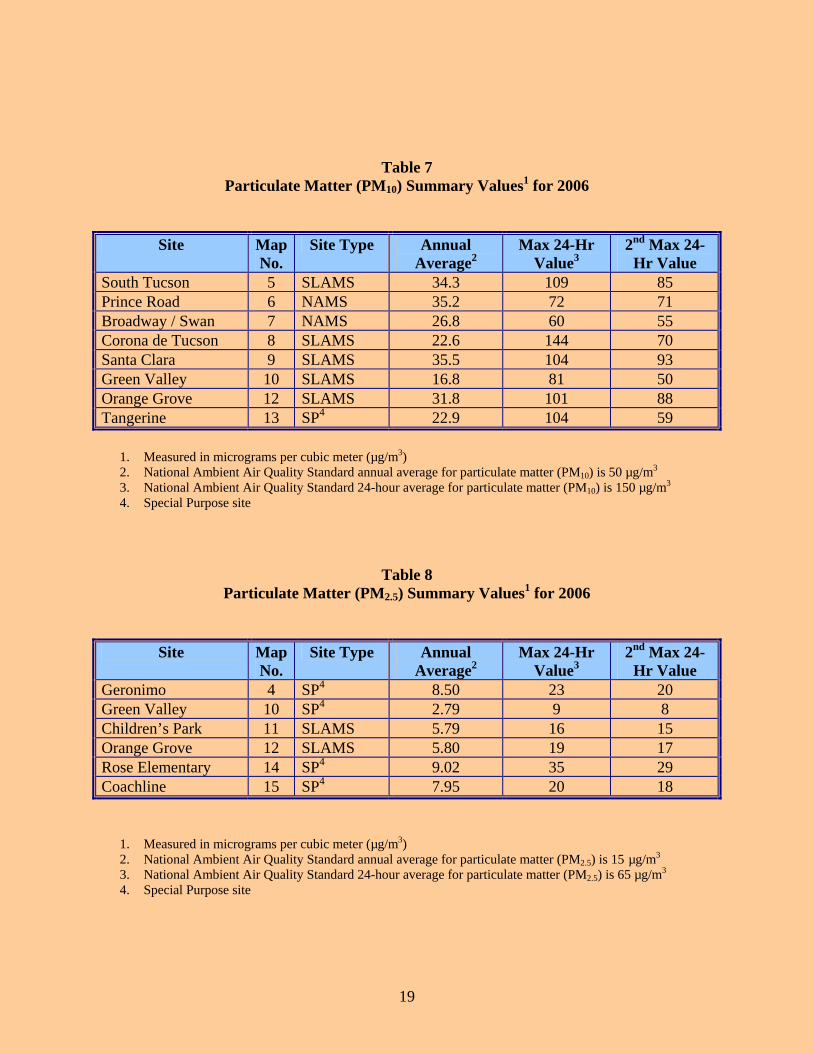
Table 7 Particulate Matter (PM10) Summary Values1 for 2006
Site Map No.
Site Type Annual Average2
Max 24-Hr Value3
2nd Max 24-Hr Value
South Tucson 5 SLAMS 34.3 109 85 Prince Road 6 NAMS 35.2 72 71 Broadway / Swan 7 NAMS 26.8 60 55 Corona de Tucson 8 SLAMS 22.6 144 70 Santa Clara 9 SLAMS 35.5 104 93 Green Valley 10 SLAMS 16.8 81 50 Orange Grove 12 SLAMS 31.8 101 88 Tangerine 13 SP4 22.9 104 59
1. Measured in micrograms per cubic meter (µg/m3) 2. National Ambient Air Quality Standard annual average for particulate matter (PM10) is 50 µg/m3 3. National Ambient Air Quality Standard 24-hour average for particulate matter (PM10) is 150 µg/m3 4. Special Purpose site
Table 8 Particulate Matter (PM2.5) Summary Values1 for 2006
Site Map No.
Site Type Annual Average2
Max 24-Hr Value3
2nd Max 24-Hr Value
Geronimo 4 SP4 8.50 23 20 Green Valley 10 SP4 2.79 9 8 Children’s Park 11 SLAMS 5.79 16 15 Orange Grove 12 SLAMS 5.80 19 17 Rose Elementary 14 SP4 9.02 35 29 Coachline 15 SP4 7.95 20 18
1. Measured in micrograms per cubic meter (µg/m3) 2. National Ambient Air Quality Standard annual average for particulate matter (PM2.5) is 15 µg/m3 3. National Ambient Air Quality Standard 24-hour average for particulate matter (PM2.5) is 65 µg/m3 4. Special Purpose site
20
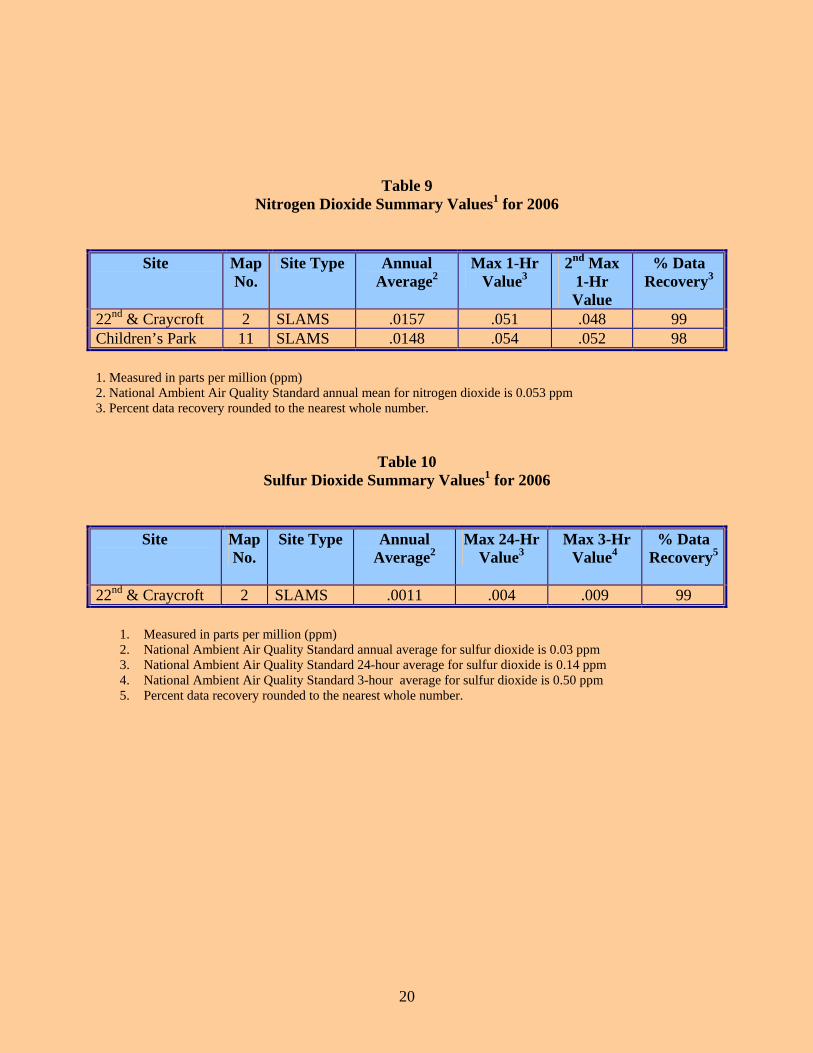
Table 9
Nitrogen Dioxide Summary Values1 for 2006
Site Map No.
Site Type Annual Average2
Max 1-Hr Value3
2nd Max 1-Hr Value
% Data Recovery3
22nd & Craycroft 2 SLAMS .0157 .051 .048 99 Children’s Park 11 SLAMS .0148 .054 .052 98 1. Measured in parts per million (ppm) 2. National Ambient Air Quality Standard annual mean for nitrogen dioxide is 0.053 ppm 3. Percent data recovery rounded to the nearest whole number.
Table 10 Sulfur Dioxide Summary Values1 for 2006
Site Map No.
Site Type Annual Average2
Max 24-Hr Value3
Max 3-Hr Value4
% Data Recovery5
22nd & Craycroft 2 SLAMS .0011 .004 .009 99
1. Measured in parts per million (ppm) 2. National Ambient Air Quality Standard annual average for sulfur dioxide is 0.03 ppm 3. National Ambient Air Quality Standard 24-hour average for sulfur dioxide is 0.14 ppm 4. National Ambient Air Quality Standard 3-hour average for sulfur dioxide is 0.50 ppm 5. Percent data recovery rounded to the nearest whole number.
21
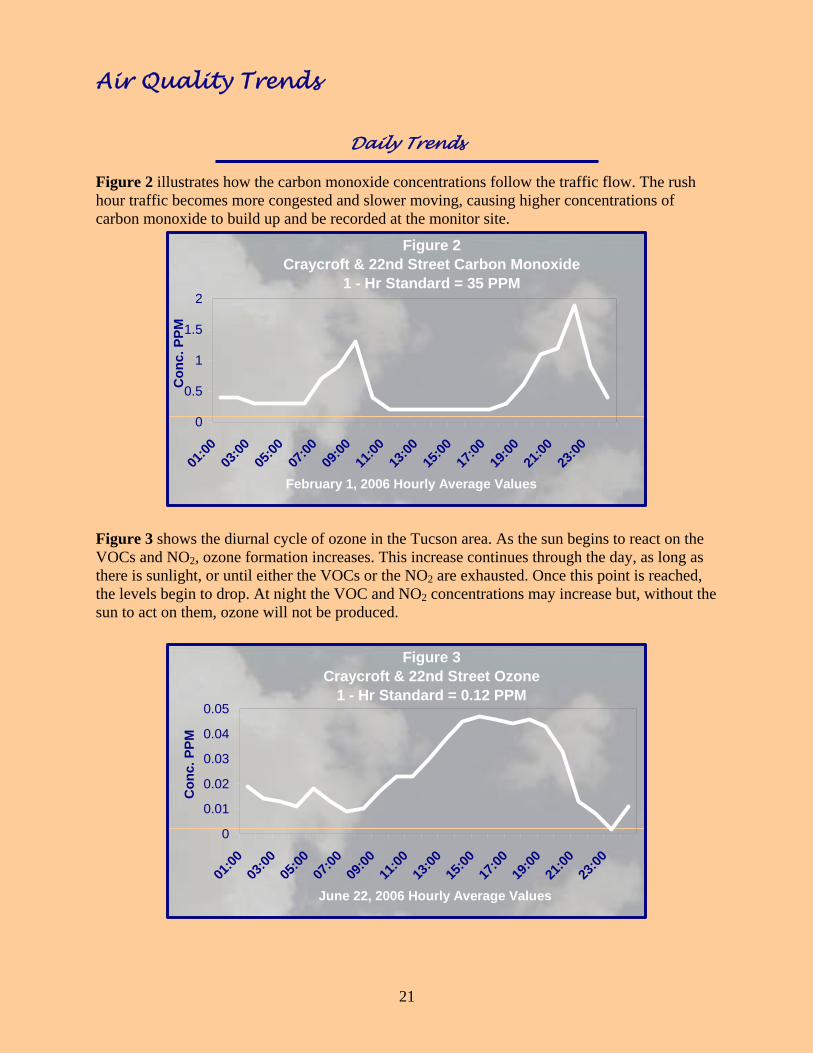
Air Quality Trends
Daily Trends Figure 2 illustrates how the carbon monoxide concentrations follow the traffic flow. The rush hour traffic becomes more congested and slower moving, causing higher concentrations of carbon monoxide to build up and be recorded at the monitor site.
Figure 2Craycroft & 22nd Street Carbon Monoxide
1 - Hr Standard = 35 PPM
0
0.5
1
1.5
2
01:00
03:00
05:00
07:00
09:00
11:00
13:00
15:00
17:00
19:00
21:00
23:00
February 1, 2006 Hourly Average Values
C
onc.
PPM
Figure 3 shows the diurnal cycle of ozone in the Tucson area. As the sun begins to react on the VOCs and NO2, ozone formation increases. This increase continues through the day, as long as there is sunlight, or until either the VOCs or the NO2 are exhausted. Once this point is reached, the levels begin to drop. At night the VOC and NO2 concentrations may increase but, without the sun to act on them, ozone will not be produced.
Figure 3
Craycroft & 22nd Street Ozone1 - Hr Standard = 0.12 PPM
0
0.01
0.02
0.03
0.04
0.05
01:00
03:00
05:00
07:00
09:00
11:00
13:00
15:00
17:00
19:00
21:00
23:00
June 22, 2006 Hourly Average Values
C
onc.
PPM
22
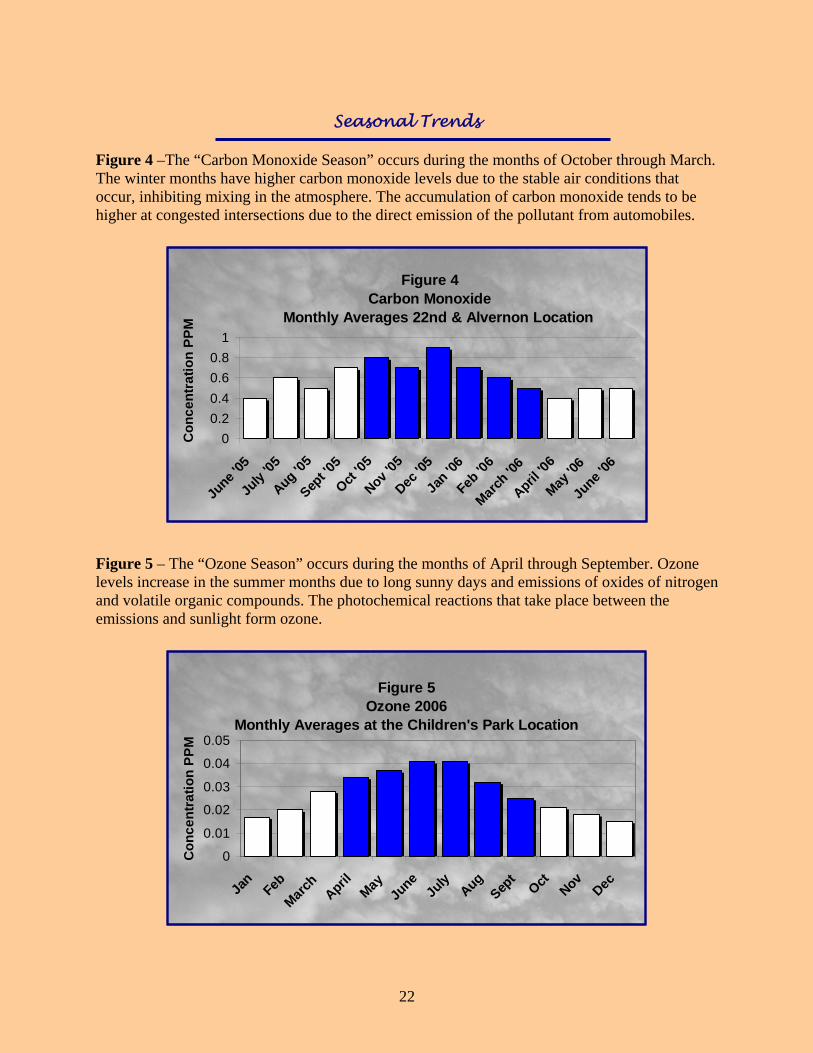
Seasonal Trends Figure 4 –The “Carbon Monoxide Season” occurs during the months of October through March. The winter months have higher carbon monoxide levels due to the stable air conditions that occur, inhibiting mixing in the atmosphere. The accumulation of carbon monoxide tends to be higher at congested intersections due to the direct emission of the pollutant from automobiles.
Figure 5 – The “Ozone Season” occurs during the months of April through September. Ozone levels increase in the summer months due to long sunny days and emissions of oxides of nitrogen and volatile organic compounds. The photochemical reactions that take place between the emissions and sunlight form ozone.
Figure 4Carbon Monoxide
Monthly Averages 22nd & Alvernon Location
00.20.40.60.8
1
June '
05
July
'05
Aug '05
Sept '0
5
Oct '05
Nov '05
Dec '0
5
Jan '0
6
Feb '0
6
March '0
6
April '06
May '0
6
June '
06
C
once
ntra
tion
PPM
Figure 5Ozone 2006
Monthly Averages at the Children's Park Location
0
0.01
0.02
0.03
0.04
0.05
Jan
FebMarc
hApril
MayJu
neJu
lyAug
Sept
OctNov
Dec
Con
cent
ratio
n PP
M
23
19921993
19941995
19961997
19981999
20002001
20022003
20042005
2006
5
15
25
35
45
55
Con
cent
ratio
n ug
/m3
Year
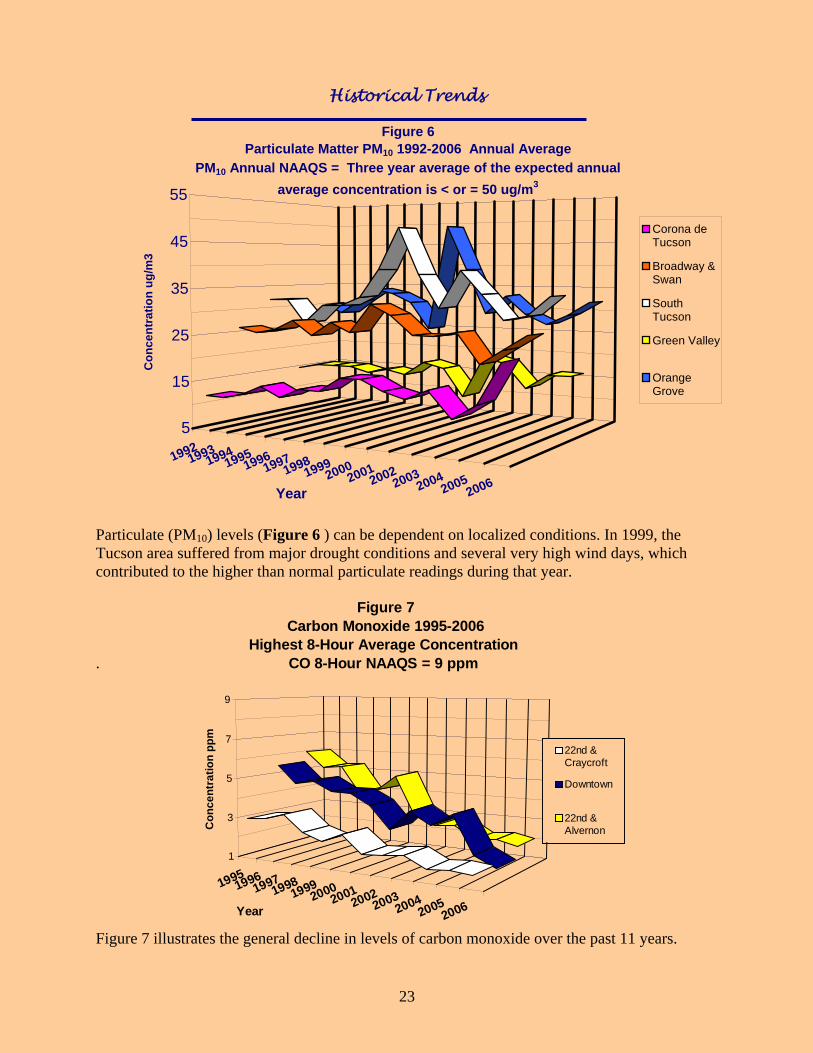
Figure 6 Particulate Matter PM10 1992-2006 Annual Average
PM10 Annual NAAQS = Three year average of the expected annual average concentration is < or = 50 ug/m3
Corona deTucson
Broadway &Swan
SouthTucson
Green Valley
OrangeGrove
Historical Trends
Particulate (PM10) levels (Figure 6 ) can be dependent on localized conditions. In 1999, the Tucson area suffered from major drought conditions and several very high wind days, which contributed to the higher than normal particulate readings during that year.
.
Figure 7 illustrates the general decline in levels of carbon monoxide over the past 11 years.
19951996
19971998
19992000
20012002
20032004
20052006
1
3
5
7
9
Con
cent
ratio
n pp
m
Year
Figure 7 Carbon Monoxide 1995-2006
Highest 8-Hour Average ConcentrationCO 8-Hour NAAQS = 9 ppm
22nd &Craycroft
Downtown
22nd &Alvernon
24
Historical Trends Continued
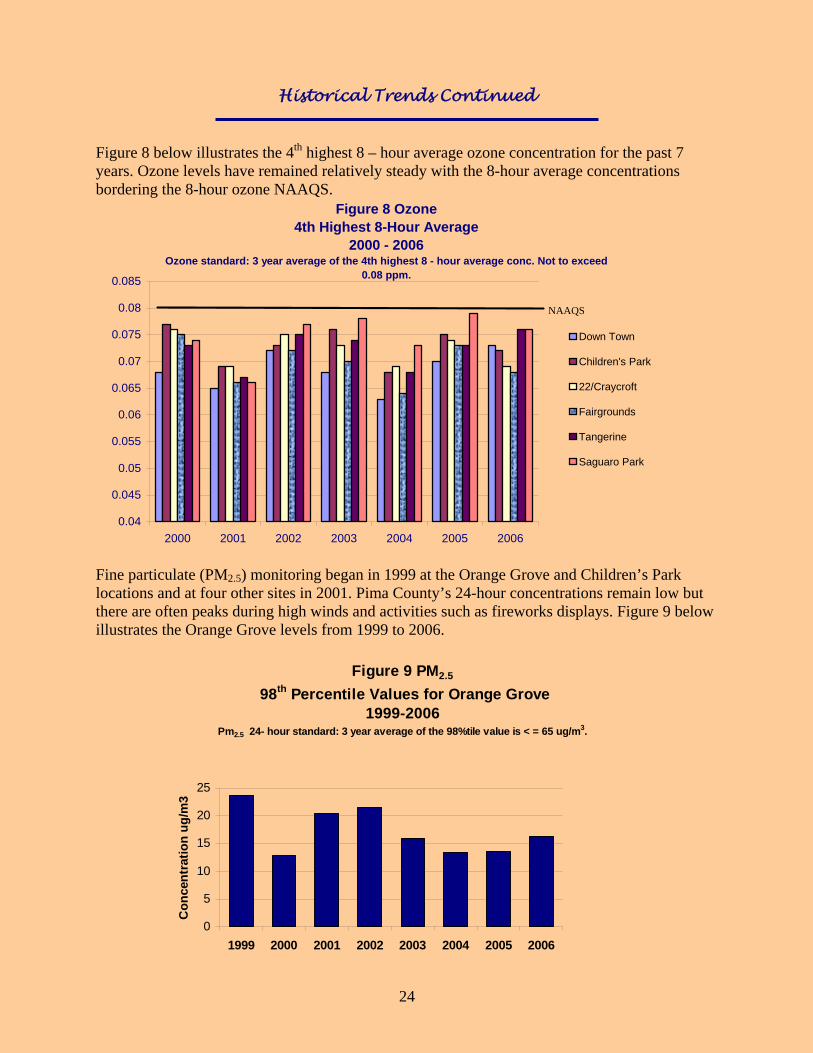
Figure 8 below illustrates the 4th highest 8 – hour average ozone concentration for the past 7 years. Ozone levels have remained relatively steady with the 8-hour average concentrations bordering the 8-hour ozone NAAQS.
Fine particulate (PM2.5) monitoring began in 1999 at the Orange Grove and Children’s Park locations and at four other sites in 2001. Pima County’s 24-hour concentrations remain low but there are often peaks during high winds and activities such as fireworks displays. Figure 9 below illustrates the Orange Grove levels from 1999 to 2006.
Figure 9 PM2.5
98th Percentile Values for Orange Grove 1999-2006
Pm2.5 24- hour standard: 3 year average of the 98%tile value is < = 65 ug/m3.
0
5
10
15
20
25
1999 2000 2001 2002 2003 2004 2005 2006
Con
cent
ratio
n ug
/m3
Figure 8 Ozone 4th Highest 8-Hour Average
2000 - 2006Ozone standard: 3 year average of the 4th highest 8 - hour average conc. Not to exceed
0.08 ppm.
0.04
0.045
0.05
0.055
0.06
0.065
0.07
0.075
0.08
0.085
2000 2001 2002 2003 2004 2005 2006
Down Town
Children's Park
22/Craycroft
Fairgrounds
Tangerine
Saguaro Park
NAAQS
25
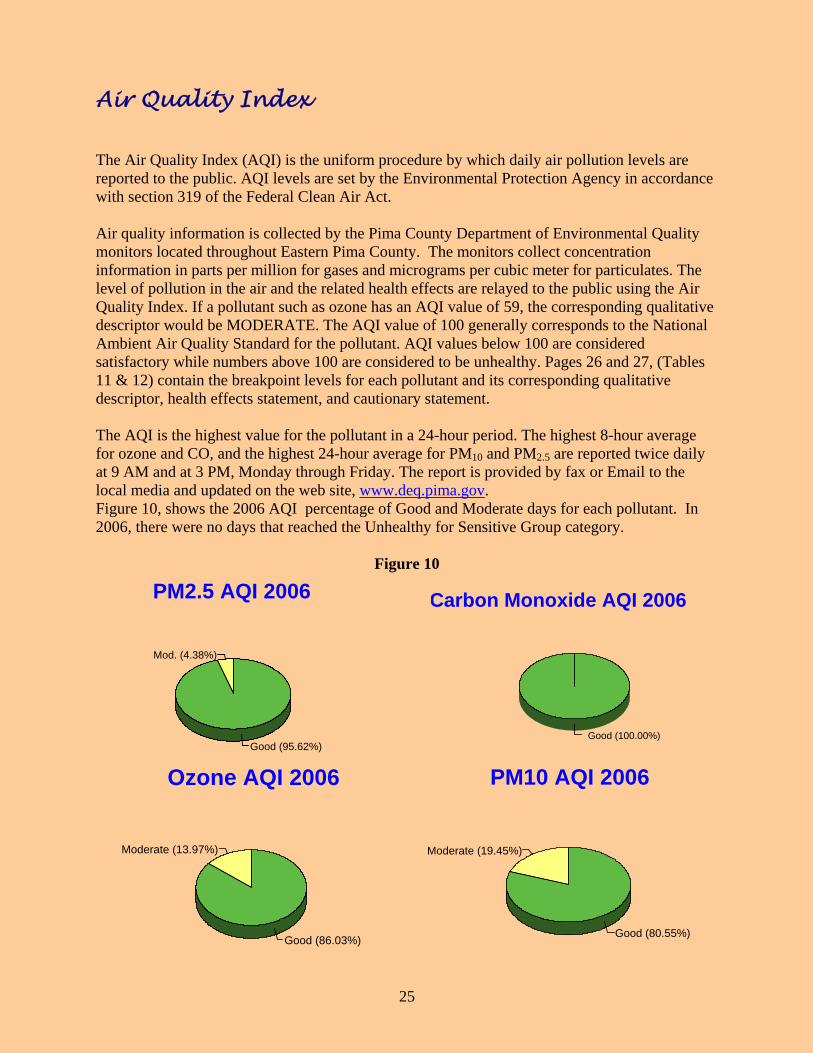
Air Quality Index The Air Quality Index (AQI) is the uniform procedure by which daily air pollution levels are reported to the public. AQI levels are set by the Environmental Protection Agency in accordance with section 319 of the Federal Clean Air Act. Air quality information is collected by the Pima County Department of Environmental Quality monitors located throughout Eastern Pima County. The monitors collect concentration information in parts per million for gases and micrograms per cubic meter for particulates. The level of pollution in the air and the related health effects are relayed to the public using the Air Quality Index. If a pollutant such as ozone has an AQI value of 59, the corresponding qualitative descriptor would be MODERATE. The AQI value of 100 generally corresponds to the National Ambient Air Quality Standard for the pollutant. AQI values below 100 are considered satisfactory while numbers above 100 are considered to be unhealthy. Pages 26 and 27, (Tables 11 & 12) contain the breakpoint levels for each pollutant and its corresponding qualitative descriptor, health effects statement, and cautionary statement. The AQI is the highest value for the pollutant in a 24-hour period. The highest 8-hour average for ozone and CO, and the highest 24-hour average for PM10 and PM2.5 are reported twice daily at 9 AM and at 3 PM, Monday through Friday. The report is provided by fax or Email to the local media and updated on the web site, www.deq.pima.gov. Figure 10, shows the 2006 AQI percentage of Good and Moderate days for each pollutant. In 2006, there were no days that reached the Unhealthy for Sensitive Group category.
Figure 10
Mod. (4.38%)
Good (95.62%)
PM2.5 AQI 2006
Moderate (13.97%)
Good (86.03%)
Ozone AQI 2006
Moderate (19.45%)
Good (80.55%)
PM10 AQI 2006
Good (100.00%)
Carbon Monoxide AQI 2006

26
Table 11 AQI Reporting Table
AQI
Category Ozone Carbon Monoxide
8-hour 8-hour Concen-
tration Health Effects Statement
Cautionary Statement
Concen-tration
Health Effects Statement
Cautionary Statement
Good 0-50
0.00-0.064 ppm
0.0-4.4 ppm
Moderate 51-100
0.065-0.084 ppm
Unusually sensitive individuals may experience respiratory symptoms.
Unusually sensitive people should consider limiting prolonged outdoor exertion.
4.5-9.4 ppm
Unhealthy for Sensitive Groups 101-150
0.085-0.104 ppm
Increased likelihood of respiratory symptoms and breathing discomfort in active children and adults and people with respiratory disease, such as asthma.
Active children, adults and people with respiratory disease should limit outdoor exertion.
9.5-12.4 ppm
Increased likelihood of reduced exercise tolerance due to increased cardiovascular symptoms in people with cardiovascular disease.
People with cardiovascular disease should limit heavy exertion and avoid sources of CO, such as heavy traffic.
Unhealthy 151-200
0.105-0.124 ppm
Greater likelihood of respiratory symptoms and breathing difficulty in active children and adults and people with respiratory disease; possible respiratory effects in general population.
Active children, adults and people with respiratory disease should avoid prolonged outdoor exertion; everyone else, especially children, should limit prolonged outdoor exertion.
12.5-15.4 ppm
Reduced exercise tolerance due to increased cardiovascular symptoms in people with cardiovascular disease.
People with cardiovascular disease should limit moderate exertion and avoid sources of CO, such as heavy traffic.
Very Unhealthy 201-300
0.125-0.374 ppm
Increased severe symptoms and impaired breathing likely in sensitive groups; increased likelihood of respiratory effects in general population.
Active children, adults and people with respiratory disease should avoid all outdoor exertion; everyone else, especially children, should limit outdoor exertion.
15.5-30.4 ppm
Significant aggravation of cardiovascular symptoms in people with cardiovascular disease.
People with cardiovascular disease should avoid exertion and avoid sources of CO, such as heavy traffic.
Hazardous 301-500
0.375-above ppm
Severe respiratory effects and impaired breathing likely in active children, adults and people with respiratory disease; increased severe respiratory effects likely in general population.
Everyone should avoid all outdoor exertion.
30.5-above ppm
Serious aggravation of cardiovascular symptoms in people with cardiovascular disease; impairment of strenuous activities in general population.
People with cardiovascular disease should avoid exertion and avoid sources of CO, such as heavy traffic; everyone else should limit heavy exertion.
27
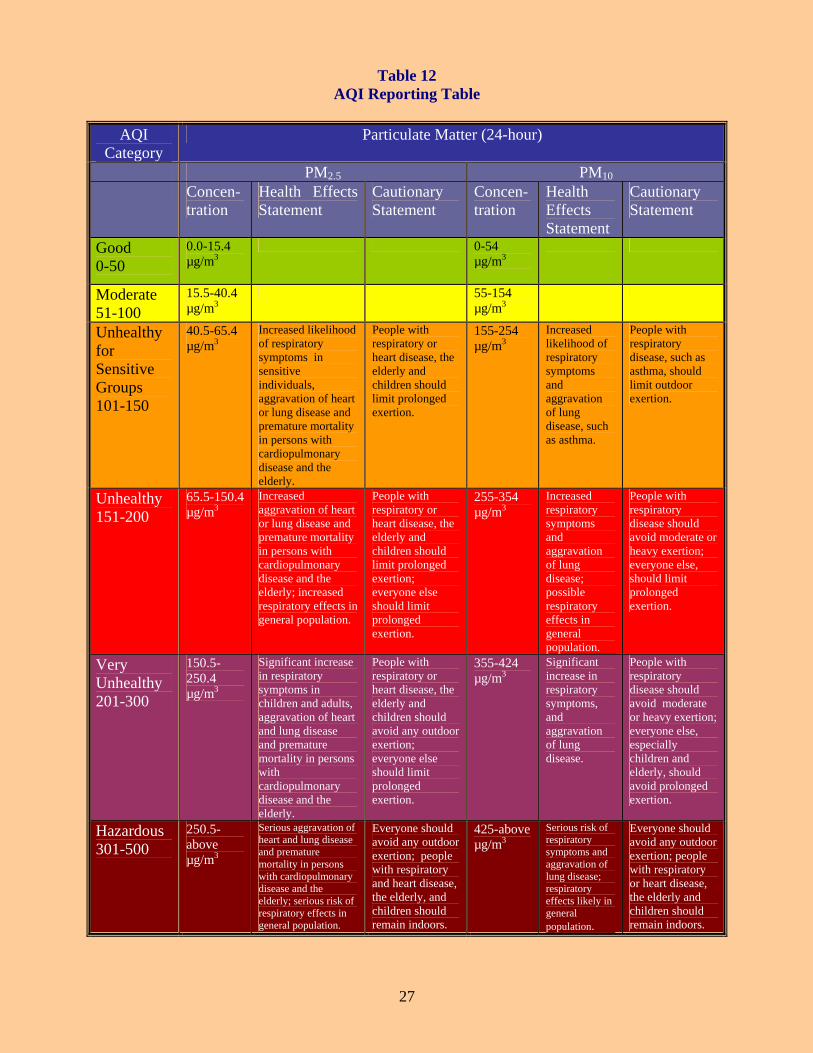
Table 12 AQI Reporting Table
AQI
Category Particulate Matter (24-hour)
PM2.5 PM10 Concen-
tration Health Effects Statement
Cautionary Statement
Concen- tration
Health Effects Statement
Cautionary Statement
Good 0-50
0.0-15.4 µg/m3
0-54 µg/m3
Moderate 51-100
15.5-40.4 µg/m3
55-154 µg/m3
Unhealthy for Sensitive Groups 101-150
40.5-65.4 µg/m3
Increased likelihood of respiratory symptoms in sensitive individuals, aggravation of heart or lung disease and premature mortality in persons with cardiopulmonary disease and the elderly.
People with respiratory or heart disease, the elderly and children should limit prolonged exertion.
155-254 µg/m3
Increased likelihood of respiratory symptoms and aggravation of lung disease, such as asthma.
People with respiratory disease, such as asthma, should limit outdoor exertion.
Unhealthy 151-200
65.5-150.4 µg/m3
Increased aggravation of heart or lung disease and premature mortality in persons with cardiopulmonary disease and the elderly; increased respiratory effects in general population.
People with respiratory or heart disease, the elderly and children should limit prolonged exertion; everyone else should limit prolonged exertion.
255-354 µg/m3
Increased respiratory symptoms and aggravation of lung disease; possible respiratory effects in general population.
People with respiratory disease should avoid moderate or heavy exertion; everyone else, should limit prolonged exertion.
Very Unhealthy 201-300
150.5-250.4 µg/m3
Significant increase in respiratory symptoms in children and adults, aggravation of heart and lung disease and premature mortality in persons with cardiopulmonary disease and the elderly.
People with respiratory or heart disease, the elderly and children should avoid any outdoor exertion; everyone else should limit prolonged exertion.
355-424 µg/m3
Significant increase in respiratory symptoms, and aggravation of lung disease.
People with respiratory disease should avoid moderate or heavy exertion; everyone else, especially children and elderly, should avoid prolonged exertion.
Hazardous 301-500
250.5-above µg/m3
Serious aggravation of heart and lung disease and premature mortality in persons with cardiopulmonary disease and the elderly; serious risk of respiratory effects in general population.
Everyone should avoid any outdoor exertion; people with respiratory and heart disease, the elderly, and children should remain indoors.
425-above µg/m3
Serious risk of respiratory symptoms and aggravation of lung disease; respiratory effects likely in general population.
Everyone should avoid any outdoor exertion; people with respiratory or heart disease, the elderly and children should remain indoors.
28
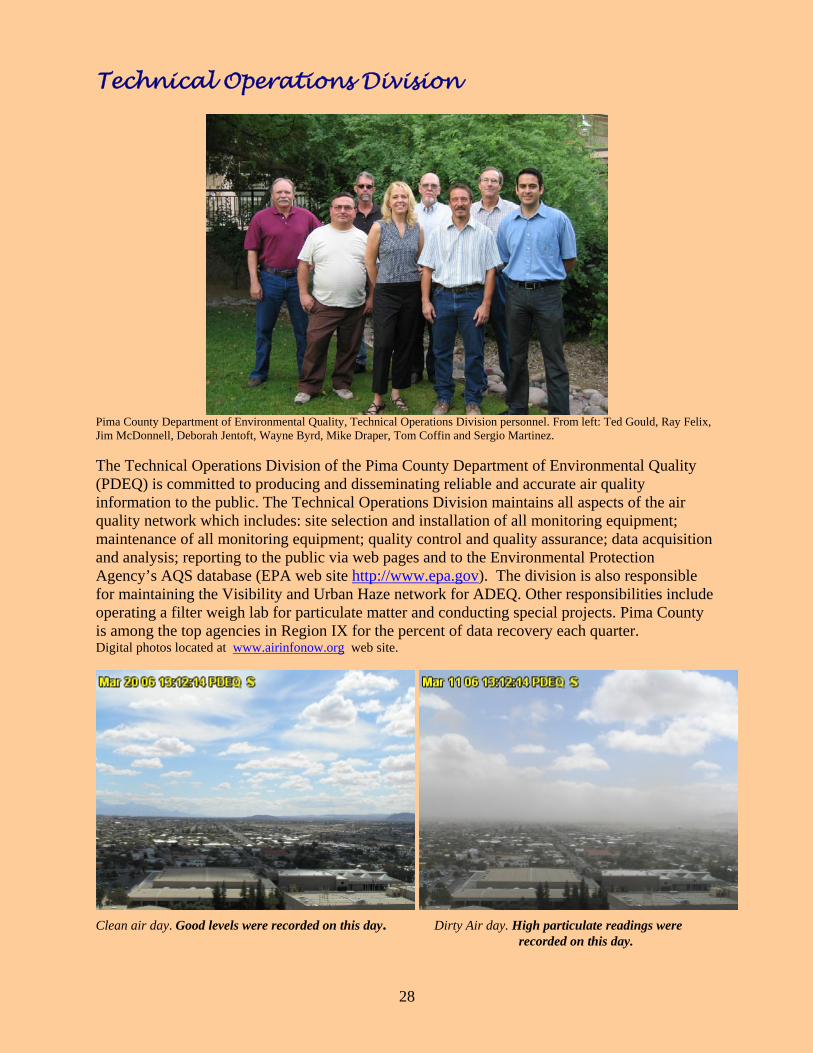
Technical Operations Division
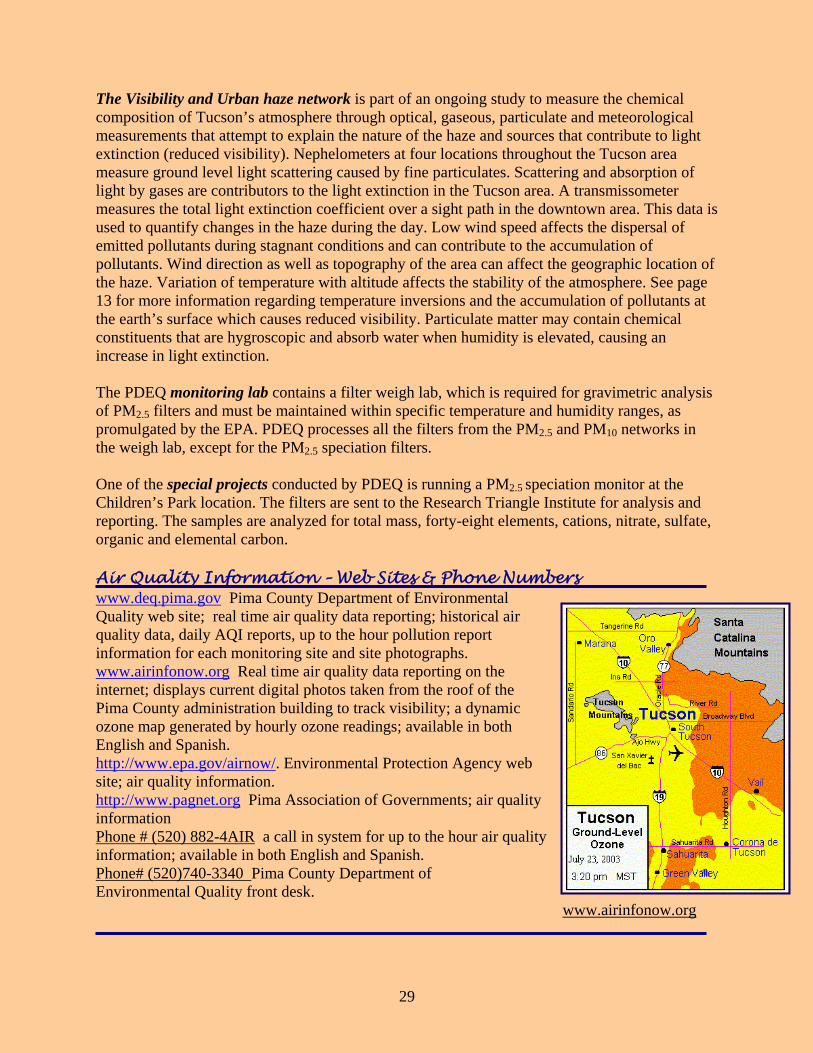
Pima County Department of Environmental Quality, Technical Operations Division personnel. From left: Ted Gould, Ray Felix, Jim McDonnell, Deborah Jentoft, Wayne Byrd, Mike Draper, Tom Coffin and Sergio Martinez. The Technical Operations Division of the Pima County Department of Environmental Quality (PDEQ) is committed to producing and disseminating reliable and accurate air quality information to the public. The Technical Operations Division maintains all aspects of the air quality network which includes: site selection and installation of all monitoring equipment; maintenance of all monitoring equipment; quality control and quality assurance; data acquisition and analysis; reporting to the public via web pages and to the Environmental Protection Agency’s AQS database (EPA web site http://www.epa.gov). The division is also responsible for maintaining the Visibility and Urban Haze network for ADEQ. Other responsibilities include operating a filter weigh lab for particulate matter and conducting special projects. Pima County is among the top agencies in Region IX for the percent of data recovery each quarter. Digital photos located at www.airinfonow.org web site.
Clean air day. Good levels were recorded on this day. Dirty Air day. High particulate readings were recorded on this day.
29
The Visibility and Urban haze network is part of an ongoing study to measure the chemical composition of Tucson’s atmosphere through optical, gaseous, particulate and meteorological measurements that attempt to explain the nature of the haze and sources that contribute to light extinction (reduced visibility). Nephelometers at four locations throughout the Tucson area measure ground level light scattering caused by fine particulates. Scattering and absorption of light by gases are contributors to the light extinction in the Tucson area. A transmissometer measures the total light extinction coefficient over a sight path in the downtown area. This data is used to quantify changes in the haze during the day. Low wind speed affects the dispersal of emitted pollutants during stagnant conditions and can contribute to the accumulation of pollutants. Wind direction as well as topography of the area can affect the geographic location of the haze. Variation of temperature with altitude affects the stability of the atmosphere. See page 13 for more information regarding temperature inversions and the accumulation of pollutants at the earth’s surface which causes reduced visibility. Particulate matter may contain chemical constituents that are hygroscopic and absorb water when humidity is elevated, causing an increase in light extinction. The PDEQ monitoring lab contains a filter weigh lab, which is required for gravimetric analysis of PM2.5 filters and must be maintained within specific temperature and humidity ranges, as promulgated by the EPA. PDEQ processes all the filters from the PM2.5 and PM10 networks in the weigh lab, except for the PM2.5 speciation filters. One of the special projects conducted by PDEQ is running a PM2.5 speciation monitor at the Children’s Park location. The filters are sent to the Research Triangle Institute for analysis and reporting. The samples are analyzed for total mass, forty-eight elements, cations, nitrate, sulfate, organic and elemental carbon. Air Quality Information – Web Sites & Phone Numbers www.deq.pima.gov Pima County Department of Environmental Quality web site; real time air quality data reporting; historical air quality data, daily AQI reports, up to the hour pollution report information for each monitoring site and site photographs. www.airinfonow.org Real time air quality data reporting on the internet; displays current digital photos taken from the roof of the Pima County administration building to track visibility; a dynamic ozone map generated by hourly ozone readings; available in both English and Spanish. http://www.epa.gov/airnow/. Environmental Protection Agency web site; air quality information. http://www.pagnet.org Pima Association of Governments; air quality information Phone # (520) 882-4AIR a call in system for up to the hour air quality information; available in both English and Spanish. Phone# (520)740-3340 Pima County Department of Environmental Quality front desk. www.airinfonow.org

30
Related Documents


