Technology Governance Board Annual Report Page 1 Annual Report January 9, 2006

Welcome message from author
This document is posted to help you gain knowledge. Please leave a comment to let me know what you think about it! Share it to your friends and learn new things together.
Transcript

Technology Governance Board Annual Report Page 1
Annual Report
January 9, 2006

State of Iowa
Technology Governance Board
Mollie Anderson, Department of Administrative Services, Chair Erv Fett, Iowa Workforce Development, Vice Chair
Jan Clausen, Department of Human Services Tom Gronstal, Iowa Department of Commerce
Karen Misjak, Iowa College Student Aid Commission Nancy Richardson, Department of Transportation Michael Tramontina, Department of Management
Randy Ramundt, Public Member Sandra Cowie, Public Member
This report was produced in compliance with Iowa Code §8A.204(3a) to be submitted to the Governor, the Department of Management, and the General Assembly by January 9, 2006. Copies of this publication have been filed in compliance with Iowa Code §§ 8A.202(e) and 305.10.
This report is available at the Iowa Publications Online website at http://publications.iowa.gov/ and is filed under the Department of Administrative Services.
© Copyright Iowa Technology Governance Board (TGB), January 2006.

Iowa Technology Governance Board
Annual Report
Table of Contents Page
Acknowledgements ....................................................................................................................... 1
Foreword ....................................................................................................................................... 2
Executive Summary ...................................................................................................................... 3
State of Iowa Information Technology Spending .......................................................................... 5
State of Iowa Information Technology Savings ............................................................................. 7
Appendix A. Action Items for the Technology Governance Board for 2006 ............................... 11
Appendix B. TGB Annual Report Terminology ........................................................................... 12
Appendix C. TGB Annual Report - Agencies Participating in the Survey of Information Technology Costs ....................................................................................................................... 14
Appendix D. Information Technology Personnel Spending ........................................................ 15
Appendix E Technology Spending .............................................................................................. 22
Appendix F. Information Technology Spending - Outside Services ............................................ 23
Index of Figures and Tables Page
Figure 1. Information Technology Leadership and Direction ........................................................ 3
Figure 2. Total State of Iowa Executive Branch Information Technology Expenditures ............... 6
Figure 3 A Value of Investment (VOI) Methodology ..................................................................... 7
Table 2. Recap of Fiscal Year 2005 and 2006 Savings from Collaborative Initiatives .................. 9

Technology Governance Board Annual Report Page 1
Acknowledgements The Technology Governance Board (TGB) would like to express our appreciation to the Chief Information Officers of the state agencies for their considerable efforts in assembling, proofing, and editing the large volume of data required to compile this report. In addition, we would like to acknowledge the contribution of John Gillispie, Chief Operating Officer of the Department of Administrative Services - Information Technology Enterprise for his leadership and guidance in the development and operation of the Technology Governance Board. Finally, we would like to recognize Denise Sturm, John Hove, and Joan Rowley from DAS Finance for their work in supporting the TGB’s financial reporting and accounting and Wes Hunsberger and Tom Shepherd for their operational and technical support of the Technology Governance Board and for producing and distributing this publication. Please direct any questions about this 2006 Technology Governance Board Annual Report to Wes Hunsberger at [email protected] or (515) 281-6993.

Technology Governance Board Annual Report Page 2
Foreword No matter how much technology you use -- and technology is certainly an enabling tool – meaningful change always starts with a vision and a plan. More people are looking to government for increased accountability, greater value, and added convenience. To that end, government is increasingly seeing the deployment of technology based on the outcomes mandated by agency business requirements as opposed to the brand of equipment or type of technology being used.
As the demands on government programs increase and government is expected to get greater value for the tax dollars spent. Increasingly, we are required to provide technology tools so employees can work more effectively and efficiently in a focused, customer-oriented environment. Technology plays a significant role in creating a synergy between
governmental processes, government employees, and government’s constituents. Ultimately, the citizen just wants the most cost effective and efficient system which will provide a license, a permit, or to check the conditions of roads, restaurants, or nursing homes.
The Technology Governance Board was created to provide planning and oversight of the information technology investments in state government for the purpose of maximizing the value of those investments. This inaugural Technology Governance Board annual report was prepared to meet the statutory obligations under Iowa Code Section 8A.204, to provide state government executive leadership, legislators, and citizens with information about the operation of the Technology Governance Board and to give an overview of the planning and management of our critical information technology assets.
We are pleased to submit our first annual report. During the past six months, we have: 1. Established a process to review all information technology purchase requests valued at
greater than $50,000 or requiring more than 750 staff hours to complete. To-date we have approved five of those requests.
2. Denied one information technology purchase request because we felt there were existing systems that will meet the agency’s needs.
3. Identified service areas that we believe we can focus on to achieve savings. 4. Developed a Request for Proposals describing a state information architecture plan to
measure future requests against. Since we have only been in existence for six months, future reports will provide more detail about how the board is carrying out its mandated responsibilities. All of our members are dedicated to maximizing the value of the state’s information technology investments.
Signed,
Mollie Anderson Chair Iowa Technology Governance Board Hoover State Office Building - Level A Des Moines, IA 50319
Mollie Anderson Director, Iowa Department of Administrative Services

Technology Governance Board Annual Report Page 3
Executive SummaryA 2004 study conducted by the National Governor’s Association Center for Best Practices listed the most important actions a Governor can take regarding information technology (IT) to improve service delivery and/or government efficiency in their state. These actions include:
• Implementing an IT governance model focused on results; • Establishing a decision-making body and process for IT investment; • Empower a trusted advisor to bridge policy and technology; • Develop an enterprise model for managing technology; • Leverage IT to solve business problems; • Use IT to understand and better manage federal funds; • Reform procurement to save money and improve outcomes; • Make information sharing a priority; and • Encourage and leverage IT innovation.
The Technology Governance Board was established by House File 839 passed by the Eighty-First General Assembly (2005). The mission of the Technology Governance Board is to set priorities for statewide technology investments and initiatives and assist the Department of Management and Enterprise Chief Information Officer in developing a statewide Information Technology budget reflecting the total Information Technology spend of the Executive Branch, resulting in improved financial investment performance reporting and decision making for Executive Branch agencies. The challenge for the Technology Governance Board is to establish the leadership and direction to link effective IT strategies with the business requirements of the state agencies. Figure 1. Information Technology Leadership and Direction
Vision & Vision & Strategic Strategic PlanningPlanning
Sustained Sustained LeadershipLeadership
A Broad A Broad Perspective Perspective of Customer of Customer
NeedsNeeds
CommunicationCommunication CollaborationCollaboration
Sustained Sustained Agency Agency
CooperationCooperation
State government—with multiple business units—rarely has had a consistent enterprise business strategy with which agencies can align their individual business strategies. It is incumbent upon the Technology Governance Board to develop a governance structure that serves the unique needs of each agency, board, or commission while maintaining consistency across the business units and building support for a unified IT strategy across state government.
To do that, it is necessary to develop a governance structure that promotes the IT goals of state government as a whole—standardization, cost savings, and return on Investment (ROI) —at the functional and business unit levels of the organization.

Technology Governance Board Annual Report Page 4
Consonant with its responsibilities, the following specific accomplishments are expected of the Technology Governance Board:
Definition of a strategic plan for deployment that supports the State of Iowa’s overall strategic IT vision.
Establishment of a collaborative standards-based, policy driven framework for state government information technology.
Implementation of state government policies and processes in Iowa for continued technology renewal and technology-enhanced services.
Development of a strategic planning process and budget strategy that reconciles the overall Information Technology plan with the distributed goals of the state agencies and administrative units. This will require the development of metrics by which state government’s progress and accomplishments in information technology can be measured and a process by which the key decision maker’s vision and plans are regularly reviewed and updated.
This inaugural Technology Governance Board Annual Report to the Governor, Department of Management, and the General Assembly, includes:
• Total information technology spending for the previous Fiscal Year - 2005; an estimate of the total information technology expenditure for Fiscal Year 2006; and a projection of information technology spending for Fiscal Year 2007 for all agencies.
• Current and prior Fiscal Year information technology cost savings.
Technology Governance Board Annual Report Page 5
State of Iowa Information Technology Spending For this 2006 TGB Annual Report, Iowa Code Section 8A.204(3) requires a report of total spending on technology for the previous fiscal year (2005), the total amount appropriated for the current fiscal year (2006), and an estimate of the amount to be requested for the succeeding fiscal year (2007) for all agencies.
The fiscal year data included in this report represents:
1. Personnel expenditures - This includes salary, state-provided benefits, travel, training, paid overtime, and other related expenditures for all FTEs with assigned information technology duties. While most IT personnel costs are associated with individuals classified in various information technology series maintained by Department of Administrative Services – Human Resources Enterprise, it is recognized that agencies receive IT support from staff non-IT job classifications. The survey instrument provided agencies with a means to report such FTEs. Agencies were instructed to report FTEs if the position is used at least 25% of the time in providing information technology services. Approximately 15% of IT personnel are in a non-IT classified job, approximately 10% of IT classified positions are not considered to be solely in the IT area (such as data entry operators) and 75% of IT personnel are in IT classified positions
2. “Technology” expenditures – This includes servers & mainframe (including anti-virus, storage devices, and tape backup servers); data network (including communications devices); printers; and workstation computing & related devices.
3. Outside Services expenditures - This portion of the survey obtained data on agency expenditures for IT services outside of those reported in the first two sections. Specifically, agencies provided data on expenditures with: • Department of Administrative Services – Information Technology Enterprise. • Iowa Communications Network (network and other technology related
communication services only - phone services were not included). • Other Agencies providing IT services. • Private Sector Service Providers.
For each of the years reported, all spending was included regardless of the funding source. It is the intent of this report to include all information technology spending and not simply that funded by the General Fund.
• For fiscal year 2005, actual expenditures are reported.
• For fiscal year 2006, agencies reported their best estimate of total agency expenditures for technology, personnel, and outside services. This may or may not be at variance with the information contained in the state’s financial systems.
• For fiscal year 2007, agencies projected their anticipated information technology expenditure requests.
Figure 2 shows the Fiscal Year 2005, 2006, and 2007 actual and projected expenditures in each of the three previously defined categories.

Technology Governance Board Annual Report Page 6
Figure 2. Total State of Iowa Executive Branch Information Technology Expenditures
$0
$20,000,000
$40,000,000
$60,000,000
$80,000,000
$100,000,000
$120,000,000
$140,000,000
$160,000,000
$180,000,000
Outside Services $68,161,000 $66,174,000 $67,422,000
IT personnel (salary plus benefits) $51,787,000 $58,941,000 $61,643,000
Technology Spending $36,517,000 $30,911,000 $32,394,000
FY05 FY06 FY07
Figure 2 shows relatively static information technology expenditures for the fiscal years shown. There is a reduction of approximately two-tenths of one percent from fiscal year 2005 to 2006 and an increase of just over three percent projected from fiscal year 2006 to 2007. Rising personnel costs (i.e. salaries and benefits) account for much of this increase.
669900..7755 FFTTEEss
771166..7755 FFTTEEss
772288..5500 FFTTEEss
Total Annual Spending $ 156,465,000 $ 156,026,000 $ 161,459,000
Technology Governance Board Annual Report Page 7
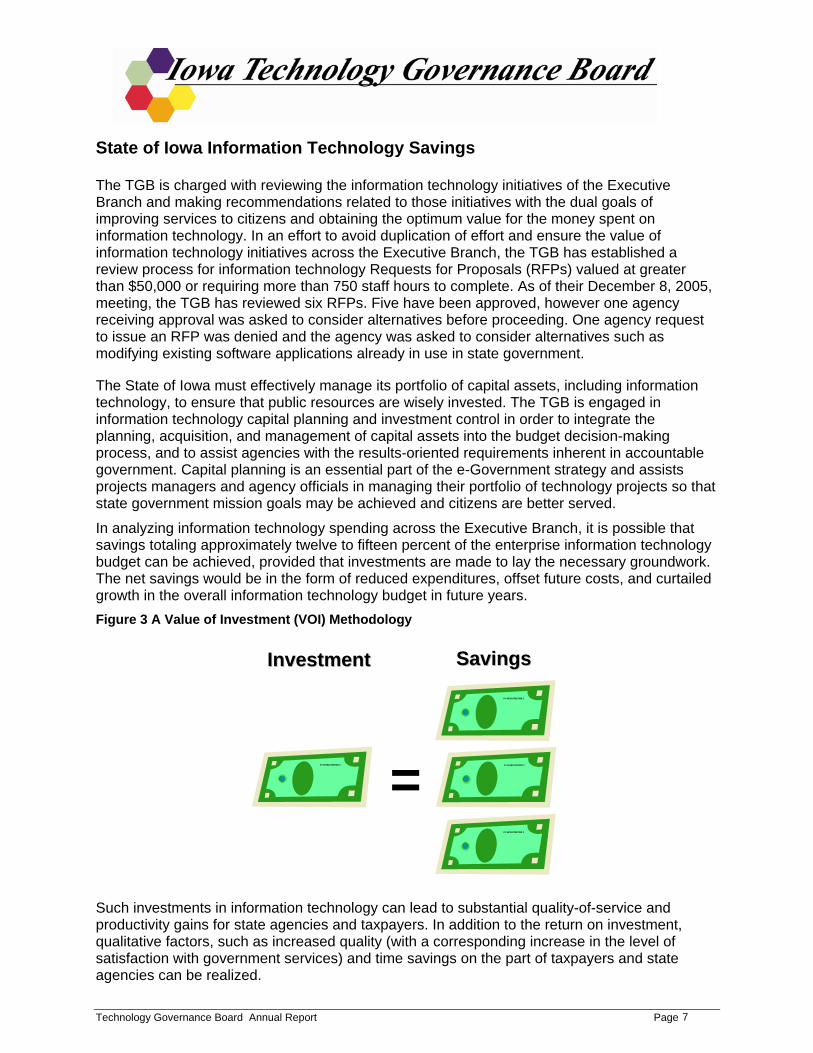
State of Iowa Information Technology Savings The TGB is charged with reviewing the information technology initiatives of the Executive Branch and making recommendations related to those initiatives with the dual goals of improving services to citizens and obtaining the optimum value for the money spent on information technology. In an effort to avoid duplication of effort and ensure the value of information technology initiatives across the Executive Branch, the TGB has established a review process for information technology Requests for Proposals (RFPs) valued at greater than $50,000 or requiring more than 750 staff hours to complete. As of their December 8, 2005, meeting, the TGB has reviewed six RFPs. Five have been approved, however one agency receiving approval was asked to consider alternatives before proceeding. One agency request to issue an RFP was denied and the agency was asked to consider alternatives such as modifying existing software applications already in use in state government. The State of Iowa must effectively manage its portfolio of capital assets, including information technology, to ensure that public resources are wisely invested. The TGB is engaged in information technology capital planning and investment control in order to integrate the planning, acquisition, and management of capital assets into the budget decision-making process, and to assist agencies with the results-oriented requirements inherent in accountable government. Capital planning is an essential part of the e-Government strategy and assists projects managers and agency officials in managing their portfolio of technology projects so that state government mission goals may be achieved and citizens are better served.
In analyzing information technology spending across the Executive Branch, it is possible that savings totaling approximately twelve to fifteen percent of the enterprise information technology budget can be achieved, provided that investments are made to lay the necessary groundwork. The net savings would be in the form of reduced expenditures, offset future costs, and curtailed growth in the overall information technology budget in future years. Figure 3 A Value of Investment (VOI) Methodology
XY 8578247827890 Z
XY 8578247827890 Z
XY 8578247827890 Z
XY 8578247827890 Z
=
InvestmentInvestment SavingsSavings
Such investments in information technology can lead to substantial quality-of-service and productivity gains for state agencies and taxpayers. In addition to the return on investment, qualitative factors, such as increased quality (with a corresponding increase in the level of satisfaction with government services) and time savings on the part of taxpayers and state agencies can be realized.
Technology Governance Board Annual Report Page 8
Traditional cost-benefit analysis focuses on costs and their directly related financial gains (i.e. return on investment - ROI). Qualitative benefits like increased availability and quality of services are normally left out of such ROI analyses or present difficulties in representing the monetary values for the benefits achieved. However, for the public sector it is important to include benefits related to such gains. Using a Value of Investment methodology makes it possible to include such benefits if certain prerequisites (i.e. legislative and executive requirements for strategic priorities and service goals) are fulfilled.
As of January 1, 2006, the executive branch agencies have collaborated on a number of cost reduction initiatives. These include:
1. Personal Computer Lifecycle Management a. Desktop Personal Computer Purchasing - A contract negotiated to aid agencies in
purchasing desktop computers at the best possible price within standardized configurations. Most agencies used this contract to purchase personal computers for their agency in the Fiscal Year 2005 and continue to use it in Fiscal Year 2006. A committee comprised of agency representatives defined business requirements for devices and components and developed standardized configurations that met the their needs. (Savings: FY05 - $260,401; FY06 - $409,508)
b. Laptop Personal Computer Purchasing - A contract negotiated to aid agencies in purchasing laptop computers at the best possible price with an agreed upon configuration. The same committee that defined the desktop computer configuration also defined a laptop configuration with the capability for various enhancements. (Savings: FY05 - $128,164; FY06 - $40,948)
2. Architecture Study – The Technology Governance Board has approved the expenditure of $170,000 to develop and issue a Request for Proposals for a Service Oriented Architecture. This effort is currently in process; proposals from potential vendors will be received and analyzed in the third quarter of fiscal year 2006.
3. IBM Software Acquisition Program - Passport Advantage and Passport Advantage Express are simple, comprehensive IBM programs that cover software license acquisition and maintenance options under a single, common set of agreements, processes and tools. Passport Advantage is focused on larger enterprises, while Passport Advantage Express is a transaction-based program designed to meet the needs of medium-sized organizations. (Savings: FY05 - $14,618; FY06 - $8,250)
4. Computer Associates Agreement - Three agencies with mainframe installations (DAS-Information Technology Enterprise, Department of Transportation and Workforce Development) worked collaboratively to negotiate the cost effective agreements for their mainframe database software products. (Savings: FY05 - $296,413; FY06 - $40,641)
5. Oracle Licenses - Oracle is a Relational DataBase Management System (RDBMS) with versions available for the vast majority of current computing platforms. Oracle has distributed capabilities that allow the aggregation of database tables from different computing environments. As a leader in the RDBMS field, many other software development companies

Technology Governance Board Annual Report Page 9
offer interfaces and compatibilities with Oracle databases. By standardizing on the Oracle database, many options are kept open for features, development tools, and other third party software. . (Savings: FY05 - $107,941; FY06 - $33,317)
6. Veritas Email Enterprise Vault – This is a contract negotiated for an email archiving system that is used by several agencies to control and manage various types of email backups. VERITAS Enterprise Vault™ provides a flexible, software-based archiving framework to enable the discovery of content held within Microsoft Exchange, SharePoint, Instant Messaging, and various file server environments, while reducing storage costs and simplifying management. (Savings: FY05 - $64,584; FY06 - $0)
7. Mainframe Leases - Three agencies with mainframe installations (DAS-Information Technology Enterprise, Department of Transportation and Workforce Development) worked collaboratively to negotiate cost effective purchase terms for IBM hardware. (Savings: FY05 - $76,908; FY06 - $323,668)
8. Secure Sockets Layer (SSL) Certificates – SSL certificates are used for securely transmitting data via the Internet. (Savings: FY05 - $8,410; FY06 - $13,110)
Table 2. Recap of Fiscal Year 2005 and 2006 Savings from Collaborative Initiatives
Fiscal Year 2005 Fiscal Year 2006
Estimated
Units
Estimated Unit
Savings
Total Estimated Savings
Estimated Units
Estimated Unit
Savings
Total Estimated Savings
Desktop Purchasing 2,438 $107 $260,401 1585 $258 $409,508
Laptop Purchasing 481 $266 $128,164 156 $262 $40,948
IBM Passport Licenses N/A N/A $14,618 N/A N/A $8,250
Computer Associates Agreement N/A N/A $296,413 N/A N/A $40,641
Oracle Licenses N/A N/A $107,941 N/A N/A $33,317
Veritas Email Enterprise Vault 5,520 N/A $64,584 N/A N/A $0
Mainframe Leases N/A N/A $76,908 N/A N/A $323,668
SSL Certificates 14 $601 $8,410 23 $570 $13,110
Estimated FY05
Savings $957,439 Estimated FY06 Savings $869,442
Of thirty-four agencies participating, twenty-two reported savings from these initiatives through the Second Quarter of Fiscal Year 2006; twelve agencies reported no savings to-date.
Technology Governance Board Annual Report Page 10
Five Year Projection of Cost Savings
The Technology Governance Board has been engaged in organizing and coordinating various advisory groups and governance in the short time it has been in place. The foundation of an effective information technology strategy for government requires a service oriented architecture (SOA) and other key infrastructure initiatives and services. Without this foundation in place, It is not possible to provide any meaningful five year projection of information technology cost savings in this inaugural TGB Annual Report. Appendix A (page 11) provides a list of TGB Action Items for 2006; Appendix B (page 12) provides definitions for terms used in this report, including “service oriented architecture”.

Technology Governance Board Annual Report Page 11
Appendix A. Action Items for the Technology Governance Board for 2006 Foundational Issues Request for Proposals for Service-Oriented Architecture (SOA) and Enterprise Portfolio Management System (EPfMS) – Definitions of Service Oriented Architecture and Enterprise Portfolio Management are contained in Appendix B (page 12).
TGB Strategic Plan - Develop a TGB-specific IT strategic plan that reflects the current structure, duties, and responsibilities of the TGB.
IT Standards Work Group - Form work group to review existing and develop new IT standards
Adoption of a Formal RFP approval process - Evaluate IT-related RFPs on:
1. Adherence to IT standards (Existing and future)
2. Adherence to IT architecture (Check for SOA requirements)
3. Duplication of existing applications or systems (Check EPfMS for duplication)
4. Development of IT strategic plan goals
Ongoing TGB Priorities
• TGB Communications - Communicate to all interested parties on the TGB decisions and projects through: website, newsletter, updates to IGOV and dept. heads, meetings, etc.
• Business Continuity – Continuity of Operations (COOP) and Continuity of Government (COG) issues related to information technology in state government.
• Enterprise IT Security Program - A combination of policies, processes, practices, and tools used to ensure the security of State of Iowa information technology systems, services, and data.
Initiatives and Surveys
• Common Life Cycle Management - A combination of policies, processes, practices, and tools used to align the business of information with the most appropriate and cost effective IT infrastructure from the time information is conceived through its final disposition.
• Depreciation Fund For Replacing Equipment - Study how the DOT manages their approach for depreciation
• JCIO cost Savings Initiatives - Share the JCIO initiatives spreadsheet with the TGB members
• Spending Research Survey - TGB to investigate possible duplicative spending in IT purchases.
Technology Governance Board Annual Report Page 12
Appendix B. TGB Annual Report Terminology
Enterprise Portfolio Management – To provide some perspective, it helps to understand project-level management and portfolio management. In project-level management, agencies developed control methods and procedures around their projects. These procedures helped decision-makers select the individual projects and initiatives that were most closely linked with the strategic direction of their organizations. Once selected, project management and control procedures were put in place to ensure that a funded project would achieve its intended objectives within cost, schedule, technical, and performance baselines.
When organizations saw the need for a broader approach, the portfolio management approach evolved. Here, the focus was at a more aggregate level (rather than at the individual project level). A cornerstone of the portfolio management approach is the "select-control-evaluate" paradigm put forward by the federal government’s General Accounting Office in 1997. The State of Iowa used various pooled funding mechanisms to the same end, eventually developing the Return on Investment (ROI) program in 2000. This framework helps decision-makers achieve organizational goals and objectives by identifying, selecting, financing, and monitoring the most appropriate mix of projects and initiatives.
Enterprise portfolio management is the next step in his evolution. An enterprise involves an amalgamation of interdependent resources (including people, processes, facilities, and technologies) organized to obtain a strategic advantage in support of mission or business objectives. Thus, by its very nature, enterprise portfolio management is larger in scope and more complex than either portfolio management or project management. This new paradigm recognizes that at the enterprise level, decision-makers must consider not only the investment options under their control, but also take into account how their alternatives affect, and are affected by, other components of the enterprise. To some extent, this view was also present in the earlier stages. However, in enterprise portfolio management, the interactive nature of the decision environment is paramount.
Information technology means computing and electronics applications used to process and distribute information in digital and other forms and includes information technology devices and information technology services. Information technology device means equipment or associated software, including programs, languages, procedures, or associated documentation, used in operating the equipment which is designed for utilizing information stored in an electronic format. Information technology device includes but is not limited to computer systems, computer networks, and equipment used for input, output, processing, storage, display, scanning, and printing. Information technology services means services designed to do any of the following:
a. Provide functions, maintenance, and support of information technology devices and facilities.
b. Provide services including, but not limited to, any of the following: 1. Computer systems application development and maintenance. 2. Systems integration and interoperability. 3. Operating systems maintenance and design.

Technology Governance Board Annual Report Page 13
4. Computer systems programming. 5. Computer systems software support. 6. Security relating to information technology. 7. Data management. 8. Information technology education. 9. Information technology planning and standards. 10. Computer networking.
Service-Oriented Architecture (SOA) - As government builds more and more software systems, we see similar situations and patterns appearing. Naturally, we want to reuse the functionality of existing systems rather than building them from scratch. A service-oriented architecture is essentially a collection of services that can communicate with each other. The communication can involve either simple data passing or it could involve two or more services coordinating some activity. The goal of SOA is an architectural style with a loose coupling among interacting software agents. A service is a unit of work done by a service provider to achieve desired end results for a service consumer. Both provider and consumer are roles played by software agents on behalf of their owners.
ServiceServiceProviderProvider
ServiceServiceConsumerConsumerService RequestService Request
Service ResponseService Response
Technology Governance Board Annual Report Page 14
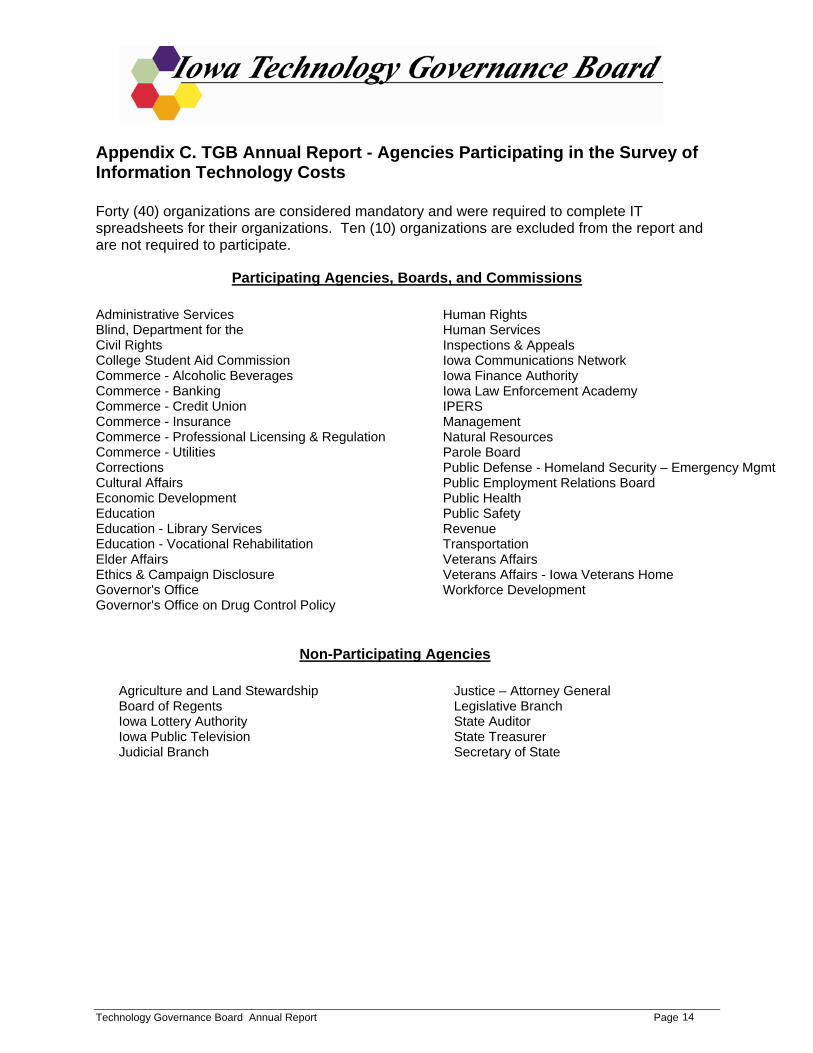
Appendix C. TGB Annual Report - Agencies Participating in the Survey of Information Technology Costs Forty (40) organizations are considered mandatory and were required to complete IT spreadsheets for their organizations. Ten (10) organizations are excluded from the report and are not required to participate.
Participating Agencies, Boards, and Commissions Administrative Services Blind, Department for the Civil Rights College Student Aid Commission Commerce - Alcoholic Beverages Commerce - Banking Commerce - Credit Union Commerce - Insurance Commerce - Professional Licensing & Regulation Commerce - Utilities Corrections Cultural Affairs Economic Development Education Education - Library Services Education - Vocational Rehabilitation Elder Affairs Ethics & Campaign Disclosure Governor's Office Governor's Office on Drug Control Policy
Human Rights Human Services Inspections & Appeals Iowa Communications Network Iowa Finance Authority Iowa Law Enforcement Academy IPERS Management Natural Resources Parole Board Public Defense - Homeland Security – Emergency Mgmt Public Employment Relations Board Public Health Public Safety Revenue Transportation Veterans Affairs Veterans Affairs - Iowa Veterans Home Workforce Development
Non-Participating Agencies Agriculture and Land Stewardship Board of Regents Iowa Lottery Authority Iowa Public Television Judicial Branch
Justice – Attorney General Legislative Branch State Auditor State Treasurer Secretary of State

Appendix D. Information Technology Personnel Spending
Technology Governance Board Annual Report Page 15
Appendix D. Information Technology Personnel Spending Personnel Spending includes salary, state-provided benefits, travel, training, paid overtime, and other related expenditures) for all information technology job classifications and non-information technology job classifications having assigned information technology duties. Agencies have included FTEs and the associated expenditures for each reporting year. While most IT personnel costs are associated with individuals classified in various information technology job classifications maintained by the Human Resources Enterprise (HRE), it is recognized that agencies receive IT support from staff in non-IT job classifications. The second table in this appendix contains information on the non-information technology job classifications with assigned information technology duties. Approximately 15% of IT personnel are in a non-IT job class, approximately 10% of IT classified positions are not considered to be solely in the IT area (such as data entry operators) and 75% of IT personnel are in IT classified positions
All Information Technology Classifications (All dollar amounts in thousands)
HRE Classification
FY05 State FTE
FY05 Cost W / Benefits
FY06 State FTE
FY06 Cost W / Benefits
FY07 State FTE
FY07 Cost W / Benefits
Info Specialist 1 1.00 $ 42 2.00 $ 97 2.00 $ 100
Info Specialist 2 3.00 $ 172 3.00 $ 171 3.00 $ 174
Info Specialist 2 - Non Union 0.00 $ - 0.00 $ - 0.00 $ -
Info Specialist 3 2.00 $ 129 2.00 $ 149 2.00 $ 158
Info Specialist 3 - Non Union 0.00 $ - 0.00 $ - 0.00 $ -
Info Tech Admin 1 3.50 $ 315 3.50 $ 326 2.50 $ 236
Info Tech Admin 2 22.50 $2,155 22.50 $2,405 24.50 $2,645
Info Tech Admin 3 8.25 $ 765 9.25 $1,028 10.00 $1,135
Info Tech Admin 4 5.00 $ 528 4.00 $ 556 4.00 $ 563
Info Tech Enterprise Expert 10.00 $1,259 11.00 $1,410 11.00 $1,482

Appendix D. Information Technology Personnel Spending
Technology Governance Board Annual Report Page 16
HRE Classification
FY05 State FTE
FY05 Cost W / Benefits
FY06 State FTE
FY06 Cost W / Benefits
FY07 State FTE
FY07 Cost W / Benefits
Info Tech Enterprise Expert - Non Union 0.00 $ 63 0.00 $ - 0.00 $ -
Info Tech Specialist 1 4.00 $ 207 4.00 $ 218 4.00 $ 221
Info Tech Specialist 1 - Non Union 0.00 $ - 0.00 $ - 0.00 $ -
Info Tech Specialist 2 54.00 $ 3,172 53.00 $3,422 54.75 $3,647
Info Tech Specialist 2 - Non Union 3.00 $ 127 2.00 $ 124 2.00 $ 130
Info Tech Specialist 3 89.25 $ 5,824 93.50 $6,655 91.50 $6,672
Info Tech Specialist 3 - Non Union 0.00 $ - 1.00 $ 56 1.00 $ 59
Info Tech Specialist 4 179.00 $ 13,465 185.50 $ 15,498 193.25 $ 16,679
Info Tech Specialist 4 - Non Union 7.00 $ 560 7.00 $ 584 7.00 $ 663
Info Tech Specialist 5 150.75 $ 13,711 163.25 $ 16,329 168.50 $ 17,102
Info Tech Specialist 5 - Non Union 4.00 $ 388 4.00 $ 414 4.00 $ 430
Info Tech Supervisor 1 0.00 $ - 0.00 $ - 0.00 $ -
Info Tech Supervisor 2 0.00 $ - 0.00 $ - 0.00 $ -
Info Tech Support Worker 1 1.00 $ 35 0.00 $ - 0.00 $ -
Info Tech Support Worker 1 - Non Union 0.00 $ - 0.00 $ - 0.00 $ -

Appendix D. Information Technology Personnel Spending
Technology Governance Board Annual Report Page 17
HRE Classification
FY05 State FTE
FY05 Cost W / Benefits
FY06 State FTE
FY06 Cost W / Benefits
FY07 State FTE
FY07 Cost W / Benefits
Info Tech Support Worker 2 22.75 $1,045 25.25 $1,145 25.25 $1,158
Info Tech Support Worker 2 - Non Union 0.00 $ - 1.00 $ 36 1.00 $ 36
Info Tech Support Worker 3 18.00 $ 791 15.00 $ 735 14.00 $ 710
Info Tech Support Worker 3 - Non Union 0.00 $ - 0.00 $ - 0.00 $ -
Info Tech Support Worker 4 13.00 $ 598 12.00 $ 681 11.00 $ 609
Info Tech Support Worker 4 - Non Union 0.00 $ - 0.00 $ - 0.00 $ -
Information System Specialist 1 0.00 $ - 0.00 $ - 0.00 $ -
Information System Specialist 2 0.00 $ - 0.00 $ - 0.00 $ -
Information System Specialist 3 0.00 $ - 0.00 $ - 0.00 $ -
Information Technology Spec 3.00 $ 177 3.00 $ 186 3.00 $ 195
Other Personnel Classifications (From the non-IT Job Classes Chart starting on page 18) 86.75 $ 6,259 90.00 $6,716 89.25 $6,839
Travel & Training 0.00 $ - 0.00 $ - 0.00 $ -
Office Supplies 0.00 $ - 0.00 $ - 0.00 $ -
Paid Overtime 0.00 $ - 0.00 $ - 0.00 $ -
All IT Classifications Total 690.75 $ 51,787 716.75 $ 58,941 728.50 $ 61,643

Appendix D. Information Technology Personnel Spending
Technology Governance Board Annual Report Page 18
All Non-Information Technology Classifications with Assigned IT Duties (All dollar amounts in thousands)
The TGB survey instrument provided agencies with a means to report FTEs in non-information technology job classifications that have assigned information technology duties. Agencies were instructed to report FTEs if the position is used at least 25% of the time in providing information technology services.
HRE Classification
FY05 State FTE
FY05 Cost W / Benefits
FY06 State FTE
FY06 Cost W / Benefits
FY07 State FTE
FY07 Cost W / Benefits
Clerk-Advanced 6.00 $242 6.00 $263 6.00 $263
Secretary 1 0.75 $ 28 1.00 $ 40 1.00 $ 40
Secretary 2 1.00 $ 55 1.00 $ 58 1.00 $ 58
Word Processor 2 0.25 $ 11 0.25 $ 11 0.25 $ 11
Purchasing Agent 3 0.00 $ - 0.00 $ - 0.00 $ -
Accounting Technician 1 1.25 $ 47 0.25 $ 12 0.25 $ 12
Accounting Technician 2 2.00 $104 3.00 $157 2.00 $169
Field Auditor 1.25 $ 67 1.25 $ 67 1.25 $ 67
Bank Examiner 3.00 $186 3.00 $139 2.00 $141
Bank Examiner Supervisor 1.00 $118 1.00 $124 1.00 $130
Credit Union Examiner Senior 1.00 $ 27 1.00 $101 1.00 $106
Admin Intern 0.50 $ 12 0.00 $ - 0.00 $ -
Admin Assistant 2 10.75 $633 10.75 $669 10.75 $669
Exec Off 1 4.25 $297 4.25 $314 4.25 $322
Exec Off 2 4.75 $395 7.75 $659 7.75 $643
Exec Off 3 3.50 $450 5.00 $480 5.00 $481

Appendix D. Information Technology Personnel Spending
Technology Governance Board Annual Report Page 19
HRE Classification
FY05 State FTE
FY05 Cost W / Benefits
FY06 State FTE
FY06 Cost W / Benefits
FY07 State FTE
FY07 Cost W / Benefits
Exec Off 4 3.00 $329 3.00 $340 3.00 $347
Exec Off 5 0.00 $ - 0.00 $ - 0.00 $ -
Budget Analyst 3 0.00 $ - 0.00 $ - 0.00 $ -
Management Analyst 2 4.00 $242 3.00 $199 3.00 $205
Management Analyst 3 1.75 $143 1.00 $ 85 1.00 $ 89
Management Analyst 4 1.00 $ 83 2.75 $257 3.00 $287
Statistical Research Analyst 3 1.00 $ 61 1.00 $ 63 1.00 $ 63
Human Resources Associate 0.25 $ 12 0.25 $ 13 0.25 $ 14
Public Service Executive 2 - Hre Code 782 0.00 $ - 0.00 $ - 0.00 $ -
Public Service Executive 3 - Hre Code 784 5.00 $477 4.50 $384 5.50 $449
Public Service Executive 5 - Hre Code 787 1.50 $188 1.50 $193 1.50 $199
Public Service Executive 6 0.00 $ - 0.00 $ - 0.00 $ -
Library Consultant 0.75 $ 62 0.75 $ 62 0.75 $ 62
Social Worker 4 0.00 $ - 0.00 $ - 0.00 $ -
Program Planner 1 0.25 $ 11 0.25 $ 12 0.25 $ 12
Program Planner 2 2.25 $127 2.25 $124 2.25 $127
Program Planner 3 2.00 $144 2.00 $151 2.00 $155
Transportation Div Director 1.00 $135 1.00 $138 1.00 $138
Appendix D. Information Technology Personnel Spending
Technology Governance Board Annual Report Page 20
HRE Classification
FY05 State FTE
FY05 Cost W / Benefits
FY06 State FTE
FY06 Cost W / Benefits
FY07 State FTE
FY07 Cost W / Benefits
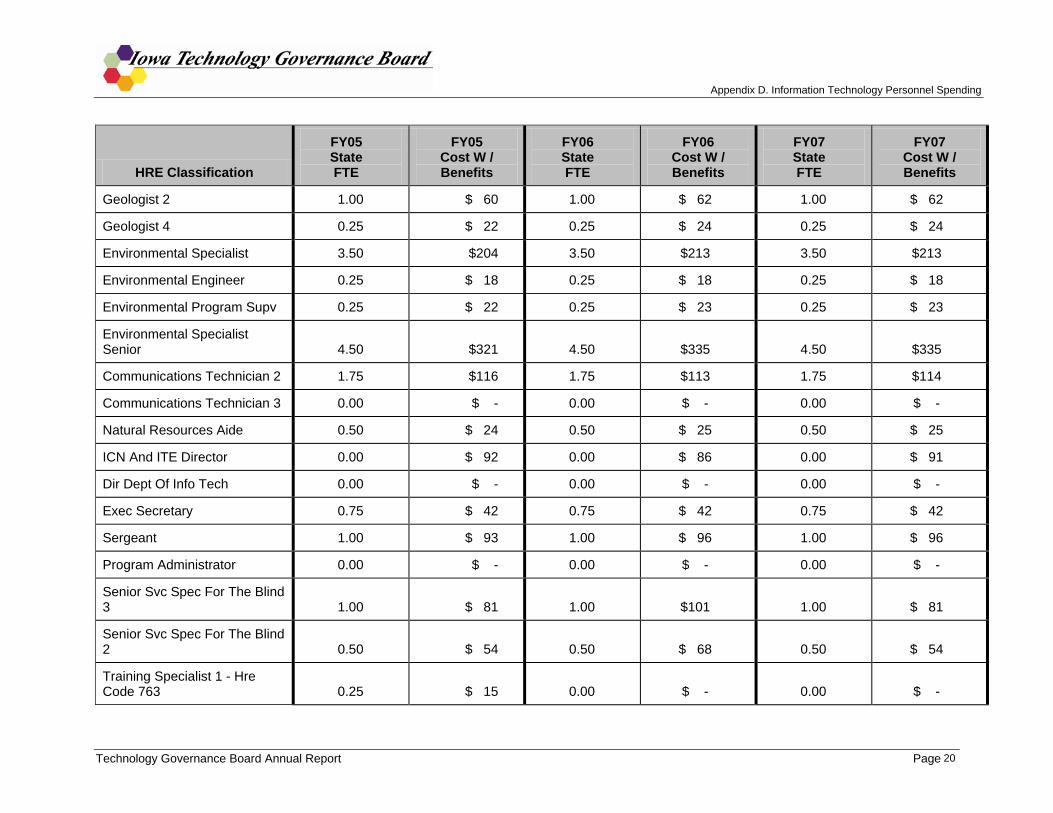
Geologist 2 1.00 $ 60 1.00 $ 62 1.00 $ 62
Geologist 4 0.25 $ 22 0.25 $ 24 0.25 $ 24
Environmental Specialist 3.50 $204 3.50 $213 3.50 $213
Environmental Engineer 0.25 $ 18 0.25 $ 18 0.25 $ 18
Environmental Program Supv 0.25 $ 22 0.25 $ 23 0.25 $ 23
Environmental Specialist Senior 4.50 $321 4.50 $335 4.50 $335
Communications Technician 2 1.75 $116 1.75 $113 1.75 $114
Communications Technician 3 0.00 $ - 0.00 $ - 0.00 $ -
Natural Resources Aide 0.50 $ 24 0.50 $ 25 0.50 $ 25
ICN And ITE Director 0.00 $ 92 0.00 $ 86 0.00 $ 91
Dir Dept Of Info Tech 0.00 $ - 0.00 $ - 0.00 $ -
Exec Secretary 0.75 $ 42 0.75 $ 42 0.75 $ 42
Sergeant 1.00 $ 93 1.00 $ 96 1.00 $ 96
Program Administrator 0.00 $ - 0.00 $ - 0.00 $ -
Senior Svc Spec For The Blind 3 1.00 $ 81 1.00 $101 1.00 $ 81
Senior Svc Spec For The Blind 2 0.50 $ 54 0.50 $ 68 0.50 $ 54
Training Specialist 1 - Hre Code 763 0.25 $ 15 0.00 $ - 0.00 $ -
Appendix D. Information Technology Personnel Spending
Technology Governance Board Annual Report Page 21
HRE Classification
FY05 State FTE
FY05 Cost W / Benefits
FY06 State FTE
FY06 Cost W / Benefits
FY07 State FTE
FY07 Cost W / Benefits
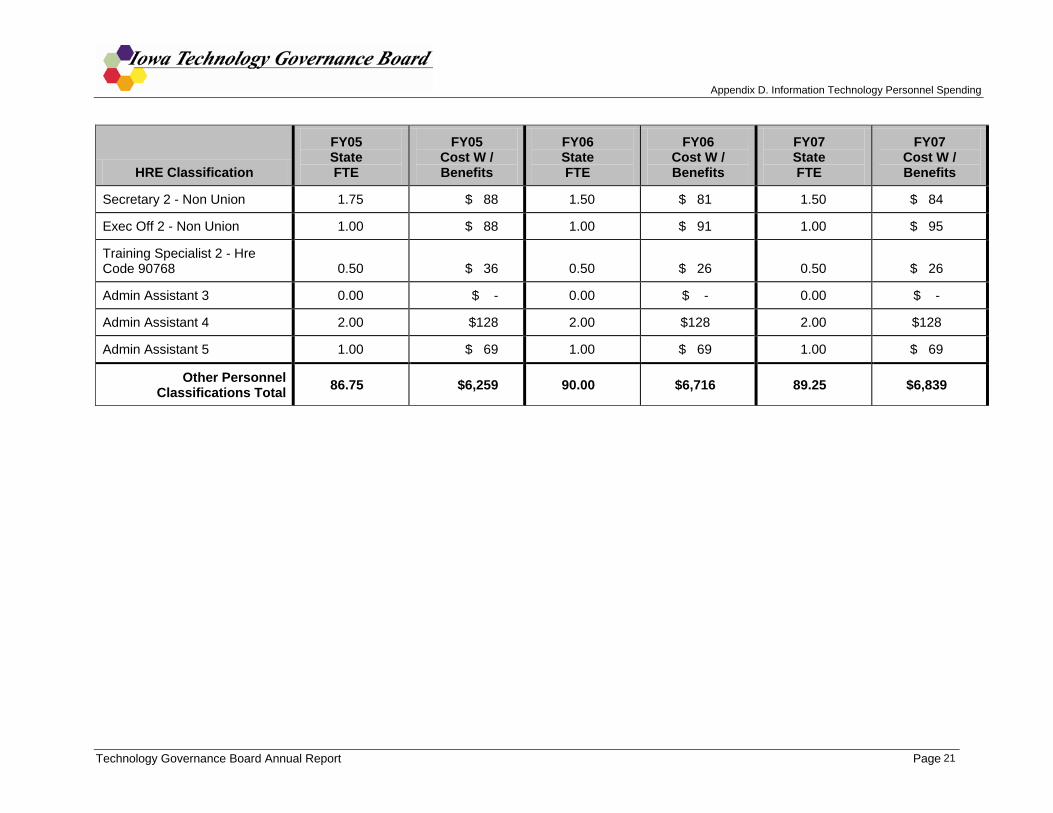
Secretary 2 - Non Union 1.75 $ 88 1.50 $ 81 1.50 $ 84
Exec Off 2 - Non Union 1.00 $ 88 1.00 $ 91 1.00 $ 95
Training Specialist 2 - Hre Code 90768 0.50 $ 36 0.50 $ 26 0.50 $ 26
Admin Assistant 3 0.00 $ - 0.00 $ - 0.00 $ -
Admin Assistant 4 2.00 $128 2.00 $128 2.00 $128
Admin Assistant 5 1.00 $ 69 1.00 $ 69 1.00 $ 69
Other Personnel Classifications Total 86.75 $6,259 90.00 $6,716 89.25 $6,839

Appendix E. Technology Spending
Technology Governance Board Annual Report Page 22
Appendix E. Technology Spending (All dollar amounts in thousands) “Technology” spending includes servers & mainframe (including anti-virus, storage devices, and tape backup servers); data network (including communications devices); printers; and workstation computing & related devices.
Inventory And Non-Inventory IT Expenditures Total Cost ($)
Hardware (Purchases & Leases)
Software (Purchases & Leases)
Hardware Maintenance
Software Maintenance
Miscellaneous (Peripherals,
Parts, Supplies, Etc.)
FY05
Desktop / workstation computing devices & related devices $ 12,537 $ 7,124 $ 2,816 $ 77 $ 1,108 $ 1,412 Servers / mainframe (including antivirus & storage devices, tape backup servers & drives) $ 18,325 $ 4,189 $ 4,774 $ 1,758 $ 6,936 $ 668 Data network including communications devices $ 3,993 $ 2,639 $ 168 $ 796 $ 224 $ 166 Printers $ 1,662 $ 1,029 $ - $ 37 $ - $ 596
TOTAL $ 36,517 $ 14,981 $ 7,758 $ 2,668 $ 8,268 $ 2,842
FY06
Desktop / workstation computing devices & related devices $ 11,663 $ 7,497 $ 2,218 $ 100 $ 967 $ 881 Servers / mainframe (including antivirus & storage devices, tape backup servers & drives) $ 15,300 $ 3,675 $ 3,949 $ 1,541 $ 5,535 $ 600 Data network including communications devices $ 2,993 $ 1,874 $ 235 $ 631 $ 169 $ 84 Printers $ 955 $ 402 $ - $ 39 $ - $ 514
TOTAL $ 30,911 $ 13,448 $ 6,402 $ 2,311 $ 6,671 $ 2,079
FY07
Desktop / workstation computing devices & related devices $ 12,711 $ 8,611 $ 2,134 $ 70 $ 1,036 $ 860 Servers / mainframe (including antivirus & storage devices, tape backup servers & drives) $ 15,390 $ 3,703 $ 3,374 $ 1,710 $ 5,986 $ 615 Data network including communications devices $ 3,281 $ 2,075 $ 240 $ 701 $ 181 $ 84 Printers $ 1,012 $ 410 $ - $ 35 $ - $ 567
TOTAL $ 32,394 $ 14,799 $ 5,748 $ 2,516 $ 7,203 $ 2,126

Appendix F. Information Technology Spending – Outside Services
Technology Governance Board Annual Report Page 23
Appendix F. Information Technology Spending - Outside Services (All dollar amounts in thousands)
Outside Services expenditures - This portion of the survey obtained data on agency expenditures for IT services outside of those reported in the first two sections. Specifically, agencies provided data on expenditures with:
• Department of Administrative Services – Information Technology Enterprise (ITE) • Iowa Communications Network (ICN) - Network and other technology related communication services only - phone services
are not included. • Other Agencies providing IT services. • Private Sector Service Providers.
Total Outside Services
Cost ITE
Cost ICN Cost
Other Agency Cost
Private Sector Project
Cost
Private Sector Staff
Augmentation Cost
Fiscal Year 2005 $ 68,161 $ 23,434 $ 9,088 $ 698 $ 25,176 $ 9,765
Fiscal Year 2006 $ 66,174 $ 24,097 $ 9,088 $ 680 $ 22,861 $ 9,448
Fiscal Year 2007 $ 67,422 $ 24,097 $ 9,088 $ 497 $ 25,056 $ 8,684
Related Documents