2005 REGION 4 EPA/ DoD/STATES/ ENVIRONMENTAL CONFERENCE “Small is beautiful!” (and better!) June 29, 2005 Chuck Tremel, P.E. Principal Technical Manager Advanced Energy Program

2005 REGION 4 EPA/ DoD/STATES/ ENVIRONMENTAL CONFERENCE “Small is beautiful!” (and better!) June 29, 2005 Chuck Tremel, P.E. Principal Technical Manager.
Dec 27, 2015
Welcome message from author
This document is posted to help you gain knowledge. Please leave a comment to let me know what you think about it! Share it to your friends and learn new things together.
Transcript

2005 REGION 4 EPA/ DoD/STATES/
ENVIRONMENTAL CONFERENCE
“Small is beautiful!” (and better!)June 29, 2005Chuck Tremel, P.E.
Principal Technical ManagerAdvanced Energy Program
Topics
Drivers for Distributed and Renewable Energy
Distributed Energy and Combined Heat & Power
Renewable Portfolio Standards Renewable Energy Opportunities &
Examples Interconnection Issues Renewable Energy Prognosis
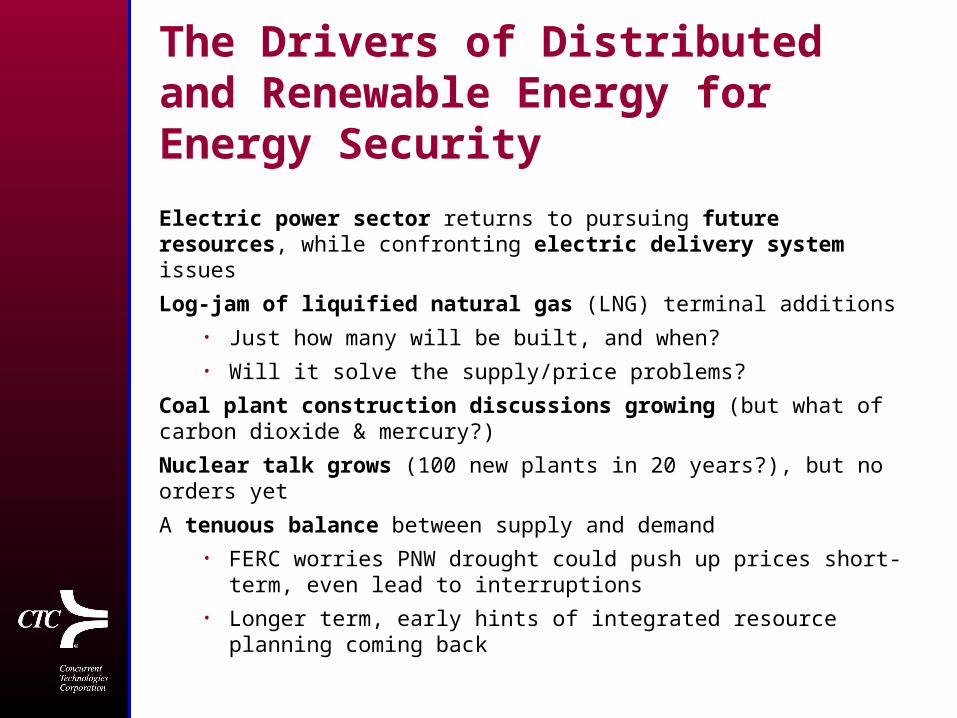
The Drivers of Distributed and Renewable Energy for Energy Security
Electric power sector returns to pursuing future resources, while confronting electric delivery system issues
Log-jam of liquified natural gas (LNG) terminal additions• Just how many will be built, and when?• Will it solve the supply/price problems?
Coal plant construction discussions growing (but what of carbon dioxide & mercury?)
Nuclear talk grows (100 new plants in 20 years?), but no orders yet
A tenuous balance between supply and demand• FERC worries PNW drought could push up prices short-
term, even lead to interruptions• Longer term, early hints of integrated resource planning
coming back
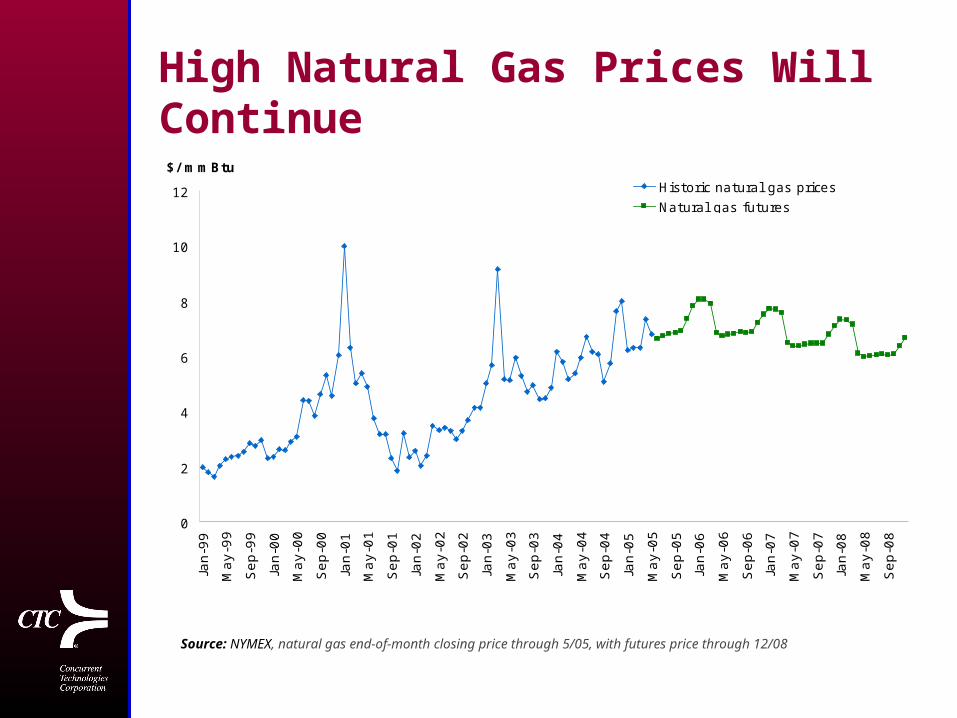
High Natural Gas Prices Will Continue
0
2
4
6
8
10
12Ja
n-9
9
Ma
y-9
9
Se
p-9
9
Jan
-00
Ma
y-0
0
Se
p-0
0
Jan
-01
Ma
y-0
1
Se
p-0
1
Jan
-02
Ma
y-0
2
Se
p-0
2
Jan
-03
Ma
y-0
3
Se
p-0
3
Jan
-04
Ma
y-0
4
Se
p-0
4
Jan
-05
Ma
y-0
5
Se
p-0
5
Jan
-06
Ma
y-0
6
Se
p-0
6
Jan
-07
Ma
y-0
7
Se
p-0
7
Jan
-08
Ma
y-0
8
Se
p-0
8
$/ mmBtu
Historic natural gas prices
Natural gas futures
Source: NYMEX, natural gas end-of-month closing price through 5/05, with futures price through 12/08

Fuel-driven DE Prime Mover Technologies
Reciprocating engines Gas turbines Microturbines Fuel cells Stirling engines
Electrical capacity
<1 kW - 80 MW 300 kW - 334 MW 30 kW - 250 kW <1 kW – 1.5 MW 1 kW - 55 kW
Applications Standby, peaking, prime power
Peaking& prime power
Peaking& prime power
Prime power Prime power
Fuel Liquidand/or gaseous
Liquidand/or gaseous
Liquid or gaseous Liquid or gaseous Any heat source
Emissions Medium to high(low with treatment)
Medium to low Medium to low Extremely low Potentially low (external combustion)
Maturity Very mature Very mature Maturing, 2nd & 3rd generation
Early market entry Early market entry
Annual shipments (2004)
~40,000 MW* <1,000 MW* 23 MW ~10 MW ~9 MW** (2005)
* For units less than 10 MW
** Stirling engines 2005 estimate

Payback for CHP Lengthened by High Gas Prices, Public Sector still Attractive
0%
10%
20%
30%
40%
50%
60%
70%
80%
90%
100%
6 mos. 1 yr. 2 yrs. 3 yrs. 4 yrs. 5 yrs. 6 to 10yrs.
11+ yrs.
Restaurants
Education
Manufacturing
Wholesale
Retail
Services
Government
Source: Primen’s 2003 Distributed Energy Market Survey

Microturbines Initiate a Turn-Around
Shipments rose for first time since 2001− Up 3.2 MW (three
projects)− But far below peak
year of 67 MW shipments
Inventory at distributors nearly gone
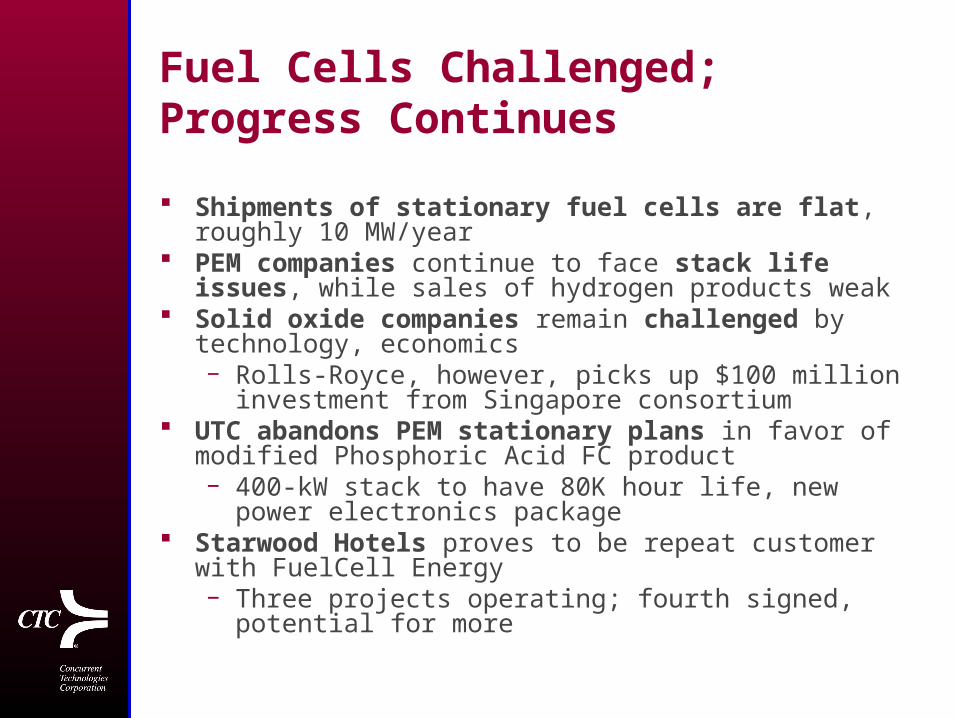
Fuel Cells Challenged; Progress Continues
Shipments of stationary fuel cells are flat, roughly 10 MW/year
PEM companies continue to face stack life issues, while sales of hydrogen products weak
Solid oxide companies remain challenged by technology, economics− Rolls-Royce, however, picks up $100 million
investment from Singapore consortium UTC abandons PEM stationary plans in favor of
modified Phosphoric Acid FC product− 400-kW stack to have 80K hour life, new power
electronics package Starwood Hotels proves to be repeat customer
with FuelCell Energy− Three projects operating; fourth signed, potential
for more
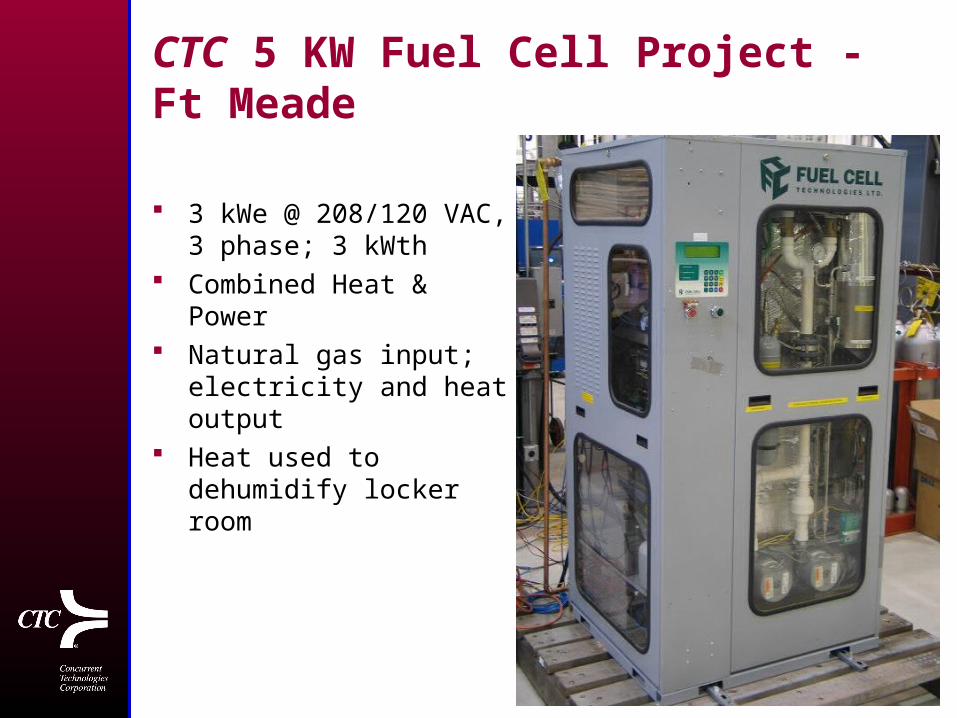
CTC 5 KW Fuel Cell Project - Ft Meade
3 kWe @ 208/120 VAC, 3 phase; 3 kWth
Combined Heat & Power
Natural gas input; electricity and heat output
Heat used to dehumidify locker room

The Upshot for Distributed Energy
Backup market growing again for critical loads
Peaking and CHP growth slow, primarily due to high gas prices

20 Renewable Portfolio Standards Now Approved, with More on the Way
RPS mandates in IL and VT are pending


Wind Boom Continues
Global wind capacity at 48 GW end of 2004, was 8.2 GW capacity on-line 2003– Forecast of 117 GW by
2009 U.S. capacity at 6.7 GW,
389 MW added in 2004– AWEA predicts 2-2.5
GW in 2005– RPS laws-on-the-books
could lead to as much as 40 GW in next 15 years
5 MW turbine commissioned by REPower (Germany); 94% availability

Wind: System Design Challenges?Western Denmark facing T&D issues from too much
wind, which now makes up 23% of power produced in the region
Similar problems cropping up in US (Texas, etc.) and solutions sought Inadequate load-following capability, and unlikely
that new firm capacity will be built Poor predictability of wind power, with wires
company purchasing costly regulating power Reactive power needs balancing, with increased
grid losses and expensive compensation Unpredictable local networks (distribution
systems), leading to an increased risk of serious system disturbances

Wind at Guantanamo Bay
Four NEG Micon 950 KW Turbines
275 feet tall; 177 ft. Blade rotor diameter
Augments 22.8 MW diesel fired stand-alone system
Cost: $12 Million Avg. Production – 8 Million
KWH/ Year Savings of $1.2 million
energy costs Environmental Benefits
– Reduce 26 tons SO2– Reduce 15 tons NOX– Reduce GHG 13 Million
pounds

USA Photovoltaics Market Installations
2003 – 66 MW; 574 MW World 2004 – 84 MW; 927 MW World 2010 – ????; 3200 MW World
Source: Solarbuzz Inc.

North American Solar Boom to Continue, but Without Coordination
Status of PV varies state-by-statean “archipelago”
State subsidies/programs expanding Nearly 1/3 of states with buy-down programs California’s Million Solar Roofs initiative moving in
state legislature Market potential for rooftop PV of nearly 3 GW/year
by 2010
State mandates expanding, too Renewable portfolio sub-requirements in
– Arizona– Colorado– Nevada– Pennsylvania

PV at 29 Palms USMC Air Ground Combat Center
BP Solar EnergyMax System
320 sunny days/year 1,291 KW (Peak) 2,530,000 KWH/ Year ~ 5% of annual
electricity needs 8000 solar modules
over 7 acres Peak output coincides
with summer demand

Biomass Opportunities Growing, Too, Though Less on a Single Industry
Catch-all term, includes alternative fuels– Land-fill & digester gases– Other “organics recycled
to energy” fuels (e.g. BioDiesel from Soybeans)
– “Healthy Forests” initiative slash/thinning
– Cofiring in coal fired plants (e.g., Switchgrass)
Significant environmental benefits

Distributed Energy Resources
Interconnection Technologies
Electric Power Systems
Fuel Cell PV
Microturbine Wind
Utility Grid Simulator
Generator
Inverter
Switchgear, Relays, & Controls
Functions
•Power Conversion
•Power Conditioning (PQ)
•Protection
•DER and Load Control
•Ancillary Services
•Communications
•Metering
Micro Grids
Energy Storage
LoadsLocal Loads
Load Simulators
Utility Grid

The Upshot for Renewable Energy
Renewable energy mandates expanding; though very uneven, inconsistent, government support
Wind having a record year, but challenges beginning to surface
Solar photovoltaic markets growing, with more to come
Green pricing still growing, despite RPS mandate proliferation
Expect more policy support
Related Documents