2005 National Health Interview Survey (NHIS) Public Use Data Release NHIS Survey Description Division of Health Interview Statistics National Center for Health Statistics Hyattsville, Maryland Centers for Disease Control and Prevention U.S. Department of Health and Human Services June, 2006

Welcome message from author
This document is posted to help you gain knowledge. Please leave a comment to let me know what you think about it! Share it to your friends and learn new things together.
Transcript
2005 National Health Interview Survey (NHIS) Public Use Data Release
NHIS Survey Description
Division of Health Interview Statistics National Center for Health Statistics
Hyattsville, Maryland
Centers for Disease Control and Prevention U.S. Department of Health and Human Services
June, 2006

2
2005 National Health Interview Survey (NHIS) Public Use Data Release
Table of Contents
The NCHS Web Page and NHIS Electronic Mail List ....................................................................4 What’s New in 2005 ........................................................................................................................5 Introduction.....................................................................................................................................6 Data Collection Procedures .............................................................................................................7 Sample Design .................................................................................................................................7 Emancipated Minors ........................................................................................................................8 Weighting Information.....................................................................................................................8 General Information about the Data ..............................................................................................11 Information about the Data File Documentation ...........................................................................12 Information about the 2005 CAPI Questionnaire ..........................................................................15 Supplements, Supplement Co-sponsoring Agencies, and Question Locations ............................ 17 Household-Level File ....................................................................................................................19 Family-Level File ..........................................................................................................................20 Person-Level File ...........................................................................................................................24
I. Health Status and Limitation of Activity Section (FHS)............................................. 24 II. Health Care Access and Utilization Section (FAU).....................................................31 III. Health Insurance Section (FHI) ...................................................................................31 IV. Socio-demographic Section (FSD).............................................................................34 V. Income and Assets Section (FIN) ...............................................................................36
Injury and Poisoning Files .............................................................................................................40 I. Injury and Poisoning Episode File ..................................................................................41 II. Verbatim Injury and Poisoning File ...............................................................................45 Sample Child File ..........................................................................................................................47
I. Child Conditions, Limitation of Activity and Health Status Section (CHS)................47

3
II. Child Health Care Access and Utilization Section (CAU). .........................................48 III. Child Mental Health Brief Section (CMB)..................................................................48
IV. Child Mental Health Services (CMS)...........................................................................49 V. Child Influenza Immunization (CFI) ............................................................................50 Sample Adult File ..........................................................................................................................51 I. Adult Demographics Section (ASD)………………………………………………....51
II. Adult Conditions Section (ACN) .................................................................................53 III. Adult Health Status and Limitation of Activity Section (AHS) ..................................57
IV. Adult Health Behaviors Section (AHB) ......................................................................59 V. Adult Health Care Access and Utilization Section (AAU)..........................................62 VI. Adult AIDS Section (ADS) .........................................................................................62
Sample Adult Cancer File…………………………………………………………………….......64
I. Diet and Nutrition (NAC)………………..…………………..……………………....65 II. Physical Activity (NAD) ........................................................................................... 65 III. Tobacco (NAE).......................................................................................................... 66 IV. Cancer Screening (NAF) ........................................................................................... 66 V. Genetic Testing (NAG).............................................................................................. 67 VI. Family History (NAH)............................................................................................... 68
Recontact Section ..........................................................................................................................69 Guidelines for Citation of Data Source..........................................................................................70 References .....................................................................................................................................71 Appendix I. Calculation of Response Rates for the 2005 NHIS ...............................................72 Appendix II. Race and Hispanic Origin……………………………………………………..…81 Appendix III. Variance Estimation and Other Analytic Issues ...................................................92 Appendix IV. A Preliminary Evaluation and Recommendations for use of the Mental Health Indicator (MHI) in the NHIS for Children Aged 2 to 3 years ...........................100 Appendix V. The Short Strengths and Difficulties Questionnaire (SDQ)............................... 102 Appendix VI. Transition to the 2000-Census-based Weights ...................................................104 Appendix VII. Merging Data Files and Combining Years of Data ............................................105 Appendix VIII. Changes/Additions/Deletions in 2005................................................................109

4
The NCHS Web Page and NHIS Electronic Mail List
Data users can obtain the latest information about the National Health Interview Survey
by periodically checking our Web site:
http://www.cdc.gov/nchs/nhis.htm
The Web site features downloadable public use data and documentation for the 2005 NHIS, as well as important information about any modifications or updates to the data and/or documentation. Published reports from previous years’ surveys are also available, as are updates about future surveys and datasets.
Data users are encouraged to join the NHIS Listserv, an electronic mail list. The listserv is made up of over 4,000 NHIS data users located around the world who receive e-news about NHIS surveys (e.g., new releases of data or modifications to existing data), publications, workshops, and conferences. To join, scroll down to “Related Sites” on the NHIS Web page, and then click on “NHIS Listserv.”
The Division of Health Interview Statistics also provides support services to data users. Users may contact us at 301-458-4901, or send e-mail to us at [email protected].
5
What’s New in 2005
• Some frequently used variables (such as AGE, REGION) are repeated on various data files, therefore, merging of files may be required less often than for the 2004 data year files. Each data file contains household, family, and person numbers that make merging the 2005 files possible, if needed. Appendix VII provides sample code for merging the files.
• All response categories are shown in the Variable Frequency Report, including those
response categories with a zero count in the data files. This allows users to see a complete list of response categories for each question without referring to the questionnaire or the Variable Layout Report.
• The Sample Child File has three new sections: Child Mental Health Brief (CMB), Child
Mental Health Services (CMS), and Child Influenza Immunization (CFI). Detail about these sections can be found in the Sample Child File information.
• The Injury/Poisoning Data Files and associated documentation are included in the main
data release.
• A new Sample Adult Cancer File has six sections: Diet and Nutrition (NAC), Physical Activity (NAD), Tobacco (NAE), Cancer Screening (NAF), Genetic Testing (NAG), and Family History (NAH). Detail about these sections can be found in the Sample Adult Cancer File information.
• Beginning in 2005, the NHIS no longer allows an emancipated minor to be an eligible
respondent; only persons who have reached the age of majority for their place of residence are eligible to respond for the household or family.

6
2005 National Health Interview Survey (NHIS) Public Use Data Release
Introduction
The National Health Interview Survey (NHIS) is a multi-purpose health survey
conducted by the National Center for Health Statistics (NCHS), Centers for Disease Control and Prevention (CDC), and is the principal source of information on the health of the civilian, noninstitutionalized, household population of the United States. The NHIS has been conducted continuously since its beginning in 1957. Public use microdata files are released on an annual basis.
The NHIS Core questionnaire items were revised every 10-15 years, with the last major revisions occurring in 1982 and in 1997. The NHIS that was fielded from 1982-1996 consisted of two parts: (1) a set of basic health and demographic items (known as the Core questionnaire) that remained stable from one survey year to the next, and (2) one or more sets of questions on current health topics that varied with each survey, referred to as Supplements. Despite periodic revisions to the Core questionnaire, Supplements played an increasingly important role in the survey as a means of enhancing topic coverage in the Core. Eventually, certain Supplements, such as “Family Resources” and “Health Insurance,” were incorporated in the NHIS Core on an annual basis.
The redesigned NHIS introduced in 1997 consists of a Basic Module or Core as well as
variable Supplements. The Basic Module, which remains largely unchanged from year to year, consists of three components: the Family Core, the Sample Child Core, and the Sample Adult Core. The Family Core component collects information on everyone in the family, and its sample also serves as a sampling frame for additional integrated surveys, as needed. Information collected for all family members includes: household composition and socio-demographic characteristics, tracking information, information for matches to administrative data bases, and basic indicators of health status, activity limitations, injuries, health insurance coverage, and access to and utilization of health care services.
From each family in the NHIS, one sample child (if any children under age 18 are present) and one sample adult are randomly selected, and information on each is collected with the Sample Child Core and the Sample Adult Core questionnaires. Because some health issues are different for children and adults, these two questionnaires differ in some items, but both collect basic information on health status, health care services, and behavior. These sections of the survey yield the Sample Child and Sample Adult data files.
The Family Core yields several data files, including the Household-Level file, the Family-Level file, the Person-Level file, and two data files pertaining to injuries and poisonings. Because these files contain the same or comparable variables from one survey year to the next, they are suitable for trend analysis; moreover, multiple years of these data may be easily pooled to increase the sample size for analytic purposes.

7
Data Collection Procedures
The U.S. Census Bureau, under a contractual agreement, is the data collection agent for the National Health Interview Survey. NHIS data are collected through a personal household interview by Census interviewers. Nationally, the NHIS uses about 400 interviewers, trained and directed by health survey supervisors in the 12 U.S. Census Bureau Regional Offices. The supervisors responsible for the NHIS are career Civil Service employees who are selected through an examination and testing process. Interviewers (also referred to as Field Representatives, or “FRs”) receive thorough training on an annual basis in basic interviewing procedures and in the concepts and procedures unique to the NHIS.
For the Family Core component of the Basic Module, all members of the household 18 years of age and over who are at home at the time of the interview are invited to participate and to respond for themselves. For children and those adults not at home during the interview, information is provided by a knowledgeable adult family member (18 years of age or over) residing in the household. Information for the Sample Child questionnaire is obtained from a knowledgeable adult residing in the household. For the Sample Adult questionnaire, one adult per family is randomly selected; this individual responds for him/herself to the questions in that section unless he/she is physically or mentally unable to do so, in which case (200-300 cases per year) a knowledgeable proxy is allowed to answer for the sample adult.
The NHIS is conducted using computer-assisted personal interviewing (CAPI). The CAPI data collection method employs computer software that presents the questionnaire on computer screens to each interviewer. The computer program guides the interviewer through the questionnaire, automatically routing the interviewer to appropriate questions based on answers to previous questions. Interviewers enter survey responses directly into the computer, and the CAPI program determines if the selected response is within an allowable range, checks it for consistency against other data collected during the interview, and saves the responses into a survey data file. On-line help facilities are available to aid interviewers in administering the CAPI questionnaire. This data collection technology reduces the time required for transferring, processing, and releasing data, and it ensures the accurate flow of the questionnaire.
Sample Design
Traditionally, the sample for the NHIS is redesigned and redrawn about every ten years to better measure the changing U.S. population and to meet new survey objectives. The sample design that was implemented in 1995 was originally planned to be utilized through 2004; however, it was extended through 2005. The fundamental sample design structure of the 1995-2005 NHIS is similar to that of the 1985-1994 NHIS; however, there were two major changes to the 1995-2005 sample design. First, state-level stratification increased the number of primary sampling units (PSUs) from 198 to 358. This enhanced the capability of using the NHIS for state estimation and future dual-frame surveys at the state level. (Users should note that the NHIS is not currently designed to provide state-level estimates; however, in some cases this can be done, particularly for those states with larger populations. Since state identifiers are not

8
publicly released, use of that information can be made in the NCHS Research Data Center. Contact the NCHS Research Data Center for more information, or visit their Web page: http://www.cdc.gov/nchs/r&d/rdc.htm ) Second, both the black and Hispanic populations are now oversampled to allow for more precise estimation of health in these growing minority populations. In the previous design, only black Americans were oversampled.
Two other important features first implemented in the 1985-1994 design continue.
NCHS survey integration and follow-back surveys are facilitated by an area frame with independent address lists; while the area frame is based on the preceding decennial Census, the address lists are obtained in a separate listing activity, explicitly for the NHIS. Also, the NHIS sample is divided into four individually representative panels to further facilitate integration with other NCHS surveys. See NCHS Series 2 (Number 130) for a description of the 1995-2005 survey design, the methods used in estimation, and general characteristics of the data obtained from the survey. This publication is available on-line at: http://www.cdc.gov/nchs/products/pubs/pubd/series/sr02/130-121/130-121.htm. (Users may also be interested in another Series 2 (Number 126) report, National Health Interview Survey: Research for the 1995-2004 Redesign, which is also available at the above address.)
Emancipated Minors Prior to 2005, in the NHIS the term “emancipated minor” was used to describe a person 14-17 years old and married or living with a partner, or a person 14-17 years old and living on his or her own without the supervision of an adult family member or legal guardian. An emancipated minor was an eligible respondent for the household and the family; he or she could respond to all NHIS health questions for all related household members of any age. However, emancipated minors were not eligible to be selected as the sample adult or the sample child. Beginning in 2005, the definition of an emancipated minor changed to: a person 14-17 years old and married, divorced, widowed, or separated; or a person 14-17 years old and living on his or her own without the supervision of an adult family member or legal guardian. The NHIS no longer allows an emancipated minor to be an eligible respondent; only persons who have reached the age of majority for their place of residence, are eligible to respond for the household or the family. Although in state criteria of an adult differ, the NHIS uses age as the only criterion to define an adult. Generally states define an adult as a person 18 years of age or older, with the exceptions of Alabama and Nebraska (19 years of age or older) and Mississippi (21 years of age or older). An emancipated minor is not eligible to be selected as a sample adult or sample child. In addition, an emancipated minor is not eligible to be the respondent for the Sample Child questionnaire, even if he or she is the parent of the sample child.
Weighting Information
The sample is chosen in such a way that each person in the covered population has a known non-zero probability of selection. These probabilities of selection, along with
9
adjustments for nonresponse and post-stratification, are reflected in the sample weights that are provided in the accompanying data files.
Since the NHIS uses a multistage sample designed to represent the civilian noninstitutionalized population of the United States, it is necessary to utilize the person's basic weight for proper analysis of person record data. In addition to the design and ratio adjustments included in the calculation of the Person-Level file’s basic weights, the person weights are further modified by adjusting them to Census control totals for sex, age, and race/ethnicity populations (post-stratification). Beginning in 2003, NCHS made the transition to weights derived from the 2000-Census-based population estimates. See Appendix VI for more detailed information.
Each file has one or more sets of weights based on the unit of analysis. Two sets of weights are provided on the Person-Level file:
Weight - Final Annual (WTFA) is based on design, ratio, non-response and post-stratification adjustments. This should be used in most analyses of the Family/Person data. National estimates of all person-level variables can be made using these weights. Weight - Interim Annual (WTIA) does not include the post-stratification adjustment (age-sex-race/ethnicity adjustment to Census population control totals). It is required by some software packages for variance estimation for surveys with complex sample designs.
Two sets of weights are also included on the Sample Child data file:
Sample Child Weight - Final Annual (WTFA_SC) includes design, ratio, non-response and post-stratification adjustments for sample children. National estimates of all sample child variables can be made using these weights.
Sample Child Weight - Interim Annual (WTIA_SC) does not include the post-stratification adjustment (age-sex-race/ethnicity adjustment to Census population control totals). It is required by some software packages for variance estimation for surveys with complex sample designs.
The Sample Adult data file contains two sets of weights:
Sample Adult Weight - Final Annual (WTFA_SA) includes design, ratio, non-response and post-stratification adjustments for sample adults. National estimates of all adult sample variables can be made using these weights.
Sample Adult Weight - Interim Annual (WTIA_SA) does not include the post-
stratification adjustment (age-sex-race/ethnicity adjustment to Census population control
10
totals). It is required by some software packages for variance estimation for surveys with complex sample designs. In addition, two sets of weights are provided on the Household file:
Weight - Final Annual Household (WTFA_HH) includes the probability of selection and non-response adjustments. This weight does not include a post-stratification adjustment to Census control totals for the number of civilian, non-institutionalized households in the U.S. because suitable control totals do not exist. Non-responding households have a zero weight in this field. WTFA_HH is the appropriate weight to use when analyzing only responding households.
Weight - Interim Annual Household (WTIA_HH) reflects the probability of household selection. It does not include non-response or post-stratification adjustments. WTIA_HH is the appropriate weight to use when analyzing all households in the file, responding or nonresponding.
Lastly, the Family-Level weight is discussed in greater detail in the section of this document pertaining to the Family file.
NOTE: Analysts should be aware that 342 persons who were active duty members of the Armed
Forces at time of interview are on the Person-Level file, despite the fact that NHIS covers only the civilian noninstitutionalized household population. These active duty members of the Armed Forces are included in that file because at least one other family member is a civilian eligible for the survey. The value of the final annual person weight (WTFA) for these military persons is zero, so they will not be counted when making national (i.e., weighted) estimates. Data for these Armed Forces members are included in all relevant files in order to aid any analyses pertaining to family structure or relationships. No active duty Armed Forces members were selected as sample adults.
Recall Period and Weights
Some questions for particular events have recall periods referring to, for example, the “last 2 weeks” or “last 3 months.” In general, annual estimates can be made using these types of variables. For example, for a variable that counts events experienced by a person within a two-week recall period, (variable) (26) (WTFA) = annual estimate; for a variable with a three-month recall period, (variable) (4) (WTFA) = annual estimate. This assumes that the average rate of occurrence is the same over the last year as over the last two weeks (or three months). Analysts are cautioned to check the accompanying file documentation and the questionnaire in order to insure that annual estimates for these kinds of event variables are possible and have intrinsic meaning.

11
Variance Estimation
The data collected in the NHIS are obtained through a complex sample design involving stratification, clustering, and multistage sampling. Because of this complex design and adjusted sampling weights, the direct application of standard statistical analysis methods for estimation and hypothesis testing to unweighted data may yield misleading results. If data are not weighted, severely biased estimates may result. For this reason, as indicated previously, it is necessary to use the weights that are included in the accompanying data file for analyses.
Weighted data used in standard software packages may provide unbiased point estimates for commonly computed first-order statistics like means or regression coefficients, but the computed standard errors of the estimates may be too small. Also, standard packages may produce hypothesis test results (such as p values) that are incorrect. Hence, it is recommended that users of NHIS data utilize computer software that provides the capability of variance estimation and hypothesis testing for complex sample designs. NCHS uses the software package SUDAANR (Shah et al. 1997) with Taylor series linearization methods for NHIS variance estimation. Appendix III provides SUDAAN code and a description of its use to compute standard errors of means, percentages and totals with the 2005 NHIS database.
Analyses of large NHIS domains usually produce reliable estimates, but analyses of small domains may yield unreliable estimates, as indicated by their large variances. The analyst should pay particular attention to the coefficient of variation (relative standard error) for estimates of means, proportions and totals. In addition, small sample sizes, or small numbers of primary sampling units containing targeted data, may be an indication of estimates lacking precision.
General Information about the 2005 Data
The interviewed sample for 2005 consisted of 38,509 households, which yielded 98,649
persons in 39,284 families. The interviewed sample for the Sample Child component, by proxy response from a knowledgeable adult in the family, was 12,523 children under 18 years of age. Data were not collected on any infant who was born during the assignment week of the interview. The interviewed sample for the Sample Adult component, which required self-response to all questions unless the sample adult was physically or mentally unable to do so, was 31,428 persons 18 years of age and older. There were 326 cases where a knowledgeable proxy answered for the sample adult.
The total household response rate was approximately 86.5%: 8.9 percentage points of the noninterview rate (13.5%) were the result of respondent refusal and unacceptable partial interviews. The remaining 4.6 percentage points were primarily the result of failure to locate an eligible respondent at home after repeated calls.
The conditional response rate for the Sample Child component was 90.1%, which was calculated by dividing the number of completed Sample Child interviews (12,523) by the total number of eligible sample children (13,906). The unconditional or final response rate for the

12
Sample Child component was calculated by multiplying the conditional rate by the overall family response rate of 86.1%, yielding a rate of 77.5%.
The conditional response rate for the Sample Adult component was 80.1% of persons identified as sample adults. The final response rate for the Adult Sample Person component was calculated as (Overall Family Response Rate) (Sample Adult Response Rate), or (86.1%) (80.1%) = 69.0%.
Additional information about NHIS response rates can be found in Appendix I.
Information about the 2005 Data File Documentation
As with previous data years, questionnaires, datasets, and related documentation for each data file is available on the NHIS Web site, http://www.cdc.gov/nchs/nhis.htm. The Web site provides the Survey Description Document; a Readme File containing a summary of data access instructions; Notices for Data Users; a log of release history and, if necessary, new notices about data problems or changes; Survey Questionnaires, Flashcards, the Field Representative Manual, and Survey Flowchart; Information on Co-Sponsors and Supplements; Race/Ethnicity Information; the Data Release with links to a page that contains the Family, Household, Person, Injury/Poisoning Episode, Injury/Poisoning Verbatim Episode, Sample Child, and Sample Adult Files; Imputed Income Files; and Summary Health Statistics reports (when available).
Each of the 2005 data release categories for Household, Family, Person, Injury/Poisoning
Episode, Injury/Poisoning Verbatim Episode, Sample Child, and Sample Adult Files will include the following documents. A description of each type of document follows:
• Variable Summary Report • Variable Layout Report • Variable Frequency Report, • ASCII data • Sample SAS statements • Sample SPSS statements • Sample Stata statements
The Variable Summary Report lists each variable, a brief description of the variable, the
question number on which it was based, and variable location in the released ASCII file. For most variables, the Variable Layout Report provides the actual question that generated the data, questionnaire location information, instrument variable name, universe, response values, and response value labels. Additional specific information is provided under “Sources,” “Recodes,” “Keywords,” and “Notes.” These terms are defined below:
Sources - If the variable in question is a recode, then all variables that were used to make this recode are listed.
13
Recodes - A recode is a variable derived from the reordering, collapsing, or verbatim coding of another variable, such as the family income recode (INCGRP) found in the Family File. Alternatively, a recode may be constructed from two or more variables, as is the body mass index (BMI) variable included in the Sample Adult file. If a particular variable was used in making recode variables, then those recode variables are listed as a cross reference. Users will note that a number of standardized variables appear in the dataset. A standardized variable is a particular type of recode based on time unit information obtained during the course of the interview. When respondents are asked any questions pertaining to time - for example, how long the respondent has worked at his/her job - the answer is typically obtained in two parts. The respondent provides the number of time units, followed by the type of time unit. During the course of data editing, this information is standardized into a single appropriate time unit. Some of the standardized time unit recodes may also be top-coded for confidentiality reasons.
Keywords - Keywords are descriptive words or phrases relevant to the topic of the variable; these can be used for word searches.
Notes - Notes provide information that analysts need to know about a particular variable, such as assumptions, limitations, caveats, differences between instrument versions, or other important information. Analysts are encouraged to read the notes for variables of interest. Currently, there are two generic notes that can appear in addition to specific information:
1) If the original questionnaire item was asked at the family level but resulted, after the editing process, in a person-level variable, this note is added: Family/person variable conversion
2) If other questions in the instrument ask about the same topic, or if similar questions appear in other sections of the instrument, this note is added: Refer to {variable name and section number} for a {family/person/child} level question on the same topic.
The universe refers to those respondents deemed eligible to answer a given question. For example, the universes for most Sample Adult variables are specified as ASTATFLG = 1 and (AGE GE ‘018’ and AGE not IN (‘997’, ‘999’)), followed by any other universe descriptors specific to the variable. ASTATFLG = 1 refers to a variable on the Person file and indicates that the respondent was selected as a sample adult and answered at least the first three sections of the Sample Adult questionnaire (constituting a completed interview or an acceptable partial interview). Sample adults who are not eligible to answer a given question are considered to be not-in-universe. For example, a sample adult who reported that he did not have surgery in the past 12 months (ASRGYR=2) would not be eligible for a follow-up question (ASRGNOYR) about the number of times that he had surgery in the past 12 months. It is important to note that for all data files, persons who are not-in-universe are no longer listed in the Variable Layout Report response categories as “Blank- Not-in-universe.” If a respondent discontinued the interview anytime after completing the first three sections of the Sample Adult
14
component, his or her responses will appear as 8's (not ascertained) for the remaining variables in the Sample Adult file where the universes are applicable. In addition, each year, there may be a few records (less than 10) where age is corrected due to data entry error. For the records where age is corrected, neither the universes nor the variables affected will be changed. However, a new variable, AGE_CHG, will indicate a correction has been made on the record.
The universes for most Sample Child file variables are specified as CSTATFLG = 1 and (AGE LE ‘017’ and AGE NE ‘ ’), followed by any other universe descriptors specific to the variable. CSTATFLG = 1 refers to a variable on the Person file that indicates a selected sample child with a completed interview or an acceptable partial interview (completion of the CHS section, or about half the questions of the Sample Child Core). Again, responses from acceptable partial interviews have a code of 8, meaning “not ascertained,” throughout the remaining, unanswered Sample Child sections where the universes are applicable.
The Variable Frequency Report provides the frequencies, percents, and the frequency
missing (not-in-universe) for each variable. For the 2005 data year, all response categories are shown in the Variable Frequency Report, including those response categories with a zero count in the data files. This allows users to see a complete list of response categories with frequencies for each variable without referring to additional documentation. In addition, the “frequency missing” label will be shown if a variable has not-in-universe cases or cases whose values fall out of range. For example, if all sample adults are asked about a usual place for medical care when sick (AUSUALPL), then the “frequency missing” label is not shown.
Within the NHIS, the same codes are used across all files to designate “Refused” and “Don’t know” responses: refusals are coded as “7” (with leading 9's to the length of the field, as in 7, 97, 997, etc.), while “don’t know” responses are “9” (again, with leading 9's to the length of the field, such as 9, 99, 999, etc.). A code of “8” is used to indicate “Not ascertained” responses, which typically occur when an in-the-universe respondent had a blank field or the field contained an impossible code. Lastly, in some limited situations (primarily recodes), the “Refused,” “Don’t know,” and “Not ascertained” categories are collapsed into a single category called “Unknown,” which is typically designated with a “9” (with leading 9's to fill out the field, if necessary).
In addition, statistical noise at both the variable level and record level may have been
added to allow for the protection of respondent confidentiality, and, at the same time, allow for release of files with as many variables as possible.
It is also important to note that for the 2005 data year, some frequently used
variables are repeated on various data files; therefore, merging of files may be required less often than for the 2004 data year files. However, each data file contains household, family, and person numbers that make merging the 2005 files possible, if needed. Appendix VII provides sample code for merging the files.

15
Information about the 2005 CAPI Questionnaire The NHIS CAPI questionnaire, also referred to as the CAPI Reference Questionnaire or
CRQ, is an integral part of the data documentation and should be consulted when analyzing data. Users desiring greater detail should also consult the 2005 NHIS Field Representative’s Manual (both the questionnaire and FR Manual are available on the NHIS Web site, http://www.cdc.gov/nchs/nhis.htm). Every effort was made to insure that the variable names in the data are consistent with the question items in the instrument. In a few cases, this was not possible. Users should match the question number in the instrument to the variable number in the File Layout Report to resolve any discrepancies.
Because the questionnaire for the NHIS is administered by computer, the questionnaire exists as a long and complex computer program. While stringent quality control measures were applied, a few errors are known to have occurred in the program. Instrument problems were identified over the course of the year, and efforts were made to correct these errors. Some of these problems were resolved through correction of skip patterns, question wording changes, addition of questions, or other internal instrument corrections.
When errors were detected and diagnosed, and time permitted, the instrument was changed to correct for the errors. In 2005, instrument changes were kept to a minimum, so that there was basically one version of the NHIS in the field across all four quarters of the survey year. Analysts are encouraged to read the notes in the Variable Layout Report for important information pertaining to specific variables that may have changed across quarters. Questionnaire Sections
The 2005 NHIS contained the annual Basic Module, which is broken into various sections that group questions into broad and specific categories. Each section is designated by a section title and corresponding three-digit acronym (or section code); questionnaire items are numbered sequentially (but not consecutively) within their respective sections, with the section acronym making up part of the item number. Multiple-part questions have an extension added to their three-digit acronym. For example, the first item in the FHS section is identified as FHS.010_00.000; note that FHS.010_00.000 also has an associated variable name, PLAPLYLM. The following list details the various questionnaire sections, their acronyms and description titles.
Table 1. 2005 NHIS Core Questionnaire Sections and Topics
A. Household Section No.
Section Code
Description
I
HHC
Household Composition

16
B. Family Core Section No.
Section Code
Description
I
FID
Family Identification and Verification
II
FHS
Health Status and Limitation of Activity
III
FIJ
Injury/Poisoning
IV
FAU
Health Care Access and Utilization
V
FHI
Health Insurance
VI
FSD
Socio-demographic
VII
FIN
Income and Assets
C. Sample Child Core Section No.
Section Code
Description
I
CID
Identification and Verification
II
CHS
Conditions, Limitation of Activity and Health Status
III
CAU
Health Care Access and Utilization
D. Sample Adult Core
Section No. Section Code
Description
I AID Identification and Verification II
ASD
Demographics
III
ACN
Conditions
IV
AHS
Health Status and Limitation of Activity
V
AHB
Health Behaviors
VI
AAU
Health Care Access and Utilization
VII
ADS
AIDS

17
E. Recontact Section No.
Section Code
Description
I
REC
Recontact Information and Follow-up
In addition to the three Core sections comprising the Basic Module, the 2005 NHIS
contains several other data files: the Household- and Family-level files, the Injury/Poisoning Episode file, and the Injury/Poisoning Verbatim Episode file. The Household file is derived largely from the Household composition section of the Basic Module and describes characteristics of each household. The variables contained in the Family-level file are reconstructions of the person-level data from the Basic Module sections at the family level. The Injury/Poisoning files are derived from information obtained from the injury/poisoning questions in the Family Core section Supplements, Supplement Co-Sponsoring Agencies, and Question Locations, 2005 NHIS
The terms “supplement” and/or “supplementary questions” refer to any co-sponsored questions that are in the NHIS for a year (or more) at a time. Beginning in 1997, co-sponsored questions were referred to as a “topical module” or “periodic module,” but these terms proved to be neither mutually exclusive nor exhaustive of the possible types of supplements. Therefore, effective 2001, we use the terms “supplement” or “supplementary questions” to describe co-sponsored questions.
In 2005 NHIS supplementary questions are in the Core questionnaires. A supplement or one or
more supplementary questions may be interwoven among core questions, or may be placed at the end of a core section. The existence of three extra digits (.xxx) at the end of the question number helps to identify supplementary questions. The Child Mental Health, Child Mental Health Services, Adult/Child Immunization, and Child Cancer Control Supplements are released in the same files as other Core data. Data from the Adult Cancer Control Supplement are released in a separate file, entitled the Sample Adult Cancer File. A chart of all 2005 co-sponsored supplements and their question numbers is below. A list of changes to existing questions in the NHIS Core is located in Appendix VIII.
In addition, users can obtain information about co-sponsored supplements from 1997-
2005 on our Web site: http://www.cdc.gov/nchs/about/major/nhis/co-sponsors.htm

18
Supplement Co-Sponsoring Agencies, and Question Locations, 2005 NHIS
Topic
Co-sponsoring Agency
Title
Survey Section/Number
Cancer National Cancer Institute (NCI) ¹ & National Center for Chronic Disease Prevention and Health Promotion (NCCDPHP)2
Cancer Control Module
CAU.350.010 – CAU.350.020; NAC.005 – NAC.470; NAD.010 – NAD.060 NAE.010 – NAE.240; NAF.010 – NAF.735 NAG.010 – NAG.090; NAH.010 – NAH.193
Mental Health
National Institute of Mental Health (NIMH) ¹
Child Mental Health Brief
FHS.065; CAU.265; CMB.010– CMB.060
Mental Health Services
Center for Mental Health Services (CMHS)3
Child Mental Health Services
CMS.010 – CMS.080
Immunization National Immunization Program (NIP) ²
Adult /Child Immunization
AAU.310 - AAU.380; CFI.010 – CFI.025_2
Agencies Providing General Support
n/a Center for Mental Health Services (CMHS) 3 Collection and Analysis of Mental Health Data using NHIS
n/a Agency for Healthcare Research and Quality (AHRQ)
Use of 2 NHIS sample panels to support the MEPS
n/a National Center for Health Statistics2 Cell phone usage
¹ National Institutes of Health (NIH) ² Centers for Disease Control and Prevention (CDC) 3 Substance Abuse & Mental Health Services Administration (SAMHSA)

19
2005 National Health Interview Survey
Household-Level File
The Household file is considered as the base file from which all other files are built. That is, the main sampling unit in the NHIS is the household, and each record on the Household file represents an eligible sampling unit. Each record on the Household file represents a unique household included in the NHIS sample or sampling frame. Each household has a unique unit number (HHX). This unique unit number is needed for merging data files.
Some of the variables found only in this file include: the nature/reason for “Type A” non-responses and number of responding and non-responding families and persons. (For information about Type A non-response, see Appendix I.) Variables in other NHIS data files that may be appropriately analyzed at the household level can be merged with this file for analysis.
The universe for the Household file is all eligible households, including both responding households and non-responding (Type A) households. The Household file contains information on 44,540 households: 38,509 households were interviewed, while 6,031 were not interviewed. The nature of non-interviews for Type A households, such as refusal or failure to locate an eligible respondent, is detailed in the variable NON_INTV.
The total non-interview rate for the Household file was 13.5% of households. The response rate for the Household file is calculated as the number of responding households divided by the total number of eligible households (responding + non-responding households), or 86.5%.
20
2005 National Health Interview Survey Family-Level File
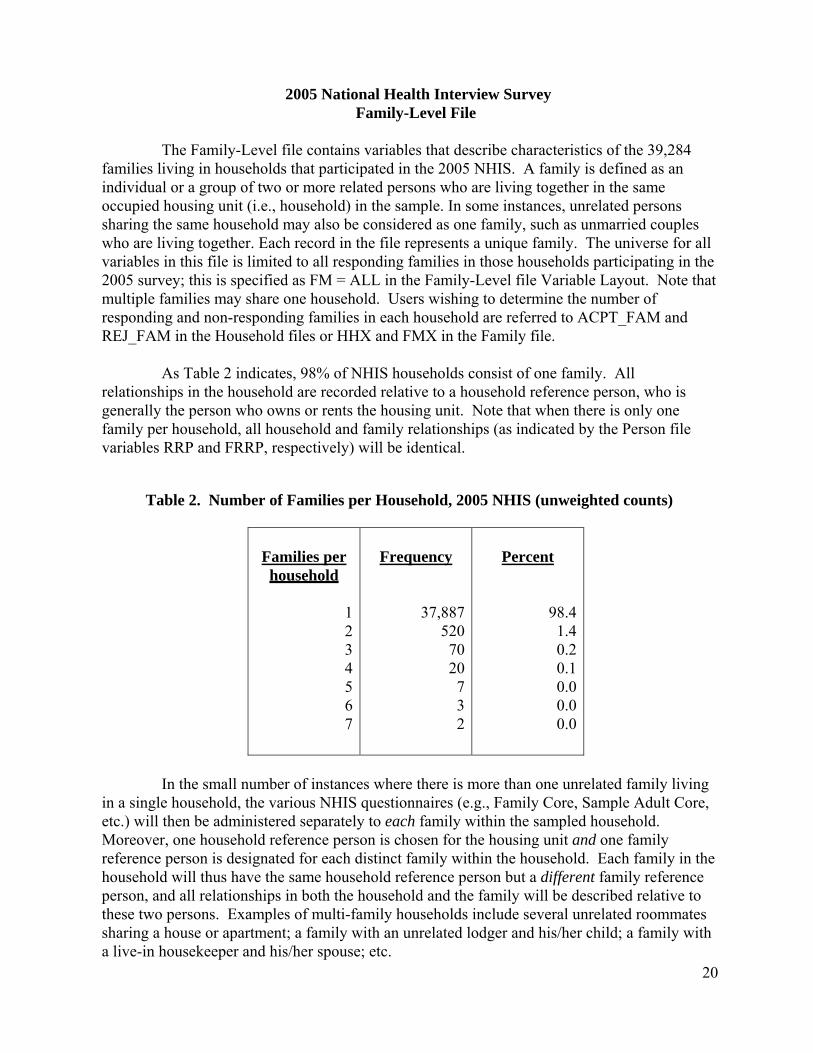
The Family-Level file contains variables that describe characteristics of the 39,284 families living in households that participated in the 2005 NHIS. A family is defined as an individual or a group of two or more related persons who are living together in the same occupied housing unit (i.e., household) in the sample. In some instances, unrelated persons sharing the same household may also be considered as one family, such as unmarried couples who are living together. Each record in the file represents a unique family. The universe for all variables in this file is limited to all responding families in those households participating in the 2005 survey; this is specified as FM = ALL in the Family-Level file Variable Layout. Note that multiple families may share one household. Users wishing to determine the number of responding and non-responding families in each household are referred to ACPT_FAM and REJ_FAM in the Household files or HHX and FMX in the Family file.
As Table 2 indicates, 98% of NHIS households consist of one family. All relationships in the household are recorded relative to a household reference person, who is generally the person who owns or rents the housing unit. Note that when there is only one family per household, all household and family relationships (as indicated by the Person file variables RRP and FRRP, respectively) will be identical.
Table 2. Number of Families per Household, 2005 NHIS (unweighted counts)
Families per household
1234567
Frequency
37,887520 70 20 732
Percent
98.4 1.4 0.2 0.1 0.0 0.0 0.0
In the small number of instances where there is more than one unrelated family living in a single household, the various NHIS questionnaires (e.g., Family Core, Sample Adult Core, etc.) will then be administered separately to each family within the sampled household. Moreover, one household reference person is chosen for the housing unit and one family reference person is designated for each distinct family within the household. Each family in the household will thus have the same household reference person but a different family reference person, and all relationships in both the household and the family will be described relative to these two persons. Examples of multi-family households include several unrelated roommates sharing a house or apartment; a family with an unrelated lodger and his/her child; a family with a live-in housekeeper and his/her spouse; etc.

21
Family size may vary considerably. Table 3 shows a breakdown of the 39,284 families by number of family members.
Table 3. Size of Family, 2005 NHIS (unweighted counts)
Number of Members
123456789
101112131415
Frequency
11,62212,1565,9865,3632,627
9413641335022104222
Percent
29.630.915.213.76.72.40.90.3 0.10.10.00.00.00.00.0
The first part of the Family file contains the technical variables that identify or describe the record type (all observations in this file have a record type value of “60”), the survey year, the household and family numbers, the interview month and year, characteristics of the family’s housing unit, geographic information associated with the housing unit, variables used for variance estimation, and a family-level weight variable.
The second part of the file consists of a series of recodes derived from five Family Core sections of the NHIS that collapse the 90,000+ individual level observations into information about their respective families. (Starting in 2004, recodes from the FHI section of the Family Core are no longer included in the Family file.)
Generally, the Family file consists of two types of recodes. The first is a simple “yes-
no” measure that indicates whether any family member falls into a particular category or exhibits a particular characteristic. Every yes-no measure also has a corresponding counter that indicates the number of family members in that category or with that characteristic. Note that counters always consist of values from zero to 30; in addition, no frequencies will be shown if a family is not contained in the universe for a specific question. For example, FSALYN and FSALCT, two recodes from the Income and Assets section of the Family Core, are limited to families with at least one member aged 18 or older; families consisting solely of emancipated minor(s) are coded as blanks to indicate that they are out of the universe, and thus, are not shown. The Family file also contains some counters that lack corresponding yes-no indicators.
22
For example, FHSTATEX, FHSTATVG, FHSTATG, FHSTATFR, and FHSTATPR (all derived from PHSTAT, FHS.500) provide counts of the number of family members in excellent, very good, good, fair, and poor health, respectively. Counters were also constructed to indicate the number of working adults in the family, the number of adults in the family looking for work, the number of adults working full time, the number of children (under age 18) in the family, and the number of family members aged 65 and older.
Because most of the variables in the Family file are recodes of the person-level variables in the family core, the sum of the number of persons across all families in each family-level counter should be equal to the number of “yes” responses in its person-level source. Returning to our previous example, consider FSALCT: 15,683 families have one member receiving income from wages/salary, 10,997 families have two members (or 2(10,997) = 21,994 persons) with wage/salary income, 1,634 families have three members (or 3(1,634) = 4,902 persons), 401 families have four members (or 4(401) = 1,604 persons), 76 families have five members (or 5(76) = 380 persons), 13 families have six members (78 persons), 4 families have seven members (28 persons), 1 family has eight members (8 persons), and 1 family has ten members (10 persons) with wage/salary income in 2005. Thus, the sum of persons across the 28,810 families answering “yes” to FSALYN, the associated yes-no indicator, is 44,687 (15,683 + 21,994 + 4,902 + 1,604 + 380 + 78 + 28 + 8 + 10), which is equal to the 44,687 “yes” responses to the person-level source variable, PSAL. Users are advised to check the Variable Layout Report for each Family file recode in order to determine its person-level source variable.
Family Structure Variables
The 2005 NHIS Family file contains two variables describing family type and structure in both general and detailed terms. FM_TYPE consists of just four categories, and represents an initial classification of families according to the numbers of adults and children that are present. In addition, FM_STRP and FM_STRCP categorize families according to familial relationships and, when children are present, parental marital status. FM_STRP and FM_STRCP differ in how they categorize unmarried parents with children. FM_STRP includes all cohabiting couple families in the same category (FM_STRP = 42), regardless of the adults’ relationships to the child(ren) in the family. FM_STRCP is identical to FMSTRCT2, a recode on the 1998, 2001-2003 NHIS Family files, and distinguishes between families consisting of unmarried parents who are related biologically or by adoption to all children in the family (FM_STRCP = 41), and families consisting of a parent, his or her child(ren), and his or her partner, who is unrelated to the child(ren) present in the family (FM_STRCP = 43). In both recodes, families that could not be classified are coded “99.” Emancipated minors are treated as adults with respect to FM_TYPE, FM_STRP, and FM_STRCP, despite the fact that they may be under 18 years of age.

23
The Family File Weight
The ideal situation for creating weights for the Family file would be to use independent estimates of the number of families from a reliable source, such as the U.S. Census Bureau, to perform post-stratification adjustments in a manner similar to what is done for the NHIS Person file weight. Unfortunately, no suitable independent estimates exist.
Due to the lack of appropriate independent estimates, a variation of the “principal person” method is used to create the 2005 NHIS Family file weight (WTFA_FAM). Our method is similar to that used in the Current Population Survey to create their household- and family-level weights. Briefly, a person-level ratio adjustment is used as a proxy for the NHIS family-level ratio adjustment. Use of the person weight with the smallest ratio adjustment within each family (that is, the smallest post-stratification factor between the interim and final person weights within the family) is believed to provide a more accurate estimate of the total number of U.S. families than either the use of other person weights in the family or the use of no ratio adjustments whatsoever.
Accordingly, the weight provided with the 2005 NHIS Family file, WTFA_FAM, corresponds to the 2005 NHIS person weight for one of the persons in the family. As a result, the Family weight contains factors for selection probabilities at the household level, household nonresponse adjustment, and several ratio adjustment factors that are applied to all person weights.
24
2005 National Health Interview Survey Person-Level File
The Person-level variables are derived from the six substantive sections making up the
Family Core of the 2005 NHIS. The information in the Family Core questionnaire is collected for all household members. Any adult household members who are present at the time of the interview may take part; information regarding adults not participating in the interview, as well as about all household members under age 18, is provided by a knowledgeable adult member of the household. (If there is more than one family in the household, then these procedures are followed for each family in the household. See the Family-Level File for more information.) The six sections comprising the Family Core are discussed in greater detail below.
I. Health Status and Limitation of Activity Section (FHS)
The Health Status and Limitation of Activity (FHS) section of the Family Core for the 2005 NHIS contains information addressing respondent-assessed disabilities, disability-associated conditions, and overall health status for all family members. Users should note that additional information on health status and disability is also included in other sections of the Sample Adult file, as well as in the Sample Child file.
Limitation of Activity at the Person Level
Information on activity limitations, including questions about work limitations; the need for personal assistance with personal care needs such as eating, bathing, dressing, and getting around inside the home; and the need for personal assistance with handling routine needs such as everyday household chores, doing necessary business, and shopping or running errands, is collected for each family member (with some exclusions for children and youth). If any limitations are identified, the respondent is asked to specify the health condition(s) causing the limitation(s) and indicate how long he or she has had each such condition.
Since cognitive impairment is increasingly recognized as a source of activity limitations among older adults, the FHS section includes an indicator that identifies family members who are limited because of difficulty remembering or periods of confusion. Other indicators in this section identify family members who have difficulty walking without any special equipment or limitations related to specific personal care needs. In addition, the section contains information about children who receive special education or early intervention services. Information regarding limitations in play activities is also collected for young children.
The 2005 FHS time variables and recodes, which indicate how long respondents have had the condition(s) causing their limitation(s), were processed using procedures similar to those used in 2002, 2003, and 2004. Substantively, the 2002, 2003, 2004 and 2005 variables and recodes are similar to those from previous years (1997-2001), but the 2002-2005 data contain fewer unknown categories than previously, that is, detailed unknown categories were collapsed into broader categories.
25
Conditions
For each family member with a previously mentioned limitation, the respondent was asked about the condition or health problem associated with that limitation, as well as the length of time he/she has had the condition. Respondents were then handed one of two flash cards listing various condition categories. These categories are broad in scope, and vary according to age. Information about family members under age 18 was solicited for the following fixed condition categories listed on the first flash card: “vision/problem seeing,” “hearing problem,” “speech problem,” “asthma/breathing problem,” “birth defect,” “injury,” “mental retardation,” “other developmental problem (e.g., cerebral palsy),” “other mental, emotional, or behavioral problem,” “bone, joint, or muscle problem,” “epilepsy or seizures,” “learning disability,” attention deficit/hyperactivity disorder,” and two instances of “other impairment problem” (if the family member was limited by a condition not listed in one of the fixed categories). Respondents could supply a 50-character verbatim response for one or both of the “other impairment problem” categories.
The fixed response categories in the instrument for adults age 18 or older were equally
broad, and comprised the conditions listed on the second flash card: “vision/problem seeing,” “hearing problem,” “arthritis/rheumatism,” “back or neck problem,” “fractures, bone/joint injury,” “other injury,” “heart problem,” “stroke problem,” “hypertension/high blood pressure,” “diabetes,” “lung/breathing problem,” “cancer,” “birth defect,” “mental retardation,” “other developmental problem (e.g., cerebral palsy),” “senility,” “depression/anxiety/emotional problem,” and “weight problem.” Starting in 2001 and continuing in 2005, if an adult family member was limited by a condition not listed in one of these 18 fixed categories, the interviewer entered “M” for “More conditions,” and a second screen containing 17 additional condition categories and two “other impairment problem” categories appeared on the interviewer’s laptop computer screen. These conditions were not read aloud to respondents, but if the respondent said a family member’s condition was limited by one of these 17 conditions, the interviewer recorded this information. If the family member was limited by a condition not listed on either the second flash card or on the interviewer’s computer screen, then the interviewer entered a 50-character verbatim response for one or both of the “other impairment problem” categories. Respondents could list any number of applicable conditions.
During data processing, the verbatim responses recorded by interviewers were reviewed to determine if any responses could be back-coded to one of the 13 fixed categories for respondents under age 18, or to one of the 18 fixed categories for adult respondents. If so, these “other” responses were assigned to the appropriate response categories (the first 13 for children, and the first 18 for adults). For adults, an additional 16 ad hoc categories were created during data processing to categorize responses that fell outside the fixed 18 condition categories included in the instrument: these ad hoc categories were assigned numbers 19_ through 34_. (Note: Due to a naming convention error in 2002 and 2003 these same ad hoc categories were assigned numbers 19 through 34 without an underscore.) In addition, responses in the 17 general categories seen only by the interviewer were also back-coded and categorized into 8 of the ad hoc categories. The resulting 36 categories for adults and 13 categories for children were based on the International Classification of Diseases, Ninth Revision, Clinical Modification (see Table 4, below; note that the ICD-9-CM codes shown in this table are not included on the data file).

26
Any verbatim conditions that could not be back-coded to one of the original categories or recoded to one of the ad hoc categories (for adult respondents) remained in the “other impairment problem” categories, and were renumbered “90” and, if necessary, “91” for both children and adults. The specific condition categories as well as the “other impairment problem” categories were subsequently transformed into variables indicating whether or not the condition was responsible for the respondent’s difficulty with any activity (a mention/not-mention format). Note that the verbatim responses associated with the “other impairment problem” categories are not included as a separate field on the public use file. Because the 16 adult ad hoc categories were not included on the flash cards given to respondents during the course of the interview, it is possible that frequencies obtained for these conditions causing limitations will be underestimates. Therefore, these variables should be analyzed with care. Moreover, none of the FHS condition variables (the 13 child variables, LAHCC1 through LAHCC13, and the 34 adult variables, LAHCA1 through LAHCA34_) should be used to estimate prevalence for the conditions they represent, because only those persons with a previously reported limitation were eligible for the condition questions that followed. Analysts who are interested in estimating the prevalence of particular conditions are referred to the Sample Adult and Child Cores.
Recodes
The recode LA1AR is a summary measure that indicates household members reporting any limitation regarding one or more of the activities discussed during the course of the FHS section of the interview. In other words, individuals who answered “yes” to PLAPLYLM, PSPEDEIS, PLAADL, PLAIADL, PLAWKNOW, PLAWKLIM, PLAWALK, PLAREMEM, or PLIMANY are coded “1” for LA1AR. LACHRONR is based on LA1AR but adds the additional criterion of whether at least one of the reported causal conditions is a chronic condition. This recode corresponds most closely with the pre-1997 NHIS recode for Activity Limitation, although it has fewer response categories and does not allow for levels of limitation.
In response to analysts’ requests that the LA1AR recode distinguish persons who are not limited from those with unknown disability status, this variable includes three response levels: “1” for limited, “2” for not limited, and “3” for unknown if limited. (For comparability with previous years, level 3 may be collapsed into level 2.) Users can also utilize the information contained in LA1AR to control for “unknown if limited” cases with respect to LACHRONR (that is, when LACHRONR = 0).
Also, a series of age-group-specific recodes (e.g., under 18 versus 18 and over) regarding conditions limiting activity and duration of limiting conditions have been created. Because the questions about limitation of activity in the redesigned NHIS are asked differently for different age groups, and because the questions are more general (in some cases) or more specific (in other cases) than in pre-1997 years, the degree to which a respondent is limited cannot be determined.

27
Chronic Conditions Each condition reported as a cause of an individual’s activity limitation has been
classified as “chronic,” “not chronic,” or “unknown if chronic,” based on the nature of the condition and/or the duration of the condition. Conditions that are generally not cured once acquired (such as heart disease, diabetes, and birth defects in the original response categories, and amputee and “old age” in the ad hoc categories) are considered chronic, while conditions related to pregnancy are always considered not chronic. Additionally, other conditions must have been present for three months or longer to be considered chronic. Conditions are considered chronic for children less than one year of age who have had a condition “since birth.” Because the presence of a limitation determined whether persons were eligible for the condition questions and the chronicity recodes, we caution data users that these variables should not be used to produce estimates of prevalence rates of chronic conditions.
Table 4. FHS Categories with Approximate ICD-9-CM Ranges
A. Codes for Adults (ages 18 or more years) NHIS Category
ICD-9-CM Codes
1 - Vision or seeing problem 360-379
2 - Hearing problem 387-389
3 - Arthritis / rheumatism 711-712, 714-716, 720.0, 721, 729.0
4 - Back or neck problem 722-724, 732.0, 737
5 - Fractures, bone or joint injury Injury with specific mention of bone or joints
800-848, 850-999
6 - Other injury Injury without specific mention of bone or joints
850-999
7 - Heart problem 410-417, 420-429, 745, 746, 785.0-785.3
8 - Stroke problem 430-438
9 - Hypertension or high blood pressure 401-405
10 – Diabetes 250
11 - Lung or breathing problem 460-461, 465-466, 470-471, 473, 477, 480-487, 490-496, 500-508, 510-519
12 – Cancer 140-208
13 - Birth defect Excludes Down’s syndrome and microcephalus
740-742.0, 742.2-744, 747-757.9, 758.1-759
14 - Mental retardation Includes Down’s syndrome and microcephalus
317-319, 742.1, 758.0

28
A. Codes for Adults (ages 18 or more years) NHIS Category
ICD-9-CM Codes
15 - Other developmental problem Includes learning disabilities
315, 343, 783.4
16 - Senility (and other cognitive problems)
290
17 - Depression, anxiety or emotional problem Includes neurotic disorders, personality disorders, and other nonpsychotic mental disorders, excluding alcohol and drug related problems and developmental problems
300-302, 306-314, 799.2
18 - Weight problem Indicates a problem with being overweight or obese
19 - Missing limbs (any part) / amputee Indicates loss of a limb or digit
20 - Other musculoskeletal system conditions Diseases of the musculoskeletal system and connective tissue not coded to 3, 4, 5
710-739
21 - Other circulatory system conditions Any diseases of the circulatory system not coded to 7, 8, 9
390-459
22 - Other endocrine system, etc. conditions Any Endocrine, Nutritional and Metabolic Diseases and Immunity Disorders not coded to 10 or 18
240-279
23 - Other Nervous system conditions Diseases of the nervous system and sense organs not coded to 1, 2, 15, 16
320-389
24 - Digestive system conditions 520-579
25 – Genitourinary system conditions 580-629
26 - Skin & subcutaneous system conditions 680-709
27 - Blood & blood-forming organ conditions 280-289
28 - Tumors & cysts, benign & unspecified Any mention of “tumor” without cancer, malignancy, etc.
210-239
29 - Alcohol & drug related problems Any mention of “alcohol,” “drugs” (or specific drug types), or substance abuse
291-292, 303-305
30 - Other mental conditions Any mental disorders not coded to 14 or 15 or 17
293-299

29
A. Codes for Adults (ages 18 or more years) NHIS Category
ICD-9-CM Codes
31 - After effects of surgery or other medical treatment Any mention of “surgery” or “operation” or other treatment as the causal condition; includes ongoing or recent treatment (1 year or less) or specific and sole mention of surgery/medical procedure as specific cause of limitation.
32 - Old age Any mention of age as the only specified cause
33 - Fatigue/Tiredness Any mention of tiredness, stiffness, or weakness without referring to any specific part of the body
34 - Pregnancy related conditions Any mention of “pregnancy” or “childbirth”
90 - Others Not Elsewhere Classified 1st other-specify verbatim, not elsewhere classified
91 - Others Not Elsewhere Classified 2nd other-specify verbatim, not elsewhere classified

30
B. Codes for Children (ages under 18 years) NHIS Category
ICD-9-CM Codes
1 - Vision or seeing problem 360-379
2 - Hearing problem 387-389
3 - Speech problem 307.0, 307.9, 315.3, 784.3, 784.5
4 - Asthma or breathing problem 460- 461, 465-466, 470-471, 473, 477, 480-487, 490-496, 500-508, 510-519
5 - Birth defect Excludes Down’s syndrome and microcephalus
740-742.0, 742.2-757.9, 758.1-759
6 – Injury 800-999
7 - Mental retardation Includes Down’s syndrome and microcephalus
317-319, 742.1, 758.0
8 - Other developmental problem
343, 783.4
9 - Other mental, emotional, or behavioral problem
290-313, 799.2, V15.4
10 - Bone, joint or muscle problem 710-739
11 - Epilepsy and seizures 345, 779.0, 780.3
12 - Learning disability 315
13 - Attention Deficit/Hyperactive Disorder (ADD/ADHD) 314
90 - Others Not Elsewhere Classified 1st other-specify verbatim that does not fit in any other category
91 - Others Not Elsewhere Classified 2nd other-specify verbatim that does not fit in any other Category
Technical Notes
The condition variable LAHCA31_ includes any causal condition that specifically mentioned “surgery” or “operation,” or otherwise indicates a medical treatment as the causal condition (either ongoing or occurring within the last year). The condition variable LAHCA33_ includes any causal condition that specifically and solely mentioned “fatigue,” “weakness,” “lack of strength,” “tiredness,” “exhaustion,” etc. without reference to any particular part of the body. Lastly, the condition variable LAHCA34_ includes any causal condition that specifically and solely mentioned “pregnancy,” “pregnant,” or “childbirth.”

31
II. Health Care Access and Utilization Section (FAU)
The Health Care Access and Utilization (FAU) section of the Family Core of the 2005 NHIS has remained largely unchanged since 1997. The FAU section contains information addressing access to health care, utilization services, and health care contacts.
Since 1997, questions that ask about delay of health care because of worry about the cost, overnight hospital stays, home care, calls to health professionals, and office visits have been included in the survey; there is also an expanded list of health care professionals, and respondents were instructed to consider “care from ALL types of medical doctors, such as dermatologists, psychiatrists, ophthalmologists, and general practitioners,” as well as nurses, physical therapists, and chiropractors. Lastly, a question asking about 10 or more visits to doctors or other health care professionals in the last 12 months has been included.
Technical Notes
A few large values were found for hospitalizations (HOSPNO) and hospital nights (HPNITE). In addition large numbers may exist for home care visits (PHCHMN2W), doctor visits (PHCDVN2W), and calls to health professionals (PHCPHN2W). Analysts should be aware that the above mentioned variables have not been edited for reasonableness.
Analysts are advised to read the notes in the Dataset Documentation for further information pertaining to any changes that may have occurred and to compare the 2005 documentation to documentation from the 2004 (and earlier) NHIS for any other changes that may have occurred over time to the variables in this section.
III. Health Insurance Section (FHI)
The Health Insurance section of the 2005 NHIS Family Core has a full range of data items addressing health insurance. No changes have been made to the section since quarter 3 of 2004. The flow of the questions pertaining to health insurance programs covered by this section is similar to the 1993-96 NHIS Health Insurance Supplements and the 1997-2003 NHIS Family Cores.
The health insurance section (FHI) covers several different topic areas:
Type of health care coverage (Medicare, Medicaid, State Children’s Health Insurance Program (SCHIP), MILITARY (TRICARE, VA, CHAMP-VA), State-sponsored health plan, Indian Health Service, other government programs, private insurance and single service plans); Managed care arrangement and the need for referrals for those covered by Medicare, Medicaid, SCHIP, other State-sponsored health plans and other government programs;

32
Medicare managed care model types; Enrollment in a Medicare Prescription Drug Discount Care Endorsement Program; Private insurance characteristics reported by the family respondent, including HMO, PPO, and POS status, source of coverage, existence of employer subsidies for premiums, amount paid by individual/family, managed care detail information, need for a referral, prescription drug benefit; Private insurance plan types, including HMO model types coded from private plan names; Types of single service plans; Type of TRICARE coverage; Periods of time without health insurance and reasons for no health insurance; Out-of-pocket costs in the past year for medical expenses (excluding health insurance premiums).
Beginning in 2004, FHI data contain several modifications, as well as some new
variables. The HIKIND list was shortened from 14 categories to 11. Private health insurance was combined into one category, HIKINDA, and military health coverage was combined into one category, HIKINDF. To increase the counts of single service coverage, SINCOV was added following the HIKIND question for persons who had not indicated earlier that they have a single service plan. A person who responded to either HIKINDJ or SINCOV received the single service detail questions. Response categories were changed in the PLNWRK question to get better precision as to how a private health plan was obtained. This detail is contained in PLNWRKN1 and PLNWRKN2. An additional question was added to the private plan detail to monitor the impact of the Medicare prescription drug benefit on private plan drug benefits. This information is contained in PRRXCOV1 and PRRXCOV2. Detailed information concerning the third and fourth plans for a respondent is no longer available on the public use data file. Persons with three or more plans have a “yes” response to the PRPLPLUS variable. Detailed information on the third and fourth plan for a respondent is still available through the NCHS Research Data Center.
Details on type of military coverage are now contained in the new variables MILSPC1,
MILSPC2, MILSPC3, MILSPC4, and MILMAN. An additional question, MCRXCARD, was added to the Medicare section to capture enrollment in the Medicare Prescription Drug Discount Care Endorsement Program. The wording on the MCCHOICE question was changed to address the new name for Medicare Plus Choice, which is Medicare Advantage. Follow-up questions were added regarding the State Children’s Health Insurance Program (SCHIP), State-sponsored and other public programs (OTHERPUB), and other government programs (OTHERGOV) to obtain managed care information for all types of public coverage.

33
Beginning with quarter 3, 2004, two new questions were added to reduce potential errors in reporting Medicare and Medicaid status. Persons 65 years and over not reporting Medicare coverage were asked explicitly about Medicare coverage in MCAREPRB. Persons under 65 with no reported coverage were asked explicitly about Medicaid coverage in MCAIDPRB. Respondents who were reclassified as covered by either of these additional questions received the appropriate follow-up questions.
Technical Notes
Analysts are strongly advised to use the recodes MEDICARE, MEDICAID, PRIVATE,
SCHIP, IHS, MILITARY, OTHERPUB, OTHERGOV, and SINGLE for types of health care coverage because these recodes take into account the complicated editing process that takes place in the FHI section. The variables HILAST and HINOTYR, which reflect periods of noncoverage, cannot be used to estimate the rate of uninsurance. Users should derive such estimates from NOTCOV (if they do not count IHS as coverage) or, alternatively, the health insurance recodes (MEDICARE, MEDICAID, PRIVATE, SCHIP, IHS, MILITARY, OTHERPUB, and OTHERGOV). Using the most conservative estimate of the uninsured (which would exclude persons with IHS coverage only), a total of 821 persons did not receive the HILAST question during the course of the interview because they indicated that they had health care coverage. It was subsequently established during the course of editing that they lacked coverage (given the information that they provided about their insurance plan(s)). NHIS staff elected not to edit these people out of the universe for HINOTYR. In addition, a total of 1,663 respondents were not asked either the HILAST or the HINOTYR questions.
It was determined that some respondents indicated plans (in response to the questions
HIPNAM1, HIPNAM2, HIPNAM3, and HIPNAM4) that were not private health insurance plans, or were single service plans that were excluded from the private health insurance coverage category. These respondents were reassigned to the appropriate response category with the enrollment recodes for MEDICARE, MEDICAID, SCHIP, IHS, MILITARY, OTHERPUB, OTHERGOV, and SINGLE. Similarly, in looking at the verbatim responses to the questions STNAME1, STNAME2 or STNAME3 that asks respondents for the name of their SCHIP, state sponsored or other government coverage respectively, it was found that some respondents indicated plans and names of programs that were clearly private health insurance, Medicare, Medicaid, military coverage, Indian Health Service, single service plans, or no coverage at all. Persons with these forms of coverage were reassigned to the appropriate enrollment recodes for MEDICARE, MEDICAID, PRIVATE, IHS, MILITARY, and SINGLE. Respondents who answered “other state sponsored” or “other government coverage” who were subsequently determined through the STNAME2 or STNAME3 fields to be covered by the State Children’s Health Insurance Program were assigned to the SCHIP recode. In looking at the verbatim responses to the question MCHMO_NA that asks respondents for the name of their Medicare managed care plan, it was found that some respondents indicated plans or programs that were clearly private health insurance, Medicaid, military coverage, Indian Health Service, single service plans, or no coverage at all. Persons with these forms of coverage were reassigned to the appropriate enrollment recodes for MEDICAID, PRIVATE, IHS, MILITARY, and SINGLE. Likewise, in looking at the verbatim responses to the questions MACHMD_1 and MACHMD_2 that ask respondents for the name of their Medicaid managed care plan, it was found that some of these respondents indicated plans or programs that were clearly private
34
health insurance, Medicare, SCHIP, military coverage, Indian Health Service, single service plans, or no coverage at all. These respondents were also reassigned to the appropriate enrollment recodes for MEDICARE, CHIP, PRIVATE, IHS, MILITARY, and SINGLE. In addition, due to reengineering changes, there are no longer “99” response codes for the variables HITYPE1 and HITYPE2.
In addition, some respondents offering an “other” response to the survey item
(HISTOPOT) that inquired about the reason(s) their coverage stopped subsequently indicated in their verbatim responses that they did in fact have health insurance. These persons were reassigned to the appropriate response category with the enrollment recodes for MEDICARE, MEDICAID, SCHIP, PRIVATE, IHS, MILITARY, OTHERPUB, and OTHERGOV. Analysts are therefore strongly advised to use the recodes MEDICARE, MEDICAID, PRIVATE, SCHIP, IHS, MILITARY, OTHERPUB, OTHERGOV, and SINGLE for types of health care coverage, because these take into account the above-mentioned back edits. In contrast, the data contained in HIKINDA-HIKINDK and MCAREPRB, MCAIDPRB, and SINCOV were not back-edited and reflect the respondents’ original replies. In addition, a recode (NOTCOV) is included in the data file that reflects the definition of noncoverage as used in Health, United State,2005 (in which persons with only Indian Health Service coverage are considered uninsured).
IV. Socio-demographic Section (FSD)
The Socio-demographic (FSD) section of the Family Core in the 2005 NHIS collects information on place of birth, citizenship status, and educational attainment for all family members, regardless of age. In addition, family members 18 years of age or older are asked if they were working last week, and if not, their main reason for not working. For those working, additional questions inquired about the number of hours they worked during the previous week, how many months they worked in 2005, an estimate of their earnings from wages in 2005, and whether their employer provided health insurance. Analysts may also refer to the Adult Core socio-demographic section (ASD) for additional occupational and employment data regarding those individuals selected as sample adults.
DOINGLWP and WHYNOWKP are the FSD equivalents of DOINGLWA and WHYNOWKA in the ASD section of the Sample Adult data file. For the majority of respondents, DOINGLWP and DOINGLWA will have identical values (and, likewise, WHYNOWKP and WHYNOWKA). However, it is nevertheless possible that DOINGLWP and DOINGLWA (and WHYNOWKP and WHYNOWKA) may have inconsistent values across the Person and Sample Adult data files. Users wishing to reconcile any discrepant values are advised to use the values of DOINGLWA and WHYNOWKA (rather than DOINGLWP and WHYNOWKP, respectively), since the information obtained from the family respondent during the FSD portion of the interview (and reflected in DOINGLWP and WHYNOWKP) was subsequently confirmed or corrected by the sample adult during his or her interview (as reflected in DOINGLWA and WHYNOWKA). Additionally, both DOINGLWP and WHYNOWKP are substantively equivalent to previous years’ versions of these variables (i.e., DOINGLW1 and WHYNOWK1).
The 2005 FSD section contains a variable called PLBORN, which is based on a question in the instrument that asked whether the respondent was born in the United States. If

35
respondents replied affirmatively, they were asked the state in which they were born (PLBORN1). If respondents said they were not born in the U.S., they were asked the country in which they were born (PLBORN2). PLBORN1 and PLBORN2 are not included on the public use file for confidentiality reasons. However, the 2005 NHIS includes two public use recodes, GEOBRTH and REGIONBR, that are based on this restricted birthplace information (as well as the variable, PLBORN). GEOBRTH indicates geographic place of birth, and has three categories: born in one of the 50 United States or the District of Columbia; born in a U.S. territory; or not born in the U.S. or a U.S. territory. In order to make GEOBRTH comparable to previous recodes (for carrying out analyses on multiple years of NHIS data), users should collapse those respondents in the last two categories of GEOBRTH into a single category. This will result in a recode that is comparable to USBRTH_P from the 2000-2001 NHIS or USBORN_P from the 1997-1999 NHIS. The second recode, REGIONBR, categorizes all respondents into one of 12 categories depending on their country of origin. The CIA on-line World Factbook was used to place countries into the regional categories shown below (for more information about the Factbook, users should refer to http://www.cia.gov/cia/publications/factbook/index.html ). Note that respondents born in Canada were included in the “Elsewhere” category of REGIONBR in order to satisfy NCHS confidentiality requirements. Users are cautioned that neither GEOBRTH nor REGIONBR indicate legal status or citizenship.
Category Countries included
United States All persons born in one of the 50 United States or the District
of Columbia
Mexico, Central America, Caribbean Islands
Mexico, all countries in Central America and the Caribbean Island area, including Puerto Rico
South America All countries on the South American continent
Europe Albania, Austria, Azores Islands, Belgium, Bosnia, Bulgaria,
Corsica, Crete, Croatia, Czechoslovakia, Denmark, Finland, France, Germany, Great Britain, Greece, Herzegovina, Holland, Hungary, Iceland, Ireland, Italy, Liechtenstein, Luxembourg, Macedonia, Majorca, Malta, Monaco, Montenegro, Netherlands, Norway, Poland, Portugal, Prussia, Romania, Scotland, Serbia, Sicily, Slovakia, Spain, Sweden, Switzerland, Yugoslavia
Russia (and former USSR areas) Russia, Lithuania, Latvia, Ukraine, and all places formerly a part of the USSR
Africa All countries on the African continent, plus the Canary Islands, Comoros, Madagascar, Madeira Islands

36
Middle East Aden, Arab Palestine, Arabia, Armenia, Bahrain, Cyprus,
Gaza Strip, Iran, Iraq, Israel, Jordan, Kuwait, Syria, Lebanon, “Middle East,” Oman, Palestine, Persia, Qatar, Saudi Arabia, Syria, Turkey, United Arab Emirates, West Bank, Yemen
Indian Subcontinent Afghanistan, Bangladesh, Bhutan, British Indian Ocean Territory, Ceylon, East Pakistan, India,, Maldives, Nepal, Pakistan, Sri Lanka, Tibet, West Pakistan
Asia Asia, Asia Minor, China, Japan, Mongolia, North Korea, South Korea
SE Asia Borneo, Brunei, Burma, Cambodia, Christmas Island, Hong Kong, Indonesia, Laos, Malaysia, Myanmar, North Vietnam, Philippines, Singapore, South Vietnam, Taiwan, Thailand
Elsewhere Guam, Bermuda, Canada, Greenland, Oceania, as well as “At sea,” “High seas,” “International waters,” “North America”
Unknown Places that could not be classified in the above categories. Users seeking more detailed information on respondents’ place of birth may gain limited, supervised access through the NCHS Research Data Center. For more information, refer to the Research Data Center Web page: http://www.cdc.gov/nchs/r&d/rdc.htm.
Respondents who were not born in one of the 50 United States or the District of Columbia were asked the year in which they came to the United States to stay. Respondents who could not recall or refused to answer were subsequently asked to estimate the number of years they had been in the United States since they came to stay. This information was combined to create a recode that indicates how long these respondents have been living in the United States (YRSINUS). The 2005 data also contain a citizenship recode (CITIZENP) that distinguishes between U.S. citizens and non-citizens.
V. Income and Assets Section (FIN)
The Income and Assets (FIN) section of the Family Core contains information regarding a variety of income sources, as well as estimates of total combined family income and home tenure status. Respondents are asked whether anyone in the family received income from a variety of sources; if so, the respondent is then asked to name the member(s) receiving income from that source. The section also includes questions about the family’s total income from all sources in 2004, and their home tenure status. The basic universe for most questions is “all families;” however, note that universes for several questions (most importantly, PSAL, PSEINC, and PWIC) are further limited with respect to age (of family members).
Sources of Income
The first two questions in the section ask about income from wages and salary, and from self-employment (business or farm) for family members 18 years of age and older.

37
Subsequent questions are not limited to adult family members. Respondents were asked about income from Social Security or Railroad Retirement (including that which was received as a disability benefit); other pensions; Supplemental Security Income (SSI); Welfare/Temporary Assistance to Needy Families (TANF); other kinds of government assistance (e.g., job training or placement, transportation assistance, or child care); interest from checking or savings accounts, Individual Retirement Accounts (IRAs) or certificates of deposit, money market funds, treasury notes, bonds, or any other accounts; dividends from stocks, mutual funds, and/or net rental income from property, royalties, estates or trusts; child support payments; and other income sources (the question specifically mentions alimony, contributions from family or friends, Veteran’s Administration (VA) payments, Worker’s Compensation, and Unemployment Compensation as possible sources of “other” income). Respondents are told at the start of the Income and Assets section that all questions are seeking information about possible income sources in the previous calendar year (2004).
Amounts and Home Ownership
In years prior to 1997, the NHIS obtained information about the amount of income received from each financial source, but that was dropped in the redesigned NHIS (1997 and beyond) in favor of a single overall estimate of combined family income. Unlike previous NHIS instruments, the redesigned instrument contains three questions to identify the family’s combined income from all sources during the previous calendar year, including a question (FIN.250) that allows the respondent to supply a specific dollar amount (up to $999,995). Any family income responses greater than $999,995 are entered as $999,996. Respondents who do not know or refuse to give a dollar amount to this question are then asked if their total combined family income for the previous year was $20,000 or more, OR less than $20,000 (FIN.260). If the respondent answers this question, he/she is then given one of two flash cards and asked to indicate which income group listed on the card best represents the family’s combined income during the previous calendar year (FIN.270). One flash card lists incomes that are $20,000 or more, and the other flash card lists incomes that are less than $20,000.
In the 2004 Survey Description Document, data analysts were made aware of an
unanticipated issue in 2004 related to the collection of exact amount income data (FIN.250). Specifically, a much larger than expected proportion of respondents reported a family income in the last calendar year of “$2.” In 2004, 2,133 persons (2.25%) had a response of “$2” to the exact amount of family income question (FIN.250). By comparison, in 2002 (the most recent data year without sample cuts), 136 persons (0.15%) had a response of “$2” to the exact amount of family income question (FIN.250). In an attempt to reduce the amount of these types of responses, an edit, which would trigger on very high or very low income amounts, was added to the survey instrument. This edit asked the interviewer to verify if the entered information was correct; the interviewer was instructed not to ask the respondent to verify the amount. This change was implemented in the 2005 NHIS starting in Quarter 2. The number of “$2” responses decreased from 214 in Quarter 1 of 2005 to 59 in Quarter 2, 44 in Quarter 3, and 41 in Quarter 4. In 2004, all of the “$2” responses to the exact amount of family income (FIN.250) were assigned the value of “not ascertained” and were subject to income imputation. The same procedure was applied to “$2” responses for 2005: they were assigned the value of “not ascertained” and were subject to income imputation.

38
Additionally, a more detailed indicator of poverty status was created by utilizing published information from the U.S. Census Bureau regarding 2004 poverty thresholds (see Income, Poverty, and Health Insurance Coverage in the United States: 2004). A ratio of the 2004 income value reported by respondents to the poverty threshold for the same year was constructed, given information on the family’s overall size as well as the number of children (aged 17 and under) present in the family. The resulting ratio was subsequently ordered into a poverty gradient consisting of 14 categories (RAT_CAT). Users should note that the universe for this variable is considered to be all families, because the initial income question was asked of all families. However, the income-to-poverty ratios and resulting RAT_CAT values could not be calculated in two situations: for families who simply did not supply adequate income information (e.g., those who would only indicate that their income was above or below $20,000, as well as those who declined to give any income information), and for families where the number of children aged 17 or under equaled the overall number of family members (these observations are coded “99” and “96,” respectively, for RAT_CAT). Analysts should also note that the distribution of income-related recodes INCGRP and RAT_CAT may differ from 2004 to 2005 because of the large decrease in the number of “$2” family income responses.
Respondents were also asked whether the family’s house or apartment was owned or
being bought, rented, or occupied by some other arrangement (FIN.280). If the family was renting the current residence, a follow-up question (FGAH or FIN.282) asked whether the family was paying lower rent due to governmental rental assistance.
Starting in 2004, INCGRP, RAT_CAT, and HOUSEOWN were moved from the Person
file to the Family file, replacing the 1997-2003 Family file variables FINCGRP, FRAT_CAT, and FHOUSE, respectively. Analysts should also note that a second income recode (AB_BL20K), which was included on the 1997-2003 Person file, was deleted from the NHIS public use files starting in 2004 because it could be created from INCGRP and was redundant. In addition, prior to 2004, FGAH was found on the Person file but has since been moved to the Family file.
Program Participation
Respondents were asked in the final part of the FIN section if any family members were authorized to receive food stamps in 2004, and if so, which members. In addition, respondents were asked whether any family member(s) had ever applied for Supplemental Security (SSI) or Social Security disability benefits (even if the claim(s) had been denied). Lastly, if one or more family members had received food stamps or Temporary Assistance to Needy Families (TANF), the respondent was asked, in two separate questions, for how many months during the last calendar year food stamps and/or TANF were provided.
Finally, the NHIS contains three person-level variables relating to the Women, Infants, and Children (WIC) program. The first of these variables, ELIGPWIC, indicates if the person was in a family with at least one WIC age-eligible person (children 0-5 years of age or females 12-55 years of age). If there is at least one WIC age-eligible person in the family, the family respondent is asked if anyone in the family received WIC benefits in the previous calendar year (PWIC). An additional variable, WIC_FLAG, is also included in the Person file. WIC_FLAG indicates if persons who received WIC benefits were age-eligible for the WIC program.
39
Technical notes
As previously mentioned, the majority of the questions in the FIN section are structured to ask first whether any family member received the applicable income source and, if yes, then to determine which family members received the income source. This format also applies to other items in the section such as TANF, food stamps, and WIC benefits. As mentioned in the 2003 Survey Description Document, the 1997–2003 NHIS only allowed six persons per family to be indicated as receiving the income and/or program source. However, this problem was corrected for 2004. Analysts interested in using these program participation variables for 1997–2003 should refer to the 2003 Survey Description Document for guidance. Further, since qualification for these programs is usually based on a family’s economic circumstances, these program participation variables may have limited analytic value at the person level. Therefore, analysts may find more utility in using the corresponding variables from the Family file.
40
2005 National Health Interview Survey
Injury and Poisoning Episode Files The Family Core portion of the 2005 survey included questions about medically consulted injuries and poisonings that occurred for any member of the family within a three-month reference period. All injury and poisoning information was provided by the family respondent. Two data files containing injury and poisoning information were created from these data: the Injury/Poisoning Episode file and the Verbatim Injury/Poisoning Episode file. The inclusion criteria used in 2004 were also used in 2005. In 1997-2003, the Injury/Poisoning Episode file and the Verbatim Injury/Poisoning Episode file contained episodes that were reported to occur within 104 days or four months of the interview and episodes where the date of the injury or poisoning was not reported. Beginning in 2004, the decision was made to retain all injury/poisoning episodes that reportedly occurred during the three months (91 days) prior to the date the injury/poisoning questions were asked based on responses to family level questions FIJ.010_01.000 to FIJ.028_00.000 (listed below), regardless of whether or not the date of the injury or poisoning episode subsequently reported by the family respondent in the family level questions was outside the 91 day reference period. Flags have been created to indicate which episodes may thus have occurred outside the 91 day reference period (ETFLG and BEIFLG). Family level injury/poisoning questions FIJ.010_01.000 to FIJ.028_00.000:
“DURING THE PAST THREE MONTHS, that is since [fill 1: date (91 days before today's date)], [fill 2: did you/did you or anyone in your family] have an injury where any part of [fill 3: your/the] body was hurt, for example, with a [fill 4: (random set of examples) cut or wound, broken bone, sprain or burn?]”;
“DURING THE PAST THREE MONTHS, how many different times [fill 1: were you/was ALIAS] injured?”;
“Did [fill 1: you /ALIAS] talk to or see a medical professional about [fill 2: any of these injuries/this injury/your injury or injuries/his injury or injuries/her injury or injuries]?”;
“Of [fill 1: the ^TFINJ3M/all the] times that [fill 2: you were/ALIAS was] injured, how many of those times was the injury serious enough that a medical professional was consulted?”;
“DURING THE PAST THREE MONTHS, that is since [fill 1: date (91 days before today's date)], [fill 2: were you/ were you or anyone in your family] poisoned by swallowing or breathing in a harmful substance such as bleach, carbon monoxide, or too many pills or drugs? Do not include food poisoning, sun poisoning, or poison ivy rashes.”;
“DURING THE PAST THREE MONTHS, how many different times [fill 1: were you/was ALIAS] poisoned? Do not include food poisoning, sun poisoning, or poison ivy rashes.”;
41
“Did [fill 1: you /ALIAS] talk to or see a medical professional about [fill 2: any of these poisonings/this poisoning/your poisoning or poisonings/his poisoning or poisonings/her poisoning or poisonings]?”
“Of [fill 1: the ^TFPOI3M/all the] times that [fill 2: you were/ALIAS was] poisoned, how many of those times was the poisoning serious enough that a medical professional was consulted?”
I. Injury/Poisoning Episode File The Injury/Poisoning Episode file is an episode-based file: each medically consulted (e.g., call to a poison control center; use of an emergency vehicle or emergency room; visit to a doctor’s office or other health clinic; phone call to a doctor, nurse, or other health care professional) injury and poisoning episode reportedly occurred during the three months prior to the date the injury/poisoning questions were asked based on responses to family level questions FIJ.010_01.000 to FIJ.028_00.000, and resulted in one or more conditions. An injury episode refers to the traumatic event in which the person was injured one or more times from an external cause (e.g., a fall, a motor vehicle traffic accident). An injury condition is the acute condition or the physical harm caused by the traumatic event. Likewise, a poisoning episode refers to the event resulting from ingestion of or contact with harmful substances, as well as overdoses or wrong use of any drug or medication, while a poisoning condition is the acute condition or the physical harm caused by the event. A person may record up to a total of ten injury and/or poisoning episodes and will be represented in this file as many times as he/she had unique injury and/or poisoning episodes. Each episode must have at least one injury condition or poisoning classified according to the nature-of-injury codes 800-909.2, 909.4, 909.9, 910-994.9, 995.5-995.59, and 995.80-995.85 in the Ninth Revision of the International Classification of Diseases (ICD-9-CM) and one external cause of injury code of E800-E848, E850-E869.9, E880-E929.9, or E950-E999. Other health conditions that were reported as occurring with the injury or poisoning, even if they are not classified according to the above mentioned nature-of-injury codes (e.g., mononeuritis of unspecified site (355.9), other symptoms referable to back (724.8)), are also included in the Injury/Poisoning Episode file. The Injury/Poisoning Episode file contains information about the external cause and nature of the injury or poisoning episode, what the person was doing at the time of the injury or poisoning episode, the date and place of occurrence, the elapsed time between the date of the injury or poisoning episode and the date the injury/poisoning questions were asked, where the person received medical advice, treatment, or follow-up care, whether the person was hospitalized, whether the person missed any days from work or school due to the injury or poisoning, ICD-9-CM diagnostic codes, and ICD-9-CM external cause codes. ICD-9-CM diagnostic and external cause codes were assigned for all injury and poisoning episodes based on information about how the injury or poisoning happened, the body part injured or poisoned, and the type of injury or poisoning, along with responses to questions about specific types of injury or poisoning episodes, and activity. During the 2005 data editing process, 124 injury and poisoning episodes were removed out of an initial total of 2,553. These included episodes with no information regarding cause, date and place of occurrence, duplicate episodes, etc. In addition, episodes
42
were removed if they consisted solely of health conditions that could not be classified according to the nature-of-injury codes and external cause of injury codes listed above. As in previous years, respondents reported episodes that they considered poisonings (e.g., food poisoning and allergic reactions) but that are not considered poisonings based on the ICD-9-CM. These types of episodes were included in the 1997-2003 data files. Beginning in 2004 and continuing in 2005, episodes that are not considered poisonings based on ICD-9-CM are no longer included in the Injury/Poisoning data files. This file only contains information about injury and poisoning episodes. Other person-level information can be obtained by linking the Injury/Poisoning Episode file to other 2005 NHIS data files (Person, Sample Adult, and Sample Child) using the household serial number (HHX), family serial number (FMX), and person number (FPX). When using a linked Injury/Poisoning Episode file and Sample Adult file, analysis should be limited to those episodes for persons included in the Sample Adult file, and the Sample Adult weight should be applied. When using a linked Injury/Poisoning Episode file and Sample Child file, analysis should be limited to those episodes for persons included in the Sample Child file, and the Sample Child weight should be applied. See Appendix VII for additional information about merging data files. Recall Period and Weights Questions in the Injury/Poisoning section of the 2005 NHIS have a recall period of the “last 3 months.” However, as the time between the injury/poisoning episode and the date the injury/poisoning questions were asked increases, the annualized number of injuries/poisonings reported decreases. For most analyses of the injury/poisoning data (e.g., estimates for all types of injury/poisoning episodes and estimates for less severe injuries/poisonings), limiting data to episodes with a reported five weeks or fewer between the injury/poisoning episode and the date the injury/poisoning questions were asked is recommended because analyses showed that respondents tend to forget less serious injuries (Warner, et al., 2005). For analysis of injury/poisoning episodes resulting in more serious outcomes (e.g., estimates for fractures and hospitalizations) that are unlikely to be forgotten, the data should not be limited to the five-week period. The longer period of time between the injury/poisoning episode and the date the injury/poisoning questions were asked will increase the number of episodes reported and therefore increase the size of the sample and provide richer detail and greater stability in the estimate. We do not suggest calculating two estimates, one for serious and one for non-serious injuries/poisonings and combining the two estimates. Analysts may wish to use the recommended five-week reference period to maintain consistency with other studies using the five-week reference period with NHIS injury/poisoning data. However, because the number of days since the injury/poisoning occurred is now provided for each episode on the public use data file, analysts can choose the time period that is the most appropriate for their analysis.

43
To calculate an annual estimate of the number of injuries and poisonings, the weighted number of episodes reported during a time period is multiplied by the number of time periods in a year. For instance, to estimate the number of injury or poisoning episodes occurring annually using episodes with three months or less elapsing between the injury/poisoning and the date the injury/poisoning questions were asked, each three-month weighted count should be multiplied by 4 (i.e., by 52/13=4). If data are limited to episodes with five weeks or less between the injury/poisoning and the date the injury/poisoning questions were asked, each five-week weighted count should be multiplied by 10.4 (i.e., by 52/5=10.4). Analysts are cautioned against estimating the number of different people injured or poisoned annually using the current NHIS questions. Estimating the number of persons injured using the annualizing method described in the above paragraph (i.e., multiplying the estimate by the number of time periods in a year) assumes that the same individuals experienced injuries at the same rate over the year. Analysts are cautioned to check the Dataset Documentation and the specific item in the questionnaire in order to insure that annual estimates for these kinds of injury or poisoning episodes have intrinsic meaning. Variance Estimation This file does not contain the design variables used in variance estimation. To obtain the design information, the Injury/Poisoning Episode file must be linked to the Person file, the Sample Adult file or the Sample Child file. Technical Notes and Imputation Information Two variables on the Injury/Poisoning Episode file, ICAUS and ECAUS, describe the external cause of the episode. ICAUS is the actual item found in the questionnaire. For each unique episode, the interviewer selected the category of ICAUS that he/she felt best described the episode based on the respondent’s description of how the injury or poisoning happened (IPHOW). ECAUS is a recoded variable that describes the cause of the episode using categories based on ICD-9-CM external cause codes. The category into which an episode was placed was based entirely on the first ICD-9-CM external cause code listed for that episode. Appendix I in the Injury/Poisoning Episode Dataset Documentation contains a list of the ICD-9-CM external cause codes found in each category. Analysts are cautioned regarding their use of the variable RPCKDMR, which indicates the elapsed time between the date of the injury or poisoning episode and the date the injury/poisoning questions were asked. This variable is based on only the month, day, and year of the injury or poisoning episode provided by the respondent and the actual day the respondent was asked the injury/poisoning questions. No information from additional date questions that are currently in the survey were used in the creation of this variable. When possible, the elapsed time between the date of the injury or poisoning episode and the date the injury/poisoning questions were asked is given in days. The time between the date of the injury or poisoning episode and the date the injury/poisoning questions were asked is only given in months when the day of the injury or poisoning episode was not reported. In previous years, the calculation of this variable was based on the last date when the interview was opened for examination or input of data, not necessarily on the date when the
44
injury/poisoning questions were asked, which could be different. This could happen if the interviewer was unable to complete the interview in one visit and had to return at a later date, so the injury and poisoning questions may have been completed earlier than indicated by the date of the interview recorded by the CAPI instrument. If this occurred, the actual time between the date of the injury or poisoning episode and the date the injury/poisoning questions were asked would be less than the elapsed time indicated by the variable RPCKDM. Beginning in 2004, the actual date when the injury and poisoning questions were completed was recorded and used in the calculation of this variable. Beginning in 2004 and continuing in 2005, imputation was implemented for episodes that did not have a valid month, day, and year of occurrence. Imputation was done so that it would be possible to calculate a specific elapsed time in days between the date of the injury/poisoning episode and the date the injury/poisoning questions were asked for all episodes in the Injury/Poisoning Episode file and the Verbatim Injury/Poisoning Episode file. Since all episodes in the files now have a specific elapsed time (RPD) between the date of the injury/poisoning episode and the date the injury/poisoning questions were asked, analysts will be able to calculate estimates based on the time period of their choice. The variable RPD indicates the elapsed time in days between the date of the injury or poisoning episode and the date the injury/poisoning questions were asked. This variable is based on all date information that was given by the respondent, and when date information was missing, imputed information was used in the creation of this variable. For some injury and poisoning episodes, the respondent was only able to provide the month and year of occurrence; or a time period within the month (beginning, middle, or end) and year of occurrence; or the number of days, weeks, or months ago. For cases in which a month but no time period during the month was provided, a day was imputed between 1 and the last day of the month. For cases in which the month of the injury/poisoning episode and the time period within the month was provided, the day of the month within that time period was imputed. If the episode was reported as occurring during the beginning of the month, a day of 1-10 was imputed; for cases in the middle of the month, a day of 11-20 was imputed; and for cases at the end of the month, a day of 21 to either 28, 29, 30, or 31, depending on the month, was imputed. In other instances, the respondent was only able to provide a time period (i.e., number of days, weeks, or months) between the date the injury/poisoning occurred and the date the injury/poisoning questions were asked. For responses given in days ago, the corresponding value of RPD was calculated. For responses given in weeks ago or months ago, RPD was imputed from within, respectively, the interval 7(# weeks ago) ± 3 or the interval 30(# months ago) ± 15. An elapsed time interval, with lower and upper bounds BIETD and EIETD, respectively, indicates the amount of uncertainty in the injury/poisoning episode date information that was provided by the respondent. If the specific day, month, and year of the episode were provided or could be deduced from information provided by the respondent, then BIETD = EIETD = RPD. Otherwise, BIETD and EIETD indicate the lowest and highest values of the elapsed time between the episode and the date the injury/poisoning questions

45
were asked that were consistent with the reported episode date information, and RPD was imputed to be within that interval. In a few cases where insufficient information was provided to determine an elapsed time interval, values of BIETD, EIETD, and RPD were obtained from a random “donor” (another reported episode) using hot deck imputation. There are several variables in the 2005 Injury/Poisoning Episode file that supply information about the imputed data and about the consistency of the episode date information provided by respondents. The variable IMPMETH indicates which episodes have a value for RPD that is based on a specific day, month, and year of the episode that was provided or was deduced from information provided by the respondent (i.e., no imputation was needed) and which episodes have a value for RPD that was imputed. Flag variables have been added to the file to indicate whether the elapsed time (RPD) or the elapsed time interval boundaries (BIETD and EIETD) fall within the 91-day reference period mentioned in family level questions FIJ.010_01.000 and FIJ.020_00.000. This was done because it is possible that the respondent provided inconsistent information (i.e., reported that the injury or poisoning occurred during the 91-day reference period mentioned in the family level questions, and then, in follow-up questions about the episode date, reported that the injury or poisoning occurred beyond the 91-day reference period mentioned in the family level questions). Also, the elapsed time interval boundaries and imputed values of the elapsed time were not constrained to be ≤91; they were only constrained to be consistent with the date information reported by the respondent. Variable ETFLG indicates whether the elapsed time (RPD) is ≤91 days. Variable BEIFLG indicates whether the boundaries (BIETD and EIETD) of the elapsed time interval are ≤91 days. These flags were created for convenience so that analysts can decide which version of inconsistently-reported date information to use. Analysts may also choose to re-impute values of RPD that are greater than 91, constraining them to be within the 91-day limit as well as within the elapsed time interval. II. Verbatim Injury/Poisoning Episode File The Verbatim Injury/Poisoning Episode file contains edited narrative text descriptions of the injury or poisoning provided by the respondent and includes a description of how the injury or poisoning happened and “other specified” responses for the body part injured, the kind of injury, the place the person received medical care, the cause of the poisoning, and the activity at the time of the injury/poisoning. (The pre-edited responses are “verbatim” only insofar as the interviewer could type the information and condense it to fit the 300 character field.) Editing was done only to protect the injured or poisoned person’s confidentiality. Text descriptions used to replace original text that could have resulted in a breach of confidentiality are surrounded by arrows (<>). Grammatical and/or spelling errors were not corrected. The codes of “R,” which represents “Refused;” “D” or “DK,” which represent “Don’t know;” and “N,” which represents “No more information,” have also been left in the file. The following types of changes were made to the file in order to protect the injured or poisoned person’s confidentiality:
• Person names (first, middle, and/or surnames or initials) were replaced with <He> or <She>;

46
• Names of commercial operations were replaced with a general category (e.g., the name of a restaurant that serves fast food would be replaced with <fast food restaurant>);
• All place names including cities, counties, states, and street addresses were removed;
• The detailed description of an occupation was replaced with a more general category
using the Standard Industrial Classification as a guide;
• Brand names were replaced with a generic term for the product (e.g., the brand name of a car would be replaced with <motor vehicle>);
• Text that indicated unusual personal behavior or events was modified to make it less
remarkable;
• Any group or organization that was known to have a register of its members was replaced with a generic term.
47
2005 National Health Interview Survey Sample Child File
The Sample Child section of the 2005 NHIS covers additional subject areas not included in
the Family Core. Moreover, the questions in the Sample Child section are more specific and are intended to gather more detailed information than those in the Family Core. Sample children do not self-report; instead a knowledgeable adult (typically a parent or guardian) answers questions on the sample child’s behalf.
In 2005 the Child Mental Health Supplement (CMH), consisting of the long Strengths and
Difficulties Questionnaire (SDQ), was dropped. A short version of the SDQ was placed in a new section entitled, the Child Mental Health Brief Section (CMB), which was created to provide a set location for the short SDQ. In addition, questions about mental health services for sample children 4-17 years of age who have difficulties with emotion, concentration, behavior, or being able to get along with others were included for the first time in 2005 in a new section, Child Mental Health Services section (CMS). Finally, a set of questions about child influenza immunizations was introduced in 2005 in the CFI section. More detail about the sections comprising the Sample Child File is discussed below.
I. Child Conditions, Limitation of Activity and Health Status Section (CHS)
The Child Conditions, Limitation of Activity and Health Status Section (CHS) of the 2005
NHIS contains information on conditions, limitations of activity, health status, and mental health. The CHS includes questions on the following health conditions: mental retardation, developmental delays, Attention Deficit Hyperactivity Disorder (ADHD) or Attention Deficit Disorder (ADD), Down’s syndrome, cerebral palsy, muscular dystrophy, cystic fibrosis, sickle cell anemia, autism, diabetes, arthritis, congenital and other heart disease, asthma, allergies, colitis, anemia, ear infections, seizures, headaches, stuttering, and stammering. A question about whether the sample child still has asthma is included. This section also contains a question used to determine the number of school-loss days reported during the 12 months prior to the interview. In addition, respondents were asked about hearing and vision loss; if a health problem requires the sample child to use special equipment such as a brace, wheelchair, or hearing aid; whether the sample child’s health is better, worse, or the same compared with 12 months ago; and whether the sample child currently has a problem that has required prescription medication for at least three months. Lastly, there are questions about the sample child’s height and weight.
In 2005, child mental health questions derived from the Child Behavior Checklist for
children ages 2-3 years remain in the CHS section. The items in the checklist were chosen for their ability to discriminate between children who have not received mental health services in the preceding 12 months and those who have, by using demographically-matched normative and clinical samples for boys and girls. Each set of items can be viewed as comprising a scale with each item scored as either “0,” “1,” or “2.” More information on the scale derived from the Child Behavior Checklist is included in Appendix IV of this document.

48
Technical Notes
Several questions pertaining to child behavior are used to create recodes; only the recodes are included in the Public Use file. The background and usage of the mental health indicators can be found in Appendix IV.
Regarding the CHS data on colds and intestinal illnesses, analysts should keep in mind that
the questions are measuring fairly broad symptoms and illnesses. Furthermore, these may be a result of either acute or chronic conditions (e.g., irritable bowel syndrome or respiratory allergies). These data are best used to measure trends over time.
II. Child Health Care Access and Utilization Section (CAU)
The Child Health Care Access and Utilization Section (CAU) of the 2005 NHIS contains
information on access to health care, dental care, and health care provider contacts. The questions pertaining to access to health care include: having a usual place for sick care; having a usual place for routine/preventive care; change in place of care; reasons for a delay in getting medical care; and the inability to afford medical care. A question on dental care asked about the length of time since last dental visit.
Questions regarding health care provider contacts include visits and telephone contacts to
or from medical doctors and other health care professionals (such as chiropractors) in the past 12 months. As with the FAU section discussed previously, the category of “health care professional” has been expanded to include chiropractors, various types of therapists, psychiatrists, psychologists, and social workers; moreover, contacts or visits are not restricted to medical doctors or professionals working with/for a medical doctor. Note that questions about home care are asked independently of other types of health care visits. In addition, the reference period for all health care contacts is the past 12 months. Lastly, a separate question is asked about the number of visits to a hospital emergency room in the past 12 months.
In 2005 two questions from the Cancer Supplement were added to the CAU section. These
questions about the use of indoor tanning devices including a sunlamp, sunbed or tanning booth were asked for sample children 14-17 years of age.
III. Child Mental Health Brief Section (CMB)
As part of a collaborative agreement with the National Institute of Mental Health (NIMH),
the Strengths and Difficulties Questionnaire (SDQ) was first used in 2001 in a Child Mental Health Supplement in the CAU section. The SDQ is a behavioral screening questionnaire for children ages 4 to 17 years with extended questions that provide information on the duration of a child’s problem and the impact that the problem has on the child and his/her family. It is copyrighted by Dr. Robert Goodman, London, England and is used with his permission. In 2002 the long version of the SDQ was deleted from the CAU section, and a short version of the SDQ was added to the CHS core.
49
In 2003 the short version of the SDQ was dropped from the CHS section, and the long
SDQ was reinserted into the CAU section. The six items from the short SDQ in 2002 reverted to their original names and question numbers in the long SDQ in 2003 as follows: CSCL2_C2 in 2003 (CMHMF12 in 2002), CSCL2_E2 in 2003 (CMHMF13 in 2002), CSCL3_E3 in 2003 (CMHMF14 in 2002), CSCL5_P5 in 2003 (CMHMF15 in 2002), CSCL5_H5 in 2003 (CMHMF16 in 2002), and CSCL6 in 2003 (CMHDIFF in 2002).
In 2004, the long SDQ was transferred from the CAU section to a newly created section,
Child Mental Health (CMH). The question/answer wording and the question order remained the same as in 2003. Variable names (except CSCL7) have been changed to accommodate the new editing system. The question numbers have also been changed to reflect the new question numbering system and the new section name.
In 2005, the long SDQ (CMH section) was dropped. The short SDQ, a subset of the long
SDQ which was originally fielded in 2002, was reinserted in the NHIS, the Child Mental Health Brief Section or CMB. For the short SDQ items, the question/answer wording has not changed and variable names remain the same as in 2004. However, question numbers have been changed to reflect placement in a new section. More detailed information on the SDQ is provided in Appendix V.
Note that other child mental health questions derived from the Child Behavior Checklist for
children ages 2-3 years remain in the CHS section.
IV. Child Mental Health Services (CMS)
In 2005 NHIS information was collected about mental health services for sample children 4-17 years of age who have difficulties with emotion, concentration, behavior, or being able to get along with others. The CMS includes information about a health care provider visit for mental health services, medication prescribed for difficulties with concentration, hyperactivity or
Important Note The original numbering system of the response categories in the instrument has been modified in the Variable Layout Report for all variables in the CMB section. In order to correspond with the SDQ scoring system detailed in Appendix V, all variables with original answer codes of 1, 2, 3 in the instrument were changed to 0, 1, 2 in the data file, Variable Layout Report, and Variable Frequency Report; all variables with original answer codes of 1, 2, 3, 4 in the instrument were changed to 0, 1, 2, 3 in the data file, Variable Layout Report, and Variable Frequency Report.

50
impulsivity, receipt of any non-pharmacologic treatment or help for difficulties with concentration, hyperactivity or impulsivity, and the type of provider for this treatment—pediatric or general medical care practice, mental health private practice, mental health clinic or center, the child’s school or some other place.
V. Child Influenza Immunization Section (CFI)
The Child Influenza Immunization Section (CFI) was included for the first time in the 2005
NHIS. This section contains information on receipt of a flu vaccination in the past 12 months; month and year of the most recent flu vaccination; receipt of nasal flu spray vaccination in the past 12 months; and month and year of most recent nasal flu spray vaccination. These questions were also administered to all sample adults (see the AAU section).

51
2005 National Health Interview Survey
Sample Adult File
The Sample Adult section of the 2005 NHIS covers many of the subject areas included in the Family Core. However, the questions in the Sample Adult section are more specific and are intended to gather more detailed information. In addition, sample adults generally respond for themselves, although in a small number of cases, proxy responses are allowed if the selected adult had a physical or mental condition prohibiting him/her from responding. The variable PROX1 indicates those cases where information was obtained from a proxy respondent. The eight sections comprising the Sample Adult section are discussed below.
I. Adult Demographics Section (ASD)
Users are advised that the two-digit recodes based on Census codes derived from the 1987 SIC/SOC have been discontinued in the 2005 NHIS. The 2005 NHIS file contains two-digit recodes based on Census codes derived from the 2002 NAICS and the 2000 SOC. Please see the section below entitled “Industry and Occupation Coding” for additional information. The 2004 NHIS data file also contained recodes based on Census codes derived from the 2002 NAICS and the 2000 SOC. Unfortunately, the 2004 Survey Description Document incorrectly stated that these new Industry recodes were derived from the 1997 NAICS.
The Adult Socio-Demographics (ASD) section contains information regarding the occupation, industry, workplace, and employment conditions of currently employed sample adults as well as those who have ever worked (e.g., retired persons).
Sample adults aged 18 years and older who were “working at a job or business,” “with a job or business but not at work,” or “working, but not for pay, at a job or business” during the week prior to their interview were asked a series of questions about their job and work status during the week prior to the interview. In addition, those sample adults who said that they were “looking for work” or “not working and not looking for work” during the week prior to the interview were asked if they had “ever held a job or worked at a business.” Sample adults who responded affirmatively were then asked the occupation, industry and work status questions in the ASD section. Note that sample adults who had ever worked and were either retired or 65 years of age or older were asked about the job they had held the longest, whereas sample adults who had ever worked, were younger than 65 years of age, and were not retired were asked about their most recently held job. In a subsequent question, currently employed sample adults were asked if their current job was also the job they had held for the longest time. Likewise, sample adults who had ever worked and were not retired were asked if their most recently held job was also the job they had held for the longest.

52
Additional questions in the ASD section ask sample adults to describe their current/most recent/longest-held employment situation (whether they were employed by a private company or business, the federal government, a state or local government, self-employed in their own business or professional practice, or working without pay in a family business or farm), the number of full and part time employees at their workplace, how long they had worked at their current/most recent/longest-held job, whether they were paid by the hour, and whether they received paid sick leave. Respondents who indicated that they were self-employed at their current/most recent/longest-held job were asked whether they had an incorporated business. Currently employed sample adults were asked whether they were working at more than one job. Users should be aware that DOINGLWA and WHYNOWKA are the ASD equivalents of DOINGLWP and WHYNOWKP in the FSD section. For the majority of respondents, DOINGLWA and DOINGLWP will have identical values (and, likewise, WHYNOWKA and WHYNOWKP). However, it is nevertheless possible that DOINGLWA and DOINGLWP (and WHYNOWKA and WHYNOWKP) may have inconsistent values across the Sample Adult and Person data files. Users wishing to reconcile any discrepant values are advised to use the values of DOINGLWA and WHYNOWKA (rather than DOINGLWP and WHYNOWKP, respectively), since the information obtained from the family respondent during the FSD portion of the interview (and reflected in DOINGLWP and WHYNOWKP) was subsequently confirmed and corrected by the sample adult during his or her interview (as reflected in DOINGLWA and WHYNOWKA).
With the exception of BUSINC1A, WRKLONGH, and ONEJOB, the universe for all variables in the 2005 ASD section includes currently employed and ever employed sample adults. Variables with smaller universes (e.g., currently employed sample adults only) that were included in previous years’ data files have been eliminated in the 2005 NHIS. Users wishing to replicate those variables are advised to use DOINGLWA to identify the subset of currently employed sample adults (i.e., DOINGLWA = 1, 2, or 4).
Industry and Occupation Coding
During the course of the interview, verbatim responses were obtained from each eligible respondent regarding his/her industry and occupation. This information was subsequently reviewed by U.S. Census Bureau coding specialists, who assigned appropriate industry and occupation codes. These 3-digit codes, developed by U.S. Census Bureau staff for use in Federal surveys, were consistent with the structures of the Standard Industrial Classification (SIC) and Standard Occupation Classification (SOC) (but were not actual SIC and SOC codes). Prior to the 1997 NHIS, the codes were included on all NHIS public use data files. However, a review of NHIS data suggested that the level of detail contained in the codes could compromise respondent confidentiality. Consequently, beginning in 1997, the 3-digit codes were restricted to in-house NHIS data files, and DHIS staff created several 2-digit industry and occupation recodes that could be included on the public use data files. The latter recodes were based on occupation and industry groups and subgroups consistent with the existent SIC and SOC structures.
Changes in the U.S. economy led to changes in the SIC and SOC classifications. After an
extensive period of review, the standard industry and occupation classifications – and the corresponding 3-digit Census codes used by the NHIS and other Federal surveys – were replaced by the North American Industrial Classification System (NAICS) and a revamped SOC (referred

53
to subsequently as “New SOC”). Accordingly, the Census Bureau has developed new 4-digit industry and occupation codes to replace the obsolete 3-digit codes.
Most Federal surveys have switched to the new classification systems based on
NAICS/New SOC. As a result, the 2004 and 2005 NHIS in-house data files contain 4-digit 2002 Census codes for industry and occupation consistent with the 2002 NAICS and 2000 New SOC. Likewise, the 2005 NHIS public use data files contain 2-digit industry and occupation recodes based on these 4-digit Census codes. A second set of 2-digit industry and occupation recodes (OCCUP1A, OCCUP2A, INDSTR1A, and INDSTR2A) based on the 3-digit 1990 Census codes (and, in turn, the 1987 SIC and 1980 SOC) has been eliminated.
Users are advised that the previous coding scheme based on the 3-digit Census codes and
the new coding scheme based on the 4-digit Census codes are entirely different classification systems that are not compatible with one another. Moreover, crosswalks showing how these systems compare to one another are available at this time. However, the coding categories for these recodes are provided in the Industry and Occupation Appendices (following the Variable Layout Report for the Sample Adult file), and additional information is available on-line (see the final paragraph in this section).
While the 2005 NHIS Sample Adult file does not include the 4-digit Census codes, it does
include a detailed occupation recode (OCCUPN1) with 94 distinct categories, while the associated simple recode (OCCUPN2) has 23 categories. These categories are derived from the 2000 New SOC Occupation Subgroups and Major Occupation Groups, respectively, as determined by the U.S. Census Bureau and the Bureau of Labor Statistics. The detailed industry recode (INDSTRN1) informed by the 2002 NAICS has 79 distinct categories, while the associated simple recode (INDSTRN2) has 21 categories. These categories are derived from the 2002 NAICS Industry Subsectors and Sectors, respectively, as identified by Census.
For more information about the 2002 NAICS, please refer to
http://www.census.gov/epcd/www/naics.html. For more information about the 2000 SOC, please refer to http://www.bls.gov/soc/home.htm. To obtain a complete list of 2002 NAICS Sectors and Subsectors and 2000 SOC Major Groups and Subgroups, please see http://www.cdc.gov/nchs/nhis.htm.
II. Adult Conditions Section (ACN)
The ACN section of the 2005 NHIS obtains information from the sample adult as to whether he/she has, or has had, a selected number of medical conditions. In most instances, sample adults were asked whether a doctor or other health professional had told them that they had the condition in question (joint symptoms, pain, hearing, vision impairment, and tooth loss are the exceptions). Respondents are also asked about head colds and intestinal illness which began in the 2 weeks prior to the interview, and women age 18-49 are asked about current pregnancy status. In addition, the section contains information about the sample adult’s current mental or emotional health (whether he/she experienced feelings of sadness, nervousness, restlessness, hopelessness, worthlessness, or that everything was an effort in the past 30 days), and the extent to which these feelings interfered with his/her life or daily activities (Kessler’s “K6” screen for nonspecific psychological distress). For more information about Kessler’s K6 please refer to

54
http://www.hcp.med.harvard.edu/ncs/k6_scales.php. Table 6 shows the specific health-related conditions covered in this section, as well as the various reference periods covered by the questions.

55
Table 6. Sample Adult File: Conditions and Reference Periods
Condition Ever 12 mos.
3 mos.
30 days
2 weeks
Now Other
ACN.010 Hypertension X ACN.020 Hypertension 2+ visits twice ACN.031 Coronary heart disease X ACN.031 Angina pectoris X ACN.031 Heart attack (MI) X ACN.031 Other heart condition or
heart disease X
ACN.031 Stroke X ACN.031 Emphysema X ACN.080 Asthma X ACN.085 Asthma still have X ACN.090 Asthma episode / attack X ACN.100 Asthma ER visit X ACN.110 Ulcer ever told X ACN.120 Ulcer recent X ACN.130 Cancer any X ACN.140 Cancer kind X ACN.150 Cancer when Age ACN.160 Diabetes X ACN.170 Diabetes when Age ACN.180 Insulin X
ACN.190 Oral agents/pills X
ACN.201 Hay fever X ACN.201 Sinusitis X ACN.201 Chronic bronchitis X ACN.201 Weak kidneys X ACN.201 Liver condition X ACN.250 Joint symptoms X ACN.260 Joints affected X ACN.270 Joint symptoms chronic X ACN.280 Joints doctor consult X ACN.290 Arthritis (arthritis, gout,
fibromyalgia, rheumatoid arthritis, lupus) diagnosis
X
ACN.295 Limited in activities due to arthritis/joint symptoms
X
ACN.300 Neck pain X

56
Condition Ever 12 mos.
3 mos.
30 days
2 weeks
Now Other
ACN.310 Back pain X ACN.320 Leg pain X ACN.331 Jaw, face pain X ACN.331 Migraine X ACN.350 Head/chest cold X ACN.360 Intestinal illness X ACN.370 Pregnant X ACN.410 Hearing aid X ACN.420 Hearing X ACN.430 Vision impairment X ACN.440 Blind X ACN.451 Lost all teeth X ACN.471 Sad X ACN.471 Nervous X ACN.471 Restless X ACN.471 Hopeless X ACN.471 Everything an effort X ACN.471 Worthless X
The cancer questions were asked in a format that allowed a respondent who reported
having had cancer to specify up to three types of cancer as well as to indicate that he/she had had more than three different cancers. The responses were recorded with the codes indicated in the questionnaire and were then transformed into “mentioned”/ “not-mentioned” variables during editing. These variables (CNKIND1-31) assign to every sample adult who reported having ever had cancer either a “mentioned,” if he/she specified that particular cancer, a “not mentioned,” if he/she did not specify that cancer, or a “refused,” “don’t know,” or “not ascertained,” if there was no information for any of the cancers. Thus, a sample adult may have a code in each of the cancer variables, but can have only up to three “mentions,” with a fourth mention possible for the variable CNKIND31 (“More than 3 kinds”).
In 2002 there were major changes to core questions about arthritis and joint symptoms.
Those questions remained unchanged through 2005. Users are advised to read the 2002 Survey Description document to learn about those changes. Because of those changes, any comparisons of 2002-2005 arthritis and joint symptom data with data prior to 2002 should be undertaken with caution.
Sample adults who had joint symptoms were asked which joint(s) were involved, and were
given the option to identify up to 16 joints. The format for this question is also a “mentioned”/ “not-mentioned” format. The resulting variables for analysis (JMTHP1-17) have a value of

57
“mentioned” or “not mentioned” (or “refused,” “don’t know,” or “not ascertained”) for each of the 16 joints (including a 17th “other joint not listed”) for each sample adult who was asked the question.
Age questions CANAGE1-30 and DIBAGE (“How old were you when you were
diagnosed [with this condition]?”) are “top coded” to 85+ years to insure confidentiality among the oldest respondents. The recode DIFAGE2 (“How long have you had diabetes” [AGE minus DIBAGE]) is calculated prior to top coding AGE and DIBAGE, but is itself top coded to 83+ years to insure confidentiality. The answers to the age questions were not edited for reasonableness, and some respondents appear to have given the length of time since they were diagnosed rather than their age at diagnosis.
III. Adult Health Status and Limitation of Activity Section (AHS)
The Adult Health Status and Limitation of Activity component of the Sample Adult file contains information from respondents on illness behavior, health status, special equipment, limitations in functional activities, and the conditions underlying such limitations. While the AHS section may seem similar to the FHS section in the Person file, the questions in these sections have a somewhat different focus. For example, both sections asked about the ability to walk without special equipment. However, the walking limitation question in the FHS section (FHS.210) only captured whether a person has difficulty walking without using special equipment. In contrast, the Sample Adult question on walking (AHS.091) asked about the degree of difficulty the respondent has walking a specified distance (a quarter mile, or about three city blocks) by him/herself and without using any special equipment.
The 2005 AHS time variables and recodes, which indicate how long respondents have had the condition(s) causing their limitation(s), were processed using procedures similar to those used in 2002, 2003 and 2004. Substantively, the 2002, 2003, 2004 and 2005 variables and recodes are similar to those from previous years (1997-2001), but the 2002-2005 data contain fewer unknown categories than previously, that is, detailed unknown categories were collapsed into broader categories.
Health Indicators: Illness Behavior and Health Status
The first questions in this section determined the number of days the respondent took off from work or spent in bed due to illness or injury during the 12 months prior to the interview. In addition, respondents were asked to compare their health now (whether it is better, worse, or the same) to their health 12 months ago.
Limitation of Functional Activities
The functional limitation questions in the AHS section asked the respondent to indicate the degree of difficulty he/she would have in performing specific physical tasks (e.g., walking a quarter of a mile, walking up ten steps, standing for two hours, carrying a ten pound object, etc.), and engaging in social activities and recreation (e.g., going shopping, attending club meetings, visiting friends, sewing, reading, etc.) without the assistance of another person or using special

58
equipment. This is in sharp contrast to the questions in the FHS section, which allow only “yes” or “no” responses to questions inquiring whether household members needed help from another person with personal care needs (e.g., bathing, dressing, eating, etc.) or in handling routine tasks (doing everyday chores or shopping).
As in FHS, if the sample adult reported difficulty with any of these 12 activities, he/she was then asked what condition(s) cause the difficulty, as well as how long he/she has had the condition. The format of these condition data is similar to that found in the FHS section.
Conditions
Each sample adult indicating any functional limitation (regardless of the degree of the limitation) is asked about the condition(s) or health problem(s) associated with that limitation, as well as the amount of time he/she has had the condition. Sample adults were given the following fixed response categories: “vision/problem seeing,” “hearing problem,” “arthritis/rheumatism,” “back or neck problem,” “fractures, bone/joint injury,” “other injury,” “heart problem,” “stroke problem,” “hypertension/high blood pressure,” “diabetes,” “lung/breathing problem,” “cancer,” “birth defect,” “mental retardation,” “other developmental problem (e.g., cerebral palsy),” “senility,” “depression/anxiety/emotional problem,” and “weight problem. Starting in 2001 and continuing in 2005, if the sample adult was limited by a condition not listed in one of these 18 fixed categories, the interviewer entered “M” for “More conditions,” and a second screen containing 17 additional condition categories and two “other impairment problem” categories appeared on the interviewer’s laptop computer screen. These conditions were not read aloud to respondents, but if the sample adult’s condition was limited by one of these 17 conditions, the interviewer recorded this information. If the sample adult was limited by a condition not included in one of the 18 fixed categories or on the interviewer’s computer screen, then the interviewer entered a 50-character verbatim response for one or both of the “other impairment problem” categories.
The AHS condition data were edited very much like the condition data in FHS. The verbatim responses recorded by interviewers in one or both of the 50-character fields indicating “other impairment problem,” as well as those in the 17 additional general categories seen by the interviewers, were subsequently analyzed during data processing. While most respondents named “other” conditions that did not fall into the 18 fixed response categories as originally specified in the instrument, some respondents named conditions that should have been included in one of the fixed categories. In the latter case, these “other” responses were assigned codes during data processing corresponding to the appropriate category. An additional 16 ad hoc categories were created, and were assigned numbers 19_ thru 34_. (Note: Due to a naming convention error in 2002 and 2003 these same ad hoc categories were assigned numbers 19 thru 34 without an underscore.) Any verbatim conditions that could not be back-coded to one of the 18 fixed categories or recoded to one of the ad hoc categories remained in the “other impairment” categories, and were renumbered “90” and, if necessary, “91.” In addition, responses in the 17 general categories seen only by the interviewer were also back-coded and categorized into 8 of the ad hoc categories. The resulting 36 categories were generally based on the International Classification of Diseases, Ninth Revision, Clinical Modification (see the FHS section).
59
These specific condition categories were subsequently transformed into variables
indicating whether or not the condition was responsible for the respondent’s difficulty with any functional activity (a mention/not-mention format). Because the 16 ad hoc categories were not included on the flash cards given to respondents during the course of the interview, it is possible that frequencies obtained for these conditions may be underestimates. Therefore, these variables should be analyzed with care. Moreover, none of the AHS condition variables (AFLHCA1 through AFLHCA34_) should be used to estimate prevalence rates for the conditions they represent, because only those sample adults with a previously reported functional limitation were eligible for the condition questions that followed. Analysts who are interested in estimating the prevalence of particular conditions are referred to the Sample Adult Conditions (ACN) section (above).
Recodes
The recode FLA1AR is a summary measure that indicates sample adults who reported any difficulty with any one or more of the functional activities discussed during the course of the AHS section of the interview. In other words, individuals who indicated any degree of difficulty in FLWALK, FLCLIMB, FLSTAND, FLSIT, FLSTOOP, FLREACH, FLGRASP, FLCARRY, FLPUSH, FLSHOP, FLSOCL, or FLRELAX are coded “1” for FLA1AR. This variable includes three response levels: “1” for limited, “2” for not limited, and “3” for unknown if limited. ALCHRONR is based on FLA1AR but adds the additional criterion of whether at least one of the reported causal conditions is a chronic condition. The section also includes time recodes and chronic recodes for each of the 36 categories, which are very similar to those used in the FHS section described above.
Technical Notes
The condition variable AFLHCA31_ includes any causal condition that specifically mentioned “surgery” or “operation,” or otherwise indicates a medical treatment as the causal condition (either ongoing or occurring within the last year). The condition variable AFLHCA33_ includes any causal condition that specifically and solely mentioned “fatigue,” “weakness,” “lack of strength,” “tiredness,” “exhaustion,” etc. without reference to any particular part of the body. Lastly, the condition variable AFLHCA34_ includes any causal condition that specifically and solely mentioned “pregnancy,” “pregnant,” or “childbirth.”
IV. Adult Health Behaviors Section (AHB)
The AHB section of the NHIS Sample Adult questionnaire contains questions related to
cigarette smoking, leisure-time physical activity, alcohol use, height, weight, and sleep. With the exception of a question added in 2004 on sleep, all health behavior questions have been in the NHIS Sample Adult core questionnaire since 1997. For details concerning the history of the Adult Health Behavior section, refer to the Survey Description documents for 1997-2001. In 2004, a few variables were dropped or their universes modified. Please review the 2004 NHIS Survey Description Document, Appendix VIII, for details about these changes within the AHB section. No changes occurred between 2004 and 2005.
60
Smoking
Current smokers are defined as persons who have ever smoked 100 cigarettes and who currently smoke every day or some days. Only one smoking status recode, SMKSTAT2, rather than three during data years 1997-2003, continues on the data file since 2004.
Leisure-time physical activity
The section on leisure-time physical activity is introduced with the following statement: “The next questions are about physical activities (exercise, sports, physically active hobbies...) that you may do in your LEISURE time.” In this section, respondents are asked to summarize their usual leisure-time physical activity – both in terms of frequency and duration. This requires some mental calculations by the respondent. Responses can be offered in terms of any time unit the respondent volunteers (times per day, per week, per month, or per year). A recode converting all responses into frequency in times per week is provided for each type of activity. The set of leisure-time physical activity questions included every year in the sample adult core module is: frequency and duration of vigorous activities, frequency and duration of light or moderate activities, and frequency of strengthening activities. The questions on leisure-time physical activity are used for tracking Healthy People 2010 Objectives 22.1-22.4 and in NHIS Early Release and in Health, United States (beginning in 2005).
Alcohol use
Lifetime drinking status was assessed for all sample adults. Questions related to current drinking behavior were asked of all respondents who had had at least 12 drinks in their lifetime. Respondents were permitted to answer in terms of the number of days they drank per week, per month, or per year. Standardized variables that convert the various time unit responses to standardized units-- that is, days per week (ALC12MWK) and days per year (ALC12MYR)- are provided.
A question asking how often the respondent had five or more drinks in one day during the past year was asked of all adults who drank at least once in the past year. The responses were not edited for consistency with the respondent’s usual quantity or frequency of alcohol consumption because there was no basis for evaluating which one might be the more accurate. Note that the questions related to quantity of alcohol consumption are phrased in terms of the number of drinks consumed in a day and not the number of drinks consumed at a sitting.
ALCSTAT, a new recode begun in 2004, classifies lifetime and current drinking status for
all sample adults. It replaced ALCSTAT1 (1997-2003) and ALC7STAT (2001-2003) and captured, in a single variable, all of the information contained in these two earlier recodes.
ALCSTAT is consistent with the classification of lifetime and current drinking status
shown annually in Health, United States, 2005. The category “current drinker, level unknown” is slightly different from the category of the same name in the earlier variable, ALC7STAT. Since

61
2004, adults who said they did not know how often they drank were not asked the question about usual number of drinks (ALCAMT) and are classified as “drinking status unknown” in ALCSTAT. In contrast, in the earlier variable (ALC7STAT), adults who said they did not know the frequency of their alcohol consumption were asked the question about number of drinks (ALCAMT); those few (less than 0.5% of sample adults) who answered the second question without having answered the first were classified as “current drinkers, level unknown” in ALC7STAT.
Since 2004, the category “former drinker, frequency unknown” (ALCSTAT=4) includes
former drinkers for whom information is not available on whether or not they had 12 or more drinks in any one year. Previously, in ALC7STAT, this category of former drinker was combined with “unknown drinking status” (ALC7STAT=9). ALCSTAT can be created by the data user relatively easily for data years in which both ALCSTAT1 and ALC7STAT appear (2001-2003). Creating ALCSTAT for data years prior to 2001 can be done, but the coding is quite complex.
Body weight and height
Sample adults were asked to estimate their current height and weight. In cases where very large or very small values were reported for either height or weight, the data for both variables were changed to “96” or “996” (“Not available”) on the public use data file. This was done in order to protect the confidentiality of NHIS respondents who might be identifiable by their unusual physical characteristics. No physical measurements were taken. National estimates based on physical measurements, such as those available from NCHS’ National Health and Nutrition Examination Survey may differ from those available from the NHIS, which are self-reported.
Body Mass Index (BMI) is a recode of the height and weight data, calculated using the formula: BMI = kilograms /meters². Although respondents had the option of answering in metric units, less than 1% of respondents did so. For purposes of calculating BMI, responses provided in U.S. Customary units were converted to metric units using the following factors: 1 kilogram = 2.205 pounds; 1 meter = 39.37 inches. BMI was calculated for all persons who provided height and weight, including those for whom specific height and weight values were changed to “96” and “996” (not available) on the public use file for reasons of confidentiality. The values for the BMI include two implied decimals. Consistent with criteria established by the World Health Organization, the following classification of body weight status is suggested for both men and women: underweight (BMI < 18.5); healthy weight (18.5 <= BMI < 25); overweight, but not obese (25 <= BMI < 30); overweight, including obese (BMI >= 25); and obese (BMI >= 30).
Sleep
A question asking about usual number of hours of sleep continues in 2005. A question on sleep was previously asked in the NHIS in 1990 as part of the Health Promotion and Disease Prevention Supplement.

62
V. Adult Health Care Access and Utilization Section (AAU)
The core Adult Health Care Access and Utilization (AAU) section of the 2005 NHIS has remained largely unchanged since 1997 and contains information on access to health care, dental care, health care provider contacts, and immunizations.
Questions regarding access to health care include having a usual place for sick care, having a usual place for routine/preventive care, change in the place of care, any delays in getting medical care, and instances of being unable to afford medical care. The question about the reason for delaying care focused on such access issues as transportation, getting an appointment, and waiting time prior to actually seeing the doctor. A question on dental care asked about the length of time since last dental visit.
Respondents were asked about health care provider contacts, including questions about doctor contacts during the past 12 months. Doctor visit probe questions allow for visits not only from medical doctors but from a variety of other health care professionals, including chiropractors. Questions about home care are included as well as a question asking about the number of visits to a hospital emergency room in the past 12 months. There is also a question that asks how long it has been since the respondent has seen or talked to a doctor.
There are several questions related to adult immunizations: flu shot, nasal spray flu vaccine, pneumonia vaccination, and the hepatitis B vaccine. Additional questions inquire whether the respondent had ever had chickenpox or had chickenpox in the past 12 months, had ever had hepatitis, or had ever lived with someone with hepatitis.
Technical notes
Beginning in 2005, new questions were added to the instrument that ask respondents the month and year of their most recent flu shot (ASHFLU_M and ASHFLU_Y,) and the month and year of their most recent nasal spray flu vaccine (ASPFLU_M and ASPFLU_Y).
Analysts are advised to read the notes in the Dataset Documentation for further information
pertaining to any changes that may have occurred and to compare the 2005 Dataset Documentation to documentation from the 2004 (and earlier) NHIS for any other changes that may have occurred over time to the variables in this section.
VI. Adult AIDS Section (ADS)
This section contains a series of questions related to testing for HIV, the virus that causes
AIDS. Respondents were asked whether they had ever donated blood and whether they had a blood test for HIV, their main reasons for getting or not getting tested, when they had their last test, the number of times they had been tested, and where (the location/facility) the testing was done. The section also contains questions on respondents’ plans for being tested in the future and their reasons for those plans, as well as their perceived personal risk for getting AIDS. With some modifications and additions, these questions are similar to those asked in the AIDS Knowledge and Attitudes Supplements that were included in the NHIS from 1987 to 1995.

63
Beginning in 2000, questions on sexually transmitted diseases (STDs) and tuberculosis
(TB) are included in this section. These questions asked respondents whether they had an STD other than HIV or AIDS, whether they saw a doctor or health professional, and the location/facility to which they went to be checked. In addition to STD questions, respondents were also asked about TB, whether they had heard of it, how much they knew about it, and if they knew anyone personally with the disease. In addition, respondents were asked about their perceived personal risk of getting TB, and if, in their opinion, TB could be cured.

64
2005 National Health Interview Survey Cancer Control Module
The Cancer Control Module was a 2005 NHIS supplement that consisted of six sections
covering diet and nutrition, physical activity, tobacco, cancer screening, genetic testing, and family history. These sections are described in greater detail below. Those respondents who served as sample adults for each household also participated in the Cancer Control Module. As a result of the large number of variables derived from the Cancer Control Module, NHIS staff decided to create a separate, stand-alone file for the cancer variables, rather than append the variables to the 2005 Sample Adult file.
Although all sample adults were to be asked the questions in the Cancer Control Module,
some persons did not complete the supplement. Persons who did not give responses to any of the questions in the supplement had a value of “not ascertained” inserted in the appropriate fields in the Cancer Control Module file. These persons were given a coded value of “1” for the Cancer Control Module record completion status variable (COMPSTAT), which indicates that their record only contains responses of “not ascertained.” In other words, these respondents are retained in the file, but they are coded as “8” in all the relevant fields of the Cancer Control Module file. All persons who met the criteria for completing the supplement were given a coded value of “2” (all answers refused or don’t know), “3” (all answers refused, DK, or not ascertained), or “4” (at least one valid answer) for the record completion status variable.
Background
The first cancer supplement to the National Health Interview Survey (NHIS) was fielded in 1987. It consisted of two supplement “booklets”, or instruments, entitled, “Cancer Control” and the “Epidemiology Study”. The topics in the Cancer Control section were acculturation, medical care, food knowledge, general knowledge and attitudes, cancer screening knowledge and practice, smoking habits, former smoker, current smoker, other tobacco use, occupational exposure, height and weight. Topics in the Epidemiology Study were acculturation, food frequency, vitamin and mineral intake, food knowledge, smoking habits, other tobacco use, reproduction and hormone use, family history of cancer, occupational exposure, height, weight, and relationships and social activities. Because these booklets both contained at least one very long section, each was administered to only a half-sample of adult respondents (except for those topics that were included in both booklets, which were asked of the full sample).
The cancer supplement was repeated in 1992 as the “Cancer Risk Factor Survey”. The
design was the same as in 1987, with a split sample and two booklets (i.e., instruments). The topics included in the “Cancer Control” booklet were acculturation, access to medical care, height and weight, cancer screening knowledge and practice, cancer survivorship, general knowledge and attitudes, smoking habits, current smoker, former smoker, other tobacco use, and workplace tobacco smoke. Topics in the “Epidemiology Study” were acculturation, food frequency, vitamin and mineral intake, height and weight, food knowledge, cancer survivorship, smoking habits, and occupational exposure. The 1992 cancer supplement was administered to
65
about a half sample of adult respondents, due to budgetary constraints, which reduced the response in many sections to about a quarter of the sample.
In 2000, the NHIS fielded a cancer supplement called the “Cancer Control Module”,
which again utilized adult respondents and covered many of the same topics as the previous cancer supplements. The split-sample design used in previous NHIS cancer supplements was dropped in order to increase the statistical power for population subgroups, and to allow the 2000 Cancer Control Module to be appended to the Sample Adult Core. The 2000 NHIS Cancer Control Module asked questions about Hispanic acculturation, diet and nutrition, physical activity, tobacco, cancer screening, genetic testing, and family history. Because the redesigned NHIS core included permanent sections on cigarette smoking, alcohol intake, and leisure-time physical activity, these topics were not covered by the 2000 supplement.
In 2003, the NHIS fielded another supplement, the Cancer Screening Module, which
included 27 of the 97 questions fielded in the 2000 Cancer Control Module cancer screening section (NAF).
The 2005 Cancer Control Module is similar to the 2000 Cancer Control Module. Six of
the seven sections found in the 2000 Cancer Control Module (diet and nutrition, physical activity, tobacco, cancer screening, genetic testing, and family history) are also found in the 2005 Cancer Control Module. While the section topics have remained the same, there have been minor changes to question wording or response categories. In addition, some questions from 2000 have been removed and new questions have been added. The Hispanic Acculturation section is the only section not included in the 2005 Cancer Control Module, although, one question about the language used most often by the respondent was added to the beginning of the Diet and Nutrition section.
I. Diet and Nutrition (NAC)
The Diet and Nutrition section (NAC) of the 2005 Cancer Control Module collected
information about selected foods consumed by the sample adult during the past month. Data were collected on the number of times the sample adult ate or drank hot or cold cereal, milk, soda, 100% fruit juice, fruit drink, fruit, salad, fries, other white potatoes, beans, other vegetables, tomato sauce, salsa, red meat, whole grain bread, donuts, cookies, and cheese. Responses about the number of times a particular item was eaten were reported in terms of daily, weekly, or monthly consumption. In addition, respondents were asked about their use of multi-vitamins, beta carotene, vitamin E, calcium, selenium, and herbal or botanical supplements during the past 12 months. All sample adults were asked about their use of medication to reduce cholesterol levels and various pain medications. Male sample adults were also asked about their use of medications for hair loss treatments or prostate problems.
II. Physical Activity (NAD)
The Physical Activity section (NAD) of the 2005 Cancer Control Module collected
information about daily physical activity. All sample adults were asked about walking for transportation, and those who were able to walk were also asked about walking for fun,

66
relaxation, or exercise. All sample adults were then asked the extent to which they “move around” during their usual daily activities (excluding leisure-time activities), the extent to which they lift or carry things while performing their usual daily activities (again, excluding leisure-time activities), the average number of hours per day that they spend in a sitting position (separate questions distinguish weekdays from weekends), and whether a doctor or other health professional had recommended in the past 12 months that they begin or continue exercise or physical activity.
III. Tobacco (NAE)
The Tobacco section of the 2005 Cancer Control Module collected smoking/tobacco-
related information from every sample adult in the NHIS interviewed sample. All sample adults were asked if they had ever smoked a pipe, a cigar, a bidi, or used snuff or chewing tobacco. Those respondents who answered affirmatively were then asked if they currently used these products. All sample adults were also asked questions about anyone smoking cigarettes, cigars, or pipes inside their home. Additionally, those sample adults who had seen or talked to a doctor or other health care professional in the past 12 months were asked whether that medical professional had asked about their consumption of any tobacco products.
In addition to the above questions, those sample adults who had already indicated in the
AHB section of the Sample Adult Core that they were former smokers were asked whether they had ever used menthol cigarettes. They were also asked about the method(s) they had used to quit smoking (when they stopped smoking completely). Those sample adults who had previously indicated that they were current smokers were asked whether they had ever used menthol cigarettes, whether they had ever tried to quit smoking, and the method(s) they used the last time they tried to stop smoking. Current smokers and former smokers who had quit within the past 12 months who indicated that they had seen a doctor or other health professional in the past 12 months were also asked whether that medical professional had advised them to quit smoking.
The final five questions in the section asked all female sample adults 18 to 49 years of
age who had given birth to a live born infant within the past five years about their smoking habits during their pregnancy.
IV. Cancer Screening (NAF)
The Cancer Screening section (NAF) of the 2005 Cancer Control Module collected
information about selected cancer screening tests received by the sample adult, including skin exams, Pap smear tests, mammograms, clinical breast exams, prostate specific antigen (PSA) tests, colorectal screening exams, and fecal occult blood (FOB) tests (performed in a doctor’s office and at home). The recommendations for having different screening exams differ by age and sex; these criteria were taken into account when asking about the different exams during the course of the interview. All sample adults were asked questions about a previous skin exam, and all female sample adults were asked the questions about a previous Pap smear test. Female sample adults 30 years of age and older were asked questions regarding a prior mammography/clinical breast exam, and male sample adults 40 years of age and older were

67
asked questions regarding a prior PSA test. All sample adults 40 years of age and older were asked a question regarding a prior colorectal screening exam/FOB test. Respondents who indicated that they had had a particular cancer screening exam were subsequently asked if abnormal results were obtained, and if so, what additional tests and/or surgery were performed.
For each type of cancer screening exam, respondents who indicated that they had had the
exam were asked the number of exams in a certain period of time: six years for mammograms and Pap smear tests, three years for FOB tests, ten years for colorectal exams, and five years for PSA tests. Respondents were asked when the most recent screening exam occurred (month/year, number of days/weeks/months/years ago, or time interval grouping).
In the 2005 NAF section there are no recodes of the time-of-cancer-screening variables
(in earlier years recoded as RPAP_MO2, RPAP3, etc.) as the skip pattern and wording of the time variables changed slightly, and it was felt that there would now be enough information available to the users to combine those variables if they wish, without the imputation previously used in the recodes.
The NAF section also contains information on live births and birth control use among
female sample adults 18 years of age and older. Female sample adults 30 years of age and older were asked about their use of hormone replacement therapy, and their use of Tamoxifen and Raloxifen (for cancer prevention or therapy). In addition, appropriate respondents were asked their reasons for not having ever had particular screening exams (e.g., Pap smear tests, mammograms, colorectal screening exams, and FOB tests), or for not having had them within a specified time period. Respondents were also asked whether a doctor or other healthcare professional had recommended (in the last 12 months) that they receive the screening exam in question.
V. Genetic Testing (NAG)
The Genetic Testing section of the 2005 Cancer Control Module collected information
about genetic testing for cancer risk from every sample adult in the NHIS interviewed sample. Respondents were told at the outset of this section that genetic testing for cancer risk involved testing a person’s blood to see if he/she carries genes that may predict a greater chance of developing cancer at some point in his/her life, and that such tests did not include diagnostic procedures to determine if the person currently had cancer. Respondents were then asked whether they had ever heard of this kind of genetic testing. Those respondents who answered affirmatively were then asked whether they had ever discussed the possibility of undergoing such a test with a doctor or other health professional, whether they had been advised by a doctor or health professional to have such a test performed, and whether they had taken a genetic test to determine their risk of cancer. If they indicated that they had undergone genetic testing, they were asked for details about the test, such as the type of genetic test taken, the date of the most recent genetic test, and whether they thought that having such a test might affect their health insurance coverage. All sample adults were also asked whether they felt they were “more likely”, “less likely”, or “about as likely” as the average man/woman their age to get cancer or colon or rectal cancer, and only female sample adults were asked the same question about breast cancer.

68
Analysts are strongly cautioned regarding their use of the data in the Genetic Testing
section. In examining the data, it was discovered that even though there was an explanation of genetic testing for cancer risk in the introduction to the section, some answers were invalid or unreliable. Some respondents reported having genetic tests for cancer risk that did not exist at the time of the survey and other respondents reported they had taken a genetic test for risk of a specific cancer before the year the test was available.
VI. Family History (NAH)
The questions in the Family History section (NAH) of the 2000 Cancer Control Module
were asked of all sample adults. Respondents were asked whether their biological father or mother had ever had cancer of any kind. If a "yes" response was obtained, the respondent was then asked to specify the type of cancer (up to three specific types, and if there were more than 3 types) and whether the parent in question was less than 50 years of age when the cancer was first diagnosed. The NHIS also collected information on the number of "full" brothers and sisters (same biological mother and father), the number of siblings diagnosed with a particular type of cancer (up to three specific types, and if there were more than 3 types), and the number of siblings who were less than 50 years of age when the cancer was first diagnosed. The NHIS further collected information on the number of "full" (biological) sons and daughters, the number of children diagnosed with a particular type of cancer (up to two specific types, and if there were more than 2 types), and the number of children who were less than 50 years of age when the cancer was first diagnosed.
69
2005 National Health Interview Survey Recontact Section
The Recontact Section includes questions about cellular phone use. The purpose of the
cellular phone questions is to track the prevalence of wireless telephones in American families over time, allowing researchers to analyze the demographic characteristics of families who may have substituted wireless service for a home telephone (land-line). Having these data from a large population-based survey such as the NHIS could aid in improving the quality of random digit dial telephone surveys, which are dependent on accurate phone listings. These questions (REC.131 – REC.141) from the 2005 survey instrument can be found on the DHIS Web site at: http://www.cdc.gov/nchs/nhis.htm.
In 2005 two new variables were added to this section. The first variable, RH1LNGDY,
asked about the number of days that the family was without non-cellular telephone service. The second variable, RH2LNGDY, asked about the number of days that the family was without non-cellular telephone service due to weather or natural disasters.

70
Guidelines for Citation of Data Source
With the goal of mutual benefit, the National Center for Health Statistics (NCHS) requests that recipients of data files cooperate in certain actions related to their use. Any published material derived from the 2005 data should acknowledge NCHS as the original source. The suggested citation to appear at the bottom of all tables and graphs is as follows:
Data Source: National Center for Health Statistics (2005)
In a bibliography, the suggested citation should read:
National Center for Health Statistics (2006). Data File Documentation, National Health Interview Survey, 2005 (machine readable data file and documentation). National Center for Health Statistics, Centers for Disease Control and Prevention, Hyattsville, Maryland.
The published material should also include a disclaimer that credits any analyses,
interpretations, or conclusions reached to the author (recipient of the data file) and not to NCHS, which is responsible only for the initial data. Users who wish to publish a technical description of the data should make a reasonable effort to insure that the description is consistent with that published by NCHS.
Information on how to cite electronic media is available at: http://www.cdc.gov/nchs/howto/citelec.htm.
71
References
Achenbach and Edelbrock. (1983). Manual for the Child Behavior Checklist and Revised Child Behavior Profile. University of Vermont, Department of Psychiatry. DeNavas-Walt C, Proctor BD, Lee CH. U.S. Census Bureau. Current Population Reports, P60-229. Income, Poverty, and Health Insurance Coverage in the United States: 2004. U.S. Government Printing Office. Washington, DC. 2005. Metropolitan Life Insurance Company. (1983). 1983 Metropolitan height and weight tables. Statistical Bulletin Metropolitan Insurance Company 64:1. National Center for Health Statistics. (2004) Health, United States, 2004. Hyattsville, Maryland. National Center for Health Statistics. (1999). National Health Interview Survey: Research for the 1995-2004 Redesign. Vital Health Stat 2(126). Shah, B.V., Barnwell, B.G. and Bieler, G.S. (1997). SUDAAN User’s Manual; Release 7.5, Research Triangle Institute, Research Triangle Park, NC. U.S. Department of Health and Human Services. Healthy People 2010. 2nd Ed. With Understanding and Improving Health and Objectives for Improving Health. 2 vols. Washington: U.S. Government Printing Office, November, 2000. Warner M, Schenker N, Heinen MA, Fingerhut LA. The effects of recall on reporting injury and poisoning episodes in the National Health Interview Survey. Injury Prevention 2005;11(5):282-7.
72
Appendix I
Calculation of Response Rates for the 2005 NHIS
The redesigned NHIS incorporated a change from the previous paper and pencil
questionnaire to a new computer assisted personal interviewing (CAPI) system. The response rates calculated here pertain to the Basic Module questions in the 2005 NHIS.
The Basic Module collects basic information on the household and all family members. In
addition, for each family, more detailed information is collected on one sample adult, and one sample child, if any.
Household Response Rate
)HouseholdsResponseNonATypeHouseholdsed(InterviewHousholds)ed(Interview
−+
The Household (HH) response rate is calculated by dividing the number of responding
households by the number of households that are in-scope or eligible for the survey. Note that Type A non-response households are eligible households that were not interviewed for a variety of reasons: language problems; no one was at home after repeated contact attempts; family temporarily absent; refusal; household records rejected for insufficient data; household records rejected for other CAPI related problems; or other reasons for no interview.
Conditional Family Response Rate
Family Core data were collected from the respondent about all persons in the family. The response rates for the Family Core can be calculated in two ways: conditionally and finally. The conditional Family response rate is the rate only for those families identified as eligible and does not take into account household non-response. The conditional Family response rate is calculated by dividing the number of responding families by the number of families that are eligible for the survey, that is, from interviewed households. Note that a household can have multiple families, and rejected families are families that were deleted from interviewed households because of insufficient data.
HHs))dInterviewe(fromFamiliesRejectedFamiliesed(InterviewFamilies)ed(Interview
+

73
Final Family Core Response Rate
( )RateResponseHouseholdHHs))dInterviewe(fromFamiliesRejecteded(Interview
Families)ed(Interview+
The final Family response rate is the rate for those families identified as eligible that takes into account household non-response. The final Family response rate is calculated by dividing the number of responding families by the number of families that are eligible for the survey, that is, from interviewed households, and then multiplying this quotient by the Household response rate.
Conditional Sample Child Response Rate
The response rates for the Sample Child section can be calculated in two ways: conditionally and finally. The conditional Sample Child response rate is the rate only for sample children and does not take into account household or family non-response. The conditional Sample Child response rate is calculated by dividing the number of responding sample children by the number of eligible sample children from interviewed families
Final Sample Child Response Rate
( )RatesponseReFamilyFinal)FamiliesdInterviewefromChildrenSampleEligible(
)ChildrenSampledInterviewe(
The final Sample Child response rate is the rate for sample children that takes into account household and family non-response. The final Sample Child response rate is calculated by dividing the number of responding sample children by the number of sample children who are eligible for the survey, that is, from interviewed families, and then multiplying this quotient by the final Family response rate.
(Interviewed Sample Children)(Eligible Sample Children)
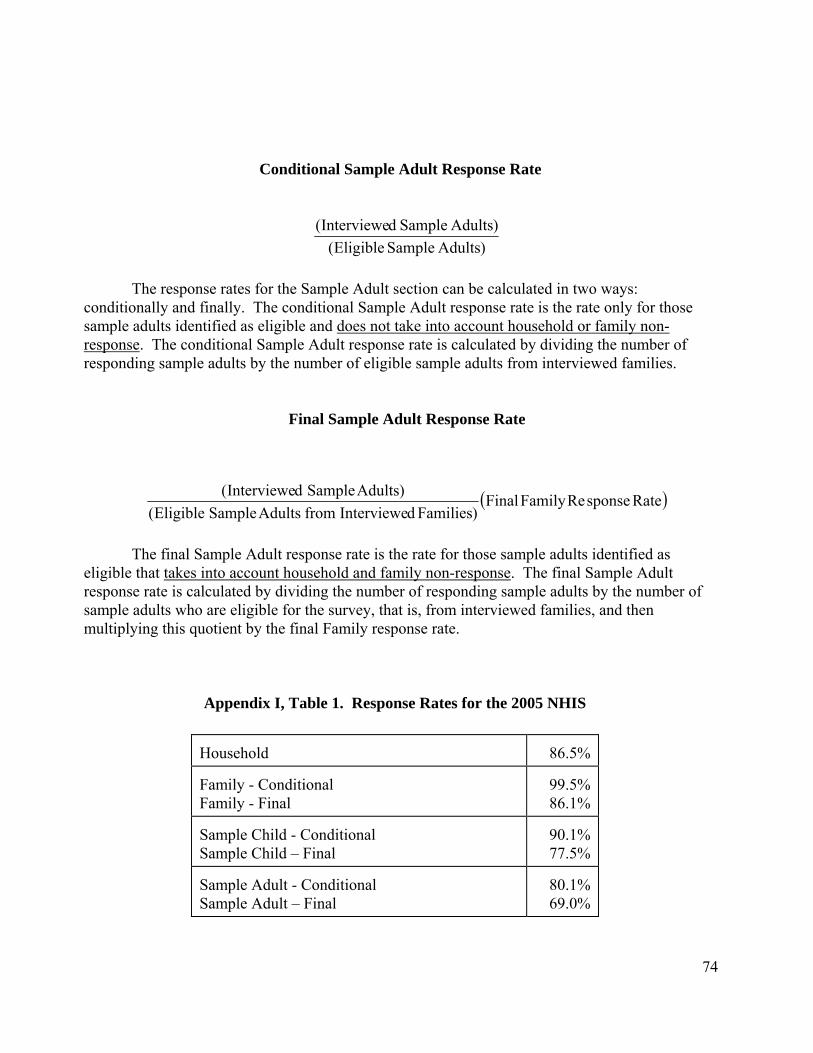
74
Conditional Sample Adult Response Rate
)AdultsSampleEligible()AdultsSampledInterviewe(
The response rates for the Sample Adult section can be calculated in two ways:
conditionally and finally. The conditional Sample Adult response rate is the rate only for those sample adults identified as eligible and does not take into account household or family non-response. The conditional Sample Adult response rate is calculated by dividing the number of responding sample adults by the number of eligible sample adults from interviewed families.
Final Sample Adult Response Rate
The final Sample Adult response rate is the rate for those sample adults identified as
eligible that takes into account household and family non-response. The final Sample Adult response rate is calculated by dividing the number of responding sample adults by the number of sample adults who are eligible for the survey, that is, from interviewed families, and then multiplying this quotient by the final Family response rate.
Appendix I, Table 1. Response Rates for the 2005 NHIS Household
86.5%
Family - Conditional Family - Final
99.5% 86.1%
Sample Child - Conditional Sample Child – Final
90.1% 77.5%
Sample Adult - Conditional Sample Adult – Final
80.1% 69.0%
( )RatesponseReFamilyFinal)FamiliesdInterviewefromAdultsSampleEligible(
)AdultsSampledInterviewe(

75
Calculation of Response Rates for Combined NHIS Data Years
The response rates for combined NHIS data years are calculated in the same basic way as for a single year. The following examples are shown for two years of data. Similar methods apply for multiple years of data with the same sample design used in 1997-2005.
Household Response Rate for Combined Data Years
)2and1YearsforHouseholdssponseReNonAType2and1Yearsfor Householdsed(Interview)2and1YearsforHouseholdsdInterviewe(
−+
The Household response rate for combined data years is calculated by dividing the number of responding households for Years 1 and 2 by the number of households that are in-scope or eligible for the survey for Years 1 and 2. Note that Type A non-response households are eligible households that were not interviewed for a variety of reasons: language problems; no one was at home after repeated contact attempts; family temporarily absent; refusal; household records rejected for insufficient data; household records rejected for other CAPI related problems; or other reasons for no interview.
Conditional Family Response Rate for Combined Data Years
Family Core data were collected from the respondent about all persons in the family. The
response rates for the Family Core can be calculated in two ways: conditionally and finally. The conditional Family response rate is the rate only for those families identified as eligible and does not take into account household non-response. The conditional Family response rate for combined data years is calculated by dividing the number of responding families in Years 1 and 2 by the number of families that are eligible for the survey in Years 1 and 2, that is, from interviewed households in Years 1 and 2. Note that a household can have multiple families, and rejected families are families that were deleted from interviewed households because of insufficient data.
(Interviewed Families for Years 1 and 2)(Interviewed Families for Years 1 and 2 + Rejected Families for Years 1 and 2)

76
Final Family Response Rate for Combined Data Years
⎟⎟⎠
⎞⎜⎜⎝
⎛
⎟⎟⎠
⎞⎜⎜⎝
⎛ + 2and1YearsforRatesponseReHousehold
2and1YearsforHHsdInterviewefromFamiliesRejected2and1YearsforFamiliesdInterviewe)2and1YearsforFamiliesdInterviewe(
The final Family response rate is the rate for those families identified as eligible that takes into account household non-response. The final Family response rate for combined data years is calculated by dividing the number of responding families for Years 1 and 2 by the number of families that are eligible for the survey for Years 1 and 2, that is, from interviewed households for Years 1 and 2, and then multiplying this quotient by the Household response rate for the combined data years.
Conditional Sample Child Response Rate for Combined Data Years
(Interviewed Sample Children for Years 1 and 2)(Eligible Sample Children for Years 1 and 2)
The response rates for the Sample Child section can be calculated in two ways: conditionally and finally. The conditional Sample Child response rate is the rate only for sample children and does not take into account household or family non-response. The conditional Sample Child response rate for combined data years is calculated by dividing the number of responding sample children for Years 1 and 2 by the number of eligible sample children from interviewed families for Years 1 and 2.
Final Sample Child Response Rate for Combined Data Years
⎟⎟⎠
⎞⎜⎜⎝
⎛2and1YearsforRate
sponseReFamilyFinal)2and1YearsforFamiliesdInterviewefromChildrenSampleEligible(
)2and1YearsforChildrenSampledInterviewe(
The final Sample Child response rate is the rate for sample children that takes into account household and family non-response. The final Sample Child response rate for combined data years is calculated by dividing the number of responding sample children for Year 1 and Year 2 by the number of sample children who are eligible for the survey, that is, from interviewed families for Year 1 and Year 2, and then multiplying this quotient by the final Family response rate for the combined data years.
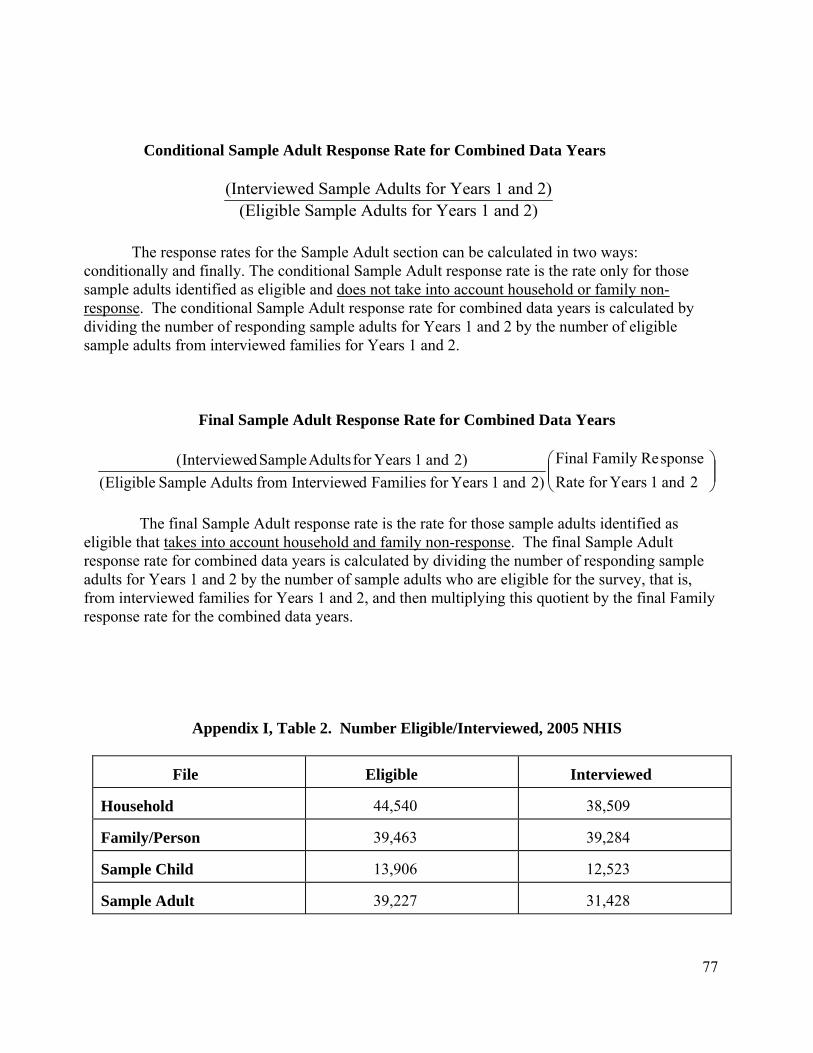
77
Conditional Sample Adult Response Rate for Combined Data Years
(Interviewed Sample Adults for Years 1 and 2)(Eligible Sample Adults for Years 1 and 2)
The response rates for the Sample Adult section can be calculated in two ways:
conditionally and finally. The conditional Sample Adult response rate is the rate only for those sample adults identified as eligible and does not take into account household or family non-response. The conditional Sample Adult response rate for combined data years is calculated by dividing the number of responding sample adults for Years 1 and 2 by the number of eligible sample adults from interviewed families for Years 1 and 2.
Final Sample Adult Response Rate for Combined Data Years
⎟⎟⎠
⎞⎜⎜⎝
⎛2and1YearsforRate
sponseReFamilyFinal)2and1YearsforFamiliesdInterviewefromAdultsSampleEligible(
)2and1YearsforAdultsSampledInterviewe(
The final Sample Adult response rate is the rate for those sample adults identified as
eligible that takes into account household and family non-response. The final Sample Adult response rate for combined data years is calculated by dividing the number of responding sample adults for Years 1 and 2 by the number of sample adults who are eligible for the survey, that is, from interviewed families for Years 1 and 2, and then multiplying this quotient by the final Family response rate for the combined data years.
Appendix I, Table 2. Number Eligible/Interviewed, 2005 NHIS
File
Eligible
Interviewed
Household
44,540
38,509
Family/Person
39,463
39,284
Sample Child
13,906
12,523
Sample Adult
39,227
31,428

78
Appendix I, Table 3. Number Eligible/Interviewed, 2004 NHIS
File
Eligible
Interviewed
Household
42,089
36,579
Family/Person
37,653
37,466
Sample Child
13,538
12,424
Sample Adult
37,388
31,326
Appendix I, Table 4. Number Eligible/Interviewed, 2003 NHIS File
Eligible
Interviewed
Household
40,266
35,921
Family/Person
37,126
36,573
Sample Child
13,275
12,249
Immunization
13,275
11,665
Sample Adult
36,524
30,852
Appendix I, Table 5. Number Eligible/Interviewed, 2002 NHIS File
Eligible
Interviewed
Household
40,377
36,161
Family/Person
37,458
36,831
Sample Child
13,570
12,524
Immunization
13,865
13,611
Sample Adult
36,787
31,044
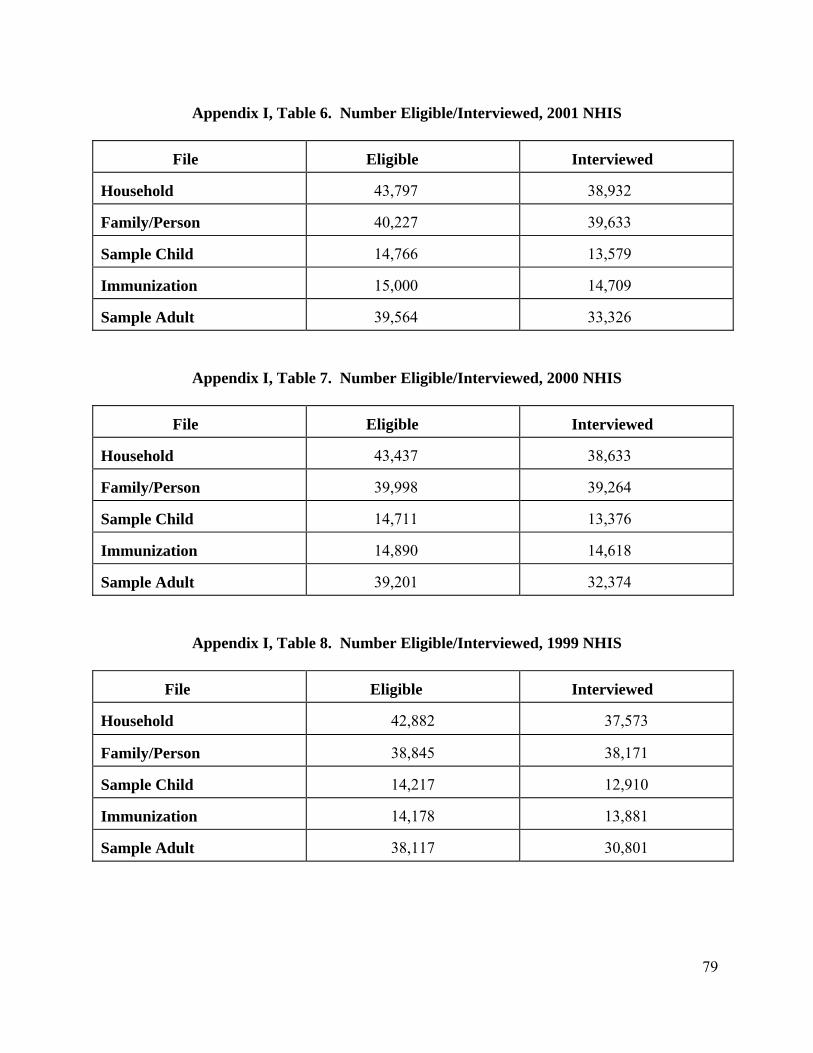
79
Appendix I, Table 6. Number Eligible/Interviewed, 2001 NHIS
File
Eligible
Interviewed
Household
43,797
38,932
Family/Person
40,227
39,633
Sample Child
14,766
13,579
Immunization
15,000
14,709
Sample Adult
39,564
33,326
Appendix I, Table 7. Number Eligible/Interviewed, 2000 NHIS
File
Eligible
Interviewed
Household
43,437
38,633
Family/Person
39,998
39,264
Sample Child
14,711
13,376
Immunization
14,890
14,618
Sample Adult
39,201
32,374
Appendix I, Table 8. Number Eligible/Interviewed, 1999 NHIS
File
Eligible
Interviewed
Household
42,882
37,573
Family/Person
38,845
38,171
Sample Child
14,217
12,910
Immunization
14,178
13,881
Sample Adult
38,117
30,801

80
Appendix I, Table 9. Number Eligible/Interviewed, 1998 NHIS
File
Eligible
Interviewed
Household
42,440
38,209
Family/Person
39,559
38,773
Sample Child
14,619
13,645
Prevention Sample Child
13,645
13,610
Immunization
15,041
14,775
Sample Adult
38,729
32,440
Prevention Sample Adult
32,440
31,882
Appendix I, Table 10. Number Eligible/Interviewed, 1997 NHIS
File
Eligible
Interviewed
Household
43,370
39,832
Family/Person
41,291
40,623
Sample Child
15,244
14,290
Immunization
15,558
15,402
Sample Adult
40,552
36,116
81
Appendix II
Race and Hispanic Origin in the 2005 NHIS
Background
For over 20 years, the National Health Interview Survey (NHIS) has collected information on the race and ethnicity of its respondents, following guidelines set forth by the Office of Management and Budget in a policy known as OMB Directive 15 (Office of Management and Budget, 1977). The NHIS has relied on respondents to provide self-identified race and ethnicity information (proxy information is reported for children and non-present household members), although interviewer-observed race was also recorded through 1996, the last year of the paper questionnaire. NHIS data are routinely tabulated by race and ethnicity in NCHS publications such as Summary Health Statistics, Health U.S., and Advance Data reports.
In response to the changing demographics of the U.S. population, the OMB revised
Directive 15 in 1997 after an extensive period of research and public commentary. The new race and ethnicity standards allow respondents to the Census and federal surveys to indicate more than one race group in answering questions on race. A complete description of the new OMB guidelines on the collection of racial and ethnic data, including descriptions of the new race categories, the ordering of race and ethnicity questions, and guidelines for the tabulation and publication of data under the new standards can be found on the OMB web site: http://www.whitehouse.gov/omb/inforeg/statpolicy.html . In accordance with this requirement, the NHIS became fully compliant with the new race and ethnicity standards with the fielding of the 1999 questionnaire, although the NHIS had been following some aspects of the new guidelines for many years. This policy was expected to be fully implemented across the federal statistical system beginning with the 2003 calendar year.
As noted previously, the U.S. Census Bureau is the data collection agent for the NHIS, as it
is for a number of other federal surveys. The Census Bureau also provides the control totals for race/ethnicity (along with sex and age) that are used in the post-stratification adjustment of the person weights in the NHIS data file. In order to maintain consistency with the Census Bureau procedures for collecting and editing data on race and ethnicity, the NHIS made major changes to its editing procedures in the 2003 data year. Beginning in the 2003 NHIS, “Other race” is no longer available as a separate race response. This response category is treated as missing, and the race is imputed if this was the only race response. In cases where “Other race” was mentioned along with one or more OMB race groups, the “Other race” response is dropped, and the OMB race group information is retained. These editing changes are consistent with the procedures that the Census Bureau uses to create the Modified Race Data Summary File, which is the data file that provides the population control controls used in weighting the NHIS data. More information about the Modified Race Data Summary File and the editing procedures used to create it can be found at the following web site: http://www.census.gov/popest/archives/files/MRSF-01-US1.html. These editing changes remain in effect for the 2005 data file. Please refer to the 2005 Variable Layout Report for more information.

82
Race and Hispanic Origin Questions in the National Health Interview Survey
The 2005 NHIS included two questions about Hispanic Origin:
“Do/Does {you/name} consider {yourself / himself / herself} Hispanic / Latino?” [HHC.170], and
“Please give me the number of the group that represents your Hispanic Origin or ancestry” [HHC.180; response categories shown to the respondent on a flashcard].
There were no changes in the wording of the 2005 Hispanic origin question, but some responses were imputed, and the variable name is labeled as HISPAN_I to indicate this fact (see section on the imputation of race and ethnicity later in this document).
The 2005 NHIS included two race questions to obtain information on a respondent’s race:
“What race {does/do} {name/you} consider {himself/herself/yourself} to be? Please select one or more of the following groups.” [HHC.200; response categories shown to the respondent on a flashcard], and
“Which one of these groups, that is (FR: READ GROUPS) would you say BEST represents {your/name’s} race?” [HHC.220; response categories given are read back to the respondent by the interviewer].
The first question is asked of all respondents, while the second question is asked only of those respondents who give more than one race in response to the first question. Although the wording and placement of these two questions are basically the same as they had been in the NHIS for the past several years, there were changes made to the response categories effective 1999. In compliance with the new race and ethnicity data collection standards, the category “Asian and Pacific Islander” is now split into two categories, “Asian” and “Native Hawaiian and Other Pacific Islander.” Because confidentiality regulations on minimum sample size do not permit the NHIS to release data for Native Hawaiians and Other Pacific Islanders or some Asian subgroups separately, public use data are provided for the three largest Asian subpopulation groups, while the “Other Pacific Islander” and “Other Asian” categories combine the remaining groups that cannot be shown separately.
The following table summarizes the Hispanic origin and race variables in the 2005 data
file. Details on the specific response categories for the race questions and additional details on these variables can be found in the 2005 public use Variable Layout Report, and users are strongly urged to read these descriptions carefully to determine how and when the variables should be used in analysis. Data users are also encouraged to check the Variable Frequency Report to examine the unweighted data for these variables before computing weighted estimates.
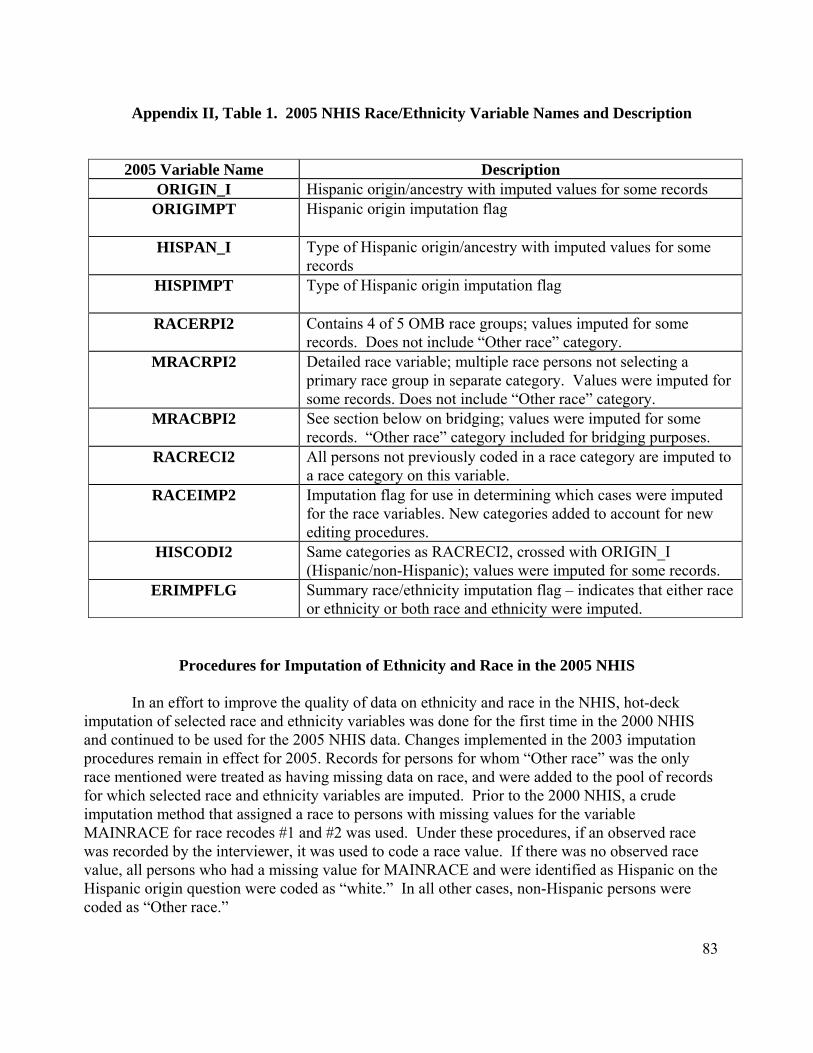
83
Appendix II, Table 1. 2005 NHIS Race/Ethnicity Variable Names and Description
2005 Variable Name Description ORIGIN_I Hispanic origin/ancestry with imputed values for some records
ORIGIMPT Hispanic origin imputation flag
HISPAN_I Type of Hispanic origin/ancestry with imputed values for some records
HISPIMPT Type of Hispanic origin imputation flag
RACERPI2 Contains 4 of 5 OMB race groups; values imputed for some records. Does not include “Other race” category.
MRACRPI2 Detailed race variable; multiple race persons not selecting a primary race group in separate category. Values were imputed for some records. Does not include “Other race” category.
MRACBPI2 See section below on bridging; values were imputed for some records. “Other race” category included for bridging purposes.
RACRECI2 All persons not previously coded in a race category are imputed to a race category on this variable.
RACEIMP2 Imputation flag for use in determining which cases were imputed for the race variables. New categories added to account for new editing procedures.
HISCODI2 Same categories as RACRECI2, crossed with ORIGIN_I (Hispanic/non-Hispanic); values were imputed for some records.
ERIMPFLG Summary race/ethnicity imputation flag – indicates that either race or ethnicity or both race and ethnicity were imputed.
Procedures for Imputation of Ethnicity and Race in the 2005 NHIS
In an effort to improve the quality of data on ethnicity and race in the NHIS, hot-deck imputation of selected race and ethnicity variables was done for the first time in the 2000 NHIS and continued to be used for the 2005 NHIS data. Changes implemented in the 2003 imputation procedures remain in effect for 2005. Records for persons for whom “Other race” was the only race mentioned were treated as having missing data on race, and were added to the pool of records for which selected race and ethnicity variables are imputed. Prior to the 2000 NHIS, a crude imputation method that assigned a race to persons with missing values for the variable MAINRACE for race recodes #1 and #2 was used. Under these procedures, if an observed race was recorded by the interviewer, it was used to code a race value. If there was no observed race value, all persons who had a missing value for MAINRACE and were identified as Hispanic on the Hispanic origin question were coded as “white.” In all other cases, non-Hispanic persons were coded as “Other race.”

84
The variables ORIGIN (whether or not the respondent is of Hispanic origin), HISPTY01-
HISPTY10 (type of Hispanic origin), RACE1-RACE5 (each of 5 possible race mentions), and MAINRACE (primary race selection for persons reporting more than one race) with missing values were imputed (note that the pre-imputation variable names are used in this description because the names were not changed until the imputation was completed). The imputation was carried out in two stages: within households at the first stage, and between households at the second stage. Hot-deck imputation procedures developed for the Decennial Census Dress Rehearsal (conducted in 1998) were adapted for use on the 2000-2005 NHIS data. In addition, imputation procedures for “Other race” were adapted from the Census Bureau’s Modified Race Data Summary File editing specifications for use in the 2005 NHIS data imputation. These specifications formed the basis of the first stage of the imputation (within households), and they were adapted to utilize NHIS family relationship variables. However, the specifications obtained from Census did not contain information on the imputation of race and ethnicity between households. Staff in DHIS and NCHS’ Office of Research and Methodology developed the specifications for the between-household imputation, using the secondary sampling unit (SSU) as the geographic unit for selecting donors.
1. Stage 1 Imputation - for households in which some persons had missing values, and some persons had valid entries for ethnicity and race variables.
Step 1. Generate datasets based on NHIS household files for within-household
imputation.
Step 2. Preview the frequency distributions of the variables to be imputed.
Step 3. Re-classify donors based on variables RRP (relationship of person to household reference persons) and DEGREE1-DEGREE7 (relationship variables - e.g., whether person is biological, step, foster, or in-law child of reference person).
Step 4. Load donors’ data to hot decks within each household, and conduct imputation for
each donee in the same household. Donees are classified in twenty-six categories based on the relationship of the donees to the Reference Person in the household (see following section). The allocation sequence of donors for each type of donee is different, depending on the type of the donee, and the relationship between the donor and the donee.
Step 5. Review the distributions of the imputed variables after imputation for comparison
and analysis. Combine all records, and reclassify households for Stage 2 imputation.

85
2. Stage 2 Imputation - for households in which all persons had missing values.
Step 1. The imputation was divided into three parts: A) Imputation among Hispanic households (ORIGIN=1). B) Imputation among Non-Hispanic households (ORIGIN=2).
C) Imputation for households with unknown Hispanic origin (ORIGIN=7, 8, 9). Step 2. Each part of the imputation complied with certain rules that are outlined in further
detail in the Stage 2 imputation specification (not provided here). The combinations of imputed variables in each part are different.
Step 3. After all imputations were completed, datasets from Stage 1 and Stage 2 were
combined, records that were imputed were flagged for the in-house and public use data files, and comparisons of the distributions of the variables before and after imputation were examined.
Use of imputation flags
Since hot-deck imputation procedures have been implemented on the NHIS race and ethnicity data, imputation flags have also been added to the data file. These flags allow data users to keep track of the number of cases for which race and/or ethnicity was imputed by the type of original response. They also provide users with a means of accessing the data in their unimputed form. The flags also provide a mechanism for converting data back to the format in the data files prior to the implementation of imputation in 2000, which is critical for merging data files across survey years and maintaining trends in the data. There are four imputation flags on the 2005 public use data file: ORIGIMPT, HISPIMPT, RACEIMP2, and ERIMPFLG. These flags are described in Table 1 above.
Users who wish to merge across data years or create trend data must recreate the race
variables RACERPI2, MRACRPI2, and MRACBPI2 in the format they had in previous years by using the flag RACEIMP2. Sample SAS code for using the imputation flags and merging across data years for the variable RACERPI2 (RACERP_I in 2000-2002 and RACER_P in 1999) is included below (the example uses 1999-2005 NHIS data, but other combinations of data years can be used. The code would just have to be adapted accordingly).
********************************************************************** *** merge 1999-2005 race variables using public use variables **** **********************************************************************; *** recode 1999 data ***; if RACER_P in (97) then RACEPU99=7; /* refused */ else if RACER_P in (98) then RACEPU99=8; /* NA */ else if RACER_P in (99) then RACEPU99=9; /* DK */ else RACEPU99=RACER_P;

86
***** code to add in imputation flags for 2000-2002 RACERP_I ******; if RACEIMPT in (1) then RACP0002=7; /* refused */ else if RACEIMPT in (2) then RACP0002=8; /* NA */ else if RACEIMPT in (3) then RACP0002=9; /* DK */ else RACP0002=RACERP_I; ****** code to add imputation flags for 2003-2005 RACERPI2 ********; if RACEIMP2 in (1) then RACP0305=7; /* refused */ else if RACEIMP2 in (2) then RACP0305=8; /* NA */ else if RACEIMP2 in (3) then RACP0305=9; /* DK */ else if RACEIMP2 in (4 5) then RACP0305=5; /* Other races1 */ else RACP0305=racerpi2; 1 Note that this category contains “Other race only,” “Unspecified Multiple race” and NHOPI persons. *** combine 1999-2005 data into single variable *****; if RACEPU99 ne . then RACE9905=RACEPU99; else if RACP0002 ne . then RACE9905=RACP0002; else RACE9905=RACP0305;
Bridging to the Old OMB Standards
The OMB tabulation guidelines for the new race and ethnicity standards recognize that the
complete transition from the old standards to the new standards will take some time, and that many federal statistical systems have a primary mission to track data trends over time. During this transitional period, known as the “bridge,” it has been recommended that data systems tabulate data for publication under the new standards, while also providing a means for data users to bridge the new data back to the old standards. This will allow data users to examine differences, if any, in tabulating the data under the old and new standards, assist in the maintenance of data trends, and allow users to become accustomed to data tabulated under the new standard before the transition is complete. In the NHIS, the second race question (commonly known as the “follow-up question”) is used to create the bridge between data collected under the old standards and data collected under the new ones. The 2005 NHIS public use data file contains one bridge race variable to allow comparisons of 2005 data with data from previous years, and to enable merging the 2005 data with 1997-2004 data.
There was one major change to the race and ethnicity data in the 1999 NHIS (which is also
true for 2000-2005) that occurred as a result of the creation of a bridge variable. NCHS confidentiality standards do not permit NCHS to release data that might lead to the inadvertent identification of individual respondents to the survey. Beginning with the 1999 survey (and now in 2005), data on “Asian” persons and “Native Hawaiian and Other Pacific Islander (NHOPI)” persons were collected separately according to the new OMB guidelines. Ideally, these two groups could be combined to recreate the old category “Asian and Pacific Islander (API)” as a bridge back to data collected under the old race standards. However, the NCHS Disclosure Review Board (DRB), consulting with DHIS analysts, determined that releasing data using an all-inclusive “Other Pacific Islander” category (which would include the Native Hawaiian, Samoan,

87
Guamanian, and Other Pacific Islander groups) would pose a disclosure risk, especially when used in combination with other demographic and geographic information available on the file. For this reason, the decision was made to suppress the “Other Pacific Islander” category on all public use bridge variables. This is important for data users to know because this change makes it impossible to bridge back to the old “Asian and Pacific Islander” category that existed in the 1998 and earlier NHIS surveys. Data users who need this information for their analyses will have to contact the NCHS Research Data Center to obtain controlled access to non-released data.
Creation and Editing of 2005 Race Variables
The variables RACRECI2 and MRACRPI2 correspond to the old OMB guidelines for collecting racial and ethnic data (see the Variable Layout Report for further descriptions of these variables). They were created in the same fashion as their previous NHIS counterparts (National Center for Health Statistics, 1996), with two exceptions. First, since observed race is no longer collected in the NHIS (beginning in 1997), it was not used to help classify persons with “Unknown” race on the RACRECI2 recode. Second, the recodes “White/Non-White” and “Black/Non-Black” were not created because they are no longer used in the weighting and tabulation of NHIS data. As in the past, smaller subgroups have been collapsed for confidentiality reasons.
Since the NHIS is now required to collect racial and ethnic data under the new OMB
guidelines, new variables have been created to allow users to tabulate NHIS data by race variables that correspond to the new OMB guidelines. These variables conform to the new OMB race standards; therefore they are created independently of the follow-up race question (see the section of this appendix on Race and Hispanic Origin Questions in the National Health Interview Survey). The variable RACERPI2 was created using an algorithm that first coded the five race mentions from the survey into the single and multiple race group combinations (shown in bold/italicized and regular font, respectively) included in Table 2, below. All of the multiple race categories in the table were then collapsed into a single “Multiple race” category, and along with 4 of the 5 OMB single race categories, the variable RACERP_I was created. The full algorithm is provided below so that our data users can better understand how this variable is derived.
Algorithm used to Create Single and Multiple Race Groups
This SAS algorithm takes into account the new OMB categories: White, Black, American
Indian/Alaskan Native (AIAN), Asian, and Native Hawaiian and Other Pacific Islander (NHOPI). In the NHIS, data are collected in 16 race categories: White, Black, Indian (American), Alaska Native, Native Hawaiian, Guamanian, Samoan, Other Pacific Islander (a verbatim mention that is back-coded to this category), Asian Indian, Chinese, Filipino, Japanese, Korean, Vietnamese, Other Asian (a verbatim mention that is back-coded to this category). These can all be collapsed back to the OMB categories in the following fashion: White, Black, AIAN (includes Indian (American) and Alaska Native), Asian (includes Asian Indian, Chinese, Filipino, Japanese, Korean, Vietnamese and Other Asian), and NHOPI (includes Native Hawaiian, Guamanian, Samoan and Other Pacific Islander.
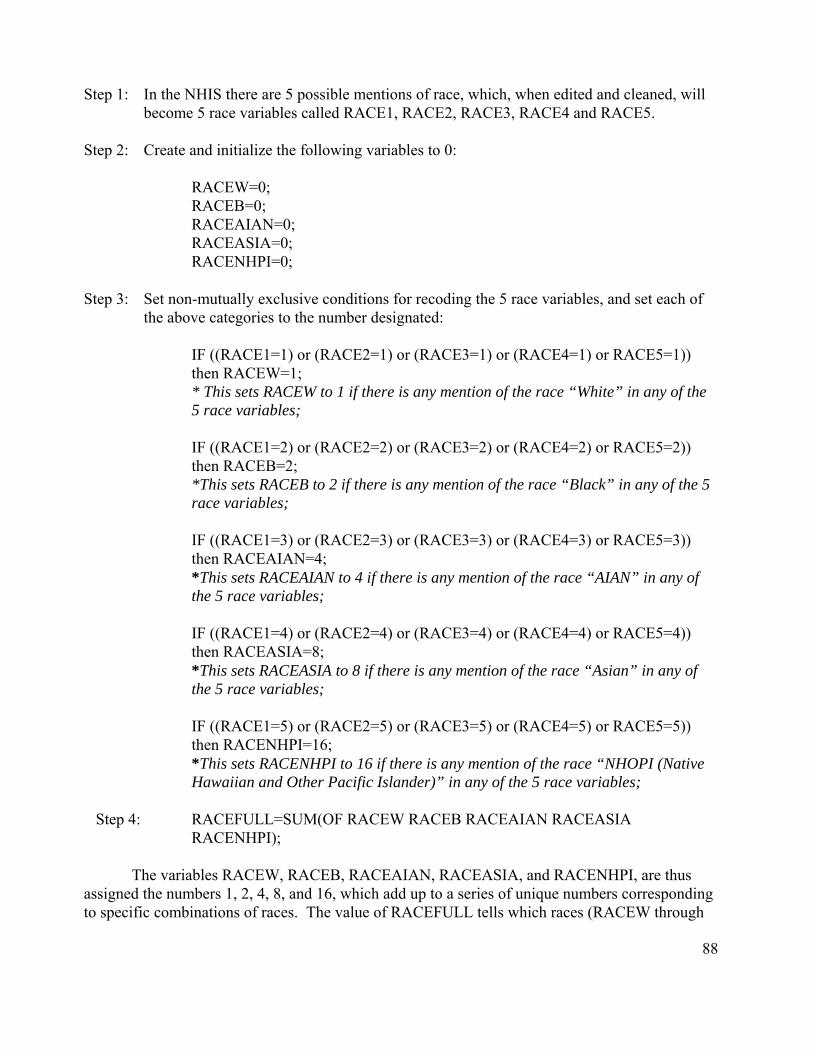
88
Step 1: In the NHIS there are 5 possible mentions of race, which, when edited and cleaned, will become 5 race variables called RACE1, RACE2, RACE3, RACE4 and RACE5.
Step 2: Create and initialize the following variables to 0:
RACEW=0; RACEB=0; RACEAIAN=0; RACEASIA=0; RACENHPI=0;
Step 3: Set non-mutually exclusive conditions for recoding the 5 race variables, and set each of the above categories to the number designated:
IF ((RACE1=1) or (RACE2=1) or (RACE3=1) or (RACE4=1) or RACE5=1)) then RACEW=1; * This sets RACEW to 1 if there is any mention of the race “White” in any of the 5 race variables;
IF ((RACE1=2) or (RACE2=2) or (RACE3=2) or (RACE4=2) or RACE5=2)) then RACEB=2; *This sets RACEB to 2 if there is any mention of the race “Black” in any of the 5 race variables;
IF ((RACE1=3) or (RACE2=3) or (RACE3=3) or (RACE4=3) or RACE5=3)) then RACEAIAN=4; *This sets RACEAIAN to 4 if there is any mention of the race “AIAN” in any of the 5 race variables;
IF ((RACE1=4) or (RACE2=4) or (RACE3=4) or (RACE4=4) or RACE5=4)) then RACEASIA=8; *This sets RACEASIA to 8 if there is any mention of the race “Asian” in any of the 5 race variables; IF ((RACE1=5) or (RACE2=5) or (RACE3=5) or (RACE4=5) or RACE5=5)) then RACENHPI=16; *This sets RACENHPI to 16 if there is any mention of the race “NHOPI (Native Hawaiian and Other Pacific Islander)” in any of the 5 race variables;
Step 4: RACEFULL=SUM(OF RACEW RACEB RACEAIAN RACEASIA
RACENHPI);
The variables RACEW, RACEB, RACEAIAN, RACEASIA, and RACENHPI, are thus assigned the numbers 1, 2, 4, 8, and 16, which add up to a series of unique numbers corresponding to specific combinations of races. The value of RACEFULL tells which races (RACEW through

89
RACENHPI) combined to give that number. For example, if RACEFULL=3, then only the sum of the values for RACEW=1 and RACEB=2 could have produced the number 3. Therefore, anyone with the value RACEFULL=3 falls into the “White/Black” race category. If RACEFULL=1, then those persons fall into the “White” category. This scheme accurately allocates persons with multiple Asian, AIAN, and NHOPI mentions. The full listing of categories and the numbers to which they correspond are included in the following table:
Appendix II, Table 2. Coding Scheme for SAS Algorithm
Coding Scheme for OMB Race Category Data (including single and multiple race mentions)
# of Category (reported in SAS
frequency distribution of RACEFULL)
Sum of Codes (breakdown of RACEFULL= SUM (OF
RACEW+RACEB+ RACEAIAN+RACEASIA+
RACENHPI+RACEOTHR))
Resulting Category (used in the PROC FORMAT
statement to label the categories in SAS)
1
1+0+0+0+0+0
White
2
0+2+0+0+0+0
Black
3
1+2+0+0+0+0
White/Black
4
0+0+4+0+0+0
AIAN
5
1+0+4+0+0+0
White/AIAN
6
0+2+4+0+0+0
Black/AIAN
7
1+2+4+0+0+0
White/Black/AIAN
8
0+0+0+8+0+0
Asian
9
1+0+0+8+0+0
White/Asian
10
0+2+0+8+0+0
Black/Asian
11
1+2+0+8+0+0
White/Black/Asian
12
0+0+4+8+0+0
AIAN/Asian
13
1+0+4+8+0+0
White/AIAN/Asian
14
0+2+4+8+0+0
Black/AIAN/Asian
15
1+2+4+8+0+0
White/Black/AIAN/Asian
16
0+0+0+0+16+0
NHOPI
17
1+0+0+0+16+0
White/NHOPI

90
Coding Scheme for OMB Race Category Data (including single and multiple race mentions)
# of Category (reported in SAS
frequency distribution of RACEFULL)
Sum of Codes (breakdown of RACEFULL= SUM (OF
RACEW+RACEB+ RACEAIAN+RACEASIA+
RACENHPI+RACEOTHR))
Resulting Category (used in the PROC FORMAT
statement to label the categories in SAS)
18 0+2+0+0+16+0 Black/NHOPI 19
1+2+0+0+16+0
White/Black/NHOPI
20
0+0+4+0+16+0
AIAN/NHOPI
21
1+0+4+0+16+0
White/AIAN/NHOPI
22
0+2+4+0+16+0
Black/AIAN/NHOPI
23
1+2+4+0+16+0
White/Black/AIAN/NHOPI
24
0+0+0+8+16+0
Asian/NHOPI
25
1+0+0+8+16+0
White/Asian/NHOPI
26
0+2+0+8+16+0
Black/Asian/NHOPI
27
1+2+0+8+16+0
White/Black/Asian/NHOPI
28
0+0+4+8+16+0
AIAN/Asian/NHOPI
29
1+0+4+8+16+0
White/AIAN/Asian/NHOPI
30
0+2+4+8+16+0
Black/AIAN/Asian/NHOPI
31
1+2+4+8+16+0
White/Black/AIAN/Asian/NHOPI
Data users should be aware that the variable RACEFULL and others derived from it are not available on public use data files for confidentiality reasons. The recode RACERPI2 is a recode based on RACEFULL. Analysts who wish to use more detailed race data in their analyses should contact the NCHS Research Data Center or visit their web page: http://www.cdc.gov/nchs/r&d/rdc.htm .
Further Information
Although the race variables included in the 2005 file have been edited and tested, analytic and methodological work with these variables continues. NCHS is also evaluating other recodes for possible public release at a later date. If these analyses should result in changes to the 2005 NHIS race data, information about this will be placed on the NCHS web site: http://www.cdc.gov/nchs/nhis.htm.

91
References
Office of Management and Budget. Provisional Guidance on the Implementation of the 1997 Standards for Federal Data on Race and Ethnicity, December 15, 2000 (Statistical Policy section). http://www.whitehouse.gov/omb/inforeg/statpolicy.html Office of Management and Budget. Interagency Committee for the Review of Standards for Data on Race and Ethnicity. Draft Provisional Guidance on the Implementation of the 1997 Standards for Federal Data on Race and Ethnicity, February 15, 1999.
National Center for Health Statistics (1996). Computer Processing Procedures Calendar Year 1995, Volume 1 of 2, National Health Interview Survey, 1995. National Center for Health Statistics, Hyattsville, MD (Producer). National Technical Information Service, U.S. Department of Commerce, Springfield, VA. 22161 (Distributor).
Office of Management and Budget. Office of Management and Budget Circular No. A48. Standards and Guidelines for Federal Statistics. Section 7H, Exhibit F, May 12, 1977. Office of Management and Budget. Revisions to the Standards for the Classification of Federal Data on Race and Ethnicity. Federal Register 62(210):58782-58790. 1997. U.S Bureau of the Census. Census 2000 Modified Race Data [MR(31)-CO.txt]. 2002.

92
Appendix III
Variance Estimation and Other Analytic Issues, NHIS 2005
Introduction
The data collected in the NHIS are obtained through a complex, multistage sample design that involves stratification, clustering, and oversampling of specific population subgroups. The final weights provided for analytic purposes have been adjusted in several ways to yield valid estimates for the civilian, noninstitutionalized population of the United States. As with any variance estimation methodology, the techniques presented here involve several simplifying assumptions about the design and weighting scheme applied to the data. This appendix provides guidelines for data users based on simplified concepts of the NHIS sample design structure so that users may compute reasonably accurate standard error estimates.
There are several available software packages for analyzing complex samples. The Web site Summary of Survey Analysis Software, currently located at:
http://www.fas.harvard.edu/~stats/survey-soft/survey-soft.html ,
provides references for and a comparison of different software alternatives for the analysis of complex data. Analysts at NCHS generally use the software package SUDAAN® (Shah et al. 1997) to produce accurate standard error estimates. In this appendix, examples of SUDAAN computer code are provided for illustrative purposes. However, the appropriate application of these procedures is the ultimate responsibility of data users, and the example command code is not “guaranteed.” Both the computer command code and methods are subject to change without notification to the user. NCHS strongly recommends that NHIS data be analyzed under the direction of or in consultation with a statistician who is cognizant of sampling methodologies and techniques for the analysis of complex survey data.
CAUTION. Users are reminded that the use of standard statistical procedures that are based on the assumption that data are generated via simple random sampling (SRS) generally will produce incorrect estimates of variances and standard errors when used to analyze data from the NHIS. The clustering protocols that are used in the multistage selection of the NHIS sample require other analytic procedures, as described below. Analysts who apply SRS techniques to NHIS data generally will produce standard error estimates that are, on average, too small, and are likely to produce results that are subject to excessive Type I error.
Conceptual NHIS design for 1995-2005
Thorough discussions of the NHIS design, the methods used for weighting data, and the methods used for variance estimation are beyond the scope of this appendix but are provided elsewhere (NCHS 1999; NCHS 2000). This appendix outlines the basic ideas published in these technical reports (NCHS 1999; NCHS 2000).

93
To achieve sampling efficiency and to keep survey operations manageable, cost-effective, and timely, the NHIS survey planners used multistage sampling techniques to select the sample of persons and households for the NHIS. These multistage methods partition the target universe into several nested levels of strata and clusters. The NHIS target universe is defined as all dwelling units in the U.S. that contain members of the civilian noninstitutionalized population. As the NHIS is conducted in a face-to-face interview format, a simple random sample of dwelling units would be too dispersed throughout the nation; as a result, the costs of interviewing a simple random sample of 40,000 households would be prohibitive. Also, specific population subgroups, such as black and/or Hispanic households, would not be sampled sufficiently under a simple random sample design. To achieve survey objectives subject to resource constraints, the NHIS uses methods of clustering, stratification, and oversampling of specific population subgroups.
First, the target universe was partitioned into approximately 1,900 primary sampling units (PSUs), which are single counties, groups of adjacent counties (or equivalent jurisdictions), or metropolitan areas. These PSUs vary in population size and number of jurisdictions. Cost-effective field operations and efficient sampling result in those PSUs with the largest populations (e.g., the New York City metropolitan area) being sampled with certainty, and the smaller universe PSUs being represented by a sample. These smaller PSUs are called non-self-representing (NSR) or non-certainty PSUs. The universe of NSR PSUs is stratified using multiple criteria consistent with NHIS objectives. The NSR PSUs were stratified first at the state level according to metropolitan status (metro or non-metro). If a particular NSR stratum in a given state contained a large population, then it was further stratified by aggregate-level poverty rates. Thus, the number of NSR strata varies from state to state, and the number of PSUs varies from stratum to stratum. Once these strata were defined, a sample of PSUs was selected; within most NSR strata, two PSUs were selected without replacement with probability proportional to population size, and the SR PSUs were selected with certainty. Within a few NSR strata with smaller population sizes, only one PSU was drawn.
The U.S. Bureau of the Census partitioned each selected NSR or SR PSU into substrata of Census blocks or combined blocks based on the concentrations of black and Hispanic populations. These race and ethnicity density substrata were defined according to the population concentrations from the 1990 Decennial Census. New housing within a PSU was included as its own substratum in order to produce the most current sample of households. Each PSU could be partitioned into up to 21 substrata of dwelling units. Large metropolitan SR PSUs tend to have many substrata, while the NSR PSUs tend to have only a few.
Sampling within the PSU substrata is complex and involves clustering dwelling units within each substratum. These clusters form a universe of Secondary Sampling Units (SSUs). A systematic sample of SSUs is selected to represent each substratum. Each race and ethnicity density substratum has its own sampling rate for SSU selection.
Within each selected SSU all households containing black or Hispanic persons are selected for interview, while only a sample of other households is selected. The non-black, non-Hispanic households are sampled at different rates within the 21 substrata. For selected

94
households, the NHIS collects some information on all household members, and additional information is obtained for randomly selected persons in each household. For example, one adult per family is randomly selected for interview with the sample adult questionnaire.
This hierarchy of sampling allows the creation of household- and person-level base weights. Each base weight is the product of the inverses of the probability of selection at each sampling stage. Roughly speaking, the base weight is the number of population units a sampled unit represents. Under ideal sampling conditions, and if 100% response occurred, a base-weighted sample total will be an unbiased estimator for the true total in the target population. In practice, however, the base weights are adjusted for non-response, and ratio-adjusted to create final sampling weights. The final person-level weights are adjusted according to a quarterly poststratification by 88 age/sex/race/ethnicity classes based on population estimates produced by the U.S. Bureau of the Census. Most other weights receive some form of ratio adjustment as well.
Internally, NCHS uses the design and weighting information to formulate appropriate variance estimates for NHIS statistics. While recognizing the need to provide accurate information, NCHS also must adhere to the Public Health Service Act (Section 308(d)) that forbids the disclosure of any information that may compromise the confidentiality promised to its survey respondents. Consequently, much of the NHIS design information cannot be publicly released, and other data are either suppressed or recoded to insure confidentiality. In order to satisfy this disclosure constraint, many of the original design strata, substrata, PSUs, and SSUs are masked for public release by applying techniques to cluster, collapse, mix, and partition the original design variables. Through this process the original NHIS design variables are transformed into public use design variables (i.e., STRATUM and PSU). The public use design structures perform reasonably well when compared to internal NCHS design structures (NCHS 2000). The sampling weights have not been changed in any way for the public data. Data users who want access to internal NCHS data have the option of accessing data through the NCHS Research Data Center. For further information, refer to http://www.cdc.gov/nchs/r&d/rdc.htm.
Design Information Available on the NHIS Public Use Data
The 2005 Household and Person public use files contain the design variables necessary for variance estimation; Table 1 provides a summary of the Person file variables. Users should check the Variable Layouts of the Household and Person files for any additional information about these variables. Note that for the 2004 NHIS data, the design variables (STRATUM and PSU) are not included on the Family, Sample Child and Sample Adult files. For the 2005 NHIS data, the design variables are included on the Sample Child and Sample Adult files, but not the Family file.
Appendix III, Table 1. Variables Used for Variance Estimation, 2005 NHIS Person File
Variable Name Variable Label STRATUM Stratum for variance estimation PSU PSU for variance estimation WTFA Weight - Final, annual Person weight

95
As discussed above, in order to mask true geographical locations, the STRATUM and PSU levels are pseudo-levels or simplified versions of the true NHIS sample design variables. Analysts are cautioned that these simplified design structures do not support geographical analyses below the Census Region level.
CAUTION. Significant changes were made to the Stratum and PSU values beginning with the 1997 survey year. More strata have been provided (compared to the 1995 public release) to improve statistical efficiency in various statistical estimation procedures. The sample design variables provided on the 1997-2005 NHIS public use data files are not comparable to those of 1995-1996. Users are cautioned that variance estimation structures discussed here are for individual survey years only, not for pooled analyses of multiple years of the NHIS. Refer to the final section of this appendix for variance estimation guidance for pooled analyses of adjacent years of the NHIS.
Variance Estimation Method for Public Use Data
The method described below is applicable to all 2005 NHIS public use data, except the Injury/Poisoning Episode file and the Verbatim Injury/Poisoning Episode file.
For this method of variance estimation, the NHIS sample is treated as having 339 strata, each containing two sampled PSUs. While in reality no PSU was sampled more than once, the limited public release design information requires a mathematical simplification that the PSUs be treated as if they were sampled with replacement (WR). This public use method provides slightly more conservative (larger) standard errors than the variance estimation method that is applied internally by analysts at NCHS (NCHS 2000). Additionally, this public use method is applicable in many statistical packages for complex survey data that require exactly two sample PSUs per stratum. Moreover, this method is robust when analyzing subsetted or subgroup data (see the section “Subsetted Data Analysis” below).
When implementing this public use method, users should observe 678 PSUs when analyzing the full database. The simplified design structure can be specified with the following statements in SUDAAN:
PROC ... DESIGN = WR ; NEST STRATUM PSU ; WEIGHT WTFA ;
Note that SUDAAN requires that the input file be sorted by the variables listed on the NEST statement (i.e., STRATUM and PSU). Design statements for other data files should use the appropriate weight variables found on these files.
CAUTION. A rule of thumb to calculate the number of degrees of freedom to associate with a standard error is the quantity number of PSUs - number of strata. Typically, this rule is applied to a design with two PSUs per stratum and when the variance components by stratum are roughly the
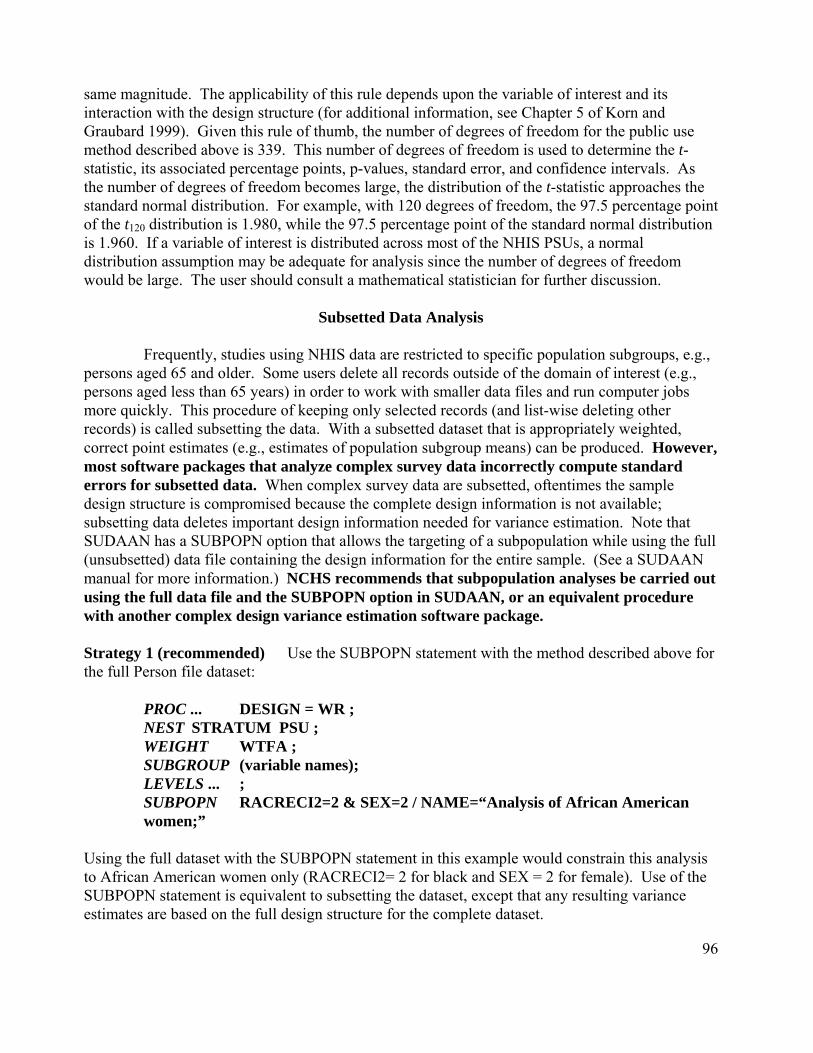
96
same magnitude. The applicability of this rule depends upon the variable of interest and its interaction with the design structure (for additional information, see Chapter 5 of Korn and Graubard 1999). Given this rule of thumb, the number of degrees of freedom for the public use method described above is 339. This number of degrees of freedom is used to determine the t-statistic, its associated percentage points, p-values, standard error, and confidence intervals. As the number of degrees of freedom becomes large, the distribution of the t-statistic approaches the standard normal distribution. For example, with 120 degrees of freedom, the 97.5 percentage point of the t120 distribution is 1.980, while the 97.5 percentage point of the standard normal distribution is 1.960. If a variable of interest is distributed across most of the NHIS PSUs, a normal distribution assumption may be adequate for analysis since the number of degrees of freedom would be large. The user should consult a mathematical statistician for further discussion.
Subsetted Data Analysis
Frequently, studies using NHIS data are restricted to specific population subgroups, e.g., persons aged 65 and older. Some users delete all records outside of the domain of interest (e.g., persons aged less than 65 years) in order to work with smaller data files and run computer jobs more quickly. This procedure of keeping only selected records (and list-wise deleting other records) is called subsetting the data. With a subsetted dataset that is appropriately weighted, correct point estimates (e.g., estimates of population subgroup means) can be produced. However, most software packages that analyze complex survey data incorrectly compute standard errors for subsetted data. When complex survey data are subsetted, oftentimes the sample design structure is compromised because the complete design information is not available; subsetting data deletes important design information needed for variance estimation. Note that SUDAAN has a SUBPOPN option that allows the targeting of a subpopulation while using the full (unsubsetted) data file containing the design information for the entire sample. (See a SUDAAN manual for more information.) NCHS recommends that subpopulation analyses be carried out using the full data file and the SUBPOPN option in SUDAAN, or an equivalent procedure with another complex design variance estimation software package.
Strategy 1 (recommended) Use the SUBPOPN statement with the method described above for the full Person file dataset:
PROC ... DESIGN = WR ; NEST STRATUM PSU ; WEIGHT WTFA ; SUBGROUP (variable names); LEVELS ... ;
SUBPOPN RACRECI2=2 & SEX=2 / NAME=“Analysis of African American women;”
Using the full dataset with the SUBPOPN statement in this example would constrain this analysis to African American women only (RACRECI2= 2 for black and SEX = 2 for female). Use of the SUBPOPN statement is equivalent to subsetting the dataset, except that any resulting variance estimates are based on the full design structure for the complete dataset.

97
Strategy 2 (not recommended, except when Strategy 1 is infeasible) Use the MISSUNIT option on the NEST statement with the method described above for subsetted data:
NEST STRATUM PSU / MISSUNIT ;
In a WR design with exactly two PSUs per stratum, when some PSUs are removed from the database through the listwise deletion of records outside the population of interest, the MISSUNIT option in SUDAAN “fixes” the estimation to avoid errors due to the presence of strata with only one PSU. However, in general there is no guarantee that the variance estimates obtained by this method are equivalent to those obtained using Strategy 1. Other calculations, such as those for design effects, degrees of freedom, standardization, etc., may need to be carried out differently. Users are responsible for verifying the correctness of their results based on subsetted data.
Variance Estimation for Pooled Analyses of Adjacent Years of the NHIS
Adjacent years of NHIS data sometimes are combined for a pooled analysis, e.g., 2004 and 2005, or 2002-2004. A pooled analysis might be done, for example, to increase the sample size for some small population. An estimate from a pooled analysis can be interpreted to be an estimate for the midpoint of the time interval of the pooled data. The sampling weights for pooled data should be adjusted; otherwise, estimates of totals will be too high. For example, the estimated total U.S. civilian noninstitutionalized population from two years of pooled data, using unadjusted weights, would be about twice as large as it should be. A simple, valid weight adjustment procedure that NCHS recommends is to divide each sample weight in the pooled dataset by the number of years that are being pooled; e.g., divide by 2 when two years of data are combined, divide by 3 when three years of data are combined, etc. A sophisticated user may want to consider an alternative weight adjustment method that would minimize the variance of a particular estimate; however, in general, if the sample sizes are similar in the data years being combined, the simple procedure and the sophisticated alternative would give a similar adjustment. Variance estimation for pooled analyses falls into one or more of the following three classifications: #1. The years being pooled fall within the same sample design period with the same public use design variables, and no changes were made to the design variables within the years being pooled. #2. The years being pooled fall into different sample design periods (e.g., 1985-1994, 1995-2005). #3. The years being pooled fall within the same sample design period, and there were changes to the public use design variables (e.g., from 1995-1996 to 1997-2005). For #1, the sample has been drawn from the same geographic areas (same sample design), and the definitions of the variables used for public use variance estimation have not changed within the time period being analyzed. A valid method for variance estimation is to treat the pooled data like one year of data with a very large sample size. It is not correct to treat the
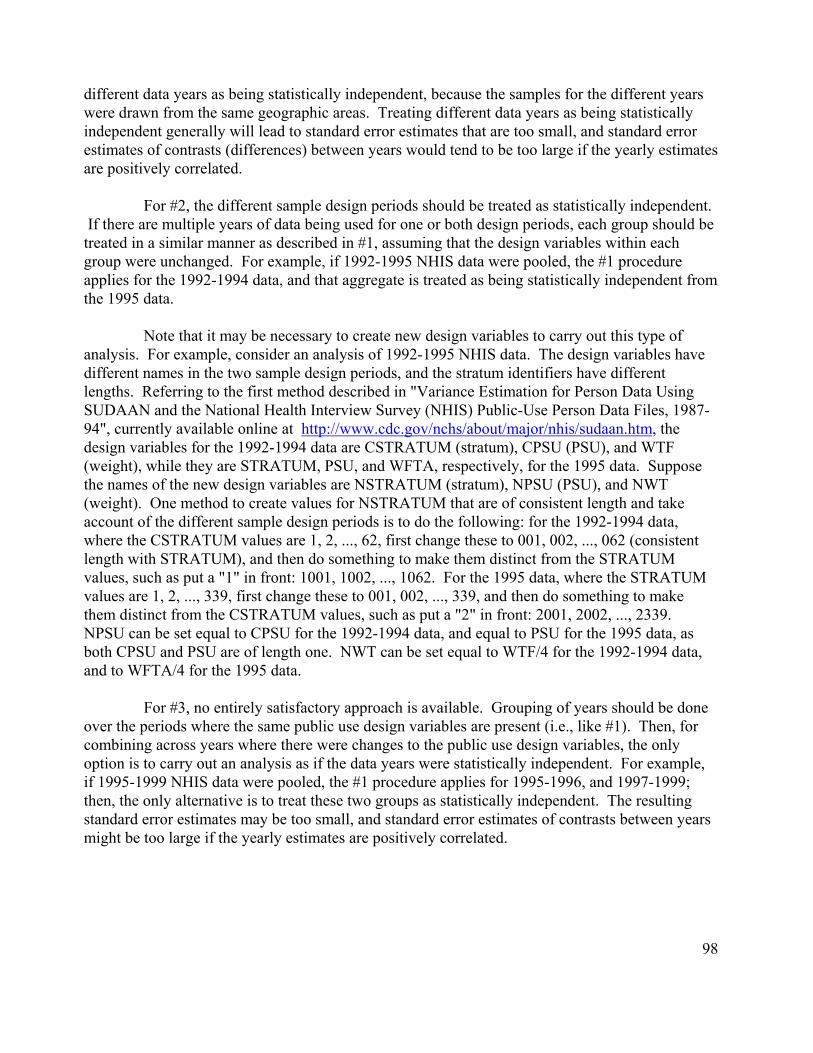
98
different data years as being statistically independent, because the samples for the different years were drawn from the same geographic areas. Treating different data years as being statistically independent generally will lead to standard error estimates that are too small, and standard error estimates of contrasts (differences) between years would tend to be too large if the yearly estimates are positively correlated. For #2, the different sample design periods should be treated as statistically independent. If there are multiple years of data being used for one or both design periods, each group should be treated in a similar manner as described in #1, assuming that the design variables within each group were unchanged. For example, if 1992-1995 NHIS data were pooled, the #1 procedure applies for the 1992-1994 data, and that aggregate is treated as being statistically independent from the 1995 data. Note that it may be necessary to create new design variables to carry out this type of analysis. For example, consider an analysis of 1992-1995 NHIS data. The design variables have different names in the two sample design periods, and the stratum identifiers have different lengths. Referring to the first method described in "Variance Estimation for Person Data Using SUDAAN and the National Health Interview Survey (NHIS) Public-Use Person Data Files, 1987-94", currently available online at http://www.cdc.gov/nchs/about/major/nhis/sudaan.htm, the design variables for the 1992-1994 data are CSTRATUM (stratum), CPSU (PSU), and WTF (weight), while they are STRATUM, PSU, and WFTA, respectively, for the 1995 data. Suppose the names of the new design variables are NSTRATUM (stratum), NPSU (PSU), and NWT (weight). One method to create values for NSTRATUM that are of consistent length and take account of the different sample design periods is to do the following: for the 1992-1994 data, where the CSTRATUM values are 1, 2, ..., 62, first change these to 001, 002, ..., 062 (consistent length with STRATUM), and then do something to make them distinct from the STRATUM values, such as put a "1" in front: 1001, 1002, ..., 1062. For the 1995 data, where the STRATUM values are 1, 2, ..., 339, first change these to 001, 002, ..., 339, and then do something to make them distinct from the CSTRATUM values, such as put a "2" in front: 2001, 2002, ..., 2339. NPSU can be set equal to CPSU for the 1992-1994 data, and equal to PSU for the 1995 data, as both CPSU and PSU are of length one. NWT can be set equal to WTF/4 for the 1992-1994 data, and to WFTA/4 for the 1995 data. For #3, no entirely satisfactory approach is available. Grouping of years should be done over the periods where the same public use design variables are present (i.e., like #1). Then, for combining across years where there were changes to the public use design variables, the only option is to carry out an analysis as if the data years were statistically independent. For example, if 1995-1999 NHIS data were pooled, the #1 procedure applies for 1995-1996, and 1997-1999; then, the only alternative is to treat these two groups as statistically independent. The resulting standard error estimates may be too small, and standard error estimates of contrasts between years might be too large if the yearly estimates are positively correlated.
99
References
Cochran, W.G. (1977), Sampling techniques (3rd edition), John Wiley & Sons.
Korn, E.L., and Graubard, B.I. (1999), Analysis of Health Surveys, John Wiley & Sons.
National Center for Health Statistics (1999), National Health Interview Survey: Research for the 1995-2004 redesign, Vital and Health Statistics, Series 2, No. 126.
National Center for Health Statistics (2000), Design and Estimation for the National Health
Interview Survey, 1995-2004, Vital and Health Statistics, Series 2, No. 130.
Shah, B.V., Barnwell, B.G. and Bieler, G.S. (1997), SUDAAN User’s Manual; Release 7.5, Research Triangle Institute, Research Triangle Park, NC.

100
Appendix IV
A Preliminary Evaluation and Recommendations for use of the Mental Health Indicator (MHI) in the NHIS
for Children Aged 2 to 3 years
This is based on from a report by Thomas M. Achenbach, Ph.D., which was submitted to the Division of Health Interview Statistics on May 10, 1999.
Introduction
The NHIS mental health indicators MHIBOY2 and MHIGRL2 are located in the Child
Health Status (CHS) section of the survey, and are based on items from the Child Behavior Checklist (CBCL) that were identified by Dr. Thomas Achenbach as providing the best discrimination between demographically similar children referred for mental health services versus nonreferred (Achenbach and Edelbrock, 1983). To take account of gender and age differences in the discriminative power of particular items, the items were selected separately for each gender and age group. From the original ten items identified in Dr. Achenbach’s 1995 analyses, the 1997 NHIS elected to include only 4 items (per gender). These include whether male sample children (aged 2-3 years) had been uncooperative, had trouble sleeping, had speech problems, or had been unhappy or depressed in the past 2 months, and whether female sample children (aged 2-3 years) had temper tantrums, had speech problems, had been nervous or high-strung, or had been unhappy or depressed in the past 2 months. Response categories included “Not true,” “Sometimes true,” or “Often true” (as well as “Refused” and “Don’t know”). These items are also located in the CHS section (see CHS.321_01-03.000 and CHS.361_01-03.000).
It is essential to note that such a small set of items cannot be used to evaluate individual
children for clinical or other purposes. Even for use as a mental health indicator in large surveys such as the NHIS, very small sets of items can serve only as approximate indicators of needs for mental health services. Multiple items tapping each of several specific areas of functioning would be needed to identify specific disorders, such as Attention Deficit Hyperactivity Disorder (ADHD), Depression, Conduct Disorder, and Somatization Disorder. (Note: The items for children ages 4 to 17 were replaced in the 2001 NHIS with a different instrument, the Strengths and Difficulties Questionnaire (SDQ). The SDQ is described in Appendix V.)
It should also be noted that different cutpoints on the distributions of item scores may be
needed for different purposes. For example, a very low cutpoint may be useful if the goal is to identify every possible case for which mental health services might be considered. However, very low cutpoints result in relatively high false positive rates, i.e., the inclusion of substantial numbers of healthy individuals among those identified as potentially needing services. Conversely, higher cutpoints may yield greater overall accuracy in classifying potential cases versus noncases, but at the cost of missing more cases potentially needing services.
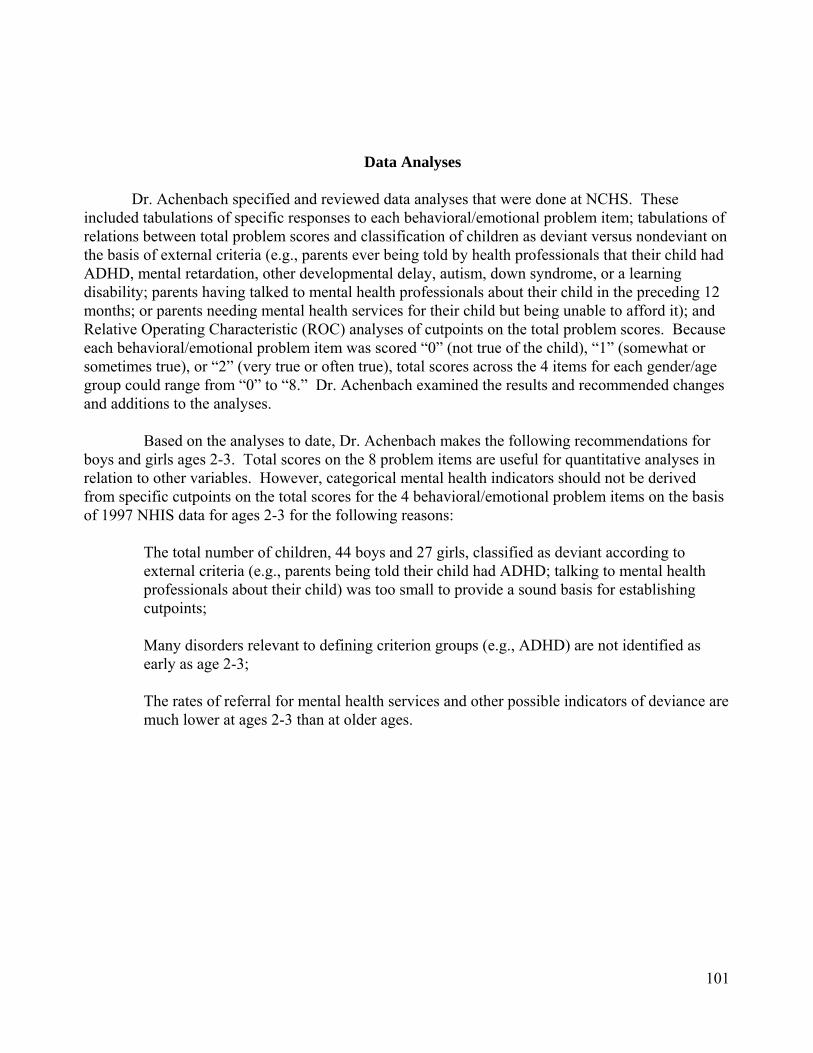
101
Data Analyses
Dr. Achenbach specified and reviewed data analyses that were done at NCHS. These included tabulations of specific responses to each behavioral/emotional problem item; tabulations of relations between total problem scores and classification of children as deviant versus nondeviant on the basis of external criteria (e.g., parents ever being told by health professionals that their child had ADHD, mental retardation, other developmental delay, autism, down syndrome, or a learning disability; parents having talked to mental health professionals about their child in the preceding 12 months; or parents needing mental health services for their child but being unable to afford it); and Relative Operating Characteristic (ROC) analyses of cutpoints on the total problem scores. Because each behavioral/emotional problem item was scored “0” (not true of the child), “1” (somewhat or sometimes true), or “2” (very true or often true), total scores across the 4 items for each gender/age group could range from “0” to “8.” Dr. Achenbach examined the results and recommended changes and additions to the analyses.
Based on the analyses to date, Dr. Achenbach makes the following recommendations for
boys and girls ages 2-3. Total scores on the 8 problem items are useful for quantitative analyses in relation to other variables. However, categorical mental health indicators should not be derived from specific cutpoints on the total scores for the 4 behavioral/emotional problem items on the basis of 1997 NHIS data for ages 2-3 for the following reasons:
The total number of children, 44 boys and 27 girls, classified as deviant according to external criteria (e.g., parents being told their child had ADHD; talking to mental health professionals about their child) was too small to provide a sound basis for establishing cutpoints;
Many disorders relevant to defining criterion groups (e.g., ADHD) are not identified as early as age 2-3;
The rates of referral for mental health services and other possible indicators of deviance are much lower at ages 2-3 than at older ages.

102
Appendix V
The Short Strengths and Difficulties Questionnaire (SDQ) In the 2005 NHIS questions CMB.020_01.000 to CMB.020_05.000 make up a brief version of the SDQ. The questions are derived from the parent version of the long Strengths and Difficulties Questionnaire Extended (SDQ), developed and copyrighted by Dr. Robert Goodman, Institute of Psychiatry, London, England. Questions from the SDQ are used in the NHIS with Dr. Goodman’s permission. The short SDQ, constructed to save time and space in the questionnaire, was added for children of ages 4-17 as a part of a collaborative agreement between NCHS and the National Institute of Mental Health (NIMH) of the National Institutes of Health (NIH). The long SDQ consists of 25 scale items. Detailed information on the SDQ can be found in Appendix 5 of the Dataset Documentation for the 2004 NHIS and on the SDQ web site at http://www.sdqinfo.com. The long SDQ has five subscales measuring the following psychological attributes or dimensions: • emotional symptoms; • conduct problems; • hyperactive behavior; • peer relationships; • prosocial behavior. The items in the short SDQ correlate to the subscales in the long SDQ as follows: CMB.020_01.000 Generally obedient, correlates 0.69 with the long SDQ conduct score. CMB.020_02.000 Many worries…, correlates 0.71 with the long SDQ emotion score. CMB.020_03.000 Often unhappy…, correlates 0.64 with the long SDQ emotion score. CMB.020_04.000 Gets along better…, correlates 0.69 with the long SDQ peer problems score. CMB.020_05.000 Sees tasks through, correlates 0.72 with the long SDQ hyperactivity-
inattention score. In order to score the short SDQ the response for each item in CMB.020 is assigned a value
from 0 – 2 based on the scale below, then all values are summed to produce a total score. A total score from 1 to 5 correlates 0.84 with the long SDQ total difficulties score.
Scoring of the Short SDQ
Response Not true Somewhat
true Definitely
true Value 0 1 2
CMB.020 is taken from a set of SDQ extended or impact questions which measure the
impact of the child’s difficulty on various aspects of his/her life. CMB.020 correlates 0.62 with the SDQ impact score from the extended SDQ questions. (See Appendix V of the Dataset Documentation for the 2004 NHIS and/or the SDQ Web site at http://www.sdqinfo.com)

103
Additional References on the SDQ and/or its use in the NHIS
Bourdon KH, Goodman R, Rae D, Simpson G, Koretz D. (2005) The Strengths and Difficulties Questionnaire: U. S. Normative Data and Psychometric Properties. Journal of American Academy of Child and Adolescent Psychiatry, 44(6): 557-564. Goodman, R. (1997) The Strengths and Difficulties Questionnaire: A Research Note. Journal of Child Psychology and Psychiatry. 38: 581-586. Goodman, R. (1999) The Strengths and Difficulties Questionnaire as a Guide to Child Psychiatric Caseness and Consequent Burden. Journal of Child Psychology and Psychiatry. 40 (5): 791-799. Goodman, R. and Scott S. (1999) Comparing the Strengths and Difficulties Questionnaire and the Child Behavior Checklist: Is small beautiful? Journal of Abnormal Child Psychology, 27(1): 7-24. Simpson GA, Bloom B, Cohen R, Blumberg S, Bourdon K. (2005) U. S. Children with Emotional and Behavioral Difficulties: Data from the 2001, 2002, and 2003 National Health Interview Surveys. Advance data from vital and health statistics no. 360. Hyattsville, MD. National Center for Health Statistics.
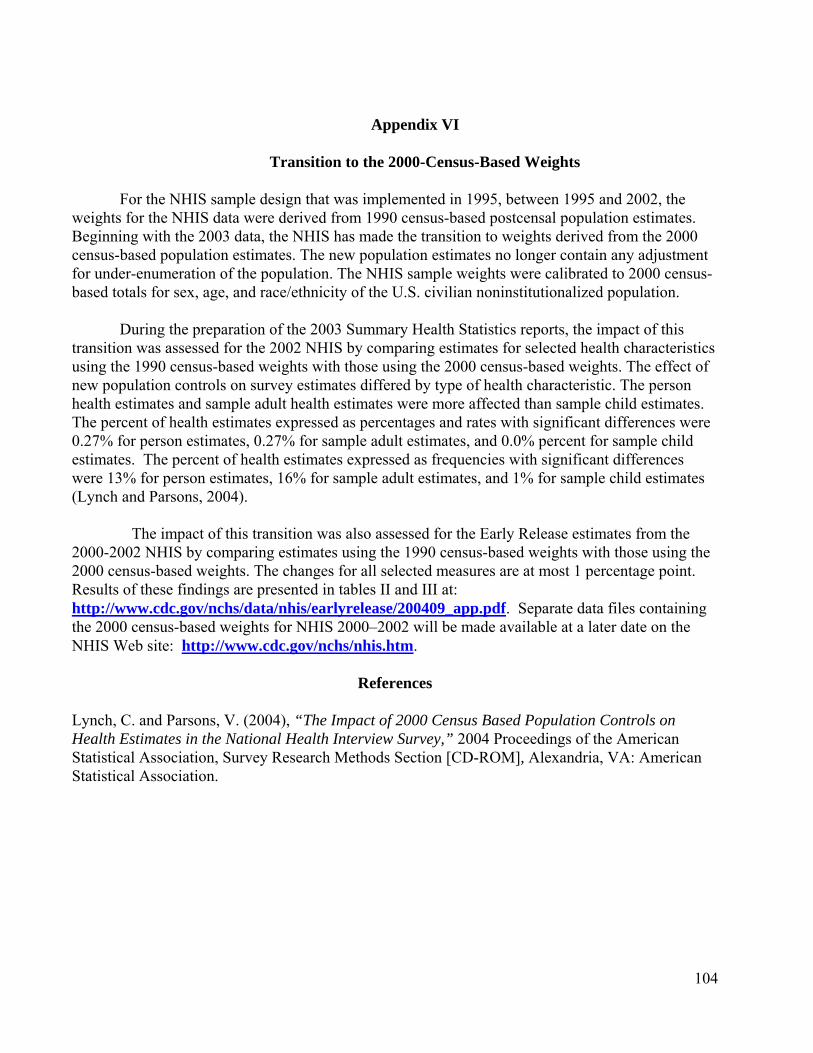
104
Appendix VI
Transition to the 2000-Census-Based Weights
For the NHIS sample design that was implemented in 1995, between 1995 and 2002, the weights for the NHIS data were derived from 1990 census-based postcensal population estimates. Beginning with the 2003 data, the NHIS has made the transition to weights derived from the 2000 census-based population estimates. The new population estimates no longer contain any adjustment for under-enumeration of the population. The NHIS sample weights were calibrated to 2000 census-based totals for sex, age, and race/ethnicity of the U.S. civilian noninstitutionalized population.
During the preparation of the 2003 Summary Health Statistics reports, the impact of this
transition was assessed for the 2002 NHIS by comparing estimates for selected health characteristics using the 1990 census-based weights with those using the 2000 census-based weights. The effect of new population controls on survey estimates differed by type of health characteristic. The person health estimates and sample adult health estimates were more affected than sample child estimates. The percent of health estimates expressed as percentages and rates with significant differences were 0.27% for person estimates, 0.27% for sample adult estimates, and 0.0% percent for sample child estimates. The percent of health estimates expressed as frequencies with significant differences were 13% for person estimates, 16% for sample adult estimates, and 1% for sample child estimates (Lynch and Parsons, 2004).
The impact of this transition was also assessed for the Early Release estimates from the 2000-2002 NHIS by comparing estimates using the 1990 census-based weights with those using the 2000 census-based weights. The changes for all selected measures are at most 1 percentage point. Results of these findings are presented in tables II and III at: http://www.cdc.gov/nchs/data/nhis/earlyrelease/200409_app.pdf. Separate data files containing the 2000 census-based weights for NHIS 2000–2002 will be made available at a later date on the NHIS Web site: http://www.cdc.gov/nchs/nhis.htm.
References
Lynch, C. and Parsons, V. (2004), “The Impact of 2000 Census Based Population Controls on Health Estimates in the National Health Interview Survey,” 2004 Proceedings of the American Statistical Association, Survey Research Methods Section [CD-ROM], Alexandria, VA: American Statistical Association.

105
Appendix VII
Merging Data Files and Combining Years of Data in the NHIS
NHIS data files can be merged within years as well as combined across years. The purpose
of merging data within a particular data year is to incorporate variables from different data files when respondents are common to both files, thereby increasing the number of variables available for analysis for a given individual. In contrast, the purpose behind combining NHIS data files across survey years is to combine respondents from different data years while retaining variables common to both files, thereby increasing the number of respondents (as long as the same variables are found in both files) and the precision of estimates.
Merging Data Files
Unlike survey years prior to 2004, variables are not generally repeated on multiple data
files in the 2005 NHIS. As a result, users may find it necessary to perform additional merging of the 2005 files in order to analyze the data. Each data file contains household, family, and person record identifiers that make merging within the 2005 files possible. Once the data files are sorted by record identifiers common to each file, merging is straightforward. Below is an example of a SAS program that will merge data files within an NHIS data year. Using the household, family, and person record identifiers (HHX, FMX and FPX, respectively), this program merges data from the 2005 Household, Family, Person, and Sample Child data files.
/* Merge the Household file and the Family file. */
/* Create a Household dataset with selected variables and sorted by HHX.*/ DATA HH (KEEP=HHX REGION); /* HH is a SAS dataset; the KEEP statement retains only the listed variables for processing. */ SET NHIS2005.HOUSEHLD; /*The SET statement reads data from the 2005 Household file. */ PROC SORT DATA=HH; /* Sort by HHX, the household identifier. */ BY HHX; RUN; /* Create a Family dataset with selected variables and sorted by HHX. */ DATA FM (KEEP=HHX FMX INCGRP RAT_CAT WTFA_FAM); /* FM is a SAS dataset; the KEEP statement retains only the listed variables for processing. */ SET NHIS2005.FAMILYXX; /*The SET statement reads data from the 2005 Family file. */ PROC SORT DATA=FM; /* Sort by HHX, the household identifier. */ BY HHX; RUN;
DATA HHFM; /* New combined dataset called HHFM */ MERGE FM (IN=FROMFM) HH ; /* Merge the newly created FM and HH files, using an IN statement.*/ BY HHX;

106
IF FROMFM = 1; /* The combined dataset HHFM will contain only those records that are in the Family file; the Household file’s REGION variable will be appended to these records. */ PROC SORT DATA=HHFM; /* Sort by HHX and FMX, the household and family identifiers. */ BY HHX FMX; RUN;
In the code above, the IN statement creates a temporary SAS variable (called FROMFM) that has a value of 1 if the dataset associated with the IN statement contributed to the current observation, or a value of 0 if it did not. The subsequent statement, “IF FROMFM = 1” tells SAS to retain only those observations from the Family file (called FM). For more information on IN statements in SAS, consult Delwiche and Slaughter (1998).
/* Merge the Person file and the combined Family/Household file. */
/* Create a Person file with selected variables. */ DATA PR (KEEP=HHX FMX FPX SEX AGE_P WTFA STRATUM PSU); /* PR is a SAS dataset; the KEEP statement retains only the listed variables for processing. */ SET NHIS2005.PERSONSX; /*The SET statement reads data from the 2005 Person file. */ PROC SORT DATA=PR; /* Sort by HHX and FMX, the household and family identifiers. */ BY HHX FMX; RUN;
DATA PRHHFM; /* Combined Person, Family, and Household dataset called PRHHFM*/ MERGE PR HHFM (DROP=WTFA_FAM); /* Merge the newly created PR file and HHFM, the combined Family/Household file, by the identifiers common to both files. At this point, users may drop the Family file weight and retain only the Person file weight for person-level analyses.*/ BY HHX FMX; PROC SORT DATA=PRHHFM; /* Sort by HHX, FMX, and FPX, the household, family, and person identifiers. */ BY HHX FMX FPX; RUN;
/* Merge the Sample Child file and the combined Person/Family/Household file. */
/* Create a Sample Child file with selected variables. */ DATA CH (KEEP=FPX HHX FMX CASHMEV PROBRX WTFA_SC); /* CH is a SAS dataset; the KEEP statement retains only the listed variables for processing. */ SET NHIS2005.SAMCHILD; /*The SET statement reads data from the 2005 Sample Child file. */ PROC SORT DATA=CH; /* Sort by HHX, FMX, and FPX, the household, family, and person identifiers. */ BY HHX FMX FPX; RUN; DATA CHPRHHFM; /* Combined Sample Child, Person, Family, and Household dataset called CHPRHHFM*/ MERGE PRHHFM CH; /* Merge CH, the newly created Sample Child file, and PRHHFM, the

107
combined Person/Family/Household file, by the identifiers common to both files. BY HHX FMX FPX; RUN;
Combining Years of Data
As previously mentioned, the purpose of combining or concatenating years of data (in SAS terminology) is to increase the number of observations or respondents for the same number of variables, and thus increase the precision of estimates. It is possible to combine data from successive years of the National Health Interview Survey (NHIS) when the questions remain essentially the same over the years being combined.
Combining datasets from more than one year joins them one after the other (concatenates), as opposed to merging datasets. Analysts wishing to do both – merge data from multiple files within years and combine years of data – will need to first merge the data within each single year and then concatenate the files for the selected years of data (see the preceding section on Merging Data Files).
Weights will normally need to be adjusted when combining data years. For example, if two years of NHIS data are combined, the sum of the weights will be about twice the size of the civilian noninstitutionalized population of the United States. To achieve annualized results when two years of NHIS data are combined, one method for weight adjustment is to divide each weight by two before analyzing the data. If data from the period 1997-2005 are combined, the combined data are treated like a single year of data with a larger sample size for the purpose of variance estimation. If data from any year before 1997 are combined with data from 1997 and beyond, variance estimation is more complicated. Refer to Appendix III for more information about variance estimation methods when combining datasets from more than one year.
The following is an example of a SAS program that will combine data files across NHIS data years. The program is written to concatenate the data from the Person files of the 2004 NHIS and the 2005 NHIS.
Important Note Variable names may change from one year to another. Users are advised to check variable names and where names differ, make certain it is appropriate to combine years of data for a given variable.
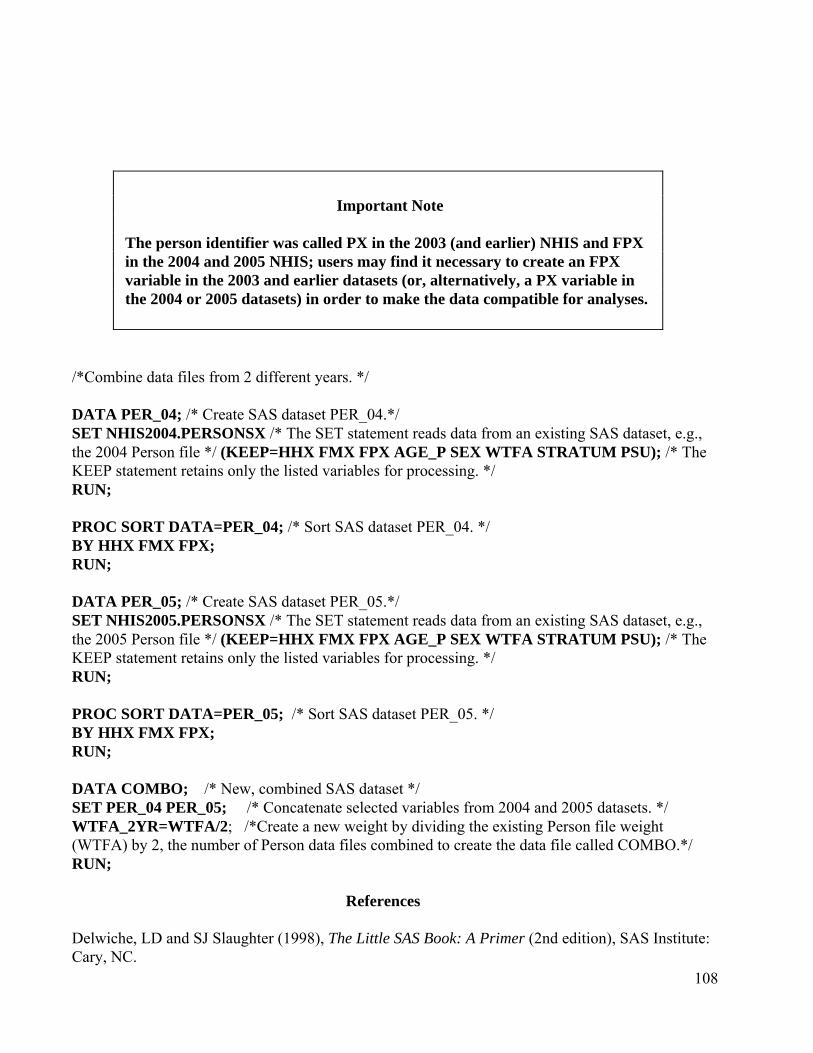
108
/*Combine data files from 2 different years. */
DATA PER_04; /* Create SAS dataset PER_04.*/ SET NHIS2004.PERSONSX /* The SET statement reads data from an existing SAS dataset, e.g., the 2004 Person file */ (KEEP=HHX FMX FPX AGE_P SEX WTFA STRATUM PSU); /* The KEEP statement retains only the listed variables for processing. */ RUN;
PROC SORT DATA=PER_04; /* Sort SAS dataset PER_04. */ BY HHX FMX FPX; RUN;
DATA PER_05; /* Create SAS dataset PER_05.*/ SET NHIS2005.PERSONSX /* The SET statement reads data from an existing SAS dataset, e.g., the 2005 Person file */ (KEEP=HHX FMX FPX AGE_P SEX WTFA STRATUM PSU); /* The KEEP statement retains only the listed variables for processing. */ RUN;
PROC SORT DATA=PER_05; /* Sort SAS dataset PER_05. */ BY HHX FMX FPX; RUN;
DATA COMBO; /* New, combined SAS dataset */ SET PER_04 PER_05; /* Concatenate selected variables from 2004 and 2005 datasets. */ WTFA_2YR=WTFA/2; /*Create a new weight by dividing the existing Person file weight (WTFA) by 2, the number of Person data files combined to create the data file called COMBO.*/ RUN;
References
Delwiche, LD and SJ Slaughter (1998), The Little SAS Book: A Primer (2nd edition), SAS Institute: Cary, NC.
Important Note The person identifier was called PX in the 2003 (and earlier) NHIS and FPX in the 2004 and 2005 NHIS; users may find it necessary to create an FPX variable in the 2003 and earlier datasets (or, alternatively, a PX variable in the 2004 or 2005 datasets) in order to make the data compatible for analyses.
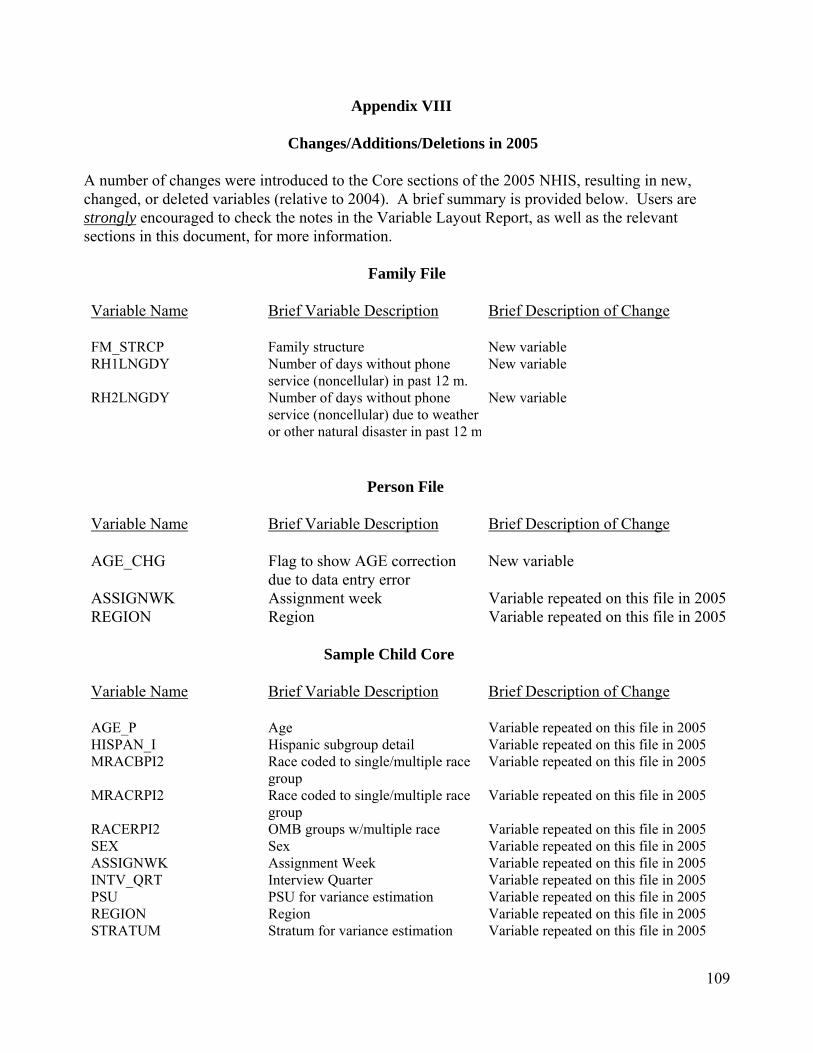
109
Appendix VIII
Changes/Additions/Deletions in 2005
A number of changes were introduced to the Core sections of the 2005 NHIS, resulting in new, changed, or deleted variables (relative to 2004). A brief summary is provided below. Users are strongly encouraged to check the notes in the Variable Layout Report, as well as the relevant sections in this document, for more information.
Family File
Variable Name
Brief Variable Description
Brief Description of Change
FM_STRCP Family structure New variable RH1LNGDY Number of days without phone
service (noncellular) in past 12 m. New variable
RH2LNGDY Number of days without phone service (noncellular) due to weather or other natural disaster in past 12 m
New variable
Person File
Variable Name
Brief Variable Description
Brief Description of Change
AGE_CHG Flag to show AGE correction due to data entry error
New variable
ASSIGNWK Assignment week Variable repeated on this file in 2005 REGION Region Variable repeated on this file in 2005
Sample Child Core
Variable Name
Brief Variable Description
Brief Description of Change
AGE_P Age Variable repeated on this file in 2005 HISPAN_I Hispanic subgroup detail Variable repeated on this file in 2005 MRACBPI2 Race coded to single/multiple race
group Variable repeated on this file in 2005
MRACRPI2 Race coded to single/multiple race group
Variable repeated on this file in 2005
RACERPI2 OMB groups w/multiple race Variable repeated on this file in 2005 SEX Sex Variable repeated on this file in 2005 ASSIGNWK Assignment Week Variable repeated on this file in 2005 INTV_QRT Interview Quarter Variable repeated on this file in 2005 PSU PSU for variance estimation Variable repeated on this file in 2005 REGION Region Variable repeated on this file in 2005 STRATUM Stratum for variance estimation Variable repeated on this file in 2005

110
Child Influenza Immunization Section (CFI)
Variable Name
Brief Variable Description
Brief Description of Change
CSHFLUYR Flu shot in past 12 months New variable CSHFLU_M Month of most recent flu shot New variable CSHFLU_Y Year of most recent flu shot New variable CSPFLUYR Flu nasal spray past 12 months New variable CSPFLU_M Month of most recent flu nasal
vaccine New variable
CSPFLU_Y Year of most recent flu nasal vaccine
New variable
Child Mental Health Section (CMH)
Variable Name Brief Variable Description Brief Description of Change
RSCL1_S1 Considerate of others feelings Deleted RSCL1_H1 Restless/overactive Deleted
RSCL1_E1 Often complains of headache, stomach aches or sickness
Deleted
RSCL1_S2 Shares with other children/youth Deleted RSCL1_C1 Often loses temper Deleted RSCL2_P1 Solitary/prefers to play/be alone Deleted RSCL2_C2 Well behaved/does what requested Moved to CMB RSCL2_E2 Many worries/often seems worried Moved to CMB RSCL2_S3 Helpful if someone hurt/ill Deleted RSCL2_H2 Constantly fidgeting/squirming Deleted RSCL3_P2 At least one good friend Deleted RSCL3_C3 Fights with other children/or bullies
them (youth) Deleted
RSCL3_E3 Unhappy/depressed/tearful Moved to CMB RSCL3_P3 Liked by other children/youth Deleted RSCL3_H3 Distracted/wandering concentration Deleted RSCL4_E4 Nervous/clingy/loses confidence Deleted RSCL4_S4 Kind to younger children Deleted RSCL4_C4 Often lies OR cheats Deleted RSCL4_P4 Picked on or bullied by other
children/youth Deleted
RSCL4_S5 Offers to help others Deleted RSCL5_H4 Thinks things out before acting Deleted RSCL5_C5 Steals from home/school Deleted
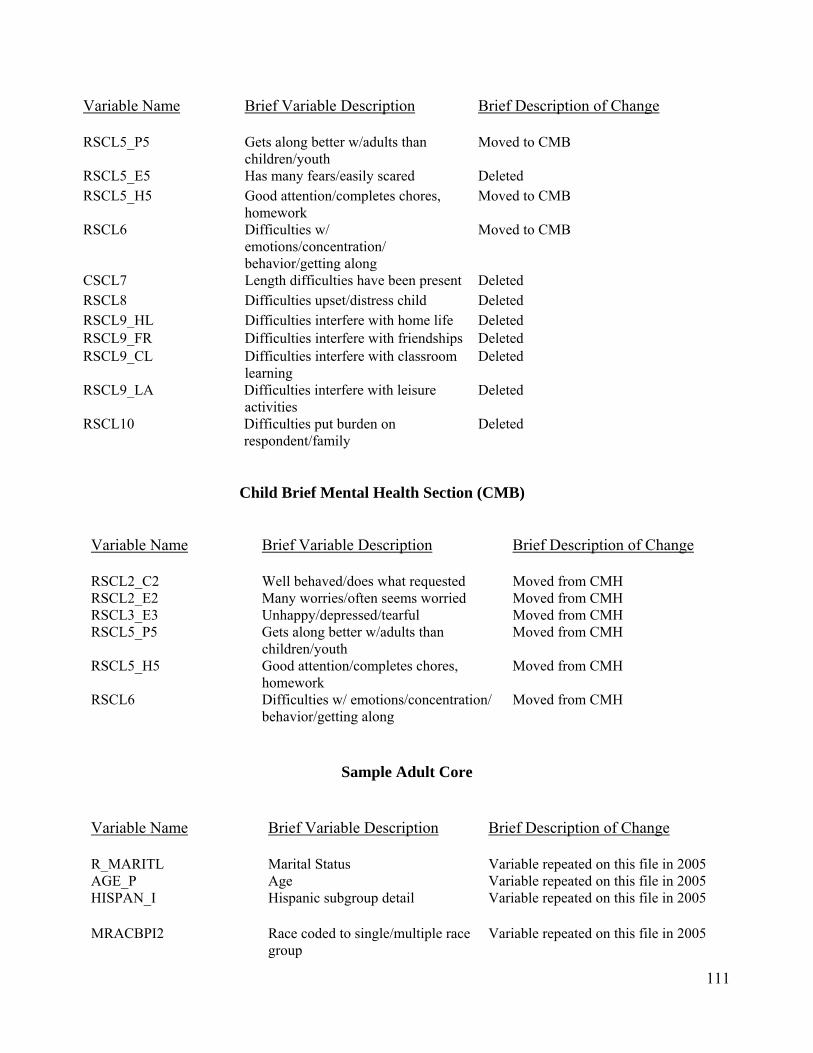
111
Variable Name Brief Variable Description Brief Description of Change
RSCL5_P5 Gets along better w/adults than children/youth
Moved to CMB
RSCL5_E5 Has many fears/easily scared Deleted RSCL5_H5 Good attention/completes chores,
homework Moved to CMB
RSCL6 Difficulties w/ emotions/concentration/ behavior/getting along
Moved to CMB
CSCL7 Length difficulties have been present Deleted RSCL8 Difficulties upset/distress child Deleted RSCL9_HL Difficulties interfere with home life Deleted RSCL9_FR Difficulties interfere with friendships Deleted RSCL9_CL Difficulties interfere with classroom
learning Deleted
RSCL9_LA Difficulties interfere with leisure activities
Deleted
RSCL10 Difficulties put burden on respondent/family
Deleted
Child Brief Mental Health Section (CMB)
Variable Name
Brief Variable Description
Brief Description of Change
RSCL2_C2 Well behaved/does what requested Moved from CMH RSCL2_E2 Many worries/often seems worried Moved from CMH RSCL3_E3 Unhappy/depressed/tearful Moved from CMH RSCL5_P5 Gets along better w/adults than
children/youth Moved from CMH
RSCL5_H5 Good attention/completes chores, homework
Moved from CMH
RSCL6 Difficulties w/ emotions/concentration/ behavior/getting along
Moved from CMH
Sample Adult Core
Variable Name
Brief Variable Description
Brief Description of Change
R_MARITL Marital Status Variable repeated on this file in 2005 AGE_P Age Variable repeated on this file in 2005 HISPAN_I Hispanic subgroup detail Variable repeated on this file in 2005
MRACBPI2 Race coded to single/multiple race group
Variable repeated on this file in 2005

112
Variable Name
Brief Variable Description
Brief Description of Change
MRACRPI2 Race coded to single/multiple race group
Variable repeated on this file in 2005
RACERPI2 OMB groups w/multiple race Variable repeated on this file in 2005 SEX Sex Variable repeated on this file in 2005 ASSIGNWK Assignment Week Variable repeated on this file in 2005 INTV_QRT Interview Quarter Variable repeated on this file in 2005 PSU PSU for variance estimation Variable repeated on this file in 2005 REGION Region Variable repeated on this file in 2005 STRATUM Stratum for variance estimation Variable repeated on this file in 2005
Adult Sociodemographics Section (ASD)
Variable Name
Brief Variable Description
Brief Description of Change
INDSTR1A Detailed industry classification (1987 SIC)
Deleted variable
INDSTR2A Simple industry classification (1987 SIC)
Deleted variable
OCCUP1A Detailed occupation classification (1987 SOC)
Deleted variable
OCCUP2A Simple occupation classification (1987 SOC)
Deleted variable
Adult Health Care Access and Utilization Section (AAU)
Variable Name Brief Variable Description Brief Description of Change
ASHFLU_M Month of most recent flu shot New variable ASHFLU_Y Year of most recent flu shot New variable ASPFLU_M Month of most recent flu nasal vaccine New variable ASPFLU_Y Year of most recent flu nasal vaccine New variable
Related Documents


