2004 Science Grade 3 Part 1 ACPS

2004 Science Grade 3 Part 1 ACPS. 1. Which of these is most like the animal in the data collected shown in the chart? 1234567891011121314151617181920.
Dec 30, 2015
Welcome message from author
This document is posted to help you gain knowledge. Please leave a comment to let me know what you think about it! Share it to your friends and learn new things together.
Transcript

2004 Science Grade 3Part 1
ACPS

1. Which of these is most like the animal in the data collected shown in the chart?
A B C D
25% 25%25%25%
1 2 3 4 5 6 7 8 9 10 11 12 13 14 15 16 17 18 19 20
21 22 23 24 25 26 27 28 29 30
A. AB. BC. CD. D

2. The picture shows a tomato plant. What part of the plant is the tomato?
25% 25%25%25%
1 2 3 4 5 6 7 8 9 10 11 12 13 14 15 16 17 18 19 20
21 22 23 24 25 26 27 28 29 30
A. The rootB. The stemC. The leafD. The fruit
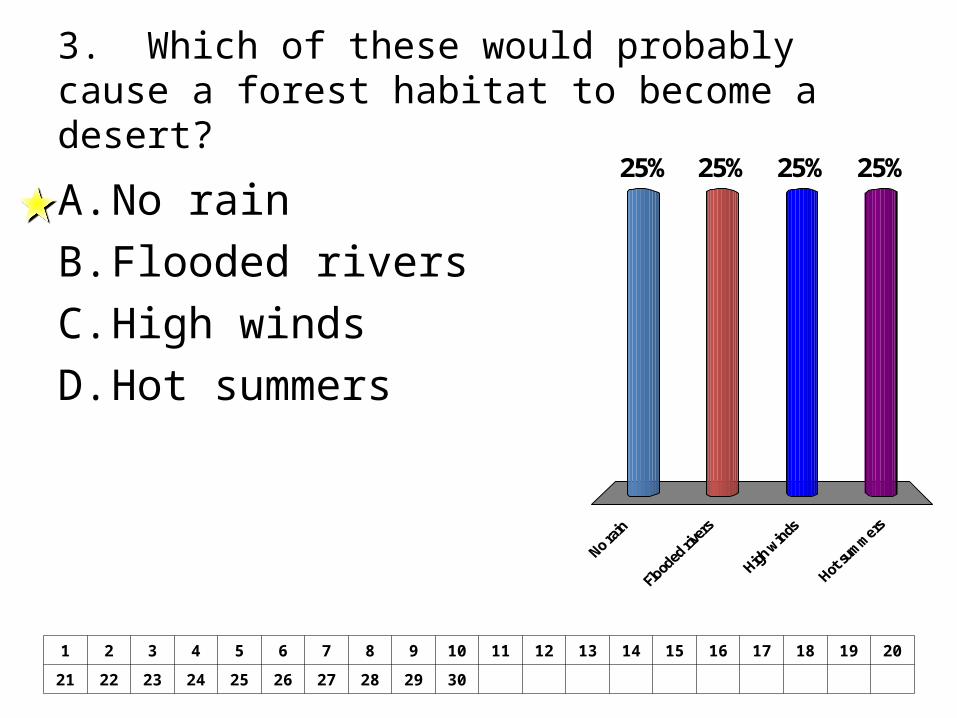
3. Which of these would probably cause a forest habitat to become a desert?
25% 25%25%25%
1 2 3 4 5 6 7 8 9 10 11 12 13 14 15 16 17 18 19 20
21 22 23 24 25 26 27 28 29 30
A. No rainB. Flooded riversC. High windsD. Hot summers

4. Magnets will stick to refrigerator doors because the doors are--
25% 25%25%25%
1 2 3 4 5 6 7 8 9 10 11 12 13 14 15 16 17 18 19 20
21 22 23 24 25 26 27 28 29 30
A. Painted with plasticB. Made of metalC. Easy to openD. heavy
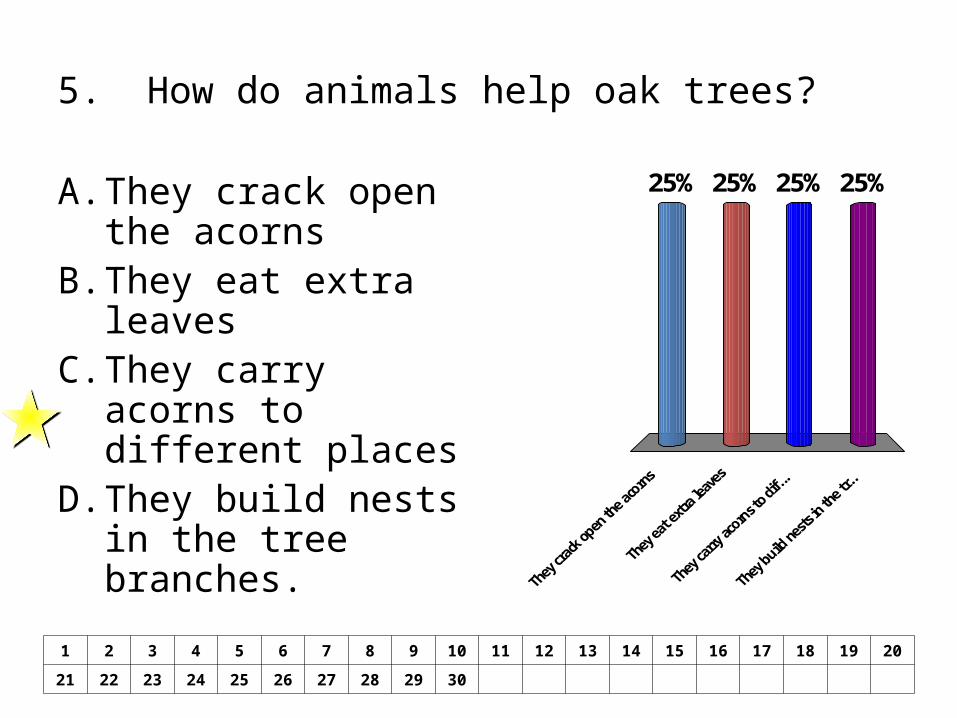
5. How do animals help oak trees?
25% 25%25%25%
1 2 3 4 5 6 7 8 9 10 11 12 13 14 15 16 17 18 19 20
21 22 23 24 25 26 27 28 29 30
A. They crack open the acorns
B. They eat extra leaves
C. They carry acorns to different places
D. They build nests in the tree branches.

6. Which type of tree is least common in this forest?
25% 25%25%25%
1 2 3 4 5 6 7 8 9 10 11 12 13 14 15 16 17 18 19 20
21 22 23 24 25 26 27 28 29 30
A. PineB. OakC. MapleD. Elm
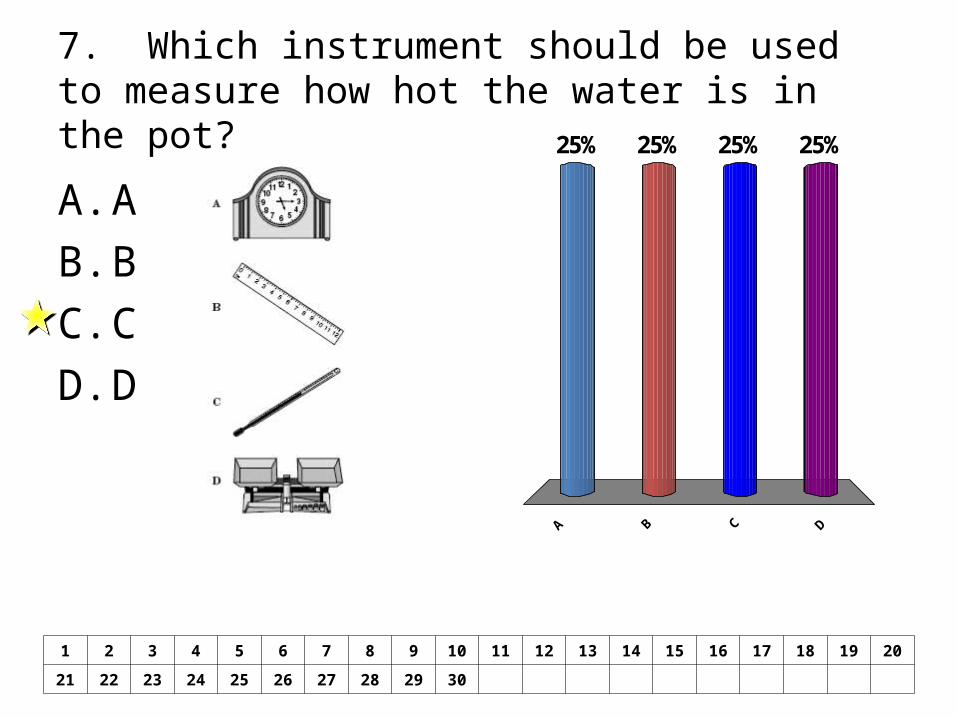
7. Which instrument should be used to measure how hot the water is in the pot?
A B C D
25% 25%25%25%
1 2 3 4 5 6 7 8 9 10 11 12 13 14 15 16 17 18 19 20
21 22 23 24 25 26 27 28 29 30
A. AB. BC. CD. D

8. Snow and sleet are two kinds of---
25% 25%25%25%
1 2 3 4 5 6 7 8 9 10 11 12 13 14 15 16 17 18 19 20
21 22 23 24 25 26 27 28 29 30
A. PrecipitationB. EvaporationC. CondensationD. Temperatures
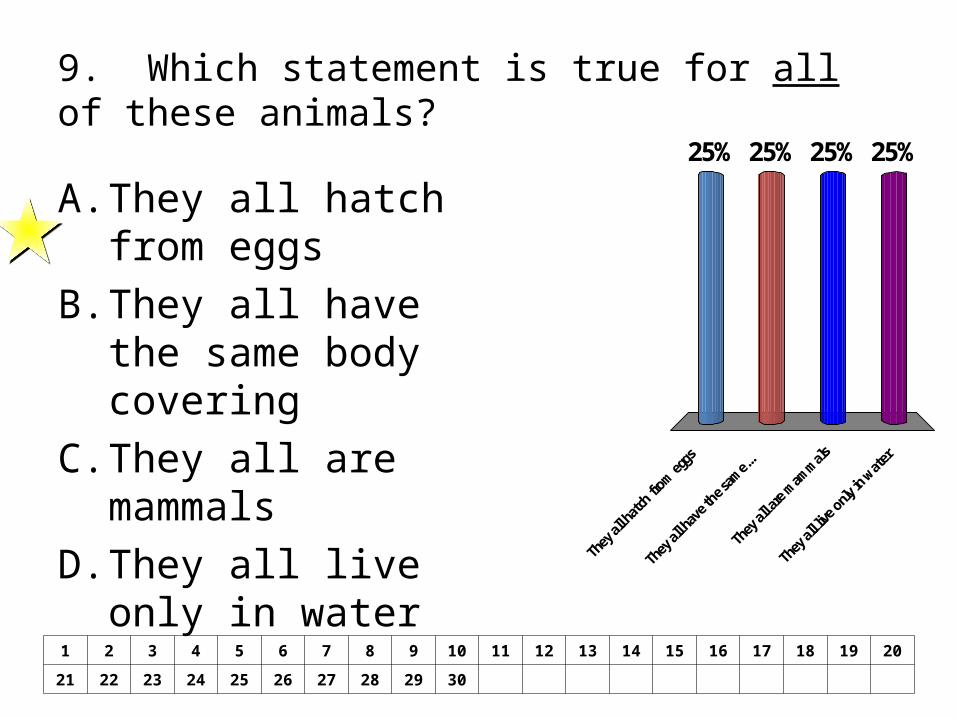
9. Which statement is true for all of these animals?25% 25%25%25%
1 2 3 4 5 6 7 8 9 10 11 12 13 14 15 16 17 18 19 20
21 22 23 24 25 26 27 28 29 30
A. They all hatch from eggs
B. They all have the same body covering
C. They all are mammals
D. They all live only in water
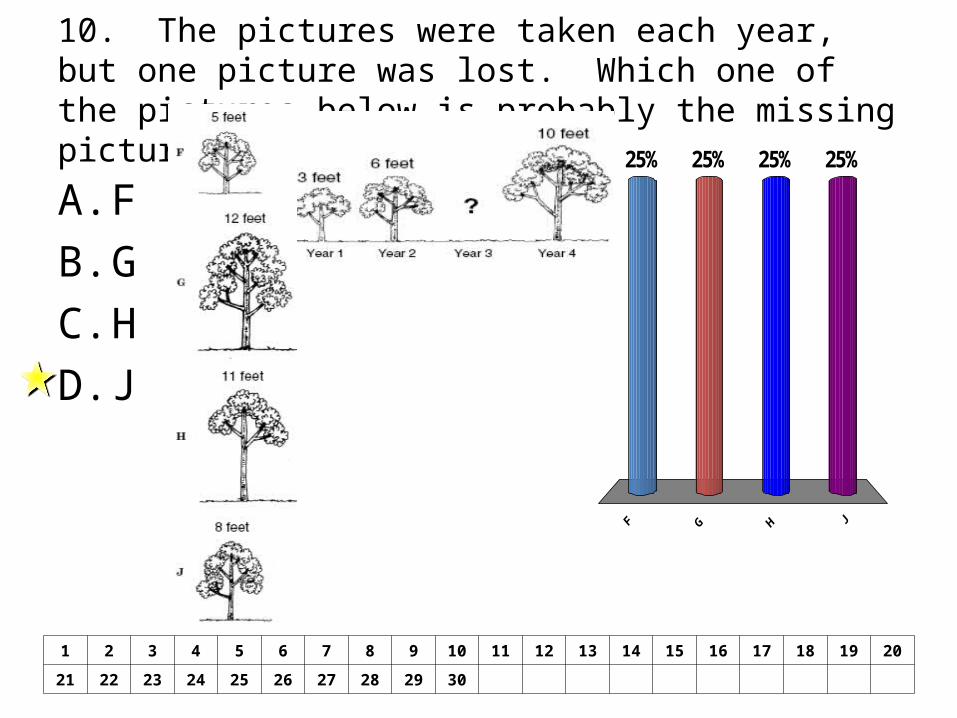
10. The pictures were taken each year, but one picture was lost. Which one of the pictures below is probably the missing picture?
25% 25%25%25%
1 2 3 4 5 6 7 8 9 10 11 12 13 14 15 16 17 18 19 20
21 22 23 24 25 26 27 28 29 30
A. FB. GC. HD. J
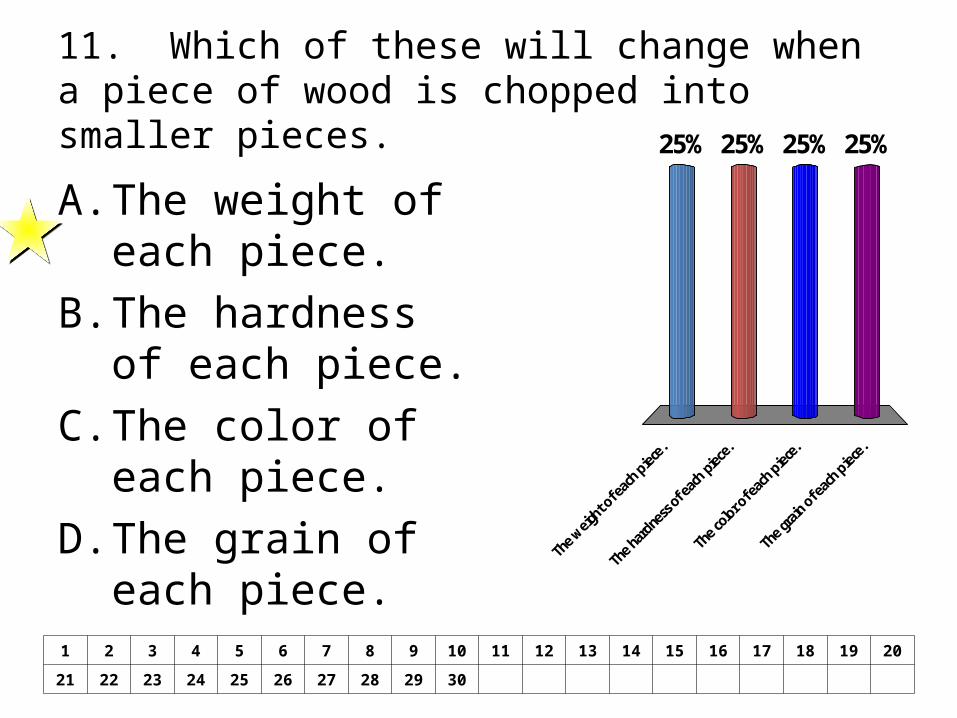
11. Which of these will change when a piece of wood is chopped into smaller pieces.
The weigh
t of e
ach piece
.
The hardness
of each
piece.
The color o
f each
piece.
The grain of e
ach piece
.
25% 25%25%25%
1 2 3 4 5 6 7 8 9 10 11 12 13 14 15 16 17 18 19 20
21 22 23 24 25 26 27 28 29 30
A. The weight of each piece.
B. The hardness of each piece.
C. The color of each piece.
D. The grain of each piece.

12. The head of an axe is wide at one end and pointed at the other to help cut or trim trees the axe head is an example of--
25% 25%25%25%
1 2 3 4 5 6 7 8 9 10 11 12 13 14 15 16 17 18 19 20
21 22 23 24 25 26 27 28 29 30
A. A pulleyB. A wheel and
axleC. A wedgeD. An inclined
plane

13. According to the five-day weather forecast--25% 25%25%25%
1 2 3 4 5 6 7 8 9 10 11 12 13 14 15 16 17 18 19 20
21 22 23 24 25 26 27 28 29 30
A. Skies will be cloudy all week
B. Warmer weather is likely on the weekend
C. The daily temperature will rise
D. Snow is most likely on the weekend

14. All rivers flow to oceans or lakes because water--25% 25%25%25%
1 2 3 4 5 6 7 8 9 10 11 12 13 14 15 16 17 18 19 20
21 22 23 24 25 26 27 28 29 30
A. Can evaporateB. Flows downhillC. Is clearD. Can freeze

15. The picture shows the water cycle. At which point in the cycle does most evaporation occur?
1 2 3 4
25% 25%25%25%
1 2 3 4 5 6 7 8 9 10 11 12 13 14 15 16 17 18 19 20
21 22 23 24 25 26 27 28 29 30
A. 1B. 2C. 3D. 4
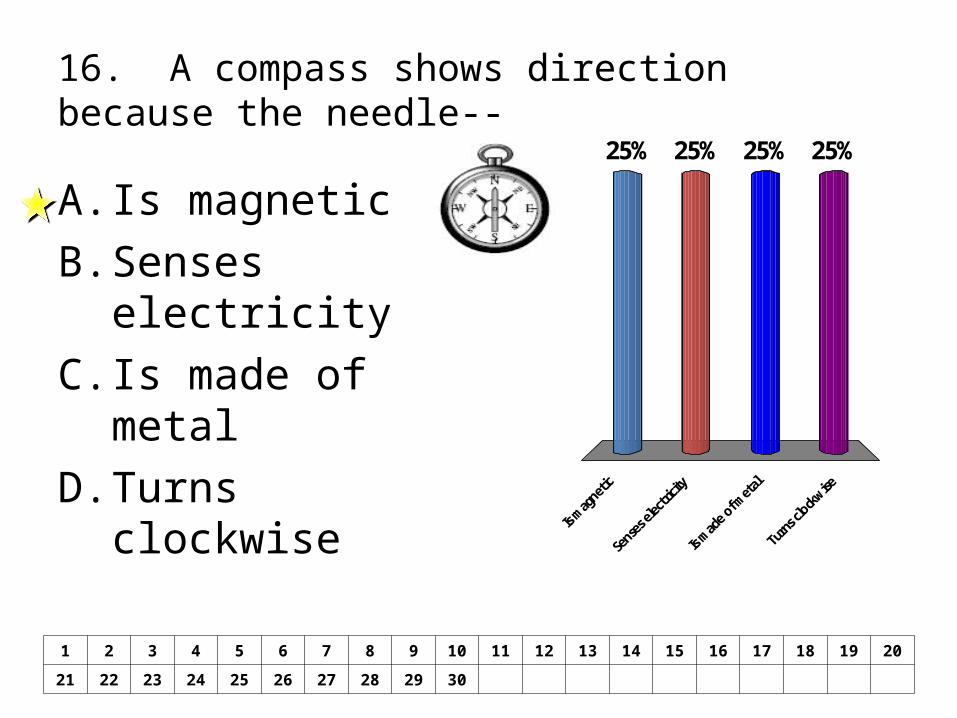
16. A compass shows direction because the needle--
Is m
agnetic
Sense
s electr
icity
Is m
ade of meta
l
Turns c
lockwise
25% 25%25%25%
1 2 3 4 5 6 7 8 9 10 11 12 13 14 15 16 17 18 19 20
21 22 23 24 25 26 27 28 29 30
A. Is magneticB. Senses electricityC. Is made of metalD. Turns clockwise
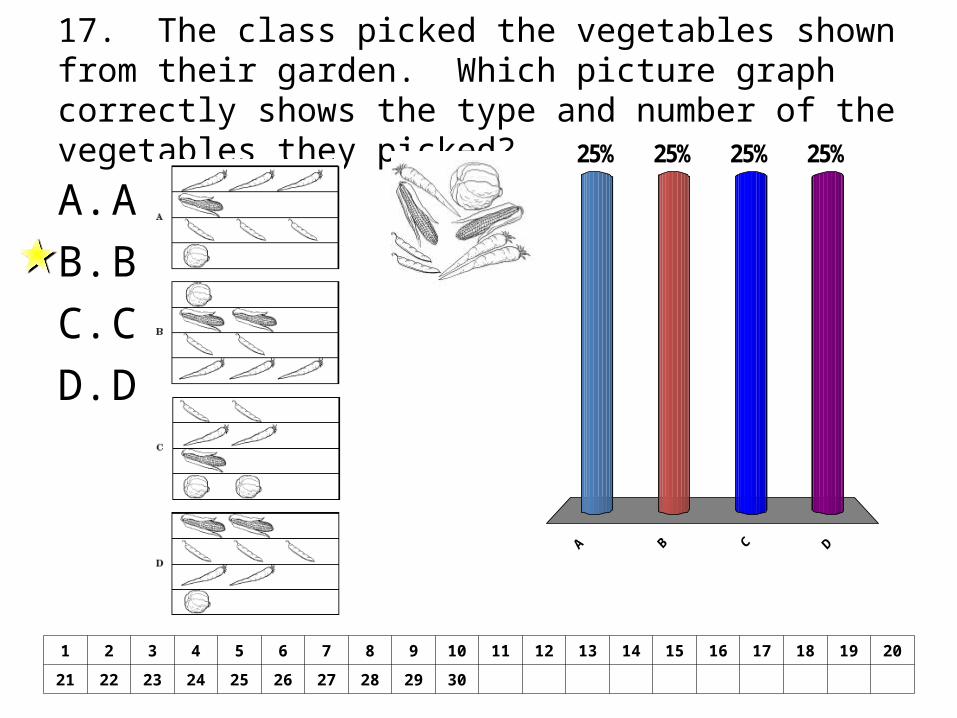
17. The class picked the vegetables shown from their garden. Which picture graph correctly shows the type and number of the vegetables they picked? 25% 25%25%25%
1 2 3 4 5 6 7 8 9 10 11 12 13 14 15 16 17 18 19 20
21 22 23 24 25 26 27 28 29 30
A. AB. BC. CD. D
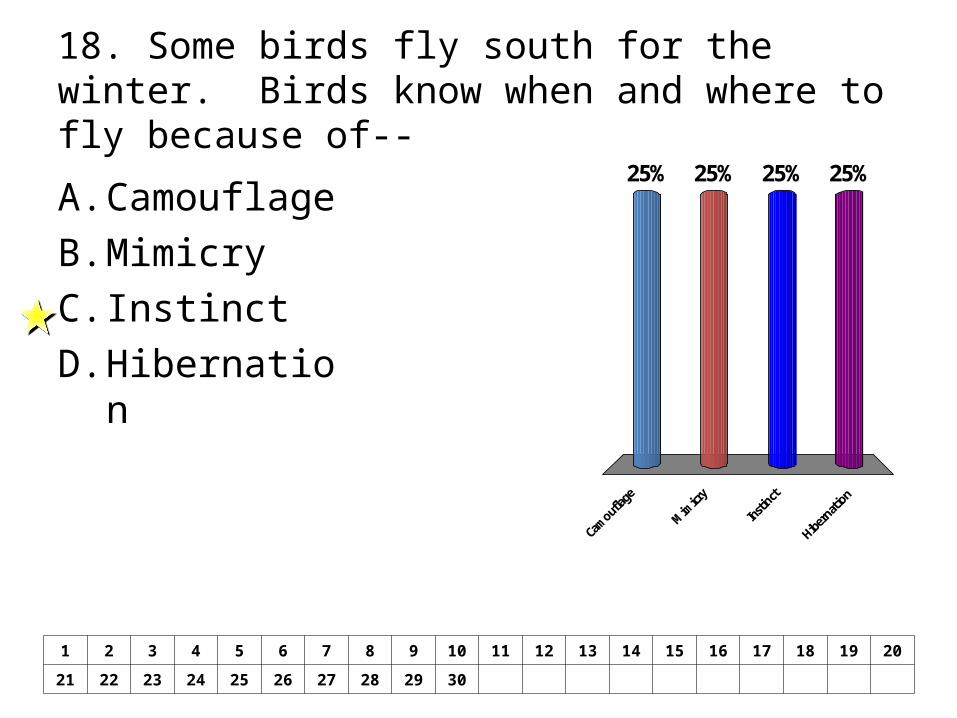
18. Some birds fly south for the winter. Birds know when and where to fly because of--
Camouflage
Mim
icry
Insti
nct
Hibern
ation
25% 25%25%25%
1 2 3 4 5 6 7 8 9 10 11 12 13 14 15 16 17 18 19 20
21 22 23 24 25 26 27 28 29 30
A. CamouflageB. MimicryC. InstinctD. Hibernation
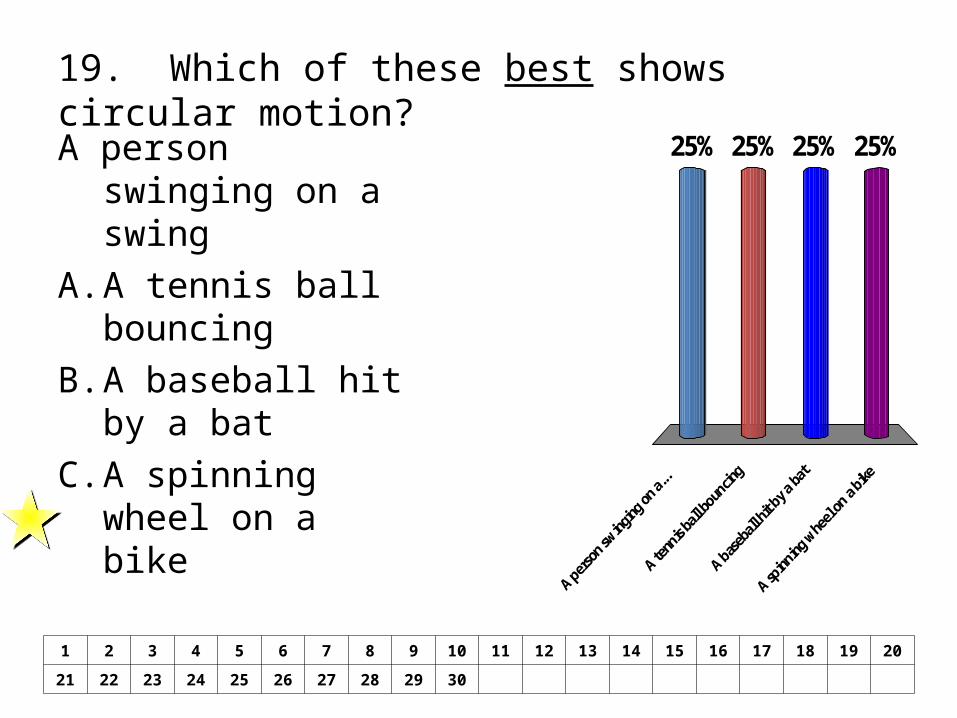
19. Which of these best shows circular motion?25% 25%25%25%
1 2 3 4 5 6 7 8 9 10 11 12 13 14 15 16 17 18 19 20
21 22 23 24 25 26 27 28 29 30
A person swinging on a swing
A. A tennis ball bouncing
B. A baseball hit by a bat
C. A spinning wheel on a bike
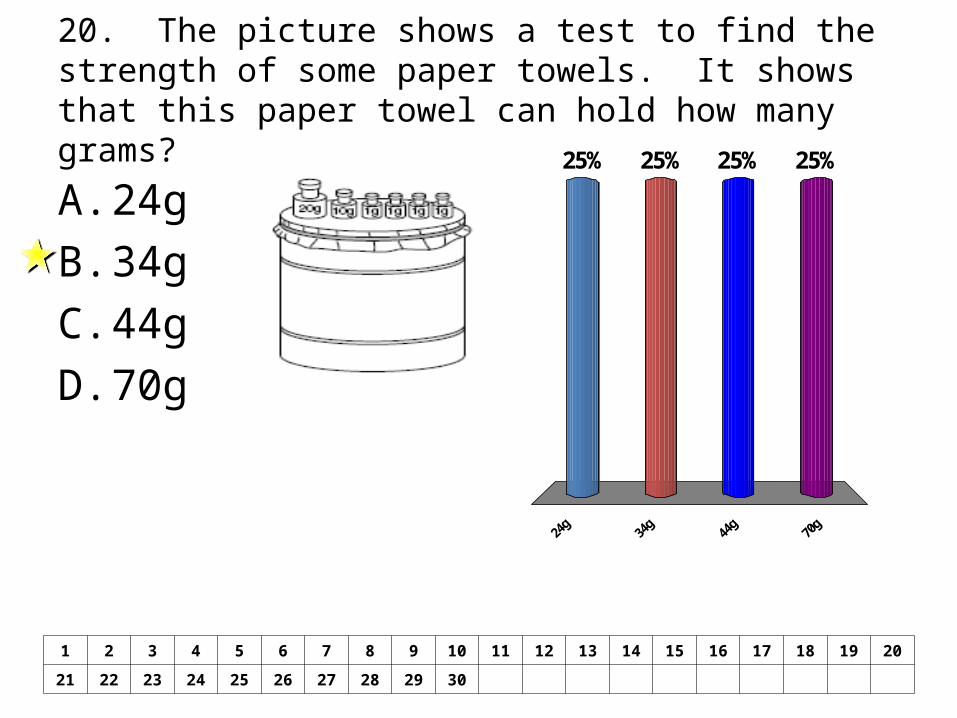
20. The picture shows a test to find the strength of some paper towels. It shows that this paper towel can hold how many grams?
24g 34g
44g 70g
25% 25%25%25%
1 2 3 4 5 6 7 8 9 10 11 12 13 14 15 16 17 18 19 20
21 22 23 24 25 26 27 28 29 30
A. 24gB. 34gC. 44gD. 70g

21 The picture shows a large area and the animals that live there. Which is the largest population in this area?
25% 25%25%25%
1 2 3 4 5 6 7 8 9 10 11 12 13 14 15 16 17 18 19 20
21 22 23 24 25 26 27 28 29 30
A. The mountain lion
B. The deerC. The rabbitD. The hawk
Related Documents


