2004 Fish Survey of Clark Lake By Steve Hogler, Steve Surendonk and Pat McKee Wisconsin Department of Natural Resources ABSTRACT Clark Lake is the second largest lake in Door County and is impounded by a dam on Whitefish Bay Creek. The lake has a surface area of 864 acres, a maximum depth of 22 feet and an average depth of 7 feet. Clark Lake has a Trophic State Index (TSI) rating of mesotrophic indicating moderately productive water. At times, because the lake is shallow, especially on the south end, lake water can be very turbid due to wind action or from heavy boating use. Other resource issues that affect Clark Lake include the operation of the outlet dam, a decline in panfish populations and a carp population perceived by some to be a problem. A number of fish surveys have been conducted on the lake since the 1950’s. Over time the lake has seen shifts in fish populations with walleye and smallmouth bass alternating dominance. Panfish have shown a similar trend with yellow perch, rock bass and bluegill alternating in dominance. Because of concerns about the perceived decline in the fishery of Clark Lake since the 1994 survey, a comprehensive fish survey was conducted in 2005 to evaluate the fishery of the lake. The comprehensive fisheries survey on Clark Lake began in April 2005 and continued through October and followed standard lake sampling protocols. A variety of gear types were used during different seasons to survey the lake and included fyke nets, mini-fyke nets and electroshocking boats. Because each gear type varied in species-specific capture efficiency, we were able to thoroughly assess the status of the entire fish community in the lake. A total of 1,825 fish were collected during the fish survey. The most abundant fish captured were walleye, yellow perch and rock bass. Fish populations in Clark Lake appear to be in a state of change. Walleye numbers were down since 1994 based on mark-recapture population estimates, but relative abundance estimates (CPE) show the population to be stable. Walleye reproduction appears to be adequate to maintain to the current population and growth, as indicated by mean length at age, was near the state averages, although few large walleye were present in the lake. Smallmouth bass numbers increased over previous surveys and largemouth bass continued to be a large part of the fishery. Bass populations appear to be reproducing well based on fyke net and summer mini-fyke survey results. The northern pike population appears to be steady in the lake. Few northern pike are large in size. Growth is slightly slower than statewide averages.

Welcome message from author
This document is posted to help you gain knowledge. Please leave a comment to let me know what you think about it! Share it to your friends and learn new things together.
Transcript
2004 Fish Survey of Clark Lake By
Steve Hogler, Steve Surendonk and Pat McKee Wisconsin Department of Natural Resources
ABSTRACT
Clark Lake is the second largest lake in Door County and is impounded by a dam on Whitefish Bay Creek. The lake has a surface area of 864 acres, a maximum depth of 22 feet and an average depth of 7 feet. Clark Lake has a Trophic State Index (TSI) rating of mesotrophic indicating moderately productive water. At times, because the lake is shallow, especially on the south end, lake water can be very turbid due to wind action or from heavy boating use. Other resource issues that affect Clark Lake include the operation of the outlet dam, a decline in panfish populations and a carp population perceived by some to be a problem. A number of fish surveys have been conducted on the lake since the 1950’s. Over time the lake has seen shifts in fish populations with walleye and smallmouth bass alternating dominance. Panfish have shown a similar trend with yellow perch, rock bass and bluegill alternating in dominance. Because of concerns about the perceived decline in the fishery of Clark Lake since the 1994 survey, a comprehensive fish survey was conducted in 2005 to evaluate the fishery of the lake. The comprehensive fisheries survey on Clark Lake began in April 2005 and continued through October and followed standard lake sampling protocols. A variety of gear types were used during different seasons to survey the lake and included fyke nets, mini-fyke nets and electroshocking boats. Because each gear type varied in species-specific capture efficiency, we were able to thoroughly assess the status of the entire fish community in the lake. A total of 1,825 fish were collected during the fish survey. The most abundant fish captured were walleye, yellow perch and rock bass. Fish populations in Clark Lake appear to be in a state of change. Walleye numbers were down since 1994 based on mark-recapture population estimates, but relative abundance estimates (CPE) show the population to be stable. Walleye reproduction appears to be adequate to maintain to the current population and growth, as indicated by mean length at age, was near the state averages, although few large walleye were present in the lake. Smallmouth bass numbers increased over previous surveys and largemouth bass continued to be a large part of the fishery. Bass populations appear to be reproducing well based on fyke net and summer mini-fyke survey results. The northern pike population appears to be steady in the lake. Few northern pike are large in size. Growth is slightly slower than statewide averages.

2
Panfish in general have declined in number since the 1960’s. The rock bass population has fluctuated in number, while the yellow perch and bluegill populations have declined. Growth of panfish in Clark Lake appears to be average. Forage minnows are common in the lake near Logan Creek, but the lack of suitable habitat in other areas of the lake limits their abundance across the entire lake. Carp although present in the lake, were captured in low number and do not appear to be a problem in the lake at this time.
Based on the results from the fish survey, several recommendations can be made. These recommendations include:
• Encourage the re-colonization of aquatic plants by establishing no wake areas or by temporary placement of wave and turbidity barriers to get plants started. Aquatic plants provide critical nursery, feeding and refuge habitat and are necessary for maintaining healthy, stable fish communities in lakes.
• Encourage shoreline residents to reestablish natural shorelines. This will
also help plant communities as well as many other animal populations.
• Monitor the movement and abundance of exotics into Clark Lake. If these species get firmly established in the lake, more changes in the fish community are likely.
• Encourage the Lake Association and its members to protect sensitive
areas.

3
INTRODUCTION
Clark Lake (WBIC 97700) is the second largest lake in Door County and is impounded by a dam on Whitefish Bay Creek (Figure 1). The lake has a surface area of 864 acres, a maximum depth of 22 feet and an average depth of 7 feet (Door County SWCD 2000). Clark Lake has a Trophic State Index (TSI) rating of mesotrophic indicating moderately productive water (WDNR 2001). At times, because the lake is shallow, especially on the south end, lake water can be very turbid due to wind action or from heavy boating use. Other resource issues that affect Clark Lake include the operation of the outlet dam, the decline in panfish populations and a carp population that is perceived by some to be a problem.
Figure 1. Clark Lake is located in Door County just north of Sturgeon Bay. The status of the aquatic plant community has been monitored on Clark Lake since the 1980’s. A 1992 study indicated that while plant diversity has increased in shallow water (less than 0.5 meters), overall the lake has seen a decline in native species with an substantial increase in the exotic species, Eurasian water milfoil (Rasman 1992). Most of the past efforts to manage the fishery of Clark Lake have focused on fish stocking. Records indicate that since 1933 the lake has been stocked with a wide variety of fish including bass, walleye, perch, bluegill, crappie and bullhead. Fish stocked since the 1970’s have included bluegill, largemouth bass, northern pike and perch (Kernen 1977).
Clark Lake

4
A number of fish surveys have been conducted since the early 1950’s that have characterized the fishery of the lake. Cline (1951) found that smallmouth bass was the dominant gamefish of the lake with lower numbers of walleye and northern pike captured. He found that panfish were low in number, but were of a very “desirable” size. He recommended no additional predator stockings. Hacker (1958) found that walleye and smallmouth were the dominant gamefish in his summer seine hauls. The panfish population was dominated by yellow perch, bluegill and rock bass. He also noted that many small perch were seen passing through the seine. He did not recommend any new management strategies for the lake. Several surveys were conducted by Kernen in the 1960’s to assess the fish populations of the lake. In a summer seine survey, Kernen (1968) found that yellow perch dominated his catch, with walleye the most abundant gamefish captured. He stated that the absence of carp during his survey indicated the carp population was less than what some anglers believed. In spring fyke net and electroshocking surveys, Kernen (1969) found that the walleye and northern pike population numbers had changed little since the 1950’s, but bass populations appeared to have declined in numbers. He found that walleye were slow growing, but were reproducing successfully. Yellow perch were the most abundant panfish and had increased in abundance since the 1950’s. He believed that the abundance of perch may have been negatively impacting spawning success of other species. Rock bass abundance had remained stable while bluegill had declined in abundance. He did not believe carp were a problem in the lake. Finally, he indicated that infertility of the lake limits the total fish biomass of the lake and makes fishing difficult. During the 1970’s several surveys were conducted to assess the success of stockings of largemouth bass, northern pike and bluegill and to assess the overall fish population of the lake. Surveys by Kernen (1973 and 1975) indicated that the fish population of the lake was dominated by perch with very little change in the overall abundance of other species. He concluded that the recent stockings of bass and bluegill were unsuccessful while the pike stockings appeared to be beneficial. However, a 1976 survey (Kernen 1977) found a dramatic shift in the fishery of the lake. Walleye had increased in number and now were the dominant species captured. Yellow perch numbers had dropped dramatically and average size had increased. He recommended the cessation of bass, bluegill and northern pike stocking. He also commented on the infertility of the lake and that proper operation of the dam would block upstream movement of fish from Whitefish Bay Creek into Clark Lake. A 1981 survey of Clark Lake (Lychwick 1982) found that the fish populations had changed little since the 1976 survey (Kernen 1977). The walleye and northern pike populations were unchanged, while the smallmouth bass population appeared to be increasing in number with several year classes of young bass

5
noted. The yellow perch population was similar to what was observed in 1976. Lychwick noted a decrease in the forage base of the lake in 1981 as compared to earlier studies. He believed that the lake drawdown during winter months had frozen out invertebrates and rooted aquatic plants. He recommended higher lake levels during winter months to protect critical habitat needed by plants and invertebrates, which indirectly supply critical habitat or forage for fish. In 1994 Lychwick (1995) surveyed Clark Lake to assess the fish populations of the lake. Walleye, rock bass and white sucker were the most common species captured. Fewer bullhead, northern pike and yellow perch were handled than in previous surveys. During the survey year, a contact creel survey was conducted. During winter months poor conditions lead to only five northern pike being caught. During the open water fishing season, May through October, it estimated that anglers harvested 312 walleye, 234 northern pike, 352 rock bass and 229 yellow perch. Total fishing hours were estimated at 3660, with most of the fishing occurring in July and August. Because of concerns about the perceived decline in the fishery of Clark Lake since the 1994 survey, a comprehensive fish survey was conducted in 2005 to evaluate the fishery of the lake.
METHODS Spring Fyke Netting A standard comprehensive fisheries survey on Clark Lake began in April 2005 and continued through October. Seven fyke nets were set following ice-out on April 13, fished until April 21 and were used to capture and mark adult spawning walleye, and northern pike for the purpose of estimating adult population size (Figure 2). Other species captured in fyke nets were also marked for potential population size estimation, but nets were set in habitats to target adult spawning walleye. Overall, there were 49 net lifts for a total effort of 70 net-nights during the netting period. All fish were identified, measured, marked with a caudal fin clip and scales or spines were removed from a sub-sample for age determination.

6
Figure 2. The locations of the seven fyke nets that were fished in Clark Lake from April 13 through April 21, 2005 are marked by an X on the lake map. Spring Electrofishing Shortly after the completion of fyke netting, three randomly selected 1 mile sections of the shoreline were electroshocked on the night of May 4 to look for marked fish (Figure 3). All gamefish fish were netted, identified, examined for marks, and measured.
X
X
X
X
X
X
X

7
Figure 3. The three electroshocking stations are shown by the red lines on the map of Clark Lake. Summer Surveys Centrarchid Electrofishing Similarly, the same 3 sections of shoreline were electroshocked on the nights of May 31 and June 8 to estimate adult smallmouth and largemouth bass population size and to estimate panfish relative abundance. All fish were netted, identified and counted. Gamefish were examined for marks, measured, and had scales or a spine removed for age determination. Fish Community Five mini-fyke nets were set and fished on July 26 and July 27 to index juvenile gamefish abundance and fish community composition (Figure 4). All fish were identified to species and counted. Gamefish and panfish species were counted and measured. Fall Recruitment and Index Sampling On the night of October 20, the three shoreline sections were electroshocked to determine the abundance young-of-year fish and to assess the general population of fish (Figure 3). All fish were netted, identified, and counted. Gamefish and panfish were measured.
8
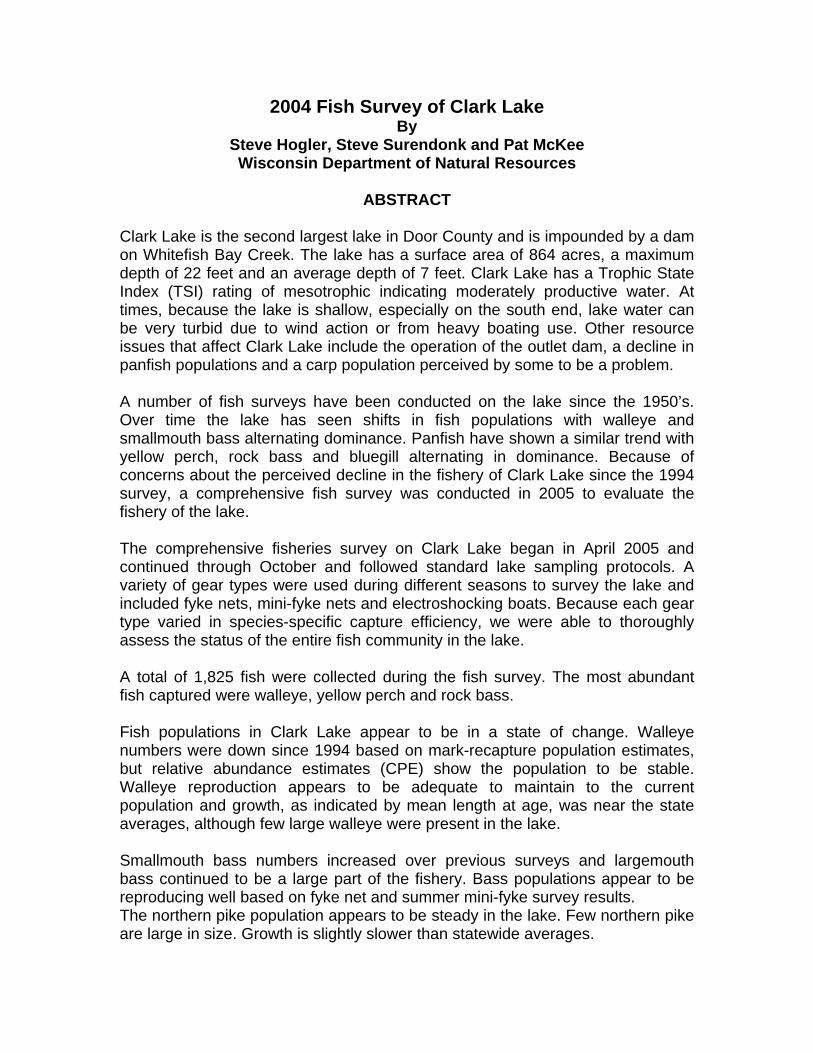
Figure 4. The locations of the five mini-fyke nets that were fished in Clark Lake on July 26 and 27, 2005 are marked by an X on the lake map. Statistical Analyses Basic fisheries statistics, such as average length, length frequencies by survey type, age distributions, and population estimates were calculated. Mean length at age was determined first by using an age length key to extrapolate length age distributions from the sub-sample of fish that were aged to the full sample length frequency, then second calculating the arithmetic mean of the length for a given age from the estimated full sample age distribution. The Schnabel and Petersen population estimation methods were used to estimate community population size when the recapture numbers were large enough to provide an unbiased estimate of population size. For the Petersen method, population size was estimated as the ratio between the number of fish initially marked and released during the marking period (M), times the number of fish captured and examined for marks (C) during the recapture period, divided by the number of fish that were found to have marks during the recapture period (R) using the Petersen estimator (Ricker 1975). Using the Schnabel multi-census
X
X
X
X
X

9
model, each fyke netting day and each electrofishing run were defined as a sampling time period, and running population estimates were calculated for each time period (Ricker 1975). In general, Schnabel population estimates tend to be more precise than Petersen estimates because the population is sampled repeatedly in time, and with each successive time period sampled, we know the true population size with more certainty.
RESULTS
Spring Fyke Netting During the fyke net portion of the survey, a total of 703 fish were captured for a CPE of 10.04 fish per net per night. Of the fourteen species captured, walleye and rock bass dominated the catch, with substantially fewer smallmouth bass, northern pike and white sucker captured (Table 1). Table 1. Species captured from Clark Lake with fyke nets during April 13–21, 2005. Species Number Captured Number
Recaptured Schnabel
Population Estimate (Range)
Bowfin 5 Rainbow Trout 2 Northern Pike 66 2 634
(232-1584) Common Carp 4 Longnose Sucker 18 4 White Sucker 64 9 240
(144-424) Bullhead sp. 6 Channel Catfish 1 Rock Bass 182 42 411
(305-564) Pumpkinseed 1 Bluegill 20 Smallmouth Bass 72 2 450
(201-1126) Yellow Perch 37 1 278
(84-505) Walleye 225 55 485
(374-628)

10
Gamefish
Walleye Walleye were the most commonly captured gamefish during fyke netting (Table 1). The 225 walleye ranged in length from 241 mm to 640 mm and had an average length of 423 mm (Table 2). Using mark and recapture during spring surveys and the Schnabel technique to estimate population size, the walleye population in Clark Lake is likely between 374 and 628 individual walleye or 0.4 to 0.7 walleye per surface acre (Table 1). Age was determined for most of the walleye that were captured using a dorsal spine. Ages ranged from age 2 through age 11 (Table 2). Age 5 was the most common age walleye followed by age 4. Age 5 walleye averaged 421 mm in length. From this data it appears that in Clark Lake, walleye begin to spawn at age 3 and most spawn by age 4 or 5. Young fish appear to be present in the lake, but numbers decline steadily after age 6. Growth of walleye in Clark Lake when compared to statewide age at length tables, appear to be at or near state rates (Table 3).

11
Table 2. Walleye length frequency and age distribution for fish captured on Clark Lake with fyke nets, April 2005.
Length Age (mm) Number 1 2 3 4 5 6 7 8 9 10+ <200 210 220 230 240 4 4 250 1 1 260 4 4 270 1 1 280 290 1 1 300 1 1 310 320 330 2 2 340 1 1 350 11 11 360 10 8 2 370 9 7 2 380 11 3 8 390 15 13 2 400 13 7 6 410 24 12 12 420 25 5 18 2 430 17 1 9 5 2 440 15 7 7 1 450 7 1 6 460 9 1 5 3 470 9 1 5 2 1 480 6 3 2 1 490 5 3 2 500 5 2 3 510 6 3 3 520 530 540 3 1 1 1 550 3 1 2 560 570 2 1 1 580 590 600 3 1 2 610 1 1 620 630 640 1 1
SUM 225 11 33 50 57 36 18 13 5 2 AVE. 423 256 356 396 421 454 479 529 568 590 S.D. 15.7 16.2 16.3 15.8 20.1 30 49.2 29.5 28.3
12
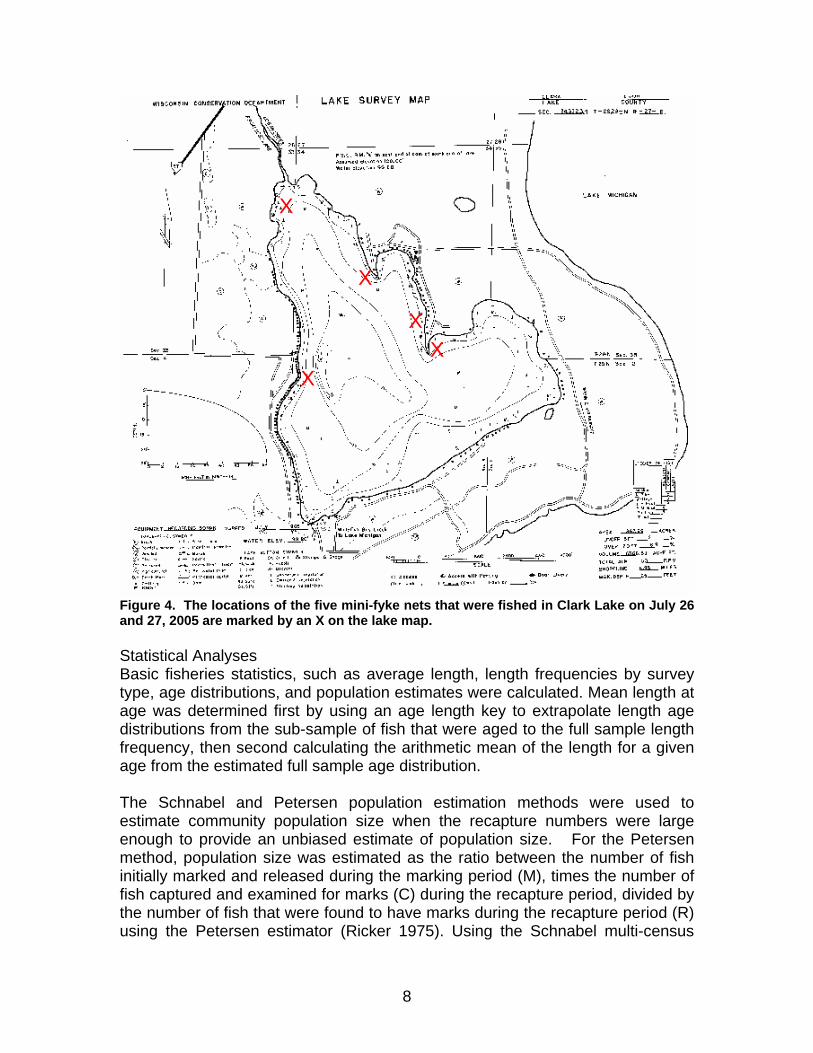
Table 3. Average length at age as determined by spines or scales for fish captured in fyke nets on Clark Lake in April 2005.
Species AGE 1 AGE 2 AGE 3 AGE 4 AGE 5 AGE 6 AGE 7 AGE 8 AGE 9 AGE 10+
Northern Pike -- 335 476 511 573 725 890 -- -- 1010 (State Average) (356) (406) (470) (546) (610) (650) (706) (762) (787) Rock Bass -- 90 129 171 212 239 255 269 273 285 (State Average) (53) (91) (127) (155) (175) (193) (213) (226) (239) (244) Bluegill -- 131 182 217 (State Average) (64) 97) (122) (147) (167) (183) (196) Smallmouth Bass -- 150 232 293 353 409 429 452 480 490 (State Average) (97) (168) (236) (292) (343) (381) (432) (457) (472) Yellow Perch -- 130 164 220 250 (State Average) (74) (119) (152) (180) (208) Walleye -- 256 356 396 421 454 479 529 568 590 (State Average) (152) (254) (324) (381) (432) (457) (497) (526) (551)
Northern Pike
The 66 northern pike that were captured during spring surveys ranged in length from 280 mm to 1010 mm and averaged 541 mm in length (Table 4). Using the Schnabel method to estimate population number, it was estimated that between 232 and 1584 northern pike were in the lake at the time of the survey (Table 1). This estimate should be viewed with caution because the low number northern pike that were captured during fyke netting may not allow for an accurate population estimate. Ages were obtained from sectioning the first anal spine. Ages 2 through 11 were obtained in the sample (Table 4). Age 5 northern pike were the most abundant followed by age 3. Age 5 northern pike had an average length of 573 mm. Very few northern pike older than age 5 were captured
Male northern pike in Clark Lake begin to spawn at age 2 or 3 and most females spawn by age 4 or 5. Growth of northern pike in Clark Lake when compared to statewide age at length tables, appear to be less than state rates (Table 3).

13
Table 4. Northern pike length frequency and age distribution for fish captured on Clark Lake with fyke nets, April 2005. Note that the length scale is not continuous with the 900 through 990 mm range omitted.
Length Total Age (mm) Number 1 2 3 4 5 6 7 9 9 10+ 280 1 1 290 1 1 300 1 1 310 320 330 340 1 1 350 1 1 360 1 1 370 380 2 2 390 400 410 1 1 420 430 440 450 1 1 460 1 1 470 480 6 5 1 490 3 3 500 5 2 3 510 1 1 520 2 1 1 530 7 1 6 540 550 4 1 3 560 3 3 570 2 2 580 5 5 590 1 1 600 3 3 610 2 2 620 3 3 630 640 2 1 1 650 1 1 660 670 680 690 700 710 720 730 740 750 760 1 1 770 780 790 800 850 1 1 890 1 1
1010 1 1 SUM 65 0 8 13 8 30 4 1 0 0 1 AVE. 541 335 476 511 573 725 890 -- -- 1010

14
Smallmouth Bass The seventy-two smallmouth that were captured by fyke net, ranged in length from 142 mm to 515 mm with an average length of 375 mm (Table 5). Using the Schnabel method, it is estimated that the smallmouth population ranges between 201 and 1126 individuals. Because the number of captured and recaptured smallmouth bass was low, estimates of population size may under represent the total number of smallmouth bass in Clark Lake. Ages for smallmouth bass were determined with the use of dorsal spines from samples collected with fyke nets and electroshocking during the May-June period. Ages 2 through 10 were present in the aged sample of fish (Table 5). Age 5 fish were the most common, followed by age 6 and age 7. Age 5 smallmouth bass averaged 353 mm in length. On Clark Lake it appears that smallmouth bass spawn by age 5, although some male fish begin at ages 2 or 3. The length at age comparison between smallmouth bass in Clark Lake to statewide averages can be made with the data we collected to determine how bass are growing in the lake. Our data indicates that bass in Clark Lake at all ages are growing very near statewide rates (Table 3).

15
Table 5. Smallmouth bass length frequency and age distribution for fish captured on Clark Lake during spring and summer fyke netting and electrofishing surveys in 2005.
Length Age (mm) Number 1 2 3 4 5 6 7 8 9 10
90 100 110 120 130 140 2 2 150 160 170 1 1 180 190 1 1 200 210 220 230 2 2 240 1 1 250 2 2 260 1 270 2 2 280 1 1 290 300 2 2 310 1 1 320 1 1 330 5 5 340 5 5 350 3 3 360 4 4 370 1 1 380 3 3 390 6 2 4 400 5 4 1 410 5 4 1 420 5 3 2 430 5 2 3 440 6 1 4 1 450 5 1 4 460 1 1 470 2 1 1 480 490 3 1 2 500 1 1 510 520 530 540 550 560 570 580 590
SUM 80 0 3 6 7 23 18 12 6 4 2 AVE. 387 150 232 293 353 409 429 452 480 490 S.D. 43.4 17.3 22.3 19.8 20.1 15.3 14.4 9.8 18.3 --
16
Panfish
Rock Bass
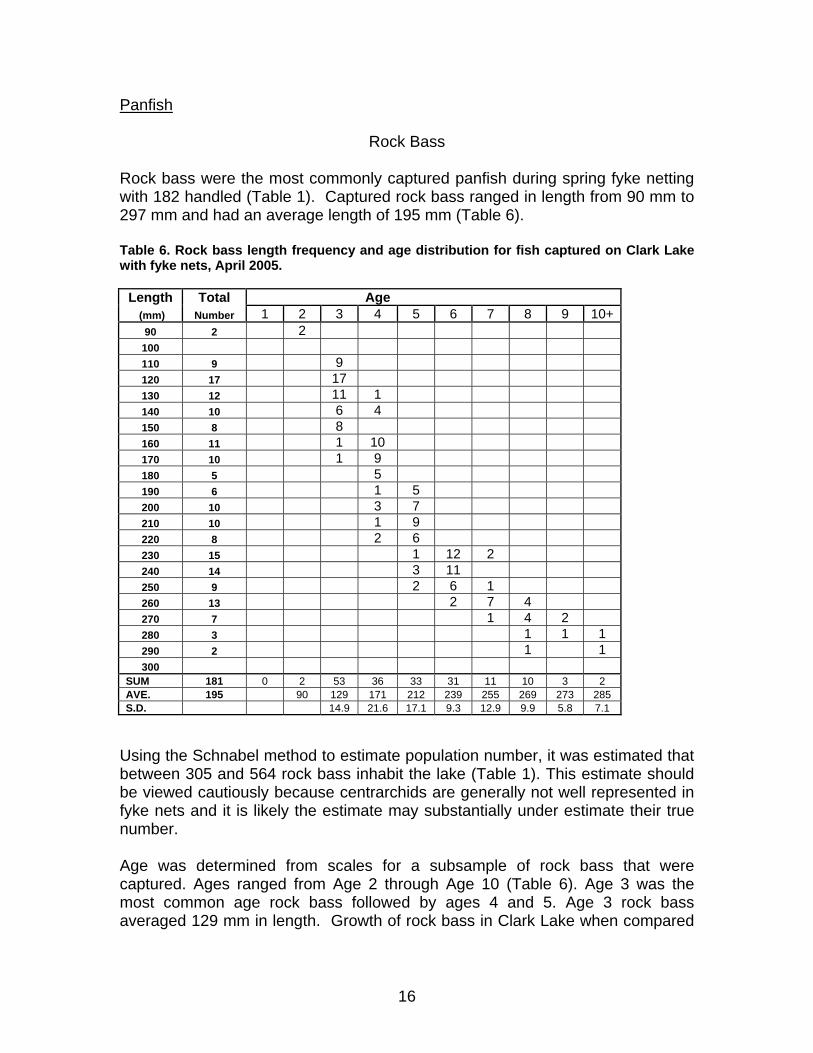
Rock bass were the most commonly captured panfish during spring fyke netting with 182 handled (Table 1). Captured rock bass ranged in length from 90 mm to 297 mm and had an average length of 195 mm (Table 6). Table 6. Rock bass length frequency and age distribution for fish captured on Clark Lake with fyke nets, April 2005.
Length Total Age (mm) Number 1 2 3 4 5 6 7 8 9 10+
90 2 2 100 110 9 9 120 17 17 130 12 11 1 140 10 6 4 150 8 8 160 11 1 10 170 10 1 9 180 5 5 190 6 1 5 200 10 3 7 210 10 1 9 220 8 2 6 230 15 1 12 2 240 14 3 11 250 9 2 6 1 260 13 2 7 4 270 7 1 4 2 280 3 1 1 1 290 2 1 1 300
SUM 181 0 2 53 36 33 31 11 10 3 2 AVE. 195 90 129 171 212 239 255 269 273 285 S.D. 14.9 21.6 17.1 9.3 12.9 9.9 5.8 7.1
Using the Schnabel method to estimate population number, it was estimated that between 305 and 564 rock bass inhabit the lake (Table 1). This estimate should be viewed cautiously because centrarchids are generally not well represented in fyke nets and it is likely the estimate may substantially under estimate their true number. Age was determined from scales for a subsample of rock bass that were captured. Ages ranged from Age 2 through Age 10 (Table 6). Age 3 was the most common age rock bass followed by ages 4 and 5. Age 3 rock bass averaged 129 mm in length. Growth of rock bass in Clark Lake when compared

17
to statewide age at length tables, show that in Clark Lake rock bass are growing at state rates through age 3 and then above state rates at older ages (Table 3).
Yellow Perch
Thirty-seven yellow perch were captured during fyke netting (Table 1). These perch ranged in length from 131 mm to 251 mm and had an average length of 171 mm (Table 7). Table 7. Yellow perch length frequency and age distribution for fish captured on Clark Lake with fyke nets, April 2005
Length Total Age (mm) Number 1 2 3 4 5
90 100 110 120 130 3 2 1 140 3 3 150 10 10 160 6 6 170 3 3 180 5 5 190 3 3 200 1 1 210 220 2 1 1 230 240 250 1 1
SUM 37 0 2 33 1 1 AVE. 171 130 164 220 250S.D. 20
Using the Schnabel method to estimate population number, it was estimated that between 84 and 505 yellow perch were in the lake at the time of the survey (Table 1). This estimate should be viewed with caution because the low number yellow perch that were captured during fyke netting may not allow for an accurate estimate of total number. The age of captured yellow perch was determined by the use of scales. Yellow perch age ranged from age 2 through age 5 (Table 7). Age 3 was the most common age for captured perch. Age 3 yellow perch had an average length of 164 mm. Growth of yellow perch in Clark Lake when compared to statewide age at length tables, indicates that in Clark Lake, yellow perch are growing at state rates through age 3 and then above state rates at older ages (Table 3).

18
Bluegill and Pumpkinseed
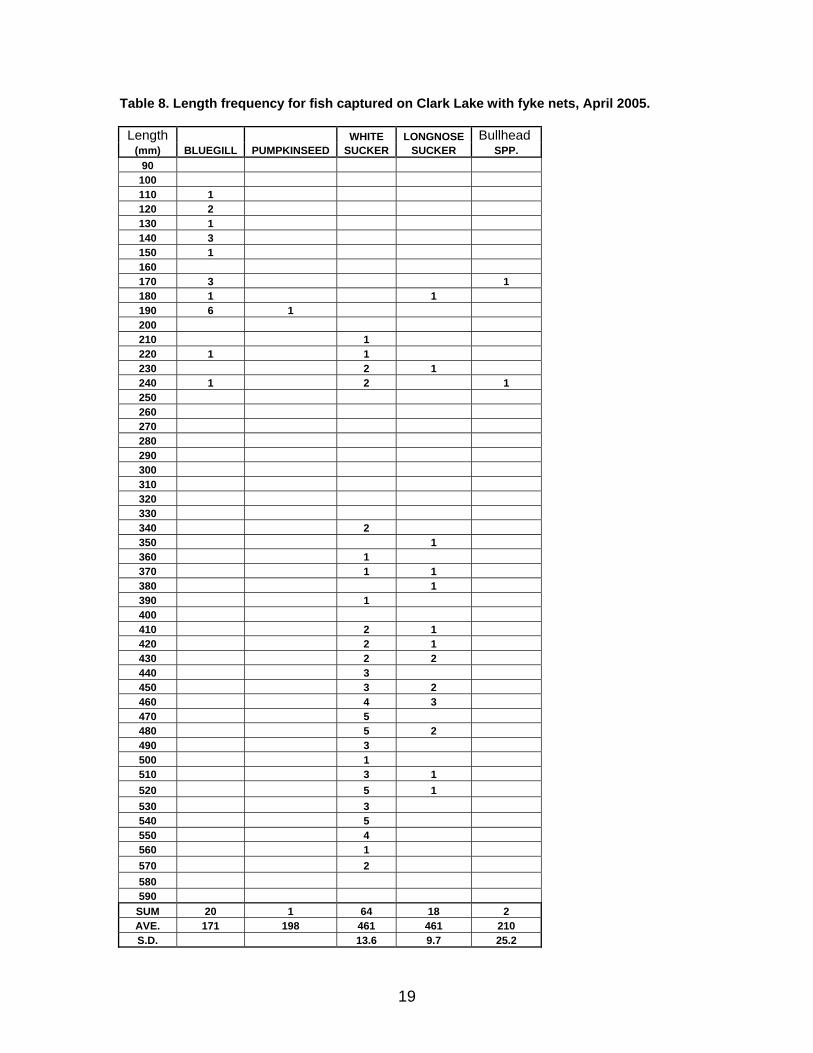
Few bluegill or pumpkinseed were captured during fyke netting. The twenty captured bluegill ranged in length from 112 mm to 245 mm with an average length of 171 mm (Table 8). Age of captured bluegill ranged from age 2 through age 4, with ages 2 and 3 the most common. Length at age was much greater that statewide averages indicating good bluegill growth in the lake (Table 3). However, because few bluegill were aged, growth data should be viewed cautiously. The single pumpkinseed was 198 mm in length.
Other Species
Seven additional species were captured during fyke netting and in order of abundance included white sucker, longnose sucker, bullhead, bowfin, carp rainbow trout and channel catfish (Table 1). The sixty-four white sucker ranged in length from 210 mm to 580 mm and had average length of 461 mm (Table 8). It was estimated that the white sucker population ranged between 144 and 424 individuals (Table 1). Longnose sucker ranged in length from 186 mm to 527 mm and had an average length of 461 mm (Table 8).
19
Table 8. Length frequency for fish captured on Clark Lake with fyke nets, April 2005.
Length WHITE LONGNOSE Bullhead (mm) BLUEGILL PUMPKINSEED SUCKER SUCKER SPP.
90 100 110 1 120 2 130 1 140 3 150 1 160 170 3 1 180 1 1 190 6 1 200 210 1 220 1 1 230 2 1 240 1 2 1 250 260 270 280 290 300 310 320 330 340 2 350 1 360 1 370 1 1 380 1 390 1 400 410 2 1 420 2 1 430 2 2 440 3 450 3 2 460 4 3 470 5 480 5 2 490 3 500 1 510 3 1 520 5 1 530 3 540 5 550 4 560 1 570 2 580 590
SUM 20 1 64 18 2 AVE. 171 198 461 461 210 S.D. 13.6 9.7 25.2

20
Spring Electroshocking On the night of May 4, Clark Lake was electroshocked for 142 minutes to look for marked fish. A total of 101 fish representing eight species were captured (Table 9). Walleye, white sucker and smallmouth bass were the most abundant species captured. Captured walleye ranged in length from 144 mm to 553 mm and had an average length of 310 mm (Table 10). The smallmouth bass that were handled ranged in length from 290 mm to 488 mm with an average length of 397 mm. Yellow perch, white sucker and carp had average lengths of 106 mm, 460 mm and 702 mm respectively. Table 9. Species captured from Clark Lake during the spring of 2005 spring recapture electroshocking. The Petersen Estimate is based on the data collected during this survey. The Schnabel Estimate is based on spring fyke net survey information. Species Number
Captured Number
Recaptured
Schnabel P.E. from Table 1
(Range)
Petersen P.E. (Range)
Carp 5 Common Shiner 2 White Sucker 24 2 240
(144-424) 711
(260-1777) Bullhead sp. 6 Freshwater Drum 1 Bluegill 1 Smallmouth Bass 20 2 450
(201-1126) 513
(188-1283) Yellow Perch 3 3 278
(84-505) 54
(22-135) Walleye 31 4 485
(374-628) 1484
(663-3710) Population estimates using the Petersen Method for a point estimate were made for walleye, smallmouth bass, yellow perch and white suckers (Table 9). Three of four species, walleye, smallmouth bass and white sucker had higher estimates than were calculated using the multiple estimate Schnabel method. The population estimate for yellow perch was lower using the Petersen method than with the Schnabel method.

21
Table 10. Length frequency of fish captured during spring recapture electroshocking, May 4, 2005.
Length YELLOW SMALLMOUTH WHITE COMMON FRESHWATER (mm) WALLEYE PERCH BASS BLUEGILL SUCKER CARP DRUM
100 2 110 1 120 130 1 140 2 150 1 160 4 170 2 180 190 200 210 220 1 230 2 240 2 250 1 260 1 1 270 1 1 280 1 290 1 1 300 1 310 320 1 330 1 340 3 350 1 360 2 2 1 370 3 1 380 1 390 1 2 400 1 410 2 2 420 1 1 430 1 2 2 440 1 2 450 1 2 2 460 1 1 470 480 2 2 1 490 2 500 1 2 510 2 520 1 530 540 2 550 1 560 1 570 1 580 2 590 600
>650 5 SUM 35 3 22 1 26 5 1 AVE. 310 106 397 132 460 702 482

22
Summer Surveys Centrarchid Electroshocking On the nights of May 31 and June 8, Clark Lake was electroshocked to assess centrarchid populations. The same three shoreline segments were shocked in early May were used for this portion of the survey (Figure 3). Effort on May 31 was 108 minutes and on June 8 we shocked for 97 minutes for a total effort of 205 minutes. Total catch was low each night of shocking, with 99 fish caught on May 31 and 68 fish captured on June 8 (Table 11). Yellow perch dominated the catch each night and was the most common fish captured during this survey. Walleye and smallmouth bass were the most common gamefish captured the survey. Forage minnows were seen, but rarely captured as they passed through the mesh of the nets. Table 11. Fish species captured from Clark Lake during summer electroshocking. SPECIES 31-May 08-Jun TOTAL COMMON CARP 5 10 15 MIMIC SHINER 2 0 2 WHITE SUCKER 6 1 7 ROCK BASS 5 12 17 BLUEGILL 4 0 4 SMALLMOUTH BASS 11 9 20 YELLOW PERCH 41 20 61 WALLEYE 24 16 40 SCULPIN SPP. 1 0 1 TOTAL 99 68 167
Most of the fish captured were small and less than 300 mm in length (Table 12). Small yellow perch and yearling walleye were the most common fish captured during the survey. Smallmouth bass and a few larger walleye were also captured. Walleye ranged in length from 105 mm to 465 mm and had an average length of 198 mm (Table 12). Spines were collected for age determination from walleye less than 200 mm in length because early spring surveys did not capture any fish of this length. Age interpretation based on the spine sample indicated that walleye less than 200 mm were age 1+ fish and averaged 145 mm in length. Based on fish age determination from spring surveys, other walleye captured during this sample period were age 2+ through age 3+ with a few older fish mixed in. Smallmouth bass ranged in length from 250 mm to 458 mm and had an average length of 377 mm (Table 12).

23
Table 12. Length frequency of the fish captured during summer electroshocking on Clark Lake.
LENGTH YELLOW SMALLMOUTH ROCK WHITE (mm) WALLEYE PERCH BASS BLUEGILL BASS SUCKER
90 3 100 1 5 1 110 7 120 2 26 1 130 5 10 2 3 140 5 10 2 150 7 1 1 160 7 1 170 1 1 180 1 1 190 200 210 2 220 1 230 1 240 250 1 1 1 260 1 1 1 270 2 2 280 290 300 310 320 1 1 330 2 340 2 2 350 2 360 1 3 370 1 380 1 390 2 400 3 410 1 420 1 3 430 440 450 2 460 1 470 480 490 500 510 1 520 530 540 550
SUM 40 61 20 3 17 7 AVE. 198 124 377 127 161 333
24
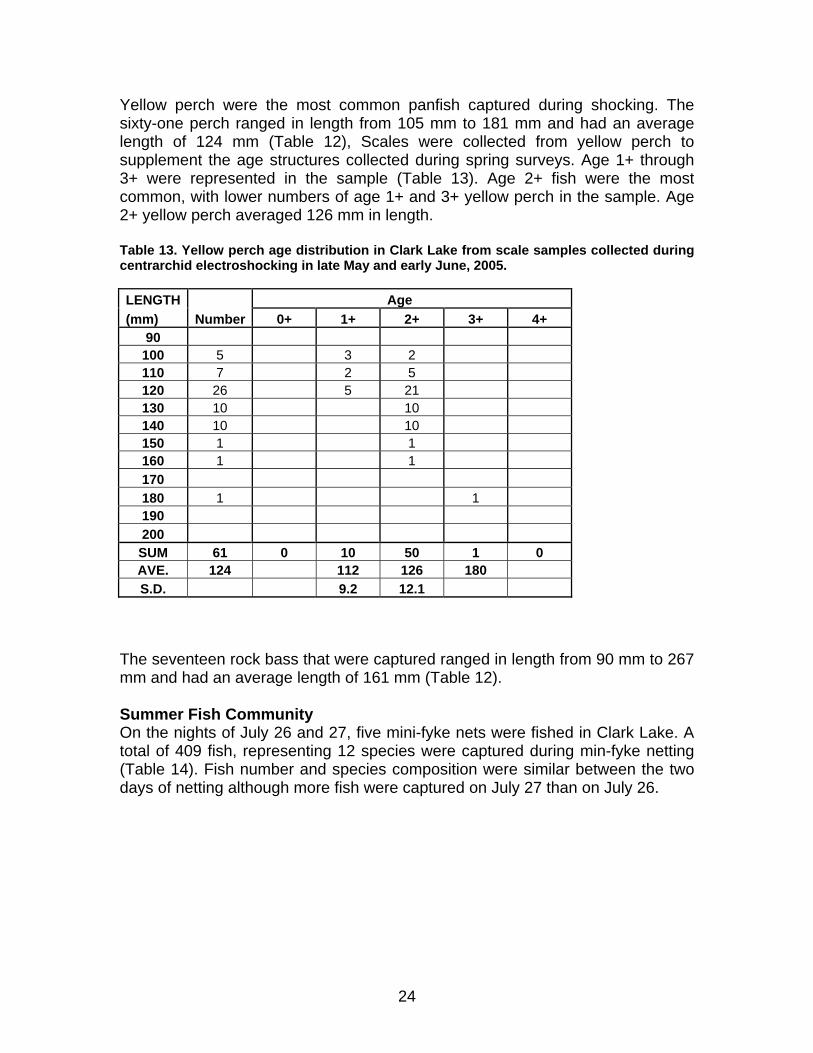
Yellow perch were the most common panfish captured during shocking. The sixty-one perch ranged in length from 105 mm to 181 mm and had an average length of 124 mm (Table 12), Scales were collected from yellow perch to supplement the age structures collected during spring surveys. Age 1+ through 3+ were represented in the sample (Table 13). Age 2+ fish were the most common, with lower numbers of age 1+ and 3+ yellow perch in the sample. Age 2+ yellow perch averaged 126 mm in length. Table 13. Yellow perch age distribution in Clark Lake from scale samples collected during centrarchid electroshocking in late May and early June, 2005. LENGTH Age (mm) Number 0+ 1+ 2+ 3+ 4+
90 100 5 3 2 110 7 2 5 120 26 5 21 130 10 10 140 10 10 150 1 1 160 1 1 170 180 1 1 190 200 SUM 61 0 10 50 1 0 AVE. 124 112 126 180 S.D. 9.2 12.1
The seventeen rock bass that were captured ranged in length from 90 mm to 267 mm and had an average length of 161 mm (Table 12). Summer Fish Community On the nights of July 26 and 27, five mini-fyke nets were fished in Clark Lake. A total of 409 fish, representing 12 species were captured during min-fyke netting (Table 14). Fish number and species composition were similar between the two days of netting although more fish were captured on July 27 than on July 26.

25
Table 14. Fish captured on Clark Lake during July 2005 mini-fyke netting. SPECIES 26-Jul 27-Jul TOTAL BOWFIN 2 6 8 COMMON SHINER 6 5 11 MIMIC SHINER 59 76 135 BLUNTNOSE MINNOW 33 90 123 FATHEAD MINNOW 1 0 1 ROCK BASS 3 1 4 BLUEGILL 3 12 15 SMALLMOUTH BASS 14 12 26 LARGEMOUTH BASS 17 26 43 JOHNNY DARTER 4 12 16 YELLOW PERCH 15 113 128 WALLEYE 0 1 1
TOTAL 157 254 511
Mimic shiner, yellow perch and bluntnose minnow were the most common species captured overall and during each day of sampling. Largemouth and smallmouth bass were also commonly caught but lower in number. As expected, most fish captured during this survey were small fish less than 150 mm in length. Largemouth bass ranged in length from 44 mm to 95 mm and had an average length of 53 mm (Table 15). Captured smallmouth bass were similar in size and ranged in length from 40 mm to 85 mm with an average length of 55 mm. Many small yellow perch were captured during netting. They ranged in length from 41 mm to 109 mm and had an average length of 49 mm. Based on age samples from summer shocking, it is likely these are age 0+ and 1+ yellow perch.

26
Table 15. Length distribution of fish measured during the mini-fyke net survey on Clark Lake. Length LARGEMOUTH SMALLMOUTH YELLOW ROCK (mm) WALLEYE BASS BASS PERCH BLUEGILL BASS BOWFIN
30 1 40 4 6 55 50 24 8 53 4 60 13 6 14 10 70 1 2 1 1 80 3 1 2 90 1 1 2 1
100 2 110 1 2 120 5 130 1 140 150
SUM 1 43 25 128 15 5 8 AVE. 90 53 55 49 58 78 119
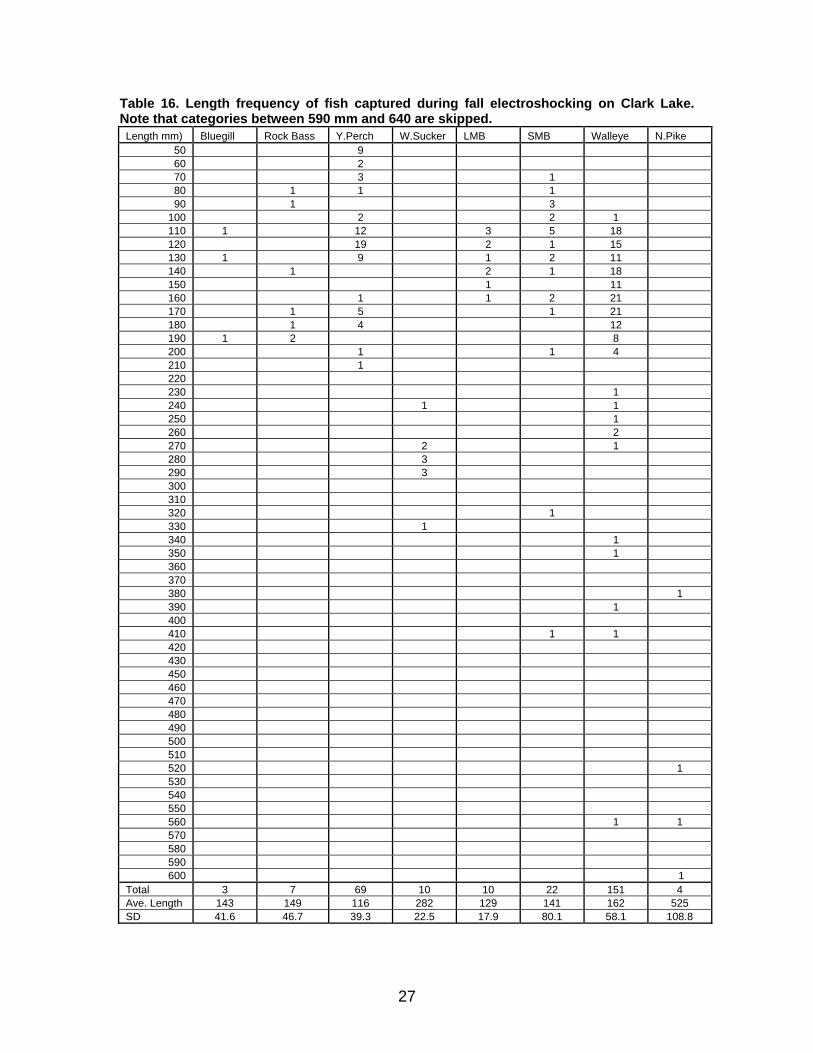
Other species captured included bluegill, rock bass, walleye and bowfin. They had average lengths of 58 mm, 78 mm, 90 mm and 119 mm respectively (Table 15). Fall Surveys Fall Recruitment and Index Sampling Three shoreline sections were shocked on the night of October 20 to assess young-of-year abundances and the general condition of the fish community. The three sections shocked were the same used in earlier electroshocking surveys (Figure 3). In 96 minutes of effort, a total of 343 individual fish representing fourteen species were captured (Table 16). It was noted that most fish were captured at the north end of the lake near Logan Creek. Additionally, the catch was much more diverse near Logan Creek than in the sand flats on the south end of the lake.
Walleye dominated the catch with substantially fewer yellow perch and bluntnose minnow captured. Additional species that were captured but not measured included: 37 bluntnose minnow, 22 common shiner, 4 mimic shiner, 2 johnny darter, 1 pumpkinseed and 1 carp. The 151 captured walleye ranged in length from 105 mm to 560 mm and had an average length of 162 mm (Table 16). Based on age determined from earlier surveys, it is likely most of the walleye less than 200 mm were young-of-year fish.
27
Table 16. Length frequency of fish captured during fall electroshocking on Clark Lake. Note that categories between 590 mm and 640 are skipped.
Length mm) Bluegill Rock Bass Y.Perch W.Sucker LMB SMB Walleye N.Pike 50 9 60 2 70 3 1 80 1 1 1 90 1 3
100 2 2 1 110 1 12 3 5 18 120 19 2 1 15 130 1 9 1 2 11 140 1 2 1 18 150 1 11 160 1 1 2 21 170 1 5 1 21 180 1 4 12 190 1 2 8 200 1 1 4 210 1 220 230 1 240 1 1 250 1 260 2 270 2 1 280 3 290 3 300 310 320 1 330 1 340 1 350 1 360 370 380 1 390 1 400 410 1 1 420 430 450 460 470 480 490 500 510 520 1 530 540 550 560 1 1 570 580 590 600 1
Total 3 7 69 10 10 22 151 4 Ave. Length 143 149 116 282 129 141 162 525 SD 41.6 46.7 39.3 22.5 17.9 80.1 58.1 108.8

28
Other gamefish that were captured included 22 smallmouth, 10 largemouth bass, and 4 northern pike. They had average lengths of 141 mm, 129 mm and 525 mm respectively. Yellow perch were the most common panfish captured. They ranged in length from 50 mm to 210 mm and had an average length of 116 mm (Table 16). It is likely that fish less than 100 mm were young-of-year yellow perch. Few rock bass or bluegill were captured during fall shocking.
DISCUSSION The 2005 comprehensive fisheries survey on Clark Lake characterized the fish populations of the lake using multiple fisheries assessment gear during multiple seasons. Each gear type was efficient in capturing certain fish species and fish sizes. The use of multiple gears during different sampling seasons provided a clearer picture of the entire fish community and fish population characteristics of individual species within the lake. A total of 1,825 fish were collected during the fisheries surveys. The most abundant fish were walleye, yellow perch and rock bass. Gamefish Walleye were the most abundant gamefish captured during surveys in 2005. Although walleye have been the most abundant gamefish captured in surveys since 1969, their abundance has fluctuated during this time period (Table 17). The current spring population estimate of 485 adult walleye based on fyke net data is the lowest since the 1960’s. However, when electroshocking surveys are included, the population estimate is 1,484 which is similar to the 1,538 estimated by Lychwick (1995). As was the case in 1995, a large percentage of captured walleye were young-of-year or juvenile fish. Reproduction appears to be good, indicating recruitment into the population. Growth (length at age) is at statewide averages until age 4 then is slightly less than average thereafter. It appears that older, larger fish may be forage limited causing slower growth. However, length at age in 2005 was greater than measured in 1994 and could signal an improving walleye population (Lychwick 1995). The presence of few old (greater than age 8) walleye suggests that total annual mortality (natural and angler) is probably high.

29
Table 17. Summary of fyke net surveys, numbers of fish and catch per net night (CPE) from Clark Lake 1969-2005. The 1969-1994 data is after Lychwick (1995).
Species 1969 1976 1981 1984 1994 2005 Walleye 142
(2.84) 458
(6.94) 388
(6.06) 393
(3.97) 209
(2.79) 225
(3.21) Northern Pike 23
(0.46) 114
(1.73) 97
(1.51) 51
(0.52) 86
(1.15) 66
(0.94) Smallmouth Bass 12
(0.24) 13
(0.20) 19
(0.30) 6
(0.06) 13
(0.17) 72
(1.03) Largemouth Bass 3
(0.06) 2
(0.03) 5
(0.08) 1
(0.01) 3
(0.04) 0
Rock Bass 38 (0.76)
86 (1.30)
318 (4.97)
88 (0.99)
201 (2.68)
182 (2.6)
Yellow Perch 328 (6.56)
46 (0.70)
22 (0.34)
17 (0.17)
9 (0.12)
37 (0.53)
Bluegill 10 (0.03)
34 (0.52)
112 (1.75)
132 (1.33)
13 (0.17)
20 (0.29)
Bullhead sp. 7 (0.14)
6 (0.10)
5 (0.08)
28 (0.28)
118 (1.58)
6 (0.09)
Carp 1 (0.02)
6 (0.09)
50 (0.78)
5 (0.05)
18 (0.24)
4 (0.06)
Sucker sp. 69 (1.38)
159 (2.41)
216 (3.38)
70 (0.71)
204 (2.71)
82 (1.17)
Bowfin 2 (0.04)
5 (0.08)
20 (0.31)
2 (0.02)
7 (0.09)
5 (0.07)
Relative abundance (CPE) for smallmouth bass during spring surveys was the highest on record. The increasing number of smallmouth bass may be linked to the decline in walleye abundance in the last ten years since both complete for food resources and adult fish of one species may prey on the young of the other species. Electroshocking surveys caught a number of small fish indicating that smallmouth bass have been successful in spawning. Growth appears to be good for smallmouth bass. Although largemouth bass were not captured during spring surveys in 2005, when all surveys are included, the number of largemouth bass captured in 2005 increased over what was caught in 1994. This may indicate that the largemouth bass population is increasing in Clark Lake. Although the number of northern pike captured in 2005 declined from 1994 levels, the number captured was near the average catch since 1969. Most captured northern pike were less than 650 mm, with most northern pike between 460 mm and 600 mm. Length at age indicates northern pike in Clark Lake are growing slightly less (slower) than statewide average growth. It appears that harvest may be reducing the number of large northern pike in the lake. Several year classes appear to under-represented in the age sample, for example ages 4, 7 and 8 and could indicate variable spawning success for northern pike in the lake. Panfish Panfish populations in Clark Lake appear to be low. Although rock bass spring CPE changed little since 1994, the rock bass population estimate declined 70%

30
between the two survey years. This decline was similar to what was seen on Kangaroo Lake between 1995 and 2004 (Hogler 2004). Habitat loss and an increasing predator population may have contributed to the decline. Length at age was above statewide averages, so forage does not appear to limit the population. The number of yellow perch captured during 2005 surveys increased from 1994 survey numbers and was similar to those seen in the 1970’s. Increased yellow perch abundance is likely due to five years of stocking by the Clark Lake Association. Electroshocking surveys captured juvenile yellow perch so it appears that stocked perch may have begun to contribute to future perch populations. It is unknown if current levels of recruitment will sustain the perch population in the face of angler harvest and habitat disturbance. Bluegill continue to be present in lower abundance than during the 1980’s (Table 17). Growth (length at age) is above statewide averages. It is likely that limited aquatic plant habitat continues to limit the bluegill population in Clark Lake. Other Species Several other species were captured that are worth noting The white sucker and longnose sucker populations in the lake have declined since 1994 and sucker relative abundance (CPE) was the second lowest measured since 1969. Forage minnows were abundant near the outlet of Logan Creek, but were scarce in other parts of the lake. It is likely the aquatic plant beds and Logan Creek provide excellent habitat for minnows while limited plant cover in other parts of the lake limit their abundance. The bullhead species population appears to be lower than it was in 1994. Bowfin populations, which have been stable since 1994, are low in abundance. Carp were captured in low number in all surveys and appear to be similar in number to earlier surveys. Carp do not appear to be a problem in the lake.
CONCLUSIONS
Fish populations in Clark Lake appear to be in a state of change. Walleye numbers are down since 1994 based on population estimates, but relative abundance (CPE) appears to be stable. Walleye reproduction is evident and length at age is near state averages although there are few large walleye in the lake. Harvest and slower growth at older ages may be impacting the size of walleye in Clark Lake.

31
Smallmouth bass numbers have increased over previous surveys and largemouth bass continue to be part of the fishery. Bass populations appear to be reproducing well. The northern pike population appears to be steady in the lake. Few northern pike are large in size and harvest or poor recruitment may be affecting their size distribution. Panfish in general have declined in number since the 1960’s. The rock bass population has fluctuated in number, while the yellow perch and bluegill populations have declined. Stocking of yellow perch by the Clark Association has improved the yellow perch population in the lake. Habitat loss, the lack of aquatic plants, and angler harvest may have influenced panfish numbers in the lake. Growth of panfish in Clark Lake appears to be good. Forage minnows are common in the lake near Logan Creek, but lack of suitable habitat in other areas of the lake, limit their abundance. Increased spatial distributions of plants would benefit forage fish as well as other species. Carp although present in the lake, were low in number and seen to be a problem at this time.
RECOMMENDATIONS
• Encourage the recolonization of aquatic plants by establishing no wake areas or by temporary placement of wave and turbidity barriers to get plants started. Reestablishment of aquatic plants is necessary to have a healthy stable fish community in the lake.
• Encourage shoreline residents to reestablish natural shorelines. This will
also help plant communities as well as many other animal populations.
• Monitor the movement and abundance of exotics such into Clark Lake. If these species get firmly established in the lake, more changes in the fish community are likely.
• Encourage the Lake Association and its members to protect sensitive
areas.
REFERENCES
Cline, C.L. 1951. Clark Lake, Door County Survey Report. Unpublished Report #664. Wisconsin Conservation Department, Madison Wisconsin. 10 pages. Door County SWCD. 2000. Surface Water Inventory of Door County. Door County SWCD, Sturgeon Bay, WI. 83 pages.

32
Hacker, V. 1959. Clark Lake, Door County Survey Report. Unpublished Report. Wisconsin Conservation Department, Madison Wisconsin. 8 pages. Hogler, S.R. 2005. Kangaroo Lake report. Unpublished Report. Wisconsin Department of Natural Resources. Madison, WI. 25 pages. Kernen, L.T. 1968. Clark Lake, Door County seine survey report. Unpublished Report. Wisconsin Department of Natural Resources. Madison Wisconsin. 10 pages. Kernen, L.T. 1969. Clark Lake, Door County fyke net and boomshocker survey report. Unpublished Report. Wisconsin Department of Natural Resources. Madison Wisconsin. 12 pages. Kernen, L.T. 1973. Clark Lake, Door County boomshocker survey report. Unpublished Report. Wisconsin Department of Natural Resources. Madison Wisconsin. 7 pages. Kernen, L.T. 1975. Clark Lake, Door County fyke net survey report. Unpublished Report. Wisconsin Department of Natural Resources. Madison Wisconsin. 13 pages. Kernen, L.T. 1977. Clark Lake, Door County inventory of fish population report. Unpublished Report. Wisconsin Department of Natural Resources. Madison Wisconsin. 25 pages. Lychwick, T. 1982. 1981 Clark Lake, Door County survey report. Unpublished Report. Wisconsin Department of Natural Resources. Madison Wisconsin. 13 pages. Lychwick, T. 1994. 1994 Clark Lake, Door County survey report. Unpublished Report. Wisconsin Department of Natural Resources. Madison Wisconsin. 9 pages. Rasman, T. 1992. Clark Lake- Door County Ambient Lake Macrophytes, 1986, 1989 and 1992. Unpublished Report. Wisconsin Department of Natural Resources. Madison Wisconsin. 10 pages. Ricker, W.E. 1975. Computation and interpretation of biological statistics of fish populations. Fisheries Research Board of Canada. Bulletin 191. Ottawa, Ontario, Canada. Wisconsin DNR. 2001. State of the Lakeshore Basin Appendices. Report PUB WT 667A 2001. Wisconsin Department of Natural Resources. Madison Wisconsin. 100 pages.
Related Documents