2004 Final Budget Summary Chicago Transit Authority Designing for the Future of Public Transit

Welcome message from author
This document is posted to help you gain knowledge. Please leave a comment to let me know what you think about it! Share it to your friends and learn new things together.
Transcript
2004 Final Budget Summary
Chicago Transit Authority
Designing for the Futureof PublicTransit
Carole L. Brown, Chairman
Appointed by: Mayor, City of Chicago
J. Douglas Donenfeld, Vice Chairman
Appointed by: Governor, State of Illinois
John H. Catlin
Appointed by: Mayor, City of Chicago
Susan A. Leonis
Appointed by: Governor, State of Illinois
Cynthia A. Panayotovich
Appointed by: Governor, State of Illinois
Victor Reyes
Appointed by: Mayor, City of Chicago
Charles E. Robinson
Appointed by: Mayor, City of Chicago
Frank Kruesi, President
ChicagoTransit Board
Designing for the Future of Public Transit: Budget 2004
2004 AnnualBudget Summary
Chicago Transit Authority
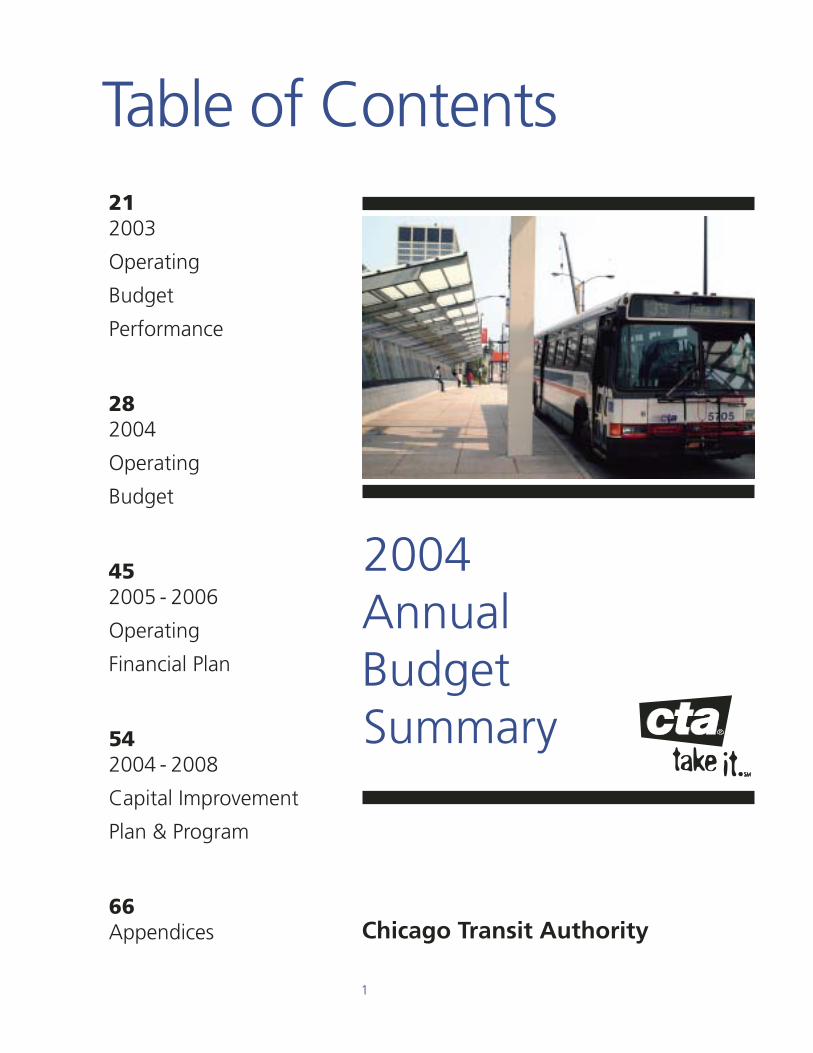
Table of Contents212003
Operating
Budget
Performance
282004
Operating
Budget
452005 - 2006
Operating
Financial Plan
542004 - 2008
Capital Improvement
Plan & Program
66Appendices
1
Designing the Future of Public Transit--- that is the vision that guidedthe CTA in preparing the budget for 2004.
Our mission is to provide quality, affordable transit services that linkpeople, jobs and communities. As communities grow and change,what works well today may not work as well in the future. The CTAmust be prepared to serve future customers. Each year, the CTAprepares a five-year capital plan that sets priorities for the future anddetermines which initiatives will best serve customers in the yearsahead. Our focus is on projects that will rebuild the system, improvethe product and sustain the momentum of the past six years.
Planning for the future is critical right now. The legislation thatdetermines federal funding is expiring and transit agencies aroundthe country are introducing projects that will be competing with oneanother for a share of scarce future funding.
To meet future transit needs, the CTA projects growth patterns andhas developed plans that provide service in key areas while bestusing the current infrastructure. With limited resources available, thisapproach maximizes customer benefits with strategic investment.This type of analysis led to long-term proposals, such as the CircleLine and express rail service to both airports, but also to shorter-terminvestments, such as ongoing fleet and facility upgrades.
In addition to developing long-term plans, the CTA creates anannual spending plan for capital improvements and prepares anoperating budget that determines the quality and level of service itcan provide in the coming year.
Developing those budgets was very challenging this year.Resources, which have always been limited, have become eventighter. In the past six years, the CTA has worked diligently tobalance its budget. Even when money has been tight, we have beenable to find new ways to control costs or increase revenues whilestill finding a way to invest in projects and services that will benefitour customers. 2003 was a prime example. As we developed thebudget last year, we faced an operating shortfall. But by continuingto work smarter, cut expenses and seek new sources of revenue, wewere able to balance the budget and still fund our most ambitiousservice improvements yet. It has been a source of pride for us thatwe have been able to continue to deliver more, with less, and thatthe CTA has gone more than 12 years without a fare increase.
But times have changed. As we prepared the 2004 budget, wefaced an operating shortfall of at least $88 million. We also are inarbitration with our largest union, ATU Local 241. We have madesome reasonable assumptions about the outcome, but we won’tknow the actual costs until the arbitrator renders a decision.
The weak economy has a direct impact on the two major sources ofCTA's operating revenue. Nearly half of the CTA's operating budgetis funded through the state's sales tax. Sales tax revenues are downthis year and, as a result, the CTA's operating funds have beenreduced by nearly $12 million compared to last year.
The other portion of the CTA's operating revenues comes primarilyfrom fares, which, of course, depend on ridership. This year, afterfive years of continuous growth, ridership dipped. To a large extent,this decrease is also tied to the economy as regional unemploymentlevels hover at about eight percent.
Revenues are down, andexpenses, though carefullycontrolled, continued toinch up. An $88 milliongap is a large one to filland we had alreadyexhausted most availableoptions to balance previ-ous budgets. Ongoing costreductions since 1998 havesaved the CTA a total of$554.8 million. In addition,over the past few years,sales of surplus properties,innovative lease transac-tions and other initiatives have pumped $92 million in revenues intothe budget.
We had to look seriously at new ways to balance the budget,including reducing the work force. Rather than turn to layoffs, weare eliminating a total of 400 positions over this year and next. Cutshave been made in every CTA department, but not to positionsdirectly involved in delivery of service to our customers. These cutswill result in a 17 percent reduction of non-service related positions.
But even with this work force reduction and tighter cost controls inplace, we still faced a budget gap and had to consider the first fareincrease since 1991. In the 2004 budget, the CTA is proposing a fareincrease of 25 cents, which would increase the base fare to $1.75.To minimize the impact on ridership, pass prices will remain thesame and the price of a transfer will be reduced from 30 cents to 25cents. To speed boarding and therefore speed service, we willencourage the use of Chicago Cards TM by offering a 10 percentbonus on purchases of $10 or more.
This fare increase will allow the CTA to balance its budget andcontinue to provide the high level of service that we have workedhard to achieve over the past six years.
As we move into 2004 and beyond, the CTA will continue to lookfor the most efficient operating methods and ways to increaserevenues that will provide long-term financial stability.
Over the next few weeks, the Chicago Transit Board, the CookCounty Board and the Regional Transportation Authority will reviewthis proposal. There are also opportunities for public comment, bytestifying at our October 30 public hearing at the Palmer HouseHilton or by writing us at the Merchandise Mart, P.O. Box 3555,Chicago, Illinois 60654. Copies of the budget are available forreview at CTA headquarters, public libraries and on our web site atwww.transitchicago.com
Sincerely,
Frank Kruesi, President
Letter from the President
2
Designing for the Future of Public Transit: Budget 2004
INTRODUCTION
The mission of the Chicago Transit Authority is todeliver quality, affordable transit services thatlink people, jobs and communities. It is why theCTA exists---to transport customers to their
destinations in the most efficient manner possible.
Accommodating current transit needs is only part ofthe CTA's mission, however. The CTA must continuallylook ahead to be prepared to serve future customers.As communities grow and change, what worked wellyesterday may not work as well today or tomorrow.Shopping centers, business districts and recreationalattractions are not the same as they were 20 yearsago, or even as recently as 10 years ago. Neighbor-hoods throughout Chicago and the suburbs haveexperienced dramatic changes---a great deal of revital-ization has taken place resulting in new and denselypopulated communities. Anticipating customer needs,projecting travel patterns and designing the future ofpublic transit using today's infrastructure as a blue-print is the full scope of CTA's mission.
For the past several years, the CTA has worked dili-gently to deliver on its mission while operating in anincreasingly tough economic environment. Like manyother businesses, the CTA is experiencing the impactof rising operating costs such as health insurance,while looking for solutions to offset the effects ofdeclining revenue and limited funding.
Because of ongoing cost containment and revenueenhancement measures, we have been able to offseta fare increase for more than a decade while buildingan improved agency by way of better service, facili-ties, equipment and operations. Not only have wemaintained our level of service for the past five years,we have improved upon it. Since November 1998,CTA has made service improvements on 66 percent ofits bus routes (98 out of 148 total routes) and on allseven of its rail routes. A total of 219 bus improve-ments have been implemented which include 22 newbus routes, expanded hours of service, added trips toreduce wait time, and route changes to improveaccess and connectivity.
The last fare increase was in 1991, when fares forboth bus and rail went from $1.25 to $1.50. In 1998,we introduced a simplified fare structure that reducedcertain fares. As intended, the plan resulted inincreased ridership on the system by offering incen-tives for frequent customers. The revised structurereduced the Monthly Pass to $75 from $88. The costof the Reduced Monthly Pass was dropped to $35
3
Designing for the Future of Public Transit: Budget 2004
from $44. Other advantages of the revised farestructure included the Transit Card bonus beingincreased to a $1 bonus for every $10 of valuestored on the card.
Strategic decision-making and investment in thesystem has served us well over the years. Today weare reaping the benefits of those efforts. We haveworked hard to bring stability to a transit system thathad fallen into a state of disrepair, and are now imple-menting plans that not only help to replace our aginginfrastructure, but also to bring new and better serviceofferings to our customers.
We have remained committed to service as our toppriority, carefully managing our operations to reducecosts without sacrificing the level of service providedto our customers. Since 1998, the CTA has realized atotal of $554.8 million in savings as a result of theseefforts. This requires a delicate balance betweenservice planning, preventative maintenance, investingin equipment and facilities, and recruiting and retain-ing experienced staff to keep Chicago and the surroun-ding suburbs moving smoothly each day.
In 1997, when the CTA introduced an automated farecollection (AFC) system through the use of TransitCards, more than $11 million in annual savings wasrealized by reducing the amount of cash fareshandled on the system. Similarly, the switch to one-person operations on all rail lines has saved the CTAmore than $10 million annually. Better purchasingand inventory management have resulted in annualsavings of $7.1 million. The CTA realized a savings of$10 million in 2003 by eliminating 200 positions byattrition, restricting overtime and carefully monitoringhiring, and expects to achieve additional savings in2004 by eliminating an additional 200 positionsthrough attrition.
In addition to carefully controlling costs, the CTA hasactively sought to increase revenues beyond thefarebox. In 2002, the CTA generated $2.7 million inrevenue by entering into an innovative lease agree-ment to lease 411 Nova buses to an equity investor.
In another lease transaction the same year, the CTAgenerated approximately $19.4 million in revenue asthe result of an agreement involving portions of theCTA's control center, AFC system, rail and bus commu-nications systems and the rail control/signalingsystem. Since 1998, innovative financing transactionshave generated $39 million in revenue for the CTA.
By the end of 2003, CTA rail customers will haveaccess to automated teller machines (ATMs) at 11 railstations. The move will generate an estimated$432,900 in additional revenue for the CTA in the nextthree years. Added to lease transactions and assetssales, this brings the revenue received by the CTAthrough alternative sources to $92 million since 1998.
As resourceful as we have been, our efforts have notbeen able to keep pace with the sustained sluggisheconomy and we are forced to face some difficultfinancial decisions in 2004 and beyond.
4
Designing for the Future of Public Transit: Budget 2004
5
Designing for the Future of Public Transit: Budget 2004Designing for the Future of Public Transit: Budget 2004
2003 ACCOMPLISHMENTS
The CTA experienced some great successes in2003 despite operating in a challengingeconomic environment. Some of the mostsignificant achievements were a result of
improved bus service for our customers. CTA staffacross several departments---service planning, opera-tions, facilities maintenance, government andcommunity relations, communications and marketing---worked in a coordinated effort to design and imple-ment enhancements for 32 bus routes.
Bus service enhancements were introduced on anexperimental basis for customers in Evanston, Skokieand West Rogers Park, as well as for customers alongNorth and South Lake Shore Drive. These serviceimprovements reflect the growth in these communi-ties---changes in travel patterns due to residentialand commercial development in burgeoning neigh-borhoods---as well as the CTA's commitment toprovide quality service that transports people towhere they want to go.
Chicago’s West Side is a prime example of how CTAservice has evolved to keep pace with a changingneighborhood. In 1996, a completely rebuilt GreenLine reopened on the West Side. Since 1998, ridershipon the Lake Street branch of the Green Line increased29 percent and in 2001 longer trains were added toaccommodate growing ridership. Over the past fewyears, eight of the nine main West Side bus routeswere enhanced with improvements such as extendedservice hours and adjustments in destinations tobetter serve customers’ needs. Since 1998, ridershipon the nine main bus routes has increased 10percent. In 2003, the CTA began another analysis ofWest Side service to ensure the changing needs ofcustomers are met.
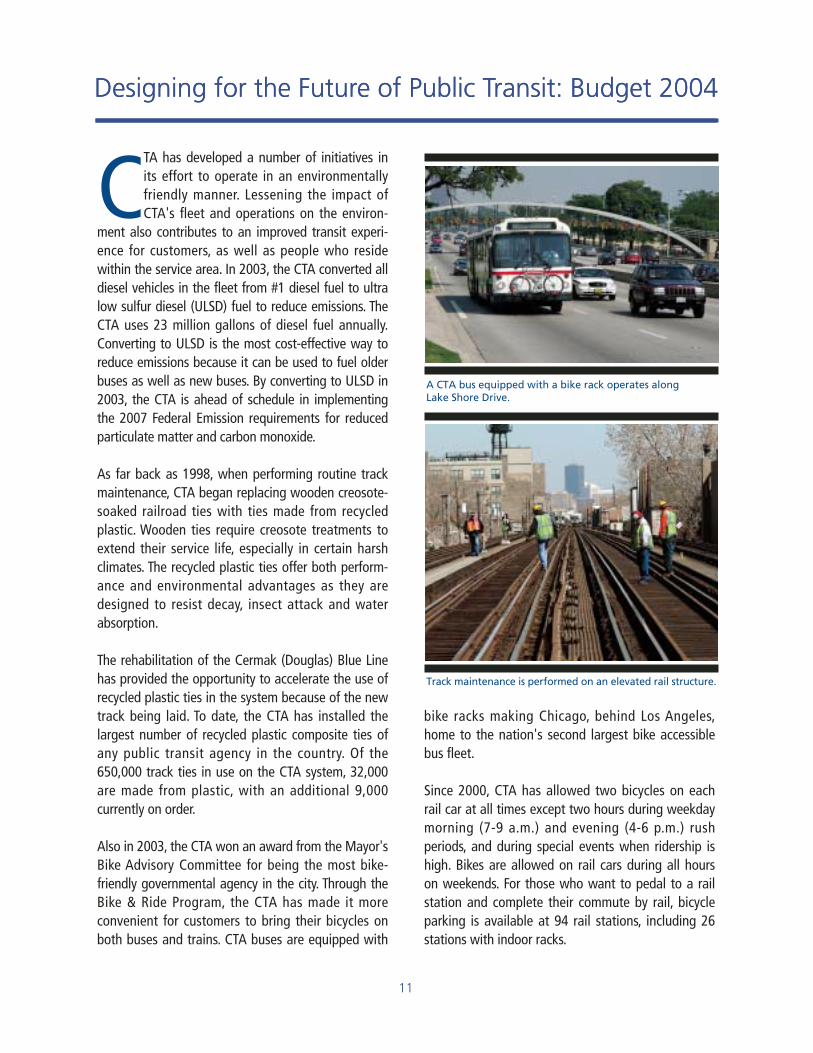
More service was made possible, in part, by a morereliable fleet. The ongoing effort to upgrade CTA's busfleet continued as the first of 226 new low-floor artic-ulated, or accordion-style, buses manufactured by
North American Bus Industries (NABI) began arrivingin late summer 2003. While a significant number ofthese buses will be used to serve customers onexpress routes along Lake Shore Drive, all of our buscustomers will benefit from the acquisition. Newerequipment means greater reliability for the entire CTAfleet as older buses are retired, and fewer repairs are
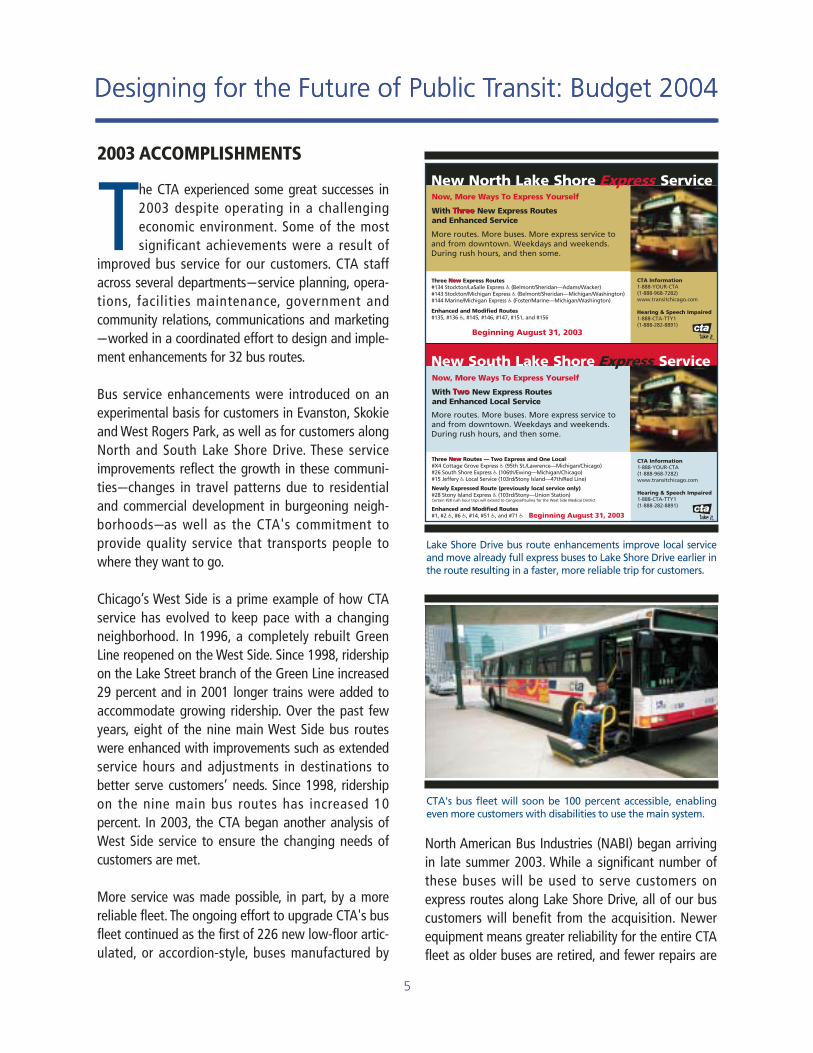
CTA's bus fleet will soon be 100 percent accessible, enablingeven more customers with disabilities to use the main system.
Lake Shore Drive bus route enhancements improve local serviceand move already full express buses to Lake Shore Drive earlier inthe route resulting in a faster, more reliable trip for customers.
6
Designing for the Future of Public Transit: Budget 2004
needed to keep the remaining buses in good workingorder. And, with the addition of the NABIs, the CTA'sentire bus fleet will soon be fully air-conditioned and100 percent accessible, a critical achievement thatwill make it possible for more customers with disabili-ties to use the main system.
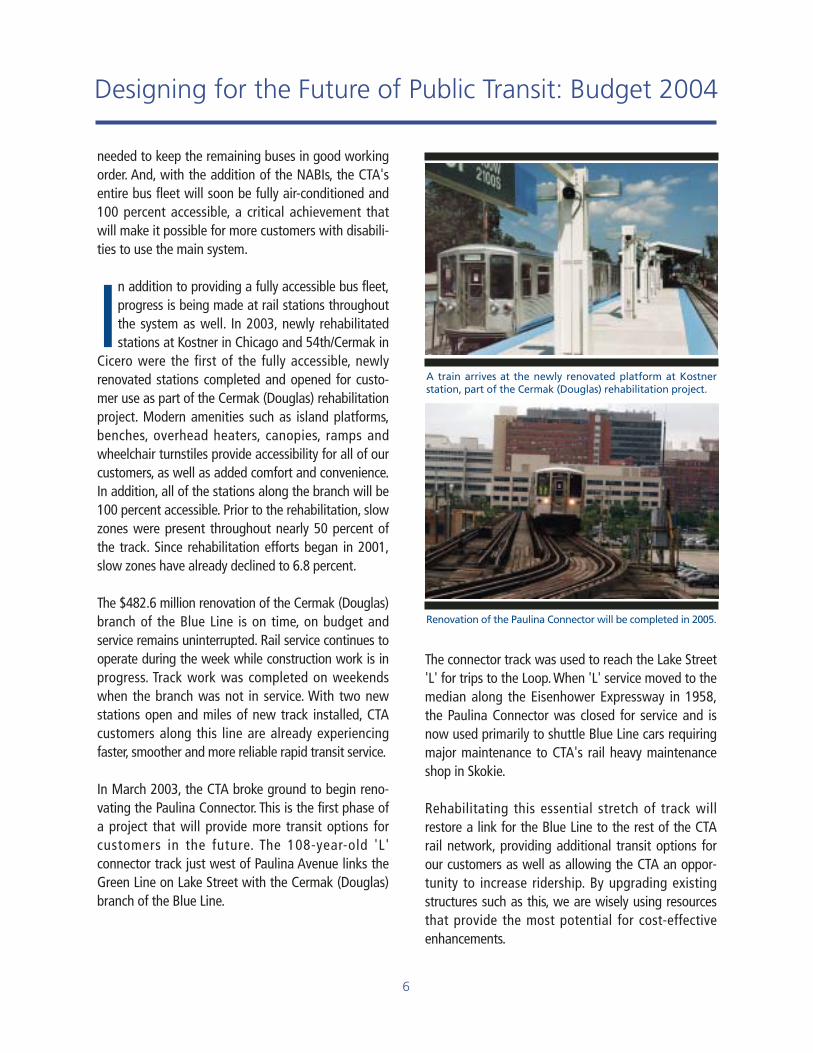
In addition to providing a fully accessible bus fleet,progress is being made at rail stations throughoutthe system as well. In 2003, newly rehabilitatedstations at Kostner in Chicago and 54th/Cermak in
Cicero were the first of the fully accessible, newlyrenovated stations completed and opened for custo-mer use as part of the Cermak (Douglas) rehabilitationproject. Modern amenities such as island platforms,benches, overhead heaters, canopies, ramps andwheelchair turnstiles provide accessibility for all of ourcustomers, as well as added comfort and convenience.In addition, all of the stations along the branch will be100 percent accessible. Prior to the rehabilitation, slowzones were present throughout nearly 50 percent ofthe track. Since rehabilitation efforts began in 2001,slow zones have already declined to 6.8 percent.
The $482.6 million renovation of the Cermak (Douglas)branch of the Blue Line is on time, on budget andservice remains uninterrupted. Rail service continues tooperate during the week while construction work is inprogress. Track work was completed on weekendswhen the branch was not in service. With two newstations open and miles of new track installed, CTAcustomers along this line are already experiencingfaster, smoother and more reliable rapid transit service.
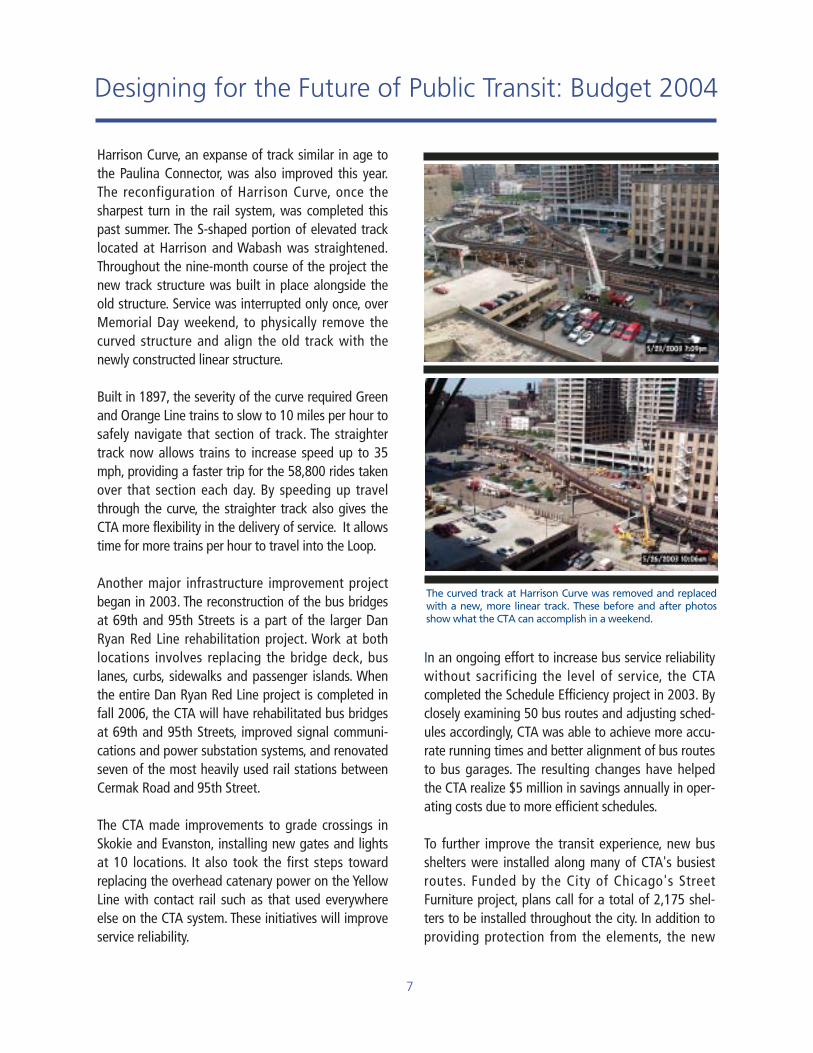
In March 2003, the CTA broke ground to begin reno-vating the Paulina Connector. This is the first phase ofa project that will provide more transit options forcustomers in the future. The 108-year-old 'L'connector track just west of Paulina Avenue links theGreen Line on Lake Street with the Cermak (Douglas)branch of the Blue Line.
The connector track was used to reach the Lake Street'L' for trips to the Loop. When 'L' service moved to themedian along the Eisenhower Expressway in 1958,the Paulina Connector was closed for service and isnow used primarily to shuttle Blue Line cars requiringmajor maintenance to CTA's rail heavy maintenanceshop in Skokie.
Rehabilitating this essential stretch of track willrestore a link for the Blue Line to the rest of the CTArail network, providing additional transit options forour customers as well as allowing the CTA an oppor-tunity to increase ridership. By upgrading existingstructures such as this, we are wisely using resourcesthat provide the most potential for cost-effectiveenhancements.
A train arrives at the newly renovated platform at Kostnerstation, part of the Cermak (Douglas) rehabilitation project.
Renovation of the Paulina Connector will be completed in 2005.
7
Designing for the Future of Public Transit: Budget 2004
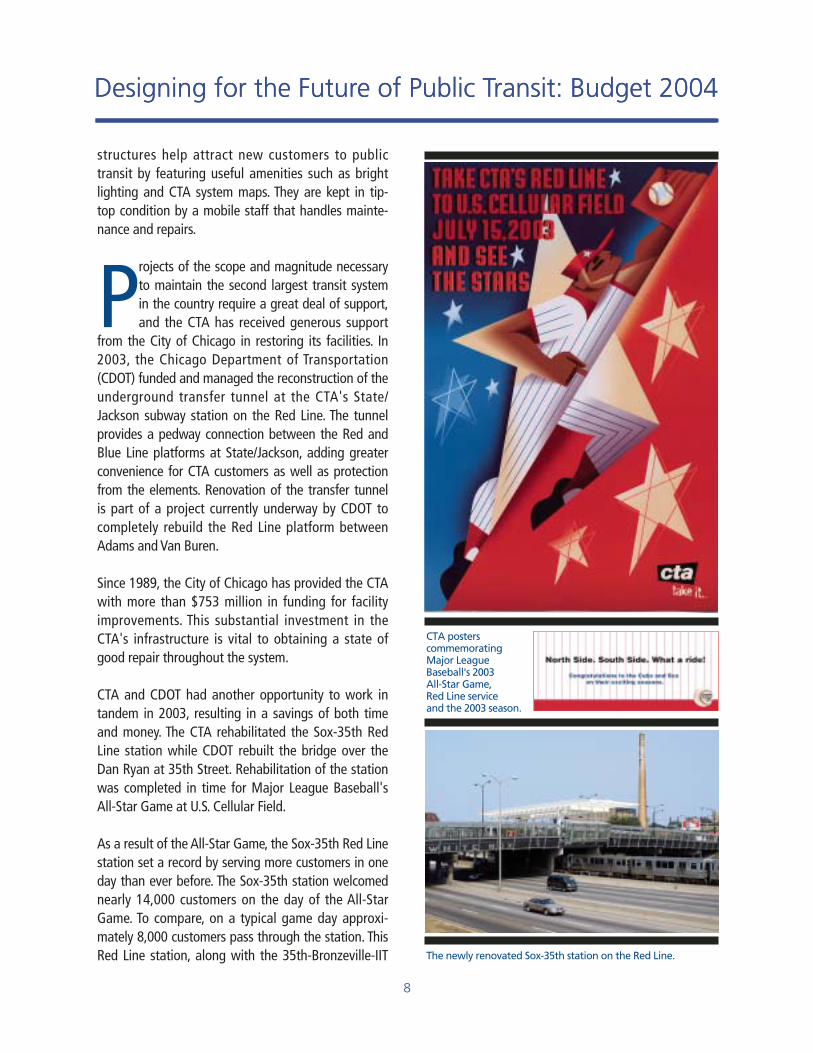
Harrison Curve, an expanse of track similar in age tothe Paulina Connector, was also improved this year.The reconfiguration of Harrison Curve, once thesharpest turn in the rail system, was completed thispast summer. The S-shaped portion of elevated tracklocated at Harrison and Wabash was straightened.Throughout the nine-month course of the project thenew track structure was built in place alongside theold structure. Service was interrupted only once, overMemorial Day weekend, to physically remove thecurved structure and align the old track with thenewly constructed linear structure.
Built in 1897, the severity of the curve required Greenand Orange Line trains to slow to 10 miles per hour tosafely navigate that section of track. The straightertrack now allows trains to increase speed up to 35mph, providing a faster trip for the 58,800 rides takenover that section each day. By speeding up travelthrough the curve, the straighter track also gives theCTA more flexibility in the delivery of service. It allowstime for more trains per hour to travel into the Loop.
Another major infrastructure improvement projectbegan in 2003. The reconstruction of the bus bridgesat 69th and 95th Streets is a part of the larger DanRyan Red Line rehabilitation project. Work at bothlocations involves replacing the bridge deck, buslanes, curbs, sidewalks and passenger islands. Whenthe entire Dan Ryan Red Line project is completed infall 2006, the CTA will have rehabilitated bus bridgesat 69th and 95th Streets, improved signal communi-cations and power substation systems, and renovatedseven of the most heavily used rail stations betweenCermak Road and 95th Street.
The CTA made improvements to grade crossings inSkokie and Evanston, installing new gates and lightsat 10 locations. It also took the first steps towardreplacing the overhead catenary power on the YellowLine with contact rail such as that used everywhereelse on the CTA system. These initiatives will improveservice reliability.
In an ongoing effort to increase bus service reliabilitywithout sacrificing the level of service, the CTAcompleted the Schedule Efficiency project in 2003. Byclosely examining 50 bus routes and adjusting sched-ules accordingly, CTA was able to achieve more accu-rate running times and better alignment of bus routesto bus garages. The resulting changes have helpedthe CTA realize $5 million in savings annually in oper-ating costs due to more efficient schedules.
To further improve the transit experience, new busshelters were installed along many of CTA's busiestroutes. Funded by the City of Chicago's StreetFurniture project, plans call for a total of 2,175 shel-ters to be installed throughout the city. In addition toproviding protection from the elements, the new
The curved track at Harrison Curve was removed and replacedwith a new, more linear track. These before and after photosshow what the CTA can accomplish in a weekend.
8
Designing for the Future of Public Transit: Budget 2004Designing for the Future of Public Transit: Budget 2004
structures help attract new customers to publictransit by featuring useful amenities such as brightlighting and CTA system maps. They are kept in tip-top condition by a mobile staff that handles mainte-nance and repairs.
Projects of the scope and magnitude necessaryto maintain the second largest transit systemin the country require a great deal of support,and the CTA has received generous support
from the City of Chicago in restoring its facilities. In2003, the Chicago Department of Transportation(CDOT) funded and managed the reconstruction of theunderground transfer tunnel at the CTA's State/Jackson subway station on the Red Line. The tunnelprovides a pedway connection between the Red andBlue Line platforms at State/Jackson, adding greaterconvenience for CTA customers as well as protectionfrom the elements. Renovation of the transfer tunnelis part of a project currently underway by CDOT tocompletely rebuild the Red Line platform betweenAdams and Van Buren.
Since 1989, the City of Chicago has provided the CTAwith more than $753 million in funding for facilityimprovements. This substantial investment in theCTA's infrastructure is vital to obtaining a state ofgood repair throughout the system.
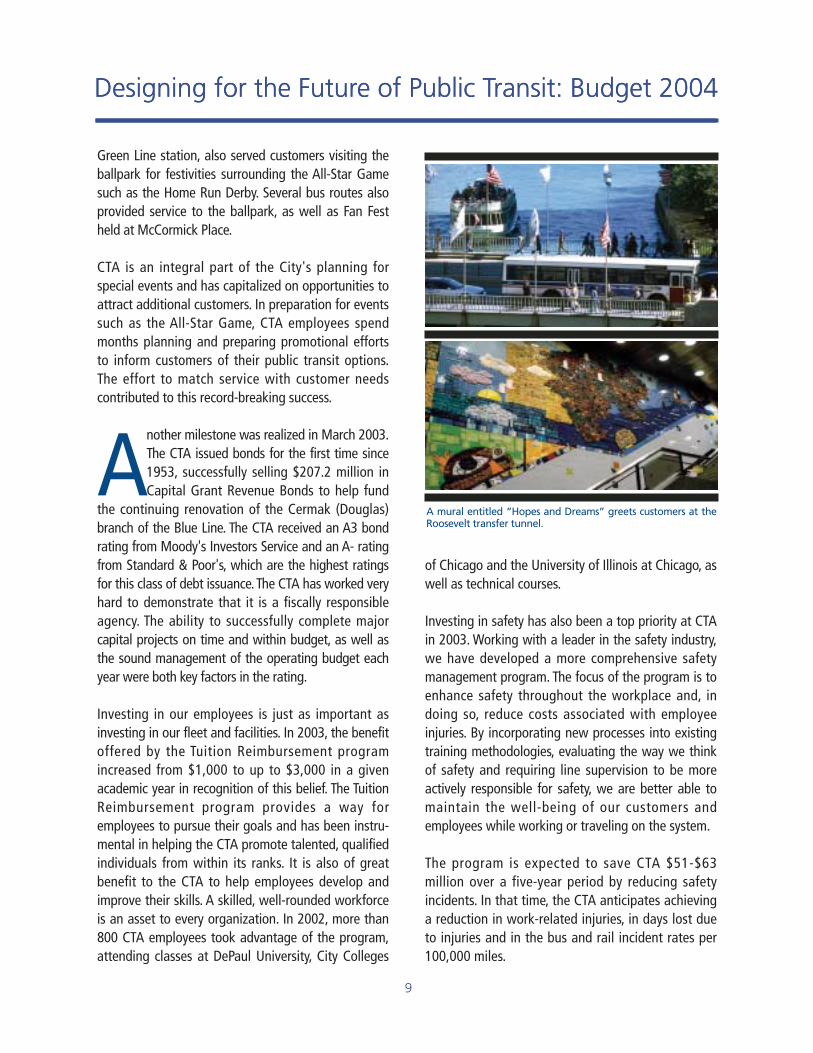
CTA and CDOT had another opportunity to work intandem in 2003, resulting in a savings of both timeand money. The CTA rehabilitated the Sox-35th RedLine station while CDOT rebuilt the bridge over theDan Ryan at 35th Street. Rehabilitation of the stationwas completed in time for Major League Baseball'sAll-Star Game at U.S. Cellular Field.
As a result of the All-Star Game, the Sox-35th Red Linestation set a record by serving more customers in oneday than ever before. The Sox-35th station welcomednearly 14,000 customers on the day of the All-StarGame. To compare, on a typical game day approxi-mately 8,000 customers pass through the station. ThisRed Line station, along with the 35th-Bronzeville-IIT The newly renovated Sox-35th station on the Red Line.
CTA posters commemorating Major LeagueBaseball's 2003 All-Star Game, Red Line service and the 2003 season.
9
Designing for the Future of Public Transit: Budget 2004Designing for the Future of Public Transit: Budget 2004
Green Line station, also served customers visiting theballpark for festivities surrounding the All-Star Gamesuch as the Home Run Derby. Several bus routes alsoprovided service to the ballpark, as well as Fan Festheld at McCormick Place.
CTA is an integral part of the City's planning forspecial events and has capitalized on opportunities toattract additional customers. In preparation for eventssuch as the All-Star Game, CTA employees spendmonths planning and preparing promotional effortsto inform customers of their public transit options.The effort to match service with customer needscontributed to this record-breaking success.
Another milestone was realized in March 2003.The CTA issued bonds for the first time since1953, successfully selling $207.2 million inCapital Grant Revenue Bonds to help fund
the continuing renovation of the Cermak (Douglas)branch of the Blue Line. The CTA received an A3 bondrating from Moody's Investors Service and an A- ratingfrom Standard & Poor's, which are the highest ratingsfor this class of debt issuance.The CTA has worked veryhard to demonstrate that it is a fiscally responsibleagency. The ability to successfully complete majorcapital projects on time and within budget, as well asthe sound management of the operating budget eachyear were both key factors in the rating.
Investing in our employees is just as important asinvesting in our fleet and facilities. In 2003, the benefitoffered by the Tuition Reimbursement programincreased from $1,000 to up to $3,000 in a givenacademic year in recognition of this belief. The TuitionReimbursement program provides a way foremployees to pursue their goals and has been instru-mental in helping the CTA promote talented, qualifiedindividuals from within its ranks. It is also of greatbenefit to the CTA to help employees develop andimprove their skills. A skilled, well-rounded workforceis an asset to every organization. In 2002, more than800 CTA employees took advantage of the program,attending classes at DePaul University, City Colleges
of Chicago and the University of Illinois at Chicago, aswell as technical courses.
Investing in safety has also been a top priority at CTAin 2003. Working with a leader in the safety industry,we have developed a more comprehensive safetymanagement program. The focus of the program is toenhance safety throughout the workplace and, indoing so, reduce costs associated with employeeinjuries. By incorporating new processes into existingtraining methodologies, evaluating the way we thinkof safety and requiring line supervision to be moreactively responsible for safety, we are better able tomaintain the well-being of our customers andemployees while working or traveling on the system.
The program is expected to save CTA $51-$63million over a five-year period by reducing safetyincidents. In that time, the CTA anticipates achievinga reduction in work-related injuries, in days lost dueto injuries and in the bus and rail incident rates per100,000 miles.
A mural entitled “Hopes and Dreams” greets customers at theRoosevelt transfer tunnel.
Designing for the Future of Public Transit: Budget 2004
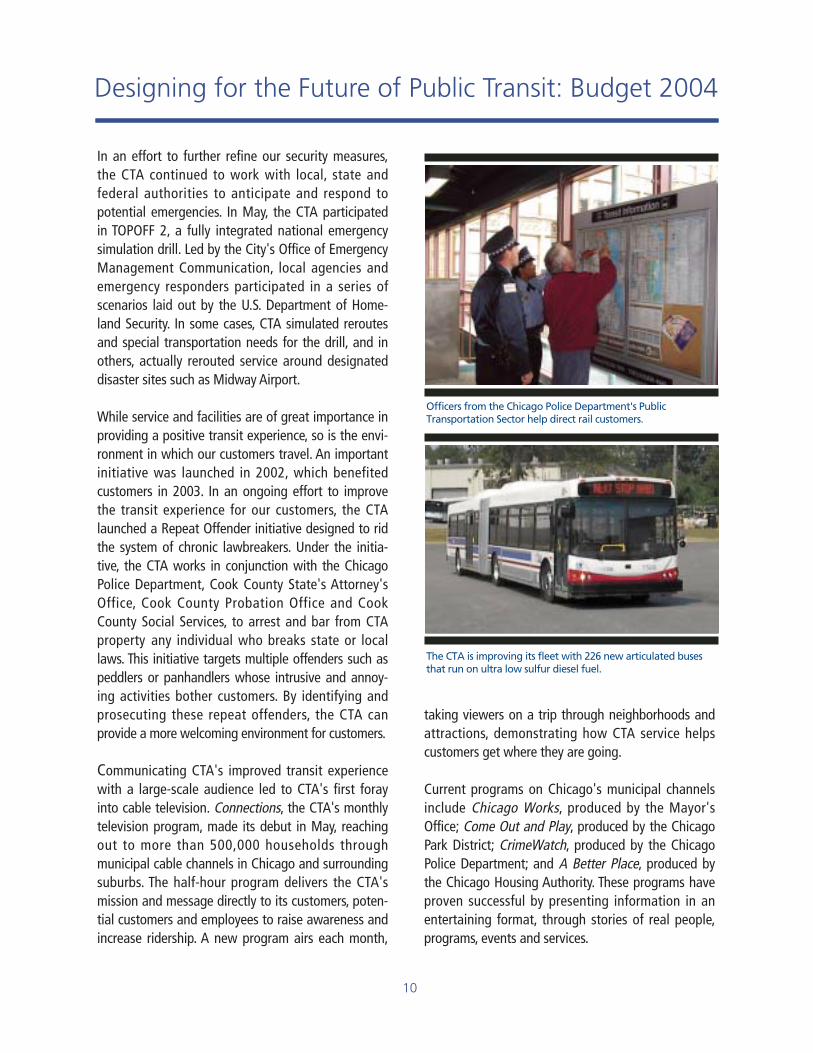
In an effort to further refine our security measures,the CTA continued to work with local, state andfederal authorities to anticipate and respond topotential emergencies. In May, the CTA participatedin TOPOFF 2, a fully integrated national emergencysimulation drill. Led by the City's Office of EmergencyManagement Communication, local agencies andemergency responders participated in a series ofscenarios laid out by the U.S. Department of Home-land Security. In some cases, CTA simulated reroutesand special transportation needs for the drill, and inothers, actually rerouted service around designateddisaster sites such as Midway Airport.
While service and facilities are of great importance inproviding a positive transit experience, so is the envi-ronment in which our customers travel. An importantinitiative was launched in 2002, which benefitedcustomers in 2003. In an ongoing effort to improvethe transit experience for our customers, the CTAlaunched a Repeat Offender initiative designed to ridthe system of chronic lawbreakers. Under the initia-tive, the CTA works in conjunction with the ChicagoPolice Department, Cook County State's Attorney'sOffice, Cook County Probation Office and CookCounty Social Services, to arrest and bar from CTAproperty any individual who breaks state or locallaws. This initiative targets multiple offenders such aspeddlers or panhandlers whose intrusive and annoy-ing activities bother customers. By identifying andprosecuting these repeat offenders, the CTA canprovide a more welcoming environment for customers.
Communicating CTA's improved transit experiencewith a large-scale audience led to CTA's first forayinto cable television. Connections, the CTA's monthlytelevision program, made its debut in May, reachingout to more than 500,000 households throughmunicipal cable channels in Chicago and surroundingsuburbs. The half-hour program delivers the CTA'smission and message directly to its customers, poten-tial customers and employees to raise awareness andincrease ridership. A new program airs each month,
taking viewers on a trip through neighborhoods andattractions, demonstrating how CTA service helpscustomers get where they are going.
Current programs on Chicago's municipal channelsinclude Chicago Works, produced by the Mayor'sOffice; Come Out and Play, produced by the ChicagoPark District; CrimeWatch, produced by the ChicagoPolice Department; and A Better Place, produced bythe Chicago Housing Authority. These programs haveproven successful by presenting information in anentertaining format, through stories of real people,programs, events and services.
Officers from the Chicago Police Department's Public Transportation Sector help direct rail customers.
10
The CTA is improving its fleet with 226 new articulated busesthat run on ultra low sulfur diesel fuel.
11
Designing for the Future of Public Transit: Budget 2004Designing for the Future of Public Transit: Budget 2004
CTA has developed a number of initiatives inits effort to operate in an environmentallyfriendly manner. Lessening the impact ofCTA's fleet and operations on the environ-
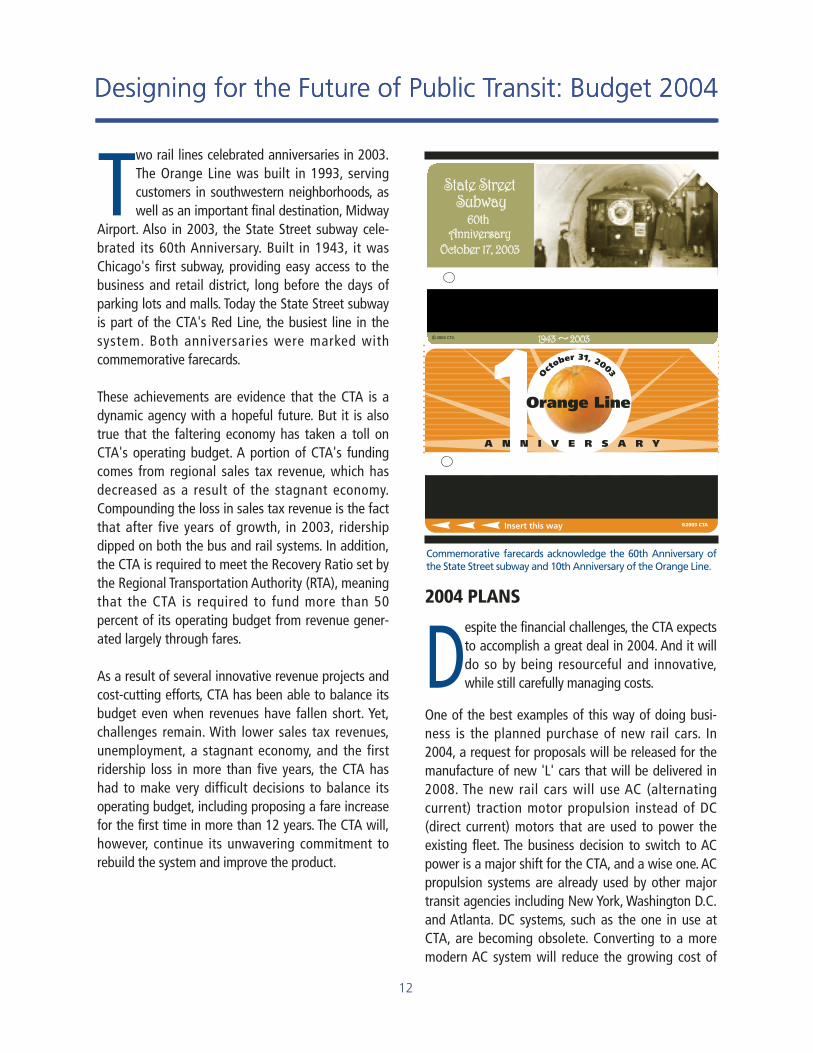
ment also contributes to an improved transit experi-ence for customers, as well as people who residewithin the service area. In 2003, the CTA converted alldiesel vehicles in the fleet from #1 diesel fuel to ultralow sulfur diesel (ULSD) fuel to reduce emissions. TheCTA uses 23 million gallons of diesel fuel annually.Converting to ULSD is the most cost-effective way toreduce emissions because it can be used to fuel olderbuses as well as new buses. By converting to ULSD in2003, the CTA is ahead of schedule in implementingthe 2007 Federal Emission requirements for reducedparticulate matter and carbon monoxide.
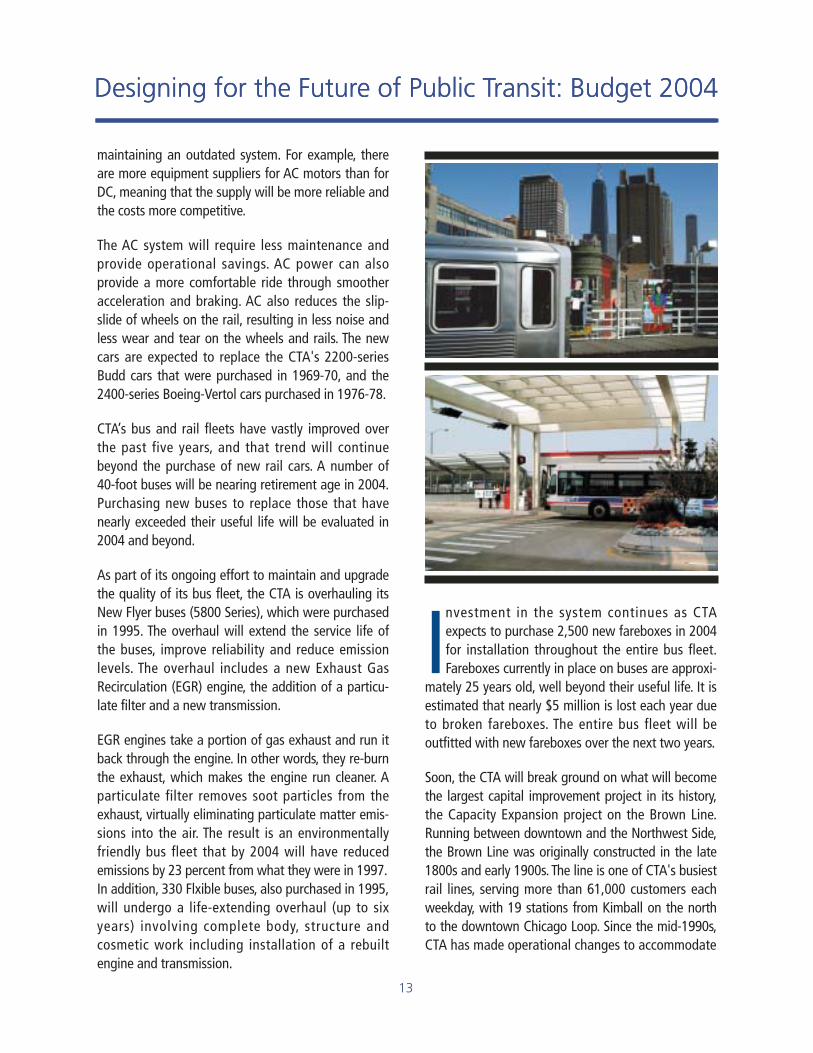
As far back as 1998, when performing routine trackmaintenance, CTA began replacing wooden creosote-soaked railroad ties with ties made from recycledplastic. Wooden ties require creosote treatments toextend their service life, especially in certain harshclimates. The recycled plastic ties offer both perform-ance and environmental advantages as they aredesigned to resist decay, insect attack and waterabsorption.
The rehabilitation of the Cermak (Douglas) Blue Linehas provided the opportunity to accelerate the use ofrecycled plastic ties in the system because of the newtrack being laid. To date, the CTA has installed thelargest number of recycled plastic composite ties ofany public transit agency in the country. Of the650,000 track ties in use on the CTA system, 32,000are made from plastic, with an additional 9,000currently on order.
Also in 2003, the CTA won an award from the Mayor'sBike Advisory Committee for being the most bike-friendly governmental agency in the city. Through theBike & Ride Program, the CTA has made it moreconvenient for customers to bring their bicycles onboth buses and trains. CTA buses are equipped with
bike racks making Chicago, behind Los Angeles,home to the nation's second largest bike accessiblebus fleet.
Since 2000, CTA has allowed two bicycles on eachrail car at all times except two hours during weekdaymorning (7-9 a.m.) and evening (4-6 p.m.) rushperiods, and during special events when ridership ishigh. Bikes are allowed on rail cars during all hourson weekends. For those who want to pedal to a railstation and complete their commute by rail, bicycleparking is available at 94 rail stations, including 26stations with indoor racks.
A CTA bus equipped with a bike rack operates along Lake Shore Drive.
Track maintenance is performed on an elevated rail structure.
Two rail lines celebrated anniversaries in 2003.The Orange Line was built in 1993, servingcustomers in southwestern neighborhoods, aswell as an important final destination, Midway
Airport. Also in 2003, the State Street subway cele-brated its 60th Anniversary. Built in 1943, it wasChicago's first subway, providing easy access to thebusiness and retail district, long before the days ofparking lots and malls. Today the State Street subwayis part of the CTA's Red Line, the busiest line in thesystem. Both anniversaries were marked withcommemorative farecards.
These achievements are evidence that the CTA is adynamic agency with a hopeful future. But it is alsotrue that the faltering economy has taken a toll onCTA's operating budget. A portion of CTA's fundingcomes from regional sales tax revenue, which hasdecreased as a result of the stagnant economy.Compounding the loss in sales tax revenue is the factthat after five years of growth, in 2003, ridershipdipped on both the bus and rail systems. In addition,the CTA is required to meet the Recovery Ratio set bythe Regional Transportation Authority (RTA), meaningthat the CTA is required to fund more than 50percent of its operating budget from revenue gener-ated largely through fares.
As a result of several innovative revenue projects andcost-cutting efforts, CTA has been able to balance itsbudget even when revenues have fallen short. Yet,challenges remain. With lower sales tax revenues,unemployment, a stagnant economy, and the firstridership loss in more than five years, the CTA hashad to make very difficult decisions to balance itsoperating budget, including proposing a fare increasefor the first time in more than 12 years. The CTA will,however, continue its unwavering commitment torebuild the system and improve the product.
2004 PLANS
Despite the financial challenges, the CTA expectsto accomplish a great deal in 2004. And it willdo so by being resourceful and innovative,while still carefully managing costs.
One of the best examples of this way of doing busi-ness is the planned purchase of new rail cars. In2004, a request for proposals will be released for themanufacture of new 'L' cars that will be delivered in2008. The new rail cars will use AC (alternatingcurrent) traction motor propulsion instead of DC(direct current) motors that are used to power theexisting fleet. The business decision to switch to ACpower is a major shift for the CTA, and a wise one. ACpropulsion systems are already used by other majortransit agencies including New York, Washington D.C.and Atlanta. DC systems, such as the one in use atCTA, are becoming obsolete. Converting to a moremodern AC system will reduce the growing cost of
12
Designing for the Future of Public Transit: Budget 2004Designing for the Future of Public Transit: Budget 2004
Commemorative farecards acknowledge the 60th Anniversary ofthe State Street subway and 10th Anniversary of the Orange Line.
13
Designing for the Future of Public Transit: Budget 2004Designing for the Future of Public Transit: Budget 2004
maintaining an outdated system. For example, thereare more equipment suppliers for AC motors than forDC, meaning that the supply will be more reliable andthe costs more competitive.
The AC system will require less maintenance andprovide operational savings. AC power can alsoprovide a more comfortable ride through smootheracceleration and braking. AC also reduces the slip-slide of wheels on the rail, resulting in less noise andless wear and tear on the wheels and rails. The newcars are expected to replace the CTA's 2200-seriesBudd cars that were purchased in 1969-70, and the2400-series Boeing-Vertol cars purchased in 1976-78.
CTA’s bus and rail fleets have vastly improved overthe past five years, and that trend will continuebeyond the purchase of new rail cars. A number of40-foot buses will be nearing retirement age in 2004.Purchasing new buses to replace those that havenearly exceeded their useful life will be evaluated in2004 and beyond.
As part of its ongoing effort to maintain and upgradethe quality of its bus fleet, the CTA is overhauling itsNew Flyer buses (5800 Series), which were purchasedin 1995. The overhaul will extend the service life ofthe buses, improve reliability and reduce emissionlevels. The overhaul includes a new Exhaust GasRecirculation (EGR) engine, the addition of a particu-late filter and a new transmission.
EGR engines take a portion of gas exhaust and run itback through the engine. In other words, they re-burnthe exhaust, which makes the engine run cleaner. Aparticulate filter removes soot particles from theexhaust, virtually eliminating particulate matter emis-sions into the air. The result is an environmentallyfriendly bus fleet that by 2004 will have reducedemissions by 23 percent from what they were in 1997.In addition, 330 Flxible buses, also purchased in 1995,will undergo a life-extending overhaul (up to sixyears) involving complete body, structure andcosmetic work including installation of a rebuiltengine and transmission.
Investment in the system continues as CTAexpects to purchase 2,500 new fareboxes in 2004for installation throughout the entire bus fleet.Fareboxes currently in place on buses are approxi-
mately 25 years old, well beyond their useful life. It isestimated that nearly $5 million is lost each year dueto broken fareboxes. The entire bus fleet will beoutfitted with new fareboxes over the next two years.
Soon, the CTA will break ground on what will becomethe largest capital improvement project in its history,the Capacity Expansion project on the Brown Line.Running between downtown and the Northwest Side,the Brown Line was originally constructed in the late1800s and early 1900s. The line is one of CTA's busiestrail lines, serving more than 61,000 customers eachweekday, with 19 stations from Kimball on the northto the downtown Chicago Loop. Since the mid-1990s,CTA has made operational changes to accommodate
14
Designing for the Future of Public Transit: Budget 2004Designing for the Future of Public Transit: Budget 2004
demand on the Brown Line, including having PurpleLine trains stop at Brown Line stations from Belmontto downtown Chicago, extending service hours,adding additional trips during afternoon rush hours,reducing headways and restoring service on Sundays.
Despite these service adjustments, persistent crowdingon Brown Line station platforms continues to impactcustomers. The goal of the project is to provide fullyaccessible stations capable of supporting eight-cartrains to increase capacity and bring stations alongthe line to a state of good repair.
In 2004, CTA will begin work on the $50.5 millionrenovation of the Howard 'L' Station on Chicago'sNorth Side. More than 15 years ago, the CTAbegan modernizing and expanding the Howard
rail yard---which is adjacent to the station---to accom-modate the additional cars that would be neededwhen the Howard and Dan Ryan 'L' branches werejoined together in 1993. The realignment that tookplace that year allowed the CTA to make more effec-tive use of its rail fleet by tying together the twobranches that carried the most riders, while connec-ting two more lightly used lines.
Today the station at Howard is a busy boarding andtransfer point, and it has more trains operating in andout than any other station in the CTA system. An esti-mated 17,200 customers change trains at the stationeach day, and another 6,000 customers enter thestation from the street.
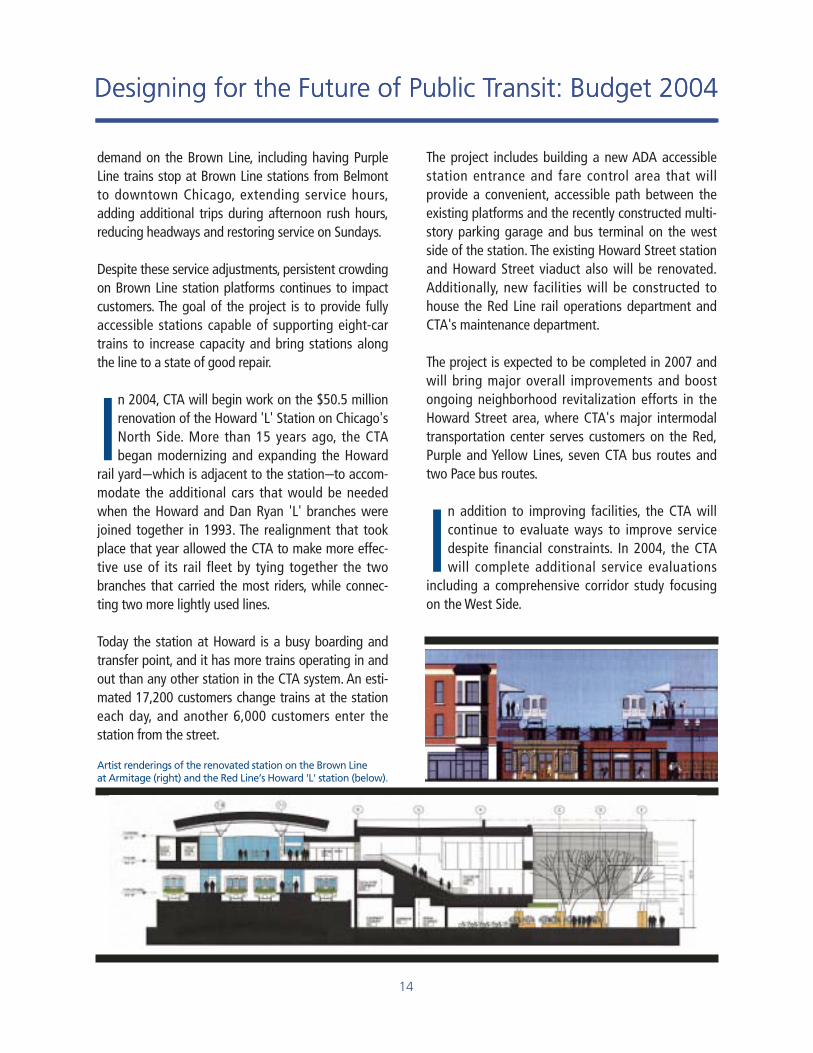
The project includes building a new ADA accessiblestation entrance and fare control area that willprovide a convenient, accessible path between theexisting platforms and the recently constructed multi-story parking garage and bus terminal on the westside of the station. The existing Howard Street stationand Howard Street viaduct also will be renovated.Additionally, new facilities will be constructed tohouse the Red Line rail operations department andCTA's maintenance department.
The project is expected to be completed in 2007 andwill bring major overall improvements and boostongoing neighborhood revitalization efforts in theHoward Street area, where CTA's major intermodaltransportation center serves customers on the Red,Purple and Yellow Lines, seven CTA bus routes andtwo Pace bus routes.
In addition to improving facilities, the CTA willcontinue to evaluate ways to improve servicedespite financial constraints. In 2004, the CTAwill complete additional service evaluations
including a comprehensive corridor study focusingon the West Side.
Artist renderings of the renovated station on the Brown Line at Armitage (right) and the Red Line’s Howard 'L' station (below).
15
Designing for the Future of Public Transit: Budget 2004Designing for the Future of Public Transit: Budget 2004
materials are key tools that contribute to effectivebudget management.
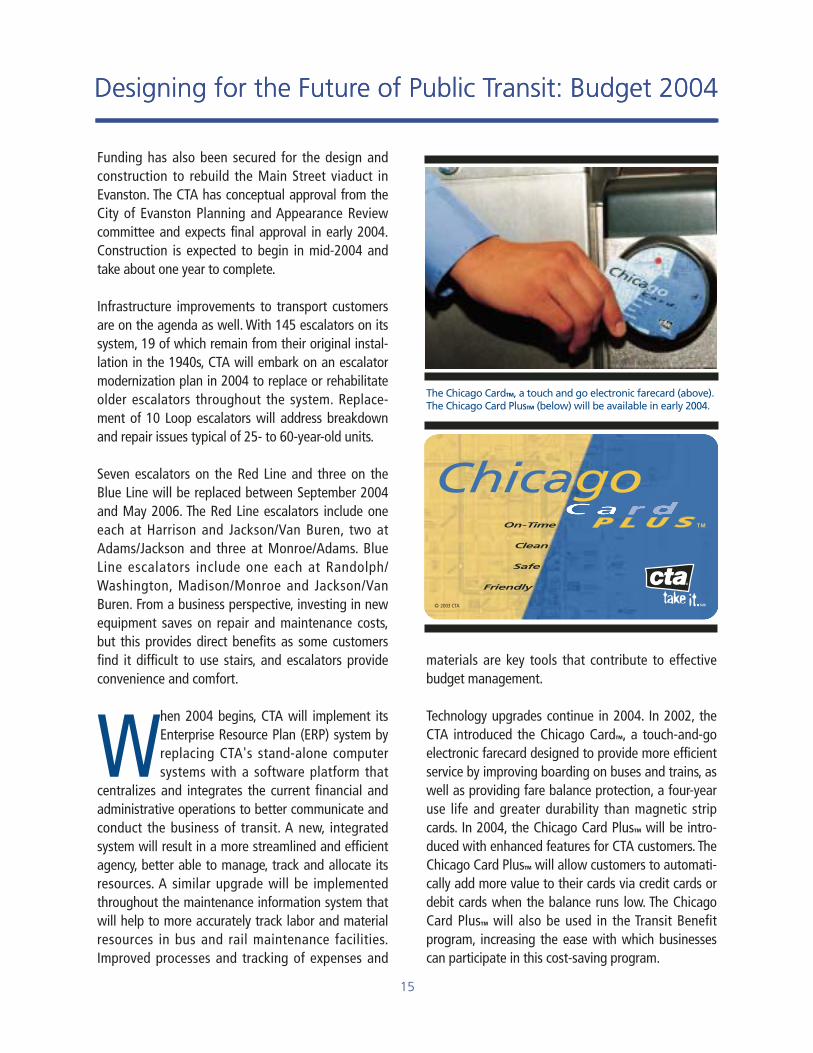
Technology upgrades continue in 2004. In 2002, theCTA introduced the Chicago CardTM, a touch-and-goelectronic farecard designed to provide more efficientservice by improving boarding on buses and trains, aswell as providing fare balance protection, a four-yearuse life and greater durability than magnetic stripcards. In 2004, the Chicago Card PlusTM will be intro-duced with enhanced features for CTA customers. TheChicago Card PlusTM will allow customers to automati-cally add more value to their cards via credit cards ordebit cards when the balance runs low. The ChicagoCard PlusTM will also be used in the Transit Benefitprogram, increasing the ease with which businessescan participate in this cost-saving program.
The Chicago CardTM, a touch and go electronic farecard (above).The Chicago Card PlusTM (below) will be available in early 2004.
Funding has also been secured for the design andconstruction to rebuild the Main Street viaduct inEvanston. The CTA has conceptual approval from theCity of Evanston Planning and Appearance Reviewcommittee and expects final approval in early 2004.Construction is expected to begin in mid-2004 andtake about one year to complete.
Infrastructure improvements to transport customersare on the agenda as well. With 145 escalators on itssystem, 19 of which remain from their original instal-lation in the 1940s, CTA will embark on an escalatormodernization plan in 2004 to replace or rehabilitateolder escalators throughout the system. Replace-ment of 10 Loop escalators will address breakdownand repair issues typical of 25- to 60-year-old units.
Seven escalators on the Red Line and three on theBlue Line will be replaced between September 2004and May 2006. The Red Line escalators include oneeach at Harrison and Jackson/Van Buren, two atAdams/Jackson and three at Monroe/Adams. BlueLine escalators include one each at Randolph/Washington, Madison/Monroe and Jackson/VanBuren. From a business perspective, investing in newequipment saves on repair and maintenance costs,but this provides direct benefits as some customersfind it difficult to use stairs, and escalators provideconvenience and comfort.
When 2004 begins, CTA will implement itsEnterprise Resource Plan (ERP) system byreplacing CTA's stand-alone computersystems with a software platform that
centralizes and integrates the current financial andadministrative operations to better communicate andconduct the business of transit. A new, integratedsystem will result in a more streamlined and efficientagency, better able to manage, track and allocate itsresources. A similar upgrade will be implementedthroughout the maintenance information system thatwill help to more accurately track labor and materialresources in bus and rail maintenance facilities.Improved processes and tracking of expenses and
16
Designing for the Future of Public Transit: Budget 2004Designing for the Future of Public Transit: Budget 2004
The Transit Benefit program provides a tax benefit toboth employers and employees by enabling them topurchase fares with pre-tax earnings. Participants'monthly pre-tax deductions can be up to $100, whichenables employees to save $200 to $465 in taxesannually by paying for transit with pre-tax dollars setaside from their paychecks. Employers benefit bygetting an annual payroll tax savings of approximately10 percent of what their employees set aside due todecreased payroll costs. Currently, 2,800 employersand 65,000 employees in the Chicagoland area areenrolled in the Transit Benefit program. Transit Benefitsales have grown from $1 million in 1999 to $12million in 2002, a 1,100 percent increase.
In our continuing efforts to control and reduceoperating costs, CTA will move into its new head-quarters located at 567 West Lake Street in fall2004. This relocation will reduce the CTA's annual
operating expenses by saving an average of $7.7million annually over the life of a lease alternative.
The CTA's headquarters have been located in theMerchandise Mart since the agency's inception in1947. The CTA also occupies office space at 350 N.Orleans (Apparel Center) and 120 N. Racine at anannual cost of $5.5 million. Consolidating administra-tive offices and owning rather than leasing willprovide the strongest long-term investment value andallow the CTA to use capital funds rather than oper-ating funds for its office space. The total base buildingdevelopment cost is $75.9 million, with additionalcosts such as architectural services, relocation costsand furnishings bringing the total to $94.6 million,which will be paid for entirely by capital funds. Nooperating funds will be used for this building.
The decision to relocate is a long-term financialopportunity that will not only reduce office spaceexpenses, but will enable the CTA to shift the expenseof a lease payment from the operating budget to thecapital budget. Using capital funds will help tobalance the operating budget and meet the RTA'sRecovery Ratio. In addition, by eliminating a lease
payment from the operating budget, those funds canbe used to support service for customers.
Operating the CTA in as cost-efficient manner aspossible is a challenge that can be met. According toour most recent Customer Satisfaction Survey, theperception of the CTA as a market-oriented agencyincreased from 41 percent in 1997 to 61 percent in2001. One of the contributing factors cited for thisimprovement was the CTA's cost-conscious manage-ment of a large and complex system.
FUTURE PLANS --- BEYOND 2004
In Chicago, transit is not simply an overflow outletfor those who would rather drive; for many, it is---by choice--- their primary mode of transportation.In the entire area CTA serves, just 10 percent of
households have residents who have never used CTA.One in five of CTA's current customers live in theChicago suburbs. Sixty-eight percent of CTA customershave a car or other option available, but choose to ridethe CTA---and this number has been growing. Transitplays a critical role in settings where land values arehigh and the space for new highway construction,and associated parking needs, is significantly limitedor non-existent.
The CTA's current infrastructure provides the mostintegrated blueprint for designing the future of theregion's public transit. It is the core system with themost potential for cost-effectively connecting to other
17
Designing for the Future of Public Transit: Budget 2004Designing for the Future of Public Transit: Budget 2004
new or extended transit systems across the country.These rail and bus investments, in turn, have improvedthe mobility of millions of Americans, helped to reducecongestion and improve air quality in the areas theyserve, and have fostered the development of viable,safer and more livable communities.
The Transportation Equity Act for the 21st Century(TEA-21) authorized $8.2 billion in New Startsfunding nationwide through fiscal year 2003. Thecompetition for funding remains highly competitiveas transit agencies throughout the country experiencethe same impact as CTA from a down economy.
Top CTA projects include express rail service to bothMidway and O'Hare Airports, building the Circle Line,extending the Orange Line from Midway Airport toFord City, extending the Red Line from 95th to
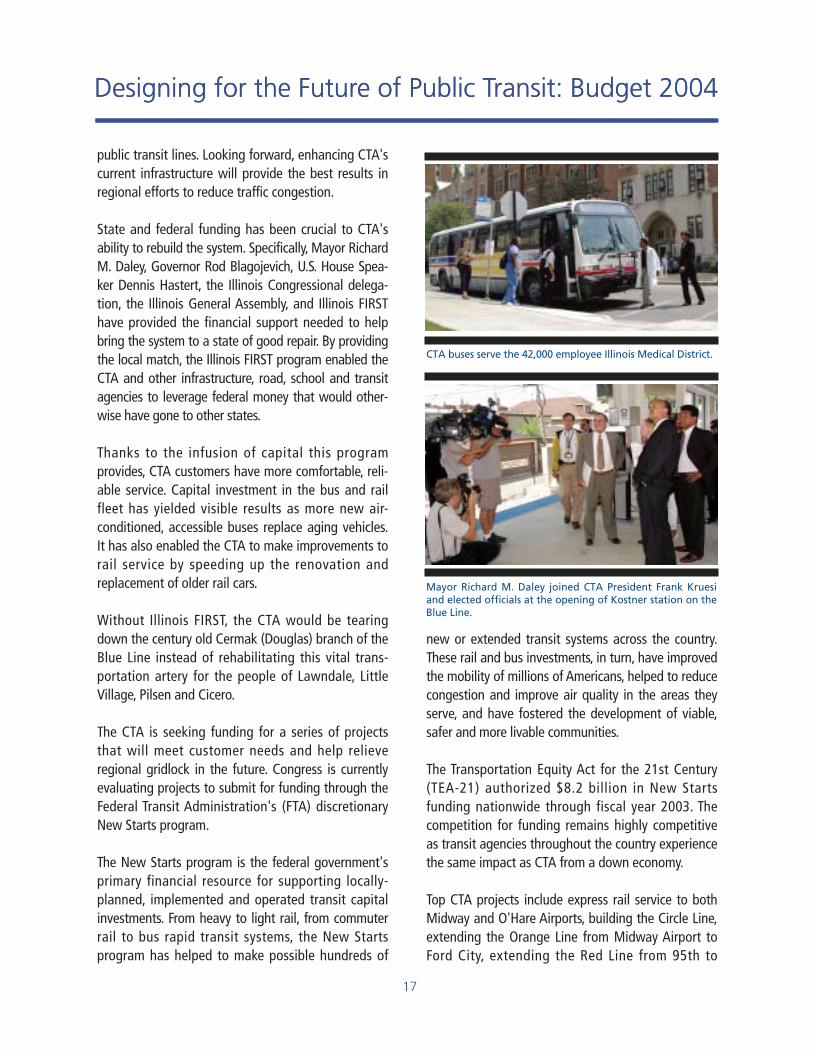
Mayor Richard M. Daley joined CTA President Frank Kruesiand elected officials at the opening of Kostner station on theBlue Line.
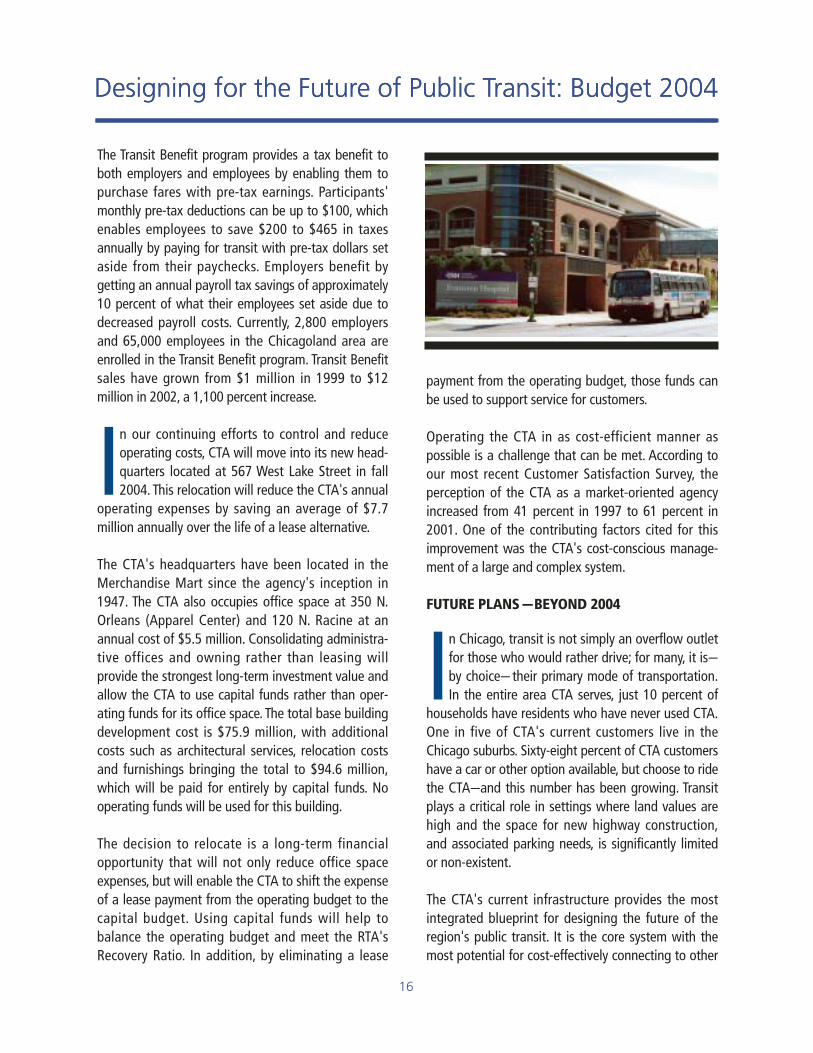
CTA buses serve the 42,000 employee Illinois Medical District.
public transit lines. Looking forward, enhancing CTA'scurrent infrastructure will provide the best results inregional efforts to reduce traffic congestion.
State and federal funding has been crucial to CTA'sability to rebuild the system. Specifically, Mayor RichardM. Daley, Governor Rod Blagojevich, U.S. House Spea-ker Dennis Hastert, the Illinois Congressional delega-tion, the Illinois General Assembly, and Illinois FIRSThave provided the financial support needed to helpbring the system to a state of good repair. By providingthe local match, the Illinois FIRST program enabled theCTA and other infrastructure, road, school and transitagencies to leverage federal money that would other-wise have gone to other states.
Thanks to the infusion of capital this programprovides, CTA customers have more comfortable, reli-able service. Capital investment in the bus and railfleet has yielded visible results as more new air-conditioned, accessible buses replace aging vehicles.It has also enabled the CTA to make improvements torail service by speeding up the renovation andreplacement of older rail cars.
Without Illinois FIRST, the CTA would be tearingdown the century old Cermak (Douglas) branch of theBlue Line instead of rehabilitating this vital trans-portation artery for the people of Lawndale, LittleVillage, Pilsen and Cicero.
The CTA is seeking funding for a series of projectsthat will meet customer needs and help relieveregional gridlock in the future. Congress is currentlyevaluating projects to submit for funding through theFederal Transit Administration's (FTA) discretionaryNew Starts program.
The New Starts program is the federal government'sprimary financial resource for supporting locally-planned, implemented and operated transit capitalinvestments. From heavy to light rail, from commuterrail to bus rapid transit systems, the New Startsprogram has helped to make possible hundreds of
18
Designing for the Future of Public Transit: Budget 2004Designing for the Future of Public Transit: Budget 2004
selection of a locally preferred alternative, and toperform the necessary analysis to prepare a draftenvironmental impact statement.
Extending the Orange Line to Ford City wouldcomplete the original Orange Line plan to provideimproved access to downtown from the far south-west side and from the central city to the strongemployment corridor along South Cicero Avenue.
Plans for new transit service along the Ogden andCarroll Avenue corridors would involve bus rapidtransit and electric streetcar transit service, and serveas a catalyst for further transit-oriented economic revi-talization of the communities through which it travels.The line would connect several Chicago neighbor-hoods including Douglas Park, the West Loop and the42,000-employee Illinois Medical District. Theproposed transit line would have a western terminal atNorth Riverside Park Mall at Harlem and Cermak, andoperate along Cermak Road, Ogden Avenue, Randolph
130th/Stony Island, extending the Yellow Line to OldOrchard Mall, and establishing a street car and busrapid transit system along the Ogden and CarrollAvenue corridors.
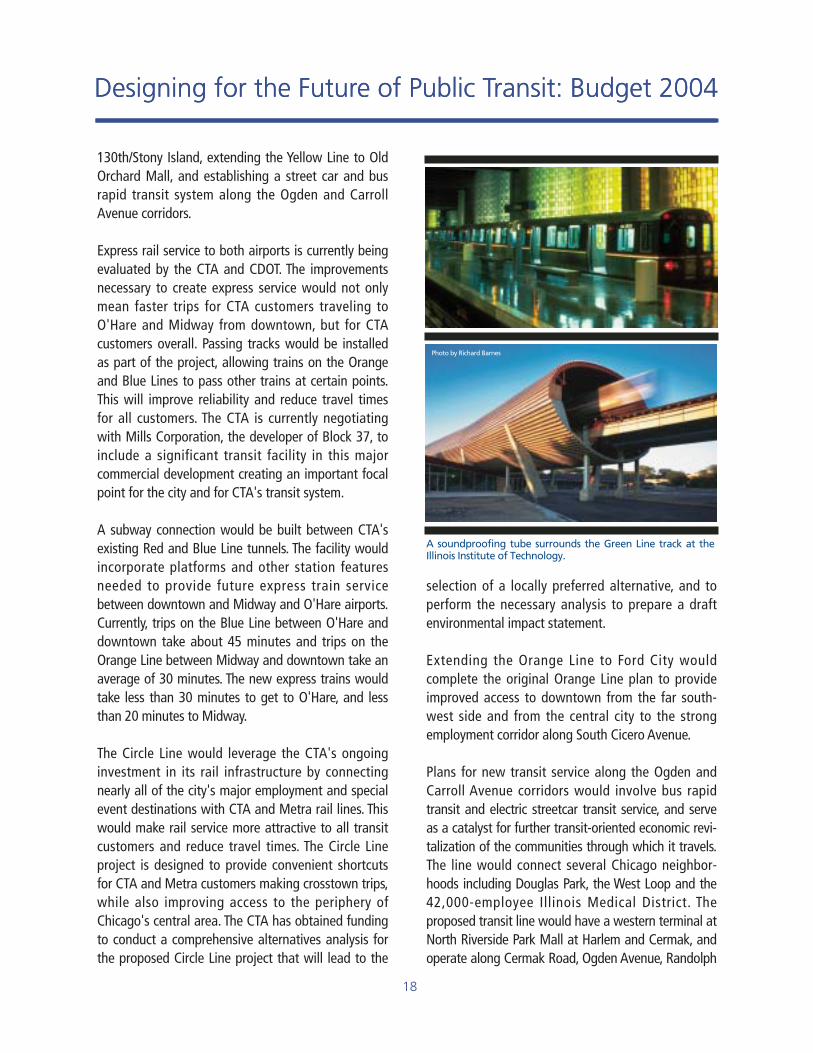
Express rail service to both airports is currently beingevaluated by the CTA and CDOT. The improvementsnecessary to create express service would not onlymean faster trips for CTA customers traveling toO'Hare and Midway from downtown, but for CTAcustomers overall. Passing tracks would be installedas part of the project, allowing trains on the Orangeand Blue Lines to pass other trains at certain points.This will improve reliability and reduce travel timesfor all customers. The CTA is currently negotiatingwith Mills Corporation, the developer of Block 37, toinclude a significant transit facility in this majorcommercial development creating an important focalpoint for the city and for CTA's transit system.
A subway connection would be built between CTA'sexisting Red and Blue Line tunnels. The facility wouldincorporate platforms and other station featuresneeded to provide future express train servicebetween downtown and Midway and O'Hare airports.Currently, trips on the Blue Line between O'Hare anddowntown take about 45 minutes and trips on theOrange Line between Midway and downtown take anaverage of 30 minutes. The new express trains wouldtake less than 30 minutes to get to O'Hare, and lessthan 20 minutes to Midway.
The Circle Line would leverage the CTA's ongoinginvestment in its rail infrastructure by connectingnearly all of the city's major employment and specialevent destinations with CTA and Metra rail lines. Thiswould make rail service more attractive to all transitcustomers and reduce travel times. The Circle Lineproject is designed to provide convenient shortcutsfor CTA and Metra customers making crosstown trips,while also improving access to the periphery ofChicago's central area. The CTA has obtained fundingto conduct a comprehensive alternatives analysis forthe proposed Circle Line project that will lead to the
Photo by Richard Barnes
A soundproofing tube surrounds the Green Line track at theIllinois Institute of Technology.
19
Designing for the Future of Public Transit: Budget 2004Designing for the Future of Public Transit: Budget 2004
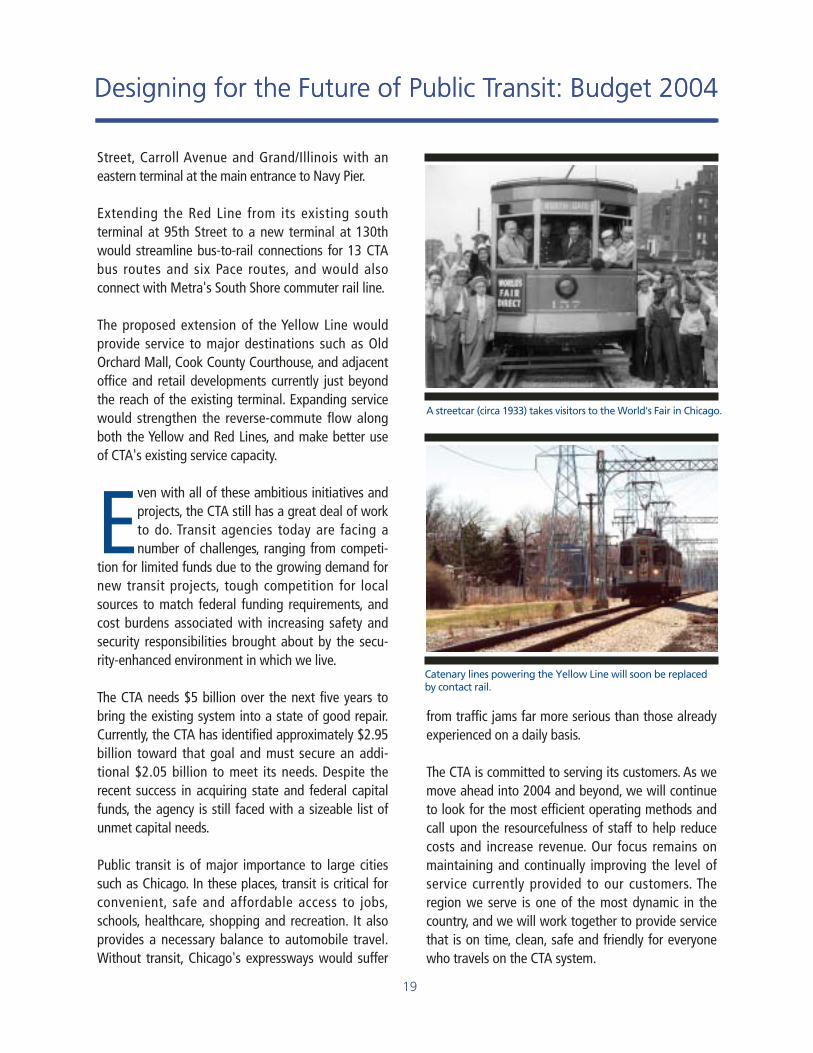
Street, Carroll Avenue and Grand/Illinois with aneastern terminal at the main entrance to Navy Pier.
Extending the Red Line from its existing southterminal at 95th Street to a new terminal at 130thwould streamline bus-to-rail connections for 13 CTAbus routes and six Pace routes, and would alsoconnect with Metra's South Shore commuter rail line.
The proposed extension of the Yellow Line wouldprovide service to major destinations such as OldOrchard Mall, Cook County Courthouse, and adjacentoffice and retail developments currently just beyondthe reach of the existing terminal. Expanding servicewould strengthen the reverse-commute flow alongboth the Yellow and Red Lines, and make better useof CTA's existing service capacity.
Even with all of these ambitious initiatives andprojects, the CTA still has a great deal of workto do. Transit agencies today are facing anumber of challenges, ranging from competi-
tion for limited funds due to the growing demand fornew transit projects, tough competition for localsources to match federal funding requirements, andcost burdens associated with increasing safety andsecurity responsibilities brought about by the secu-rity-enhanced environment in which we live.
The CTA needs $5 billion over the next five years tobring the existing system into a state of good repair.Currently, the CTA has identified approximately $2.95billion toward that goal and must secure an addi-tional $2.05 billion to meet its needs. Despite therecent success in acquiring state and federal capitalfunds, the agency is still faced with a sizeable list ofunmet capital needs.
Public transit is of major importance to large citiessuch as Chicago. In these places, transit is critical forconvenient, safe and affordable access to jobs,schools, healthcare, shopping and recreation. It alsoprovides a necessary balance to automobile travel.Without transit, Chicago's expressways would suffer
from traffic jams far more serious than those alreadyexperienced on a daily basis.
The CTA is committed to serving its customers. As wemove ahead into 2004 and beyond, we will continueto look for the most efficient operating methods andcall upon the resourcefulness of staff to help reducecosts and increase revenue. Our focus remains onmaintaining and continually improving the level ofservice currently provided to our customers. Theregion we serve is one of the most dynamic in thecountry, and we will work together to provide servicethat is on time, clean, safe and friendly for everyonewho travels on the CTA system.
A streetcar (circa 1933) takes visitors to the World's Fair in Chicago.
Catenary lines powering the Yellow Line will soon be replacedby contact rail.
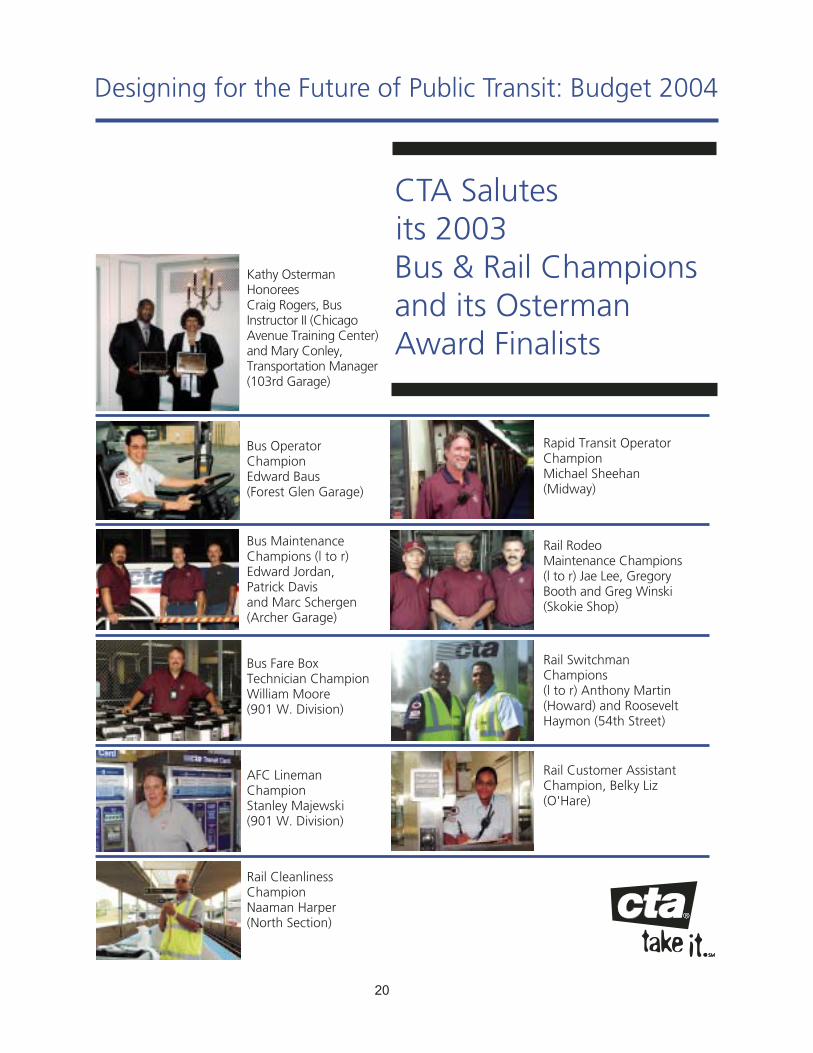
CTA Salutes its 2003 Bus & Rail Champions and its Osterman Award Finalists
Rapid Transit OperatorChampionMichael Sheehan(Midway)
Rail Rodeo Maintenance Champions(l to r) Jae Lee, GregoryBooth and Greg Winski(Skokie Shop)
Rail SwitchmanChampions(l to r) Anthony Martin(Howard) and RooseveltHaymon (54th Street)
Rail Customer AssistantChampion, Belky Liz(O'Hare)
Kathy OstermanHonorees Craig Rogers, BusInstructor II (ChicagoAvenue Training Center)and Mary Conley,Transportation Manager(103rd Garage)
Bus OperatorChampionEdward Baus(Forest Glen Garage)
Bus MaintenanceChampions (l to r)Edward Jordan, Patrick Davisand Marc Schergen(Archer Garage)
Bus Fare BoxTechnician ChampionWilliam Moore(901 W. Division)
AFC LinemanChampionStanley Majewski(901 W. Division)
Rail CleanlinessChampionNaaman Harper(North Section)
Designing for the Future of Public Transit: Budget 2004
20
2003 Operating Budget Performance
Chicago Transit Authority
Courteous
We will create
a pleasant environment
for our customers
and ourselves.
2003 Operating Budget Performance
21
The CTA forecasts completing 2003 with a balanced budget as a result of tight fiscal controls and implementation of alternative revenue programs. Achieving a balanced budget was exceedingly challenging as CTA’s revenues were adversely affected by the economic environment. After five consecutive years of growth, the CTA experienced a decline in ridership for the first time since 1997. Ridership loss was also experienced by our sister agencies Metra and Pace, as well as most other public transportation agencies across the nation. The loss of jobs in the region is the primary factor. The economy in 2003 proved weaker than expected. Both ridership and sales tax revenues for the region fell short of predictions. To add further strain, prices for diesel fuel exceeded budget, and healthcare costs outpaced the rate of inflation more than five-fold. As weaknesses in revenues were experienced early in the year, management immediately implemented a plan of action to address the shortfalls. Once again neither service nor fares were impacted. In fact, service has been increased and improved each year since 1998 and fares have not been increased since December of 1991. In 2003, despite falling sales tax and fare box revenue projections, CTA continued its commitment to service improvements to both rail and bus customers. In response to growth in the industrial and commercial corridors in Chicago, Evanston and Skokie, CTA developed service enhancements to address the transportation needs of employers and employees. Overall, CTA has made service improvements on 61 percent, or 87 out of 142, of its bus routes and on all of its rail routes since November 1998. These improvements include 15 new bus routes, expanded hours of service, added trips to reduce wait time, and route changes to improve access and connectivity. In 2003, the Chicago Transit Authority also made transit more convenient for rail customers:
q Purple Line – Earlier weekend service on both Saturday and Sunday mornings between Linden and Howard.
q Brown Line – More frequent evening service on weekdays and weekend evenings. q Blue Line – More frequent weekday service between the O’Hare branch and downtown and between
the Forest Park and Cermak (Douglas) branches and downtown. q Red Line – More frequent Saturday service.
The CTA also improved bus service on a number of routes throughout the city on both weekends and weekdays to accommodate customers:
q Weekend service on the #3 King Drive route was improved by adding service on Saturday and Sunday mornings.
q Bus service to and from Midway Airport was increased on the #55 Garfield route and the #62 Archer route was expanded to provide 24 hour service from Midway.
q More frequent weekday service was provided on #20 Madison and #34 South Michigan buses. q Service enhancements for bus routes serving Lake Shore Drive.
2003 Operating Budget Performance
22
CTA’s management has made significant steps in 2003 to implement environmental initiatives across the transit and administrative operations. In 2003, the CTA voluntarily began converting all diesel vehicles in CTA’s fleet – both buses and non-revenue vehicles – to more expensive ultra low-sulfur diesel (ULSD) fuel. By converting to ULSD now, the CTA is ahead of schedule in implementing the 2007 Federal Emission requirements for reduced particulate matter and carbon monoxide. The CTA also reached an agreement between the City of Chicago and Commonwealth Edison to upgrade facilities with energy-efficient lighting and improved heating and cooling systems to reduce electricity and natural gas consumption. The agreement will enable the CTA to save nearly $0.5 million per year in energy costs. The CTA continued enhancing its transit infrastructure with several major bus and rail projects in 2003 that included the following highlights:
q Ongoing rehabilitation of the Cermak (Douglas) Branch of the Blue Line. q Purchase of new low-floor articulated buses. q Installation of an automated bus announcement system. q Upgrade of the bus turnaround at 95th Street. q Start renovation on eight stations on the Dan Ryan Branch of the Red Line late fourth quarter. q Upgrade of the signal and communications systems at Clark Junction.
In 2003, the CTA celebrated the opening of two of the eight new or rehabilitated stations as part of the largest rehabilitation in the history of the Cermak (Douglas) Branch of the Blue Line. In the 4th quarter of 2003, the CTA will begin its multi-year Brown Line capacity expansion project. The project, which will be completed in 2008, will reconstruct and expand “L” service to the fastest growing market segment in CTA’s system. The Brown Line was developed in the late 1800’s and includes neighborhood stations that are outdated and cannot accommodate the neighborhood growth along the line. Included in the expansion project are platform extensions to allow for eight-car trains; platforms that meet accessibility requirements of the Americans with Disabilities Act (ADA); upgraded power, signal and communication equipment; and reduction of slow zones. In 2003, the CTA completed rehabilitation of the Harrison curve, a section of the rail system south of the Loop that had a sharp turn requiring slow zones (lower train speed). The elevated structure was built in 1897 by the South Side Elevated Railroad Company to connect with the Loop ‘L’ and serves the Orange and Green Lines. The sharp “S” curve was replaced with new tracks that allows the Orange and Green “L” trains to travel at speeds up to 35 miles an hour from 10 miles per hour prior to the modernization and therefore increases loop track rush-hour capacity. Ridership Ridership for 2003 is forecasted at 448.4 million trips. This forecast is 8.4 million trips or 1.8% below budget and 8.8 million trips or 1.9% below 2002 actual ridership. The decline in ridership is a direct result of the poor economic climate and higher unemployment levels in 2003 for the metropolitan region.
2003 Operating Budget Performance
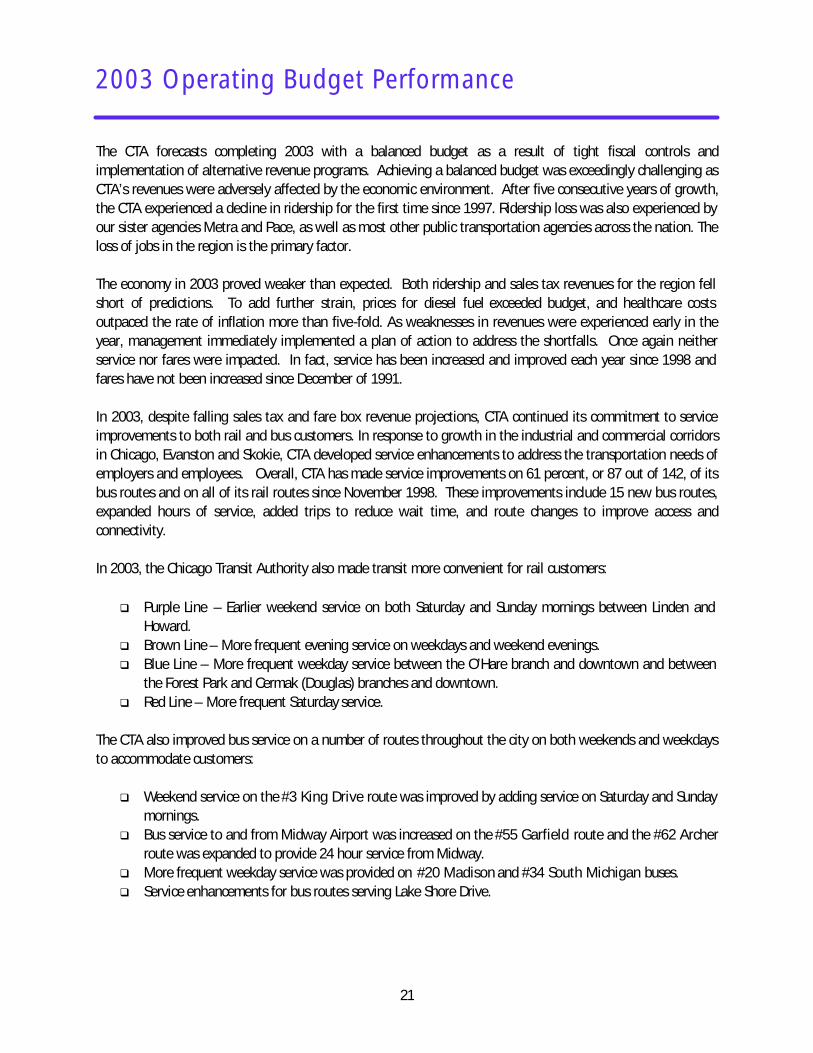
Bus ridership is forecasted at 295.7 million trips for 2003 and is 4.6 million trips or 1.5% lower than budget and 7.6 million trips or 2.5% lower than prior year. Rail ridership is projected at 150.8 million trips and is below budget by 4.1 million trips or 2.6%. Rail ridership is also lower than the prior year by 1.5 million trips or 1.0%. Paratransit ridership is expected to end the year at 1.8 million trips, 18.0% higher than 2003 budget and prior year actual. Operating Expenses The CTA will complete 2003 with expenditures lower than the prior year. The 2003 operating expenses are estimated at $893.7 million and compare favorably to the budget by $30.9 million or 3.3%. All expense categories are expected to finish the year under budget except for fuel and paratransit
expenses. The lower operating expenses are largely related to the belt tightening and fiscal controls implemented early in 2003 to ensure that CTA achieves a balanced budget by year-end. CTA’s operating expenses are forecasted at $26.0 million or 2.8% lower than the 2002 actual operating expenses in a year when inflation ran at 2.4%.
430,000
435,000
440,000
445,000
450,000
455,000
460,000
Ridership
Ridership 450,530 454,868 457,218 448,386
00 01 02 03
CTA Ridership(In 000's)
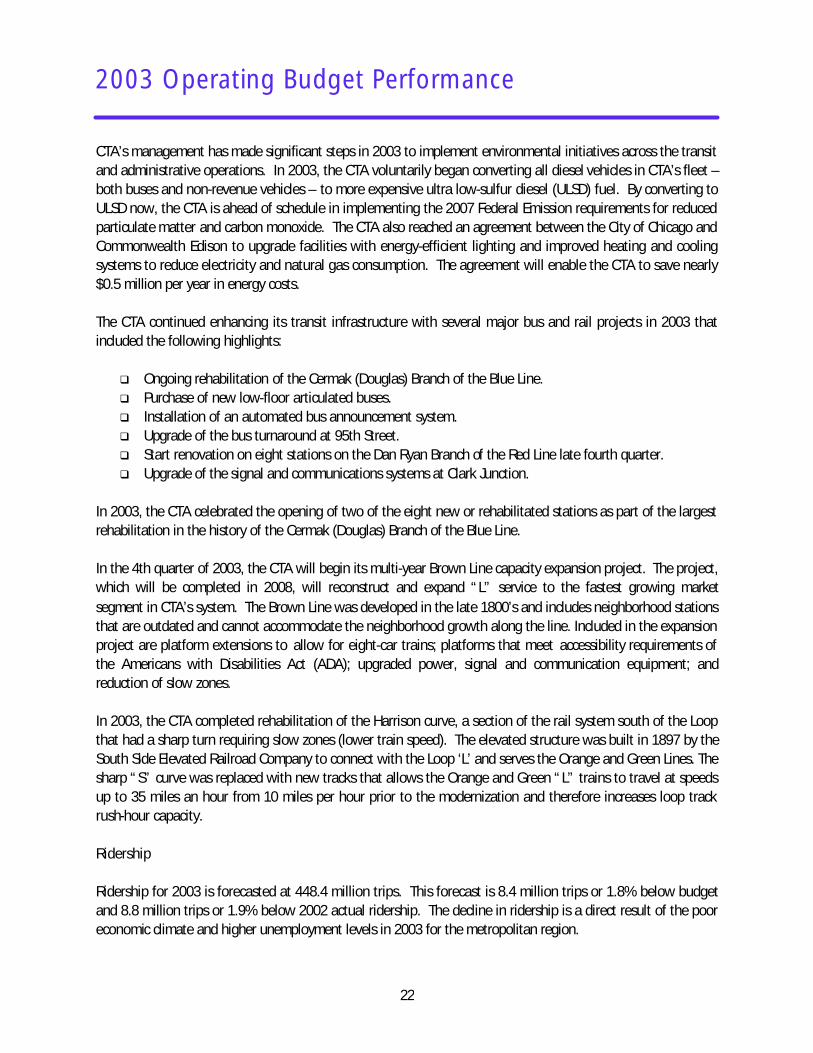
Labor73%
Material7%
Power2%
Fuel3%
Provision for Injuries & Damages
2%
Purchase of Paratransit
Services5%
Other Services5%
Security3%
CTA 2003 Operating Expenses, by Category
Labor expense is projected at $662.2 million and is $24.7 million or 3.6% below budget. Lower labor expenses were related to the tight day-to-day fiscal monitoring of expenses. Overtime was managed very tightly and vacancies that were not service related were not filled. This is evidenced by a comparison to 2002 actual financial results -- labor expense is $1.3 million lower. Additionally, more labor was charged to capital budgets due to the extraordinary amount of capital work underway requiring force labor. At this time, CTA has yet to finalize a labor
23
2003 Operating Budget Performance
24
contract agreement with the Bus Operators Amalgamated Transit Union Local 241. The arbitration process is underway and a decision is expected by the end of this year. This will be the main cost driver for 74% of CTA’s
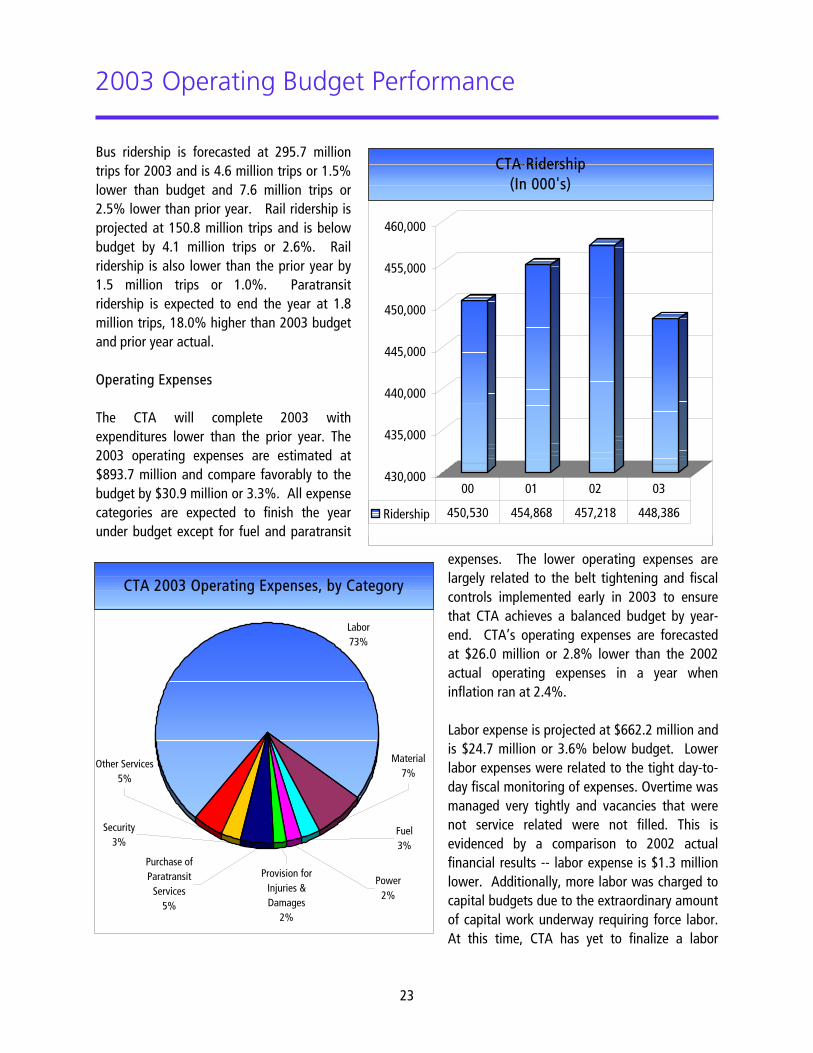
expenses in 2003 and beyond. Material expense is forecasted at $63.5 million, $4.0 million or 5.9% favorable to the budget. The reduction in material expense is associated with lower maintenance parts and components usage. This is related to the on-going modernization of the bus and rail vehicles, rehabilitation and preventative maintenance on the bus and rail fleets, and higher capitalization of vehicle components. Fuel expense for revenue equipment is expected to finish the year slightly below $24.0 million. This is $1.6 million or 7.2% higher than budget. The 2003 budget assumed an average price of $1.00 per gallon and consumption of 22.4 million gallons. Fuel prices and consumption have been above budget and are estimated to end the year at an average price of $1.09 per gallon and consumption of 23.0 million gallons. In addition to switching to ultra low-sulfur fuel to reduce emissions, higher fuel expenses were seen during 2003 due to the war in Iraq and an oil strike
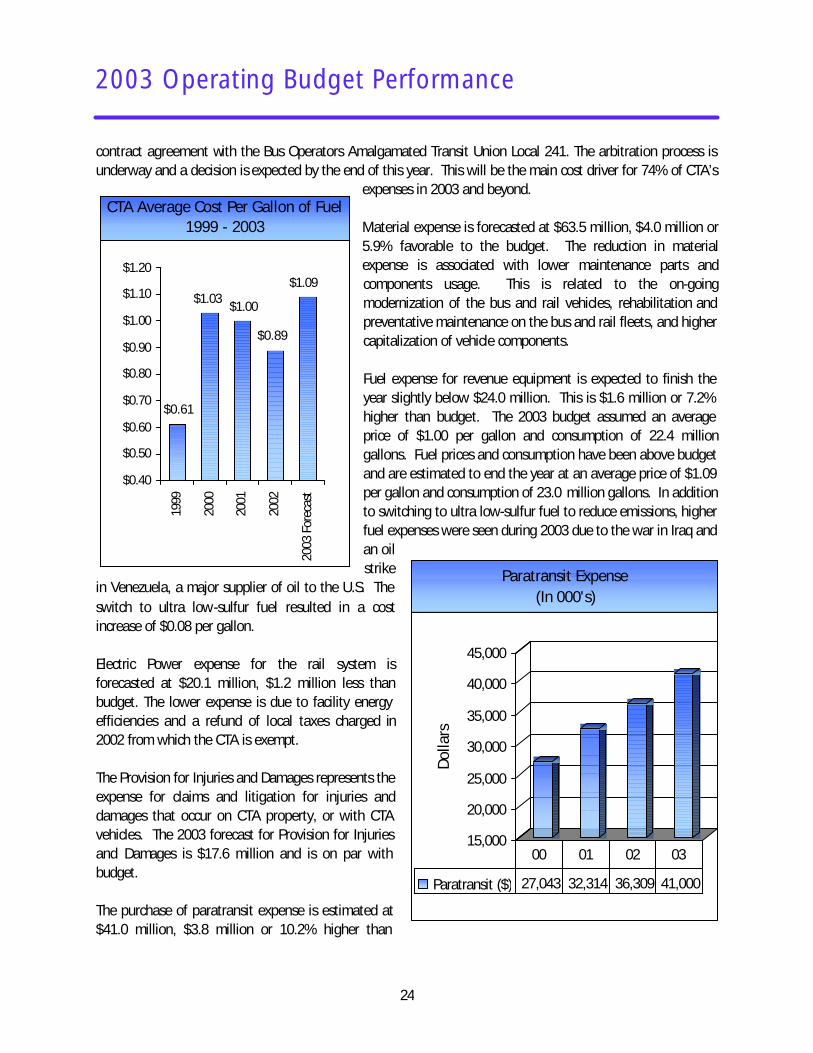
in Venezuela, a major supplier of oil to the U.S. The switch to ultra low-sulfur fuel resulted in a cost increase of $0.08 per gallon. Electric Power expense for the rail system is forecasted at $20.1 million, $1.2 million less than budget. The lower expense is due to facility energy efficiencies and a refund of local taxes charged in 2002 from which the CTA is exempt. The Provision for Injuries and Damages represents the expense for claims and litigation for injuries and damages that occur on CTA property, or with CTA vehicles. The 2003 forecast for Provision for Injuries and Damages is $17.6 million and is on par with budget. The purchase of paratransit expense is estimated at $41.0 million, $3.8 million or 10.2% higher than
15,000
20,000
25,000
30,000
35,000
40,000
45,000
Dol
lars
Paratransit ($)
Paratransit ($) 27,043 32,314 36,309 41,000
00 01 02 03
Paratransit Expense(In 000's)
$1.09
$0.89
$1.00$1.03
$0.61
$0.40
$0.50
$0.60
$0.70
$0.80
$0.90
$1.00
$1.10
$1.20
1999
2000
2001
2002
2003
For
ecas
t
CTA Average Cost Per Gallon of Fuel1999 - 2003
2003 Operating Budget Performance
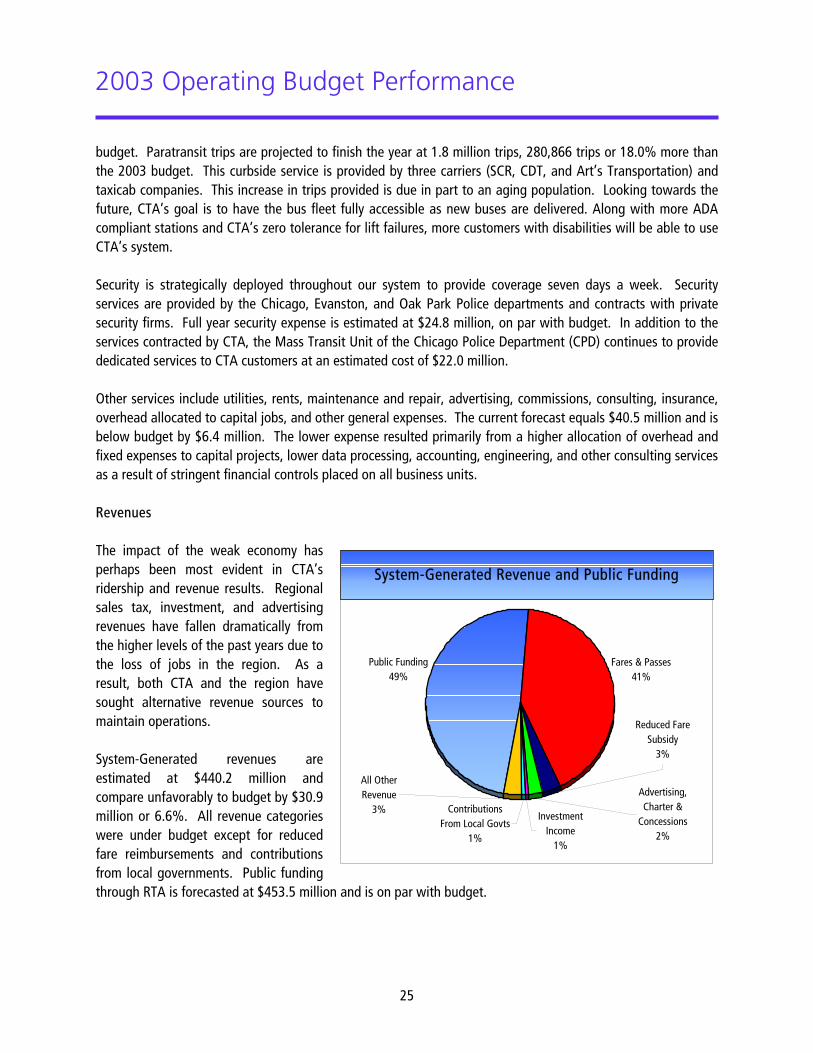
budget. Paratransit trips are projected to finish the year at 1.8 million trips, 280,866 trips or 18.0% more than the 2003 budget. This curbside service is provided by three carriers (SCR, CDT, and Art’s Transportation) and taxicab companies. This increase in trips provided is due in part to an aging population. Looking towards the future, CTA’s goal is to have the bus fleet fully accessible as new buses are delivered. Along with more ADA compliant stations and CTA’s zero tolerance for lift failures, more customers with disabilities will be able to use CTA’s system. Security is strategically deployed throughout our system to provide coverage seven days a week. Security services are provided by the Chicago, Evanston, and Oak Park Police departments and contracts with private security firms. Full year security expense is estimated at $24.8 million, on par with budget. In addition to the services contracted by CTA, the Mass Transit Unit of the Chicago Police Department (CPD) continues to provide dedicated services to CTA customers at an estimated cost of $22.0 million. Other services include utilities, rents, maintenance and repair, advertising, commissions, consulting, insurance, overhead allocated to capital jobs, and other general expenses. The current forecast equals $40.5 million and is below budget by $6.4 million. The lower expense resulted primarily from a higher allocation of overhead and fixed expenses to capital projects, lower data processing, accounting, engineering, and other consulting services as a result of stringent financial controls placed on all business units. Revenues The impact of the weak economy has perhaps been most evident in CTA’s ridership and revenue results. Regional sales tax, investment, and advertising revenues have fallen dramatically from the higher levels of the past years due to the loss of jobs in the region. As a result, both CTA and the region have sought alternative revenue sources to maintain operations. System-Generated revenues are estimated at $440.2 million and compare unfavorably to budget by $30.9 million or 6.6%. All revenue categories were under budget except for reduced fare reimbursements and contributions from local governments. Public funding through RTA is forecasted at $453.5 million and is on par with budget.
Public Funding49%
Fares & Passes41%
All Other Revenue
3%
Reduced Fare Subsidy
3%
Advertising, Charter &
Concessions2%
Contributions From Local Govts
1%
Investment Income
1%
System-Generated Revenue and Public Funding
25
2003 Operating Budget Performance
26
Revenues from fares are forecasted at $367.0 million and compare unfavorably to the budget by $9.1 million or 2.4%. The lower fare revenue is due to lower ridership and increased use of discounted fares and passes. The average fare for 2003 is estimated to be $0.818, which is 0.6% lower than budget. Even though CTA’s basic cash fare is $1.50, CTA’s average fare is only $0.82 – 45% less than the basic cash fare. This difference is due to customers utilizing discounted fare media products including daily, 7-Day and 30-Day pass media, as well as, the University Pass (U-Pass). Customers also take advantage of the transit and Chicago cards that provide various levels of bonus. The Reduced Fare reimbursement is the State of Illinois contribution to CTA for providing discounted fares to the disabled, elderly, and student customers. Reduced Fare Reimbursement is projected at $32.3 million and is on par with budget. Advertising, Charter, and Concessions revenues in 2003 are projected to be $22.0 million and is below budget by $2.6 million or 10.6%. This shortfall is due to the soft economy and lower investment by businesses in advertising. Investment Income is estimated at $2.4 million, $2.4 million or 50.3% lower than budget. This is due primarily to low interest rates. Interest rates are the lowest they have been in 40 years due to Federal Reserve Board rate cuts. Contributions from Local Governments of $5.0 million are on par with budget. The RTA Act requires the City of Chicago and County of Cook to contribute $3.0 million and $2.0 million, respectively, to the operations of CTA each year. Other revenues are projected at $11.5 million, $16.7 million below budget. The reduction in other revenue is due to lower lease transaction revenue and surplus property sales. CTA projects a balanced budget by the end of 2003 due to cost containment efforts. The RTA Act requires CTA to achieve a balanced budget each year. The Recovery Ratio, which measures the percentage of operating expenses CTA funds from revenues it generates, is estimated to be 51.32 percent and is below the required recovery ratio of 52.9 percent. The lower recovery ratio is due to the lower-than-budget revenues. The RTA Act requires the regional recovery ratio to equal 50%. Although the year unfolded with many financial challenges, CTA was able to quickly offset revenue shortfalls from cost controls that did not affect the service we deliver. We remain committed to providing high quality and high value service for our customers.
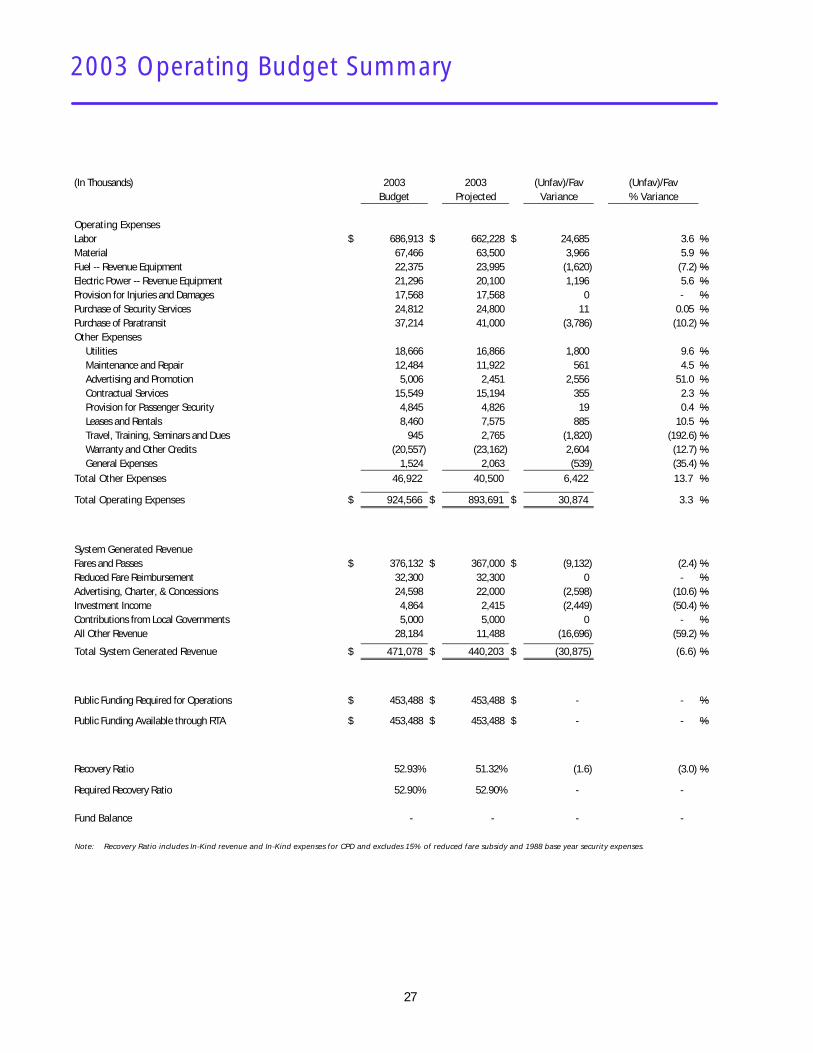
(In Thousands) 2003 2003 (Unfav)/Fav (Unfav)/FavBudget Projected Variance % Variance
Operating ExpensesLabor $ 686,913 $ 662,228 $ 24,685 3.6 %Material 67,466 63,500 3,966 5.9 %Fuel -- Revenue Equipment 22,375 23,995 (1,620) (7.2) %Electric Power -- Revenue Equipment 21,296 20,100 1,196 5.6 %Provision for Injuries and Damages 17,568 17,568 0 - %Purchase of Security Services 24,812 24,800 11 0.05 %Purchase of Paratransit 37,214 41,000 (3,786) (10.2) %Other Expenses
Utilities 18,666 16,866 1,800 9.6 %Maintenance and Repair 12,484 11,922 561 4.5 %Advertising and Promotion 5,006 2,451 2,556 51.0 %Contractual Services 15,549 15,194 355 2.3 %Provision for Passenger Security 4,845 4,826 19 0.4 %Leases and Rentals 8,460 7,575 885 10.5 %Travel, Training, Seminars and Dues 945 2,765 (1,820) (192.6) %Warranty and Other Credits (20,557) (23,162) 2,604 (12.7) %General Expenses 1,524 2,063 (539) (35.4) %
Total Other Expenses 46,922 40,500 6,422 13.7 %
Total Operating Expenses $ 924,566 $ 893,691 $ 30,874 3.3 %
System Generated RevenueFares and Passes $ 376,132 $ 367,000 $ (9,132) (2.4) %Reduced Fare Reimbursement 32,300 32,300 0 - %Advertising, Charter, & Concessions 24,598 22,000 (2,598) (10.6) %Investment Income 4,864 2,415 (2,449) (50.4) %Contributions from Local Governments 5,000 5,000 0 - %All Other Revenue 28,184 11,488 (16,696) (59.2) %
Total System Generated Revenue $ 471,078 $ 440,203 $ (30,875) (6.6) %
Public Funding Required for Operations $ 453,488 $ 453,488 $ - - %
Public Funding Available through RTA $ 453,488 $ 453,488 $ - - %
Recovery Ratio 52.93% 51.32% (1.6) (3.0) %
Required Recovery Ratio 52.90% 52.90% - -
Fund Balance - - - -
2003 Operating Budget Summary
Recovery Ratio includes In-Kind revenue and In-Kind expenses for CPD and excludes 15% of reduced fare subsidy and 1988 base year security expenses.Note:
27
2004 Operating Budget
InnovativeWe will seek out andencourage employees who initiate change,improvement, learning and advancement of our goals.
Chicago Transit Authority
2004 Operating Budget
In developing the 2004 budget, CTA faced difficult decisions. The last three years have been challenging for businesses and government agencies alike across the country. A weak economic environment and revenue shortfalls have increased the need to streamline operations, cause layoffs, enact price increases and supplement taxes. By streamlining operations and enhancing revenues, CTA was able to offset potential shortfalls without negatively impacting customers. For example, CTA’s 2003 revenues are forecasted at $30.9 million less than budget. To address this shortfall, hiring of non-service positions was carefully monitored, overtime was restricted, department spending was reduced, employees share of health insurance costs were increased and efficiencies were achieved to increase schedule efficiency. On the revenue side, CTA completed a bus lease transaction, sold surplus property and contracted with a local bank to share revenues from ATM machines installed at several CTA facilities. In 2002, CTA also completed a Qualified Technology Equipment (QTE) leveraged lease that generated $19.3 million, a bus lease transaction that generated $2.9 million, sold surplus property that generated over $5.0 million and entered into a five-year contract with an industry leader to implement a safety program expected to save $50.0 million over the next five years. In 2001, CTA sold surplus property that netted over $16.0 million and reengineered the design of parts that achieved cost savings of $3.0 million. In addition, the CTA started implementation of an Enterprise Resource Planning (ERP) system that will streamline operations and provide better business intelligence for timely decision-making. The State of Illinois restored $15.0 million of funding to the reduced fare reimbursement for seniors and customers with disabilities in 2000. Additionally, CTA entered into a transaction to swap investment securities used in a prior lease transaction that generated investment income of $4.3 million for the agency. The list of actions undertaken by CTA to reduce operating costs and increase non-fare revenues are numerous and have aided CTA in achieving balanced budgets while maintaining service and keeping fares constant. Since 1997, CTA cost reduction efforts have provided savings of $554.8 million. Sales of surplus property, innovative lease transactions and other miscellaneous transactions have provided the CTA a one-time revenue benefit of $185.0 million. Recently, the RTA issued CTA the funding marks for the next three years that was based upon the State of Illinois Office of Management and Budget’s projection of sales tax. Per statutory allocation, the RTA projects to provide CTA $441.6 million in 2004, 2005 and 2006. These funding marks are based on the statutory funding formula included in the RTA Act that provides a set percentage to allocate sales taxes collected in the City of Chicago, suburban Cook County, and the collar counties to the three service boards, plus the allocation of some discretionary funds. The funding mark for CTA is $11.9 million lower for each of the years than the amount of public funding provided to the CTA in 2003. In fact, public funding to the CTA has been rolled back to the 2002 level. The lower amount of public support will create a significant financial challenge for CTA.
28
2004 Operating Budget
Meanwhile costs continue to rise, along with inflation. Our rail operators’ top wage rate will increase to $23.01 by the end of 2003. At the same time, healthcare costs have soared during the last five years, rising over 73% and the price of fuel has also increased by over 77% since 1999. Furthermore, customer demand for paratransit service provided to our passengers with disabilities has increased significantly since 2000, increasing expenses by over 34% for this service. With rising wages, health care costs and fuel prices, combined with declining revenues, CTA is now confronted with difficult choices for balancing the operating budget in the face of the reduced public funding. CTA proposes to close the gap through position reductions, productivity improvements from new technologies, more flexible negotiated work rules, streamlined operations, health care management changes and a fare increase. These actions result in a balanced budget, with a modest 1.2% increase in operating expenses over the 2003 budget. This projected increase is below the consumer price index forecast for 2004. However, the decision to increase fares is a difficult one. CTA has not increased fares since December 1991, and in fact decreased fares in 1999 with a fare simplification program that reduced monthly pass prices and increased the discount on Transit Card purchases. Since 1991, Metra raised fares twice, some of which are for capital purposes, and Pace raised fares three times during this period. The price of a weekday edition of a major Chicago newspaper increased by 42.9% to $0.50 and a Chicago business periodical increased $1.00 or 33.3%. The price of a postage stamp has increased three times since 1995 for a total increase of 15.6%. There are very few businesses or governments that have not increased prices or fees during the past 12 years. The region’s economy has been weakened by a steady loss of its manufacturing base, resulting in the highest unemployment rates in a decade. For the region, unemployment has remained high, with an average rate of 7.9% for the first half of 2003, a slight improvement from 8.1% unemployment in 2002, yet far above the low rates of 6.9% for 2001 and 5.6% for 2000. The economic recovery of the region remains hopeful but the timing is uncertain. In a speech on July 28, 2003, the President and CEO of the Federal Reserve Bank of Chicago, Michael H. Moskow, stated: “Output is rising, but it does not feel like an expanding economy for many people because of a stagnant job market. Solid productivity trends, fiscal stimulus, and low interest rates have laid the groundwork for stronger growth. But corporate governance issues and geopolitical events have left many business managers with a diminished appetite for risk.” 2004 Performance Goals A healthy public transportation system is an integral part of a growing, thriving Chicago region that helps improve the quality of life of residents, attracts businesses and tourists. Each year, CTA provides over 450 million trips to and from work, school, the region’s two main airports, recreational and sporting events, as well as to shopping centers and cultural institutions. In response to growth throughout the region, CTA has expanded service to the north and south side neighborhoods with lakefront bus service improvements, to the
29
2004 Operating Budget
southwest side with the renovated Cermak (Douglas) Branch of the Blue Line to the neighborhoods, to the north side of Chicago and 40 surrounding suburbs with north lakefront service improvements. In 2004, CTA customers will continue to see new, modernized stations that reflect the unique neighborhoods they serve, such as the Sox 35th station on the Red Line, and will continue to benefit from service expansion and innovation through pursuit of the following agency goals:
o Continued bus route improvements and pilot programs on growing service routes. o Improved automated scheduling and management system for Paratransit customers. o Expanded and more frequent rail service during mid-day and evening weekday service and weekend
service. o Delivery of new articulated low-floor, air-conditioned buses from North American Bus Industries, Inc.
(NABI). o Start rehabilitation of Red Line and Brown Line stations.
In 2004, CTA plans to introduce additional express bus routes similar to bus routes #X80 Irving Park Express and #X55 Garfield Express. These services, which operate with fewer stops than the local service, have increased customer satisfaction and ridership in the corridors where they have been introduced. CTA hopes to continue that trend in 2004, with two new express routes. Also in 2004, CTA will continue its evaluation of service in the west side neighborhoods, and could recommend service adjustments based on the results of that evaluation. Downtown circulation and rail system service levels will also be evaluated and adjusted as needed in 2004. CTA Environmental Initiatives Based on a unique funding agreement with the City of Chicago and Commonwealth Edison, CTA will make investments to upgrade its facilities with energy-efficient lighting and improved heating and cooling systems to reduce electricity and natural gas consumption. The agreement will enable CTA to save nearly $0.5 million per year in energy expenses when fully implemented, while improving the Authority’s facilities and the environment. In 2004, CTA will continue to incorporate green technologies into bus purchases and maintenance programs that meet higher environmental standards. With grant funding from the City of Chicago, the CTA will begin a comprehensive overhaul of its 5800 series of New Flyer buses purchased in 1995 with an Exhaust Gas Recirculation (EGR) system. EGR equipped engines take a part of the exhaust gases and burn them, reducing emissions. The result is an improvement to CTA’s environmentally friendly bus fleet that by 2004 will have reduced emissions by 23 percent from 1997 levels. Although by its nature, public transit is environmentally friendly, the addition of EGR equipped engines and particulate filters on CTA’s New Flyer buses builds on these inherent benefits by lowering emissions by 30 tons per year, thereby improving customer satisfaction and environmental consciousness.
30
2004 Operating Budget
CTA Technology Initiatives In 2004, the CTA will continue to invest in technology to improve service to its customers. One of these technology improvements is the Chicago Card Plus. Chicago Card Plus offers a cash-free way to pay for fares through web-enabled credit card payments or direct payments through employer transit benefit programs. Similar to the CTA’s current smart card, Chicago Card, the Chicago Card Plus is a fare media that will provide customer security if the card is lost or stolen. Finally, in 2004, the CTA will fully implement the Enterprise Resource (ERP) system and continue implementation of the maintenance management information system, a result of a multi-year upgrade that will improve the tracking of financial, purchasing and resource data. The new system will help contain unnecessary costs through better data management. Implementation of a new time and attendance system will aid in controlling and reducing overtime and lost time costs thereby improving productivity and holding down labor costs. CTA Capital Improvements In 2003, customers saw improved integration and transferability to ‘L’ lines through the completion of a transfer tunnel between the State/Roosevelt Red Line subway with the Green/Orange Line elevated station, providing greater access to the CTA system at this busy and growing area of the Chicago Loop. In 2004, CTA will begin renovation of eight stations on the Dan Ryan Branch of the Red Line, CTA’s highest volume ‘L’ line in the rail system. New, higher capacity power substations will also be added to the 95th branch to support the added service on a line that is now 30 years old. The CTA’s largest current construction project, the Cermak (Douglas) Branch reconstruction of the Blue Line, expects to be on schedule and on budget without disruption to service. When completed in 2005, it will have new platforms, ADA compliant stations, upgraded tracks with no slow zones and state of the art signal and communication systems. 2004 Ridership The CTA forecasts providing 452.6 million trips in 2004, an increase of 1.0% over 2003 forecasted levels. The unemployment rates in the region have thwarted the ridership growth over the past year. The region’s unemployment level peaked at 8.6% in the summer of 2002, and has fluctuated within a few tenths of a percentage point in the following 15 months. As of June 2003, the unemployment level was 8.1%. However, bus ridership in 2004 is projected to be 298.1 million total trips, an increase of 0.8% over 2003 forecasted levels of 295.7 million trips. Rail ridership is projected to be 152.6 million rides in 2004, an increase of 1.8 million trips or 1.2% over the 2003 forecast. CTA forecasts providing 1.9 million paratransit trips in 2004, an increase of 5% over 2003 forecasted levels. Paratransit ridership is expected to grow at a slower pace as more riders are transitioned to the mainline service. For 2004, the CTA projects providing 1,465,122 Special Service trips and 466,144 Taxi Access Program (TAP) trips, a growth rate of 5%.
31
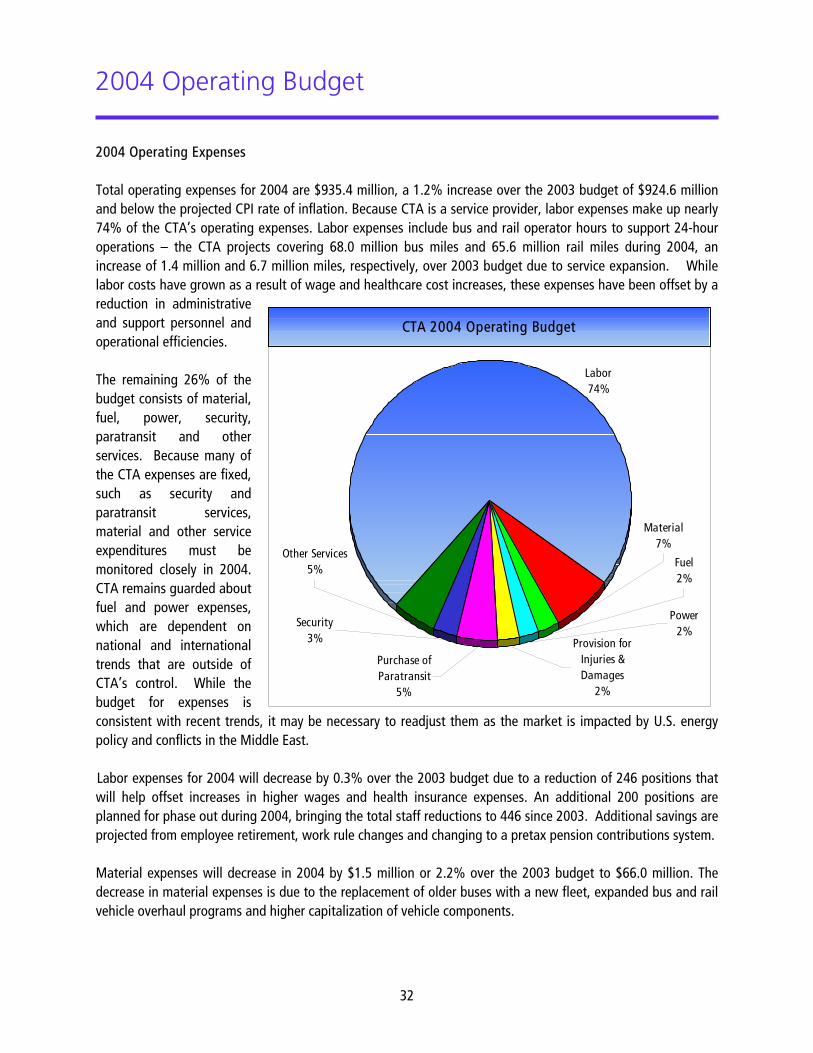
2004 Operating Budget
2004 Operating Expenses Total operating expenses for 2004 are $935.4 million, a 1.2% increase over the 2003 budget of $924.6 million and below the projected CPI rate of inflation. Because CTA is a service provider, labor expenses make up nearly 74% of the CTA’s operating expenses. Labor expenses include bus and rail operator hours to support 24-hour operations – the CTA projects covering 68.0 million bus miles and 65.6 million rail miles during 2004, an increase of 1.4 million and 6.7 million miles, respectively, over 2003 budget due to service expansion. While labor costs have grown as a result of wage and healthcare cost increases, these expenses have been offset by a reduction in administrative and support personnel and operational efficiencies. The remaining 26% of the budget consists of material, fuel, power, security, paratransit and other services. Because many of the CTA expenses are fixed, such as security and paratransit services, material and other service expenditures must be monitored closely in 2004. CTA remains guarded about fuel and power expenses, which are dependent on national and international trends that are outside of CTA’s control. While the budget for expenses is consistent with recent trends, it may be necessary to readjust them as the market is impacted by U.S. energy policy and conflicts in the Middle East.
Power2%
Fuel2%
Purchase of Paratransit
5%
Security3%
Other Services5%
Provision for Injuries & Damages
2%
Material7%
Labor74%
CTA 2004 Operating Budget
Labor expenses for 2004 will decrease by 0.3% over the 2003 budget due to a reduction of 246 positions that will help offset increases in higher wages and health insurance expenses. An additional 200 positions are planned for phase out during 2004, bringing the total staff reductions to 446 since 2003. Additional savings are projected from employee retirement, work rule changes and changing to a pretax pension contributions system. Material expenses will decrease in 2004 by $1.5 million or 2.2% over the 2003 budget to $66.0 million. The decrease in material expenses is due to the replacement of older buses with a new fleet, expanded bus and rail vehicle overhaul programs and higher capitalization of vehicle components.
32
2004 Operating Budget
Fuel for revenue equipment for 2004 is budgeted at $23.0 million, an increase of $0.6 million from $22.4 million in the 2003 budget. The budgeted rate per gallon is $1.08 for 2004. In 2003, CTA switched to Ultra Low Sulfur Diesel (ULSD) fuel increasing the per gallon costs by $0.08. The incremental cost of $0.08 per gallon will be funded by a CMAQ grant that will be fully utilized by the end of 2004. Fuel consumption in 2004 is also higher than the 2003 budget by 625,000 gallons due to expanded bus service and new bus routes throughout the service area. Electric power for revenue equipment covers the electricity to power the ‘L’ system. The 2004 budgeted level for power is $22.0 million, which is $0.7 million or 3.3% higher than the 2003 budget of $21.3 million. The increase is due to a refund received in 2003 for taxes charged to CTA in error in prior years that CTA and other municipal governments are exempt from paying. During the year, CTA will benefit from improved energy efficiency initiatives undertaken in partnership with the City of Chicago. Provision for Injuries and Damages is expected to increase to $22.0 million in 2004 or 25.2% from $17.6 million in 2003. Purchase of Security Services is budgeted at $25.0 million for 2004, an increase of $0.2 million from the 2003 budget due to contract increases for the privatized security companies utilized by the CTA. The CTA will continue to utilize the services of Chicago, Evanston and Oak Park police officers in providing security to CTA customers. Purchase of Paratransit Services is budgeted at $45.1 million in 2004; a $7.9 million or 21.2% increase over the 2003 budget. This increase reflects the combination of growth in demand of paratransit services and vendor rate increases. The CTA provides two types of paratransit services, Special Services and the Taxi Access Program (TAP). Each Special Service trip costs the CTA on average $26.51 while the TAP program costs the CTA an average of $13.53 per trip. Other expenses are budgeted at $47.2 million for 2004 and are $0.3 million more than the 2003 budget due to higher advertisement and contractual costs associated with the Chicago Plus Card. In November of 2004, CTA will move out of its headquarters at the Merchandise Mart and consolidate its administrative offices into one location generating an annual reduction in operating lease expenses over the life on a comparable lease alternative. Revenues CTA collects revenue from two main sources, system-generated revenues (fares and passes, advertising income, etc.) and public funding generated primarily from sales tax revenues and public transportation funds (state match on sales tax) that is provided through the Regional Transit Authority (RTA), the oversight agency for Metra, Pace and CTA.
33
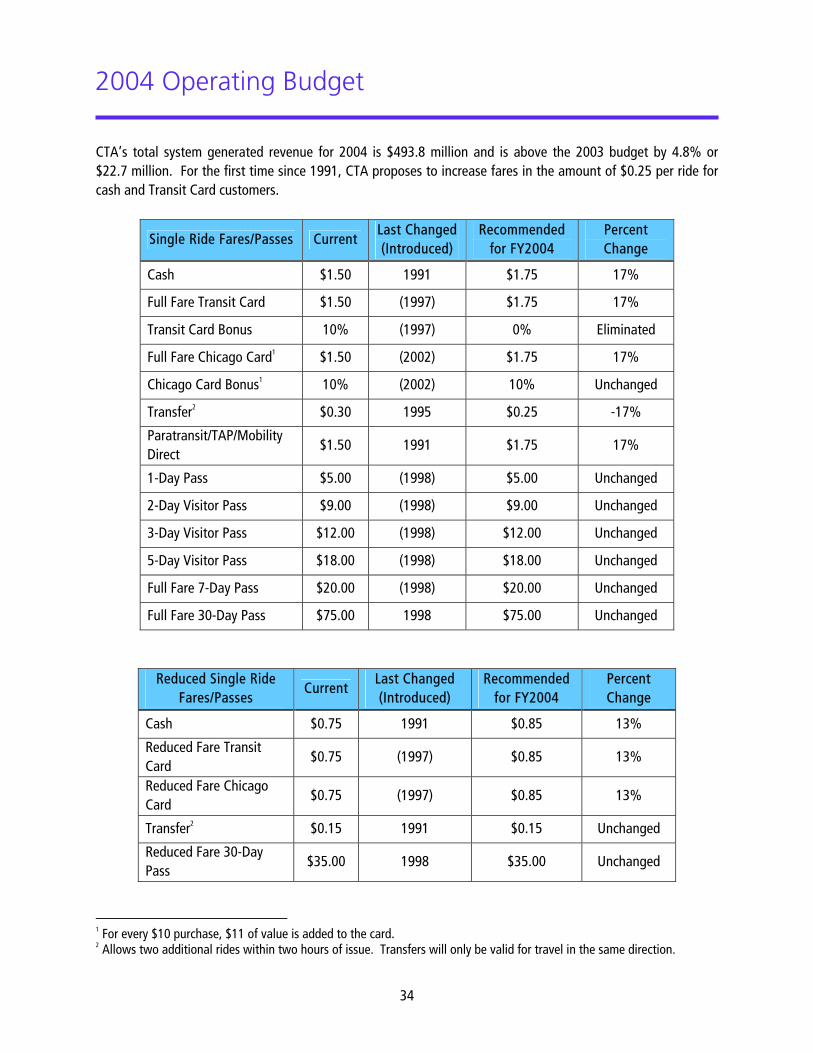
2004 Operating Budget
CTA’s total system generated revenue for 2004 is $493.8 million and is above the 2003 budget by 4.8% or $22.7 million. For the first time since 1991, CTA proposes to increase fares in the amount of $0.25 per ride for cash and Transit Card customers.
Single Ride Fares/Passes Current Last Changed (Introduced)
Recommended for FY2004
Percent Change
Cash $1.50 1991 $1.75 17%
Full Fare Transit Card $1.50 (1997) $1.75 17%
Transit Card Bonus 10% (1997) 0% Eliminated
Full Fare Chicago Card1 $1.50 (2002) $1.75 17%
Chicago Card Bonus1 10% (2002) 10% Unchanged
Transfer2 $0.30 1995 $0.25 -17%
Paratransit/TAP/Mobility Direct
$1.50 1991 $1.75 17%
1-Day Pass $5.00 (1998) $5.00 Unchanged
2-Day Visitor Pass $9.00 (1998) $9.00 Unchanged
3-Day Visitor Pass $12.00 (1998) $12.00 Unchanged
5-Day Visitor Pass $18.00 (1998) $18.00 Unchanged
Full Fare 7-Day Pass $20.00 (1998) $20.00 Unchanged
Full Fare 30-Day Pass $75.00 1998 $75.00 Unchanged
Reduced Single Ride Fares/Passes
Current Last Changed (Introduced)
Recommended for FY2004
Percent Change
Cash $0.75 1991 $0.85 13%
Reduced Fare Transit Card
$0.75 (1997) $0.85 13%
Reduced Fare Chicago Card
$0.75 (1997) $0.85 13%
Transfer2 $0.15 1991 $0.15 Unchanged
Reduced Fare 30-Day Pass
$35.00 1998 $35.00 Unchanged
1 For every $10 purchase, $11 of value is added to the card. 2 Allows two additional rides within two hours of issue. Transfers will only be valid for travel in the same direction.
34
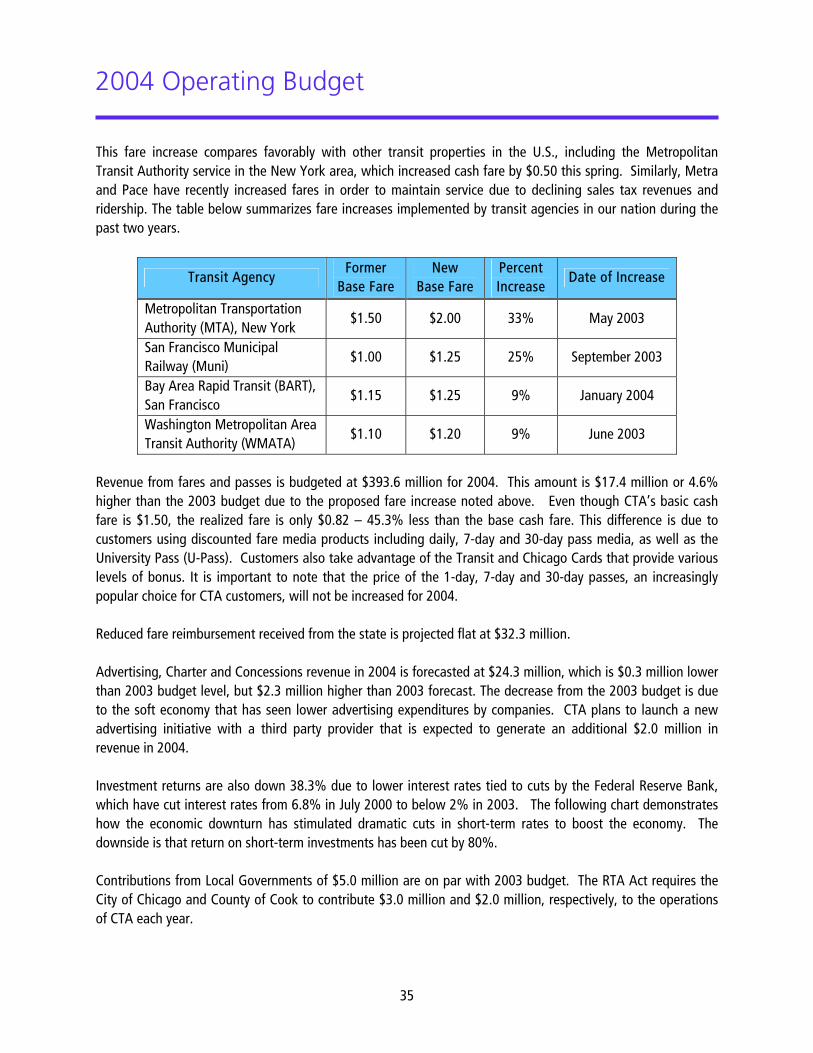
2004 Operating Budget
This fare increase compares favorably with other transit properties in the U.S., including the Metropolitan Transit Authority service in the New York area, which increased cash fare by $0.50 this spring. Similarly, Metra and Pace have recently increased fares in order to maintain service due to declining sales tax revenues and ridership. The table below summarizes fare increases implemented by transit agencies in our nation during the past two years.
Transit Agency Former
Base Fare New
Base Fare Percent Increase
Date of Increase
Metropolitan Transportation Authority (MTA), New York
$1.50 $2.00 33% May 2003
San Francisco Municipal Railway (Muni)
$1.00 $1.25 25% September 2003
Bay Area Rapid Transit (BART), San Francisco
$1.15 $1.25 9% January 2004
Washington Metropolitan Area Transit Authority (WMATA)
$1.10 $1.20 9% June 2003
Revenue from fares and passes is budgeted at $393.6 million for 2004. This amount is $17.4 million or 4.6% higher than the 2003 budget due to the proposed fare increase noted above. Even though CTA’s basic cash fare is $1.50, the realized fare is only $0.82 – 45.3% less than the base cash fare. This difference is due to customers using discounted fare media products including daily, 7-day and 30-day pass media, as well as the University Pass (U-Pass). Customers also take advantage of the Transit and Chicago Cards that provide various levels of bonus. It is important to note that the price of the 1-day, 7-day and 30-day passes, an increasingly popular choice for CTA customers, will not be increased for 2004. Reduced fare reimbursement received from the state is projected flat at $32.3 million. Advertising, Charter and Concessions revenue in 2004 is forecasted at $24.3 million, which is $0.3 million lower than 2003 budget level, but $2.3 million higher than 2003 forecast. The decrease from the 2003 budget is due to the soft economy that has seen lower advertising expenditures by companies. CTA plans to launch a new advertising initiative with a third party provider that is expected to generate an additional $2.0 million in revenue in 2004. Investment returns are also down 38.3% due to lower interest rates tied to cuts by the Federal Reserve Bank, which have cut interest rates from 6.8% in July 2000 to below 2% in 2003. The following chart demonstrates how the economic downturn has stimulated dramatic cuts in short-term rates to boost the economy. The downside is that return on short-term investments has been cut by 80%. Contributions from Local Governments of $5.0 million are on par with 2003 budget. The RTA Act requires the City of Chicago and County of Cook to contribute $3.0 million and $2.0 million, respectively, to the operations of CTA each year.
35
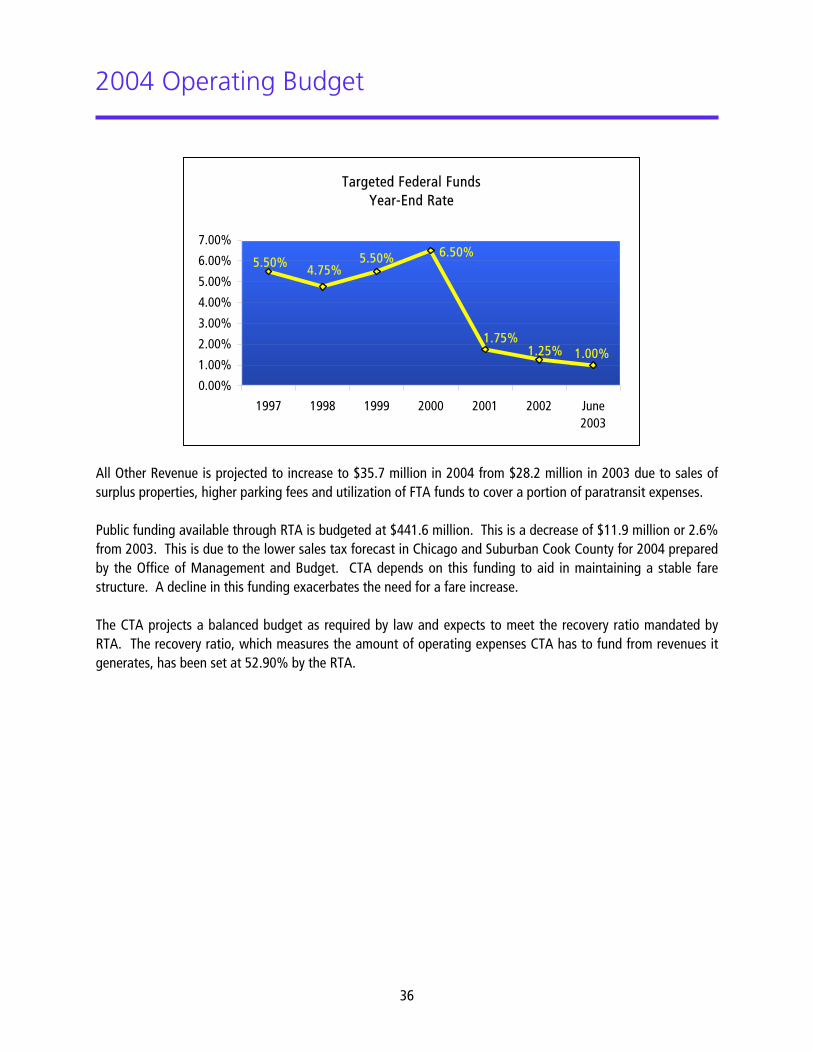
2004 Operating Budget
36
Targeted Federal Funds Year-End Rate
5.50%
1.25% 1.00%
4.75%5.50%
1.75%
6.50%
0.00%
1.00%
2.00%
3.00%
4.00%
5.00%
6.00%
7.00%
1997 1998 1999 2000 2001 2002 June2003
All Other Revenue is projected to increase to $35.7 million in 2004 from $28.2 million in 2003 due to sales of surplus properties, higher parking fees and utilization of FTA funds to cover a portion of paratransit expenses. Public funding available through RTA is budgeted at $441.6 million. This is a decrease of $11.9 million or 2.6% from 2003. This is due to the lower sales tax forecast in Chicago and Suburban Cook County for 2004 prepared by the Office of Management and Budget. CTA depends on this funding to aid in maintaining a stable fare structure. A decline in this funding exacerbates the need for a fare increase. The CTA projects a balanced budget as required by law and expects to meet the recovery ratio mandated by RTA. The recovery ratio, which measures the amount of operating expenses CTA has to fund from revenues it generates, has been set at 52.90% by the RTA.
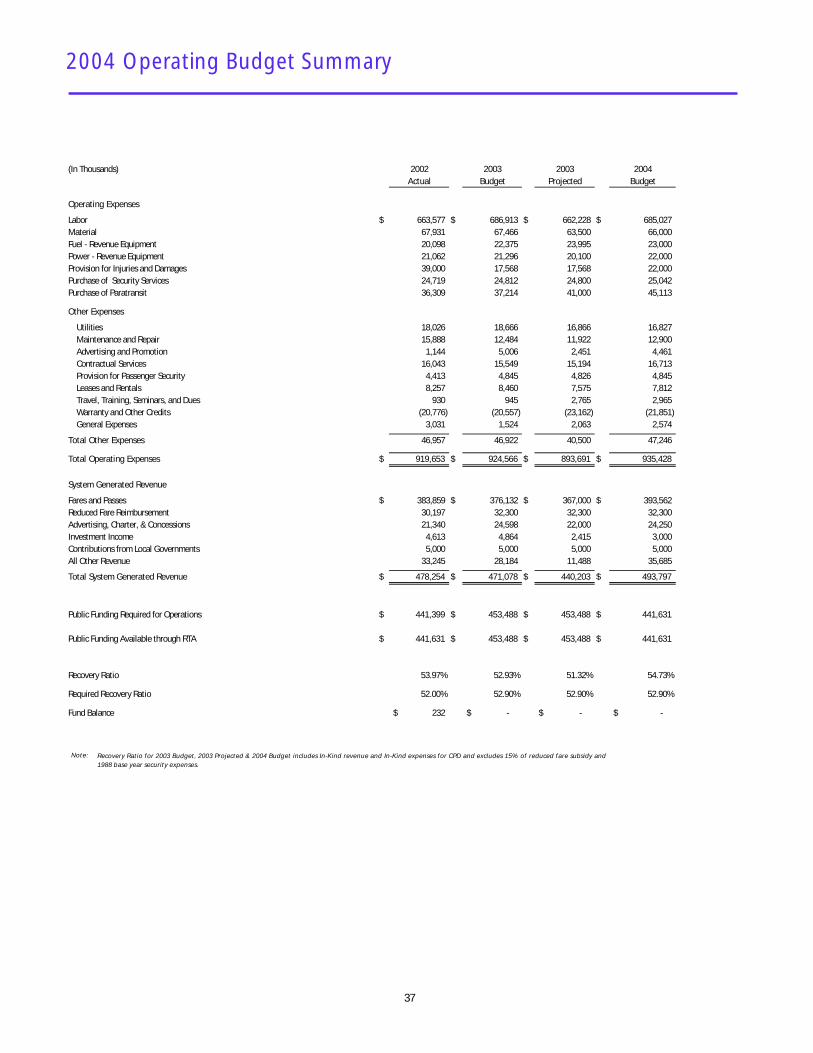
(In Thousands) 2002 2003 2003 2004Actual Budget Projected Budget
3 4 5 6Operating Expenses
Labor $ 663,577 $ 686,913 $ 662,228 $ 685,027 Material 67,931 67,466 63,500 66,000 Fuel - Revenue Equipment 20,098 22,375 23,995 23,000 Power - Revenue Equipment 21,062 21,296 20,100 22,000 Provision for Injuries and Damages 39,000 17,568 17,568 22,000 Purchase of Security Services 24,719 24,812 24,800 25,042 Purchase of Paratransit 36,309 37,214 41,000 45,113
Other Expenses
Utilities 18,026 18,666 16,866 16,827 Maintenance and Repair 15,888 12,484 11,922 12,900 Advertising and Promotion 1,144 5,006 2,451 4,461 Contractual Services 16,043 15,549 15,194 16,713 Provision for Passenger Security 4,413 4,845 4,826 4,845 Leases and Rentals 8,257 8,460 7,575 7,812 Travel, Training, Seminars, and Dues 930 945 2,765 2,965 Warranty and Other Credits (20,776) (20,557) (23,162) (21,851) General Expenses 3,031 1,524 2,063 2,574
Total Other Expenses 46,957 46,922 40,500 47,246
Total Operating Expenses $ 919,653 $ 924,566 $ 893,691 $ 935,428
System Generated Revenue
Fares and Passes $ 383,859 $ 376,132 $ 367,000 $ 393,562 Reduced Fare Reimbursement 30,197 32,300 32,300 32,300 Advertising, Charter, & Concessions 21,340 24,598 22,000 24,250 Investment Income 4,613 4,864 2,415 3,000 Contributions from Local Governments 5,000 5,000 5,000 5,000 All Other Revenue 33,245 28,184 11,488 35,685
Total System Generated Revenue $ 478,254 $ 471,078 $ 440,203 $ 493,797
Public Funding Required for Operations $ 441,399 $ 453,488 $ 453,488 $ 441,631
Public Funding Available through RTA $ 441,631 $ 453,488 $ 453,488 $ 441,631
Recovery Ratio 53.97% 52.93% 51.32% 54.73%
Required Recovery Ratio 52.00% 52.90% 52.90% 52.90%
Fund Balance 232$ -$ -$ -$
2004 Operating Budget Summary
Note: Recovery Ratio for 2003 Budget, 2003 Projected & 2004 Budget includes In-Kind revenue and In-Kind expenses for CPD and excludes 15% of reduced fare subsidy and1988 base year security expenses.
37
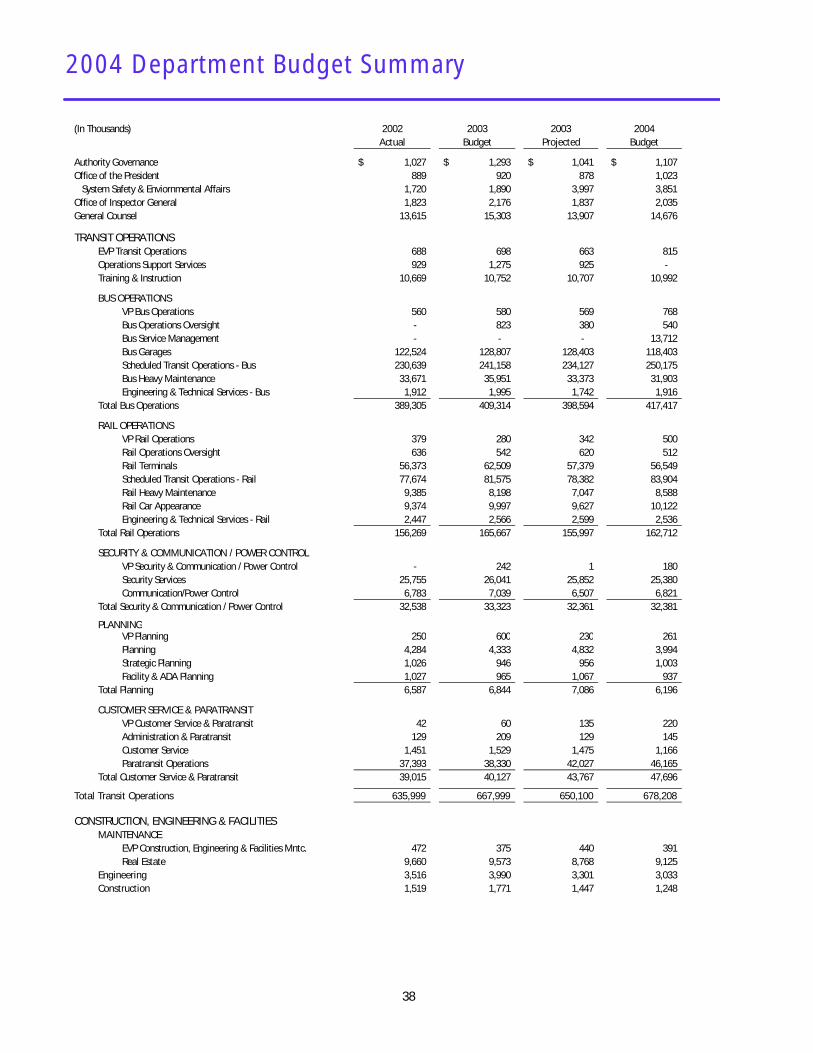
(In Thousands) 2002 2003 2003 2004Actual Budget Projected Budget
3 5 7 9Authority Governance 1,027$ 1,293$ 1,041$ 1,107$ Office of the President 889 920 878 1,023
System Safety & Enviornmental Affairs 1,720 1,890 3,997 3,851 Office of Inspector General 1,823 2,176 1,837 2,035 General Counsel 13,615 15,303 13,907 14,676
TRANSIT OPERATIONSEVP Transit Operations 688 698 663 815 Operations Support Services 929 1,275 925 - Training & Instruction 10,669 10,752 10,707 10,992
BUS OPERATIONSVP Bus Operations 560 580 569 768 Bus Operations Oversight - 823 380 540 Bus Service Management - - - 13,712 Bus Garages 122,524 128,807 128,403 118,403 Scheduled Transit Operations - Bus 230,639 241,158 234,127 250,175 Bus Heavy Maintenance 33,671 35,951 33,373 31,903 Engineering & Technical Services - Bus 1,912 1,995 1,742 1,916
Total Bus Operations 389,305 409,314 398,594 417,417
RAIL OPERATIONSVP Rail Operations 379 280 342 500 Rail Operations Oversight 636 542 620 512 Rail Terminals 56,373 62,509 57,379 56,549 Scheduled Transit Operations - Rail 77,674 81,575 78,382 83,904 Rail Heavy Maintenance 9,385 8,198 7,047 8,588 Rail Car Appearance 9,374 9,997 9,627 10,122 Engineering & Technical Services - Rail 2,447 2,566 2,599 2,536
Total Rail Operations 156,269 165,667 155,997 162,712
SECURITY & COMMUNICATION / POWER CONTROLVP Security & Communication / Power Control - 242 1 180 Security Services 25,755 26,041 25,852 25,380 Communication/Power Control 6,783 7,039 6,507 6,821
Total Security & Communication / Power Control 32,538 33,323 32,361 32,381
PLANNINGVP Planning 250 600 230 261 Planning 4,284 4,333 4,832 3,994 Strategic Planning 1,026 946 956 1,003 Facility & ADA Planning 1,027 965 1,067 937
Total Planning 6,587 6,844 7,086 6,196
CUSTOMER SERVICE & PARATRANSITVP Customer Service & Paratransit 42 60 135 220 Administration & Paratransit 129 209 129 145 Customer Service 1,451 1,529 1,475 1,166 Paratransit Operations 37,393 38,330 42,027 46,165
Total Customer Service & Paratransit 39,015 40,127 43,767 47,696
Total Transit Operations 635,999 667,999 650,100 678,208
CONSTRUCTION, ENGINEERING & FACILITIESMAINTENANCE
EVP Construction, Engineering & Facilities Mntc. 472 375 440 391 Real Estate 9,660 9,573 8,768 9,125
Engineering 3,516 3,990 3,301 3,033 Construction 1,519 1,771 1,447 1,248
2004 Department Budget Summary
38
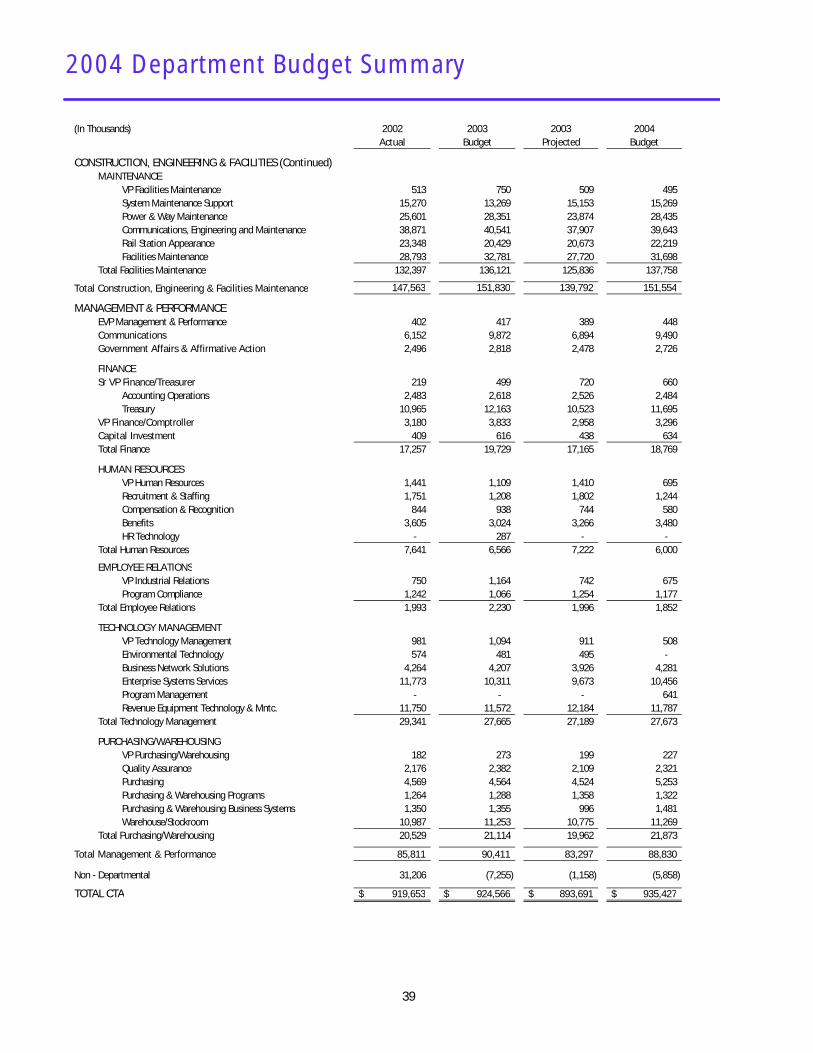
(In Thousands) 2002 2003 2003 2004Actual Budget Projected Budget
3 5 7 9
2004 Department Budget Summary
CONSTRUCTION, ENGINEERING & FACILITIES (Continued)MAINTENANCE
VP Facilities Maintenance 513 750 509 495 System Maintenance Support 15,270 13,269 15,153 15,269 Power & Way Maintenance 25,601 28,351 23,874 28,435 Communications, Engineering and Maintenance 38,871 40,541 37,907 39,643 Rail Station Appearance 23,348 20,429 20,673 22,219 Facilities Maintenance 28,793 32,781 27,720 31,698
Total Facilities Maintenance 132,397 136,121 125,836 137,758
147,563 151,830 139,792 151,554
MANAGEMENT & PERFORMANCEEVP Management & Performance 402 417 389 448 Communications 6,152 9,872 6,894 9,490 Government Affairs & Affirmative Action 2,496 2,818 2,478 2,726
FINANCESr VP Finance/Treasurer 219 499 720 660
Accounting Operations 2,483 2,618 2,526 2,484 Treasury 10,965 12,163 10,523 11,695
VP Finance/Comptroller 3,180 3,833 2,958 3,296 Capital Investment 409 616 438 634 Total Finance 17,257 19,729 17,165 18,769
HUMAN RESOURCESVP Human Resources 1,441 1,109 1,410 695 Recruitment & Staffing 1,751 1,208 1,802 1,244 Compensation & Recognition 844 938 744 580 Benefits 3,605 3,024 3,266 3,480 HR Technology - 287 - -
Total Human Resources 7,641 6,566 7,222 6,000
EMPLOYEE RELATIONSVP Industrial Relations 750 1,164 742 675 Program Compliance 1,242 1,066 1,254 1,177
Total Employee Relations 1,993 2,230 1,996 1,852
TECHNOLOGY MANAGEMENTVP Technology Management 981 1,094 911 508 Environmental Technology 574 481 495 - Business Network Solutions 4,264 4,207 3,926 4,281 Enterprise Systems Services 11,773 10,311 9,673 10,456 Program Management - - - 641 Revenue Equipment Technology & Mntc. 11,750 11,572 12,184 11,787
Total Technology Management 29,341 27,665 27,189 27,673
PURCHASING/WAREHOUSINGVP Purchasing/Warehousing 182 273 199 227 Quality Assurance 2,176 2,382 2,109 2,321 Purchasing 4,569 4,564 4,524 5,253 Purchasing & Warehousing Programs 1,264 1,288 1,358 1,322 Purchasing & Warehousing Business Systems 1,350 1,355 996 1,481 Warehouse/Stockroom 10,987 11,253 10,775 11,269
Total Purchasing/Warehousing 20,529 21,114 19,962 21,873
Total Management & Performance 85,811 90,411 83,297 88,830
Non - Departmental 31,206 (7,255) (1,158) (5,858)
TOTAL CTA 919,653$ 924,566$ 893,691$ 935,427$
Total Construction, Engineering & Facilities Maintenance
39
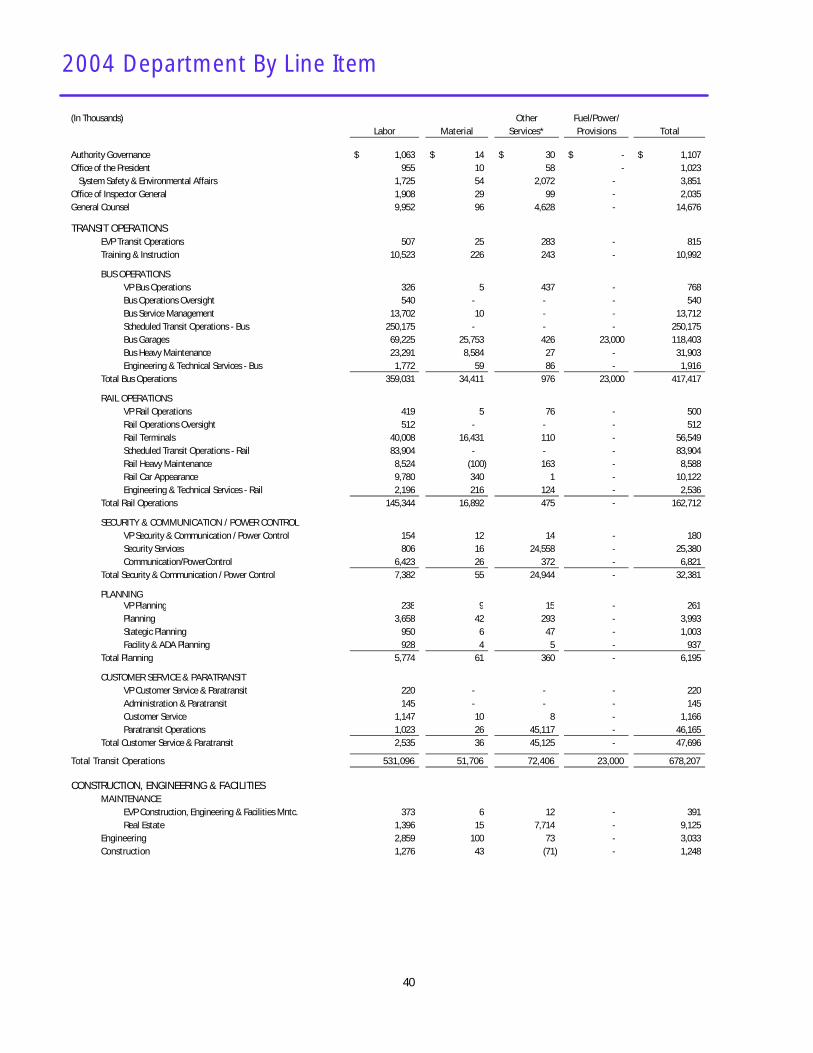
2004 Department By Line Item
(In Thousands) Other Fuel/Power/Labor Material Services* Provisions Total
3 4 5 Authority Governance 1,063$ 14$ 30$ -$ 1,107$ Office of the President 955 10 58 - 1,023
System Safety & Environmental Affairs 1,725 54 2,072 - 3,851 Office of Inspector General 1,908 29 99 - 2,035 General Counsel 9,952 96 4,628 - 14,676
TRANSIT OPERATIONSEVP Transit Operations 507 25 283 - 815 Training & Instruction 10,523 226 243 - 10,992
BUS OPERATIONSVP Bus Operations 326 5 437 - 768 Bus Operations Oversight 540 - - - 540 Bus Service Management 13,702 10 - - 13,712 Scheduled Transit Operations - Bus 250,175 - - - 250,175 Bus Garages 69,225 25,753 426 23,000 118,403 Bus Heavy Maintenance 23,291 8,584 27 - 31,903 Engineering & Technical Services - Bus 1,772 59 86 - 1,916
Total Bus Operations 359,031 34,411 976 23,000 417,417
RAIL OPERATIONSVP Rail Operations 419 5 76 - 500 Rail Operations Oversight 512 - - - 512 Rail Terminals 40,008 16,431 110 - 56,549 Scheduled Transit Operations - Rail 83,904 - - - 83,904 Rail Heavy Maintenance 8,524 (100) 163 - 8,588 Rail Car Appearance 9,780 340 1 - 10,122 Engineering & Technical Services - Rail 2,196 216 124 - 2,536
Total Rail Operations 145,344 16,892 475 - 162,712
SECURITY & COMMUNICATION / POWER CONTROLVP Security & Communication / Power Control 154 12 14 - 180 Security Services 806 16 24,558 - 25,380 Communication/PowerControl 6,423 26 372 - 6,821
Total Security & Communication / Power Control 7,382 55 24,944 - 32,381
PLANNINGVP Planning 238 9 15 - 261 Planning 3,658 42 293 - 3,993 Stategic Planning 950 6 47 - 1,003 Facility & ADA Planning 928 4 5 - 937
Total Planning 5,774 61 360 - 6,195
CUSTOMER SERVICE & PARATRANSITVP Customer Service & Paratransit 220 - - - 220 Administration & Paratransit 145 - - - 145 Customer Service 1,147 10 8 - 1,166 Paratransit Operations 1,023 26 45,117 - 46,165
Total Customer Service & Paratransit 2,535 36 45,125 - 47,696
Total Transit Operations 531,096 51,706 72,406 23,000 678,207
CONSTRUCTION, ENGINEERING & FACILITIESMAINTENANCE
EVP Construction, Engineering & Facilities Mntc. 373 6 12 - 391 Real Estate 1,396 15 7,714 - 9,125
Engineering 2,859 100 73 - 3,033 Construction 1,276 43 (71) - 1,248
40
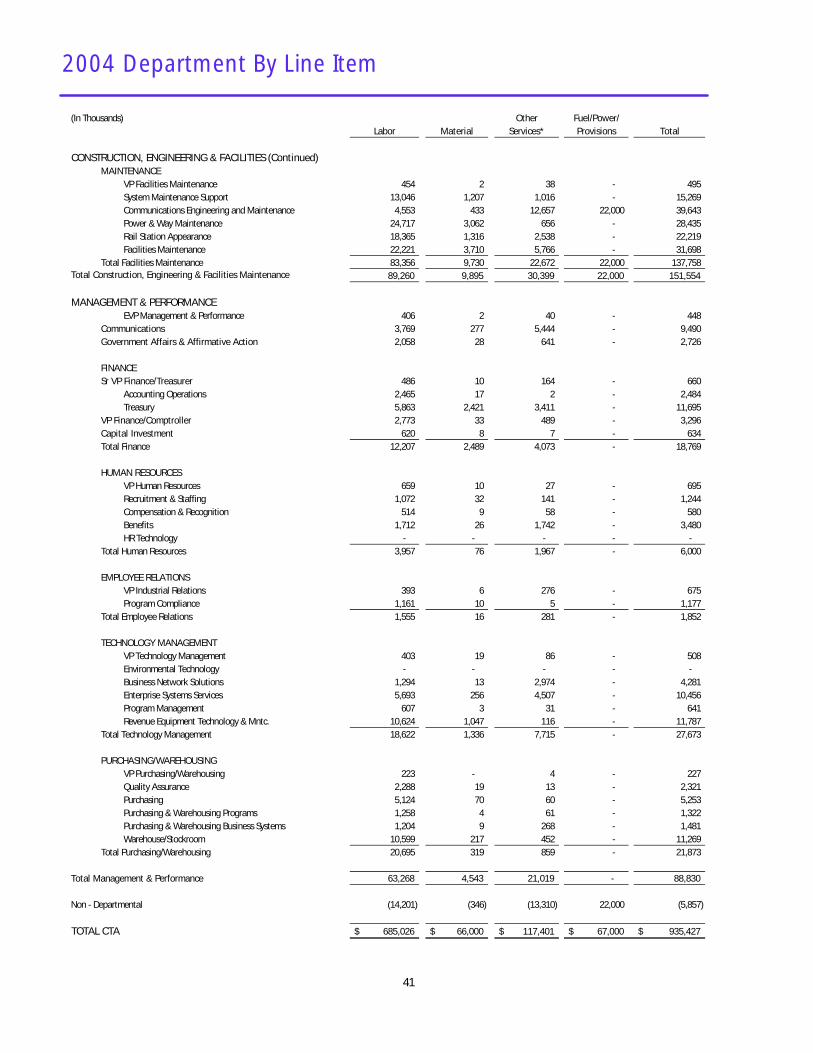
2004 Department By Line Item
(In Thousands) Other Fuel/Power/Labor Material Services* Provisions Total
CONSTRUCTION, ENGINEERING & FACILITIES (Continued)MAINTENANCE
VP Facilities Maintenance 454 2 38 - 495 System Maintenance Support 13,046 1,207 1,016 - 15,269 Communications Engineering and Maintenance 4,553 433 12,657 22,000 39,643 Power & Way Maintenance 24,717 3,062 656 - 28,435 Rail Station Appearance 18,365 1,316 2,538 - 22,219 Facilities Maintenance 22,221 3,710 5,766 - 31,698
Total Facilities Maintenance 83,356 9,730 22,672 22,000 137,758 89,260 9,895 30,399 22,000 151,554
MANAGEMENT & PERFORMANCEEVP Management & Performance 406 2 40 - 448
Communications 3,769 277 5,444 - 9,490 Government Affairs & Affirmative Action 2,058 28 641 - 2,726
FINANCESr VP Finance/Treasurer 486 10 164 - 660
Accounting Operations 2,465 17 2 - 2,484 Treasury 5,863 2,421 3,411 - 11,695
VP Finance/Comptroller 2,773 33 489 - 3,296 Capital Investment 620 8 7 - 634 Total Finance 12,207 2,489 4,073 - 18,769
HUMAN RESOURCESVP Human Resources 659 10 27 - 695 Recruitment & Staffing 1,072 32 141 - 1,244 Compensation & Recognition 514 9 58 - 580 Benefits 1,712 26 1,742 - 3,480 HR Technology - - - - -
Total Human Resources 3,957 76 1,967 - 6,000
EMPLOYEE RELATIONSVP Industrial Relations 393 6 276 - 675 Program Compliance 1,161 10 5 - 1,177
Total Employee Relations 1,555 16 281 - 1,852
TECHNOLOGY MANAGEMENTVP Technology Management 403 19 86 - 508 Environmental Technology - - - - - Business Network Solutions 1,294 13 2,974 - 4,281 Enterprise Systems Services 5,693 256 4,507 - 10,456 Program Management 607 3 31 - 641 Revenue Equipment Technology & Mntc. 10,624 1,047 116 - 11,787
Total Technology Management 18,622 1,336 7,715 - 27,673
PURCHASING/WAREHOUSINGVP Purchasing/Warehousing 223 - 4 - 227 Quality Assurance 2,288 19 13 - 2,321 Purchasing 5,124 70 60 - 5,253 Purchasing & Warehousing Programs 1,258 4 61 - 1,322 Purchasing & Warehousing Business Systems 1,204 9 268 - 1,481 Warehouse/Stockroom 10,599 217 452 - 11,269
Total Purchasing/Warehousing 20,695 319 859 - 21,873
Total Management & Performance 63,268 4,543 21,019 - 88,830
Non - Departmental (14,201) (346) (13,310) 22,000 (5,857)
TOTAL CTA 685,026$ 66,000$ 117,401$ 67,000$ 935,427$
Total Construction, Engineering & Facilities Maintenance
41
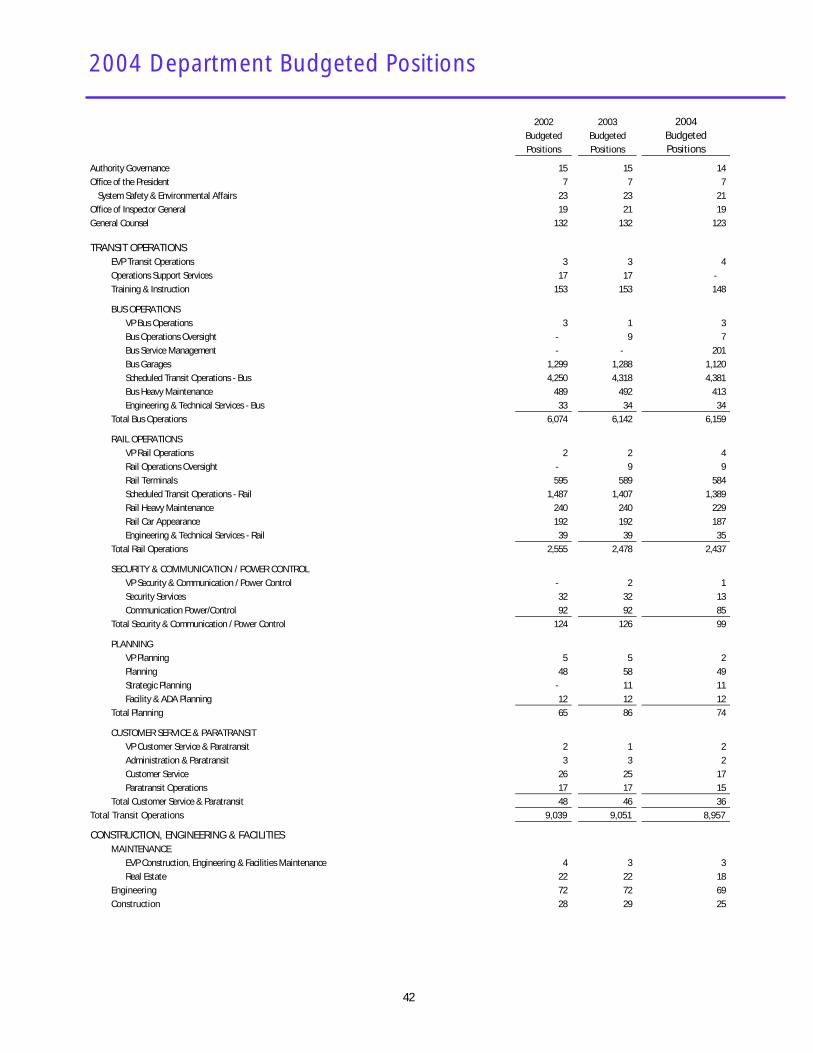
2002 2003 2004Budgeted Budgeted BudgetedPositions Positions Positions
Authority Governance 15 15 14 Office of the President 7 7 7
System Safety & Environmental Affairs 23 23 21 Office of Inspector General 19 21 19 General Counsel 132 132 123
TRANSIT OPERATIONSEVP Transit Operations 3 3 4 Operations Support Services 17 17 - Training & Instruction 153 153 148
BUS OPERATIONSVP Bus Operations 3 1 3 Bus Operations Oversight - 9 7 Bus Service Management - - 201 Bus Garages 1,299 1,288 1,120 Scheduled Transit Operations - Bus 4,250 4,318 4,381 Bus Heavy Maintenance 489 492 413 Engineering & Technical Services - Bus 33 34 34
Total Bus Operations 6,074 6,142 6,159
RAIL OPERATIONSVP Rail Operations 2 2 4 Rail Operations Oversight - 9 9 Rail Terminals 595 589 584 Scheduled Transit Operations - Rail 1,487 1,407 1,389 Rail Heavy Maintenance 240 240 229 Rail Car Appearance 192 192 187 Engineering & Technical Services - Rail 39 39 35
Total Rail Operations 2,555 2,478 2,437
SECURITY & COMMUNICATION / POWER CONTROLVP Security & Communication / Power Control - 2 1 Security Services 32 32 13 Communication Power/Control 92 92 85
Total Security & Communication / Power Control 124 126 99
PLANNINGVP Planning 5 5 2 Planning 48 58 49 Strategic Planning - 11 11 Facility & ADA Planning 12 12 12
Total Planning 65 86 74
CUSTOMER SERVICE & PARATRANSITVP Customer Service & Paratransit 2 1 2 Administration & Paratransit 3 3 2 Customer Service 26 25 17 Paratransit Operations 17 17 15
Total Customer Service & Paratransit 48 46 36 Total Transit Operations 9,039 9,051 8,957
CONSTRUCTION, ENGINEERING & FACILITIES MAINTENANCE
EVP Construction, Engineering & Facilities Maintenance 4 3 3 Real Estate 22 22 18
Engineering 72 72 69 Construction 28 29 25
2004 Department Budgeted Positions
42
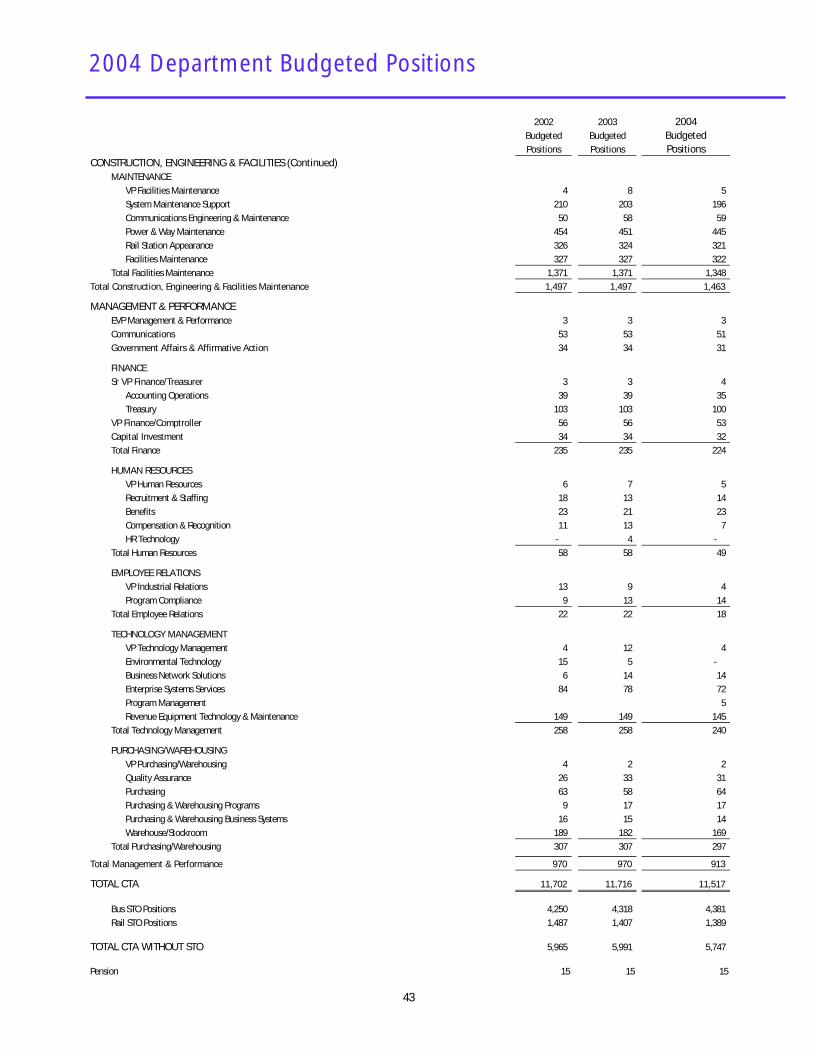
2002 2003 2004Budgeted Budgeted BudgetedPositions Positions Positions
2004 Department Budgeted Positions
CONSTRUCTION, ENGINEERING & FACILITIES (Continued)MAINTENANCE
VP Facilities Maintenance 4 8 5 System Maintenance Support 210 203 196 Communications Engineering & Maintenance 50 58 59 Power & Way Maintenance 454 451 445 Rail Station Appearance 326 324 321 Facilities Maintenance 327 327 322
Total Facilities Maintenance 1,371 1,371 1,348 Total Construction, Engineering & Facilities Maintenance 1,497 1,497 1,463
MANAGEMENT & PERFORMANCEEVP Management & Performance 3 3 3 Communications 53 53 51 Government Affairs & Affirmative Action 34 34 31
FINANCESr VP Finance/Treasurer 3 3 4
Accounting Operations 39 39 35 Treasury 103 103 100
VP Finance/Comptroller 56 56 53 Capital Investment 34 34 32 Total Finance 235 235 224
HUMAN RESOURCESVP Human Resources 6 7 5 Recruitment & Staffing 18 13 14 Benefits 23 21 23 Compensation & Recognition 11 13 7 HR Technology - 4 -
Total Human Resources 58 58 49
EMPLOYEE RELATIONSVP Industrial Relations 13 9 4 Program Compliance 9 13 14
Total Employee Relations 22 22 18
TECHNOLOGY MANAGEMENTVP Technology Management 4 12 4 Environmental Technology 15 5 - Business Network Solutions 6 14 14 Enterprise Systems Services 84 78 72 Program Management 5 Revenue Equipment Technology & Maintenance 149 149 145
Total Technology Management 258 258 240
PURCHASING/WAREHOUSINGVP Purchasing/Warehousing 4 2 2 Quality Assurance 26 33 31 Purchasing 63 58 64 Purchasing & Warehousing Programs 9 17 17 Purchasing & Warehousing Business Systems 16 15 14 Warehouse/Stockroom 189 182 169
Total Purchasing/Warehousing 307 307 297
Total Management & Performance 970 970 913
TOTAL CTA 11,702 11,716 11,517
Bus STO Positions 4,250 4,318 4,381 Rail STO Positions 1,487 1,407 1,389
TOTAL CTA WITHOUT STO 5,965 5,991 5,747
Pension 15 15 15
43
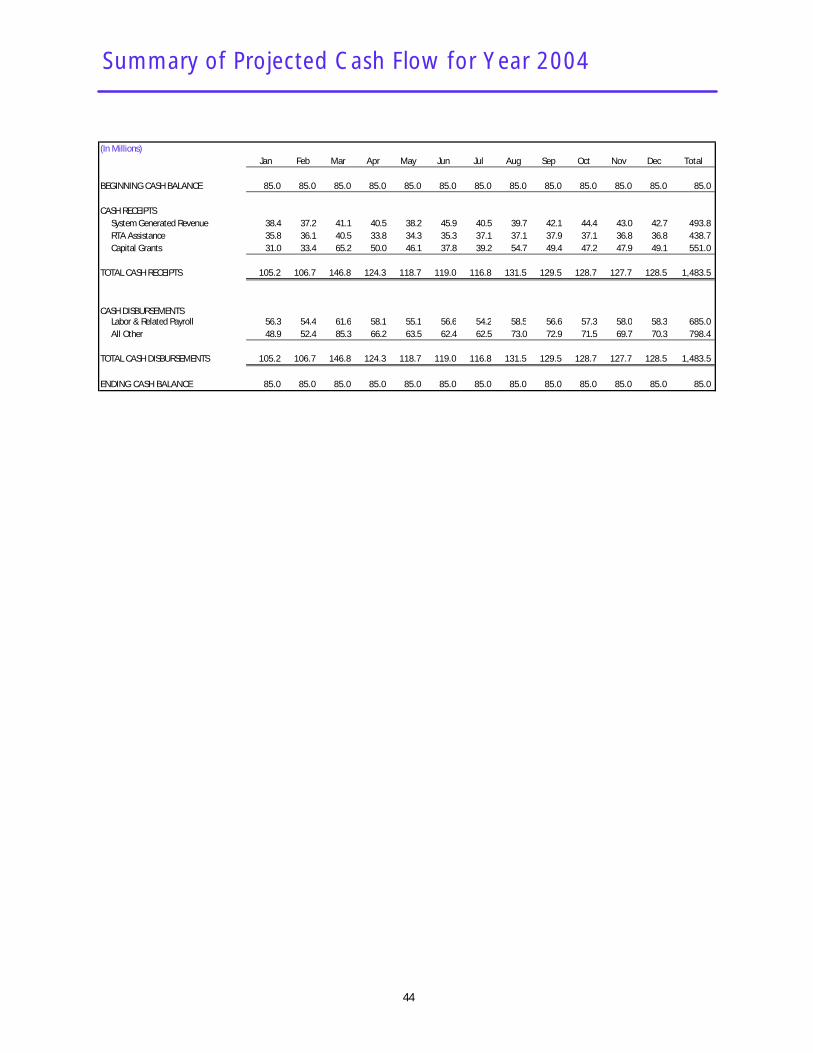
Summary of Projected Cash Flow for Year 2004
(In Millions)Jan Feb Mar Apr May Jun Jul Aug Sep Oct Nov Dec Total
BEGINNING CASH BALANCE 85.0 85.0 85.0 85.0 85.0 85.0 85.0 85.0 85.0 85.0 85.0 85.0 85.0
CASH RECEIPTSSystem Generated Revenue 38.4 37.2 41.1 40.5 38.2 45.9 40.5 39.7 42.1 44.4 43.0 42.7 493.8RTA Assistance 35.8 36.1 40.5 33.8 34.3 35.3 37.1 37.1 37.9 37.1 36.8 36.8 438.7Capital Grants 31.0 33.4 65.2 50.0 46.1 37.8 39.2 54.7 49.4 47.2 47.9 49.1 551.0
TOTAL CASH RECEIPTS 105.2 106.7 146.8 124.3 118.7 119.0 116.8 131.5 129.5 128.7 127.7 128.5 1,483.5
CASH DISBURSEMENTSLabor & Related Payroll 56.3 54.4 61.6 58.1 55.1 56.6 54.2 58.5 56.6 57.3 58.0 58.3 685.0All Other 48.9 52.4 85.3 66.2 63.5 62.4 62.5 73.0 72.9 71.5 69.7 70.3 798.4
TOTAL CASH DISBURSEMENTS 105.2 106.7 146.8 124.3 118.7 119.0 116.8 131.5 129.5 128.7 127.7 128.5 1,483.5
ENDING CASH BALANCE 85.0 85.0 85.0 85.0 85.0 85.0 85.0 85.0 85.0 85.0 85.0 85.0 85.0
44
2005-2006 Operating Financial Plan
Chicago Transit Authority
Professional
We will provide transitservice with the higheststandards of quality andsafety for our customersand ourselves.
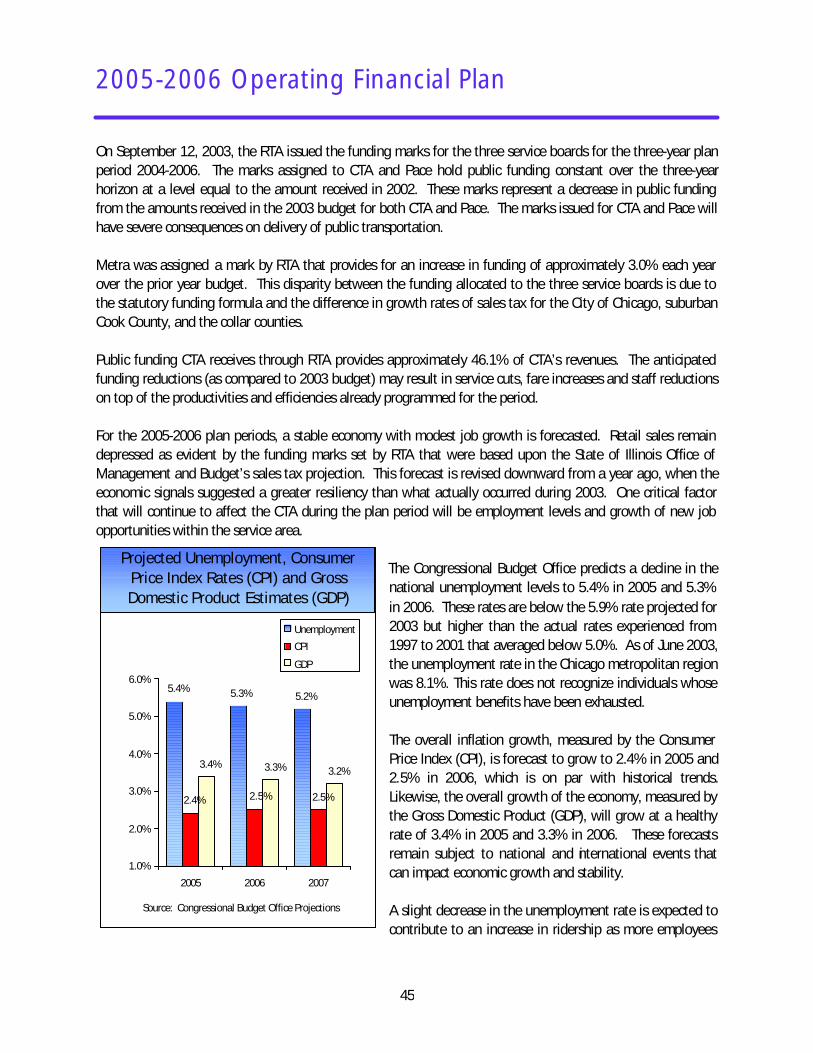
2005-2006 Operating Financial Plan
45
On September 12, 2003, the RTA issued the funding marks for the three service boards for the three-year plan period 2004-2006. The marks assigned to CTA and Pace hold public funding constant over the three-year horizon at a level equal to the amount received in 2002. These marks represent a decrease in public funding from the amounts received in the 2003 budget for both CTA and Pace. The marks issued for CTA and Pace will have severe consequences on delivery of public transportation. Metra was assigned a mark by RTA that provides for an increase in funding of approximately 3.0% each year over the prior year budget. This disparity between the funding allocated to the three service boards is due to the statutory funding formula and the difference in growth rates of sales tax for the City of Chicago, suburban Cook County, and the collar counties. Public funding CTA receives through RTA provides approximately 46.1% of CTA’s revenues. The anticipated funding reductions (as compared to 2003 budget) may result in service cuts, fare increases and staff reductions on top of the productivities and efficiencies already programmed for the period. For the 2005-2006 plan periods, a stable economy with modest job growth is forecasted. Retail sales remain depressed as evident by the funding marks set by RTA that were based upon the State of Illinois Office of Management and Budget’s sales tax projection. This forecast is revised downward from a year ago, when the economic signals suggested a greater resiliency than what actually occurred during 2003. One critical factor that will continue to affect the CTA during the plan period will be employment levels and growth of new job opportunities within the service area.
The Congressional Budget Office predicts a decline in the national unemployment levels to 5.4% in 2005 and 5.3% in 2006. These rates are below the 5.9% rate projected for 2003 but higher than the actual rates experienced from 1997 to 2001 that averaged below 5.0%. As of June 2003, the unemployment rate in the Chicago metropolitan region was 8.1%. This rate does not recognize individuals whose unemployment benefits have been exhausted. The overall inflation growth, measured by the Consumer Price Index (CPI), is forecast to grow to 2.4% in 2005 and 2.5% in 2006, which is on par with historical trends. Likewise, the overall growth of the economy, measured by the Gross Domestic Product (GDP), will grow at a healthy rate of 3.4% in 2005 and 3.3% in 2006. These forecasts remain subject to national and international events that can impact economic growth and stability. A slight decrease in the unemployment rate is expected to contribute to an increase in ridership as more employees
5.2%5.3%5.4%
2.4% 2.5% 2.5%
3.4%3.2%3.3%
1.0%
2.0%
3.0%
4.0%
5.0%
6.0%
2005 2006 2007
Source: Congressional Budget Office Projections
Unemployment
CPI
GDP
Projected Unemployment, Consumer Price Index Rates (CPI) and Gross Domestic Product Estimates (GDP)
2005-2006 Operating Financial Plan
46
use public transportation to go to work. An increase in the GDP is an indication of a growing economy. A relatively flat CPI signals stable consumer prices. Although the U.S. is widely acknowledged to be in a recovery, unemployment rates have failed to decrease appreciably, prompting some to refer to current conditions as a jobless recovery. This remains to be an obstacle to our financial health. 2005 and 2006 Operating Budget Based on the projected economic conditions, CTA is forecasting modest growth for 2005 and 2006 revenues and expenses. The projected operating budget for 2005 is $955.0 million and is 2.1% higher than 2004. The 2006 budget is anticipated to be $981.0 million and is 2.7% higher than fiscal year 2005, primarily due to higher labor costs as a result of wage rate and health care cost increases. Labor Labor expenses are projected to increase at an annual rate of 2.1% during 2005 and 2.4% during 2006 to $699.4 million and $716.2 million, respectively. Increases in wages and benefits are partially offset by labor savings from productivity gains and streamlining of operations. This projection includes a reduction of 200 more positions that are planned for phase out during 2004 through attrition, bringing the total staff reductions to 446 since 2003. CTA continues to emphasize cost reductions achieved through productivity gains, efficiencies, streamlining business operations, and automation and work rule changes. Also driving down the annual increase in labor costs are savings expected from retirements, lower absenteeism and reductions in overtime. A new time and attendance system is planned for implementation starting in 2004 with an expected completion date in mid-2005 that will result in the aforementioned savings. CTA has been experiencing increased costs in fringe benefits, particularly health care and workers compensation expenses. In 2002, CTA entered into a contract with a nationally recognized leader in safety management and accident reduction programs. This contract expects to reduce worker related injuries by 50% over the five-year contract term. Health care expenses have been growing at an annual average rate of 14.0% since 1995 -- over five times the rate of inflation. To aid in controlling these costs, CTA will work to restructure benefits and seek a larger contribution from employees. Material CTA projects material expenses to increase by $1.5 million or 2.3% in 2005 to $67.5 million. However, in 2006, material expenses are forecast to decrease by $2.5 million or 3.7% as a result of efficiencies achieved from implementation of the maintenance management system. This system will track the life cycle of vehicle parts, warranties and vehicle repairer information.
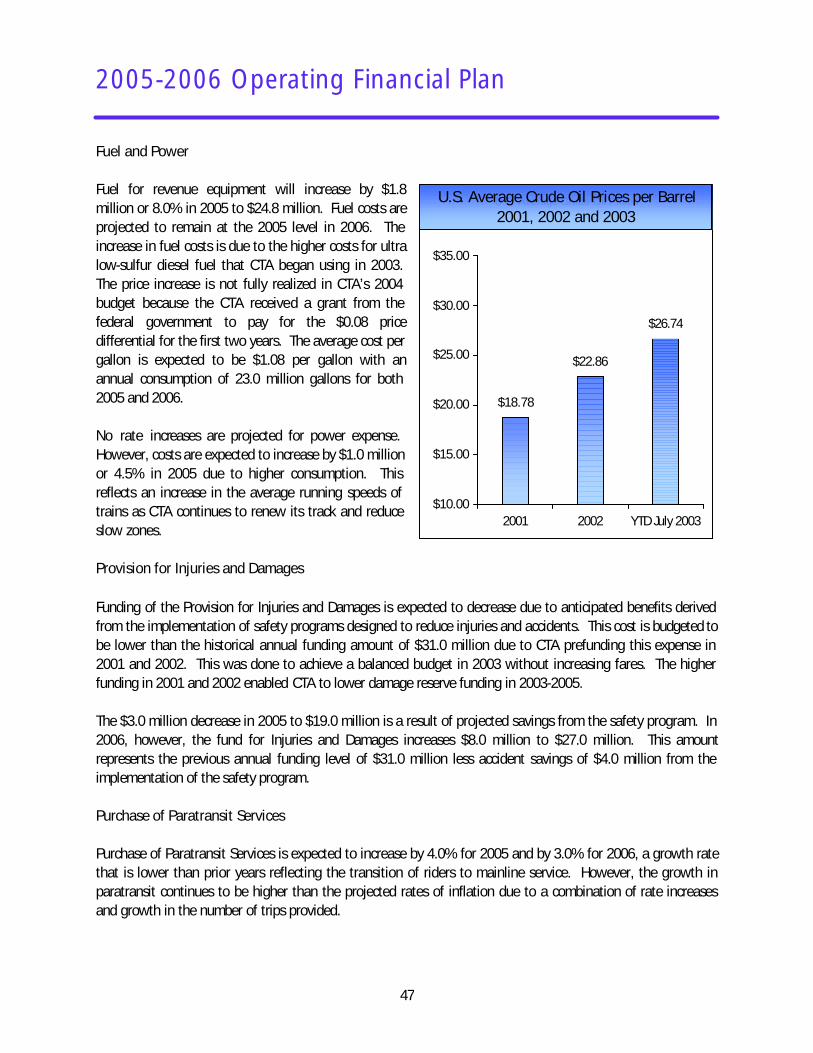
2005-2006 Operating Financial Plan
47
Fuel and Power Fuel for revenue equipment will increase by $1.8 million or 8.0% in 2005 to $24.8 million. Fuel costs are projected to remain at the 2005 level in 2006. The increase in fuel costs is due to the higher costs for ultra low-sulfur diesel fuel that CTA began using in 2003. The price increase is not fully realized in CTA’s 2004 budget because the CTA received a grant from the federal government to pay for the $0.08 price differential for the first two years. The average cost per gallon is expected to be $1.08 per gallon with an annual consumption of 23.0 million gallons for both 2005 and 2006. No rate increases are projected for power expense. However, costs are expected to increase by $1.0 million or 4.5% in 2005 due to higher consumption. This reflects an increase in the average running speeds of trains as CTA continues to renew its track and reduce slow zones. Provision for Injuries and Damages Funding of the Provision for Injuries and Damages is expected to decrease due to anticipated benefits derived from the implementation of safety programs designed to reduce injuries and accidents. This cost is budgeted to be lower than the historical annual funding amount of $31.0 million due to CTA prefunding this expense in 2001 and 2002. This was done to achieve a balanced budget in 2003 without increasing fares. The higher funding in 2001 and 2002 enabled CTA to lower damage reserve funding in 2003-2005. The $3.0 million decrease in 2005 to $19.0 million is a result of projected savings from the safety program. In 2006, however, the fund for Injuries and Damages increases $8.0 million to $27.0 million. This amount represents the previous annual funding level of $31.0 million less accident savings of $4.0 million from the implementation of the safety program. Purchase of Paratransit Services Purchase of Paratransit Services is expected to increase by 4.0% for 2005 and by 3.0% for 2006, a growth rate that is lower than prior years reflecting the transition of riders to mainline service. However, the growth in paratransit continues to be higher than the projected rates of inflation due to a combination of rate increases and growth in the number of trips provided.
U.S. Average Crude Oil Prices
$18.78
$22.86
$26.74
$10.00
$15.00
$20.00
$25.00
$30.00
$35.00
2001 2002 YTD July 2003
U.S. Average Crude Oil Prices per Barrel 2001, 2002 and 2003
2005-2006 Operating Financial Plan
48
The CTA continues to increase accessibility of mainline services for customers with disabilities. With the addition of new NABI buses, 100% of the bus fleet will be accessible. Additionally, the planned rehabilitation of ‘L’ stations on the Blue and Brown Lines will make 24 more stations accessible in coming years (two Blue Line stations are already open). Paratransit expense represents 4.9% of CTA’s total operating costs. CTA only receives $1.50 per trip taken with a private carrier while it pays the third party vendor approximately $26.00 -- a loss of $24.50 per ride. Special funding is not provided for this service. Since 2000, paratransit expense has increased by over 73%. CTA remains challenged to meet the service needs of the community while working to reduce the cost of providing this service. Security Because security is a high priority for the CTA and its customers, purchase of security expenses will increase. Expenses for security services are projected to increase by 3.0% in 2005 to $25.8 million and 3.0% in 2006 to $26.6 million due to contractual cost of living increases for the employees of Securitas, a private security service firm contracted by the CTA. Other Services Other services include rent, utilities, data processing maintenance, consulting, accounting, engineering, and other consulting services. Other services expenses will grow at a rate of 2.9% for 2005 to $48.6 million and $50.0 million in 2006. Revenues The sources of CTA revenue include system-generated revenues as well as public funding. System-generated revenue is projected to be $513.4 million and $539.4 in 2005 and 2006, respectively. This represents a growth rate of 4.0% for 2005 and a growth rate of 5.1% for 2006. Public funding, as previously mentioned, is projected by the RTA to be flat at the amount received in 2002. Over 46% of CTA’s revenue is derived from public funding through RTA. CTA is faced with a financial challenge spurred by the lack of an adequate funding source. What business can continue to keep service levels and quality constant for five years while revenues remain flat but costs continue to rise? The following explains the changes in each of the revenue categories over the two-year period. Fares and Passes Revenue from fares and passes are projected at $420.1 million in 2005 and $437.8 million in 2006. This represents an increase of 6.7% over 2004 and 4.2% over 2005 levels. These increases reflect modest fare increases. Without additional public funding, CTA may be forced to increase fares in conjunction with other cost containment initiatives to balance its budget while maintaining service.
2005-2006 Operating Financial Plan
49
Reduced Fare Reimbursement Reduced fare reimbursement from the state is projected flat at $32.3 million for 2005 and 2006. Advertising, Charter and Concessions Advertising, Charter and Concessions revenues are derived from advertisements placed on buses, trains and stations, as well as income from concessions. Advertisement revenues in 2005 are projected to increase by $2.0 million or 8.2% to $26.2 million. In 2006, advertising revenues are expected to increase by an additional $4.5 million or 17.1% to $30.7 million due to an increase in advertising revenues on the system and expanded concession contracts. Investment Income Investment Income is projected to remain flat at the 2004 budget of $3.0 million as short-term interest rates are projected to remain low. Other Revenues Other revenues are forecasted at $26.8 million in 2005. Revenues in this category include a grant from the Federal Transit Administration (FTA) to fund some paratransit expenses, parking fees, rental properties, third party contractor reimbursements, fees from movie studios and other miscellaneous revenues. All Other Revenue will decrease by $8.9 million in 2005 because 2004 included revenue from sales of surplus properties. In 2006, other revenue is forecast to increase by $3.7 million due to surplus property sales. Public Funding The Public Funding Available for operations represents the funding “mark” issued by the RTA, based upon the State of Illinois Office of Management and Budget’s projection. Per statutory allocation, the RTA projects to provide CTA $441.6 million in 2004, 2005 and 2006. This is 2.6% less than it provided in 2003 and is set at the 2002 funding mark. Pace also will receive the same funding amount it received in 2002 for each year 2004-2006. In contrast, Metra will receive annual increases of 3.1% in 2004, 2.8% in 2005 and 2.8% in 2006. These funding marks are based on the statutory funding formula included in the RTA Act that provides a set percentage to allocate sales taxes collected in the City of Chicago, suburban Cook County, and the collar counties to the three service boards. All of the public funding the service boards (CTA, Metra, and Pace) receive for operating needs is funneled through the RTA. The RTA currently has two principal sources of operating funds used to fund the three service boards:
(1) RTA Sales Tax; (2) Public Transportation Fund appropriated by the State annually.
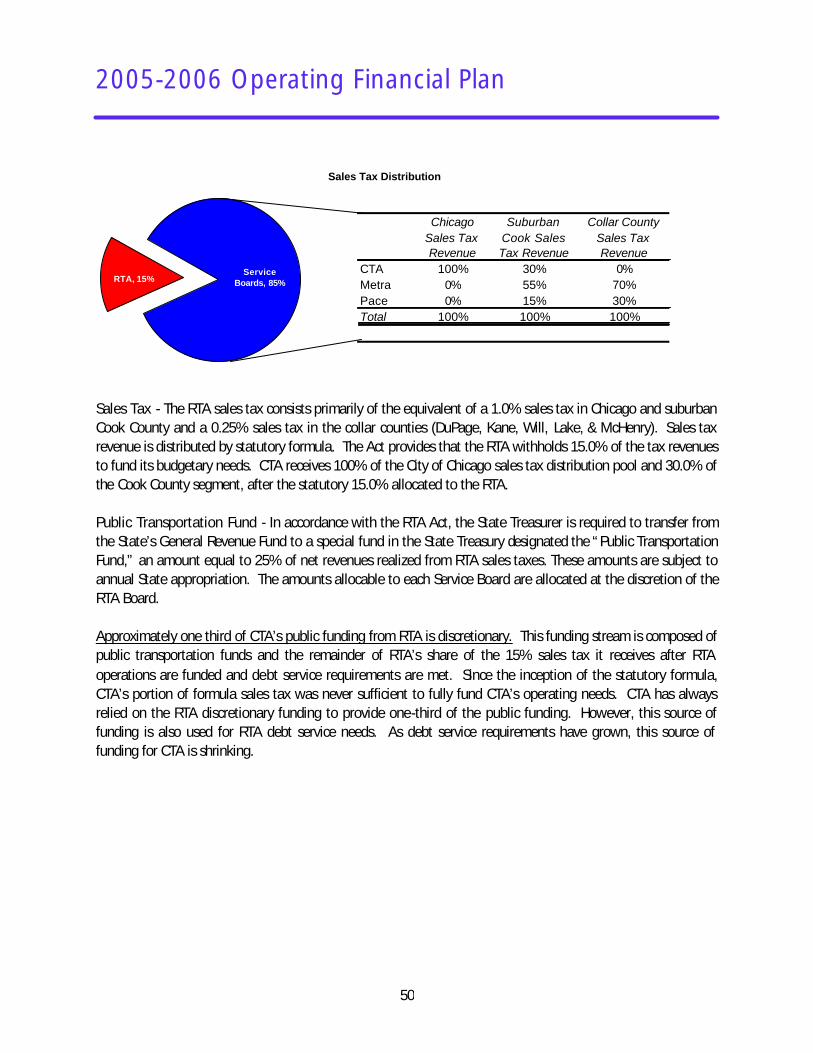
2005-2006 Operating Financial Plan
50
Chicago Sales Tax Revenue
Suburban Cook Sales Tax Revenue
Collar County Sales Tax Revenue
CTA 100% 30% 0%Metra 0% 55% 70%Pace 0% 15% 30%Total 100% 100% 100%
Sales Tax Distribution
Service Boards, 85%RTA, 15%
Sales Tax - The RTA sales tax consists primarily of the equivalent of a 1.0% sales tax in Chicago and suburban Cook County and a 0.25% sales tax in the collar counties (DuPage, Kane, Will, Lake, & McHenry). Sales tax revenue is distributed by statutory formula. The Act provides that the RTA withholds 15.0% of the tax revenues to fund its budgetary needs. CTA receives 100% of the City of Chicago sales tax distribution pool and 30.0% of the Cook County segment, after the statutory 15.0% allocated to the RTA. Public Transportation Fund - In accordance with the RTA Act, the State Treasurer is required to transfer from the State’s General Revenue Fund to a special fund in the State Treasury designated the “Public Transportation Fund,” an amount equal to 25% of net revenues realized from RTA sales taxes. These amounts are subject to annual State appropriation. The amounts allocable to each Service Board are allocated at the discretion of the RTA Board. Approximately one third of CTA’s public funding from RTA is discretionary. This funding stream is composed of public transportation funds and the remainder of RTA’s share of the 15% sales tax it receives after RTA operations are funded and debt service requirements are met. Since the inception of the statutory formula, CTA’s portion of formula sales tax was never sufficient to fully fund CTA’s operating needs. CTA has always relied on the RTA discretionary funding to provide one-third of the public funding. However, this source of funding is also used for RTA debt service needs. As debt service requirements have grown, this source of funding for CTA is shrinking.
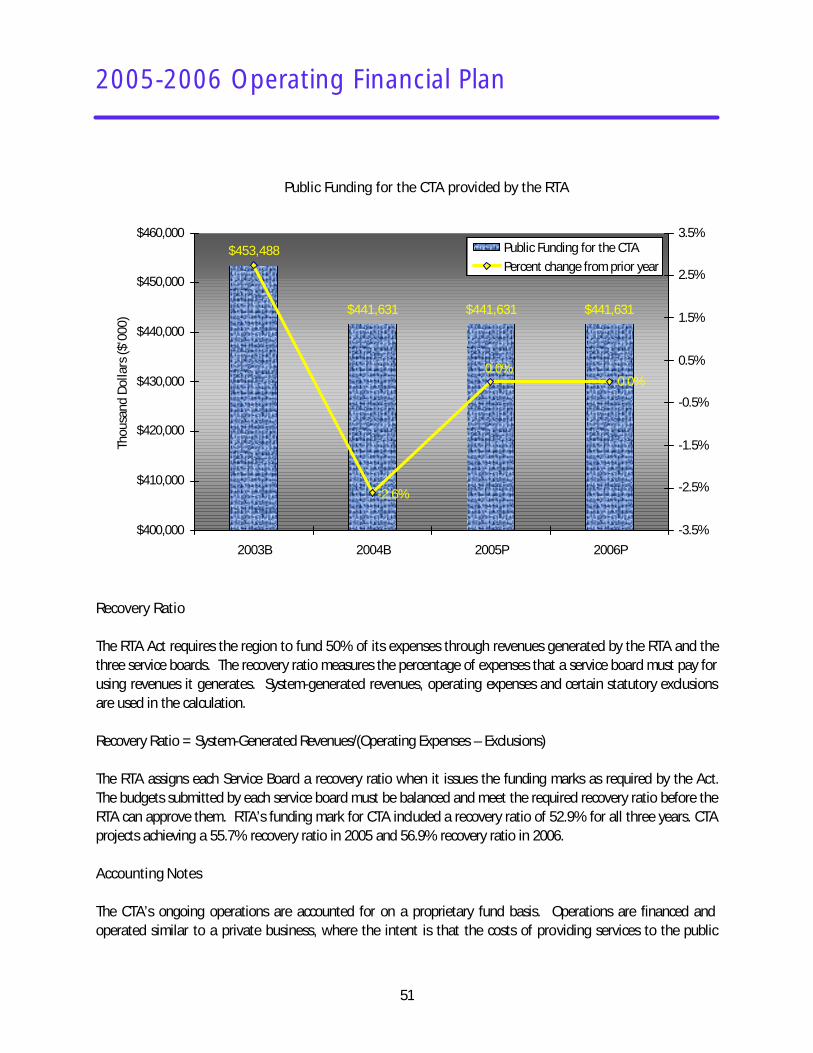
2005-2006 Operating Financial Plan
51
Public Funding for the CTA provided by the RTA
$453,488
$441,631 $441,631 $441,631
0.0%
-2.6%
0.0%
$400,000
$410,000
$420,000
$430,000
$440,000
$450,000
$460,000
2003B 2004B 2005P 2006P
Thou
sand
Dol
lars
($'0
00)
-3.5%
-2.5%
-1.5%
-0.5%
0.5%
1.5%
2.5%
3.5%Public Funding for the CTAPercent change from prior year
Recovery Ratio The RTA Act requires the region to fund 50% of its expenses through revenues generated by the RTA and the three service boards. The recovery ratio measures the percentage of expenses that a service board must pay for using revenues it generates. System-generated revenues, operating expenses and certain statutory exclusions are used in the calculation. Recovery Ratio = System-Generated Revenues/(Operating Expenses – Exclusions) The RTA assigns each Service Board a recovery ratio when it issues the funding marks as required by the Act. The budgets submitted by each service board must be balanced and meet the required recovery ratio before the RTA can approve them. RTA’s funding mark for CTA included a recovery ratio of 52.9% for all three years. CTA projects achieving a 55.7% recovery ratio in 2005 and 56.9% recovery ratio in 2006. Accounting Notes The CTA’s ongoing operations are accounted for on a proprietary fund basis. Operations are financed and operated similar to a private business, where the intent is that the costs of providing services to the public
2005-2006 Operating Financial Plan
52
should be recovered through user charges. The full accrual method of accounting is used where revenues are recorded when earned and expenses are recorded when incurred. During 2003, CTA issued debt to finance the renovation of the Cermak (Douglas) Branch of the Blue Line. This debt is backed by the full funding grant agreement with the FTA. All debt service payments will be made with FTA funds.
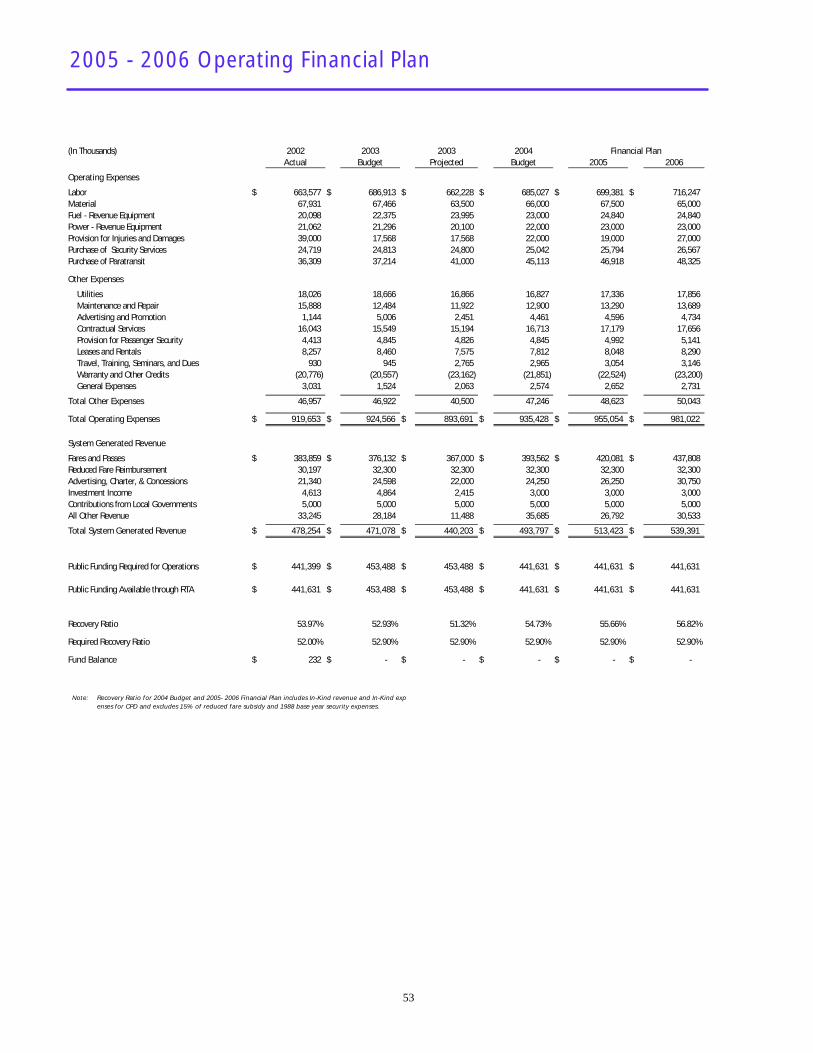
2005 - 2006 Operating Financial Plan
(In Thousands) 2002 2003 2003 2004 Financial PlanActual Budget Projected Budget 2005 20063 4 5 6
Operating Expenses 5 7 8 9
Labor $ 663,577 $ 686,913 $ 662,228 $ 685,027 $ 699,381 $ 716,247 Material 67,931 67,466 63,500 66,000 67,500 65,000 Fuel - Revenue Equipment 20,098 22,375 23,995 23,000 24,840 24,840 Power - Revenue Equipment 21,062 21,296 20,100 22,000 23,000 23,000 Provision for Injuries and Damages 39,000 17,568 17,568 22,000 19,000 27,000 Purchase of Security Services 24,719 24,813 24,800 25,042 25,794 26,567 Purchase of Paratransit 36,309 37,214 41,000 45,113 46,918 48,325
Other Expenses
Utilities 18,026 18,666 16,866 16,827 17,336 17,856 Maintenance and Repair 15,888 12,484 11,922 12,900 13,290 13,689 Advertising and Promotion 1,144 5,006 2,451 4,461 4,596 4,734 Contractual Services 16,043 15,549 15,194 16,713 17,179 17,656 Provision for Passenger Security 4,413 4,845 4,826 4,845 4,992 5,141 Leases and Rentals 8,257 8,460 7,575 7,812 8,048 8,290 Travel, Training, Seminars, and Dues 930 945 2,765 2,965 3,054 3,146 Warranty and Other Credits (20,776) (20,557) (23,162) (21,851) (22,524) (23,200) General Expenses 3,031 1,524 2,063 2,574 2,652 2,731
Total Other Expenses 46,957 46,922 40,500 47,246 48,623 50,043
Total Operating Expenses $ 919,653 $ 924,566 $ 893,691 $ 935,428 $ 955,054 $ 981,022
System Generated Revenue
Fares and Passes $ 383,859 $ 376,132 $ 367,000 $ 393,562 $ 420,081 $ 437,808 Reduced Fare Reimbursement 30,197 32,300 32,300 32,300 32,300 32,300 Advertising, Charter, & Concessions 21,340 24,598 22,000 24,250 26,250 30,750 Investment Income 4,613 4,864 2,415 3,000 3,000 3,000 Contributions from Local Governments 5,000 5,000 5,000 5,000 5,000 5,000 All Other Revenue 33,245 28,184 11,488 35,685 26,792 30,533
Total System Generated Revenue $ 478,254 $ 471,078 $ 440,203 $ 493,797 $ 513,423 $ 539,391
Public Funding Required for Operations $ 441,399 $ 453,488 $ 453,488 $ 441,631 $ 441,631 $ 441,631
Public Funding Available through RTA $ 441,631 $ 453,488 $ 453,488 $ 441,631 $ 441,631 $ 441,631
Recovery Ratio 53.97% 52.93% 51.32% 54.73% 55.66% 56.82%
Required Recovery Ratio 52.00% 52.90% 52.90% 52.90% 52.90% 52.90%
Fund Balance $ 232 $ - $ - $ - $ - $ -
Note: Recovery Ratio for 2004 Budget and 2005- 2006 Financial Plan includes In-Kind revenue and In-Kind expenses for CPD and excludes 15% of reduced fare subsidy and 1988 base year security expenses.
53
2004-2008 Capital Improvement Plan and Program
Chicago Transit Authority
ReliableWe will be dependablefor our customers and fellow employees,and will maintain the highest standardsof trust.
2004 Capital Improvement Program Overview
54
This 2004-2008 Capital Improvement Program (CIP) identifies and targets available capital funds toward recognized capital renewal and improvement needs of CTA’s system. The program is funded from five sources:
• The Federal government - Federal Transit Administration (FTA) • The State of Illinois – Department of Transportation (IDOT) • The Regional Transportation Authority (RTA) • CTA Bond Issue • Miscellaneous local sources and reprogrammed funds
Each of these sources provides funding to cover projects contained in the typical CTA five-year capital
program. CTA estimates that over $5 billion is needed over the next five years to bring its system to a state of good repair. Of this amount $2.91 billion has been identified in this current CIP while $2.05 billion of needed capital projects remain unfunded. Consequently, despite CTA’s recent success in acquiring state and federal assistance for CTA’s capital program, CTA is still faced with a sizeable list of unmet capital needs and as a result continues to look for new sources of funding for the capital program. Vital projects such as replacement of subway lighting and ventilation systems; renewal of Red Line and Purple Line viaducts, track, and track bed; and upgrades to Red Line and Blue Line stations are unfunded. The use of private financing is proposed as an appropriate mechanism to accelerate addressing this unmet need. CTA is projecting total capital funding of $2.91 billion will be available over the next five years, to help bring CTA’s system to a state of good repair, whereby:
• CTA’s goal is to keep no bus in service over the industry standard retirement age of 12 years. In special circumstances buses may be kept in service 14 years, but extension beyond 14 creates significant maintenance problems that affect service quality. Any such extension should be based on a life-extending rehabilitation of the buses. All buses should be rehabilitated at mid-life (after six or seven years of service). This ensures reliability and customer comfort, and will reduce maintenance expenses.
• All rail cars are rehabilitated at mid-life (12-13 years), overhauled at their
quarter-life points (6 and 18 years), and either rehabilitated or replaced at the end of their useful life, (25 years). Vehicle life can be extended to 30 years, but extension beyond 30 years begins to raise serious maintenance issues and affects the quality of service CTA can give its customers. Any such extension should be based on a life-extending rehabilitation of the cars.
2004 Capital Improvement Program Overview
55
• All rail stations are in good condition, and able to meet modern standards for passenger comfort, security, and reliability. Stations should be replaced or rehabilitated at the end of their useful life of 40 years.
• All rail lines operate at scheduled speeds; no areas are slowed down
because of track or structural disrepair. Rail signal systems are fully reliable and meet modern standards of performance.
• Service management systems are fully reliable and incorporate modern
features. Such systems are used to send information between CTA’s Control Center and its vehicles and stations, and are especially important in dealing with emergencies and service problems.
• All maintenance facilities are designed and kept in good condition, to
permit buses and trains to be maintained efficiently and effectively. CTA cannot ensure a quality ride if it lacks the wherewithal to maintain its vehicles. As with stations, 40 years is a desirable standard for replacing maintenance facilities, with suitable maintenance and reinvestment, such buildings can effectively serve for as much as 70 years.
• CTA has judiciously employed the use of certain categories of capital
funds to help ensure the adequate maintenance of assets such as buses and rail cars. This keeps the bulk of capital funds committed to replacing or renewing the equipment and facilities while continuing services until additional operating funding becomes available.
Meeting and maintaining these standards would improve the comfort and reliability of the services CTA provides its customers, and yield operational and maintenance benefits for CTA.
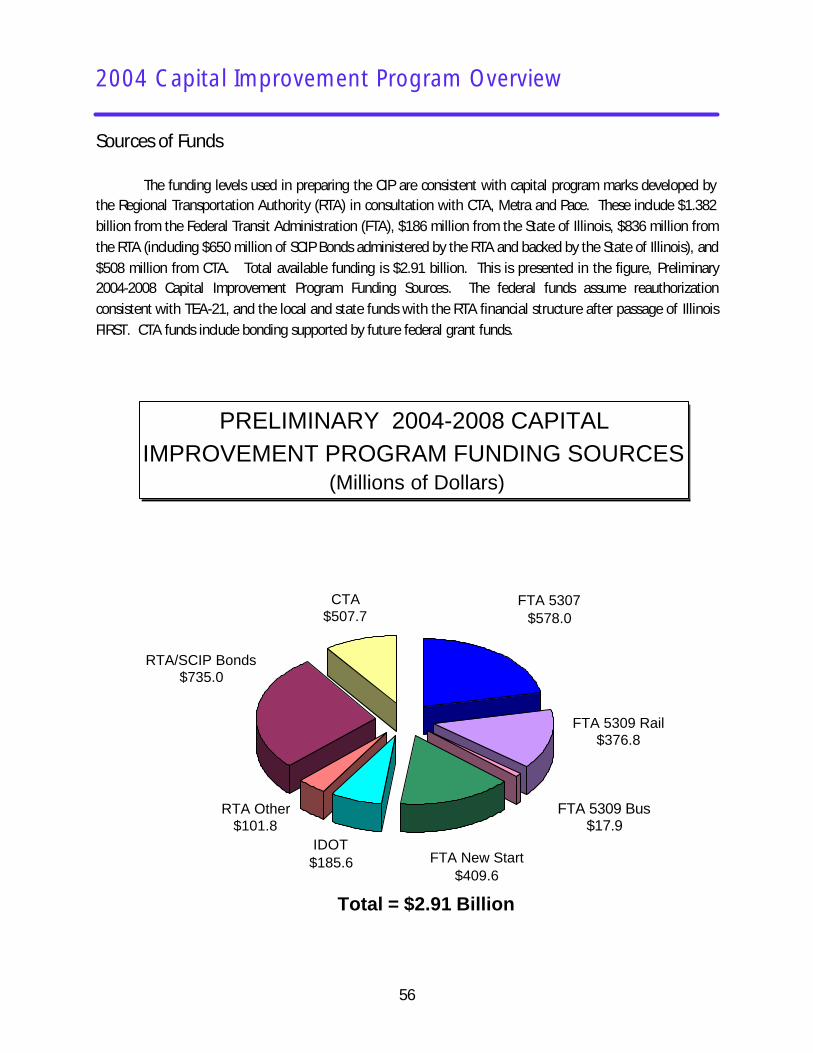
2004 Capital Improvement Program Overview
56
Sources of Funds The funding levels used in preparing the CIP are consistent with capital program marks developed by the Regional Transportation Authority (RTA) in consultation with CTA, Metra and Pace. These include $1.382 billion from the Federal Transit Administration (FTA), $186 million from the State of Illinois, $836 million from the RTA (including $650 million of SCIP Bonds administered by the RTA and backed by the State of Illinois), and $508 million from CTA. Total available funding is $2.91 billion. This is presented in the figure, Preliminary 2004-2008 Capital Improvement Program Funding Sources. The federal funds assume reauthorization consistent with TEA-21, and the local and state funds with the RTA financial structure after passage of Illinois FIRST. CTA funds include bonding supported by future federal grant funds.
PRELIMINARY 2004-2008 CAPITAL IMPROVEMENT PROGRAM FUNDING SOURCES
(Millions of Dollars)
CTA$507.7
FTA 5307$578.0
FTA 5309 Rail$376.8
FTA New Start$409.6
IDOT$185.6
RTA Other$101.8
RTA/SCIP Bonds$735.0
Total = $2.91 Billion
FTA 5309 Bus $17.9
2004 Capital Improvement Program Overview
57
Uses of Funds Using the capital program marks as a foundation, CTA has developed a program of capital projects for the 2004–2008 Capital Improvement Program. CTA’s 2004-2008 capital budget continues to work towards the goals and objectives outlined in the 2003-2007 CIP:
• Continue New Starts projects intended to rehabilitate deteriorated rail infrastructure [Blue Line – Cermak (Douglas) Branch] and expand capacity to accommodate growth in ridership [Brown Line]. Rebuild the system, starting with the segments of CTA’s rail system most in need.
• Fund the procurement/replacement of vehicles as needed. Replace CTA’s bus and rail fleets
and provide safe and reliable transportation to CTA customers. • Renew CTA’s rail right-of-way (ROW). Eliminate ROW slow zones that increase travel times.
Work to place CTA’s rail system in a state of good repair and increase the reliability of CTA service.
• Fund the implementation of preventive maintenance programs for CTA’s bus and rail fleets.
Improve CTA’s product to provide on-time, clean, safe and friendly transit service.
• Upgrade maintenance facilities and provide the necessary equipment to keep CTA’s buses and trains running. Sustain the momentum reflected in CTA’s increased ridership and customer satisfaction.
During weak economic times, the traveling public is more than ever dependent on CTA’s system to meet its
mobility needs. Investment in vital public infrastructure projects provides jobs, creates and supports better economic growth and ensures the future of the region. The 2004-2008 capital program provides some of the funding necessary to continue to address CTA’s customers’ concerns over the next five years.
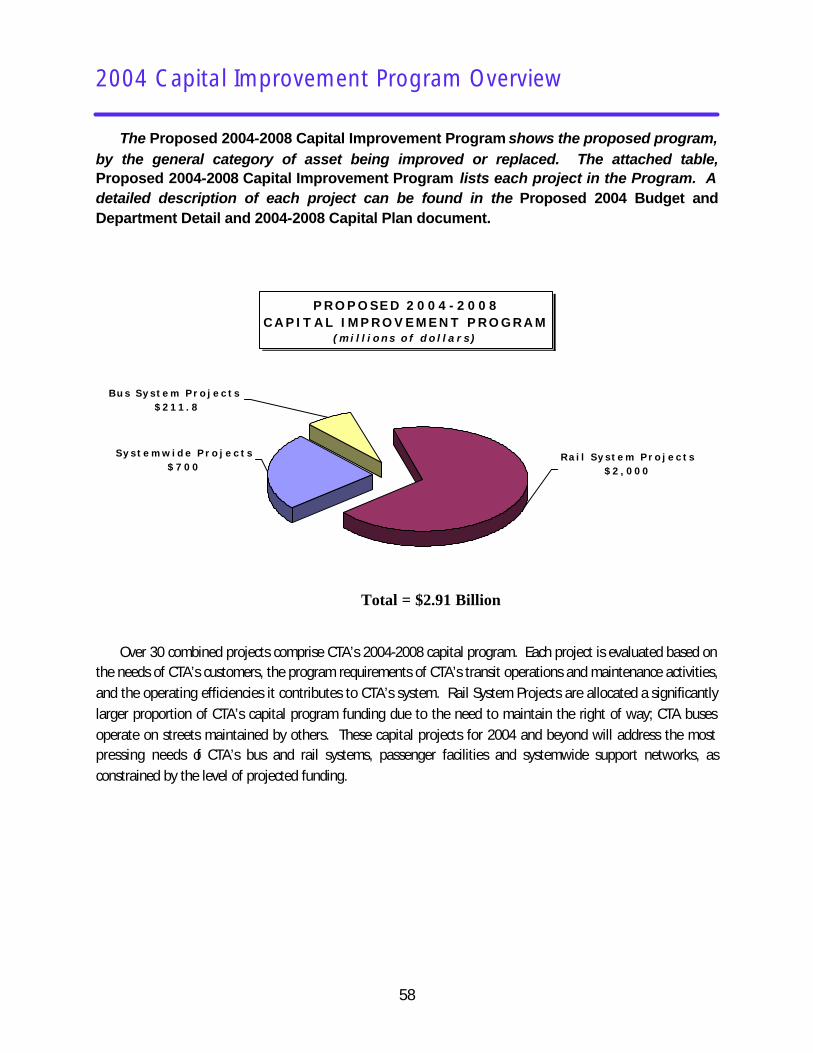
2004 Capital Improvement Program Overview
58
The Proposed 2004-2008 Capital Improvement Program shows the proposed program, by the general category of asset being improved or replaced. The attached table, Proposed 2004-2008 Capital Improvement Program lists each project in the Program. A detailed description of each project can be found in the Proposed 2004 Budget and Department Detail and 2004-2008 Capital Plan document.
Over 30 combined projects comprise CTA’s 2004-2008 capital program. Each project is evaluated based on
the needs of CTA’s customers, the program requirements of CTA’s transit operations and maintenance activities, and the operating efficiencies it contributes to CTA’s system. Rail System Projects are allocated a significantly larger proportion of CTA’s capital program funding due to the need to maintain the right of way; CTA buses operate on streets maintained by others. These capital projects for 2004 and beyond will address the most pressing needs of CTA’s bus and rail systems, passenger facilities and systemwide support networks, as constrained by the level of projected funding.
P R O P O S E D 2 0 0 4 - 2 0 0 8C A P I T A L I M P R O V E M E N T P R O G R A M
( m i l l i o n s o f d o l l a r s )
R a i l S y s t e m P r o j e c t s$ 2 , 0 0 0
B u s S y s t e m P r o j e c t s $ 2 1 1 . 8
S y s t e m w i d e P r o j e c t s$ 7 0 0
Total = $2.91 Billion
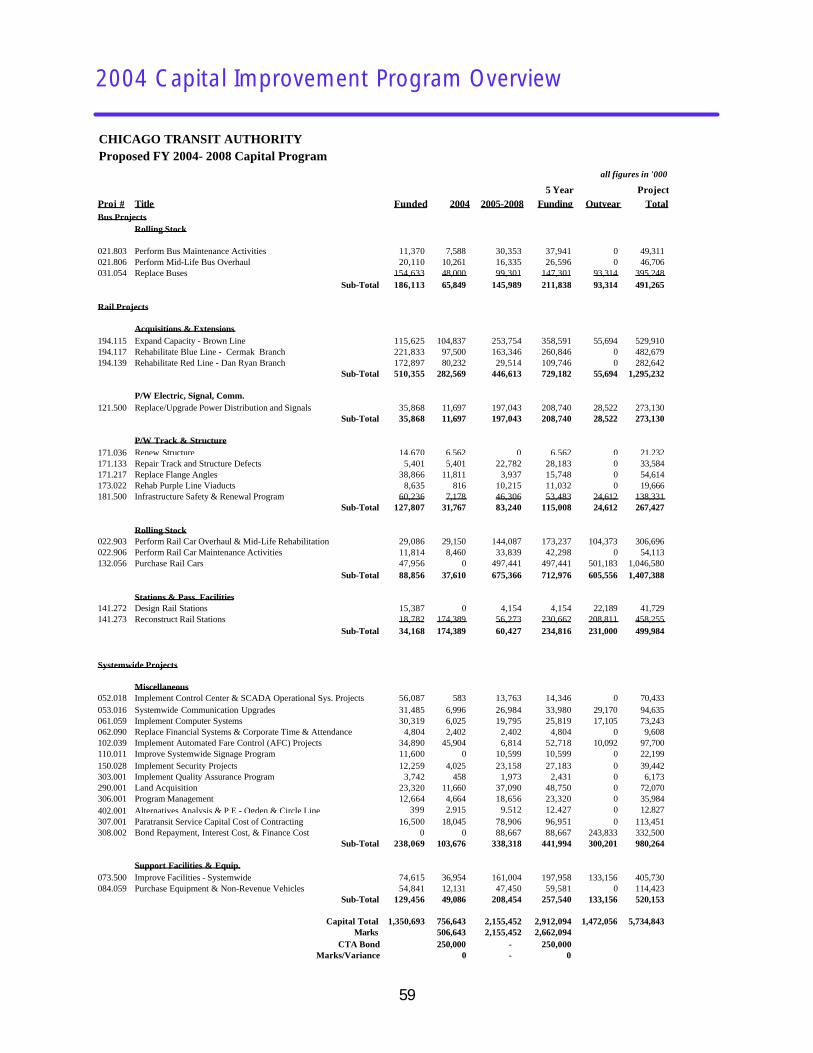
2004 Capital Improvement Program Overview
59
CHICAGO TRANSIT AUTHORITYProposed FY 2004- 2008 Capital Program
all figures in '000
5 Year ProjectProj # Title Funded 2004 2005-2008 Funding Outyear TotalBus Projects
Rolling Stock
021.803 Perform Bus Maintenance Activities 11,370 7,588 30,353 37,941 0 49,311021.806 Perform Mid-Life Bus Overhaul 20,110 10,261 16,335 26,596 0 46,706031.054 Replace Buses 154,633 48,000 99,301 147,301 93,314 395,248
Sub-Total 186,113 65,849 145,989 211,838 93,314 491,265
Rail Projects
Acquisitions & Extensions194.115 Expand Capacity - Brown Line 115,625 104,837 253,754 358,591 55,694 529,910194.117 Rehabilitate Blue Line - Cermak Branch 221,833 97,500 163,346 260,846 0 482,679194.139 Rehabilitate Red Line - Dan Ryan Branch 172,897 80,232 29,514 109,746 0 282,642
Sub-Total 510,355 282,569 446,613 729,182 55,694 1,295,232
P/W Electric, Signal, Comm.121.500 Replace/Upgrade Power Distribution and Signals 35,868 11,697 197,043 208,740 28,522 273,130
Sub-Total 35,868 11,697 197,043 208,740 28,522 273,130
P/W Track & Structure171.036 Renew Structure 14,670 6,562 0 6,562 0 21,232171.133 Repair Track and Structure Defects 5,401 5,401 22,782 28,183 0 33,584171.217 Replace Flange Angles 38,866 11,811 3,937 15,748 0 54,614173.022 Rehab Purple Line Viaducts 8,635 816 10,215 11,032 0 19,666181.500 Infrastructure Safety & Renewal Program 60,236 7,178 46,306 53,483 24,612 138,331
Sub-Total 127,807 31,767 83,240 115,008 24,612 267,427
Rolling Stock022.903 Perform Rail Car Overhaul & Mid-Life Rehabilitation 29,086 29,150 144,087 173,237 104,373 306,696022.906 Perform Rail Car Maintenance Activities 11,814 8,460 33,839 42,298 0 54,113132.056 Purchase Rail Cars 47,956 0 497,441 497,441 501,183 1,046,580
Sub-Total 88,856 37,610 675,366 712,976 605,556 1,407,388
Stations & Pass. Facilities141.272 Design Rail Stations 15,387 0 4,154 4,154 22,189 41,729141.273 Reconstruct Rail Stations 18,782 174,389 56,273 230,662 208,811 458,255
Sub-Total 34,168 174,389 60,427 234,816 231,000 499,984
Systemwide Projects
Miscellaneous052.018 Implement Control Center & SCADA Operational Sys. Projects 56,087 583 13,763 14,346 0 70,433053.016 Systemwide Communication Upgrades 31,485 6,996 26,984 33,980 29,170 94,635061.059 Implement Computer Systems 30,319 6,025 19,795 25,819 17,105 73,243062.090 Replace Financial Systems & Corporate Time & Attendance 4,804 2,402 2,402 4,804 0 9,608102.039 Implement Automated Fare Control (AFC) Projects 34,890 45,904 6,814 52,718 10,092 97,700110.011 Improve Systemwide Signage Program 11,600 0 10,599 10,599 0 22,199150.028 Implement Security Projects 12,259 4,025 23,158 27,183 0 39,442303.001 Implement Quality Assurance Program 3,742 458 1,973 2,431 0 6,173290.001 Land Acquisition 23,320 11,660 37,090 48,750 0 72,070306.001 Program Management 12,664 4,664 18,656 23,320 0 35,984402.001 Alternatives Analysis & P E - Ogden & Circle Line 399 2,915 9,512 12,427 0 12,827307.001 Paratransit Service Capital Cost of Contracting 16,500 18,045 78,906 96,951 0 113,451308.002 Bond Repayment, Interest Cost, & Finance Cost 0 0 88,667 88,667 243,833 332,500
Sub-Total 238,069 103,676 338,318 441,994 300,201 980,264
Support Facilities & Equip.073.500 Improve Facilities - Systemwide 74,615 36,954 161,004 197,958 133,156 405,730084.059 Purchase Equipment & Non-Revenue Vehicles 54,841 12,131 47,450 59,581 0 114,423
Sub-Total 129,456 49,086 208,454 257,540 133,156 520,153
Capital Total 1,350,693 756,643 2,155,452 2,912,094 1,472,056 5,734,843Marks 506,643 2,155,452 2,662,094
CTA Bond 250,000 - 250,000 Marks/Variance 0 - 0
2004 Capital Improvement Program Overview
60
CTA has made significant improvements to its bus fleet. The completion of the overhaul of 490 TMC buses will ensure on-time reliable service to our bus riders. Bike racks have been installed on all CTA buses providing another enhanced amenity to our customers. By the end of 2003, all CTA buses will be also equipped with protective deflectors.
The Bus System The Chicago Transit Authority operates approximately 1,993 buses, making over 24,031 weekday trips on 143 routes, providing over 1 million rides on a typical weekday. Each customer who boards a bus at one of over 12,000 bus stops located throughout CTA’s service area expects reliable service that is on-time, clean, safe, and friendly. The backbone of the bus system is the bus fleet. The system’s success depends on CTA’s ability to renew, maintain and operate the bus fleet.
Bus Rolling Stock CTA’s commitment to its customers continues by providing new, air conditioned, and fully accessible buses. A total of 226 new North American Bus Industries articulated, fully accessible, buses are scheduled to be delivered and placed into service throughout 2003 and 2004. In the last five years, CTA has made significant progress towards its goal of having its entire bus fleet air conditioned and fully accessible. In the next five years, CTA plans to spend over $147 million on additional purchases of new low floor fully accessible air-conditioned buses. By year-end 2004, CTA will have its entire bus fleet air conditioned and fully accessible. These new buses will replace models that entered service in 1991 and later. Replacing this outdated equipment will increase the comfort for thousands of CTA customers.
The bus preventative maintenance program continues to improve service through regular replacement of major mechanical components subject to extensive wear. With fewer road calls and fewer buses taken out of service due to mechanical problems, CTA bus service is more reliable. CTA plans to spend $26 million in 2004-
2008 to conduct mid-life overhauls on the bus fleet. CTA will continue bus overhaul initiatives in 2004 to the Flxible (Series 6000) buses. Beyond 2004 CTA will begin the mid-life rehabilitation of the Nova (Series 6400) buses. With a projected service life of 12-13 years, CTA’s plan calls for a complete overhaul of a bus approximately five to seven years after it enters service. The bus overhaul program ensures that CTA’s bus fleet is kept in a state of good repair to service CTA’s customers.
Other customer-focused improvements to CTA’s existing buses are also on the capital agenda. CTA has completed Operation Clearview on the bus fleet. A protective plastic coating minimizes damage done to window glass by vandals. Clearview has also funded the installation of security video cameras and recorders on the bus fleet and has been successfully completed. CTA is also installing an automated bus
announcement system on the bus fleet. CTA will also continue the bus preventive maintenance program aimed at reducing costs and improving service. Unscheduled maintenance, required by the failure of a bus in service, disrupts operations and results in dissatisfied customers.
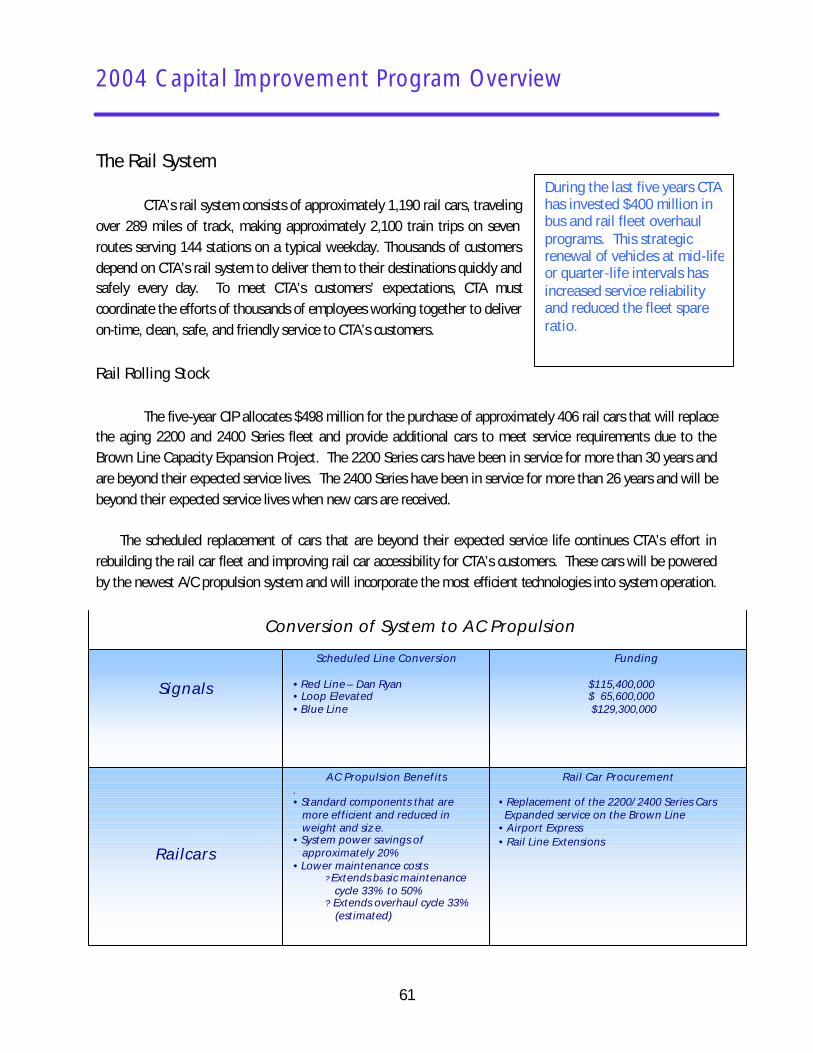
2004 Capital Improvement Program Overview
61
The Rail System CTA’s rail system consists of approximately 1,190 rail cars, traveling over 289 miles of track, making approximately 2,100 train trips on seven routes serving 144 stations on a typical weekday. Thousands of customers depend on CTA’s rail system to deliver them to their destinations quickly and safely every day. To meet CTA’s customers’ expectations, CTA must coordinate the efforts of thousands of employees working together to deliver on-time, clean, safe, and friendly service to CTA’s customers. Rail Rolling Stock
The five-year CIP allocates $498 million for the purchase of approximately 406 rail cars that will replace the aging 2200 and 2400 Series fleet and provide additional cars to meet service requirements due to the Brown Line Capacity Expansion Project. The 2200 Series cars have been in service for more than 30 years and are beyond their expected service lives. The 2400 Series have been in service for more than 26 years and will be beyond their expected service lives when new cars are received.
The scheduled replacement of cars that are beyond their expected service life continues CTA’s effort in rebuilding the rail car fleet and improving rail car accessibility for CTA’s customers. These cars will be powered by the newest A/C propulsion system and will incorporate the most efficient technologies into system operation.
Rail Car Procurement • Replacement of the 2200/ 2400 Series Cars Expanded service on the Brown Line • Airport Express • Rail Line Extensions
AC Propulsion Benefits . • Standard components that are more efficient and reduced in weight and siz e. • System power savings of approximately 20% • Lower maintenance costs ? Extends basic maintenance cycle 33% to 50% ? Extends overhaul cycle 33% (estimated)
Railcars
Funding
$115,400,000 $ 65,600,000
$129,300,000
Scheduled Line Conversion
• Red Line – Dan Ryan • Loop Elevated • Blue Line
Signals
Conversion of System to AC Propulsion
During the last five years CTA has invested $400 million in bus and rail fleet overhaul programs. This strategic renewal of vehicles at mid-life or quarter-life intervals has increased service reliability and reduced the fleet spare ratio.
2004 Capital Improvement Program Overview
62
CTA’s preventive maintenance program raises the level of commitment to overhaul railcars. Through December of 2002, forty-two Series 3200 railcars have received a quarter life overhaul and Series 2400 car Cam Group replacements are underway. In 2003, life-extending overhaul work will begin on Series 2200 and 2400 railcars while Series 3200 overhaul and 2400 Cam group work will continue.
CTA’s 2004-2008 capital program also sets aside $215 million in
projected funding during the next five years for the overhaul and upgrade of CTA’s rail fleet. Mid-life and quarter-life rehabilitation returns these valuable assets to comfortable, reliable service for CTA customers. CTA will continue overhaul initiatives in 2004 for 2400 and 2600 Series rail cars and the continuation of the quarter-life overhaul of the 3200 Series rail cars. Beyond 2004 CTA will begin the mid-life rehab of the 3200 Series rail cars.
Major New Start Projects on Blue and Brown Lines Using TEA-21 and Illinois FIRST funds, the reconstruction of the
Blue Line’s Cermak (Douglas) Branch will continue into 2004. This largest CTA capital project is on budget and on-time. In addition to funds already spent, a total of $260 million is projected to be spent through 2006. This project includes the reconstruction of eight elevated stations and over five miles of elevated structure and trackwork, as well as the purchase and installation of new signal/communications equipment, plus miscellaneous work on the right-of-way and track. Funding is also provided for reconstruction of the Paulina Connector as a two-track railroad. The Paulina Connector is located on the elevated section of railroad that connects the Lake street segment of the Green Line to the Blue Line at Paulina where the Cermak Branch joins the Forest Park Branch. Reconfiguration of trackwork at this location will provide CTA rail operations greater operating flexibility and will result in added capacity to the existing rail system. The Paulina Connector is the first phase in a future three-phase project implementing the Circle Line. The Circle Line project calls for adding three segments of new track and eleven new or rebuilt stations to CTA’s system. The 6.6 miles of new elevated and subway tracks would allow CTA to operate a new cross town route, which would significantly reduce travel times between CTA and Metra stations throughout the city and region. CTA will begin an alternatives analysis in FY 2004 for this project to meet federal requirements.
CTA is planning to expand capacity on the Brown (Ravenswood) Line. Ridership on the Brown Line has
exceeded both projections and the level that can be supported by current station and signal infrastructure. The capital budget provides $104.8 million in 2004, in addition to $115.6 million previously provided. Current projections estimate an additional $358.6 million will be allocated to the Brown Line expansion over the next five years and future funds of $56 million beyond 2008 to complete this project, with a total project budget of $530 million. This project will extend station platforms at 18 stations to accommodate eight-car trains and increase capacity by 33 percent. Sixteen stations will be reconstructed, of which thirteen will have elevators installed to provide improved station accessibility for all customers. The other three are at-grade and will be
2004 Capital Improvement Program Overview
63
The Dan Ryan (Red) Line serves over 51,000 passengers per weekday over nine stations. Dan Ryan rehabilitation will replace and/or upgrade substations, signals, communications, and rail stations. Renovated stations will provide greater access to nearby street locations, improved bus to rail transfers, and enhancement of variety of passenger amenities.
Howard Station is the last of the Key Stations to be upgraded to bring it into compliance with ADA requirements. In addition to accessibility improvement, this station reconstruction will enhance customers’ waiting facilities, platforms, and the fare collection areas.
made accessible through the use of ramps. Signal, electrical and communications upgrades will be made as well. Clark Junction will be rehabilitated prior to the beginning of the Brown Line Capacity Expansion project. Clark Junction is located where the Brown, Purple and Red Line trains merge, just north of Belmont Station. The rehabilitation effort consists of replacing sections of track, installing special track work, and upgrading third rail power, communications and signal systems.
Other Major Rail Initiatives: Red (Dan Ryan) Line Rehabilitation and O’Hare Line Improvements
The Dan Ryan Branch of the Red Line has not had any major rehabilitation work since the branch was built over thirty years ago. This project will provide for rail station upgrades, reconstruction of a bus bridge and bus turnarounds, as well as track and signal system replacement. The 2004-2008 capital program allocates $80.2 million in 2004 for continuing design and construction work and $29.5 million to complete construction in FY2005. The total project cost is $283 million.
In 2004-2008, $139 million has been provided to prepare the Blue Line for future express service to O’Hare Airport. This upgrade includes both track and signal upgrades for the Congress/Dearborn Subway and track upgrades on the section from Addison to O’Hare. This upgrade improves service reliability for all Blue Line customers. In
addition, the initial phase of this project includes $128.7 million for reconstruction of the Washington Station on the Blue and Red Lines to allow for future airport express service.
In addition to the improvements realized through the reconstruction of the Cermak (Douglas) Branch of the Blue Line, the Brown Line and the Red Line (Dan Ryan Branch) projects, $31.7 million will be budgeted in 2004 to provide improvements and upgrades to CTA’s rail system infrastructure. The Main Street viaduct on the Evanston Purple Line will be reconstructed in 2004. The design and reconstruction of an additional Evanston Purple Line viaduct is also included in the CIP. Footwalks used by maintenance staff and by passengers in case of emergencies will be replaced or renewed. Right-of-way, ties, track, and structure will be replaced; eliminating slow zones and maintaining heightened service standards. CTA will also replace and upgrade power distribution and support structures for $40.4 million over the five-year plan using a recently completed System Master Plan. Train movement through the heart of the
2004 Capital Improvement Program Overview
64
Scheduled for replacement in the 5 Year CIP is the 77th Street Garage. This operating garage houses 261 buses and is located within the South Shops Heavy Maintenance Facility. The buildings to be replaced on this site include some which were originally built in the 1900’s as trolley car barns. Replacement of these inefficient buildings will greatly facilitate provision of bus service to our customers.
Loop, controlled by a signal territory including both Tower 12 and Tower 18, is also slated for $62.5 million over five years for rehabilitation and upgrade. The structural steel elements used to support CTA’s world famous elevated track will be rehabilitated in locations throughout the system.
In the 2004-2008 program, CTA will spend $42.6 million to reconstruct Howard Station on the Red Line. Design will be completed during 2003 with construction to follow in 2004 and 2005. This is the last of the Key Stations outside of the current line rehabilitations that have not yet been brought into compliance with the ADA.
Systemwide Improvements The 2004 Budget includes an additional $103.6 million allocated to various projects, which directly or
indirectly support CTA’s service delivery. These projects improve the operation of CTA’s Control Center, upgrade communications systems, manage information technology, upgrade CTA’s financial systems and provide critical management information and operational support to CTA’s bus and rail fleets. Over the five-year program, $33.9 million is included for communications projects to enhance the safety and security of CTA’s customers and CTA’s employees.
In the 2004-2008 program, CTA provides approximately $43.5 million for design and replacement of aging fare boxes that are beyond their useful lives. This project continues CTA’s efforts in automating the fare collection system to provide faster passenger entry and access to the transit system. An additional $2.3 million is allocated in 2004 to fund the continued implementation of the Chicago Card. This project will enhance CTA’s fare media for the convenience of CTA’s customers. These rechargeable plastic cards are embedded with a special computer chip, which tracks the value of the card. They can be touched to the turnstile or farebox rather than inserted, speeding customers to their destinations. Computer software upgrades will facilitate customer use of their cards.
Facility Improvements CTA will spend $37 million on facility improvements in 2004, including upgrades to bus facilities, rail
station amenities, and various support facilities throughout the system. In the five-year program, $197.9 million is allocated to construct or improve CTA support facilities.
The 2004-2008 program includes $8.1 million to repair and
renovate the elevators and escalators in CTA stations, including escalators on the Red Line. Escalators facilitate the transfer of customers from station to street and in the downtown area, from one rail line to another. Many of these escalators exceed the average service life of 20 years while others need extensive
2004 Capital Improvement Program Overview
65
CTA plans to issue $250 million in Capital Bonds in 2004. These bonds will be backed by future federal formula funds, and will be utilized for long life assets. Without these funds, major projects including the Dan Ryan Rehabilitation, Howard Station, and garage replacement will be significantly delayed. Bond financing will be repaid with future federal funds matched entirely with CTA generated sources; no RTA funds will be utilized for this purpose.
mechanical overhaul to bring them to a state of good repair. Elevators and escalators help facilitate access to CTA’s rail system for CTA’s customers with disabilities. Many of CTA’s elevators have exceeded their expected service lives, making replacement parts hard to obtain. Once these projects are complete, CTA customers will find a newly accessible experience awaiting them at their neighborhood rail stations.
Looking Ahead
CTA is dedicated to providing on-time, clean, safe, and friendly service; but much remains to be done
to bring CTA’s system to a state of good repair. The 2004-2008 Capital Improvement Program projects $2.91 billion will be available over the next five years, but that will only be the first step.
Completely rebuilding CTA’s system means addressing over $2.05 billion in unfunded capital needs over the next five years. Strategic investment is needed in railcar replacement, traction power system modernization, right of way, viaduct renewal, escalators and elevators in rail stations, and upgrade of critical communications systems. An additional $4.2 billion is needed over the following five-year period for continued progress toward a state of good repair. Robust population growth continues to prime local economic growth, but brings traffic congestion, transportation gridlock and the need for transit service expansion. Potential future expansion projects such as Circle Line, Ogden Avenue, and Orange, Blue, Red, and Yellow Line extensions will be predicated on additional capital funding through federal and local sources.
CTA will work tirelessly to bridge the funding gap between today’s
needs and tomorrow’s increasing demands for service. 2004 represents the last year of funding under Illinois FIRST; and will be the first year funded under the replacement for TEA-21. Thanks to the strong support of Mayor Richard M. Daley, Governor Rod R. Blagojevich, House Speaker J. Dennis Hastert, the Illinois Congressional delegation, and the General Assembly, these programs have helped advance CTA’s efforts to rehabilitate rail lines and to renew CTA’s bus fleet and incorporate or expand preventive maintenance programs.
With every dollar of new capital funding obtained, with every capital dollar well spent, and with each
project completed, CTA comes closer to realizing its goal of providing high quality service for its customers. When one of the new Nova buses stops to pick up customers, or a fully overhauled 2600 Series rail car pulls into a newly rebuilt station, CTA’s customers experience the results of CTA’s capital program. They see first hand that CTA is providing quality, affordable transit services that link people, jobs and communities.
Appendices
Results-Oriented
We will focus on getting the job done and will derive personal satisfaction from the service we provide.
Chicago Transit Authority
1 History of the Agency
66
Transit in Chicago: Creation of CTA The Chicago Transit Authority (“CTA”), an independent government agency, was formed when the Illinois General Assembly passed the Metropolitan Transit Authority Act in 1945. In the same year, the City of Chicago passed an ordinance granting the CTA the exclusive right to own and operate a unified local transportation system. Voters in a referendum passed the Act and Ordinance on June 4, 1945. In the years between the two World Wars, the viability of privately owned and operated mass transportation in Chicago was in doubt. At the time, two of the three transit companies in Chicago were facing bankruptcy as repeated restructuring efforts failed. Cash shortages were causing the delay of essential capital investment. The CTA began operating in 1947 when it issued $105 million in revenue bonds to purchase the Chicago Surface Lines and the Chicago Rapid Transit Company. Through additional bond issues, the Chicago Motor Coach Company and a portion of the Chicago Milwaukee St. Paul and Pacific Railroad right-of-way were added to the CTA in 1952 and 1953, respectively. Chicago Surface Lines 1859 marked the beginning of public transit in Chicago. Early service was horse-drawn. In 1882, the Chicago City Railway obtained the exclusive rights to operate San Francisco-style cable cars in Chicago. Cable cars gave way to innovations in electric traction. Electric-powered streetcars replaced the last cable and horse-drawn cars in 1906. Streetcar lines operated along most major streets in Chicago. On February 1, 1914, five streetcar companies united under a single management: the Chicago Surface Lines. At its peak, the Chicago Surface Lines operated along 1,100 miles of tracks; it was the largest and most heavily used streetcar system in the world. Chicago Motor Coach Company Buses were first used in Chicago in 1917 with the creation of the Chicago Motor Bus Company. Bus use was limited to Chicago’s boulevards and parks. The Chicago Motor Coach Company succeeded the company in 1922. Chicago Rapid Transit Company The Chicago and South Side Rapid Transit Railroad Company opened on June 6, 1892, bringing elevated train service to Chicago. At the turn of the century, four separate transit railroads operated in Chicago. The first trains, powered by steam, were quickly converted to electricity. Elevated tracks were built along available right-of-ways often above alleys and less heavily used streets. The opening of the Loop ‘L’ in 1897 connected rapid transit lines serving the north, south, and west sides of Chicago. The rapid transit companies formed a cost-saving trust in 1911 and later, in 1924, merged creating the Chicago Rapid Transit Company. To ease traffic congestion, the US Department of Interior, the Public Works Administration, and the City of Chicago financed the State Street Subway that opened in 1943 and the Dearborn Street Subway that opened in 1951.
1 History of the Agency
67
The Congress Branch During the 1950’s and 60’s, Chicago expressways were expanded to ease traffic congestion. In 1958 the Congress branch opened along the median of the newly expanded Congress (Eisenhower) expressway. The Congress branch extended east-west from Forest Park, IL to the loop with connection to the northwest subway at the Dearborn station. Regional Transportation Authority By the early 1970’s the popularity of car travel and declining rider levels threatened the fiscal stability of the three public transportation agencies. In 1974, the Illinois General Assembly created the Regional Transportation Authority (RTA) as a fiscal and policy oversight agency committed to providing an efficient and effective public transportation system. The RTA continues to provide annual fiscal oversight to CTA, Metra, and Pace today. Skokie Swift In 1964 the CTA partnered with federal planners to create the first “light rail” service, the Skokie Swift. The Skokie Swift operated on track lines purchased by the CTA from the Chicago North Shore & Milwaukee Railway. The Skokie Swift quickly became a popular rail shuttle and also served as a suburban and inter-city bus hub. Kennedy / O’Hare The CTA responded to changing demographics during the 1970’s by expanding the northwest subway to Jefferson Park from Logan Square. In 1983, the subway was further extended along the Kennedy Expressway median to River (Mannheim) Road. In 1984, the northwest transit extension was completed at O’Hare airport with a station within the airport terminal. Loop ‘ L’ Track and Subway Consolidation In 1993 the Dan Ryan branch, formerly linked to the Englewood and Jackson Park lines, was linked with the Howard line. The Lake to Englewood-Jackson Park lines were moved from the Howard branch to the loop elevated connection. Elevated loop connections were made more convenient with the Merchandise Mart station. “Orange” Midway Line The O’Hare terminal service proved so successful that transportation planners were encouraged to build a new elevated train service to the Southwest side to Midway Airport. The Midway “Orange” line was completed in 1993 linking the downtown elevated loop to the southwest side airport, providing improved transportation to the southwest side. Neighborhood Revitalization The CTA celebrated the re-opening of the rehabilitated Green Line in 1996, improving the service to our customers on the west and south sides of Chicago. In 1997, the CTA revitalized its services with a mission to provide on-time, clean, safe and friendly bus and rail service.
2 Transit Facts
68
Creation of CTA • The CTA was created by state legislation and began operating on October 1, 1947, after acquiring the
properties of the Chicago Rapid Transit Company and the Chicago Surface Lines. On October 1, 1952, the CTA became the sole operator of City of Chicago transit when it purchased the Chicago Motor Coach System.
CTA Governance • The CTA’s governing arm is the Chicago Transit Board, which consists of seven members. The Mayor of
Chicago appoints four, subject to the approval by the City Council and the Governor. The Governor, subject to the approval of the State Senate and the Mayor of Chicago, appoints three.
• In 1974, the Regional Transportation Authority (RTA) was created by state legislation. The RTA serves as CTA’s fiscal oversight agency.
Service Area & Population • 220 square miles of Chicago and 40 nearby suburbs
• The service area has 3.8 million people Ridership • 452.7 million trips projected in 2004 • Over 1.5 million trips per weekday Bus Service • 1,993 buses travel over 143 routes • Routes cover 2,290 miles, with over 12,324 bus stops Rail Service • 1,190 train cars travel over seven routes • There are 289 miles of track, including yard track Paratransit Service • The CTA contracts with three carriers and taxicab companies that provide door-to-door service for riders
with disabilities • 1,931,266 trips projected in 2004
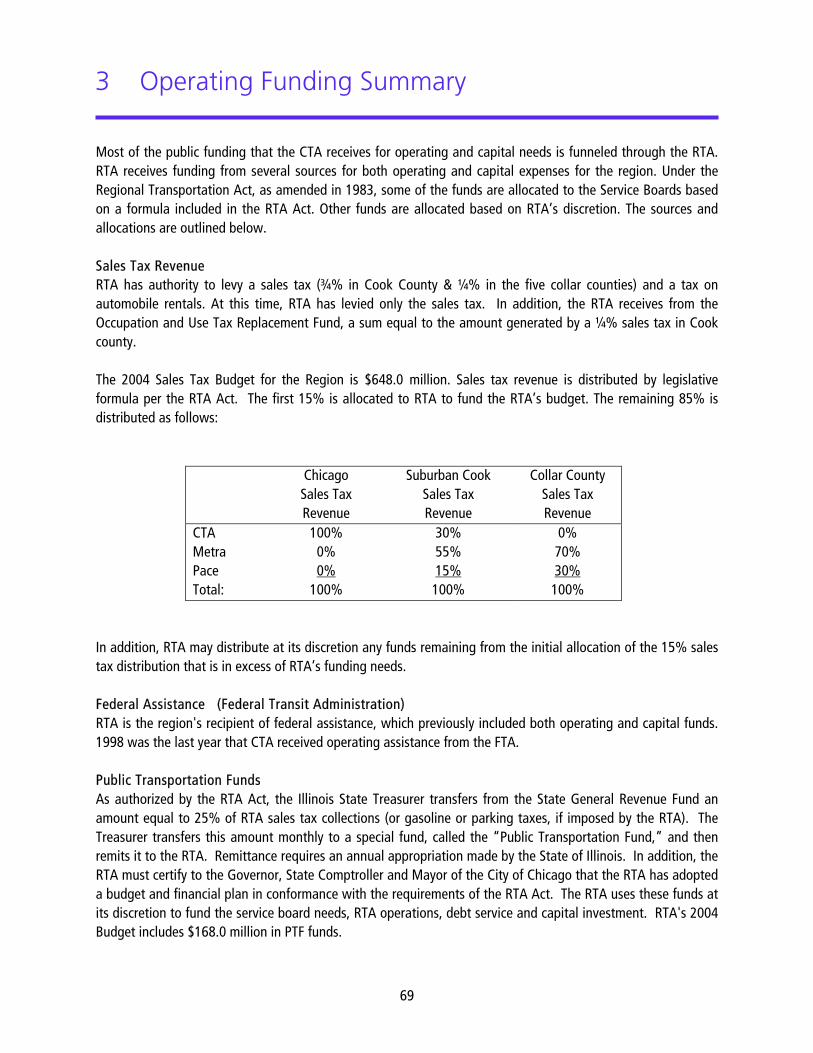
3 Operating Funding Summary
Most of the public funding that the CTA receives for operating and capital needs is funneled through the RTA. RTA receives funding from several sources for both operating and capital expenses for the region. Under the Regional Transportation Act, as amended in 1983, some of the funds are allocated to the Service Boards based on a formula included in the RTA Act. Other funds are allocated based on RTA’s discretion. The sources and allocations are outlined below. Sales Tax Revenue RTA has authority to levy a sales tax (¾% in Cook County & ¼% in the five collar counties) and a tax on automobile rentals. At this time, RTA has levied only the sales tax. In addition, the RTA receives from the Occupation and Use Tax Replacement Fund, a sum equal to the amount generated by a ¼% sales tax in Cook county. The 2004 Sales Tax Budget for the Region is $648.0 million. Sales tax revenue is distributed by legislative formula per the RTA Act. The first 15% is allocated to RTA to fund the RTA’s budget. The remaining 85% is distributed as follows:
Chicago Sales Tax Revenue
Suburban Cook Sales Tax Revenue
Collar County Sales Tax Revenue
CTA 100% 30% 0% Metra 0% 55% 70% Pace 0% 15% 30% Total: 100% 100% 100%
In addition, RTA may distribute at its discretion any funds remaining from the initial allocation of the 15% sales tax distribution that is in excess of RTA’s funding needs. Federal Assistance (Federal Transit Administration) RTA is the region's recipient of federal assistance, which previously included both operating and capital funds. 1998 was the last year that CTA received operating assistance from the FTA.
Public Transportation Funds As authorized by the RTA Act, the Illinois State Treasurer transfers from the State General Revenue Fund an amount equal to 25% of RTA sales tax collections (or gasoline or parking taxes, if imposed by the RTA). The Treasurer transfers this amount monthly to a special fund, called the “Public Transportation Fund,” and then remits it to the RTA. Remittance requires an annual appropriation made by the State of Illinois. In addition, the RTA must certify to the Governor, State Comptroller and Mayor of the City of Chicago that the RTA has adopted a budget and financial plan in conformance with the requirements of the RTA Act. The RTA uses these funds at its discretion to fund the service board needs, RTA operations, debt service and capital investment. RTA's 2004 Budget includes $168.0 million in PTF funds.
69
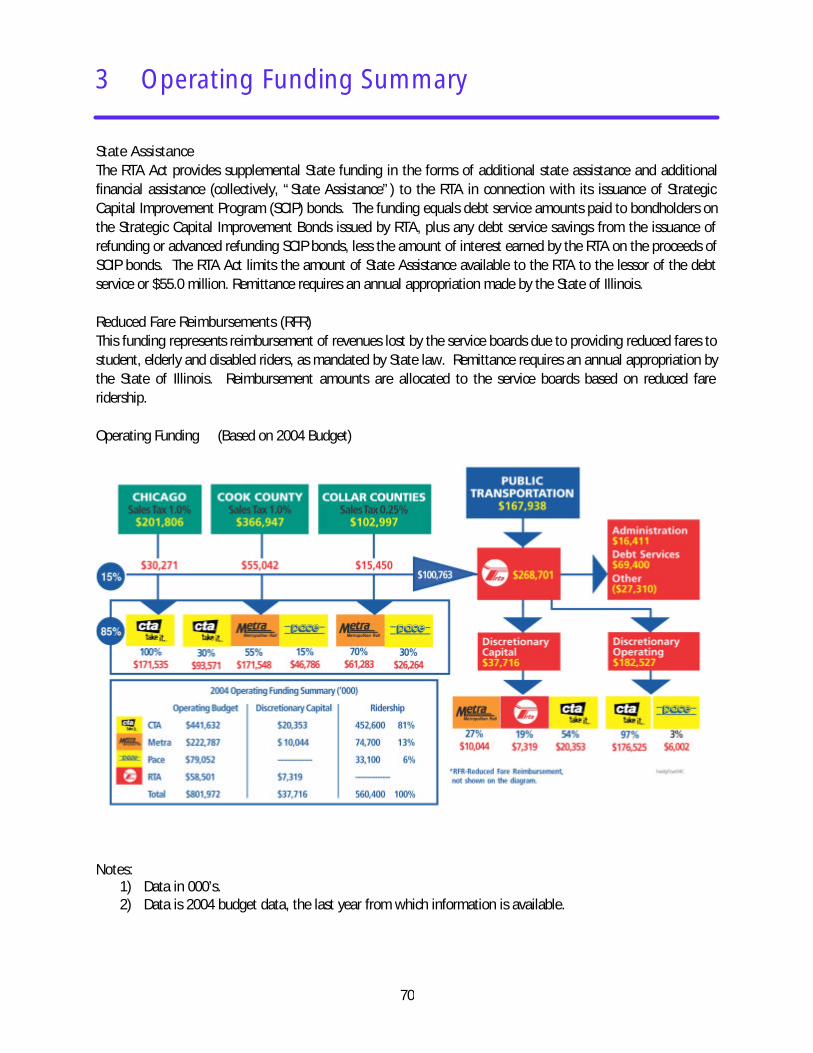
3 Operating Funding Summary
70
State Assistance The RTA Act provides supplemental State funding in the forms of additional state assistance and additional financial assistance (collectively, “State Assistance”) to the RTA in connection with its issuance of Strategic Capital Improvement Program (SCIP) bonds. The funding equals debt service amounts paid to bondholders on the Strategic Capital Improvement Bonds issued by RTA, plus any debt service savings from the issuance of refunding or advanced refunding SCIP bonds, less the amount of interest earned by the RTA on the proceeds of SCIP bonds. The RTA Act limits the amount of State Assistance available to the RTA to the lessor of the debt service or $55.0 million. Remittance requires an annual appropriation made by the State of Illinois. Reduced Fare Reimbursements (RFR) This funding represents reimbursement of revenues lost by the service boards due to providing reduced fares to student, elderly and disabled riders, as mandated by State law. Remittance requires an annual appropriation by the State of Illinois. Reimbursement amounts are allocated to the service boards based on reduced fare ridership. Operating Funding (Based on 2004 Budget)
Notes:
1) Data in 000’s. 2) Data is 2004 budget data, the last year from which information is available.
4 Capital Funding Summary
71
CTA’s capital needs are funded primarily by three agencies: the Federal Transit Administration of the United States Department of Transportation (FTA); the Illinois Department of Transportation (IDOT); and the Regional Transportation Authority (RTA). Funds are also provided from other local units of government who receive FTA/IDOT/RTA grants and contracts with the CTA for work. The majority of FTA funds come from two programs authorized by 49 U.S.C. Chapter 53, Sections 5309 and 5307 (formerly Sections 3 and 9, respectively, of the Federal Transit Act). On June 9, 1998, the Transportation Equity Act for the 21st Century (TEA-21) was signed into law. TEA-21 provided a six-year authorization of the Federal Transit Program. TEA-21 was due to expire on September 30, 2003. It is expected that Congress will act to either extend the current provisions of TEA-21 or pass a new authorization bill, which will replace TEA-21. A successor bill to TEA-21 would most likely continue many of its key provisions. FTA grants can pay for up to 80% of the cost of a capital project, with the remaining 20% usually funded by IDOT or the RTA. Through the passage of Illinois FIRST – a Fund for Infrastructure, Roads, Schools and Transit, (a five year public works program) - CTA secured the local matching funds necessary to obtain federal funding through TEA-21. Transit was allocated $2.0 billion dollars for bus, rail, and other public transit infrastructure needs under Illinois FIRST in Northeastern Illinois. CTA expects to receive approximately $2.7 billion from all sources to spend on capital needs for the period 2004-2008.
• Section 5309, "Capital Investment Program" authorizes grants under three programs. The Fixed Guideway Modernization program provides funding for modernization of existing rail transit systems, with funds allocated by statutory formula. The Bus Discretionary program allocates funding for bus and bus related projects allocated nationwide using a Congressional earmarking process. Finally, New Starts are authorized in this section, with annual Congressional appropriation and allocation to special projects designed to enhance or expand the capacity of existing transit systems or to begin new services.
• Section 3037, “Job Access and Reverse Commute Grants” authorizes grants for both reverse commute
projects, defined as transportation for suburban job opportunities, along with transportation to welfare recipients (individuals who receive or received aid under a state program funded under part A of Title IV of the Social Security Act) and eligible low-income individuals (those with family incomes at or below 150% of the poverty line). CTA received grants of $1.3 million from the discretionary program during 2003.
• Section 5307, "Urbanized Area Formula Program" authorizes grants for any capital, operating or
planning purpose (with operating use subject to a cap). Funds are allocated by statutory formula, to all qualifying urbanized areas in the country, with the amount based on Congressional authorization and appropriation. Transit systems in large urban areas, such as CTA, do not receive any operating grant funds, only capital.
4 Capital Funding Summary
72
The Congestion Mitigation and Air Quality Improvement Program (CMAQ), funds transit, highway, or non-traditional projects with the specific intent to improve the region's air quality. Programming decisions are made by the Chicago Area Transportation Study (CATS) and IDOT. CTA has been successful in pursuing CMAQ funds, having received over $61.6 million since 1992. The CTA can also receive grants from IDOT and RTA not tied to federal funding. Until the passage of Illinois FIRST, however, most of these funds were needed to match federal funds so as not to lose the opportunity of 80% federal grants. Transit funding under Illinois FIRST approximately equaled anticipated federal funding, meaning a significant number of non-federal funds exist. Non-federal funds come from several sources: l RTA bonds backed and funded with RTA revenue; l RTA “Strategic Capital Improvement Program (SCIP)” bonds are funded with revenues from Additional
State Assistance (ASA) and backed by RTA. ASA revenues from the State are capped at the lesser of the debt service or $55.0 million annually;
l IDOT Series B Transportation Bonds; l CTA’s fund balance which represents an operating budget surplus that can be used for capital projects
in later years; l Proceeds from innovative lease transactions.
Procedures
Each year, the local agencies involved in public transportation grant programs (primarily the City of Chicago, RTA and the three service boards - CTA, Metra and Pace) estimate the availability of Federal, State and local capital grant funds for the next five years, and how funds should be allocated among the agencies. (For example, CTA is allocated 50% of the $1.3 billion in SCIP debt capacity authorized in Illinois FIRST, and is usually allocated 58% of FTA, RTA Discretionary and IDOT funding.) Each agency then develops a capital program to use the expected funds to the best advantage. Precise allocations of FTA/IDOT/RTA funds are still subject to adjustment based on final agreements in this area as well as pending decisions regarding CMAQ funds. The funding marks used in this document are the best presently available. Capital grants take the form of contractual agreements between CTA and its respective funding agencies. Each grant agreement stipulates the work to be accomplished (scope) and corresponding budget. The usual practice is to fund several different items of work in each grant. The CTA cannot encumber or spend any funds on a capital project until written approval is received from each funding agency participating in that project. Approval generally takes the form of an executed grant agreement. A mix of FTA, IDOT and RTA funds in separate grant agreements provide for most of CTA’s capital projects. The rules governing budget detail, oversight, prior approval of certain actions, etc., vary from agency to agency. This results in a very complex administrative burden, as project activities must be reconciled with multiple sets of
4 Capital Funding Summary
73
requirements. Managing these requirements is important because the grant agreements give each funding agency broad powers of oversight, inspection and audit over all project activities, and the potential to disallow costs and require reimbursement, with interest, from the CTA. Procedures for funding capital differ significantly from those used for operating expenses. Whereas operating funds do not carry from year-to-year (though the CTA can retain a favorable budget balance for other purposes), capital grant agreements do not expire at year-end, but continue in force for several years. Because the grants are project-specific, rather than time-specific (i.e., limited in duration), and because capital projects often take years to complete, any given year's capital spending consists of expenditures from many grants, which may have originated either recently or several years ago.
5 Annual Budget Process
74
The Budget & Financial Plan Process The RTA Act requires the RTA Board to adopt a consolidated annual budget and two-year financial plan. The budgetary process contains three phases: budget development, budget adoption, and budget execution and administration. Budget Development Budget development begins each year in the middle of June with the Budget Call from the RTA. The Budget Call outlines the required budget information for the RTA, and provides economic assumptions for the region. The RTA's sales tax forecast is based on the most recent sales tax revenue estimate provided by the State Bureau of the Budget (BOB). The BOB is required to submit to the Regional Transportation Authority by July 1 of each year an estimate of Sales Tax Revenues to be received by the CTA (Authority) for the next fiscal year. The RTA uses this estimate and the sales tax growth rates to prepare the annual budget funding “Mark” and to estimate sales tax for the two years of the financial plan. Budget Adoption By the middle of August, CTA is required to submit a macro-level budget and a two-year financial plan to the RTA. By September 15, the RTA Board is required to set operating funding "Marks" for the three Service Boards. The "Marks" include estimates of available operating funding for the budget and financial plan, estimated cash flows and a required recovery ratio (the ratio or percentage of operating expenses that must be recovered from system-generated revenue) for the budget. Upon issuance of the budget "Mark," CTA revises its expenses and revenues to conform to the "Marks." CTA then makes its budget document available to the public. The statute requires documents be available for public inspection 21 days prior to public hearings. After the public hearings, the budget is presented at the November Cook County Board meeting. Then the CTA Board incorporates any changes and adopts the budget and two-year financial plan. By November 15, CTA is required to submit to RTA its detailed budget and financial plan that conforms to the Budget Marks set by the RTA on September 15th. The RTA Board adopts the proposed budget and plan upon the approval of nine of the RTA's thirteen directors. The RTA is required to adopt the budget by December 31st if the budgets meet the RTA’s six criteria identified in the RTA Act. If the RTA Board does not approve the budget, the RTA Board cannot release any discretionary funds for the periods covered by the budget and financial plan except the proceeds of sales taxes due by formula to CTA. Budget Execution & Administration After the proposed budget and financial plan are adopted, the budget execution and administration phase begins. Detailed budgets of revenues and expenses calendarized for the 12 months of the budget year are forwarded to the RTA. CTA’s actual monthly financial performance is measured against the monthly budget and reported to the RTA Board. Amendment Process During this monitoring, changes may be required to the CTA's budget. The RTA might revise its sales tax forecast, which would mean less public funding. This in turn would require reduced spending to meet the
5 Annual Budget Process
75
revised funding “Mark” and Recovery Ratio. When the RTA amends a revenue or expense item of the budget because of changes in economic conditions, governmental funding, a new program, or other reasons, CTA has 30 days to revise its budget to reflect these changes. Depending on the type of request, the proposed amendment may be presented to one or more committees of the RTA Board for approval. The RTA’s Finance Committee, however, must approve all amendments before they are recommended to the RTA Board. The RTA Board ultimately approves or disapproves all proposals. The budget may need to be amended if CTA is found not in compliance with the budget for a particular quarter based upon its financial condition and results of operations. The RTA Board, by a vote of nine members, may require CTA to submit a revised financial plan and budget, which show that the Marks will be met in a time period of less than four quarters. If the RTA Board determines that the revised budget is not in compliance with the Marks, the RTA will not release any money except the sales taxes that are due under the statutory allocation formula. The funds the RTA can withhold include Public Transportation Fund (PTF), discretionary sales tax and other state funding. If the Authority submits a revised financial plan and budget which show the Marks will be met within a four quarter period, then the RTA Board shall continue to release funds.
6 Accounting System & Budgetary Control
76
The Chicago Transit Authority ("CTA") was formed in 1945 pursuant to the Metropolitan Transportation Authority Act passed by the Illinois Legislature. The CTA was established as an independent governmental agency (an Illinois municipal corporation) "separate and apart from all other government agencies" to consolidate Chicago's public and private mass transit carriers. As such, the operations of the CTA are accounted for on a proprietary fund basis. This basis is used when operations are financed and operated in a manner similar to private business enterprises, where the intent of the governing body is that the costs of providing services to the general public on a continuing basis be financed or recovered primarily through user charges, and the periodic determination of revenues earned, costs incurred, and net income is appropriate. The accounts of the CTA are reported using the "flow of economic resources" (cost of services) measurement focus and the accrual basis of accounting. Under the "flow of economic resources” measurement focus, all assets and liabilities are included on the balance sheet. Fund equity consists of contributed capital and accumulated deficit. Under the accrual basis of accounting, revenues are recognized when earned and expenses are recognized when incurred. In 1995 the CTA changed its financial reporting to a calendar year. Prior to 1995, the CTA operated on a 52-week fiscal year composed of four quarters of "four week, four week, and five week" periods. Periodically a 53-week fiscal year was required to keep the fiscal year aligned with the calendar. Management of the Authority is responsible for establishing and maintaining an internal control system designed to ensure that the assets of the Authority are protected from loss, theft or misuse and to ensure that adequate accounting data are compiled to allow for the preparation of financial statements in conformity with generally accepted accounting principles. The internal control system is designed to provide reasonable, but not absolute, assurance that these objectives are met. The concept of reasonable assurance recognizes that the cost of internal control should not exceed the benefits likely to be derived, and that the evaluation of cost and benefits requires estimates and judgments by management. All internal control evaluations occur within the above framework. We believe that the Authority's internal accounting controls are reasonable under the existing budgetary constraints and adequately safeguard assets and provide reasonable assurance of proper recording of all financial transactions. As a recipient of federal, state, and RTA financial assistance, the Authority is also responsible for ensuring that the internal control system is adequate to ensure compliance with applicable laws and regulations related to those programs. This internal control system is subject to periodic evaluation by management and the internal audit staff of the Authority, as well as an annual audit by an independent accounting firm. The results of the Authority's prior year-end audit provided no instances of material weaknesses in the internal control system or significant violations of applicable laws and regulations. The CTA is required by the Regional Transportation Act to submit for approval an annual budget to the RTA prior to the commencement of each fiscal year.
6 Accounting System & Budgetary Control
77
The Metropolitan Transportation Authority Act requires that no expenditures in excess of budget be made without approval of the Chicago Transit Board. The budget is prepared on a basis consistent with generally accepted accounting principles, except for the exclusion of certain expenses which do not qualify under the Act for public funding, principally depreciation expense and pension expense in excess of actual pension contributions. The RTA funds the budgets of the Service Boards, rather than the actual Operating Expenses in excess of System-Generated Revenue. Favorable variances from budget remain as deferred operating assistance to the CTA, and can be used in future years with RTA approval. All annual appropriations lapse at fiscal year-end. The RTA monitors the CTA's performance against the budget on a quarterly basis, and if in the judgment of the RTA, this performance is not substantially in accordance with CTA's budget for such period, the RTA shall so advise the CTA. The CTA must, within the period specified by the RTA, submit a revised budget to bring the CTA into compliance with the budgetary requirements. The RTA must approve any amendments to the CTA’s budget requiring additional public funding, or a reduction to the recovery ratio. Budget amendments resulting in transfers between departments, or major budget line items, are also permitted. The Authority maintains budgetary controls to ensure compliance with legal provisions embodied in the annual budget appropriated by the Chicago Transit Board, and approved by the Regional Transportation Authority. The level of budgetary control (the level at which expenditures cannot legally exceed the appropriated amount) is established for Public Funding Required. The Authority also maintains a Position Control System, that allows the monitoring and controlling of the number of employees versus budgeted positions for every job that is not part of scheduled transit operations (which are controlled by hours, not positions).
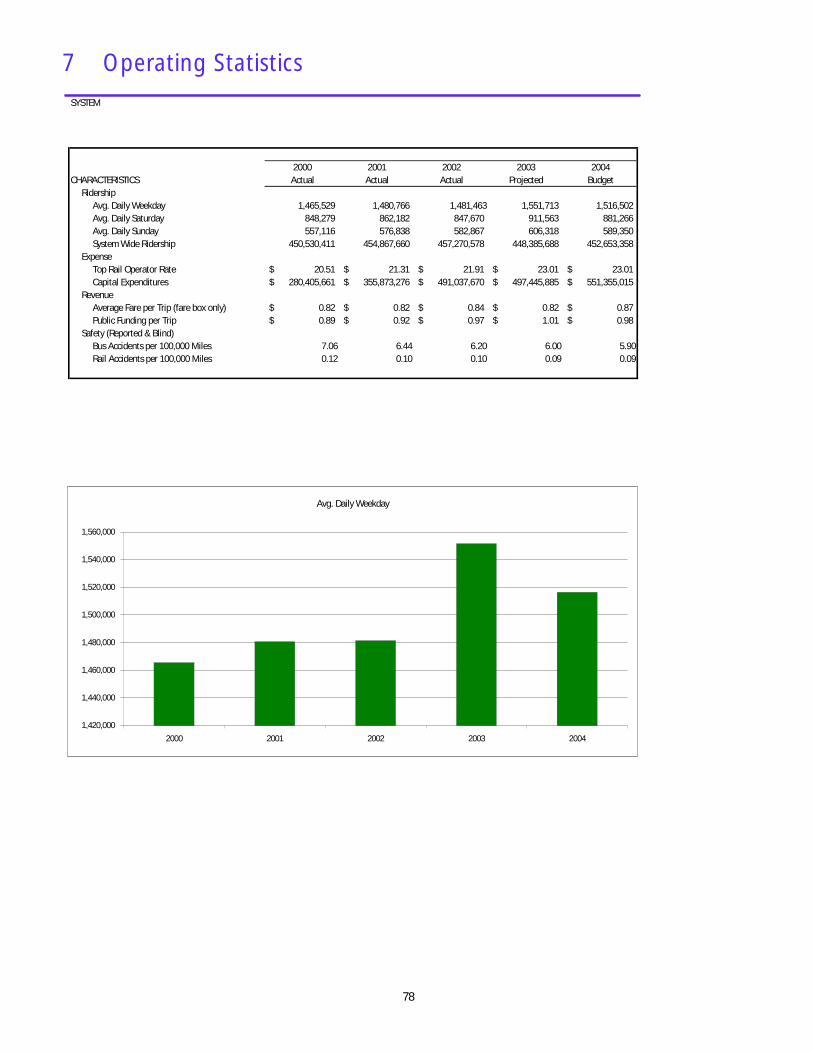
7 Operating StatisticsSYSTEM
2000 2001 2002 2003 2004CHARACTERISTICS Actual Actual Actual Projected Budget
RidershipAvg. Daily Weekday 1,465,529 1,480,766 1,481,463 1,551,713 1,516,502 Avg. Daily Saturday 848,279 862,182 847,670 911,563 881,266 Avg. Daily Sunday 557,116 576,838 582,867 606,318 589,350 System Wide Ridership 450,530,411 454,867,660 457,270,578 448,385,688 452,653,358
ExpenseTop Rail Operator Rate 20.51$ 21.31$ 21.91$ 23.01$ 23.01$ Capital Expenditures 280,405,661$ 355,873,276$ 491,037,670$ 497,445,885$ 551,355,015$
RevenueAverage Fare per Trip (fare box only) 0.82$ 0.82$ 0.84$ 0.82$ 0.87$ Public Funding per Trip 0.89$ 0.92$ 0.97$ 1.01$ 0.98$
Safety (Reported & Blind)Bus Accidents per 100,000 Miles 7.06 6.44 6.20 6.00 5.90Rail Accidents per 100,000 Miles 0.12 0.10 0.10 0.09 0.09
Avg. Daily Weekday
1,420,000
1,440,000
1,460,000
1,480,000
1,500,000
1,520,000
1,540,000
1,560,000
2000 2001 2002 2003 2004
78
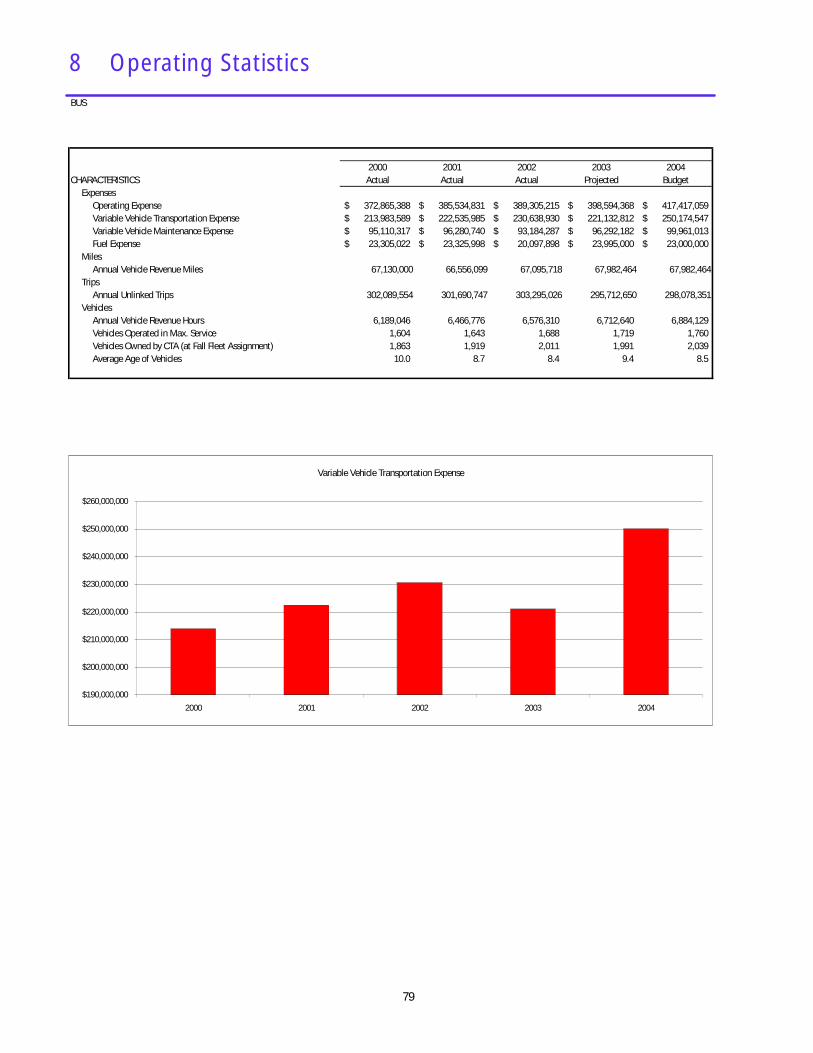
8 Operating StatisticsBUS
2000 2001 2002 2003 2004CHARACTERISTICS Actual Actual Actual Projected Budget
ExpensesOperating Expense 372,865,388$ 385,534,831$ 389,305,215$ 398,594,368$ 417,417,059$ Variable Vehicle Transportation Expense 213,983,589$ 222,535,985$ 230,638,930$ 221,132,812$ 250,174,547$ Variable Vehicle Maintenance Expense 95,110,317$ 96,280,740$ 93,184,287$ 96,292,182$ 99,961,013$ Fuel Expense 23,305,022$ 23,325,998$ 20,097,898$ 23,995,000$ 23,000,000$
MilesAnnual Vehicle Revenue Miles 67,130,000 66,556,099 67,095,718 67,982,464 67,982,464
TripsAnnual Unlinked Trips 302,089,554 301,690,747 303,295,026 295,712,650 298,078,351
VehiclesAnnual Vehicle Revenue Hours 6,189,046 6,466,776 6,576,310 6,712,640 6,884,129 Vehicles Operated in Max. Service 1,604 1,643 1,688 1,719 1,760Vehicles Owned by CTA (at Fall Fleet Assignment) 1,863 1,919 2,011 1,991 2,039Average Age of Vehicles 10.0 8.7 8.4 9.4 8.5
Variable Vehicle Transportation Expense
$190,000,000
$200,000,000
$210,000,000
$220,000,000
$230,000,000
$240,000,000
$250,000,000
$260,000,000
2000 2001 2002 2003 2004
79
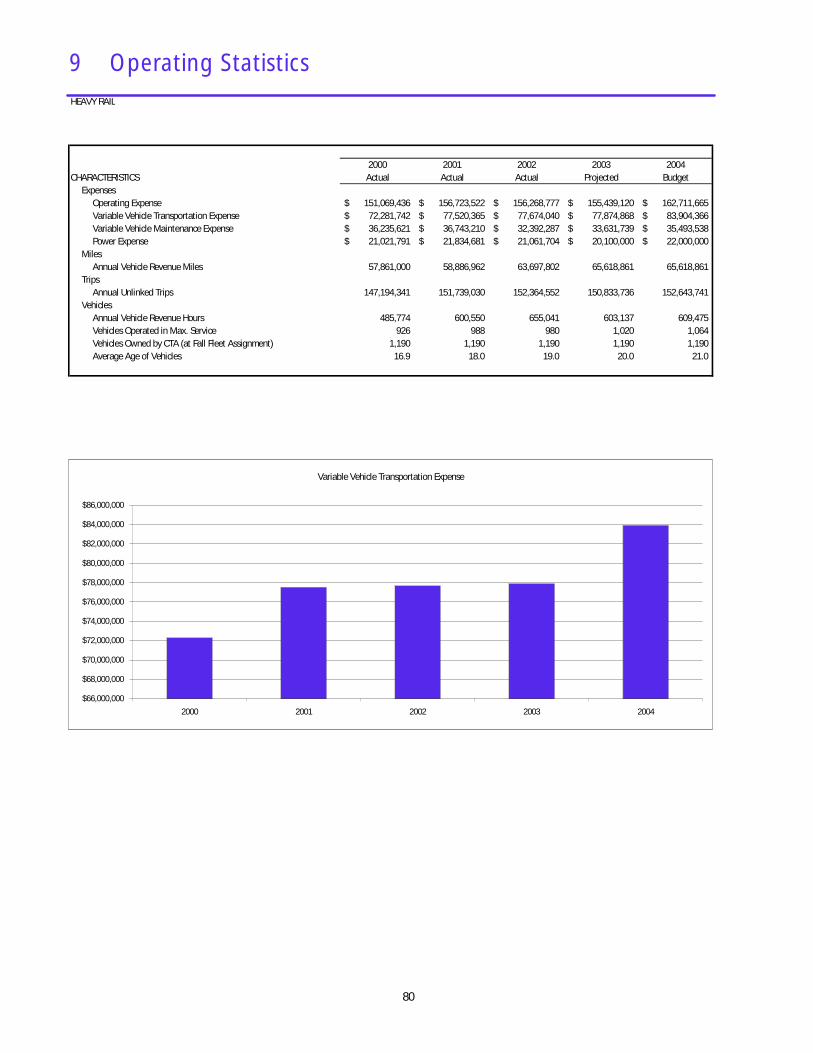
9 Operating StatisticsHEAVY RAIL
2000 2001 2002 2003 2004CHARACTERISTICS Actual Actual Actual Projected Budget
ExpensesOperating Expense 151,069,436$ 156,723,522$ 156,268,777$ 155,439,120$ 162,711,665$ Variable Vehicle Transportation Expense 72,281,742$ 77,520,365$ 77,674,040$ 77,874,868$ 83,904,366$ Variable Vehicle Maintenance Expense 36,235,621$ 36,743,210$ 32,392,287$ 33,631,739$ 35,493,538$ Power Expense 21,021,791$ 21,834,681$ 21,061,704$ 20,100,000$ 22,000,000$
MilesAnnual Vehicle Revenue Miles 57,861,000 58,886,962 63,697,802 65,618,861 65,618,861
TripsAnnual Unlinked Trips 147,194,341 151,739,030 152,364,552 150,833,736 152,643,741
VehiclesAnnual Vehicle Revenue Hours 485,774 600,550 655,041 603,137 609,475 Vehicles Operated in Max. Service 926 988 980 1,020 1,064Vehicles Owned by CTA (at Fall Fleet Assignment) 1,190 1,190 1,190 1,190 1,190Average Age of Vehicles 16.9 18.0 19.0 20.0 21.0
Variable Vehicle Transportation Expense
$66,000,000
$68,000,000
$70,000,000
$72,000,000
$74,000,000
$76,000,000
$78,000,000
$80,000,000
$82,000,000
$84,000,000
$86,000,000
2000 2001 2002 2003 2004
80
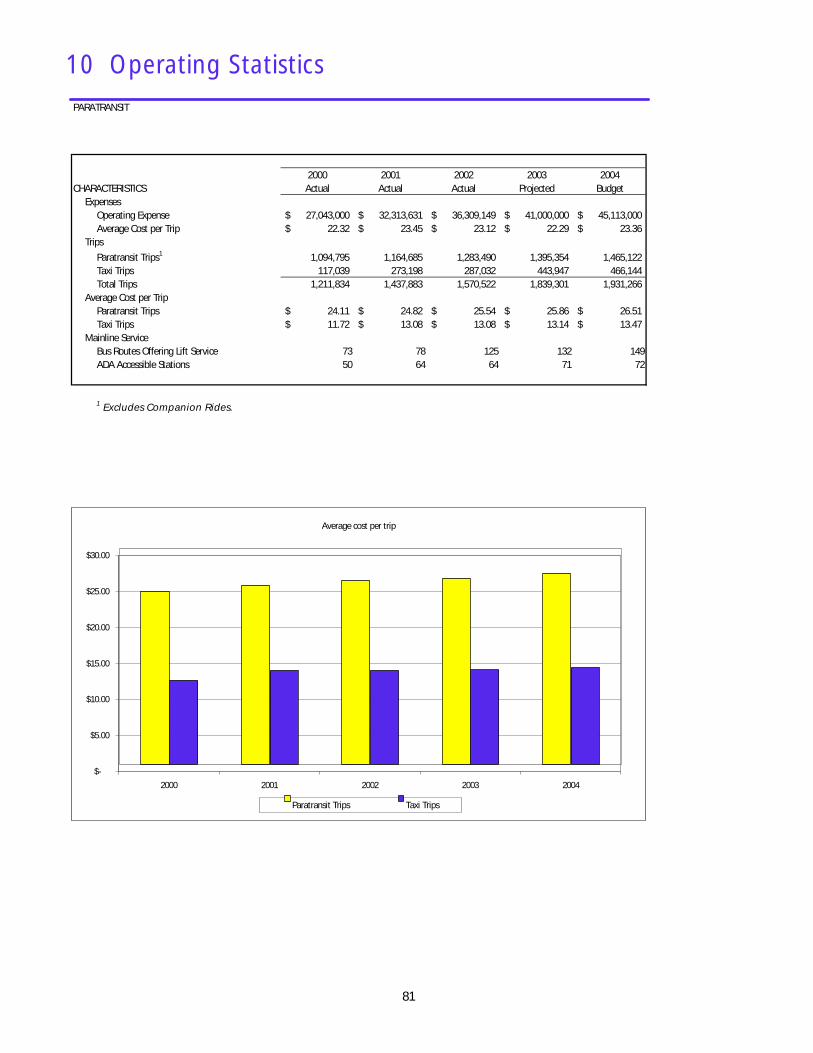
10 Operating StatisticsPARATRANSIT
2000 2001 2002 2003 2004CHARACTERISTICS Actual Actual Actual Projected Budget
ExpensesOperating Expense 27,043,000$ 32,313,631$ 36,309,149$ 41,000,000$ 45,113,000$ Average Cost per Trip 22.32$ 23.45$ 23.12$ 22.29$ 23.36$
Trips
Paratransit Trips1 1,094,795 1,164,685 1,283,490 1,395,354 1,465,122Taxi Trips 117,039 273,198 287,032 443,947 466,144Total Trips 1,211,834 1,437,883 1,570,522 1,839,301 1,931,266
Average Cost per TripParatransit Trips 24.11$ 24.82$ 25.54$ 25.86$ 26.51$ Taxi Trips 11.72$ 13.08$ 13.08$ 13.14$ 13.47$
Mainline ServiceBus Routes Offering Lift Service 73 78 125 132 149ADA Accessible Stations 50 64 64 71 72
1 Excludes Companion Rides.
Average cost per trip
$-
$5.00
$10.00
$15.00
$20.00
$25.00
$30.00
2000 2001 2002 2003 2004
Paratransit Trips Taxi Trips
81
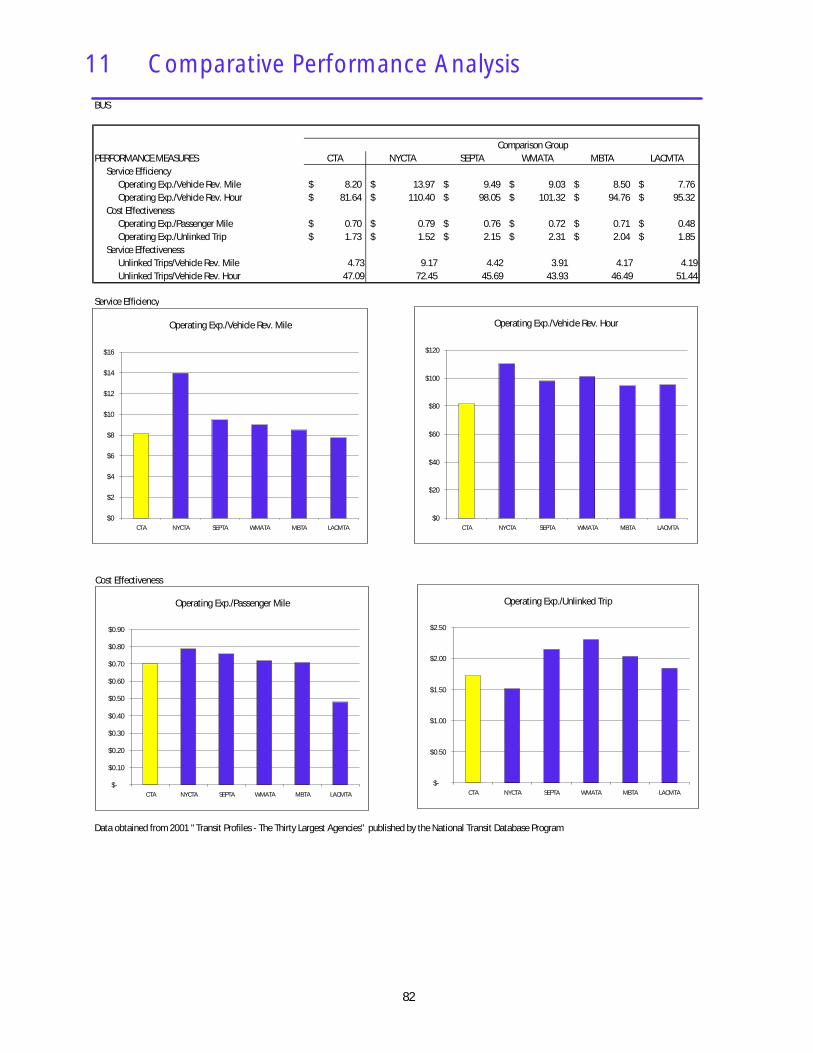
11 Comparative Performance AnalysisBUS
PERFORMANCE MEASURES CTA NYCTA SEPTA WMATA MBTA LACMTAService Efficiency
Operating Exp./Vehicle Rev. Mile 8.20$ 13.97$ 9.49$ 9.03$ 8.50$ 7.76$ Operating Exp./Vehicle Rev. Hour 81.64$ 110.40$ 98.05$ 101.32$ 94.76$ 95.32$
Cost EffectivenessOperating Exp./Passenger Mile 0.70$ 0.79$ 0.76$ 0.72$ 0.71$ 0.48$ Operating Exp./Unlinked Trip 1.73$ 1.52$ 2.15$ 2.31$ 2.04$ 1.85$
Service EffectivenessUnlinked Trips/Vehicle Rev. Mile 4.73 9.17 4.42 3.91 4.17 4.19Unlinked Trips/Vehicle Rev. Hour 47.09 72.45 45.69 43.93 46.49 51.44
Data obtained from 2001 "Transit Profiles - The Thirty Largest Agencies" published by the National Transit Database Program
Comparison Group
Operating Exp./Vehicle Rev. Mile
$0
$2
$4
$6
$8
$10
$12
$14
$16
CTA NYCTA SEPTA WMATA MBTA LACMTA
Operating Exp./Passenger Mile
$-
$0.10
$0.20
$0.30
$0.40
$0.50
$0.60
$0.70
$0.80
$0.90
CTA NYCTA SEPTA WMATA MBTA LACMTA
Operating Exp./Vehicle Rev. Hour
$0
$20
$40
$60
$80
$100
$120
CTA NYCTA SEPTA WMATA MBTA LACMTA
Operating Exp./Unlinked Trip
$-
$0.50
$1.00
$1.50
$2.00
$2.50
CTA NYCTA SEPTA WMATA MBTA LACMTA
Service Efficiency
Cost Effectiveness
82
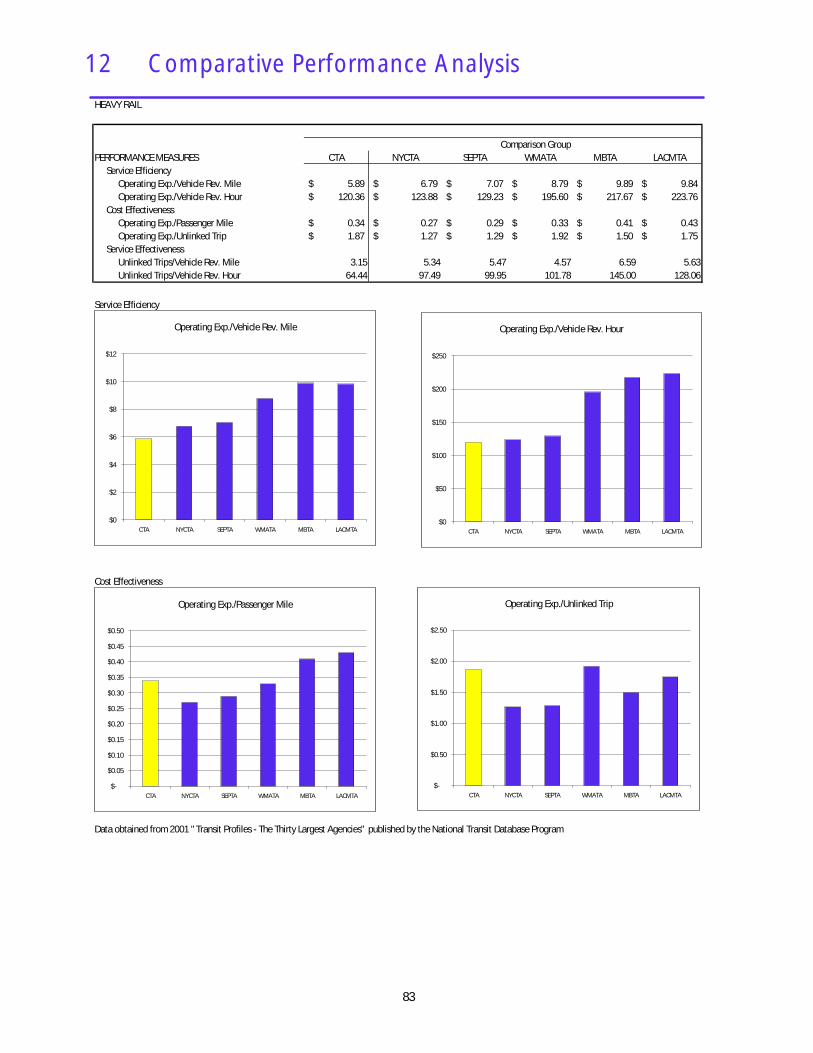
12 Comparative Performance AnalysisHEAVY RAIL
PERFORMANCE MEASURES CTA NYCTA SEPTA WMATA MBTA LACMTAService Efficiency
Operating Exp./Vehicle Rev. Mile 5.89$ 6.79$ 7.07$ 8.79$ 9.89$ 9.84$ Operating Exp./Vehicle Rev. Hour 120.36$ 123.88$ 129.23$ 195.60$ 217.67$ 223.76$
Cost EffectivenessOperating Exp./Passenger Mile 0.34$ 0.27$ 0.29$ 0.33$ 0.41$ 0.43$ Operating Exp./Unlinked Trip 1.87$ 1.27$ 1.29$ 1.92$ 1.50$ 1.75$
Service EffectivenessUnlinked Trips/Vehicle Rev. Mile 3.15 5.34 5.47 4.57 6.59 5.63Unlinked Trips/Vehicle Rev. Hour 64.44 97.49 99.95 101.78 145.00 128.06
Data obtained from 2001 "Transit Profiles - The Thirty Largest Agencies" published by the National Transit Database Program
Comparison Group
Operating Exp./Vehicle Rev. Mile
$0
$2
$4
$6
$8
$10
$12
CTA NYCTA SEPTA WMATA MBTA LACMTA
Operating Exp./Passenger Mile
$-
$0.05
$0.10
$0.15
$0.20
$0.25
$0.30
$0.35
$0.40
$0.45
$0.50
CTA NYCTA SEPTA WMATA MBTA LACMTA
Operating Exp./Vehicle Rev. Hour
$0
$50
$100
$150
$200
$250
CTA NYCTA SEPTA WMATA MBTA LACMTA
Operating Exp./Unlinked Trip
$-
$0.50
$1.00
$1.50
$2.00
$2.50
CTA NYCTA SEPTA WMATA MBTA LACMTA
Service Efficiency
Cost Effectiveness
83
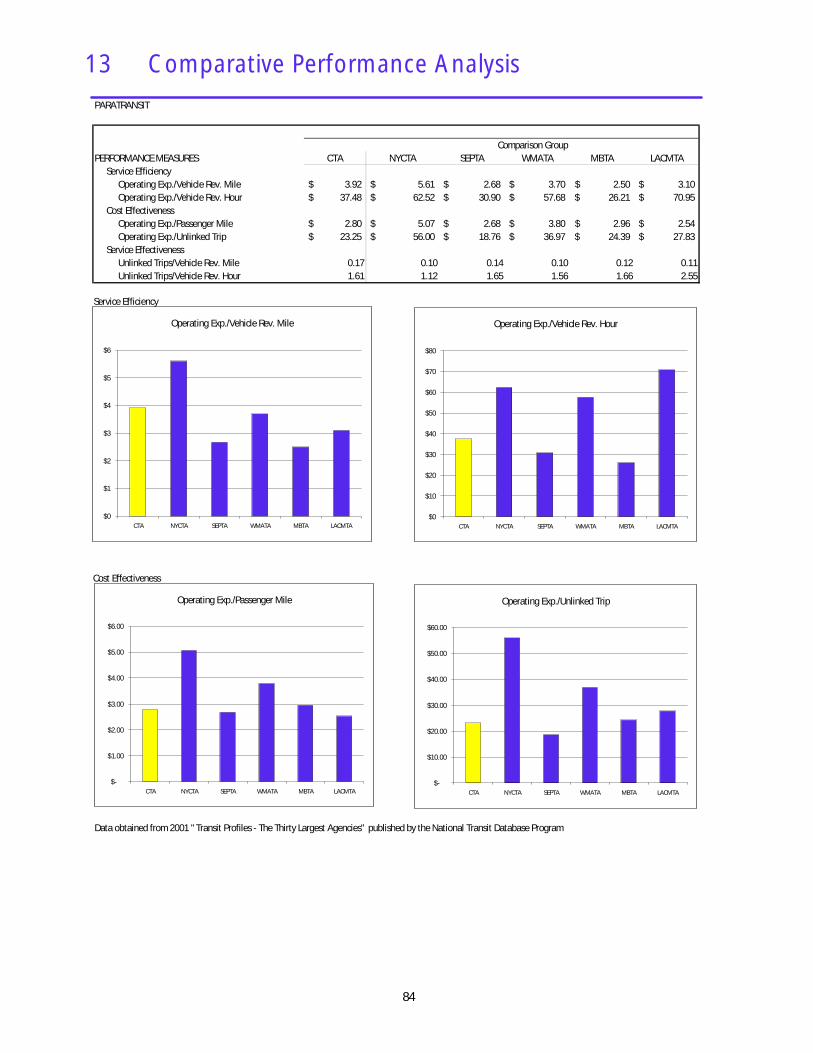
13 Comparative Performance AnalysisPARATRANSIT
PERFORMANCE MEASURES CTA NYCTA SEPTA WMATA MBTA LACMTAService Efficiency
Operating Exp./Vehicle Rev. Mile 3.92$ 5.61$ 2.68$ 3.70$ 2.50$ 3.10$ Operating Exp./Vehicle Rev. Hour 37.48$ 62.52$ 30.90$ 57.68$ 26.21$ 70.95$
Cost EffectivenessOperating Exp./Passenger Mile 2.80$ 5.07$ 2.68$ 3.80$ 2.96$ 2.54$ Operating Exp./Unlinked Trip 23.25$ 56.00$ 18.76$ 36.97$ 24.39$ 27.83$
Service EffectivenessUnlinked Trips/Vehicle Rev. Mile 0.17 0.10 0.14 0.10 0.12 0.11Unlinked Trips/Vehicle Rev. Hour 1.61 1.12 1.65 1.56 1.66 2.55
Data obtained from 2001 "Transit Profiles - The Thirty Largest Agencies" published by the National Transit Database Program
Comparison Group
Operating Exp./Vehicle Rev. Mile
$0
$1
$2
$3
$4
$5
$6
CTA NYCTA SEPTA WMATA MBTA LACMTA
Operating Exp./Passenger Mile
$-
$1.00
$2.00
$3.00
$4.00
$5.00
$6.00
CTA NYCTA SEPTA WMATA MBTA LACMTA
Operating Exp./Vehicle Rev. Hour
$0
$10
$20
$30
$40
$50
$60
$70
$80
CTA NYCTA SEPTA WMATA MBTA LACMTA
Operating Exp./Unlinked Trip
$-
$10.00
$20.00
$30.00
$40.00
$50.00
$60.00
CTA NYCTA SEPTA WMATA MBTA LACMTA
Service Efficiency
Cost Effectiveness
84
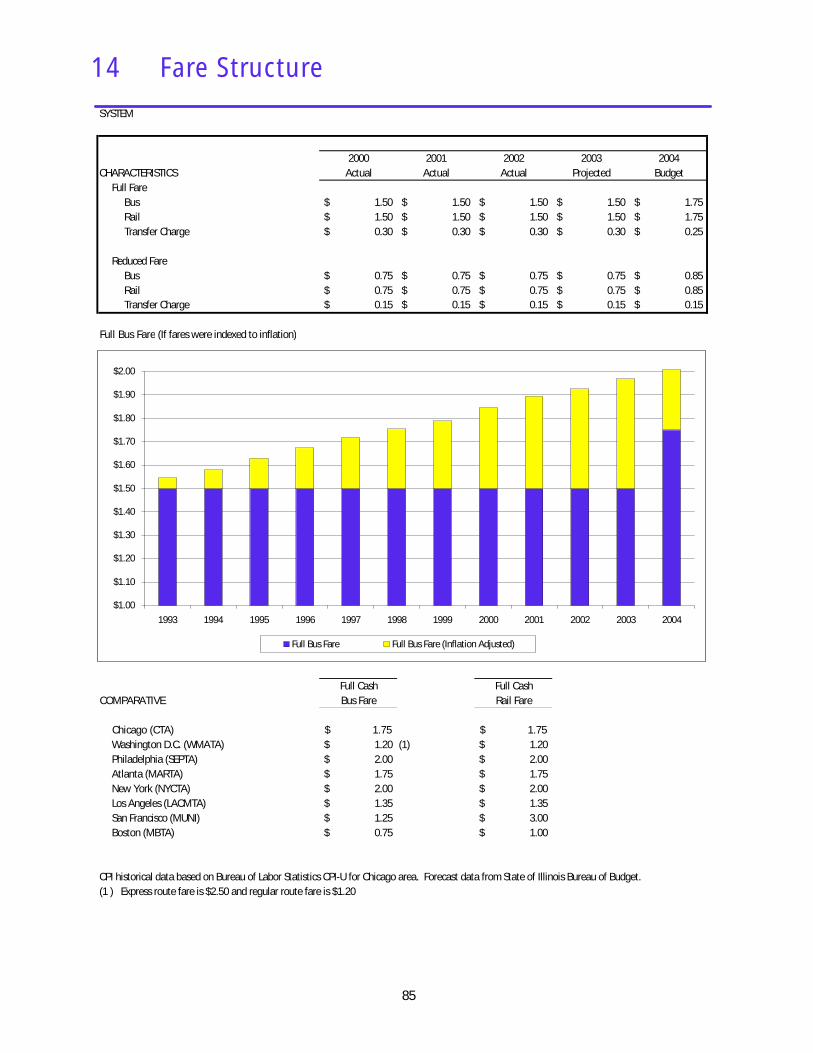
14 Fare Structure
SYSTEM
2000 2001 2002 2003 2004CHARACTERISTICS Actual Actual Actual Projected Budget
Full FareBus 1.50$ 1.50$ 1.50$ 1.50$ 1.75$ Rail 1.50$ 1.50$ 1.50$ 1.50$ 1.75$ Transfer Charge 0.30$ 0.30$ 0.30$ 0.30$ 0.25$
Reduced FareBus 0.75$ 0.75$ 0.75$ 0.75$ 0.85$ Rail 0.75$ 0.75$ 0.75$ 0.75$ 0.85$ Transfer Charge 0.15$ 0.15$ 0.15$ 0.15$ 0.15$
Full Bus Fare (If fares were indexed to inflation)
Full Cash Full CashCOMPARATIVE Bus Fare Rail Fare
Chicago (CTA) 1.75$ 1.75$ Washington D.C. (WMATA) 1.20$ (1) 1.20$ Philadelphia (SEPTA) 2.00$ 2.00$ Atlanta (MARTA) 1.75$ 1.75$ New York (NYCTA) 2.00$ 2.00$ Los Angeles (LACMTA) 1.35$ 1.35$ San Francisco (MUNI) 1.25$ 3.00$ Boston (MBTA) 0.75$ 1.00$
CPI historical data based on Bureau of Labor Statistics CPI-U for Chicago area. Forecast data from State of Illinois Bureau of Budget.(1 ) Express route fare is $2.50 and regular route fare is $1.20
$1.00
$1.10
$1.20
$1.30
$1.40
$1.50
$1.60
$1.70
$1.80
$1.90
$2.00
1993 1994 1995 1996 1997 1998 1999 2000 2001 2002 2003 2004
Full Bus Fare Full Bus Fare (Inflation Adjusted)
85
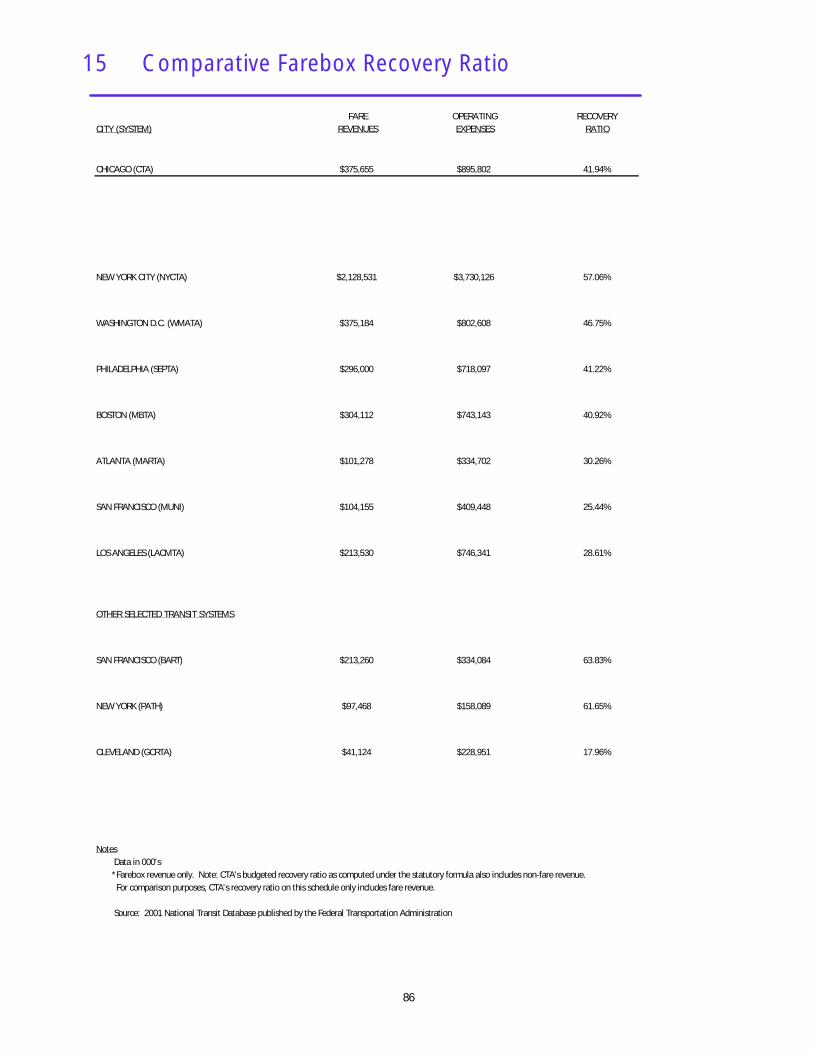
15 Comparative Farebox Recovery Ratio
FARE OPERATING RECOVERYCITY (SYSTEM) REVENUES EXPENSES RATIO
CHICAGO (CTA) $375,655 $895,802 41.94%
NEW YORK CITY (NYCTA) $2,128,531 $3,730,126 57.06%
WASHINGTON D.C. (WMATA) $375,184 $802,608 46.75%
PHILADELPHIA (SEPTA) $296,000 $718,097 41.22%
BOSTON (MBTA) $304,112 $743,143 40.92%
ATLANTA (MARTA) $101,278 $334,702 30.26%
SAN FRANCISCO (MUNI) $104,155 $409,448 25.44%
LOS ANGELES (LACMTA) $213,530 $746,341 28.61%
$0
$0
$0
OTHER SELECTED TRANSIT SYSTEMS $0
$0
$0
SAN FRANCISCO (BART) $213,260 $334,084 63.83% $0
$0
$0
NEW YORK (PATH) $97,468 $158,089 61.65% $0
$0
CLEVELAND (GCRTA) $41,124 $228,951 17.96%
Full Bus Fare1.50$ 1.50$ 1.50$
Notes 1.50$ Data in 000's 1.50$ *Farebox revenue only. Note: CTA's budgeted recovery ratio as computed under the statutory formula also includes non-fare revenue. 1.50$ For comparison purposes, CTA's recovery ratio on this schedule only includes fare revenue. 1.50$
1.50$ Source: 2001 National Transit Database published by the Federal Transportation Administration 1.50$
86
16 Glossary
87
ADA The Americans with Disabilities Act of 1990. Federal Legislation mandates that all new buses and rail lines be wheel chair accessible, and that alternative transportation be provided to customers unable to access the transit system.
AFC The automated fare collection system. Block Runs Runs that are scheduled between Monday and Friday. These runs consist of
a ten-hour shift at straight pay. Overtime is not a factor. Bus Trip A bus one-way trip. Budget Marks The Regional Transportation Authority Act, as amended in 1983, calls for RTA
to advise each of its Service Boards by September 15th of its required revenue recovery ratio for the subsequent year, and the public funding to be available. These figures are referred to as budget marks.
CPI Consumer Price Index. An index that tracks the prices of a variety of goods
purchased by an average consumer. Also known as the cost of living index which is used as a reference for wage increases and other similar inflation prone items.
Deferred Operating Funds remaining from the prior year or years that can be used to cover Assistance shortfalls or capital expenditures in future years. Spending is allowed only
after RTA budgetary approval. ERP Enterprise Resource Planning. A suite of software applications that increase
organizational economy & efficiency by migrating onto a common software platform to allow departments to more easily share information and communicate with each other.
Financial Plan In addition to an annual budget, the Regional Transportation Authority Act,
amended in 1983, requires that all transit authorities prepare a financial plan encompassing the two years subsequent to the budget year. This provides a three-year projection of expenses, revenues, and public funding requirements.
Fund Balance The cumulative amount that has not been used by which total revenues
(including Public Funding) exceed (or are exceeded by) expenses over a series of years. Annual budget surpluses (or deficits) generally add to (or subtract) from the Fund Balance. This balance is available to fund current or future operating or capital needs.
16 Glossary
88
GDP Gross Domestic Product. A measure of economic activity, the amount of goods and services produced in the United States in a year. It is calculated by adding together the market values of all of the final goods and services produced in a year.
Headway The time span between service vehicles (bus or rail) on specified routes. Illinois FIRST A State funded program to maintain and support Illinois Infrastructure,
Roads, Schools, and Transit. Infrastructure The basic installations and facilities on which the continuance and growth of
a community depend. For the CTA, this means such facilities as elevated structure, track, repair shops, bus garages, rail terminals, and power substations, etc.
Labor Base Labor expense for time actually worked. It excludes holidays, sick time, and
vacation time. Labor Load The cost of fringe benefits. The burden includes insurance, paid time off,
FICA, and retirement obligations. Non-Operating Expenses and Revenues funded with capital. Off Peak Non rush hour time periods. Operating Expenses The expenses associated with the operation of the transit agency, and
classified by function or activity and the goods and services purchased. Passenger Miles The cumulative sum of the distances ridden by each passenger. Peak Rush hour time periods, defined as 6:00 a.m. through 10:00 a.m. and 3:00
p.m. through 7:00 p.m. Platform Time The period of time in which a transit vehicle is in revenue service. Positive Budget The favorable difference between Budget and Actual revenues and/or Variance expenses.
16 Glossary
89
Public Funding Funding received from the RTA for operating or capital purposes. Purchase of Paratransit The cost of using outside vendors to provide transit to certified disabled Service riders. Recovery Ratio One of the key performance indicators, which measures the amount of
operating, expense that was recouped from operating revenues. Reduced Fares Discounted fare for children age 7 – 11, grade and high school students (with
CTA ID), seniors 65 and older (with RTA ID), and riders with disabilities (with RTA ID) except Paratransit Riders.
Run Rail or Bus Operator’s assigned work for the day. Service Board The Regional Transportation Authority Act, as amended in 1983, refers to the
CTA, Metra (the commuter rail system), and Pace (the suburban bus system) as service boards.
SPTO STO personnel that are restricted to weekend work, at a lower pay rate, and
who receive no fringe benefits from the CTA. STO The portion of labor that represents Scheduled Transit Operations. This
classification includes bus operators, motormen, conductors, and customer assistants.
System Generated Rev. Revenue generated internally by CTA. Includes fares, charter revenue,
advertising, investment income, income from local governments per a provision of the Regional Transportation Authority Act, and a subsidy for reduced fare riders per 1989 legislation.
TEA – 21 Federal transportation package which reauthorized the Federal Transit
Program for six years (1998-2003). Grants can pay up to 80 percent of a capital project, with the remaining 20 percent funded from local sources.
Top Operator Rate The top hourly rate paid to Bus Operators and Rail Operators, based on
employee seniority within the job, as specified by the union contract. Train Trip One-Way train trip from originating terminal to destination terminal. Trick A part of the daily working schedule of a transit employee. Also considered
as a shift.
16 Glossary
90
Unlinked Passenger Trip Each boarding of a transit vehicle by a passenger is defined as an unlinked passenger trip. A single journey by one passenger, consisting of one or more unlinked boardings is considered a linked trip.
Vehicle Revenue Hours The hours that vehicles travel while in revenue service. Vehicle revenue
hours include layover/recovery time but exclude travel to and from storage facilities, training operators prior to revenue service, road test and deadhead travel, as well as school bus and charter services.
Vehicle Revenue Miles The miles that vehicles travel while in revenue service. Vehicle revenue miles
exclude travel to and from storage facilities, training operators prior to revenue service, road tests and deadhead travel, as well as school bus and charter services.
Warranty & Credits Reimbursement for repairs covered by manufacturers warranty agreements.
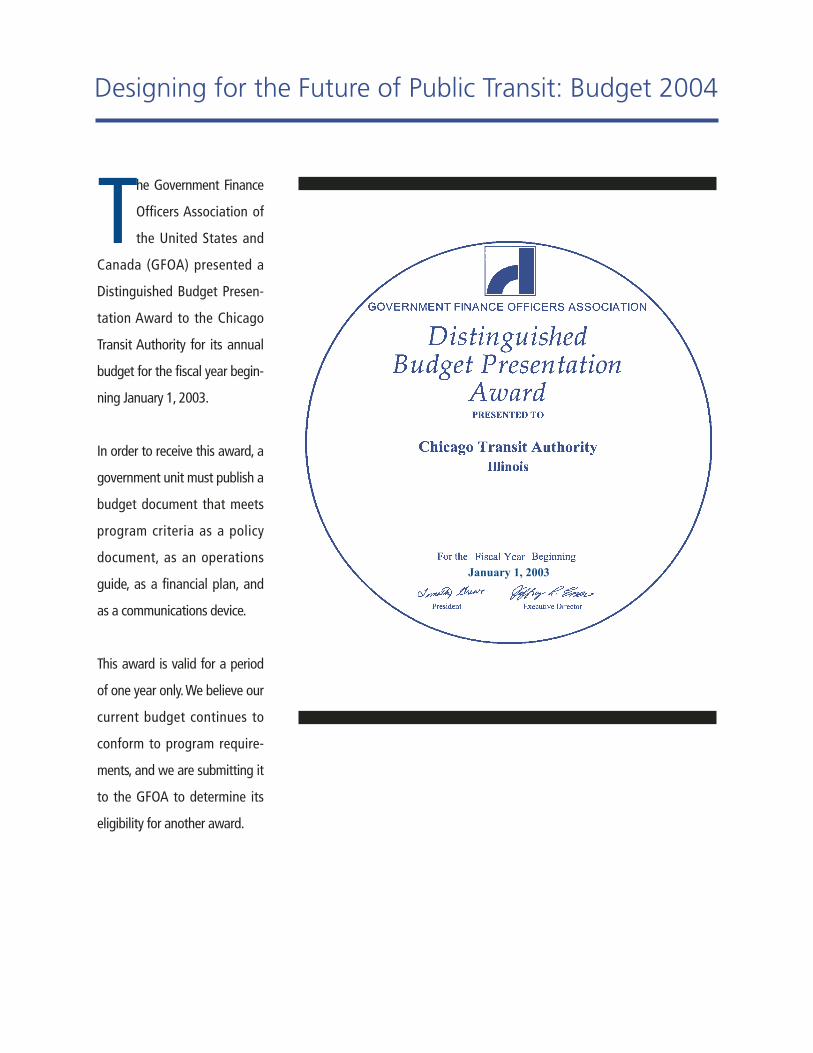
Designing for the Future of Public Transit: Budget 2004
January 1, 2003
The Government Finance
Officers Association of
the United States and
Canada (GFOA) presented a
Distinguished Budget Presen-
tation Award to the Chicago
Transit Authority for its annual
budget for the fiscal year begin-
ning January 1, 2003.
In order to receive this award, a
government unit must publish a
budget document that meets
program criteria as a policy
document, as an operations
guide, as a financial plan, and
as a communications device.
This award is valid for a period
of one year only.We believe our
current budget continues to
conform to program require-
ments, and we are submitting it
to the GFOA to determine its
eligibility for another award.

Morse
Jarvis
Loyola
Granville
Lawrence
Wilson
Sheridan
Berwyn
Argyle
Thorndale
Bryn Mawr
KKKedz
ieKi
mba
ll
Mononontrooose
Irving Pararark
Addison Sout
hut
hut
hpor
t
Fran
cisc
o
Rock
wel
l
Wes
tern
Dam
en
Paul
iul
iul
ina
Wellington
Diversey
Armitage
North/Clybourn
Clark/D/D/Division
Addison
JeffersonPark
Montrose
Irving Park
Addison
Belmont
California
Western
Damen
Division
Chicago
Med
ical
ed
ical
ed
ical
Ctr
Wes
tern
Polk
18th
Cent
ral P
arCe
ntra
l Par
Cent
ral P
ark
Kedz
ieKe
dzie
Kedz
ieKe
dzie
-Ho
man
Calif
orni
aCa
lifor
nia
Calif
orni
a
Wes
tern
Wes
tern
Wes
tern
Hoyn
eHo
yne
Hoyn
e
Pula
ski
Kost
ner
Pula
ski
35/Archer
Kedzie Western
Pulaski
Midway
69th
95th/Dan Ryan
87th
79th
47th
Garfield
63rd
Raci
ne
UIC-
Hals
ted
UIC-
Hals
ted
UIC-
Hals
ted
Halsted
Ashland
Sox-35th
Cice
ro
FOREST PARKBRANCH
Linden
Central
Noyes
Foster
Davis
Dempster
South Blvd
Main
Cum
berl
and
Harl
em
O’H
are
Rose
mon
t
54th
/Cer
mak
Fore
st P
ark
Harle
m
Oak
Par
k
Aust
in
Clin
ton
LaSa
lle
Chicago
Grand
Harrison
Cermak-Chinatownownown
LoganSquare
ASHLAND BRANCH EAST 63RD BRANCH
East 63rd-CottageGrove
King
Dr
Hals
ted
Ashl
and/
63rd
GGGaaarfield
51st
47th
43rd
Indddiana
3555-BronzBronzBronzevilleee-IIT
Ashl
and
Calif
orni
a
Kedz
ie
Pula
ski
Cice
ro
Cent
ral
Aust
in
Ridg
elan
d
Oak
Par
k
Harl
em/L
ake
CERMAKBRANCH
Lara
mie
Clin
ton
Cice
ro
Dam
en,
amen
,am
en, P
aulin
a
Lom
bard
Pulaski
Spaulding
Lunt
Just
ine
33rd
MerchMart
Roosevelt
Belmont
Fullerton
Howard
Loom
is
3444th
East
Ave
Chicago
Grand
Sedg
wic
k
Mar
ion
Skokie
Cons
erva
torrry
–Ce
ntra
l Par
k D
rive
k D
rive
k D
rive
Peor
ia, M
orga
nPe
oria
, Mor
gan
Peor
ia, M
orga
n
90
294
290
294
294
9457
90
94
55
88
290
55
294
Des P
laine
s Rive
r
Sanit
ary &
Ship
Cana
l
9490
Calumet Sag Channel
North
Sho
re C
hann
el
94
OaktonCommunityCollege
Golf Mill Mall
StephensConventionCenter
AllstateArena
Harlem/IrvingPlaza
TritonCollege
MaywoodParkRace Track
Cook Co.CourtsMaywood
FrankLloydWrightHistoricDistrict
Hines VAHospital
NorthRiversidePark Mall
Brookfield Zoo
MortonCollege
ChicagoRidgeMall
Cook Co.CourtsBridgeview
MoraineValleyCollege
OrlandSquareMall
St XavierUniversity
EvergreenPlaza
ChicagoState Univ
FordCityMall
CookCountyCourts
HawthorneRace Course U.S. Cellular
Field
GarfieldParkConser-vatory
NortheasternIllinoisUniversity
LincolnwoodTown Center
WestfieldShoppingtownOld Orchard
Cook Co.CourtsSkokie
Edens Plaza
Baha’i Temple
KohlChildren’sMuseum
National-LouisUniversity
NorthwesternUniversity
Loyola University
WrigleyWrigleyWrigleyFieldFieldField
DePaulUniv
Zoo
Chicago Historical Society
InternationalMuseum ofSurgical Science
Museum ofHolography
Greektown
UnitedCenter
IllinoisMedicalDistrict
UICUICPavilion
Prairie AvenueHistoric District
McCormick Place
MidwayAirport
O’HareAirport
IllinoisInstitute ofTechnology
Universityof Chicago
Museum of Science& Industry/Omnimax
DominicanUniversity
ConcordiaUniversity
OaktonCommunityCollege
Vietnam Veterans Art Museum
UPS
RyanField
LoyolaMedicalCenter
North ParkUniversity
Malcolm XCollege
TrumanTrumanTrumanCollegeCollegeCollege
DaleyCollege
Olive-HarveyCollege
Kennedy-KingCollege
WrightCollege
Kiddieland
PullmanHistoricDistrict
North-westernBusinessCollege
DawsonTechnicalInstitute
SmartMuseum
OrientalInstitute Museum of
Science& Industry/Omnimax
Regenstein Library
Univ ofChicagoHospitals
PeaceMuseum
Nature Museum
China-town
Mexican Fine ArtsMexican Fine ArtsMexican Fine ArtsCenter MuseumCenter MuseumCenter Museum
DuSableMuseum
DuSableMuseum
South Shore Cultural Center
ILL
INO
ISIN
DIA
NA
L A K E
M I C H I G A N
ColumbusPark
Garfield Park
HumboldtPark
WarrenPark
Jackson Park
Wash-ingtonPark
MarquettePark
CalumetPark
Forest Preserve
Forest Preserve
Forest Preserve
Forest Preserve
Forest Preserve
Forest Preserve
ForestPreserve
ForestPreserve
ForestPreserve Forest
Preserve
ForestPreserve
Lincoln Park
DanRyanWoods
DouglasPark
North Branch of the Chicago River
Des Plaines River
NortherlyIsland Park
BurnhamPark
2800
W
5600N
5200N
4800N
4400N
1200N
4000
W
3400
W
3200
W
2400
W
2000
W
6400N
6000N
800W
1600
W
3600N
3200N
2800N
4000N
1600N
800N
7200
W
6800
W
5200
W
4800
W
6400
W
6000
W
5600
W
2400N
2000N
1200S
1600S
2200S
2600S
3100S
3500S
4300S
4700S
5100S
5500S
5900S
6300S
6700S
7100S
7900S
8700S
2400
W
1200
W
800W
400W
2000
W
1600
W
2000
E
2400
E
400E
800E
1200
E
1600
E
3000
E
3600
E
4000
E
3200
E
200N
1N/1S
300S
10000N
9200N
8400N
8000N
7600N
7200N
6800N
9600N
8800N
11100S
11900S
12700S
13500S
8000
W
7600
W
7200
W
6400
W
5600
W
6800
W
6000
W
9500S
10300S
5200
W
4400
W
4000
W
3600
W
3200
W
2800
W
4800
W
9600
W
8800
W
3900S
8800
W
8400
W
1040
0W
2800
E
9900S
7500S
8300S
8400
W
10700S
11500S
12300S
9600
W
8000
W
7600
W
4400
W
400N
600S
9200
W92
00W
1120
0W
1E/1
W
Glenview
Golf
MortonGrove
Niles
Wilmette
Skokie
Evanston
Skokie
Lincolnwood
NorridgeHarwoodHeights
DesPlaines
DesPlaines
Niles
ParkRidge
SchillerPark
FranklinPark
LakeCalumet
Riverdale
MerrionettePark
BlueIslandAlsip
RobbinsCrestwood
Worth Alsip
PalosHeights
PalosPark
HickoryHills
PalosHills
ChicagoRidge
Bridgeview
OakLawn
Hometown
Burbank
Evergreen Park
Justice
WillowSprings
LaGrange
McCook
HodgkinsBedford Park
LaGrangePark
Brookfield
WesternSprings
Countryside
Riverside
Lyons
ForestView
Summit
Stickney
OakPark
Cicero
Berwyn
Maywood
Broadview
ForestPark
NorthRiverside
Bellwood
Hillside
Westchester
ElmwoodPark
RiverForest
RiverGrove
MelrosePark
Northlake
StonePark
OakPark
Rosemont
Berkeley
BurrRidge
CalumetPark
Glenview
ParkRidge
WolfLake
Berk
eley
Bellw
ood
Evanston
FranklinPark
Mar
s
Mon
t Cla
re
Gal
ewoo
d
Han
son
Park
Crag
in Her
mos
a
Elm
woo
dPa
rk
Rive
rG
rove
Healy
Fran
klin
Park
Man
nhei
m Grayland
Mayfair
Forest
Glen
Edgebrook
Morton
Grove
Golf
Glenview
Davivivis
Main
RogersPark
Ravenswood
Clybourn
Irving
Park
Jeffe
rson P
arkGlad
stone
Park
Norwoo
dPa
rk
Ediso
nPa
rk
Park
Ridg
e
DeeRo
ad
Des Pl
aines
Kedz
ie
Hal
sted
Wes
tern
Willow
Springs
Summit
Ashburn
Oak Lawn
ChicagoRidge
Worth
PalosPark
Robbins
Blue IslandVermont St
Prairie
119th
123rd
BurrOak
Ash
land
Raci
ne
115th
111th
107th
103rd103rd
99th
95th
95th
91st Brai
nerd
Gresham
23rd
18th
27th
47th
53 rd
55th
59th
63rd
75th
79th
83rd
87th
91st
95th
103rd
107th
111th
Kensington
Stat
e
Stew
art
Ridg
e
Wes
tPu
llman
RiverdaleHegewisch
93rd
87th
83rd
Cheltenham
Windsor Park
Ston
yIsl
and
Bryn
Maw
r SouthShore
Cumberland
Central
Wes
tern
O’HareTransfer
53rd
55th-56th-57th(South Shore Linealso stops here)
59th
Cice
ro
Clyd
e
LaVe
rgne
Berw
yn
Har
lem
Rive
rsid
e
Hol
lyw
ood
Broo
kfie
ld
Cong
ress
Park
LaG
rang
e Rd
Ston
e Av
e
Wes
tern
Sprin
gs
Hig
hlan
ds
Mel
rose
Park
May
woo
d
Rive
rFo
rest
Oak
Park
Wrightwood
Pula
ski
Herm
itage
Ashl
and
Kedz
ie
Milwaukee
Berwyn
Lincoln
Webster
Broadway
Stockton
Sheridan
Hom
an
Kim
ball
Calif
orni
a
Kim
ball
Kedz
ie
Lawrence
Peterson McCorm
ick
Lincoln
Caldwell
Broa
dway
Ridge
Ashl
and
Sout
hpor
t
Devon
Peterson
Calif
orni
a
Wes
tern
Howard
Lunt
Morse
Rogers
Clark
Sheridan
Lake Shore Drive
Ma rine D rive
Sher
idan
Clar
endo
n
Clark
Sher
idan
Lincoln
Lake Shore Dr
Clar
k
Clark
Inner Drive
Cice
ro
Armitage
Chicago
Cice
ro
Oak
Park
Cent
ral
Lawrence
Latro
beGrand
Nagl
e
Northwest Hwy
Grand
Cent
ral
Pula
ski
Bryn Mawr
Montrose
Irving Park
Addison
Belmont
Diversey
Fullerton
Harle
m
Aust
in
Harle
m
Narra
gans
ett
North
Division
Cent
ral
Lara
mie
Wes
tern
Dam
en
Milwaukee
Chicago
Grand
Taylor
Dam
en
Ashl
and
Racin
e
JacksonVan Buren
Lafli
n
Cermak
Ogden
Was
hten
aw
18th
Clar
kSt
ate
Congress
Harrison
Roosevelt
16thCent
ral
Park
Fifth
Kost
ner
25th26th
Pula
ski
Kedz
ie
Archer
Kom
ensk
y
Law
ndal
e
St L
ouis
36th
Archer
Blue Island
35th
Garfield
47th
55th
69th
Calif
orni
a
55th
51st
59th
Archer
63rd
Cice
ro
74th
Pula
ski
Dam
en
Ashl
and
Loom
is
Racin
e
Sacr
amen
to
71st
79th
87th
76th
Kedz
ie
Wes
tern
76th
Monterey
Halst
ed
Mich
igan
Vinc
enne
s
Beverly
103rd
111th
115th
104th
111th
115th
Pula
ski
Kedz
ie
Wes
tern
St L
awre
nce
Woo
dlaw
n
King
Corli
ss
Low
e
Cotta
ge G
rove
119th
Eggl
esto
n
Wen
twor
th
Rhod
es
Keefe
Wells
Halst
ed
Lafa
yette
Cotta
ge G
rove
Ston
y Isl
and
Stat
e
King
95th
Jeffe
ry
100th
South Chicago
Mac
kina
w
Ewing
91st
93rd
100th
87th
103rd 104th106th
112th112th
Torre
nce
Aven
ue O
118th
Ewin
g
Aven
ue C
Aven
ue B
132nd
Exch
ange
Balti
mor
e
Yate
s
Lake Park
43rd
47th
51st
55th
Drex
el
Hyde Park Lake
Par
k
67th
61st63rd
56th57th
Ston
yIsl
and
Yale
Wel
ls
71st
73rd75th
79th
Yate
s
SouthShore
South Shore
Wen
twor
th
Stat
eSt
ate
Indi
ana
King
Rhod
es
35thWal
lace
40th
45th
Root
Racin
e
Prin
ceto
n
Cana
l
26th
Mor
gan
Wen
twor
th
LaSa
lle
Mich
igan
Lake
Sedg
wick
LaSa
lle
Stat
e
Halst
ed
Wel
ls
Sacr
amen
to
Fulton
Exchange
Jackson
Madison
Harrison
Lexington
Lake
Old Orchard
GlenviewWilmette
Central
Golf
Dempster
Lake
Grant
Church
Oakton
Touhy
Pratt
Skok
ie
Howard
Mc
Corm
ick Kedz
ie
Cice
ro
Pratt
Cent
ral
Nile
s Cen
ter
LeCl
aire
Carp
ente
r
Niles
Cen
terLincoln
Craw
ford
Bron
x
Harms
Skokie
Ferri
s
Gros
sPo
int
Harle
m
Wau
kega
n
Milwaukee
Glenview
Golf
Central
Howard
Touhy
ChicagoRidge
Asbu
ry
Davis
Oak
Emerson
Central
McCormick
Eden
s Exp
wy
Avondale
Lehigh
ImlayDevon
Cour
tland
Pros
pect
Over
hill
Forest Pres
erve
Foster
Gunnison
Talcott
River Rd
Bess
ie C
olem
anW
hite
Map
le
Busse Hwy
Ballard
Dempster
Oakton
Howard
Touhy Touhy
Cent
er Potte
r
Gree
nwoo
d
Northwest Hwy
Dearlo
ve
Gree
nwoo
d
Dee
Miner
River Rd
Higgins
Lee
Golf
Thacker
Devon
Dee
Scot
t
Pratt
Higgins
East
Rive
r Rd
Ozan
amTalcott
Delp
hia
Higgins
O’Hare Cargo
Access Road
Man
nhei
m
25th
Cum
berla
nd
Lawrence
Rive
r Rd
NW Tollway
Hyde
Park
127th
132nd133rd
Ellis
Indi
ana
Eber
hart
Lang
ley
130th
Torre
nce Brainard
124th
127th
Woo
d
Thro
op
Vermont
119th
127th Burr Oak
135th
Cice
ro
Keel
er
Broadway
VermontCalumet Sag
Pula
ski
Cent
ral
Park
Hom
anKe
dzie
Wes
tern
Greg
ory
135th
Fran
cisco
123rd
139th
127th
Harle
m
Route 83
135th
Ridg
elan
d
123rd
131st
LaGr
ange
82nd
Ave
80th
Ave
76th
Ave
93rd
95th
103rdTracy
Robe
rts
Ridg
elan
d
South
west Hwy
76th
Ave
Oak
Park
100th Pl
107th
103rd
74th
77th
79th
Harle
m
Cent
ral
Oak
Park
Narra
gans
ett
87th
Cice
ro
95th
98th
100th
63rd
Archer
Cork
88th
Ave
LaGr
ange
Law
ndal
e
31st
Hwy 171
Ogden
Harle
m
Neva
Narra
gans
ett
Aust
in
Map
le
Prai
rie
1st
Desp
lain
es
East
46th47th
Archer
Stevenson Expressway
Stanley
Ogden
Pershing
35th
31st
Cent
ral
65th
Joliet
Joliet
55th
73rd
26th
Washington
Cermak
25th
Mon
itor
Lara
mie
Roosevelt
Harle
m
Ridg
elan
d
Aust
in
Oak
Park
Washington
Roosevelt
Canterbury
Cermak
Desp
lain
es
1st
Bellw
ood
19th
1st
Man
nhei
m
Balm
oral
Wes
tche
ster
25th
5th
Butterfield
St. Charles
That
cher
North
Lake
Division
Man
nhei
m
5th
25th
River Rd
Lake
Broa
dway
Oak
Park
Ridg
elan
d
Aust
in
Rose
Nord
ica
Franklin
Grand
Belmont
North
Irving Park
Hibb
ard
Canf
ield
Canf
ield
Cent
ral
FosterFoster
Shef
field
Neva
Narra
gans
ett
Rock
wel
l
24th Pl
Joliet
Pershing
Northwest Hwy
South Shore
St. L
ouis
Harle
m
Ridg
elan
d
103rd
Van Vlissingen
104th
InnerDrive
Caldwell
95th
Ston
y Isl
and
Indi
ana
Wol
fGolf
GolfW
olf
Mannheim
Tri-State Tollway
Cam
pbel
l
Chicago Skyway
Mea
de
Exch
Tri-State Tollway
LaGrange 26th
Pershing
Dam
en
Ashl
and
Racin
e
Wes
tern
Halst
ed
25th
Tri-S
tate
Tollw
ay
Belmont
Wol
f
Madison
Eisenhower Expwy
Taft
Madison
Kent
on
Halst
edRoosevelt
Kedz
ie
Sheridan
Miner
Dewes
Dee
Lym
an
Harrison
Tri-S
tate
Tollw
ay
Karlo
v
McCarthy
Stevenson Expressway
Electric
63rd Pl
Cermak
Irving Park
Rand
Wol
f
Business Center Dr
Cotta
ge G
rove
Orio
leHiggins
Sher
man
Paul
ina
Ashl
and
Polk
St. Charles
Lara
mie
Pershing
Ellinwood
Feehanville
Armitamitamitage
Wilson
Harding
Edgi
ngto
n
Clar
emon
t
Halst
ed
Lave
rgne
29th
Coun
ty L
ine
Rd
81st
Perry
Wilmette
Skok
ie
17th
Harrison
Indi
ana
State
Central
Devon
Church
Dodg
e
Milwaukee
CountryClub Ln
That
cher
14th
Sagi
naw
Narra
gans
ett
3rd
4th
39th
44th
Waveland
Gracela
ndLe
e
Franklin
Kedz
ie
Exchange
88th
9th
Ashl
and
Elston
31st
Lara
mie
Archer
Vinc
enne
s
Hom
an
Douglas
Old
Harle
m
Maybrook
Bryn Mawr
Mor
gan
130th131st
LakeSho re
Drive
Main
Hum
phre
y
May
field
Gran
dLa
wn
Wol
f Rd
55th
Cascade64th
Joliet
OakWoo
dlan
d
Gilb
ert
Wes
tern
Blvd
Cannon
Green Bay
Cermak
Oakton
Armitage
Wol
f Rd
111th
135th
Com
mer
cial
Sheridan
137th
inbo
und
only
21st
Braga
20th
Church
SouthBlvd
Kennedy Expwy
Kennedy Expwy
Taylor
Bishop Ford Freeway
47th
Pershing
Lawrence
Harrison
Pula
ski
Kost
ner
Addison
Lawrence
93rd
Hyde Park Blvd
55th
59th
60thCo
ttage
Gro
ve
Ston
yIsl
and
Ellis
Woo
dlaw
n
Hyde
Par
k Bl
vd
50th
Blac
ksto
neDo
rche
ster57th
61st
Bryn Mawr
Indianapolis Blvd108th
53rd
Lake Shore Drive
Roscoe
Sout
hSh
ore
Rive
r Rd
Broadway
Montrose
Green
LakeLake
Desp
lain
es
92nd
Cortland
Cana
l
Ham
lin
St L
ouis
Cent
ral
Park
Gross
Point
Map
le
Midlothian
86th
Ave
LaGr
ange
25th
Grand
That
cher
Cum
berla
nd
Still
wel
l
31st
Elgin/Clark
Lake
Racin
e
Buffa
lo
60th
Montrose
Chica
go
McC
orm
ick
Golf
Cont
iPk
wy
Jarvis
Pratt
Hammm
lin
Asbu
ry
Jackson
28 weekdayrush to/fromPaulina/Congress
Burlington
A
B
C
D
E
F
G
H
I
J
K
L
A
B
C
D
E
F
G
H
I
J
K
L
1 2 3 4 5 6 7 8
1 2 3 4 5 6 7 8
Hyde Park
METRA UNION PACIF IC
NORTHWEST L INE
TO HARVARD
MET
RA
NO
RTH
CEN
TRA
LLI
NE
TO A
NTI
OC
H
METRA MILWAUKEE DISTRICT
WEST LINE TO ELGIN
METRA UNION PACIFICWEST LINE TO GENEVA
METRA BURLINGTON
NORTHERN SANTA FE
TO AURORA
METRA HERITAGE CORRID
OR TO JOLIET
MET
RA S
OUTHW
EST
SERV
ICE
TO O
RLAND P
ARK
Niles Free BusRoutes 411, 412, 413Call 847-588-7960
METRA M
ILWAUKEE
DISTRICT NO
RTH
LINE TO
FOX LAKE
to/from Irving ParkBlue Line Station
to Downtown(Monroe/Wabash)
to Oak Brook,Lombard,Downers Grove
MET
RA E
LECT
RIC
MA
IN L
INE
TOU
NIV
ERSI
TY P
ARK
MET
RA R
OC
K IS
LAN
D S
UBU
RBA
N L
INE
TO J
OLI
ETM
ETRA
RO
CK
ISLA
ND
MA
IN L
INE
TO J
OLI
ET
SEEDOWNTOWNMAP
to NorthMichigan Ave
nonstop betweenBelmont/Lake Shoreand Michigan/Delaware
nonstop betweenMarine/Foster andMichigan/Delaware
toLoop
owl serviceoperates overnight fromCentral/Ridge via Howard Stationto Granville Red Line Station
METRA
UNION PACIFIC
NORTH LINE TO
KENOSHA
nonstopbetween 47th/Lake Parkand 11th/Columbus
nonstopbetween 67th/Jefferyand 11th/Columbus
METRA ELECTRIC
SOUTH CHICAGOBRANCH
Connection toHammond TransitRoute 1call 219-853-6513
SOUTH SHORE L INETO EAST CHICAGO,GARY, MICHIGAN CITY,SOUTH BEND AIRPORT
METRA ELECTRIC BLUE ISLAND BRANCH
to Downtown
(Monroe/Wabash)
nonstopto Carver HS
to Downtown (Lake/Stetson)via Cermak and Michigan
nonstop betweenBelmont/Lake Shoreand Wacker/Columbus
nonstop betweenMarine/Bittersweet (4100N)and Wacker/Columbus
to NorthMichigan Ave
nonstop betweenMuseum of Science & Industryand 11th/Columbus
owl service operates overnight from Granville Stationvia Howard Station to Central/Ridge in Evanston
Express busesfrom RosemontCTA Station:284, 600, 606,610, 616, 637
localwestof 54th
S E P T E M B E R 2 0 0 3
Part-time service only
No stopsalong bus route
Free trainconnectionsat station
Point of interest
CTA bus routes (1-206)
Bus route terminal
CTA Trains and Stations
Brown LineBetween Kimball and downtown
Green LineBetween Harlem/Lake, downtown,and 63rd Street terminals
Orange LineBetween Midway Airportand downtown
Red LineBetween Howard, downtown,and 95th/Dan Ryan
Purple LineBetween Linden and Howard
Yellow LineBetween Skokie and Howard
Blue LineBetween O’Hare, downtown,and Forest Park or 54th/Cermak
Rail line and station
Part-time station only
Park & Ride lot
Chicago street numbers3600N
Night Owl service only
Expressway or tollway
Chicago street numbers start at Stateand Madison downtown. State Streetdivides east and west addresses, and MadisonStreet divides north and south addresses.Suburban street numbers vary; not all useChicago’s system. One mile is equal to 800street numbers. Example: Montrose (4400 N)is one mile north of Addison (3600 N).
Limited stopsalong bus route
Purple Line ExpressBetween Linden and downtown,weekday rush periods only
94
Accessible station
Pace bus routes (208 and up)
CTA and Pace Bus Routes
Belmont
Metra Commuter Rail
Other Symbols
Accessible CTA bus routes are markedin first bus/last bus chart on other side
000
00
000
000
N00
Automated station entranceEntry for farecards, passes, permits only.No farecard machines at this entrance.
O N E M I L E
NORTH
providesadditional servicebetween Hyde Park,the Loop and North Sideevery evening duringU of C school year.Call 836-7000 for info.
Special UPS limited-stop serviceSchedule coincides with shift changes.Call 836-7000 for details168 to/from UIC-Halsted CTA Blue Line station169 to/from 69th CTA Red Line station390 to/from Midway CTA Orange Line station391 to/from Madison/Cicero392 to/from Roosevelt/Cicero395 to/from 95th CTA Red Line station397 to/from 119th/Halsted890 to/from Harvey, Homewood, Chicago Heights891 to/from Gary, Indiana
Southbound Purple LineExpress stops here beforeCubs weekday night games
see schedule
see schedule
see schedule
nonstop to UPSsee schedule
nonstopto UPSsee schedule
nonstop to UPSsee schedule
nonstop betweenStockton/Arlington (2500N)and Wacker/Columbus
nonstop betweenStockton/Arlington (2500N)and Michigan/Delaware
to Oak Brook, Lombard,Downers Grove
via Archer, Halsted,Roosevelt, State
nonstop betweenMarine/Bittersweet (4100N)and Michigan/Delaware
nonstop betweenIrving Park/Lake Shoreand Michigan/Delaware
servedby 767
53A
326
77
76
152
81W
64
88
88
69
81W
331
331
209
56A
91
56A270
68 85
84254
82
92
81
78
80
81W
90 86 91
85
319
319
307
318 72 311
73
57
70
66
54 53
56
7652
74
7382
72
77
152
78
92
93
93
84
49B
49
56
20320
315311307
305
86
12657
7
85
74
20
1267
12
70
66
65
94
84
50
155
96
22
96
290
215147
155
250
215
36
147
151
14722
81
9
78
152
77
36
36
11
3622
22
76
221
221
234
209209
230
221
220230
209
209
270
240
241
250
226
228270
220208
208
208
220
210
421212
212
210
210
250
226
225 225
290
225
226
626
421
421
422423
421 422
213
212
208
208
208
212422
151
92
136
146
9
135
147
135146
147
210
210
97
97
54A
54A
254
241
241
240230
223
223 221
221
230
240
241 290
241
600606
610
616637
330
223
284
332
330
326 325
54A 254
56
50
8
73
3772
N77
33
319
319
319
319 330 325
319
309 318
309
303
331
313313309
305
320
310 303
301 308301
325
767
757
767
747
747 757
330
304
331
322
757767
65
135136
145146
3622
146
757
5354
1291
315
305
767
322
331
308
302
669
330
330330
311
302
302
307 311
315
302
305
305
855
855
669
54B60
53
53A
60
21
18
82
82
21
1237
37
52 94
18
50
9
18
2019
126
6533
52
X21
49
N62
24X21
21
44
24
8
35
35
35
39
43
47
43
43
47
39
9
2
8
15
2
106
35
39
62
62
94
52
52A
52
67
52A
53A
62
54B
47
55N 55A
62H
62H
307
831165
55A 55N
386
382
382
63 63
59
51
48
4948
4849
67
79
67
71
75
79
87
3071
24 24
6729
2929
24
67
449
24
87
54B
79
383385
385
384386379
379381 385 386
381 AM
835
385 385384
835
386
386
384
386
383
383384
381 381 835
382383SAT
381
383
103
112
119
52A
103
53A
LTD
9
30
30
N5
N5
N5
N5
N5
71
15
103
100
100
100
106
111
111
119
N595E
95E
X3
3
X3
3
X3
28353
11934
10334
106119
10895W
N9
108
34
34
353
34
8A
386
385
385
383
383877
877385
359
359
385
349 877
352359
359
352 353
1088A
30358
355
71
52A
49A349
49A349
95W
8A
226
97 215
49B
85A
90N
228
68
209
90
85
53
145
156
8
74
11
151156
N20309 313
310303
767322
N60
60
50
83138663W63W
382
379 384
37954B
382383384385
53ALTD
94
75
59
62
10
54A
N201
240
220
234
325
326
332
332
270
225
226
85A
210
210
317317
331
305
108
151
136
136
7
52A
111
49A
X21 25
34
385
72
304
44
254
254
56A
11
11
81
77
N9
304
63
N5
835
835
3
N6247
47
318
N5
N201
831
831
831
154
147
X49
X49
X49
X49
X49
62
N5
111
312
312
172
171
170
172
171
59
2 15
28
364
173
X4949
87
307
220
330
8
79 169169
169
49A
349
X3
3
172
9191
80
355
75
359
112
352
352381
307
168
168
168
379 169
54A
55
78
80 80
X98
151
205
N4
112
87
50
3
X80
82
X80
11
96
59
151
212
205
205201 206
206
AM
206
93
205
135
134
134
143
144
143
145
136
144
144
145
21
26
352
200
206
PM206
4
28
28
6
14
14
15
14
28
28 15
201205
201
290
93
AMPM
201
PMAM
97
151
888
272
28
144
1
1
X4
X4
X4
X4
X55 X55
30
30
26
87
26
26
26
26
636
28
2
AMPM
AM PM
2
1426
10
2628
14
2
X4
2
2
2
AM PM
AMPM
4
4
4
55
55X55
172
172
17 17
18
X3X4
3
51
14
1
95E
359
136144
151156
156
151
6
71
628
4
28
171
29
39
71
78
6
15
2
6
15
93
208208
145
26
10
55X55
37
7
X80
AMPM
AMPM
15
170
6
15
213
Chicago Transit Authority
02sk031V
Related Documents