200 4 ANNUAL REPORT Nintendo Co., Ltd.

Welcome message from author
This document is posted to help you gain knowledge. Please leave a comment to let me know what you think about it! Share it to your friends and learn new things together.
Transcript
2 0 0 4 A N N U A L R E P O R T
N i n t e n d o C o . , L t d .
Nello Giambi / Getty Images
Since the launch of Famicom in 1983, video game industry revenue has grown to exceed that of the
movie industry. During that time span, Nintendo has become a well-recognized international brand
name, known for developing quality hardware products that enable the creation of unique games that are
enjoyed by people regardless of nationality, culture, age or gender. The breadth and diversity of
Nintendo's fan base illustrates the distinctive appeal of our products.
Unfortunately, in the current market, increasing numbers of casual gamers are not picking up controllers
because games created using the old formula for success are no longer as appealing as they once were.
Increasingly complex games with intricate game controls, while popular with avid game enthusiasts, are
not what the majority of the game playing public is seeking. Most players are not looking for games that
require them to invest large amounts of time and energy, instead most want games they can enjoy
periodically, when there's a free moment in their day.
Nintendo's powerful software development teams have the most impressive track record in the history of
video games. Using our unparalleled talent and resources, Nintendo will continue to create innovative
entertainment which resets players to the same starting point, regardless of the age, gender or whether
they've played a video game. The first and most visible example of this effort will be our new handheld
product, code-named Nintendo DS. With dual screens, touch capabilities, wireless communication, voice
recognition technology and other unique features, this unprecedented portable game device will bring
gaming to a new dimension.
Currently, the game play skills of avid gamers far surpass those of novice players. Led by Nintendo, the
industry needs to present a style of play that levels the playing field, so players of all skill levels can enjoy
video games. In order to expand the market, we need to place everybody back at the same starting point.
Our efforts won't stop there. Nintendo's renewed focus will also effect software under development for
Nintendo GameCube and Game Boy Advance. All together, our efforts will begin a gaming revolution.
In Japan, the software market has been shrinking for the past few years and the North American market,
which used to experience significant growth year after year, is seeing a slowing of that trend. Under
such circumstances, a revolutionary approach to video game creation is required more than ever.
Satoru Iwata
President
Nintendo Co., Ltd.
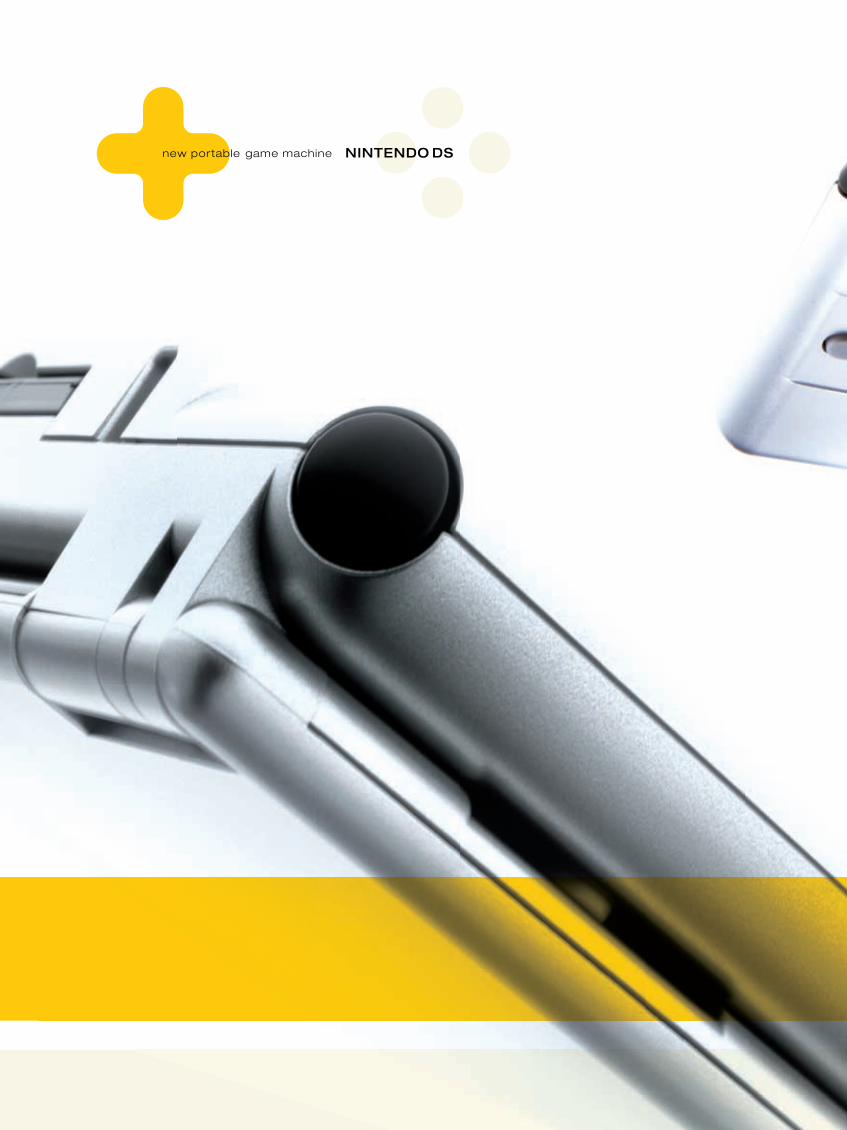
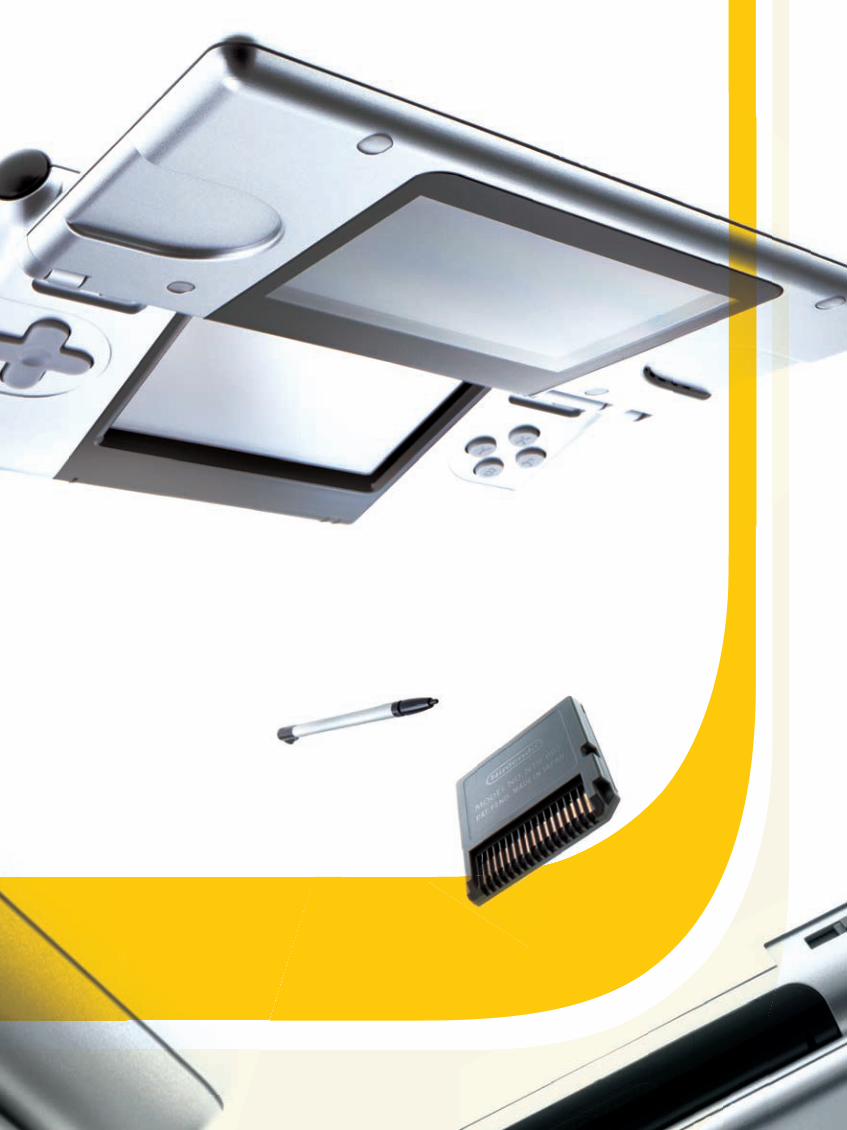
new portable game machine NINTENDO DS

Seth Kushner / Getty Images
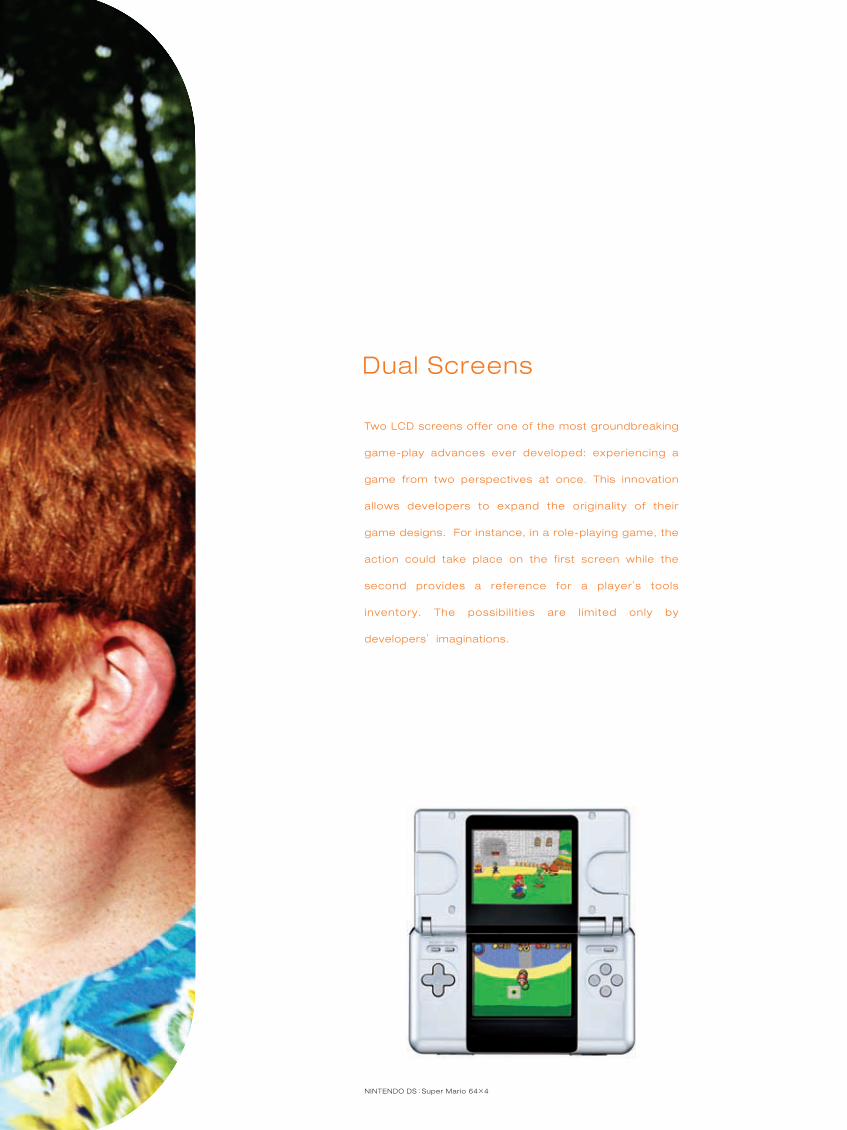
Two LCD screens offer one of the most groundbreaking
game-play advances ever developed: experiencing a
game from two perspectives at once. This innovation
al lows developers to expand the original ity of their
game designs. For instance, in a role-playing game, the
action could take place on the first screen while the
second provides a reference for a player 's tools
inventory. The possibi l i t ies are l imited only by
developers ' imaginations.
Dual Screens
NINTENDO DS : Super Mario 64×4

Tony Latham / Getty Images
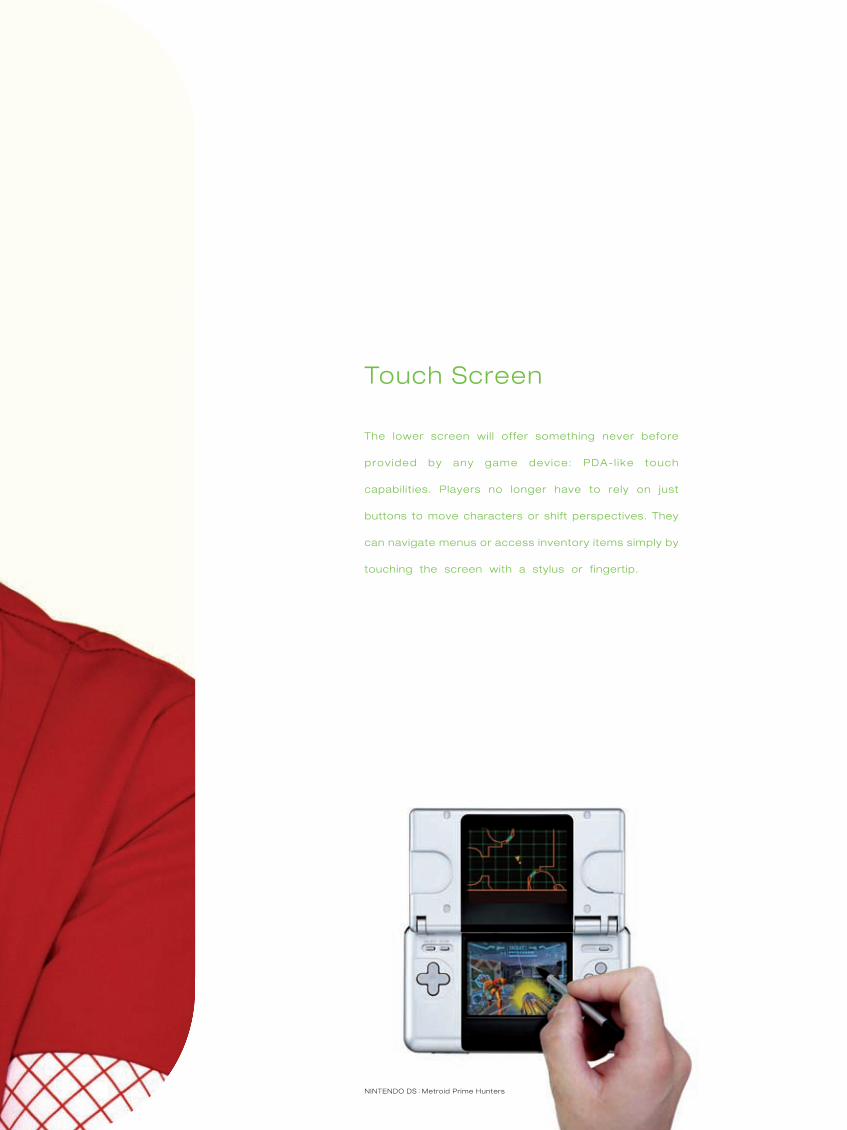
The lower screen wil l offer something never before
prov ided by any game dev ice: PDA- l ike touch
capabil it ies. Players no longer have to rely on just
buttons to move characters or shift perspectives. They
can navigate menus or access inventory items simply by
touching the screen with a stylus or fingertip.
Touch Screen
NINTENDO DS : Metroid Prime Hunters

Joe McBride / Getty Images
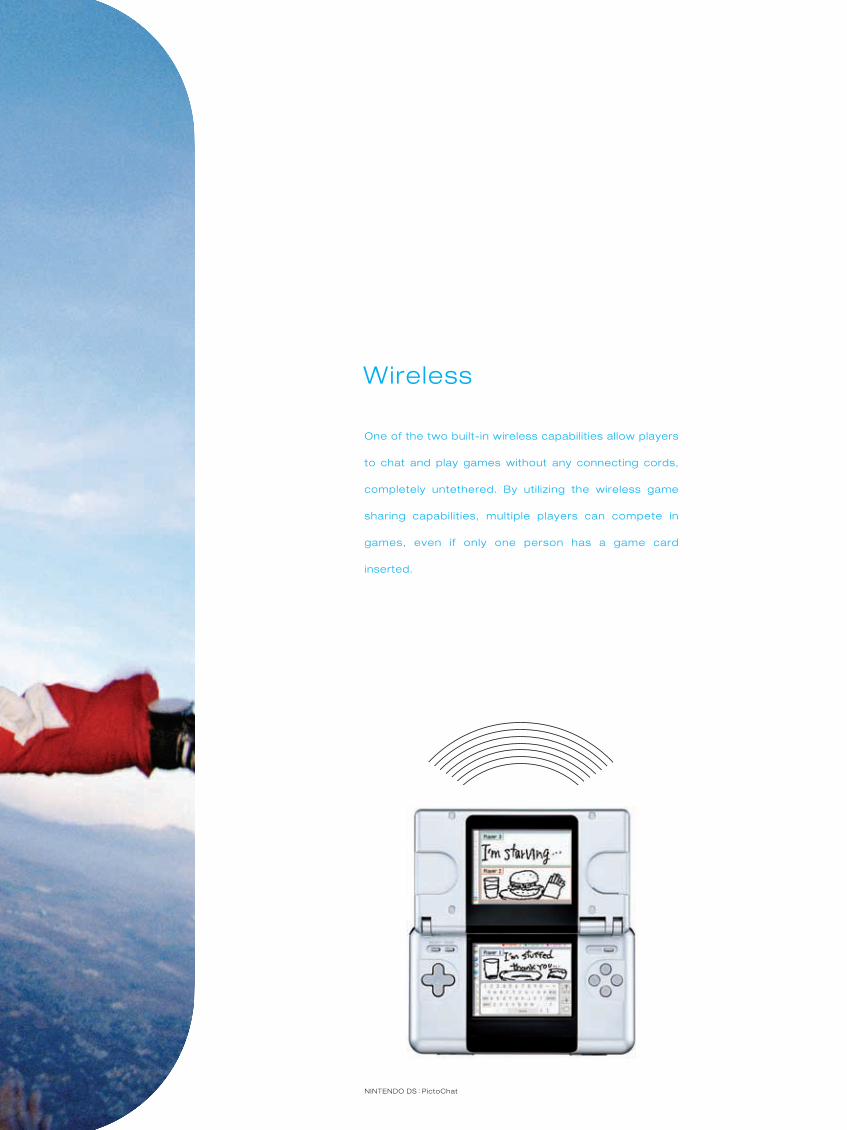
One of the two built-in wireless capabilities allow players
to chat and play games without any connecting cords,
completely untethered. By util izing the wireless game
sharing capabil it ies, multiple players can compete in
games, even if only one person has a game card
inserted.
Wireless
NINTENDO DS : PictoChat

Ma Reynolds / Getty Images
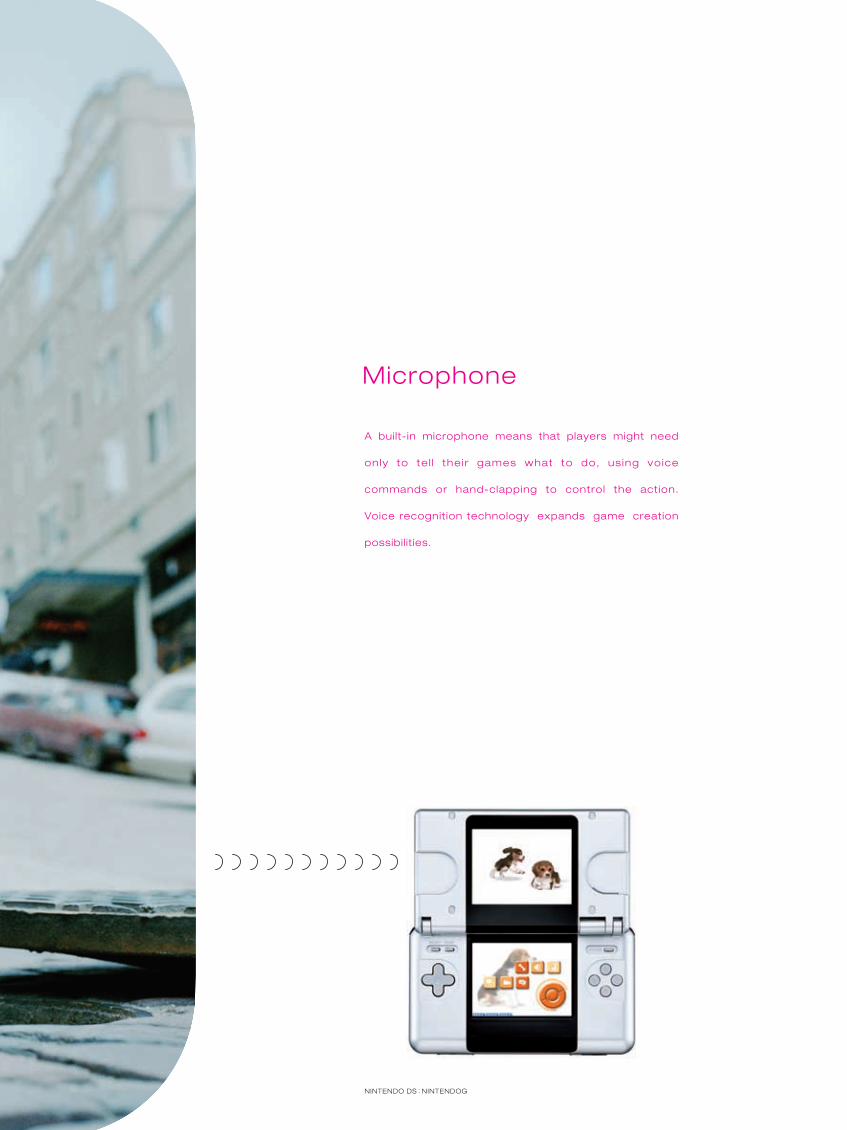
A built-in microphone means that players might need
only to te l l the i r games what to do, us ing vo ice
commands or hand-clapping to control the action.
Voice recognition technology expands game creation
possibil ities.
Microphone
NINTENDO DS : NINTENDOG

Nintendo DS is its tentative name.The hardware design and screen shots for Nintendo DS presented herein are currently under development.
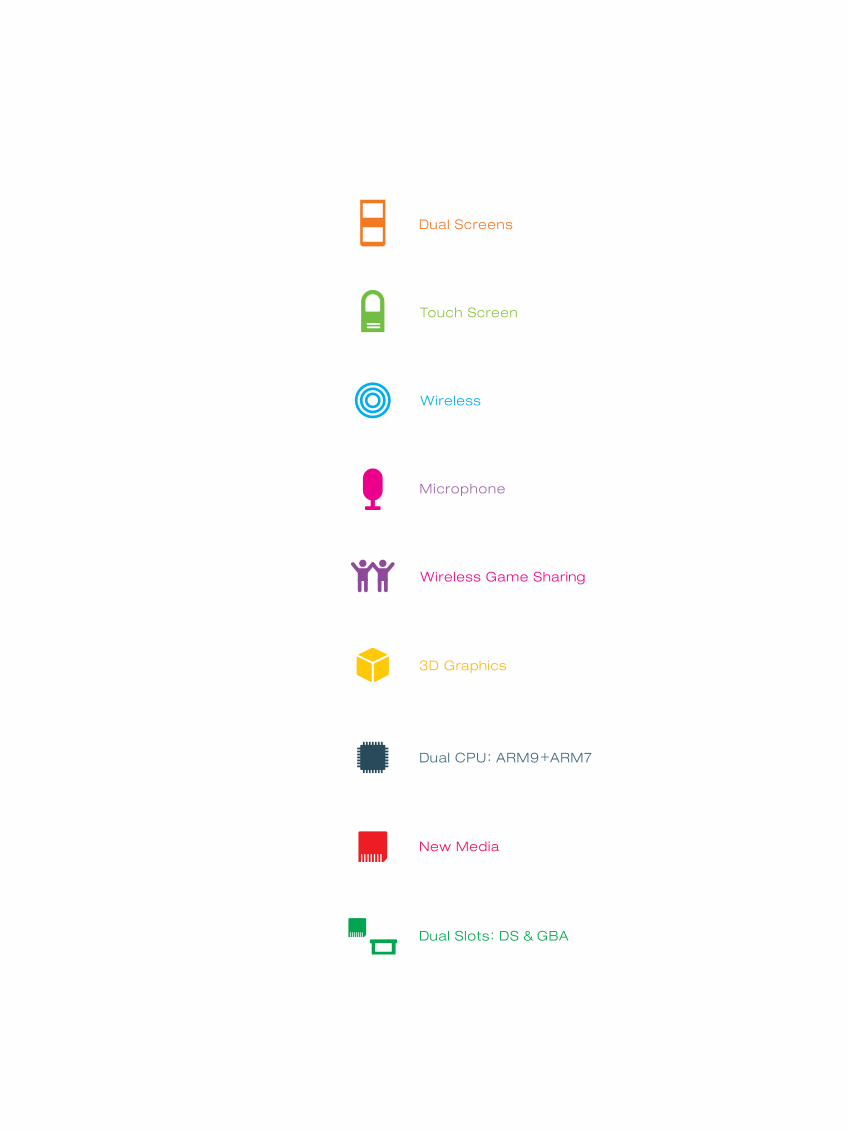
Dual Screens
Touch Screen
Wireless
Microphone
Wireless Game Sharing
3D Graphics
Dual CPU: ARM9+ARM7
New Media
Dual Slots: DS & GBA


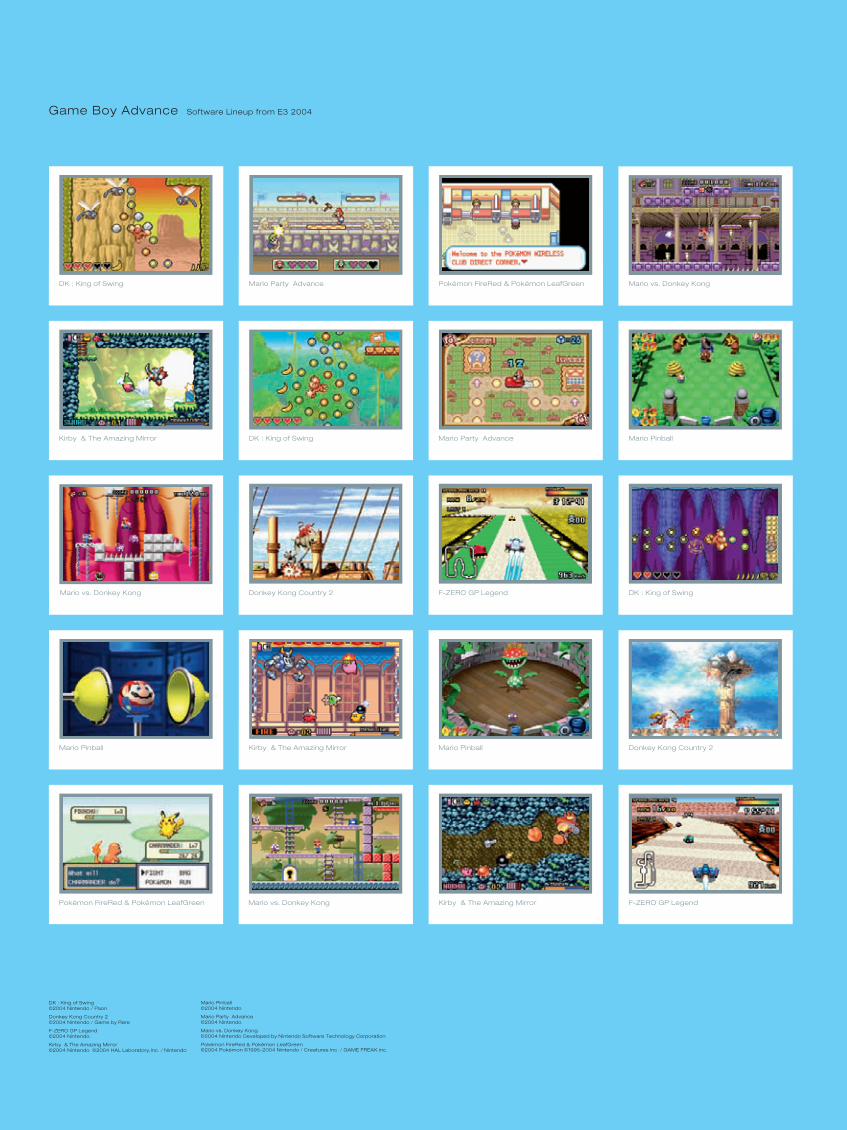
Game Boy Advance Software Lineup from E3 2004
DK : King of Swing©2004 Nintendo / Paon
Donkey Kong Country 2©2004 Nintendo / Game by Rare
F-ZERO GP Legend©2004 Nintendo
Kirby & The Amazing Mirror©2004 Nintendo ©2004 HAL Laboratory,Inc. / Nintendo
Mario Pinball©2004 Nintendo
Mario Party Advance©2004 Nintendo
Mario vs. Donkey Kong©2004 Nintendo Developed by Nintendo Software Technology Corporation
Pokémon FireRed & Pokémon LeafGreen ©2004 Pokémon ©1995-2004 Nintendo / Creatures Inc. / GAME FREAK inc.
Pokémon FireRed & Pokémon LeafGreen Mario vs. Donkey Kong Kirby & The Amazing Mirror F-ZERO GP Legend
Mario vs. Donkey Kong F-ZERO GP Legend DK : King of SwingDonkey Kong Country 2
Donkey Kong Country 2Mario Pinball Kirby & The Amazing Mirror Mario Pinball
Kirby & The Amazing Mirror Mario PinballMario Party AdvanceDK : King of Swing
Pokémon FireRed & Pokémon LeafGreen Mario vs. Donkey KongMario Party AdvanceDK : King of Swing
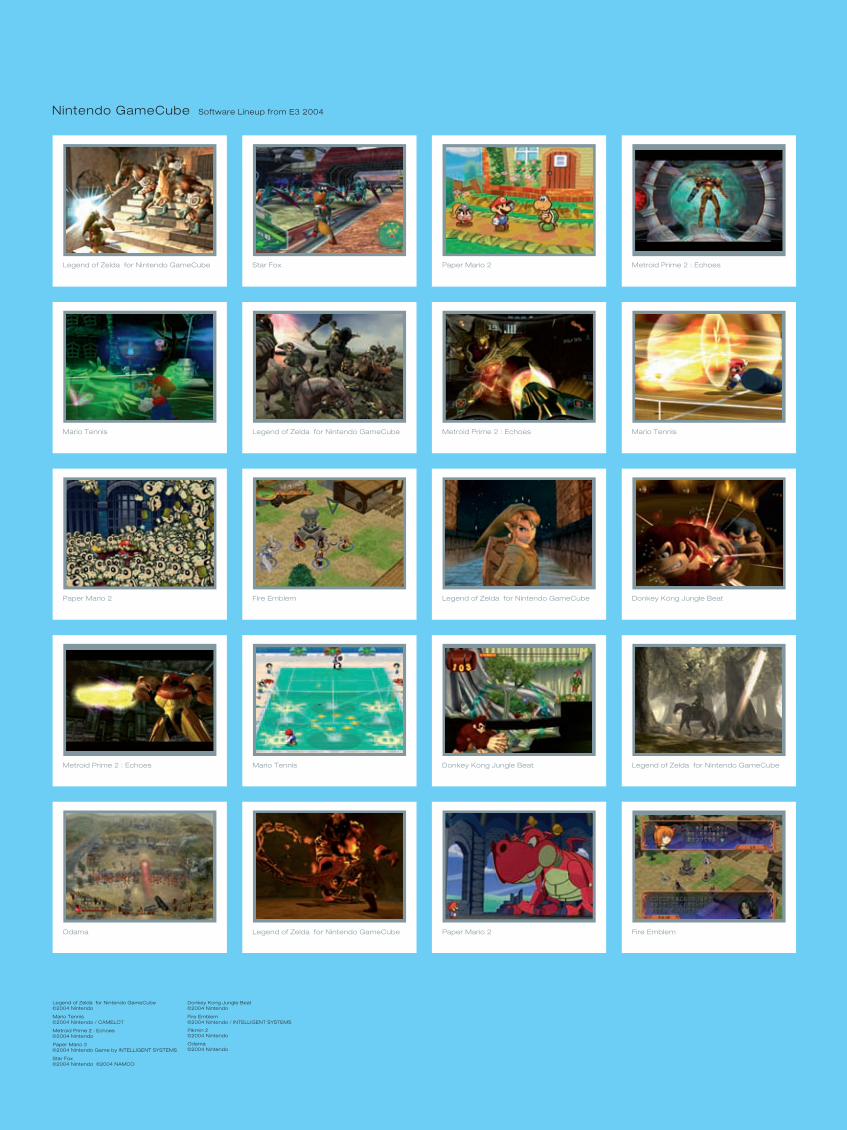
Nintendo GameCube Software Lineup from E3 2004
Legend of Zelda for Nintendo GameCube©2004 Nintendo
Mario Tennis©2004 Nintendo / CAMELOT
Metroid Prime 2 : Echoes©2004 Nintendo
Paper Mario 2 ©2004 Nintendo Game by INTELLIGENT SYSTEMS
Star Fox©2004 Nintendo ©2004 NAMCO
Donkey Kong Jungle Beat©2004 Nintendo
Fire Emblem©2004 Nintendo / INTELLIGENT SYSTEMS
Pikmin 2 ©2004 Nintendo
Odama©2004 Nintendo
Odama Legend of Zelda for Nintendo GameCube Paper Mario 2 Fire Emblem
Metroid Prime 2 : Echoes Mario Tennis Donkey Kong Jungle Beat Legend of Zelda for Nintendo GameCube
Paper Mario 2 Fire Emblem Legend of Zelda for Nintendo GameCube Donkey Kong Jungle Beat
Mario Tennis Legend of Zelda for Nintendo GameCube Metroid Prime 2 : Echoes Mario Tennis
Legend of Zelda for Nintendo GameCube Star Fox Paper Mario 2 Metroid Prime 2 : Echoes
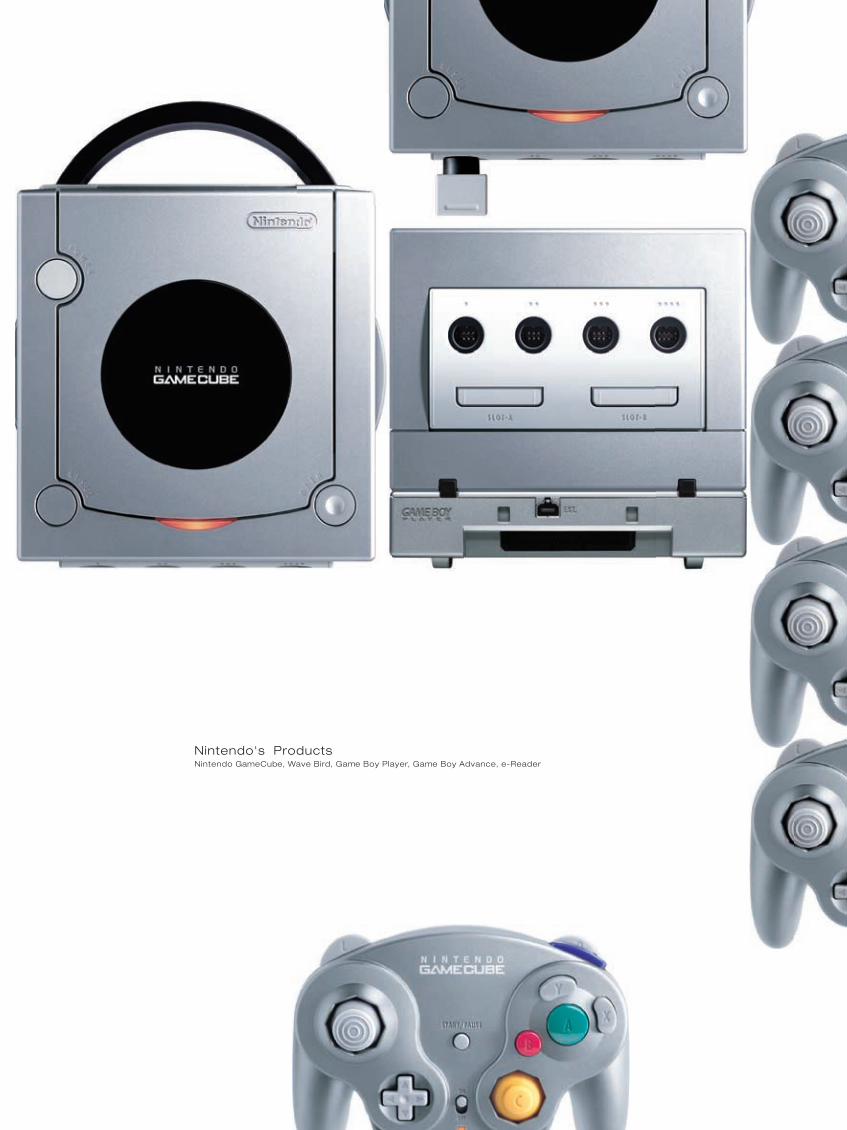
Nintendo's ProductsNintendo GameCube, Wave Bird, Game Boy Player, Game Boy Advance, e-Reader
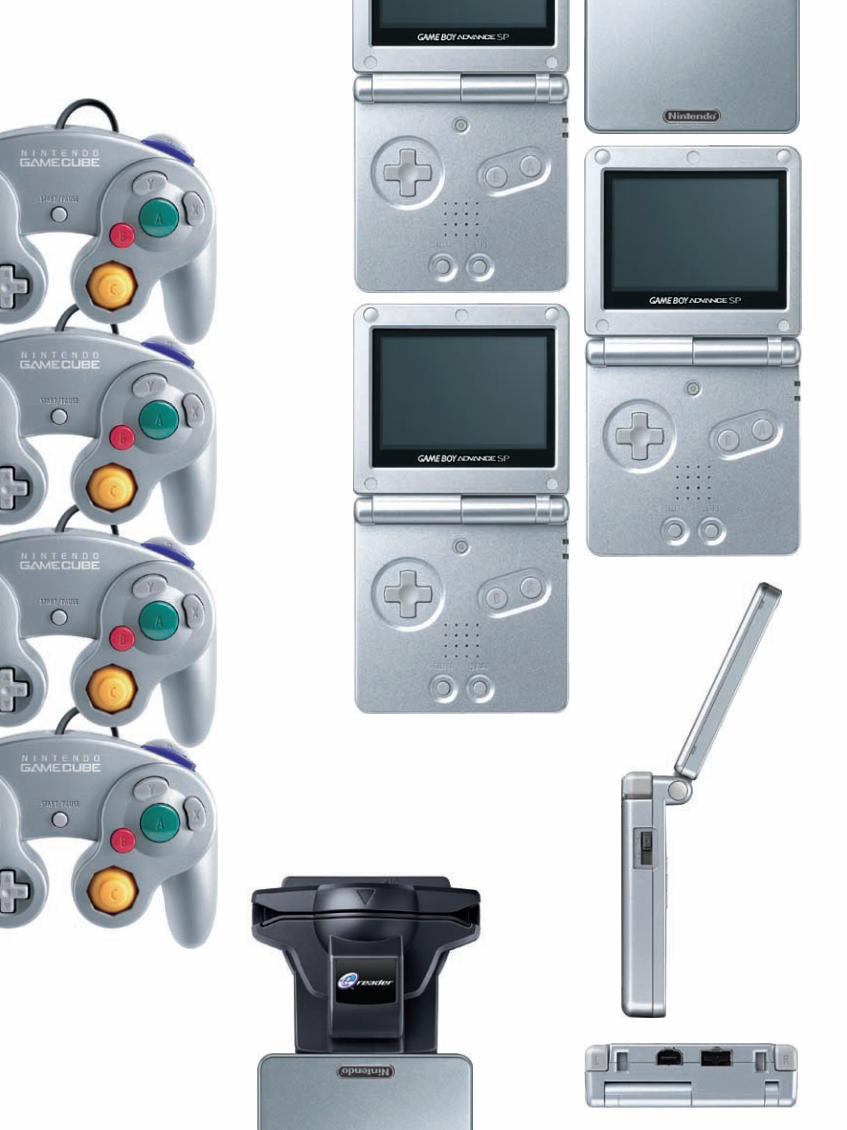
Nintendo GameCubeSince it's domestic launch in September
2001, worldwide cumulative unit sales
reached 14.57 mil l ion (domestic sales
were 3.46 million). With more than 100
mill ion copies of software sold to date,
it demonstrates that GameCube owners
love Nintendo's quality software.�
Color variation ----- GC Controller
Everyone wants to be "free" when they
play! The WaveBird Wireless Controller
realizes this dream by eliminating cords
and al lowing Nintendo GameCube
lovers to play "free" for more than 100
hours without replacing the batteries.
�
WaveBirdNintendo GameCube Wireless Controller
Do you know how to enjoy more than
1,500 Game Boy games on you television?
The answer is the Game Boy Player.
Simply attach the Game Boy Player to
the bottom of the Nintendo GameCube,
and you can sit back, relax and play
your favorite Game Boy games on the big
screen.
Game Boy PlayerNintendo GameCube
*as of March 2004
4-player game play
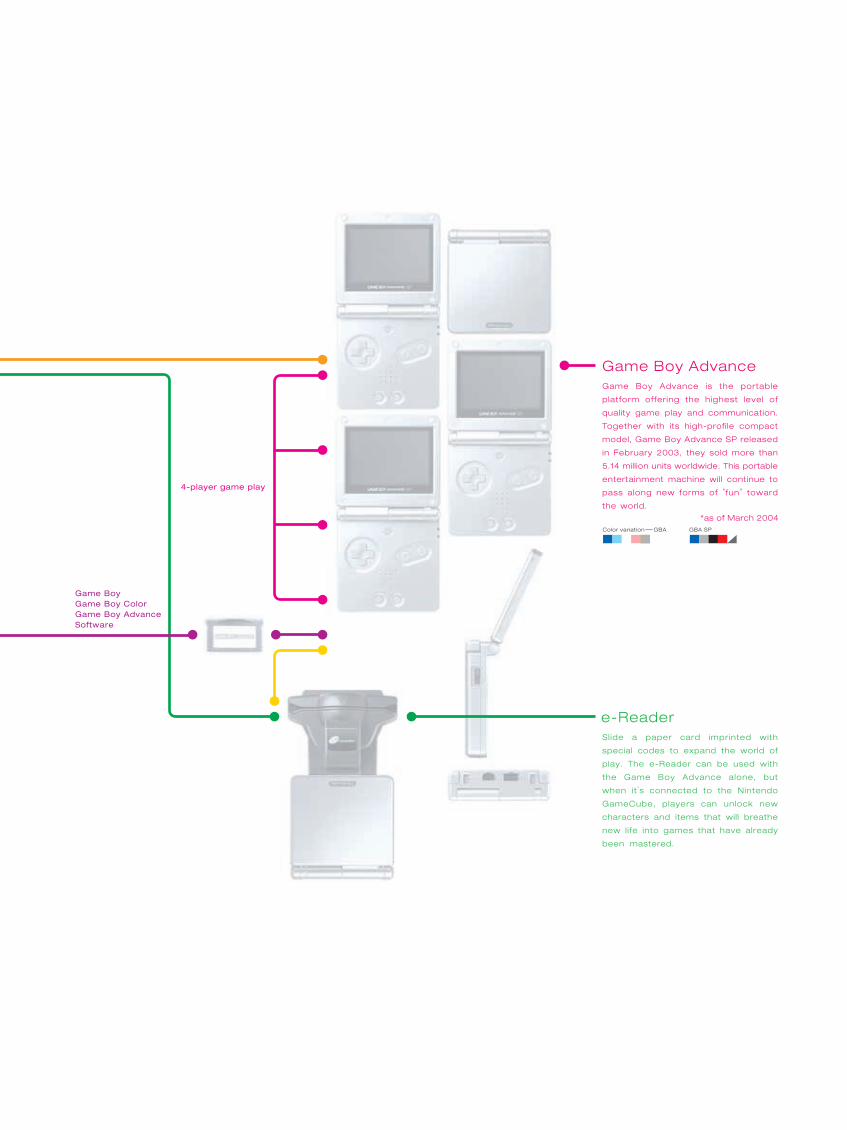
Game Boy AdvanceGame Boy Advance is the portable
platform offering the highest level of
quality game play and communication.
Together with its high-profile compact
model, Game Boy Advance SP released
in February 2003, they sold more than
5.14 million units worldwide. This portable
entertainment machine will continue to
pass along new forms of "fun" toward
the world.�
Color variation ----- GBA GBA SP
e-ReaderSlide a paper card imprinted with
special codes to expand the world of
play. The e-Reader can be used with
the Game Boy Advance alone, but
when it 's connected to the Nintendo
GameCube, players can unlock new
characters and items that will breathe
new l ife into games that have already
been mastered.
*as of March 2004
4-player game play
Game BoyGame Boy ColorGame Boy AdvanceSoftware
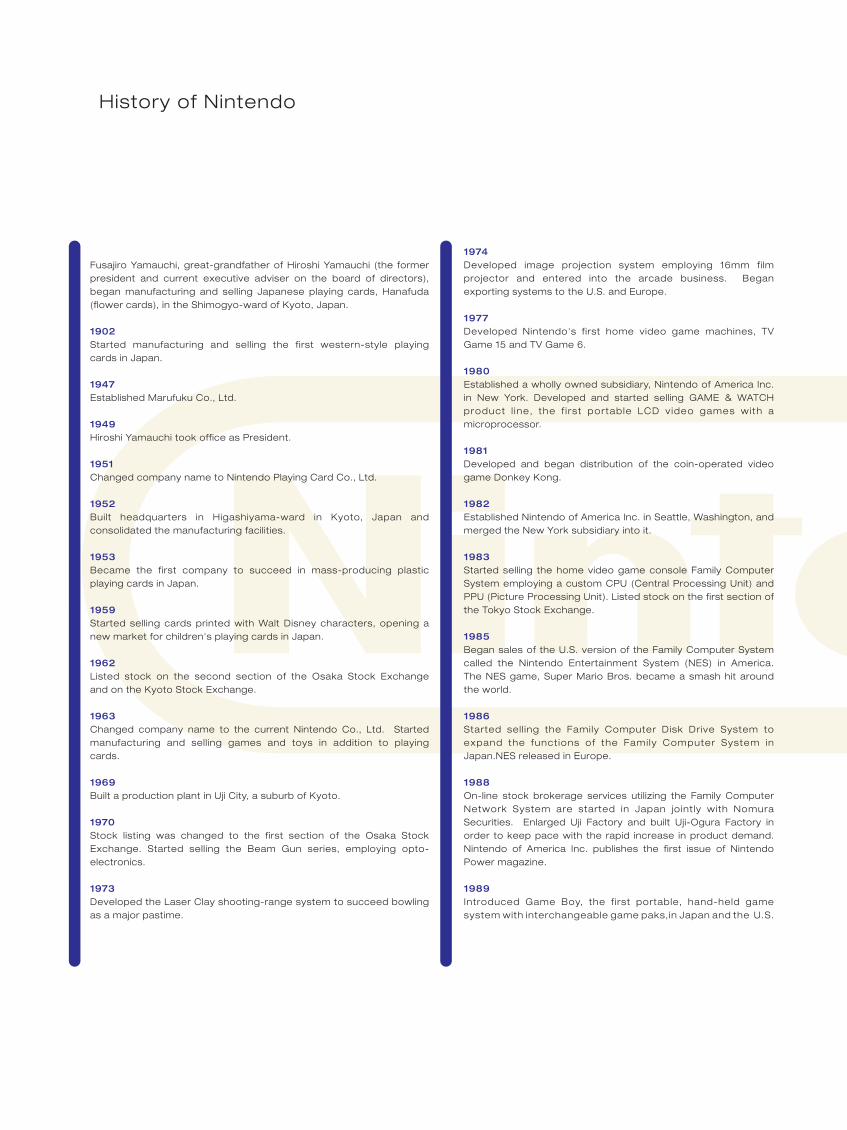
Fusajiro Yamauchi, great-grandfather of Hiroshi Yamauchi (the former president and current executive adviser on the board of directors), began manufacturing and selling Japanese playing cards, Hanafuda (flower cards), in the Shimogyo-ward of Kyoto, Japan.
1902Started manufacturing and selling the first western-style playing cards in Japan.
1947Established Marufuku Co., Ltd.
1949Hiroshi Yamauchi took office as President.
1951Changed company name to Nintendo Playing Card Co., Ltd.
1952Built headquarters in Higashiyama-ward in Kyoto, Japan and consolidated the manufacturing facilities.
1953Became the first company to succeed in mass-producing plastic playing cards in Japan.
1959Started selling cards printed with Walt Disney characters, opening a new market for children's playing cards in Japan.
1962Listed stock on the second section of the Osaka Stock Exchange and on the Kyoto Stock Exchange.
1963Changed company name to the current Nintendo Co., Ltd. Started manufacturing and selling games and toys in addition to playing cards.
1969Built a production plant in Uji City, a suburb of Kyoto.
1970Stock listing was changed to the first section of the Osaka Stock Exchange. Started selling the Beam Gun series, employing opto-electronics.
1973Developed the Laser Clay shooting-range system to succeed bowling as a major pastime.
1974Developed image projection system employing 16mm film projector and entered into the arcade business. Began exporting systems to the U.S. and Europe.
1977Developed Nintendo's first home video game machines, TV Game 15 and TV Game 6.
1980Established a wholly owned subsidiary, Nintendo of America Inc. in New York. Developed and started selling GAME & WATCH product l ine, the f i rs t portab le LCD v ideo games wi th a microprocessor.
1981Developed and began distribution of the coin-operated video game Donkey Kong.
1982Established Nintendo of America Inc. in Seattle, Washington, and merged the New York subsidiary into it.
1983Started selling the home video game console Family Computer System employing a custom CPU (Central Processing Unit) and PPU (Picture Processing Unit). Listed stock on the first section of the Tokyo Stock Exchange.
1985Began sales of the U.S. version of the Family Computer System called the Nintendo Entertainment System (NES) in America. The NES game, Super Mario Bros. became a smash hit around the world.
1986Started sel l ing the Family Computer Disk Drive System to expand the funct ions of the Fami ly Computer System in Japan.NES released in Europe.
1988On-line stock brokerage services utilizing the Family Computer Network System are started in Japan joint ly with Nomura Securities. Enlarged Uji Factory and built Uji-Ogura Factory in order to keep pace with the rapid increase in product demand. Nintendo of America Inc. publishes the first issue of Nintendo Power magazine.
1989Introduced Game Boy, the f irst portable, hand-held game system with interchangeable game paks, in Japan and the U.S.
History of Nintendo
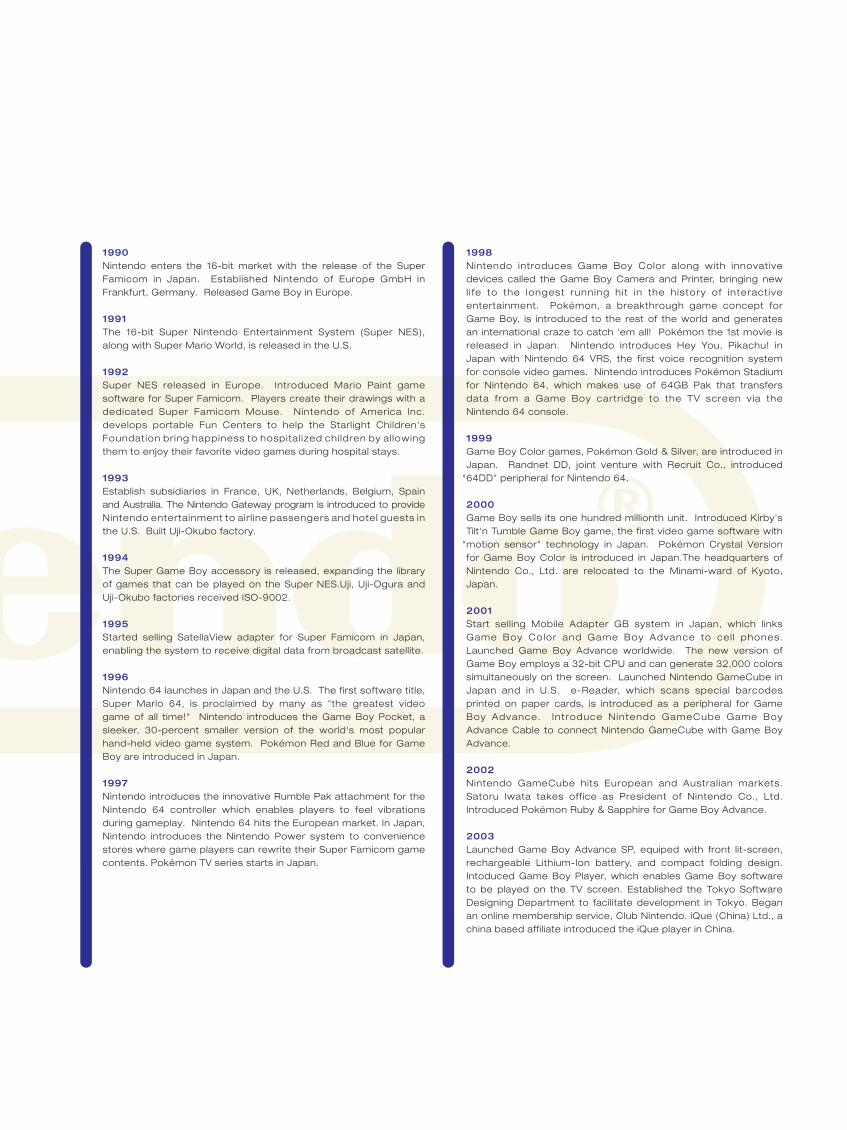
1990Nintendo enters the 16-bit market with the release of the Super Famicom in Japan. Established Nintendo of Europe GmbH in Frankfurt, Germany. Released Game Boy in Europe.
1991The 16-bit Super Nintendo Entertainment System (Super NES), along with Super Mario World, is released in the U.S.
1992Super NES released in Europe. Introduced Mario Paint game software for Super Famicom. Players create their drawings with a dedicated Super Famicom Mouse. Nintendo of America Inc. develops portable Fun Centers to help the Starlight Children's Foundat ion br ing happiness to hospita l ized chi ldren by al lowing them to enjoy their favorite video games during hospital stays.
1993Establish subsidiaries in France, UK, Netherlands, Belgium, Spain and Australia. The Nintendo Gateway program is introduced to provide Nintendo entertainment to air l ine passengers and hotel guests in the U.S. Built Uji-Okubo factory.
1994The Super Game Boy accessory is released, expanding the library of games that can be played on the Super NES.Uji, Uji-Ogura and Uji-Okubo factories received ISO-9002.
1995Started selling SatellaView adapter for Super Famicom in Japan, enabling the system to receive digital data from broadcast satellite.
1996Nintendo 64 launches in Japan and the U.S. The first software title, Super Mario 64, is proclaimed by many as "the greatest video game of all time!" Nintendo introduces the Game Boy Pocket, a sleeker, 30-percent smaller version of the world's most popular hand-held video game system. Pokémon Red and Blue for Game Boy are introduced in Japan.
1997Nintendo introduces the innovative Rumble Pak attachment for the Nintendo 64 controller which enables players to feel vibrations during gameplay. Nintendo 64 hits the European market. In Japan, Nintendo introduces the Nintendo Power system to convenience stores where game players can rewrite their Super Famicom game contents. Pokémon TV series starts in Japan.
1998Nintendo introduces Game Boy Color along with innovative devices called the Game Boy Camera and Printer, bringing new l i fe to the longest running h i t in the h istory of interact ive entertainment. Pokémon, a breakthrough game concept for Game Boy, is introduced to the rest of the world and generates an international craze to catch 'em all! Pokémon the 1st movie is released in Japan. Nintendo introduces Hey You, Pikachu! in Japan with Nintendo 64 VRS, the first voice recognition system for console video games. Nintendo introduces Pokémon Stadium for Nintendo 64, which makes use of 64GB Pak that transfers data from a Game Boy cartr idge to the TV screen via the Nintendo 64 console.
1999Game Boy Color games, Pokémon Gold & Silver, are introduced in Japan. Randnet DD, joint venture with Recruit Co., introduced
"64DD" peripheral for Nintendo 64.
2000Game Boy sells its one hundred millionth unit. Introduced Kirby's Tilt'n Tumble Game Boy game, the first video game software with
"motion sensor" technology in Japan. Pokémon Crystal Version for Game Boy Color is introduced in Japan.The headquarters of Nintendo Co., Ltd. are relocated to the Minami-ward of Kyoto, Japan.
2001Start selling Mobile Adapter GB system in Japan, which links Game Boy Color and Game Boy Advance to ce l l phones. Launched Game Boy Advance worldwide. The new version of Game Boy employs a 32-bit CPU and can generate 32,000 colors simultaneously on the screen. Launched Nintendo GameCube in Japan and in U.S. e-Reader, which scans special barcodes printed on paper cards, is introduced as a peripheral for Game Boy Advance. Int roduce Nintendo GameCube Game Boy Advance Cable to connect Nintendo GameCube with Game Boy Advance.
2002Nintendo GameCube hits European and Austral ian markets. Satoru Iwata takes office as President of Nintendo Co., Ltd. Introduced Pokémon Ruby & Sapphire for Game Boy Advance.
2003Launched Game Boy Advance SP, equiped with front lit-screen, rechargeable Lithium-Ion battery, and compact folding design. Intoduced Game Boy Player, which enables Game Boy software to be played on the TV screen. Established the Tokyo Software Designing Department to facilitate development in Tokyo. Began an online membership service, Club Nintendo. iQue (China) Ltd., a china based affiliate introduced the iQue player in China.
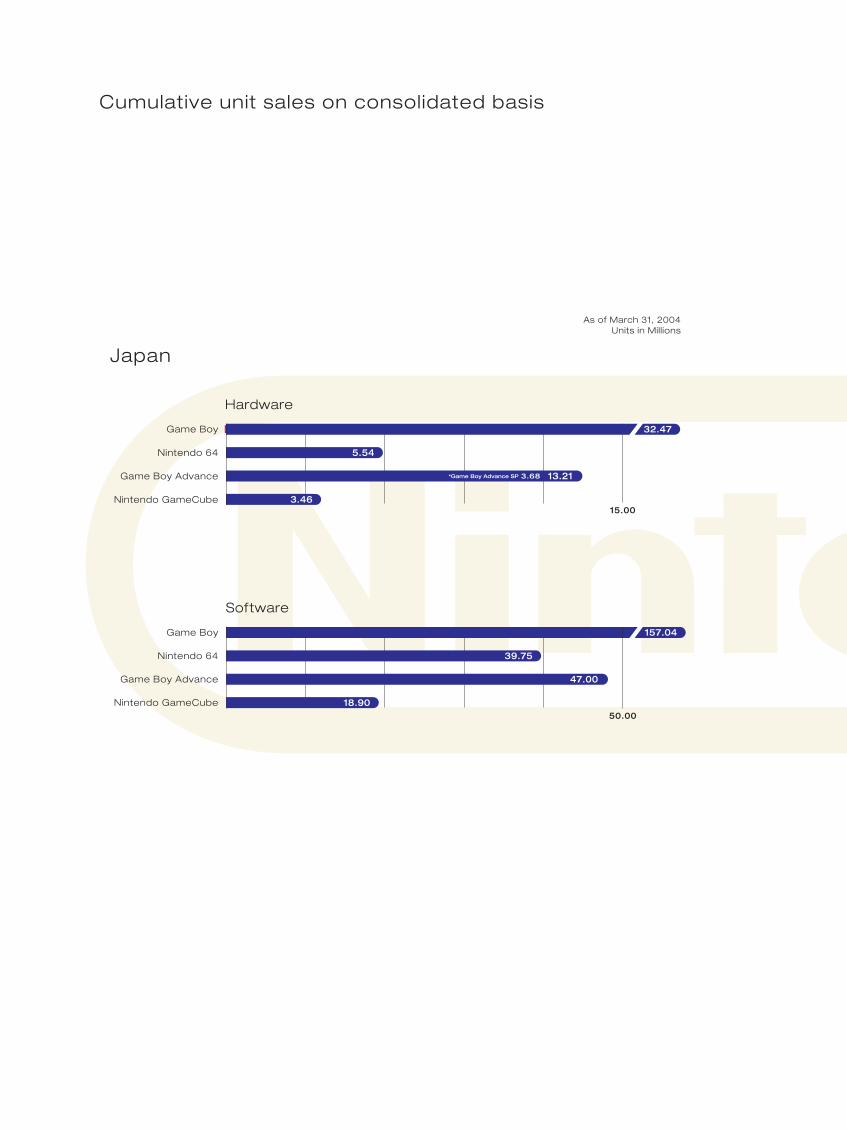
Hardware
15.00
5.54
Japan
Game Boy
Nintendo 64
Game Boy Advance
Nintendo GameCube
Game Boy
Nintendo 64
Game Boy Advance
Nintendo GameCube
Software
50.00
157.04
47.00
18.90
39.75
As of March 31, 2004Units in Millions
Cumulative unit sales on consolidated basis
3.46
13.21
32.47
*Game Boy Advance SP 3.68
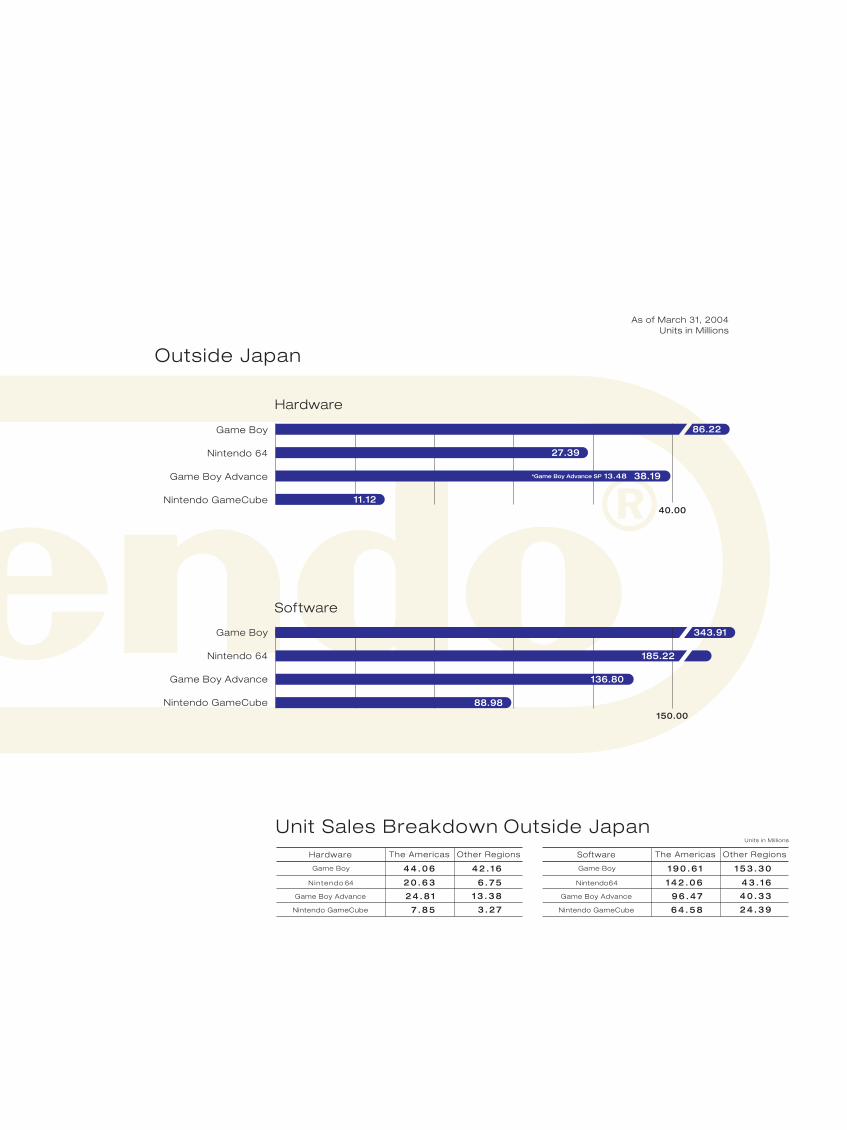
Unit Sales Breakdown Outside JapanUnits in Mill ions
Hardware The Americas Other Regions
Game Boy
Nintendo 64
Game Boy Advance
4 4 . 0 6 4 2 . 1 6
2 0 . 6 3 6 . 7 5
2 4 . 8 1 1 3 . 3 8
Nintendo GameCube 7 . 8 5 3 . 2 7
Software The Americas Other Regions
Game Boy
Nintendo64
Game Boy Advance
1 9 0 . 6 1 1 5 3 . 3 0
1 4 2 . 0 6 4 3 . 1 6
9 6 . 4 7 4 0 . 3 3
Nintendo GameCube 6 4 . 5 8 2 4 . 3 9
Game Boy
Nintendo 64
Game Boy Advance
Nintendo GameCube
Game Boy
Nintendo 64
Game Boy Advance
Nintendo GameCube
As of March 31, 2004Units in Millions
18,522
5,011
Software
150.00
343.91
136.80
88.98
185.22
Outside Japan
Hardware
40.00
86.22
11.12
27.39
38.19 *Game Boy Advance SP 13.48
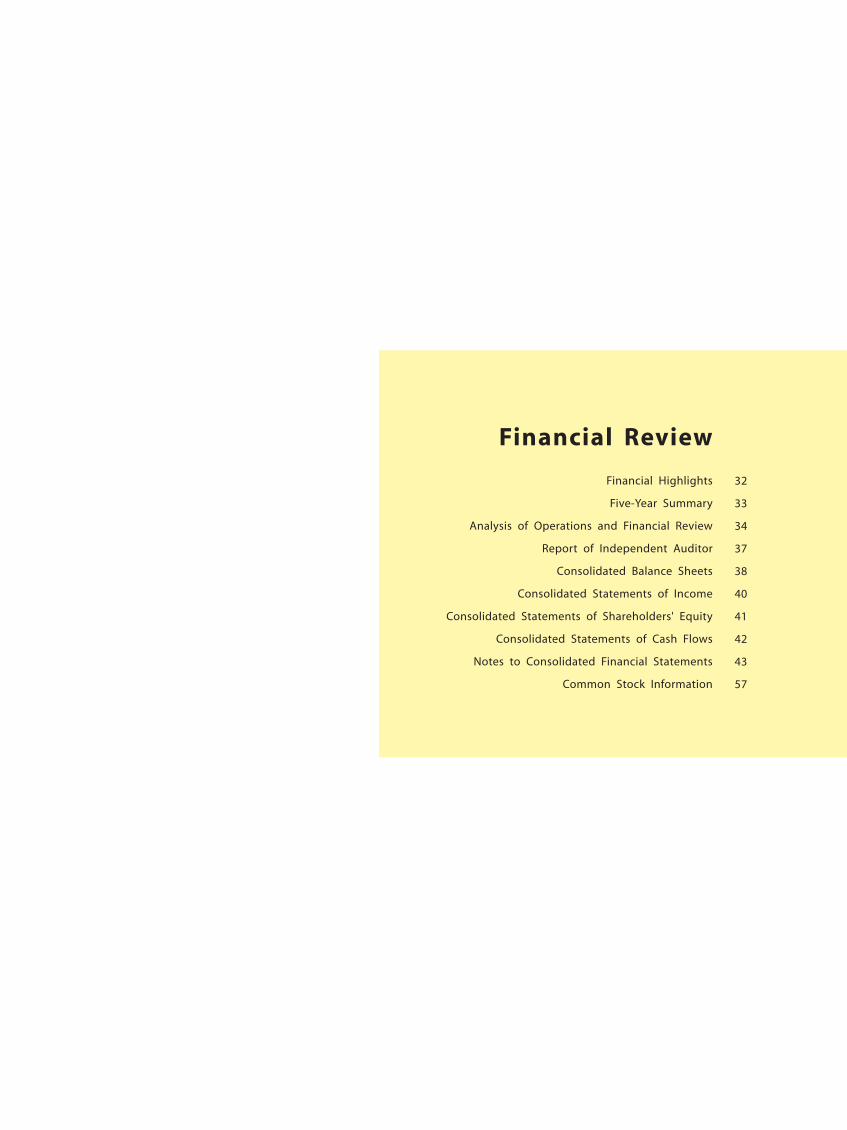
Financial Review
Financial Highlights
Five-Year Summary
Analysis of Operations and Financial Review
Report of Independent Auditor
Consolidated Balance Sheets
Consolidated Statements of Income
Consolidated Statements of Shareholders' Equity
Consolidated Statements of Cash Flows
Notes to Consolidated Financial Statements
Common Stock Information
32
33
34
37
38
40
41
42
43
57
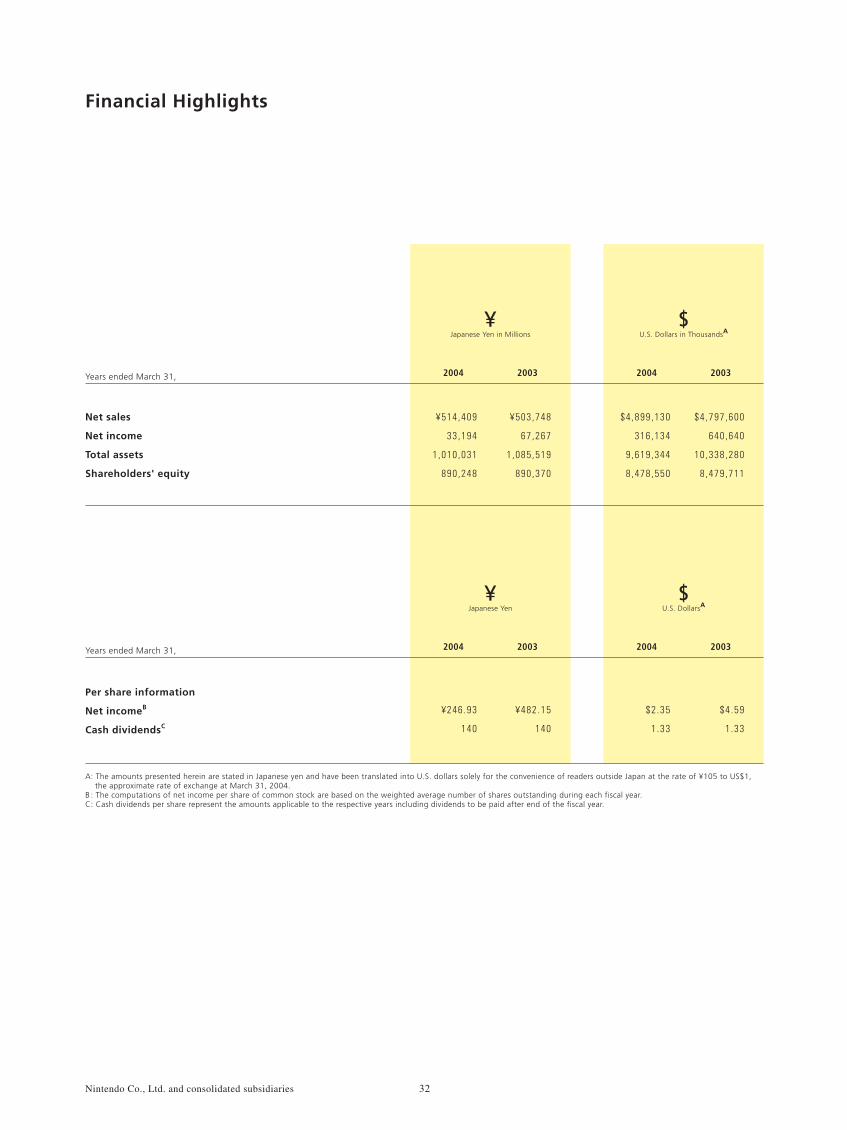
Net sales
Net income
Total assets
Shareholders' equity
Japanese Yen in Millions¥
U.S. Dollars in ThousandsA$
Years ended March 31,
Financial Highlights
Per share information
Net incomeB
Cash dividendsC
Japanese Yen¥
U.S. DollarsA$
Years ended March 31,
32Nintendo Co., Ltd. and consolidated subsidiaries
¥503,748
67 ,267
1 ,085 ,519
890 ,370
¥514 ,409
33 ,194
1 ,010 ,031
890 ,248
$4 ,899 ,130
316 ,134
9 ,619 ,344
8 ,478 ,550
$4 ,797 ,600
640 ,640
10 ,338 ,280
8 ,479 ,711
¥246 .93
140
¥482 .15
140
$2 .35
1 .33
$4 .59
1 .33
2004 2003 2004 2003
2004 2003 2004 2003
A: The amounts presented herein are stated in Japanese yen and have been translated into U.S. dollars solely for the convenience of readers outside Japan at the rate of ¥105 to US$1, the approximate rate of exchange at March 31, 2004.B : The computations of net income per share of common stock are based on the weighted average number of shares outstanding during each fiscal year.C: Cash dividends per share represent the amounts applicable to the respective years including dividends to be paid after end of the fiscal year.
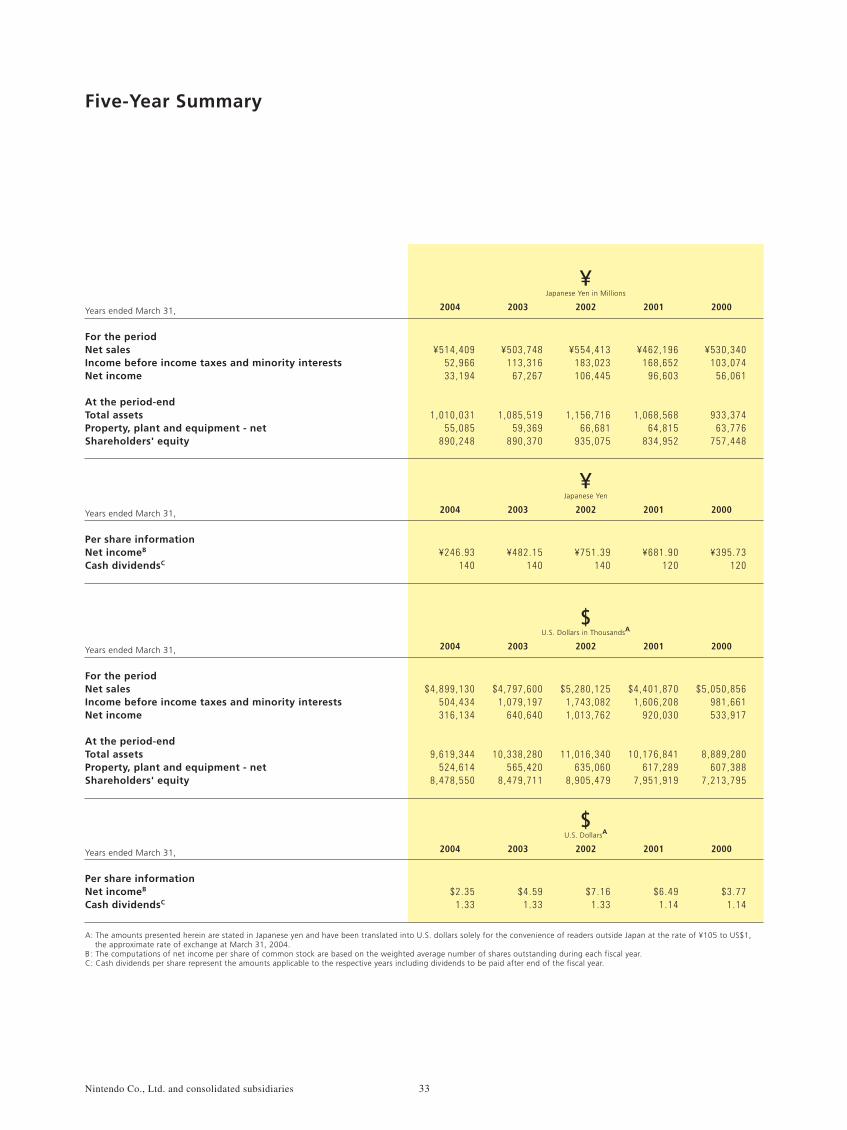
For the periodNet salesIncome before income taxes and minority interestsNet income
At the period-endTotal assetsProperty, plant and equipment - netShareholders' equity
Japanese Yen in Millions¥
Years ended March 31,
Five-Year Summary
Per share informationNet incomeB
Cash dividendsC
Japanese Yen¥
Years ended March 31,
For the periodNet salesIncome before income taxes and minority interestsNet income
At the period-endTotal assetsProperty, plant and equipment - netShareholders' equity
U.S. Dollars in ThousandsA$
Years ended March 31,
Per share informationNet incomeB
Cash dividendsC
U.S. DollarsA$
Years ended March 31,
33Nintendo Co., Ltd. and consolidated subsidiaries
¥514,409 52 ,966 33 ,194
1 ,010 ,031 55 ,085
890 ,248
2004
¥246.93 140
2004
¥503,748 113 ,316
67 ,267
1 ,085 ,519 59 ,369
890 ,370
2003
¥554,413 183 ,023 106 ,445
1 ,156 ,716 66 ,681
935 ,075
2002
¥462,196 168 ,652
96 ,603
1 ,068 ,568 64 ,815
834 ,952
2001
¥530,340 103 ,074
56 ,061
933 ,374 63 ,776
757 ,448
2000
¥482.15 140
2003
¥751.39 140
2002
¥681.90 120
2001
¥395.73 120
2000
$4,899 ,130 504 ,434 316 ,134
9 ,619 ,344 524 ,614
8 ,478 ,550
2004
$4,797 ,600 1 ,079 ,197
640 ,640
10 ,338 ,280 565 ,420
8 ,479 ,711
2003
$5,280 ,125 1 ,743 ,082 1 ,013 ,762
11 ,016 ,340 635 ,060
8 ,905 ,479
2002
$4,401 ,870 1 ,606 ,208
920 ,030
10 ,176 ,841 617 ,289
7 ,951 ,919
2001
$5,050 ,856 981 ,661 533 ,917
8 ,889 ,280 607 ,388
7 ,213 ,795
2000
$2.35 1 .33
2004
$4.59 1 .33
2003
$7.16 1 .33
2002
$6.49 1 .14
2001
$3.77 1 .14
2000
A: The amounts presented herein are stated in Japanese yen and have been translated into U.S. dollars solely for the convenience of readers outside Japan at the rate of ¥105 to US$1, the approximate rate of exchange at March 31, 2004.B : The computations of net income per share of common stock are based on the weighted average number of shares outstanding during each fiscal year.C: Cash dividends per share represent the amounts applicable to the respective years including dividends to be paid after end of the fiscal year.
Analysis of Operations and Financial Review
In Fiscal 2004, the global video game industry faced hardware pricing competition while the U.S. market, which had maintained a high growth rate throughout the past, began to show signs of a slowdown. In addition, the domestic market continued to shrink, leaving the business environment in a crucial situation. Furthermore, in recent years, software development dependant on advancements in audio-visual technology is approaching the point where it can no longer be characterized as the key element in creating new and exciting video game software. It is becoming much more difficult to mesmerize people around the world by merely pursuing rich visual content and complexity. Under such circumstances, Nintendo Co., Ltd. (the "Company") and its subsidiaries (together with the Company, "Nintendo") have focused on expanding sales of the home entertainment console NINTENDO GAMECUBE, while introducing new gaming ideas under the theme "connectivity and integration" with the handheld system GAME BOY ADVANCE. In addition, Nintendo is developing and distributing fascinating software that can be enjoyed by anyone around the world regardless of age, gender, cultural background, or previous game experience. As a positive achievement, a new handheld device NINTENDO DS (tentative) was unveiled in May 2004, at the Electronic Entertainment Expo (E3).
Overview
“Pokémon Ruby/Sapphire”, which was released in Japan and the Americas in the previous period, achieved worldwide availability with its European release last July. The title sold more than 6 million copies worldwide during the previous period and has surpassed the 6 million mark in worldwide unit sales this period as well. With respect to other GAME BOY ADVANCE titles, “Super Mario Advance 4” sold more than 2.5 million copies, “Donkey Kong Country” and “Mario & Luigi RPG” both sold more than a million copies, reflecting their worldwide acclaim. In Japan, new introductions were made ahead of other markets. “Pokémon Fire Red/Leaf Green”, which provide a whole new gaming experience through wireless communication only available on handheld consoles, captivated newcomers to the franchise and sold more than 2 million copies. Meanwhile, the “FAMICOM MINI (Classic NES)” series, which enables users to enjoy NES software on the GAME BOY ADVANCE, stimulated demand of nostalgic gamers and was widely accepted, going platinum soon after its launch. Driven by favorable software sales, combined unit sales of GAME BOY ADVANCE and GAME BOY ADVANCE SP hardware were 17.6 million this period, cumulative unit sales reached 51.4 million. With respect to GAMECUBE titles, popular franchise titles such as “Mario Kart: Double Dash!!” and “Mario Party 5” were launched during the holiday season where demand is expected to be at its highest. Notably, “Mario Kart: Double Dash!!” sold an outstanding 3.5 million copies after its November 2003 launch. “Pokémon Colosseum”, which allows players to experience vigorous battles with Pokémon they have trained in exclusive GAME BOY ADVANCE “Pokémon” titles, sold more than a million copies. New titles are not the only titles that deserve attention. Nintendo software has been enjoyed by many for a long period of time. For example, “Super Smash Bros. Melee”, which was released in 2001, sold more than a million units for 3 consecutive years. As for NINTENDO GAMECUBE hardware, unit sales significantly increased after a strategic markdown initiated last September. As a result, consolidated net sales in Fiscal 2004 were ¥514.4 billion ($4,899 million). Gross margin was ¥207.5 billion ($1,977 million). The gross margin ratio increased by 2% compared with the previous fiscal year to 40%. Selling, general and administrative expenses amounted to ¥97.3 billion ($927 million). Operating income was ¥110.2 billion ($1,050 million). The operating income ratio increased by 2% compared with the previous fiscal year to 21%. Interest income was ¥9.0 billion ($86 million), while foreign exchange loss was ¥67.9 billion ($646 million) affected by Japanese yen appreciation. Due to such factors, net income was ¥33.2 billion ($316 million). The net income ratio decreased by 7% compared with the previous fiscal year to 6%.
Revenue and Expenses
34Nintendo Co., Ltd. and consolidated subsidiaries
At March 31, 2004, Nintendo’s cash and cash equivalents were ¥720.1 billion ($6,858 million). Net cash provided by operating activities was ¥120.1 billion ($1,144 million) which was an increase of ¥143.6 billion compared with the previous fiscal year. The decrease in accounts receivable and inventory contributed to the overall increase. Net cash used in investing activities was ¥67.0 billion ($638 million). Deposits to time deposits which had exceeded withdrawals contributed to the overall decrease. Net cash used in financing activities was ¥24.1 billion ($229 million) with dividend payout accounting for a significant portion.
Cash Flow
Nintendo’s financial position continues to be very strong. At March 31, 2004 total liabilities were ¥119.6 billion ($1,139 million), and the current ratio was 7.87:1. The balance of cash and cash equivalents was 6.02 times total liabilities. Working capital was ¥777.5 billion ($7,405 million). The number of days’ sales in receivables decreased by 7 days compared with the previous fiscal year to 28 days. Inventories were ¥31.0 billion ($295 million). The number of days’ sales in inventories decreased substantially to 22 days. Liabilities-to-equity ratio was 0.13:1 at March 31, 2004.
Financial Position
Various market risks that could significantly affect Nintendo’s operating performance, share price, and financial condition are as follows:Note that matters pertaining to the future presented herein are determined by Nintendo as of fiscal year ended March 31, 2004.
(1) Fluctuation in Foreign Exchange RatesNintendo distributes its products globally with overseas sales accounting for more than 70% of total sales. The majority of monetary transactions are made in local currencies. In addition, the Company holds a substantial amount of assets denominated in foreign currencies without exchange contracts. Thus, the fluctuation in foreign exchange rates would affect these assets if they were to be converted to Japanese yen or revaluated for financial reporting purposes. Japanese yen appreciation against the U.S. dollar or Euro would have a negative impact on Nintendo’s performance.
(2) Failure of Financial InstitutionsNintendo holds a substantial amount of deposits in order to respond flexibly to future capital needs. There is no guarantee that financial institutions that have monetary transactions with Nintendo will not fail.
(3) Collectibility of Accounts Receivable and Notes ReceivableAt Nintendo, based on contracts etc., a certain time period is required to collect receivables. During that time period, it is possible that those receivables may prove to be uncollectible.
(4) Fluctuation of the MarketNintendo is engaged in a business categorized under the massive entertainment industry. Therefore, the availability of other forms of entertainment affects Nintendo’s business. If consumer preferences shift to other forms of entertainment, it is possible that the video game market may shrink.
Risk Factors
During the fiscal year ended March 31, 2004, the Nikkei stock average rose 47% to ¥11,715.39 ($111.58). The Company’s stock price ended the year at ¥10,510 ($100.10). The Company maintained its annual dividend level at ¥140 ($1.33) per share for Fiscal 2004. On a consolidated basis, the dividend payout ratio was approximately 57%. Foreign shareholders constituted 39% of total outstanding shares at March 31, 2004.
(Note) The amounts presented herein are stated in Japanese yen and have been translated into U.S. dollars solely for the convenience of readers outside Japan at the rate of ¥105 to US$1, the approximate rate of exchange at March 31, 2004.
Common Stock Activity
35Nintendo Co., Ltd. and consolidated subsidiaries
Analysis of Operations and Financial Review
(5) Development of New ProductsAlthough Nintendo continues to develop innovative and appealing products, in the field of computer entertainment, the development process is complicated and includes many uncertainties. Various risks involved are as follows:① Despite the substantial costs and time needed for software development, there is no guarantee that all new products will be
accepted by consumers due to ever shifting consumer preferences. As a result, development of certain products may be suspended or aborted.
② Hardware requires a long term development span. On the other hand, while technological advancements occur continuously, the possibility of inability to acquire the adequate technology which can be utilized in entertainment exists. Furthermore, in the case of a delayed launch, it is possible that market share cannot be secured.
③ Due to the nature of Nintendo products, actual development and distribution may significantly differ from initial projections.
(6) Competition in the MarketIn the video game industry, it may become even more difficult to generate profit as more research and development fees and marketing expenses are demanded at the same time that price competition intensifies with giant enterprises competing in the video game market. As an outcome, Nintendo may find difficulty in maintaining or expanding its market share as well as sustaining profitability.
(7) Product Valuation and Adequate Inventory SecurementShort product life cycles and sharp increases in demand around the holiday season characterize the video game market. Although, production is targeted at the equilibrium point of supply and demand, accurate projections are extremely difficult to obtain, which may lead to the risk of excessive inventory. In addition, inventory obsolescence could have an adverse effect on Nintendo’s operations and financial situation.
(8) International Activities and Overseas Business ExpansionNintendo engages in business in territories other than Japan; they include The United States, Europe, Australia, and Asia. Expansion of business to these overseas markets involve risks such as ① unpredicted amendments of law or regulations, ② emergence of political or economical factors that prove to be a disadvantage, ③ inconsistency of multilateral taxation systems and diversity of tax law interpretation leading to a disadvantaged position, ④ difficulty of recruiting and securing human resources, ⑤ social disruption resulting from terrorist attacks, war, and other factors.
(9) Dependency on Outside ManufacturersNintendo commissions a number of certain outside manufacturers to produce key components or assemble finished products. In the event of their commercial failure, significant components or products may not be adequately provided. In addition, in periods of high demand, certain manufacturers may not have the capacity to provide the ordered amount of components. The lack of key components could lead to issues such as high pricing, insufficient supply, and quality control. This may impair the relationship between Nintendo and its customers.
(10) Limitations of Protecting Intellectual PropertyThrough the years, Nintendo has built up a variety of intellectual properties that can clearly be differentiated from other products in the market. In certain territories, counterfeit products are already circulating in the market, violating Nintendo’s intellectual property rights. In the future, it may not be possible to fully protect its intellectual property.
(11) Defective ProductsNintendo products are manufactured based on quality control standards accepted in each worldwide region. Although, in the future, defective products may be discovered leading to a large-scale return request. In addition, defective products that require product liability compensation would create additional costs and leave Nintendo with an unfavorable reputation, adversely affecting its future performance and financial position.
(12) LitigationNintendo may be subject to litigation, disputes, or other legal proceedings relating to its domestic and overseas operations which could have an adverse effect on its business.
(13) Business Operations Affected by Seasonal FluctuationSince a major portion of demand is focused around the holiday season, Nintendo is subject to the impact of seasonal fluctuations. If the launch of key titles were to miss the period of high demand, it would have an adverse effect on Nintendo’s business performance.
(14) Administration of Personal InformationNintendo possesses personal information through its online membership service. If this information were to leak, it would adversely effect its future performance and financial position.
36Nintendo Co., Ltd. and consolidated subsidiaries
Report of Independent Auditor
To the Board of Directors and Shareholders of Nintendo Co., Ltd.
We have audited the accompanying consolidated balance sheets of Nintendo Co., Ltd. and its subsidiaries as of March 31, 2004 and 2003, and the related consolidated statements of income, shareholders' equity, and cash flows for the years then ended, all expressed in Japanese Yen. These consolidated financial statements are the responsibility of the Company's management. Our responsibility is to express an opinion on these consolidated financial statements based on our audits.
We conducted our audits in accordance with auditing standards generally accepted in Japan. These standards require that we plan and perform the audit to obtain reasonable assurance about whether the consolidated financial statements are free of material misstatement. An audit includes examining, on a test basis, evidence supporting the amounts and disclosures in the consolidated financial statements. An audit also includes assessing the accounting principles used and significant estimates made by management, as well as evaluating the overall consolidated financial statement presentation. We believe that our audits provide a reasonable basis for our opinion.
In our opinion, the consolidated financial statements referred to above present fairly, in all material respects, the consolidated financial position of Nintendo Co., Ltd. and its subsidiaries as of March 31, 2004 and 2003, and the consolidated results of their operations and their cash flows for the years then ended in conformity with accounting principles generally accepted in Japan.
The amounts expressed in U.S. dollars, which are provided solely for the convenience of the reader, have been translated on the basis set forth in Note 1 to the accompanying consolidated financial statements.
ChuoAoyama PricewaterhouseCoopersKyoto, JapanJune 29, 2004
37Nintendo Co., Ltd. and consolidated subsidiaries
Japanese Yen in Millions¥
U.S. Dollars in Thousands (Note 1)
$As of March 31,
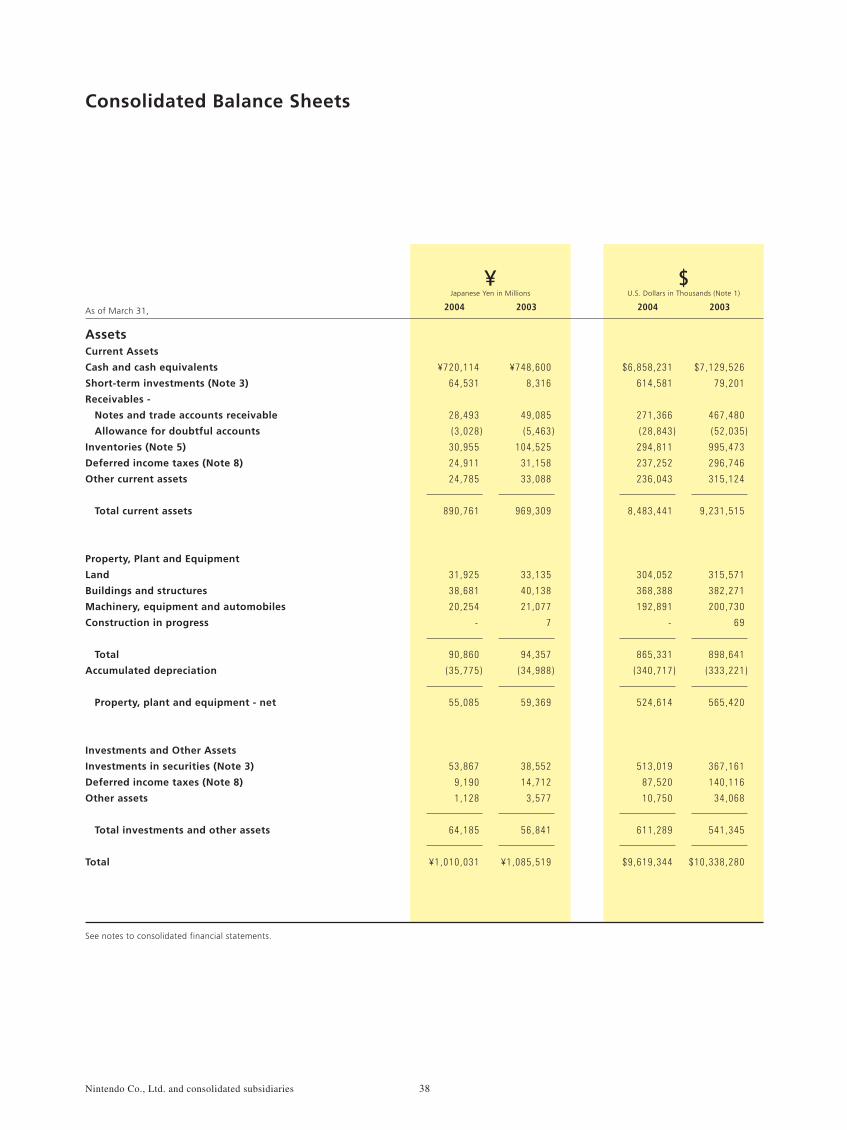
Consolidated Balance Sheets
2004 2003 2004 2003
See notes to consolidated financial statements.
AssetsCurrent Assets
Cash and cash equivalents
Short-term investments (Note 3)
Receivables -
Notes and trade accounts receivable
Allowance for doubtful accounts
Inventories (Note 5)
Deferred income taxes (Note 8)
Other current assets
Total current assets
Property, Plant and Equipment
Land
Buildings and structures
Machinery, equipment and automobiles
Construction in progress
Total
Accumulated depreciation
Property, plant and equipment - net
Investments and Other Assets
Investments in securities (Note 3)
Deferred income taxes (Note 8)
Other assets
Total investments and other assets
Total
38Nintendo Co., Ltd. and consolidated subsidiaries
¥720,114
64 ,531
28 ,493
(3 ,028 )
30 ,955
24 ,911
24 ,785
890 ,761
31 ,925
38 ,681
20 ,254
-
90 ,860
(35 ,775 )
55 ,085
53 ,867
9 ,190
1 ,128
64 ,185
¥1 ,010 ,031
¥748 ,600
8 ,316
49 ,085
(5 ,463 )
104 ,525
31 ,158
33 ,088
969 ,309
33 ,135
40 ,138
21 ,077
7
94 ,357
(34 ,988 )
59 ,369
38 ,552
14 ,712
3 ,577
56 ,841
¥1 ,085 ,519
$6 ,858 ,231
614 ,581
271 ,366
(28 ,843 )
294 ,811
237 ,252
236 ,043
8 ,483 ,441
304 ,052
368 ,388
192 ,891
-
865 ,331
(340 ,717 )
524 ,614
513 ,019
87 ,520
10 ,750
611 ,289
$9 ,619 ,344
$7 ,129 ,526
79 ,201
467 ,480
(52 ,035 )
995 ,473
296 ,746
315 ,124
9 ,231 ,515
315 ,571
382 ,271
200 ,730
69
898 ,641
(333 ,221 )
565 ,420
367 ,161
140 ,116
34 ,068
541 ,345
$10 ,338 ,280
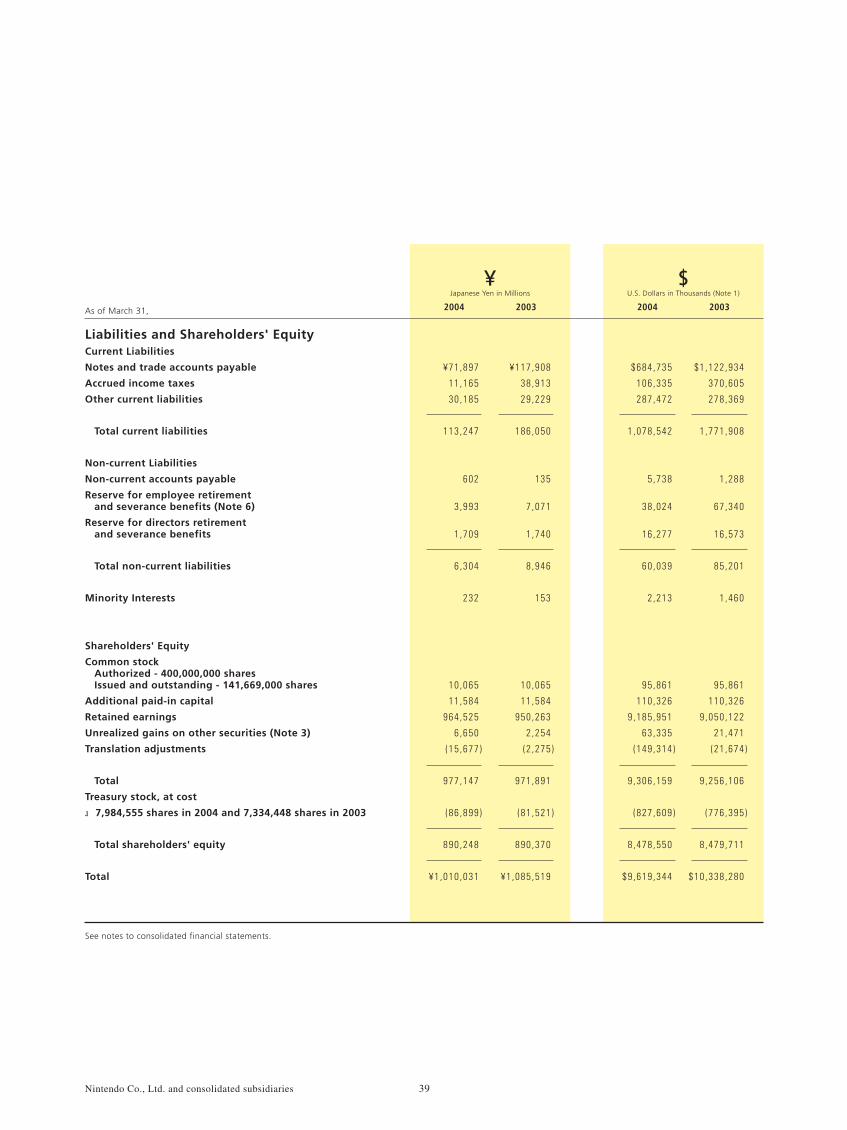
Liabilities and Shareholders' EquityCurrent Liabilities
Notes and trade accounts payable
Accrued income taxes
Other current liabilities
Total current liabilities
Non-current Liabilities
Non-current accounts payable
Reserve for employee retirement and severance benefits (Note 6)
Reserve for directors retirement and severance benefits
Total non-current liabilities
Minority Interests
Shareholders' Equity
Common stock Authorized - 400,000,000 shares Issued and outstanding - 141,669,000 shares
Additional paid-in capital
Retained earnings
Unrealized gains on other securities (Note 3)
Translation adjustments
Total
Treasury stock, at cost
7,984,555 shares in 2004 and 7,334,448 shares in 2003
Total shareholders' equity
Total
Japanese Yen in Millions¥
U.S. Dollars in Thousands (Note 1)
$As of March 31, 2004 2003 2004 2003
See notes to consolidated financial statements.
39Nintendo Co., Ltd. and consolidated subsidiaries
¥71,897
11 ,165
30 ,185
113 ,247
602
3 ,993
1 ,709
6 ,304
232
10 ,065
11 ,584
964 ,525
6 ,650
(15 ,677 )
977 ,147
(86 ,899 )
890 ,248
¥1 ,010 ,031
¥117 ,908
38 ,913
29 ,229
186 ,050
135
7 ,071
1 ,740
8 ,946
153
10 ,065
11 ,584
950 ,263
2 ,254
(2 ,275 )
971 ,891
(81 ,521 )
890 ,370
¥1 ,085 ,519
$684 ,735
106 ,335
287 ,472
1 ,078 ,542
5 ,738
38 ,024
16 ,277
60 ,039
2 ,213
95 ,861
110 ,326
9 ,185 ,951
63 ,335
(149 ,314 )
9 ,306 ,159
(827 ,609 )
8 ,478 ,550
$9 ,619 ,344
$1 ,122 ,934
370 ,605
278 ,369
1 ,771 ,908
1 ,288
67 ,340
16 ,573
85 ,201
1 ,460
95 ,861
110 ,326
9 ,050 ,122
21 ,471
(21 ,674 )
9 ,256 ,106
(776 ,395 )
8 ,479 ,711
$10 ,338 ,280
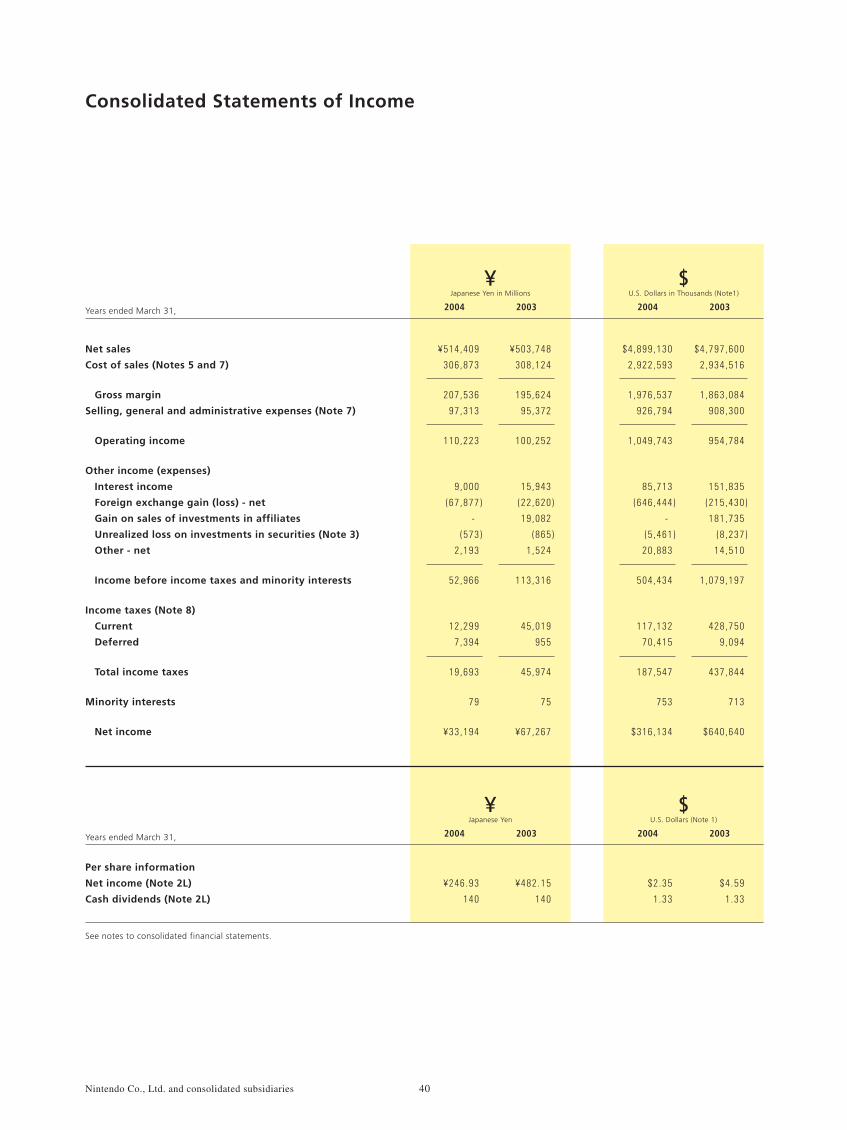
Net sales
Cost of sales (Notes 5 and 7)
Gross margin
Selling, general and administrative expenses (Note 7)
Operating income
Other income (expenses)
Interest income
Foreign exchange gain (loss) - net
Gain on sales of investments in affiliates
Unrealized loss on investments in securities (Note 3)
Other - net
Income before income taxes and minority interests
Income taxes (Note 8)
Current
Deferred
Total income taxes
Minority interests
Net income
Japanese Yen in Millions¥
U.S. Dollars in Thousands (Note1)
$Years ended March 31,
Consolidated Statements of Income
2004 2003 2004 2003
See notes to consolidated financial statements.
Per share information
Net income (Note 2L)
Cash dividends (Note 2L)
Japanese Yen¥
U.S. Dollars (Note 1)
$Years ended March 31, 2004 2003 2004 2003
40Nintendo Co., Ltd. and consolidated subsidiaries
¥514,409
306 ,873
207 ,536
97 ,313
110 ,223
9 ,000
(67 ,877 )
-
(573 )
2 ,193
52 ,966
12 ,299
7 ,394
19 ,693
79
¥33 ,194
¥503 ,748
308 ,124
195 ,624
95 ,372
100 ,252
15 ,943
(22 ,620 )
19 ,082
(865 )
1 ,524
113 ,316
45 ,019
955
45 ,974
75
¥67 ,267
$4 ,899 ,130
2 ,922 ,593
1 ,976 ,537
926 ,794
1 ,049 ,743
85 ,713
(646 ,444 )
-
(5 ,461 )
20 ,883
504 ,434
117 ,132
70 ,415
187 ,547
753
$316 ,134
$4 ,797 ,600
2 ,934 ,516
1 ,863 ,084
908 ,300
954 ,784
151 ,835
(215 ,430 )
181 ,735
(8 ,237 )
14 ,510
1 ,079 ,197
428 ,750
9 ,094
437 ,844
713
$640 ,640
¥246 .93
140
¥482 .15
140
$2 .35
1 .33
$4 .59
1 .33
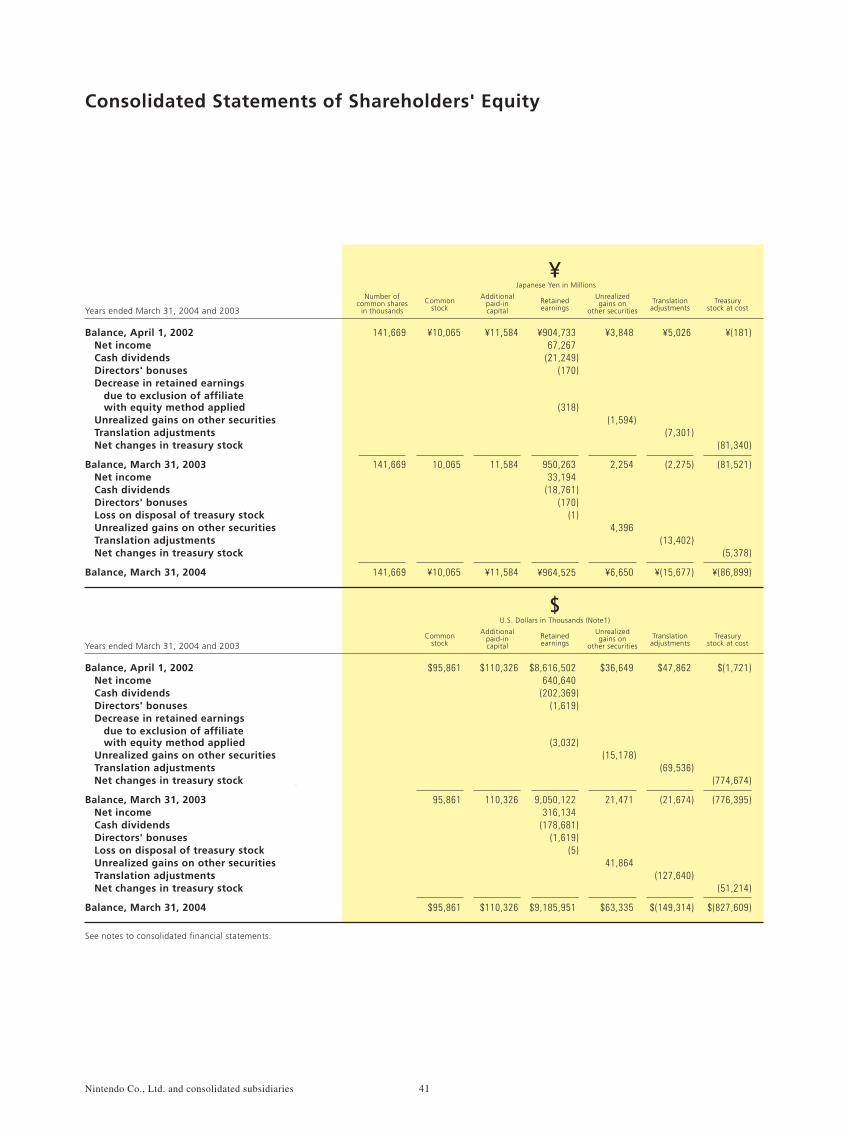
Consolidated Statements of Shareholders' Equity
Balance, April 1, 2002 Net income Cash dividends Directors' bonuses Decrease in retained earnings due to exclusion of affiliate with equity method applied Unrealized gains on other securities Translation adjustments Net changes in treasury stock
Balance, March 31, 2003 Net income Cash dividends Directors' bonuses Loss on disposal of treasury stock Unrealized gains on other securities Translation adjustments Net changes in treasury stock
Balance, March 31, 2004
Japanese Yen in Millions¥
Years ended March 31, 2004 and 2003Translation
adjustments
Unrealizedgains on
other securitiesRetainedearnings
Additionalpaid-incapital
Commonstock
Number ofcommon shares
in thousandsTreasury
stock at cost
See notes to consolidated financial statements.
Balance, April 1, 2002 Net income Cash dividends Directors' bonuses Decrease in retained earnings due to exclusion of affiliate with equity method applied Unrealized gains on other securities Translation adjustments Net changes in treasury stock
Balance, March 31, 2003 Net income Cash dividends Directors' bonuses Loss on disposal of treasury stock Unrealized gains on other securities Translation adjustments Net changes in treasury stock
Balance, March 31, 2004
U.S. Dollars in Thousands (Note1)
$
Years ended March 31, 2004 and 2003Translation
adjustments
Unrealizedgains on
other securitiesRetainedearnings
Additionalpaid-incapital
Commonstock
Treasurystock at cost
41Nintendo Co., Ltd. and consolidated subsidiaries
¥5,026
(7,301)
(2,275)
(13,402)
¥(15,677)
¥3,848
(1,594)
2,254
4,396
¥6,650
¥904,733 67,267
(21,249)(170)
(318)
950,263 33,194
(18,761)(170)
(1)
¥964,525
¥11,584
11,584
¥11,584
¥10,065
10,065
¥10,065
141,669
141,669
141,669
¥(181)
(81,340)
(81,521)
(5,378)
¥(86,899)
$47,862
(69,536)
(21,674)
(127,640)
$(149,314)
$36,649
(15,178)
21,471
41,864
$63,335
$8,616,502 640,640
(202,369)(1,619)
(3,032)
9,050,122 316,134
(178,681)(1,619)
(5)
$9,185,951
$110,326
110,326
$110,326
$95,861
95,861
$95,861
$(1,721)
(774,674)
(776,395)
(51,214)
$(827,609)
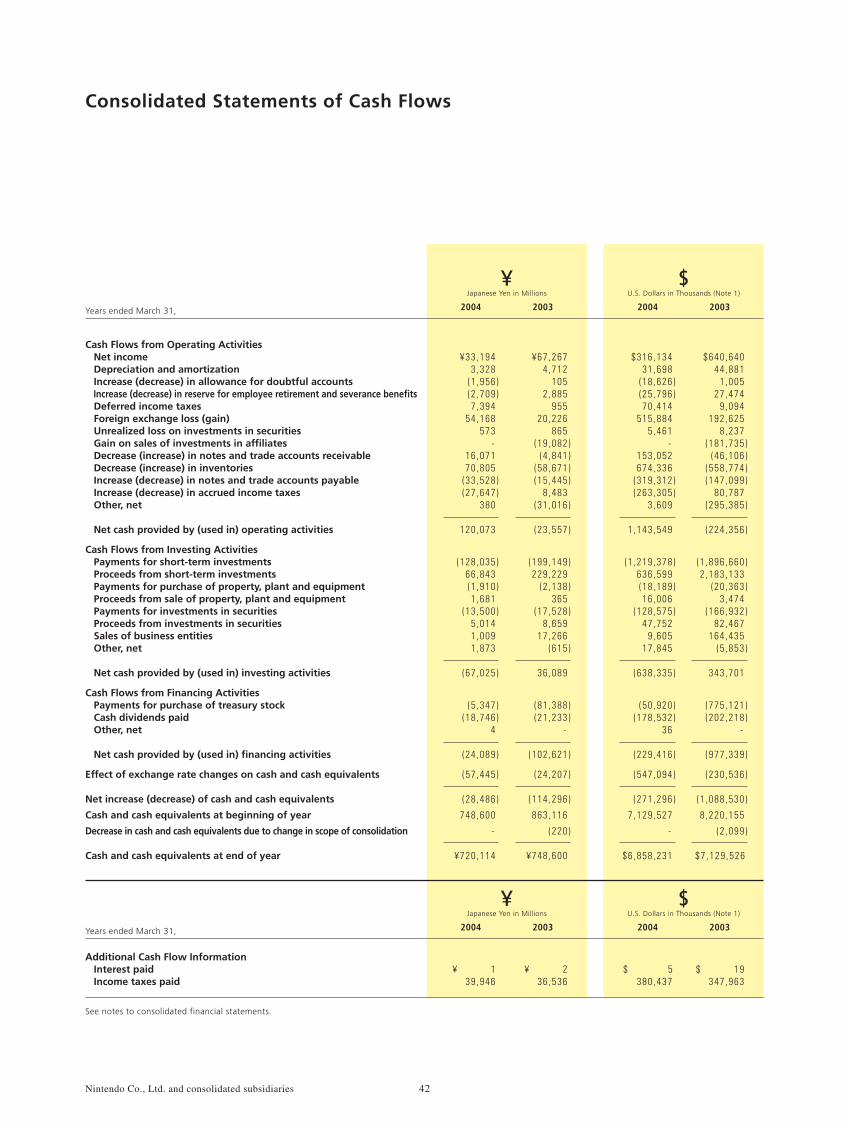
Cash Flows from Operating Activities Net income Depreciation and amortization Increase (decrease) in allowance for doubtful accounts Increase (decrease) in reserve for employee retirement and severance benefits Deferred income taxes Foreign exchange loss (gain) Unrealized loss on investments in securities Gain on sales of investments in affiliates Decrease (increase) in notes and trade accounts receivable Decrease (increase) in inventories Increase (decrease) in notes and trade accounts payable Increase (decrease) in accrued income taxes Other, net
Net cash provided by (used in) operating activities
Cash Flows from Investing Activities Payments for short-term investments Proceeds from short-term investments Payments for purchase of property, plant and equipment Proceeds from sale of property, plant and equipment Payments for investments in securities Proceeds from investments in securities Sales of business entities Other, net
Net cash provided by (used in) investing activities
Cash Flows from Financing Activities Payments for purchase of treasury stock Cash dividends paid Other, net
Net cash provided by (used in) financing activities
Effect of exchange rate changes on cash and cash equivalents
Net increase (decrease) of cash and cash equivalents
Cash and cash equivalents at beginning of year
Decrease in cash and cash equivalents due to change in scope of consolidation
Cash and cash equivalents at end of year
Japanese Yen in Millions¥
U.S. Dollars in Thousands (Note 1)
$Years ended March 31,
Consolidated Statements of Cash Flows
Additional Cash Flow Information Interest paid Income taxes paid
Japanese Yen in Millions¥
U.S. Dollars in Thousands (Note 1)
$Years ended March 31,
See notes to consolidated financial statements.
42Nintendo Co., Ltd. and consolidated subsidiaries
2004 2003 2004 2003
¥ 1 39 ,946
2004
¥ 2 36 ,536
2003
$ 5 380 ,437
2004
$ 19 347 ,963
2003
¥33 ,194 3 ,328
(1 ,956 )(2 ,709 )7 ,394
54 ,168 573
- 16 ,071 70 ,805
(33 ,528 )(27 ,647 )
380
120 ,073
(128 ,035 )66 ,843 (1 ,910 )1 ,681
(13 ,500 )5 ,014 1 ,009 1 ,873
(67 ,025 )
(5 ,347 )(18 ,746 )
4
(24 ,089 )
(57 ,445 )
(28 ,486 )
748 ,600
-
¥720 ,114
¥67 ,267 4 ,712
105 2 ,885
955 20 ,226
865 (19 ,082 )
(4 ,841 )(58 ,671 )(15 ,445 )
8 ,483 (31 ,016 )
(23 ,557 )
(199 ,149 )229 ,229
(2 ,138 )365
(17 ,528 )8 ,659
17 ,266 (615 )
36 ,089
(81 ,388 ) (21 ,233 )
-
(102 ,621 )
(24 ,207 )
(114 ,296 )
863 ,116
(220 )
¥748 ,600
$316 ,134 31 ,698
(18 ,626 )(25 ,796 )70 ,414
515 ,884 5 ,461
- 153 ,052 674 ,336
(319 ,312 )(263 ,305 )
3 ,609
1 ,143 ,549
(1 ,219 ,378 )636 ,599 (18 ,189 )16 ,006
(128 ,575 )47 ,752
9 ,605 17 ,845
(638 ,335 )
(50 ,920 )(178 ,532 )
36
(229 ,416 )
(547 ,094 )
(271 ,296 )
7 ,129 ,527
-
$6 ,858 ,231
$640 ,640 44 ,881
1 ,005 27 ,474
9 ,094 192 ,625
8 ,237 (181 ,735 )
(46 ,106 )(558 ,774 )(147 ,099 )
80 ,787 (295 ,385 )
(224 ,356 )
(1 ,896 ,660 )2 ,183 ,133
(20 ,363 )3 ,474
(166 ,932 )82 ,467
164 ,435 (5 ,853 )
343 ,701
(775 ,121 )(202 ,218 )
-
(977 ,339 )
(230 ,536 )
(1 ,088 ,530 )
8 ,220 ,155
(2 ,099 )
$7 ,129 ,526
Years ended March 31, 2004 and 2003
Notes to Consolidated Financial Statements
A. Principles of ConsolidationThe accompanying consolidated financial statements include the accounts of the Company and all subsidiaries (total 21 in 2004 and 2003) except for two. The equity method of accounting has been applied to one of the non-consolidated subsidiaries and to 7 affiliates (out of 9 in 2004 and 10 in 2003). The remaining subsidiary and affiliates are immaterial and investments in them are carried at cost in the accompanying consolidated balance sheets. The principal consolidated subsidiaries and the principal affiliate for which the equity method of accounting was used for the year ended March 31, 2004 were as follows:
All significant intercompany transactions, accounts and unrealized profits have been eliminated in consolidation. The amounts of certain subsidiaries have been included on the basis of fiscal periods ended within three months prior to March 31.
Note 2. Significant Accounting Policies
The accompanying consolidated financial statements are prepared from the consolidated financial statements issued in Japan for domestic reporting purposes. Nintendo Co., Ltd. (the “Company”) and its subsidiaries in Japan maintain their accounts and records in accordance with the provisions set forth in the Japanese Commercial Code and the Securities and Exchange Law, and in conformity with generally accepted accounting principles and practices in Japan, which are different in certain respects from the application and disclosure requirements of International Financial Reporting Standards. Its overseas consolidated subsidiaries maintain their accounts in conformity with the generally accepted accounting principles and practices prevailing in the respective countries of domicile and no adjustment has been made to their financial statements in consolidation, as allowed under accounting principles and practices generally accepted in Japan. The consolidated financial statements are not intended to present the consolidated financial position, results of operations and cash flows in accordance with accounting principles and practices generally accepted in countries and jurisdictions other than Japan. In preparing the accompanying consolidated financial statements, certain reclassifications have been made to the consolidated financial statements issued domestically in order to present them in a form which is more familiar to readers outside Japan. The consolidated financial statements presented herein are stated in Japanese yen, the currency of the country in which the Company is incorporated and operates. The translations of Japanese yen amounts into U.S. dollar amounts are included solely for the convenience of readers outside Japan and have been made at the rate of ¥105 to US$1, the approximate rate of exchange at March 31, 2004. These translations should not be construed as representations that the Japanese yen amounts have been, could have been or could in the future be, converted into U.S. dollars at this or any other rate of exchange.
Note 1. Basis of Presenting Consolidated Financial Statements
Nintendo o f Amer ica Inc .Nintendo Bene lux B .V.Nintendo España , S .A .Nintendo F rance S .A .R .L .
Nintendo Aust ra l ia P ty . L td .Nintendo o f Canada L td .Nintendo o f Europe GmbH
Consolidated subsidiaries
Affiliate
The Pokémon Company
43Nintendo Co., Ltd. and consolidated subsidiaries
Years ended March 31, 2004 and 2003
Notes to Consolidated Financial Statements
B. Translation of Foreign Currency ItemsIn accordance with the Japanese accounting standard, short-term and long-term monetary receivables and payables denominated in foreign currencies are translated into Japanese yen at the exchange rate in effect at the balance sheet date. The foreign exchange gains and losses from translation are recognized in the statements of income to the extent that they are not hedged by forward exchange contracts. With respect to financial statements of overseas subsidiaries, the balance sheet accounts are translated into Japanese yen at the exchange rates in effect at the balance sheet date except for shareholders' equity, which are translated at the historical rates. The average exchange rates for the fiscal period are used for translation of revenue and expenses. The differences resulting from translation in this manner are included in “Minority Interests” and “Translation adjustments” which are listed in Shareholders’ Equity in the accompanying consolidated balance sheets.
C. Cash and Cash EquivalentsCash and cash equivalents include cash on hand, deposit which can be withdrawn on demand, time deposit with an original maturity of three months or less and certain investments. Investments are defined as those that are easily accessible, with little risk of fluctuation in value and the maturity date is within three months of the acquisition date.
D. Financial InstrumentsDerivativesAll derivatives are stated at fair value, with changes in fair value included in net profit or loss for the period in which they arise.
SecuritiesHeld-to-maturity debt securities are stated at cost after accounting for premium or discount on acquisition, which is amortized over the period to maturity. Equity securities of non-consolidated subsidiary and affiliated companies with equity method non-applied are stated at cost. Other securities for which market quotations are available are stated at fair value. Unrealized gains on other securities are reported as “Unrealized gains on other securities” in Shareholders’ Equity at a net-of-tax amount, while unrealized losses on other securities are included in net profit or loss for the period. Other securities for which market quotations are unavailable are stated at cost, determined by the moving average method except as stated in the paragraph below. In case where the fair value of held-to-maturity debt securities, equity securities issued by non-consolidated subsidiaries and affiliates, or other securities has declined significantly and such impairment of the value is not deemed temporary, those securities are written down to the fair value and the resulting losses are included in net profit or loss for the period. Under the Japanese accounting standard, trading securities and debt securities due within one year are presented as “current” and all the other securities are presented as “non-current.”
E. InventoriesInventories are stated at the lower of cost, determined by the moving average method, or market.
44Nintendo Co., Ltd. and consolidated subsidiaries
F. Property, Plant and EquipmentProperty, plant and equipment are stated at cost. The Company and its consolidated subsidiaries in Japan compute depreciation by the declining balance method over the estimated useful lives. The straight-line method of depreciation is used for buildings, except for structures, acquired on or after April 1, 1998. Overseas consolidated subsidiaries compute depreciation of assets by applying the straight-line method over the period of estimated useful lives. Estimated useful lives of the principal assets are as follows: Buildings and structures: 3 to 60 years
From the year ended March 31, 2004, the Company promptly adopted the new Japanese Accounting Standards for impairment on fixed assets. The effect on net profit or loss of this application is minor.
G. Income TaxesDeferred income taxes are recorded to reflect the impact of temporary differences between assets and liabilities recognized for financial reporting purposes and such amounts recognized for tax purposes. These deferred taxes are measured by applying currently enacted tax laws to the temporary differences.
H. Retirement and Severance Benefits and Pension PlanThe Company and certain consolidated subsidiaries are calculating the reserve for employee retirement and severance benefits with actuarially calculated amounts on the basis of the cost of retirement benefit and plan assets at end of fiscal year. Benefits under the plan are generally based on the current rate of base salary, length of service and certain other factors when the termination occurs. Directors and corporate auditors customarily receive lump-sum payments upon termination of their services subject to shareholders’ approval. The Company provides for the reserve for lump-sum severance benefits for directors and corporate auditors at the estimated amount required if all retired at the fiscal year-end.
I. Research and Development and Computer SoftwareExpenses relating to research and development activities are charged to income as incurred. Computer software for the internal use included in other assets is amortized using the straight-line method over the estimated useful lives.
J. Leases All leases are accounted for as operating leases. Under Japanese accounting standards for leases, finance leases that are deemed to transfer ownership of the leased assets to the lessee are to be capitalized, while other finance leases are permitted to be accounted for as operating lease transactions if certain “as if capitalized” information is disclosed in the notes to the lessee’s financial statements.
K. Appropriations of Retained EarningsAppropriations of retained earnings are reflected in the consolidated financial statements for the following year upon shareholders’ approval
L. Per Share InformationThe computations of net income per share of common stock are based on the weighted average number of shares outstanding during each fiscal year. The average number of common stock used in the computation for the years ended March 31, 2004 and 2003 were 133,741 thousand and 139,162 thousand, respectively. Cash dividends per share represent the amounts applicable to the respective years including dividends to be paid after end of the fiscal year.
45Nintendo Co., Ltd. and consolidated subsidiaries
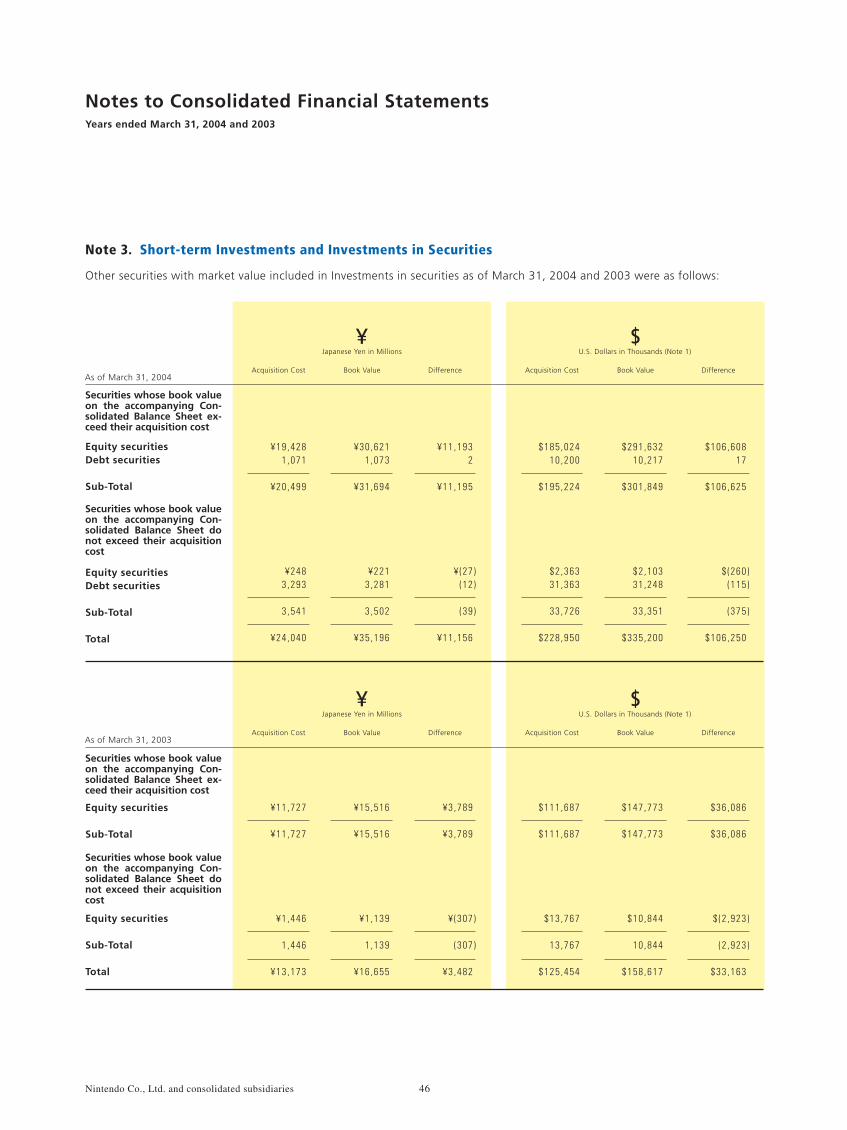
Other securities with market value included in Investments in securities as of March 31, 2004 and 2003 were as follows:
¥19,428 1 ,071
¥20 ,499
¥30 ,621 1 ,073
¥31 ,694
¥11 ,193 2
¥11 ,195
¥248 3 ,293
3 ,541
¥24 ,040
¥221 3 ,281
3 ,502
¥35 ,196
¥ (27 )(12 )
(39 )
¥11 ,156
$185 ,024 10 ,200
$195 ,224
$291 ,632 10 ,217
$301 ,849
$106 ,608 17
$106 ,625
$2 ,363 31 ,363
33 ,726
$228 ,950
$2 ,103 31 ,248
33 ,351
$335 ,200
$ (260 )(115 )
(375 )
$106 ,250
¥11 ,727
¥11 ,727
¥15 ,516
¥15 ,516
¥3 ,789
¥3 ,789
¥1 ,446
1 ,446
¥13 ,173
¥1 ,139
1 ,139
¥16 ,655
¥ (307 )
(307 )
¥3 ,482
$111 ,687
$111 ,687
$147 ,773
$147 ,773
$36 ,086
$36 ,086
$13 ,767
13 ,767
$125 ,454
$10 ,844
10 ,844
$158 ,617
$ (2 ,923 )
(2 ,923 )
$33 ,163
Note 3. Short-term Investments and Investments in Securities
Acquisition Cost DifferenceBook Value
Japanese Yen in Millions¥
Securities whose book value on the accompanying Con-solidated Balance Sheet ex-ceed their acquisition cost
Securities whose book value on the accompanying Con-solidated Balance Sheet ex-ceed their acquisition cost
Securities whose book value on the accompanying Con-solidated Balance Sheet do not exceed their acquisition cost
Securities whose book value on the accompanying Con-solidated Balance Sheet do not exceed their acquisition cost
As of March 31, 2004
As of March 31, 2003
Equity securitiesDebt securities
Sub-Total
Equity securities
Sub-Total
Equity securities
Sub-Total
Total
Equity securitiesDebt securities
Sub-Total
Total
46Nintendo Co., Ltd. and consolidated subsidiaries
Years ended March 31, 2004 and 2003
Notes to Consolidated Financial Statements
Difference
$U.S. Dollars in Thousands (Note 1)
Acquisition Cost Book Value
Acquisition Cost DifferenceBook Value
Japanese Yen in Millions¥
Difference
$U.S. Dollars in Thousands (Note 1)
Acquisition Cost Book Value
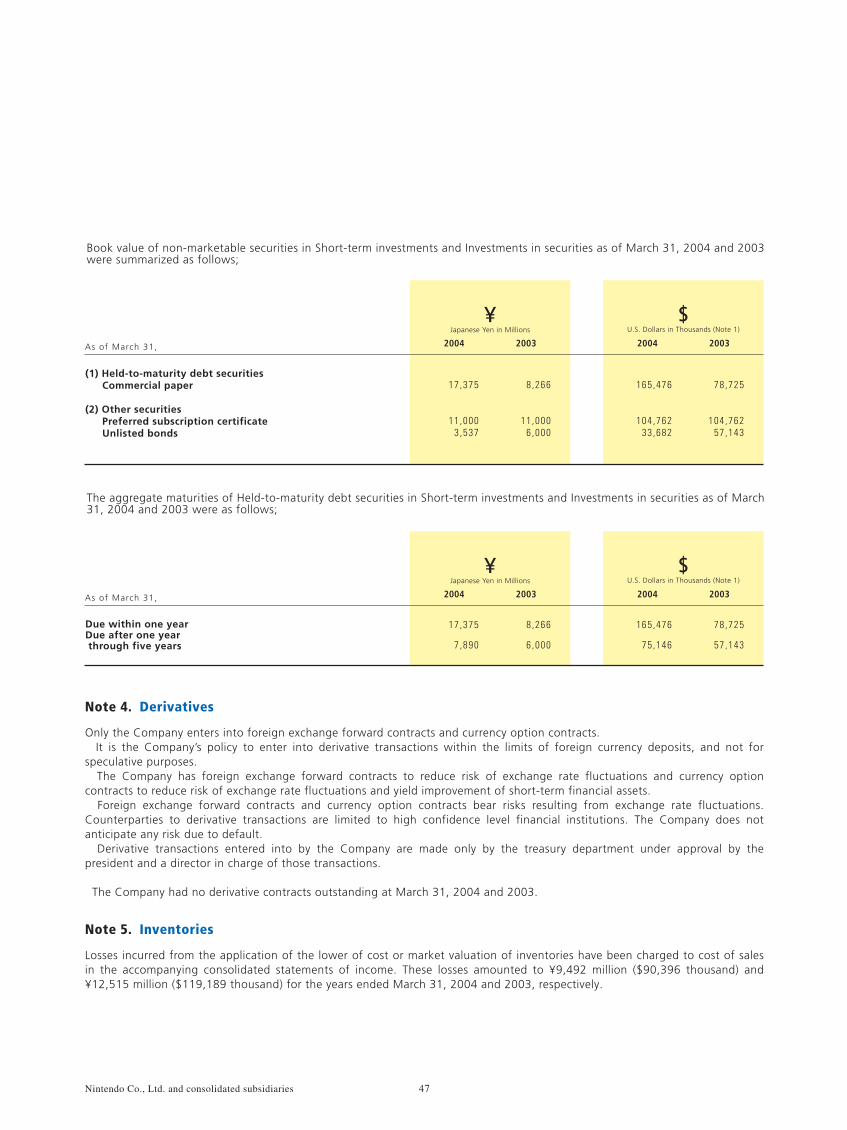
The aggregate maturities of Held-to-maturity debt securities in Short-term investments and Investments in securities as of March 31, 2004 and 2003 were as follows;
Book value of non-marketable securities in Short-term investments and Investments in securities as of March 31, 2004 and 2003 were summarized as follows;
Only the Company enters into foreign exchange forward contracts and currency option contracts. It is the Company’s policy to enter into derivative transactions within the limits of foreign currency deposits, and not for speculative purposes. The Company has foreign exchange forward contracts to reduce risk of exchange rate fluctuations and currency option contracts to reduce risk of exchange rate fluctuations and yield improvement of short-term financial assets. Foreign exchange forward contracts and currency option contracts bear risks resulting from exchange rate fluctuations. Counterparties to derivative transactions are limited to high confidence level financial institutions. The Company does not anticipate any risk due to default. Derivative transactions entered into by the Company are made only by the treasury department under approval by the president and a director in charge of those transactions.
Note 4. Derivatives
Losses incurred from the application of the lower of cost or market valuation of inventories have been charged to cost of sales in the accompanying consolidated statements of income. These losses amounted to ¥9,492 million ($90,396 thousand) and ¥12,515 million ($119,189 thousand) for the years ended March 31, 2004 and 2003, respectively.
Note 5. Inventories
(1) Held-to-maturity debt securities Commercial paper (2) Other securities Preferred subscription certificate Unlisted bonds
Due within one year Due after one year through five years
47Nintendo Co., Ltd. and consolidated subsidiaries
The Company had no derivative contracts outstanding at March 31, 2004 and 2003.
17,375
11 ,000 3 ,537
8 ,266
11 ,000 6 ,000
165 ,476
104 ,762 33 ,682
78 ,725
104 ,762 57 ,143
Japanese Yen in Millions¥
2004 2003
U.S. Dollars in Thousands (Note 1)
$2004 2003As of March 31,
As of March 31,
17,375
7 ,890
8 ,266
6 ,000
165 ,476
75 ,146
78 ,725
57 ,143
Japanese Yen in Millions¥
2004 2003
U.S. Dollars in Thousands (Note 1)
$2004 2003
¥(17 ,189 )
11 ,429
(5 ,760 )
1 ,698
69
¥ (3 ,993 )
¥ (18 ,055 )
9 ,053
(9 ,002 )
1 ,118
813
¥ (7 ,071 )
$ (163 ,701 )
108 ,847
(54 ,854 )
16 ,172
658
$ (38 ,024 )
$ (171 ,953 )
86 ,220
(85 ,733 )
10 ,652
7 ,741
$ (67 ,340 )
¥1 ,252
525
(149 )
(1 ,267 )
(211 )
150
473
¥623
¥1 ,125
548
(255 )
2 ,706
218
4 ,342
521
¥4 ,863
$11 ,924
5 ,003
(1 ,419 )
(12 ,069 )
(2 ,009 )
1 ,430
4 ,503
$5 ,933
$10 ,714
5 ,219
(2 ,431 )
25 ,774
2 ,073
41 ,349
4 ,970
$46 ,319
As of March 31,
. Retirement benefit obligation
. Plan assets
. Unfunded retirement benefit obligation
. Unrecognized actuarial difference
. Unrecognized prior service cost (decrease of obligation)
. Reserve for employee retirement and severance benefits
a
b
c
d
e
f
. Service cost
. Interest cost
. Expected return on plan assets
. Amortization of actuarial difference
. Amortization of prior service cost
. Retirement benefit cost
. Other
. Total
a
b
c
d
e
f
g
h
Years ended March 31,
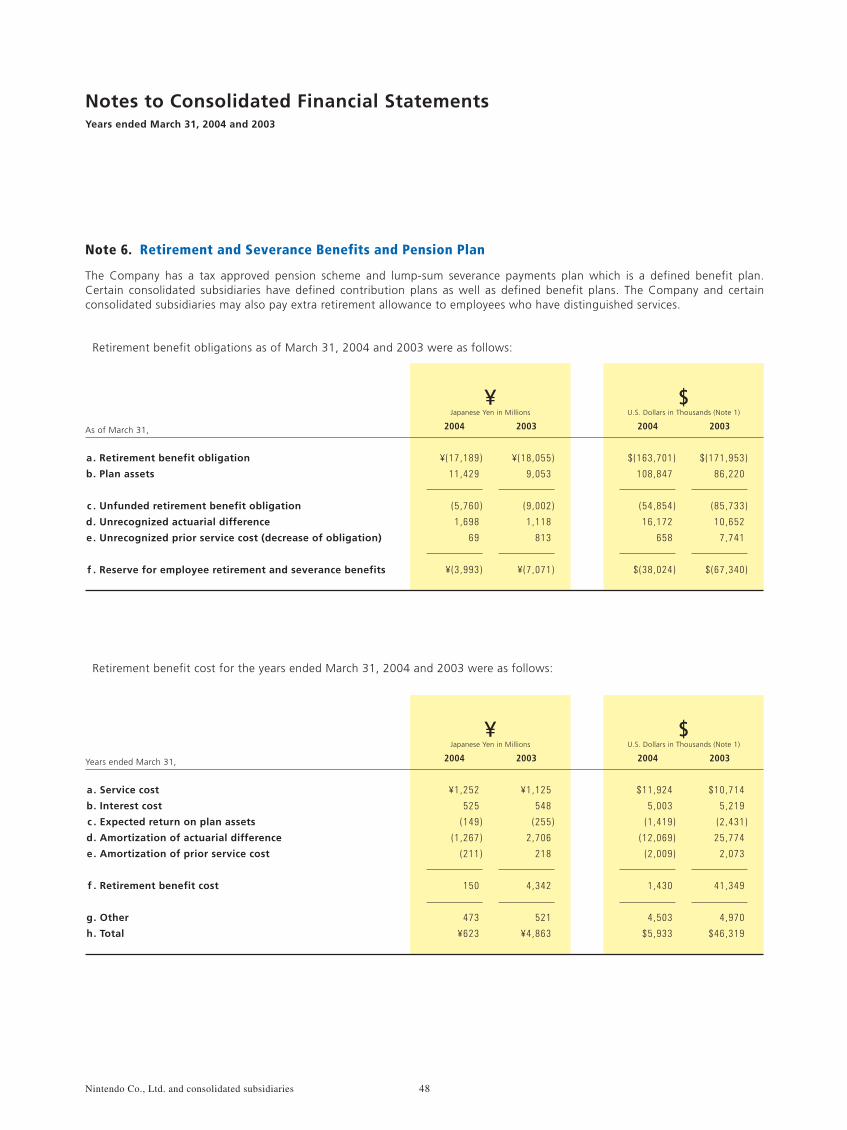
Retirement benefit obligations as of March 31, 2004 and 2003 were as follows:
Retirement benefit cost for the years ended March 31, 2004 and 2003 were as follows:
The Company has a tax approved pension scheme and lump-sum severance payments plan which is a defined benefit plan. Certain consolidated subsidiaries have defined contribution plans as well as defined benefit plans. The Company and certain consolidated subsidiaries may also pay extra retirement allowance to employees who have distinguished services.
Note 6. Retirement and Severance Benefits and Pension Plan
48Nintendo Co., Ltd. and consolidated subsidiaries
Years ended March 31, 2004 and 2003
Notes to Consolidated Financial Statements
Japanese Yen in Millions¥
2004 2003
U.S. Dollars in Thousands (Note 1)
$2004 2003
Japanese Yen in Millions¥
2004 2003
U.S. Dollars in Thousands (Note 1)
$2004 2003
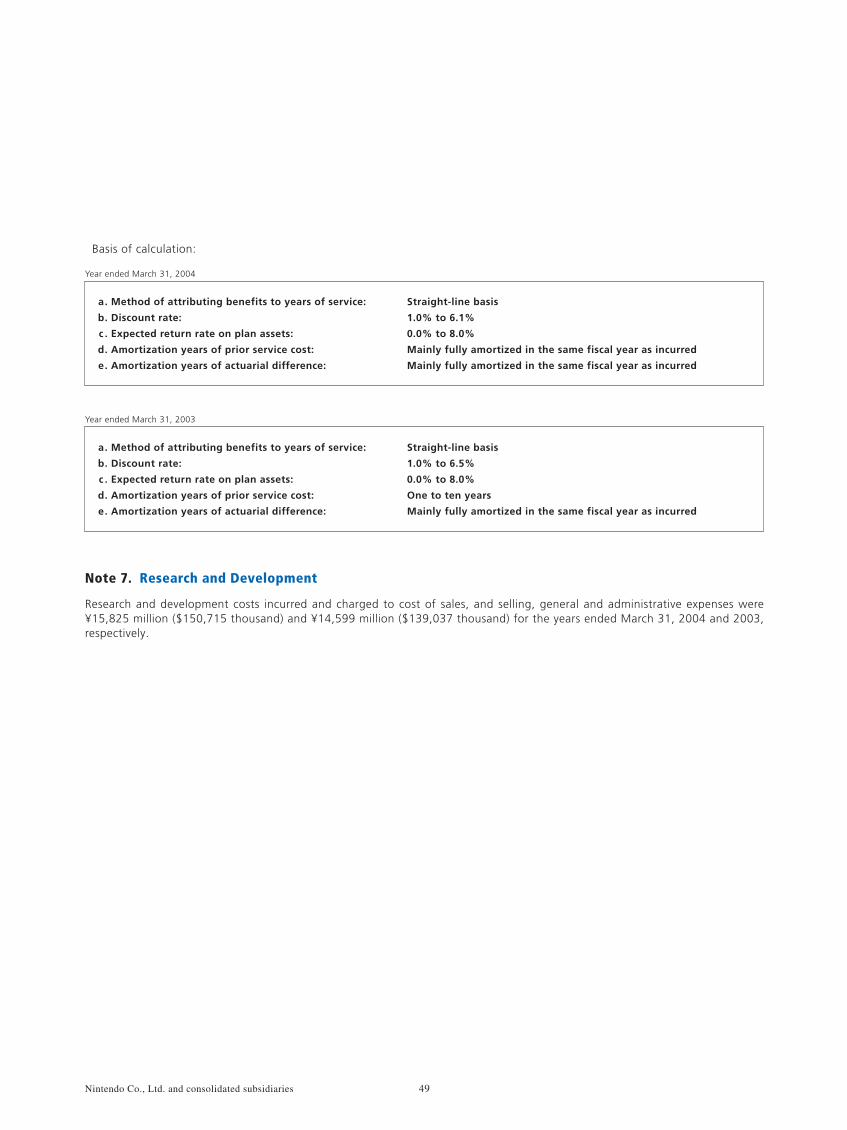
Research and development costs incurred and charged to cost of sales, and selling, general and administrative expenses were ¥15,825 million ($150,715 thousand) and ¥14,599 million ($139,037 thousand) for the years ended March 31, 2004 and 2003, respectively.
Note 7. Research and Development
a
b
c
d
e
. Method of attributing benefits to years of service:
. Discount rate:
. Expected return rate on plan assets:
. Amortization years of prior service cost:
. Amortization years of actuarial difference:
Straight-line basis
1.0% to 6.1%
0.0% to 8.0%
Mainly fully amortized in the same fiscal year as incurred
Mainly fully amortized in the same fiscal year as incurred
Year ended March 31, 2004
a
b
c
d
e
. Method of attributing benefits to years of service:
. Discount rate:
. Expected return rate on plan assets:
. Amortization years of prior service cost:
. Amortization years of actuarial difference:
Straight-line basis
1.0% to 6.5%
0.0% to 8.0%
One to ten years
Mainly fully amortized in the same fiscal year as incurred
Year ended March 31, 2003
Basis of calculation:
49Nintendo Co., Ltd. and consolidated subsidiaries
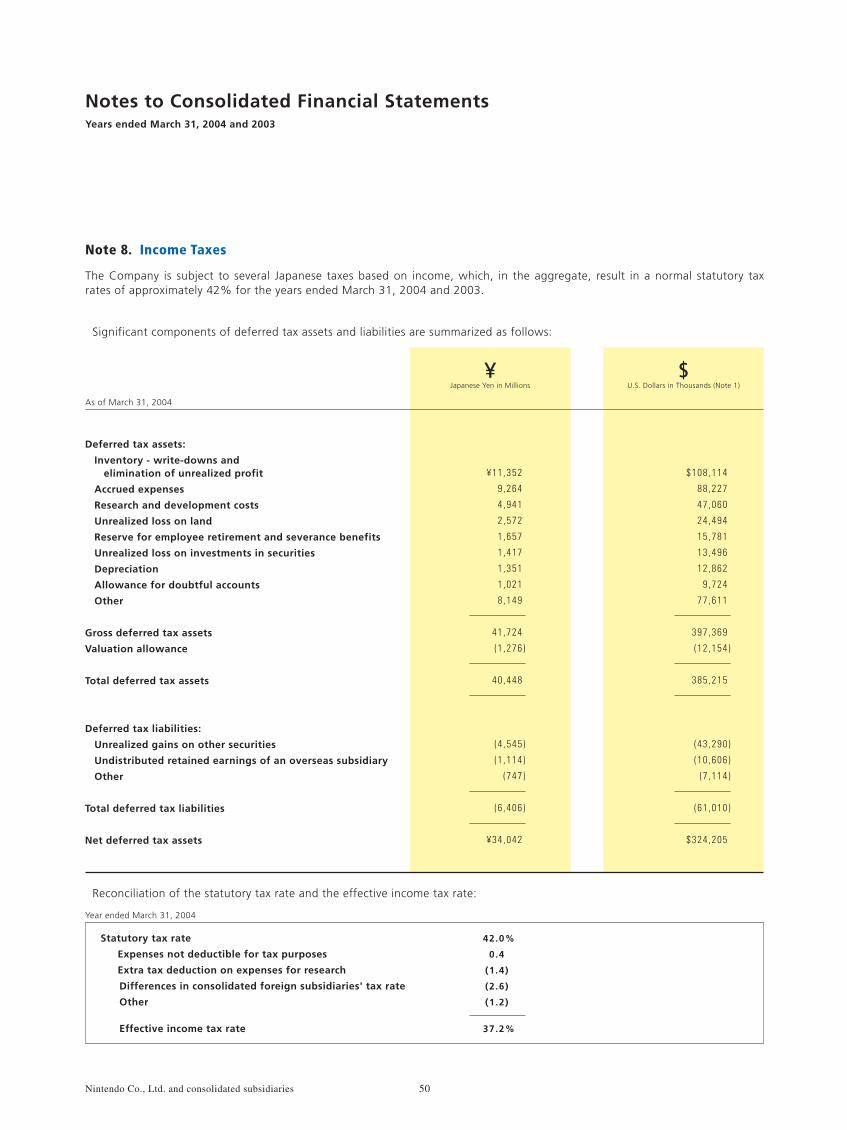
The Company is subject to several Japanese taxes based on income, which, in the aggregate, result in a normal statutory tax rates of approximately 42% for the years ended March 31, 2004 and 2003.
Note 8. Income Taxes
Deferred tax assets:
Inventory - write-downs and elimination of unrealized profit
Accrued expenses
Research and development costs
Unrealized loss on land
Reserve for employee retirement and severance benefits
Unrealized loss on investments in securities
Depreciation
Allowance for doubtful accounts
Other
Gross deferred tax assets
Valuation allowance
Total deferred tax assets
Deferred tax liabilities:
Unrealized gains on other securities
Undistributed retained earnings of an overseas subsidiary
Other
Total deferred tax liabilities
Net deferred tax assets
Japanese Yen in Millions¥
U.S. Dollars in Thousands (Note 1)
$
Significant components of deferred tax assets and liabilities are summarized as follows:
Reconciliation of the statutory tax rate and the effective income tax rate:
50Nintendo Co., Ltd. and consolidated subsidiaries
Years ended March 31, 2004 and 2003
Notes to Consolidated Financial Statements
¥11,352
9 ,264
4 ,941
2 ,572
1 ,657
1 ,417
1 ,351
1 ,021
8 ,149
41 ,724
(1 ,276 )
40 ,448
(4 ,545 )
(1 ,114 )
(747 )
(6 ,406 )
¥34 ,042
$108 ,114
88 ,227
47 ,060
24 ,494
15 ,781
13 ,496
12 ,862
9 ,724
77 ,611
397 ,369
(12 ,154 )
385 ,215
(43 ,290 )
(10 ,606 )
(7 ,114 )
(61 ,010 )
$324 ,205
As of March 31, 2004
Statutory tax rate
Expenses not deductible for tax purposes
Extra tax deduction on expenses for research
Differences in consolidated foreign subsidiaries' tax rate
Other
Effective income tax rate
42.0%
0.4
(1.4)
(2.6)
(1.2)
37.2%
Year ended March 31, 2004
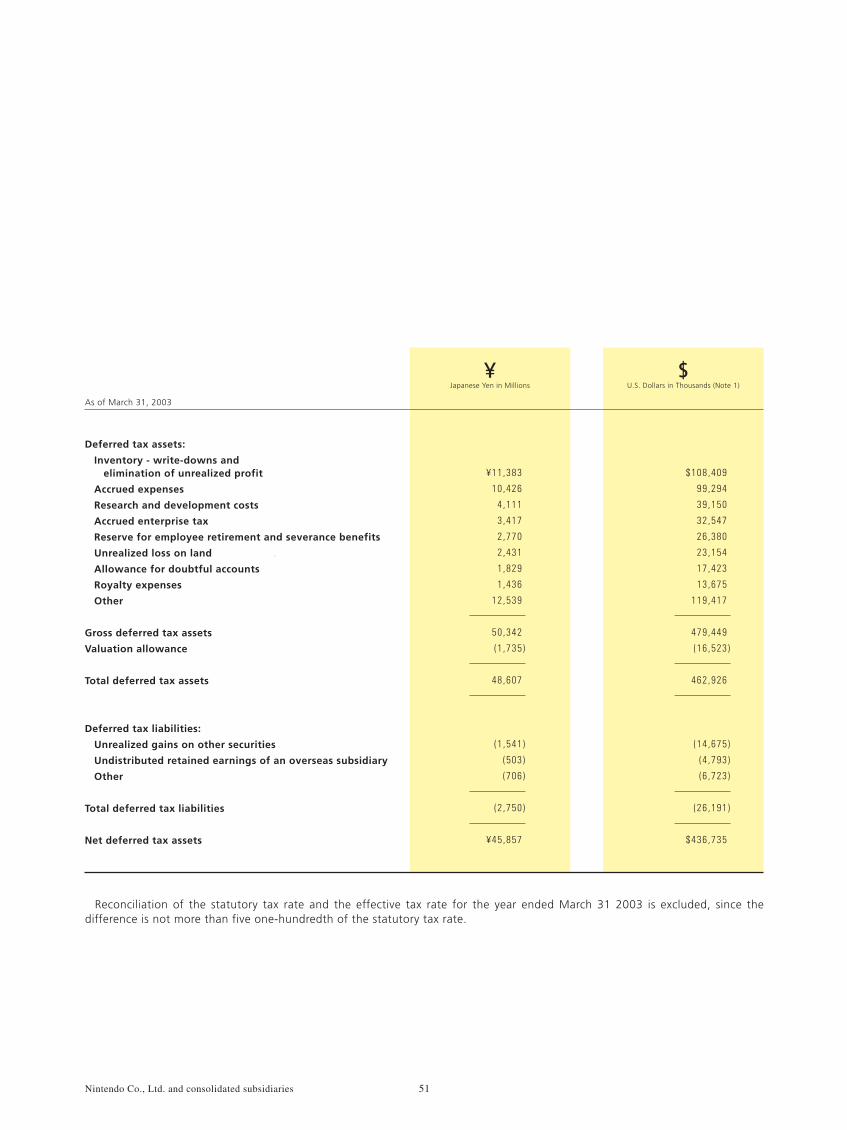
Reconciliation of the statutory tax rate and the effective tax rate for the year ended March 31 2003 is excluded, since the difference is not more than five one-hundredth of the statutory tax rate.
Deferred tax assets:
Inventory - write-downs and elimination of unrealized profit
Accrued expenses
Research and development costs
Accrued enterprise tax
Reserve for employee retirement and severance benefits
Unrealized loss on land
Allowance for doubtful accounts
Royalty expenses
Other
Gross deferred tax assets
Valuation allowance
Total deferred tax assets
Deferred tax liabilities:
Unrealized gains on other securities
Undistributed retained earnings of an overseas subsidiary
Other
Total deferred tax liabilities
Net deferred tax assets
51Nintendo Co., Ltd. and consolidated subsidiaries
Japanese Yen in Millions¥
U.S. Dollars in Thousands (Note 1)
$As of March 31, 2003
¥11,383
10 ,426
4 ,111
3 ,417
2 ,770
2 ,431
1 ,829
1 ,436
12 ,539
50 ,342
(1 ,735 )
48 ,607
(1 ,541 )
(503 )
(706 )
(2 ,750 )
¥45 ,857
$108 ,409
99 ,294
39 ,150
32 ,547
26 ,380
23 ,154
17 ,423
13 ,675
119 ,417
479 ,449
(16 ,523 )
462 ,926
(14 ,675 )
(4 ,793 )
(6 ,723 )
(26 ,191 )
$436 ,735
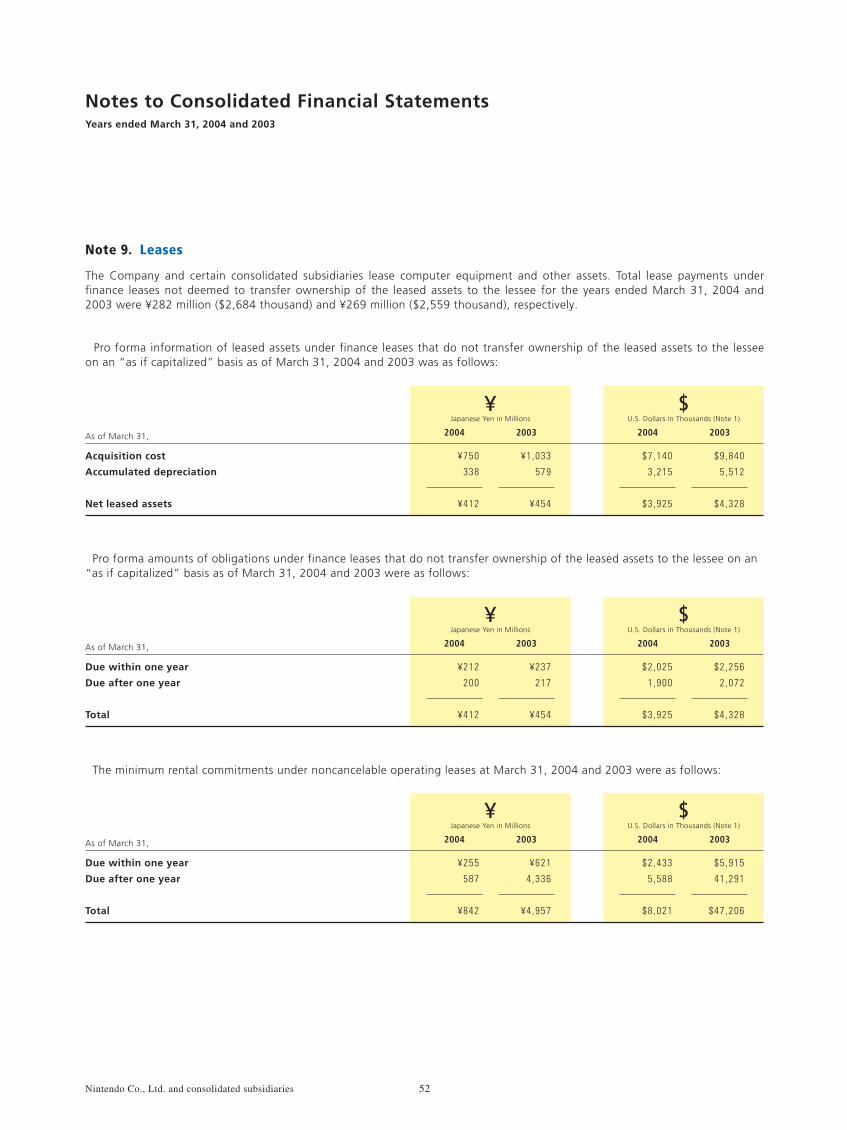
¥750
338
¥412
¥1 ,033
579
¥454
$7 ,140
3 ,215
$3 ,925
$9 ,840
5 ,512
$4 ,328
2004 2003 2004 2003
¥212
200
¥412
¥237
217
¥454
$2 ,025
1 ,900
$3 ,925
$2 ,256
2 ,072
$4 ,328
2004 2003 2004 2003
¥255
587
¥842
¥621
4 ,336
¥4 ,957
$2 ,433
5 ,588
$8 ,021
$5 ,915
41 ,291
$47 ,206
2004 2003 2004 2003
The Company and certain consolidated subsidiaries lease computer equipment and other assets. Total lease payments under finance leases not deemed to transfer ownership of the leased assets to the lessee for the years ended March 31, 2004 and 2003 were ¥282 million ($2,684 thousand) and ¥269 million ($2,559 thousand), respectively.
Pro forma amounts of obligations under finance leases that do not transfer ownership of the leased assets to the lessee on an “as if capitalized” basis as of March 31, 2004 and 2003 were as follows:
Note 9. Leases
Acquisition cost
Accumulated depreciation
Net leased assets
U.S. Dollars in Thousands (Note 1)
$Japanese Yen in Millions
¥
U.S. Dollars in Thousands (Note 1)
$Japanese Yen in Millions
¥
U.S. Dollars in Thousands (Note 1)
$Japanese Yen in Millions
¥
As of March 31,
Due within one year
Due after one year
Total
As of March 31,
Due within one year
Due after one year
Total
As of March 31,
Pro forma information of leased assets under finance leases that do not transfer ownership of the leased assets to the lessee on an “as if capitalized” basis as of March 31, 2004 and 2003 was as follows:
The minimum rental commitments under noncancelable operating leases at March 31, 2004 and 2003 were as follows:
52Nintendo Co., Ltd. and consolidated subsidiaries
Years ended March 31, 2004 and 2003
Notes to Consolidated Financial Statements
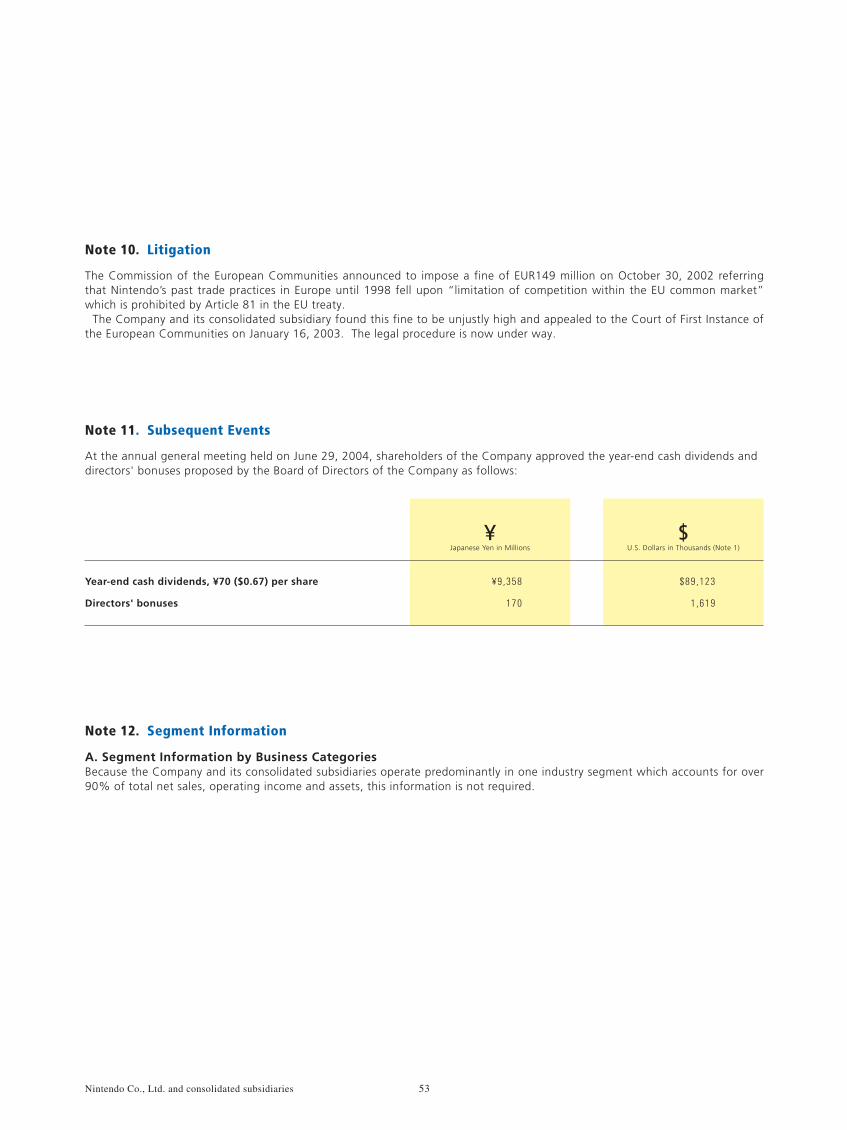
At the annual general meeting held on June 29, 2004, shareholders of the Company approved the year-end cash dividends and directors' bonuses proposed by the Board of Directors of the Company as follows:
A. Segment Information by Business CategoriesBecause the Company and its consolidated subsidiaries operate predominantly in one industry segment which accounts for over 90% of total net sales, operating income and assets, this information is not required.
Note 11. Subsequent Events
Note 12. Segment Information
Japanese Yen in Millions¥
Year-end cash dividends, ¥70 ($0.67) per share
Directors' bonuses
U.S. Dollars in Thousands (Note 1)
$
The Commission of the European Communities announced to impose a fine of EUR149 million on October 30, 2002 referring that Nintendo’s past trade practices in Europe until 1998 fell upon “limitation of competition within the EU common market” which is prohibited by Article 81 in the EU treaty. The Company and its consolidated subsidiary found this fine to be unjustly high and appealed to the Court of First Instance of the European Communities on January 16, 2003. The legal procedure is now under way.
Note 10. Litigation
53Nintendo Co., Ltd. and consolidated subsidiaries
¥9,358
170
$89 ,123
1 ,619
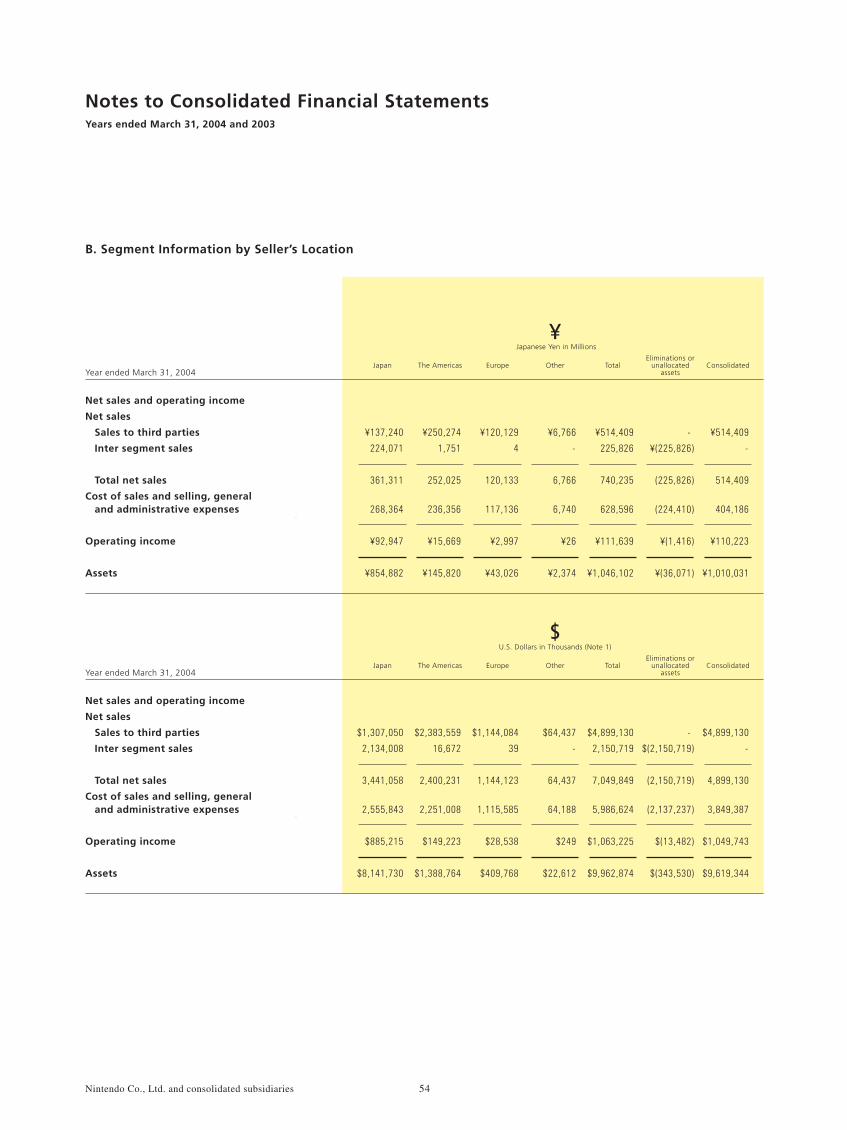
B. Segment Information by Seller’s Location
Net sales and operating income
Net sales
Sales to third parties
Inter segment sales
Total net sales
Cost of sales and selling, general and administrative expenses
Operating income
Assets
Japanese Yen in Millions¥
Year ended March 31, 2004
Eliminations orunallocated
assetsTotalOtherEuropeThe AmericasJapan Consolidated
Net sales and operating income
Net sales
Sales to third parties
Inter segment sales
Total net sales
Cost of sales and selling, general and administrative expenses
Operating income
Assets
U.S. Dollars in Thousands (Note 1)
$
Year ended March 31, 2004
Eliminations orunallocated
assetsTotalOtherEuropeThe AmericasJapan Consolidated
54Nintendo Co., Ltd. and consolidated subsidiaries
-
¥(225,826)
(225,826)
(224,410)
¥(1,416)
¥(36,071)
¥514,409
225,826
740,235
628,596
¥111,639
¥1,046,102
¥6,766
-
6,766
6,740
¥26
¥2,374
¥120,129
4
120,133
117,136
¥2,997
¥43,026
¥250,274
1,751
252,025
236,356
¥15,669
¥145,820
¥137,240
224,071
361,311
268,364
¥92,947
¥854,882
¥514,409
-
514,409
404,186
¥110,223
¥1,010,031
-
$(2,150,719)
(2,150,719)
(2,137,237)
$(13,482)
$(343,530)
$4,899,130
2,150,719
7,049,849
5,986,624
$1,063,225
$9,962,874
$64,437
-
64,437
64,188
$249
$22,612
$1,144,084
39
1,144,123
1,115,585
$28,538
$409,768
$2,383,559
16,672
2,400,231
2,251,008
$149,223
$1,388,764
$1,307,050
2,134,008
3,441,058
2,555,843
$885,215
$8,141,730
$4,899,130
-
4,899,130
3,849,387
$1,049,743
$9,619,344
Years ended March 31, 2004 and 2003
Notes to Consolidated Financial Statements
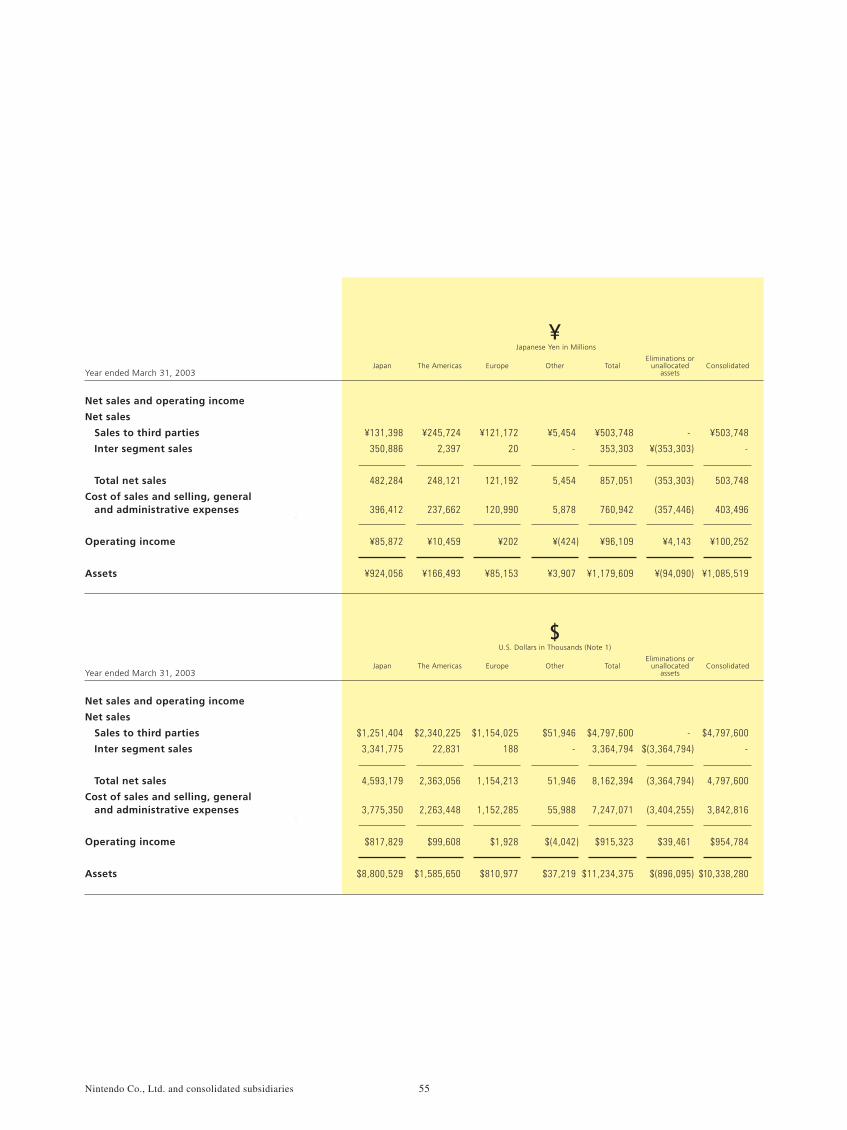
Net sales and operating income
Net sales
Sales to third parties
Inter segment sales
Total net sales
Cost of sales and selling, general and administrative expenses
Operating income
Assets
U.S. Dollars in Thousands (Note 1)
$
Year ended March 31, 2003
Eliminations orunallocated
assetsTotalOtherEuropeThe AmericasJapan Consolidated
Net sales and operating income
Net sales
Sales to third parties
Inter segment sales
Total net sales
Cost of sales and selling, general and administrative expenses
Operating income
Assets
Japanese Yen in Millions¥
Year ended March 31, 2003
Eliminations orunallocated
assetsTotalOtherEuropeThe AmericasJapan Consolidated
55Nintendo Co., Ltd. and consolidated subsidiaries
-
$(3,364,794)
(3,364,794)
(3,404,255)
$39,461
$(896,095)
$4,797,600
3,364,794
8,162,394
7,247,071
$915,323
$11,234,375
$51,946
-
51,946
55,988
$(4,042)
$37,219
$1,154,025
188
1,154,213
1,152,285
$1,928
$810,977
$2,340,225
22,831
2,363,056
2,263,448
$99,608
$1,585,650
$1,251,404
3,341,775
4,593,179
3,775,350
$817,829
$8,800,529
$4,797,600
-
4,797,600
3,842,816
$954,784
$10,338,280
-
¥(353,303)
(353,303)
(357,446)
¥4,143
¥(94,090)
¥503,748
353,303
857,051
760,942
¥96,109
¥1,179,609
¥5,454
-
5,454
5,878
¥(424)
¥3,907
¥121,172
20
121,192
120,990
¥202
¥85,153
¥245,724
2,397
248,121
237,662
¥10,459
¥166,493
¥131,398
350,886
482,284
396,412
¥85,872
¥924,056
¥503,748
-
503,748
403,496
¥100,252
¥1,085,519
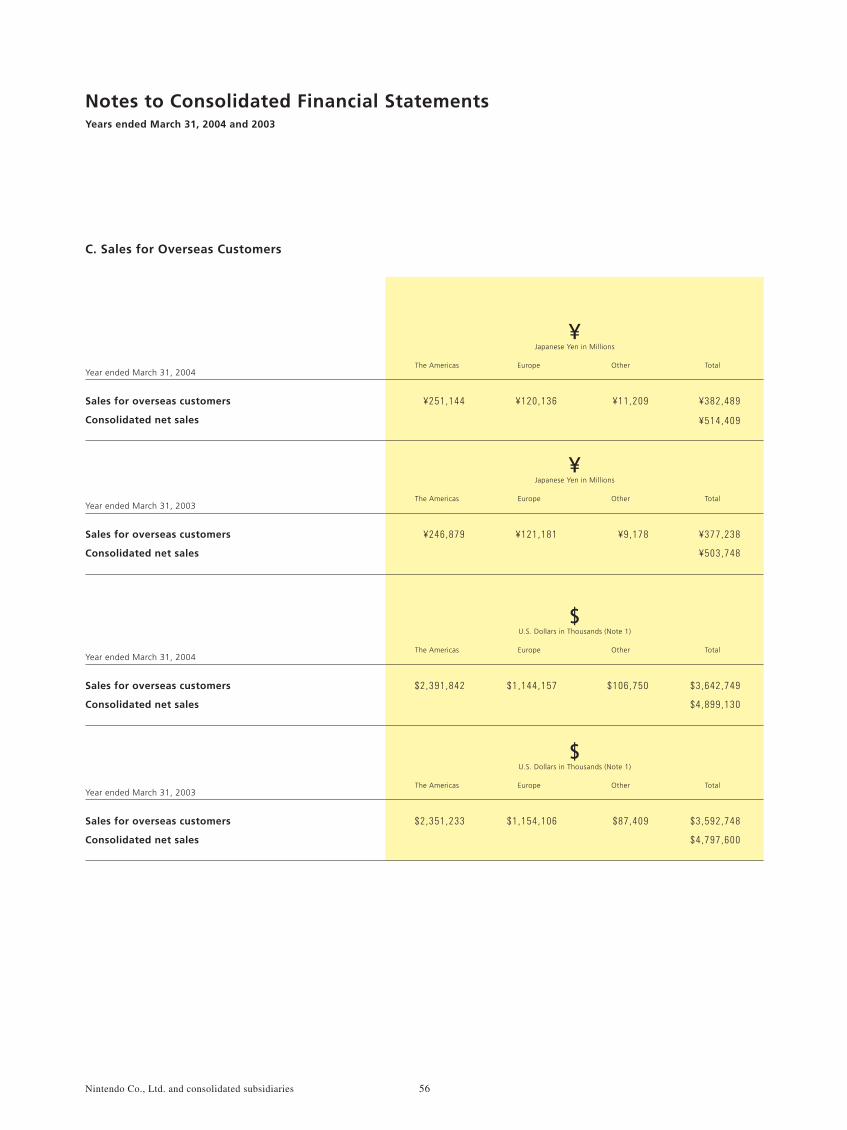
Japanese Yen in Millions¥
Sales for overseas customers
Consolidated net sales
Year ended March 31, 2004The Americas TotalOtherEurope
Japanese Yen in Millions¥
Sales for overseas customers
Consolidated net sales
Year ended March 31, 2003The Americas TotalOtherEurope
U.S. Dollars in Thousands (Note 1)
$
Sales for overseas customers
Consolidated net sales
Year ended March 31, 2004The Americas TotalOtherEurope
U.S. Dollars in Thousands (Note 1)
$
Sales for overseas customers
Consolidated net sales
Year ended March 31, 2003The Americas TotalOtherEurope
C. Sales for Overseas Customers
56Nintendo Co., Ltd. and consolidated subsidiaries
¥251,144 ¥120 ,136 ¥11 ,209 ¥382 ,489
¥514 ,409
¥246 ,879 ¥121 ,181 ¥9 ,178 ¥377 ,238
¥503 ,748
$2 ,391 ,842 $1 ,144 ,157 $106 ,750 $3 ,642 ,749
$4 ,899 ,130
$2 ,351 ,233 $1 ,154 ,106 $87 ,409 $3 ,592 ,748
$4 ,797 ,600
Years ended March 31, 2004 and 2003
Notes to Consolidated Financial Statements
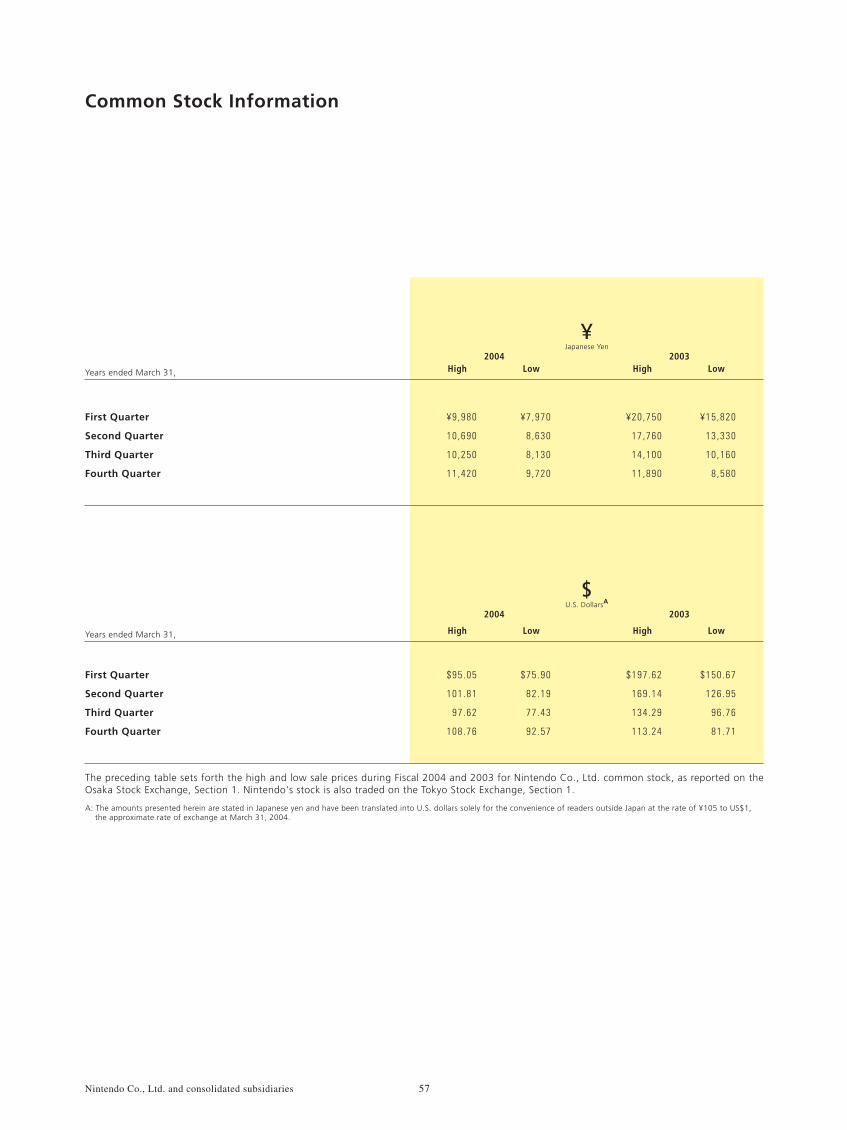
Common Stock Information
Japanese Yen¥
U.S. DollarsA$
High Low High Low
High Low High Low
2004 2003
2004 2003
First Quarter
Second Quarter
Third Quarter
Fourth Quarter
First Quarter
Second Quarter
Third Quarter
Fourth Quarter
Years ended March 31,
Years ended March 31,
The preceding table sets forth the high and low sale prices during Fiscal 2004 and 2003 for Nintendo Co., Ltd. common stock, as reported on the Osaka Stock Exchange, Section 1. Nintendo's stock is also traded on the Tokyo Stock Exchange, Section 1.
57Nintendo Co., Ltd. and consolidated subsidiaries
A: The amounts presented herein are stated in Japanese yen and have been translated into U.S. dollars solely for the convenience of readers outside Japan at the rate of ¥105 to US$1, the approximate rate of exchange at March 31, 2004.
¥9,980
10 ,690
10 ,250
11 ,420
$95 .05
101 .81
97 .62
108 .76
$75 .90
82 .19
77 .43
92 .57
$197 .62
169 .14
134 .29
113 .24
$150 .67
126 .95
96 .76
81 .71
¥7 ,970
8 ,630
8 ,130
9 ,720
¥20 ,750
17 ,760
14 ,100
11 ,890
¥15 ,820
13 ,330
10 ,160
8 ,580
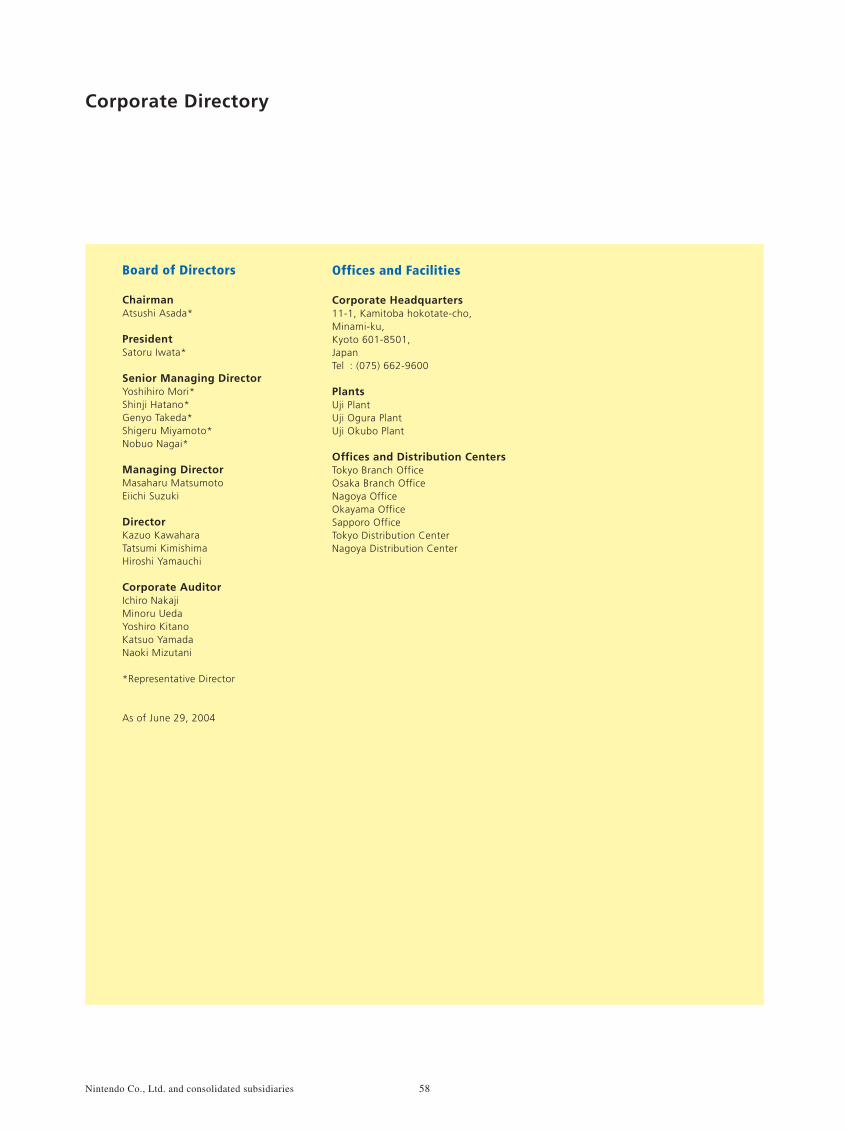
Board of Directors
ChairmanAtsushi Asada*
PresidentSatoru Iwata*
Senior Managing DirectorYoshihiro Mori*Shinji Hatano*Genyo Takeda*Shigeru Miyamoto*Nobuo Nagai*
Managing DirectorMasaharu MatsumotoEiichi Suzuki
DirectorKazuo KawaharaTatsumi KimishimaHiroshi Yamauchi
Corporate AuditorIchiro NakajiMinoru UedaYoshiro KitanoKatsuo YamadaNaoki Mizutani
*Representative Director
As of June 29, 2004
Offices and Facilities
Corporate Headquarters 11-1, Kamitoba hokotate-cho,Minami-ku,Kyoto 601-8501,JapanTel : (075) 662-9600
PlantsUji PlantUji Ogura PlantUji Okubo Plant
Offices and Distribution CentersTokyo Branch OfficeOsaka Branch OfficeNagoya OfficeOkayama OfficeSapporo OfficeTokyo Distribution Center Nagoya Distribution Center
Corporate Directory
58Nintendo Co., Ltd. and consolidated subsidiaries
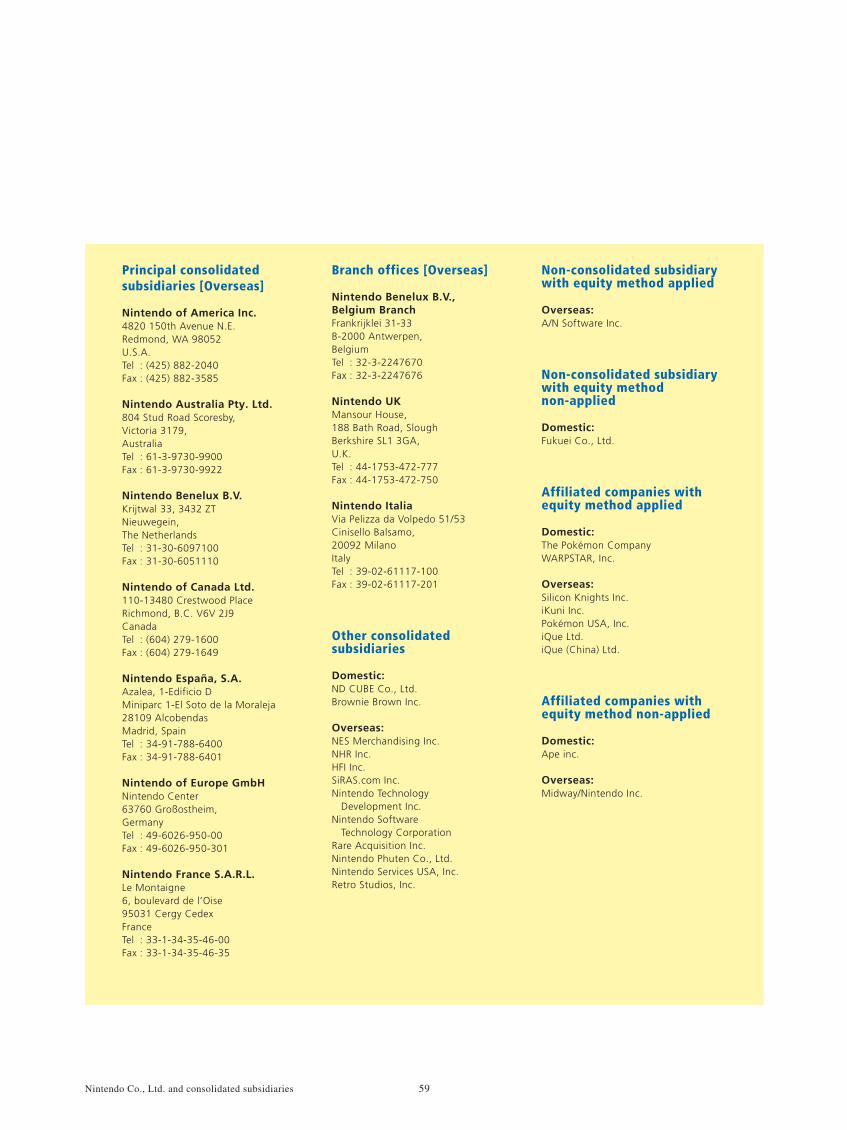
Principal consolidated subsidiaries [Overseas]
Nintendo of America Inc.4820 150th Avenue N.E.Redmond, WA 98052U.S.A.Tel : (425) 882-2040Fax : (425) 882-3585
Nintendo Australia Pty. Ltd.804 Stud Road Scoresby,Victoria 3179,AustraliaTel : 61-3-9730-9900Fax : 61-3-9730-9922
Nintendo Benelux B.V. Krijtwal 33, 3432 ZTNieuwegein,The NetherlandsTel : 31-30-6097100Fax : 31-30-6051110
Nintendo of Canada Ltd.110-13480 Crestwood PlaceRichmond, B.C. V6V 2J9 CanadaTel : (604) 279-1600Fax : (604) 279-1649
Nintendo España, S.A.Azalea, 1-Edificio DMiniparc 1-El Soto de la Moraleja28109 AlcobendasMadrid, SpainTel : 34-91-788-6400Fax : 34-91-788-6401
Nintendo of Europe GmbHNintendo Center63760 Großostheim,GermanyTel : 49-6026-950-00Fax : 49-6026-950-301
Nintendo France S.A.R.L.Le Montaigne6, boulevard de l’Oise95031 Cergy CedexFranceTel : 33-1-34-35-46-00Fax : 33-1-34-35-46-35
Branch offices [Overseas]
Nintendo Benelux B.V.,Belgium BranchFrankrijklei 31-33B-2000 Antwerpen,BelgiumTel : 32-3-2247670Fax : 32-3-2247676
Nintendo UKMansour House,188 Bath Road, SloughBerkshire SL1 3GA,U.K.Tel : 44-1753-472-777Fax : 44-1753-472-750
Nintendo ItaliaVia Pelizza da Volpedo 51/53Cinisello Balsamo,20092 MilanoItalyTel : 39-02-61117-100Fax : 39-02-61117-201
Other consolidated subsidiaries
Domestic:ND CUBE Co., Ltd.Brownie Brown Inc.
Overseas:NES Merchandising Inc.NHR Inc.HFI Inc.SiRAS.com Inc.Nintendo Technology Development Inc.Nintendo Software Technology CorporationRare Acquisition Inc.Nintendo Phuten Co., Ltd.Nintendo Services USA, Inc.Retro Studios, Inc.
Non-consolidated subsidiary with equity method applied
Overseas:A/N Software Inc.
Non-consolidated subsidiary with equity methodnon-applied
Domestic:Fukuei Co., Ltd.
Affiliated companies with equity method applied
Domestic:The Pokémon Company WARPSTAR, Inc.
Overseas:Silicon Knights Inc.iKuni Inc.Pokémon USA, Inc.iQue Ltd.iQue (China) Ltd.
Affiliated companies with equity method non-applied
Domestic:Ape inc.
Overseas:Midway/Nintendo Inc.
59Nintendo Co., Ltd. and consolidated subsidiaries
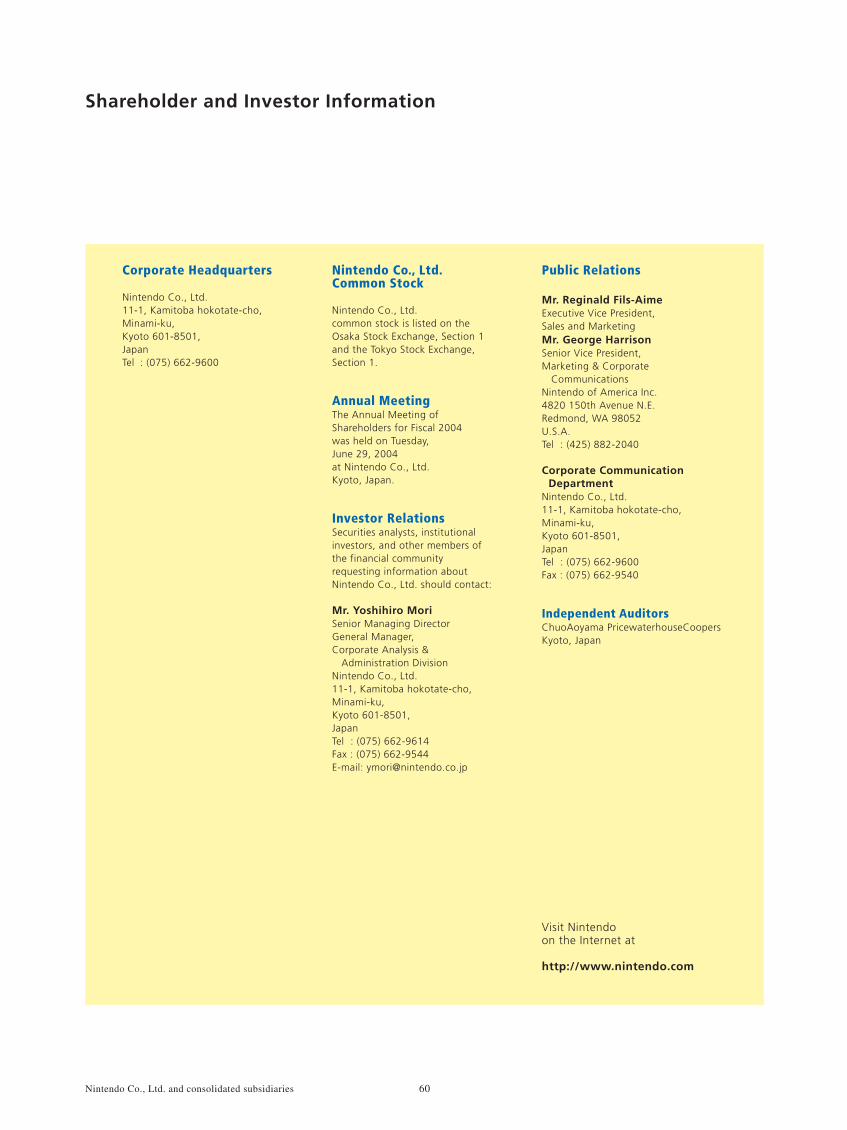
Corporate Headquarters
Nintendo Co., Ltd.11-1, Kamitoba hokotate-cho,Minami-ku,Kyoto 601-8501,JapanTel : (075) 662-9600
Nintendo Co., Ltd. Common Stock
Nintendo Co., Ltd.common stock is listed on theOsaka Stock Exchange, Section 1and the Tokyo Stock Exchange,Section 1.
Annual MeetingThe Annual Meeting ofShareholders for Fiscal 2004was held on Tuesday,June 29, 2004at Nintendo Co., Ltd.Kyoto, Japan.
Investor RelationsSecurities analysts, institutionalinvestors, and other members ofthe financial communityrequesting information aboutNintendo Co., Ltd. should contact:
Mr. Yoshihiro MoriSenior Managing DirectorGeneral Manager,Corporate Analysis & Administration DivisionNintendo Co., Ltd.11-1, Kamitoba hokotate-cho,Minami-ku,Kyoto 601-8501,JapanTel : (075) 662-9614Fax : (075) 662-9544E-mail: [email protected]
Public Relations
Mr. Reginald Fils-AimeExecutive Vice President,Sales and MarketingMr. George HarrisonSenior Vice President,Marketing & Corporate CommunicationsNintendo of America Inc.4820 150th Avenue N.E.Redmond, WA 98052U.S.A.Tel : (425) 882-2040
Corporate Communication DepartmentNintendo Co., Ltd.11-1, Kamitoba hokotate-cho,Minami-ku,Kyoto 601-8501,JapanTel : (075) 662-9600Fax : (075) 662-9540
Independent AuditorsChuoAoyama PricewaterhouseCoopersKyoto, Japan
Visit Nintendoon the Internet at
http://www.nintendo.com
Shareholder and Investor Information
60Nintendo Co., Ltd. and consolidated subsidiaries


Related Documents