Welcome message from author
This document is posted to help you gain knowledge. Please leave a comment to let me know what you think about it! Share it to your friends and learn new things together.
Transcript

7/30/2019 2004 _ anderson county _ elkhart isd _ 2004 texas school survey of drug and alcohol use _ elementary report
http://slidepdf.com/reader/full/2004-anderson-county-elkhart-isd-2004-texas-school-survey-of-drug-and 1/41
7/30/2019 2004 _ anderson county _ elkhart isd _ 2004 texas school survey of drug and alcohol use _ elementary report
http://slidepdf.com/reader/full/2004-anderson-county-elkhart-isd-2004-texas-school-survey-of-drug-and 2/41
ElkhartSpring 2004
________________________________________________________________________________
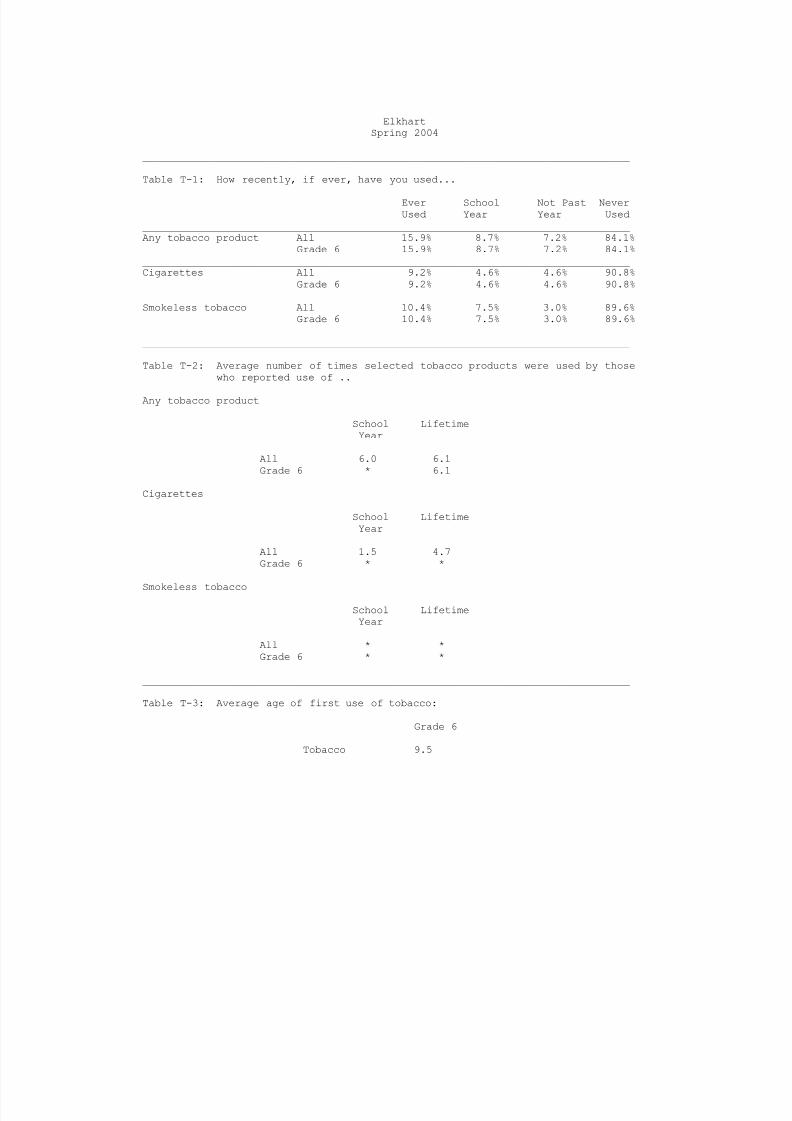
Table T-1: How recently, if ever, have you used...
Ever School Not Past NeverUsed Year Year Used
________________________________________________________________________________Any tobacco product All 15.9% 8.7% 7.2% 84.1%
Grade 6 15.9% 8.7% 7.2% 84.1%________________________________________________________________________________Cigarettes All 9.2% 4.6% 4.6% 90.8%
Grade 6 9.2% 4.6% 4.6% 90.8%________________________________________________________________________________Smokeless tobacco All 10.4% 7.5% 3.0% 89.6%
Grade 6 10.4% 7.5% 3.0% 89.6%
________________________________________________________________________________
Table T-2: Average number of times selected tobacco products were used by thosewho reported use of ..
Any tobacco product
School LifetimeYear
All 6.0 6.1Grade 6 * 6.1
Cigarettes
School LifetimeYear
All 1.5 4.7Grade 6 * *
Smokeless tobacco
School LifetimeYear
All * *Grade 6 * *
________________________________________________________________________________
Table T-3: Average age of first use of tobacco:
Grade 6
Tobacco 9.5
7/30/2019 2004 _ anderson county _ elkhart isd _ 2004 texas school survey of drug and alcohol use _ elementary report
http://slidepdf.com/reader/full/2004-anderson-county-elkhart-isd-2004-texas-school-survey-of-drug-and 3/41
ElkhartSpring 2004
________________________________________________________________________________
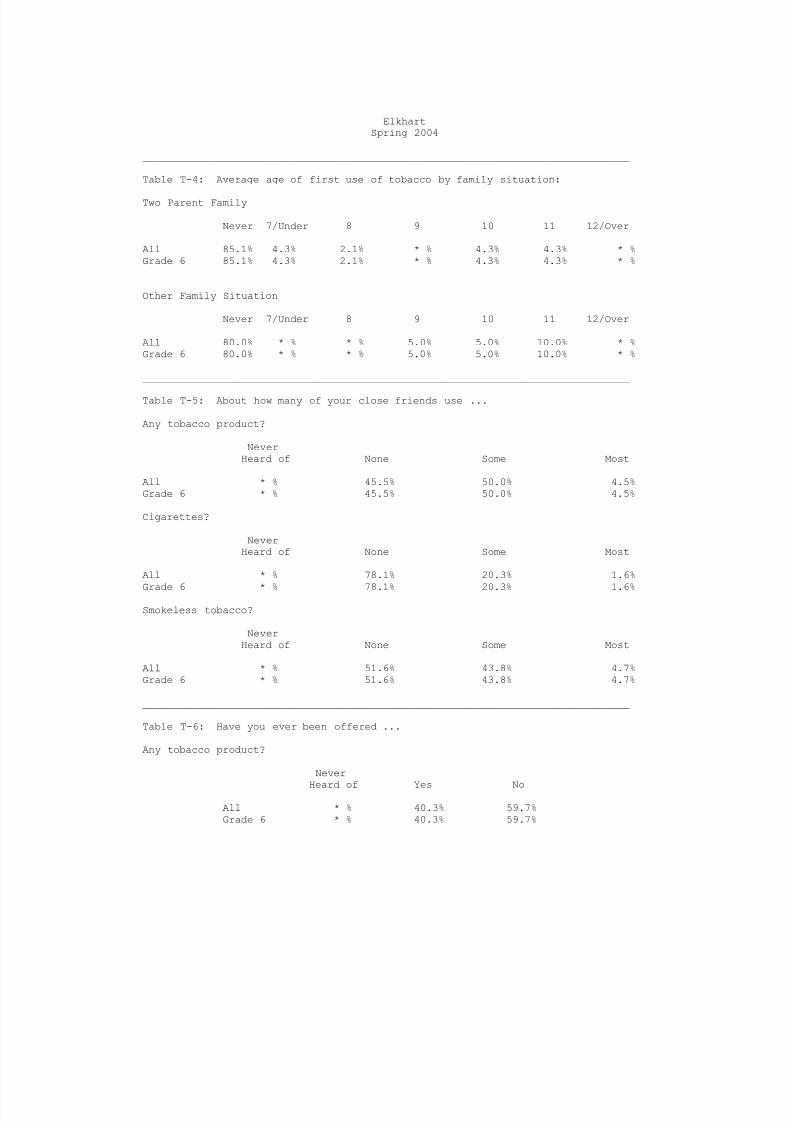
Table T-4: Average age of first use of tobacco by family situation:
Two Parent Family
Never 7/Under 8 9 10 11 12/Over
All 85.1% 4.3% 2.1% * % 4.3% 4.3% * %Grade 6 85.1% 4.3% 2.1% * % 4.3% 4.3% * %
Other Family Situation
Never 7/Under 8 9 10 11 12/Over
All 80.0% * % * % 5.0% 5.0% 10.0% * %Grade 6 80.0% * % * % 5.0% 5.0% 10.0% * %
________________________________________________________________________________
Table T-5: About how many of your close friends use ...
Any tobacco product?
NeverHeard of None Some Most
All * % 45.5% 50.0% 4.5%Grade 6 * % 45.5% 50.0% 4.5%
Cigarettes?
NeverHeard of None Some Most
All * % 78.1% 20.3% 1.6%
Grade 6 * % 78.1% 20.3% 1.6%
Smokeless tobacco?
NeverHeard of None Some Most
All * % 51.6% 43.8% 4.7%Grade 6 * % 51.6% 43.8% 4.7%
________________________________________________________________________________
Table T-6: Have you ever been offered ...
Any tobacco product?
Never
Heard of Yes No
All * % 40.3% 59.7%Grade 6 * % 40.3% 59.7%

7/30/2019 2004 _ anderson county _ elkhart isd _ 2004 texas school survey of drug and alcohol use _ elementary report
http://slidepdf.com/reader/full/2004-anderson-county-elkhart-isd-2004-texas-school-survey-of-drug-and 4/41
ElkhartSpring 2004
________________________________________________________________________________
Cigarettes?
NeverHeard of Yes No
All * % 25.0% 75.0%Grade 6 * % 25.0% 75.0%
Smokeless tobacco?
NeverHeard of Yes No
All * % 29.3% 70.7%Grade 6 * % 29.3% 70.7%
________________________________________________________________________________
Table T-7: How dangerous do you think it is for kids your age to use ...
Any tobacco product?
Never Very Not at All Do NotHeard of Dangerous Dangerous Dangerous Know
All * % 60.3% 33.8% 1.5% 4.4%Grade 6 * % 60.3% 33.8% 1.5% 4.4%
Cigarettes?
Never Very Not at All Do NotHeard of Dangerous Dangerous Dangerous Know
All * % 54.4% 39.7% 1.5% 4.4%Grade 6 * % 54.4% 39.7% 1.5% 4.4%
Smokeless tobacco?
Never Very Not at All Do NotHeard of Dangerous Dangerous Dangerous Know
All * % 55.7% 36.1% 3.3% 4.9%Grade 6 * % 55.7% 36.1% 3.3% 4.9%

7/30/2019 2004 _ anderson county _ elkhart isd _ 2004 texas school survey of drug and alcohol use _ elementary report
http://slidepdf.com/reader/full/2004-anderson-county-elkhart-isd-2004-texas-school-survey-of-drug-and 5/41

7/30/2019 2004 _ anderson county _ elkhart isd _ 2004 texas school survey of drug and alcohol use _ elementary report
http://slidepdf.com/reader/full/2004-anderson-county-elkhart-isd-2004-texas-school-survey-of-drug-and 6/41
ElkhartSpring 2004
________________________________________________________________________________
Table A-1: How recently, if ever, have you used..
Ever School Not Past NeverUsed Year Year Used
________________________________________________________________________________Any alcohol product All 34.3% 20.9% 13.4% 65.7%
Grade 6 34.3% 20.9% 13.4% 65.7%________________________________________________________________________________Beer All 13.4% 7.5% 6.0% 86.6%
Grade 6 13.4% 7.5% 6.0% 86.6%________________________________________________________________________________Wine coolers All 23.1% 9.2% 13.8% 76.9%
Grade 6 23.1% 9.2% 13.8% 76.9%________________________________________________________________________________Wine All 9.4% 6.3% 3.1% 90.6%
Grade 6 9.4% 6.3% 3.1% 90.6%________________________________________________________________________________Liquor All 12.7% 7.9% 4.8% 87.3%
Grade 6 12.7% 7.9% 4.8% 87.3%
________________________________________________________________________________
Table A-2: Average number of times selected alcohol products were used by thosewho reported use of ..
Any alcohol product
School LifetimeYear
All 3.5 3.3Grade 6 3.5 3.3
Beer
School LifetimeYear
All * *Grade 6 * *
Liquor
School LifetimeYear
All * *Grade 6 * *
Wine
School Lifetime
Year
All * 1.5Grade 6 * *
7/30/2019 2004 _ anderson county _ elkhart isd _ 2004 texas school survey of drug and alcohol use _ elementary report
http://slidepdf.com/reader/full/2004-anderson-county-elkhart-isd-2004-texas-school-survey-of-drug-and 7/41
ElkhartSpring 2004
________________________________________________________________________________
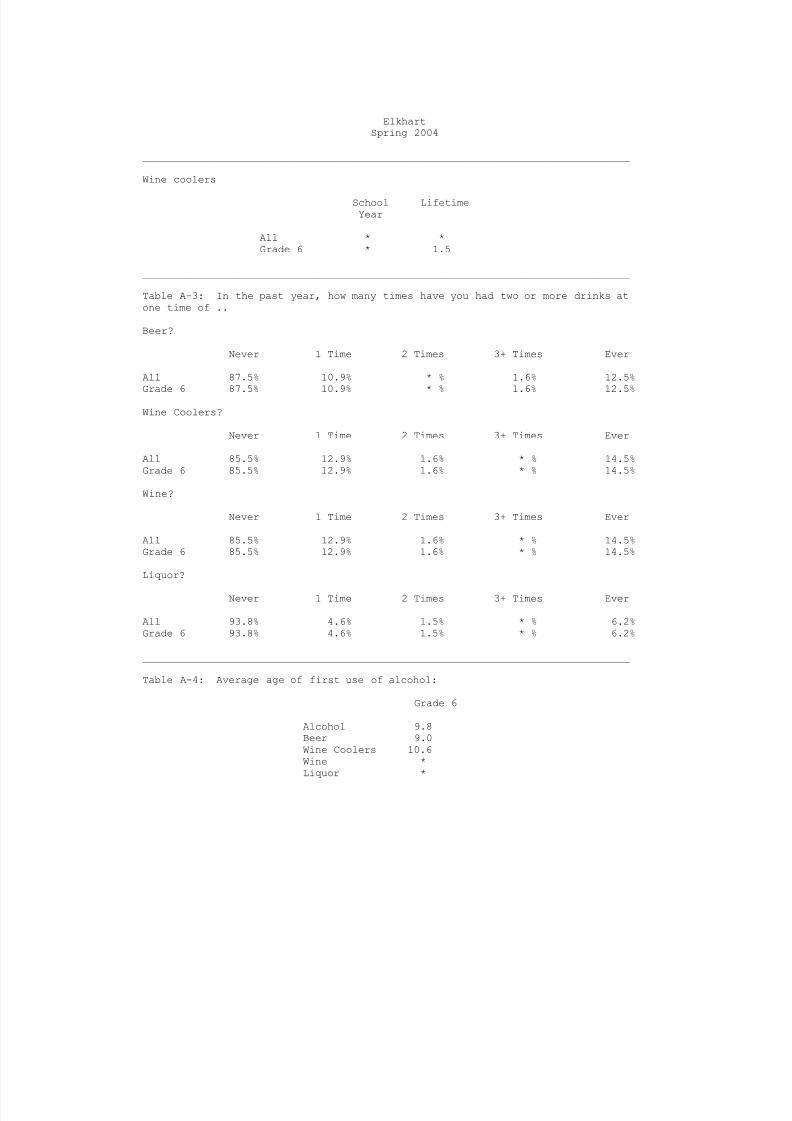
Wine coolers
School LifetimeYear
All * *Grade 6 * 1.5
________________________________________________________________________________
Table A-3: In the past year, how many times have you had two or more drinks atone time of ..
Beer?
Never 1 Time 2 Times 3+ Times Ever
All 87.5% 10.9% * % 1.6% 12.5%
Grade 6 87.5% 10.9% * % 1.6% 12.5%
Wine Coolers?
Never 1 Time 2 Times 3+ Times Ever
All 85.5% 12.9% 1.6% * % 14.5%Grade 6 85.5% 12.9% 1.6% * % 14.5%
Wine?
Never 1 Time 2 Times 3+ Times Ever
All 85.5% 12.9% 1.6% * % 14.5%Grade 6 85.5% 12.9% 1.6% * % 14.5%
Liquor?
Never 1 Time 2 Times 3+ Times Ever
All 93.8% 4.6% 1.5% * % 6.2%Grade 6 93.8% 4.6% 1.5% * % 6.2%
________________________________________________________________________________
Table A-4: Average age of first use of alcohol:
Grade 6
Alcohol 9.8Beer 9.0Wine Coolers 10.6Wine *Liquor *

7/30/2019 2004 _ anderson county _ elkhart isd _ 2004 texas school survey of drug and alcohol use _ elementary report
http://slidepdf.com/reader/full/2004-anderson-county-elkhart-isd-2004-texas-school-survey-of-drug-and 8/41
ElkhartSpring 2004
________________________________________________________________________________
Table A-5: Average age of first use of alcohol by family situation:
Two Parent Family
Never 7/Under 8 9 10 11 12/Over
All 80.4% 6.5% 2.2% * % 6.5% 4.3% * %Grade 6 80.4% 6.5% 2.2% * % 6.5% 4.3% * %
Other Family Situation
Never 7/Under 8 9 10 11 12/Over
All 45.0% 5.0% 5.0% 5.0% 5.0% 5.0% 30.0%Grade 6 45.0% 5.0% 5.0% 5.0% 5.0% 5.0% 30.0%
________________________________________________________________________________
Table A-6 : Lifetime prevalence of use of alcohol by reported conduct problemsthis school year:
No Absences or Cut Sent toConduct Problems School Principal Both
Alcohol 34.1% * % 33.3% * %
________________________________________________________________________________
Table A-7: When you drink alcohol, do you get it from ..
Home?
Don'tDrink Yes No
All 73.8% 10.8% 15.4%Grade 6 73.8% 10.8% 15.4%
Friends?
Don'tDrink Yes No
All 72.1% 6.6% 21.3%Grade 6 72.1% 6.6% 21.3%
Somewhere else?
Don'tDrink Yes No
All 72.6% 16.1% 11.3%Grade 6 72.6% 16.1% 11.3%

7/30/2019 2004 _ anderson county _ elkhart isd _ 2004 texas school survey of drug and alcohol use _ elementary report
http://slidepdf.com/reader/full/2004-anderson-county-elkhart-isd-2004-texas-school-survey-of-drug-and 9/41
ElkhartSpring 2004
________________________________________________________________________________
Table A-8: About how many of your close friends use ..
Any alcohol product?
NeverHeard of None Some Most
All 1.5% 58.5% 35.4% 4.6%Grade 6 1.5% 58.5% 35.4% 4.6%
Beer?
NeverHeard of None Some Most
All 1.6% 68.9% 27.9% 1.6%Grade 6 1.6% 68.9% 27.9% 1.6%
Wine coolers?
NeverHeard of None Some Most
All 1.6% 79.0% 17.7% 1.6%Grade 6 1.6% 79.0% 17.7% 1.6%
Wine?
NeverHeard of None Some Most
All 1.7% 88.3% 10.0% * %Grade 6 1.7% 88.3% 10.0% * %
Liquor?
NeverHeard of None Some Most
All 3.2% 74.2% 21.0% 1.6%Grade 6 3.2% 74.2% 21.0% 1.6%
________________________________________________________________________________
Table A-9: Have you ever been offered ..
Any alcohol product?
NeverHeard of Yes No
All * % 29.7% 70.3%
Grade 6 * % 29.7% 70.3%
Beer?
NeverHeard of Yes No
All * % 25.9% 74.1%Grade 6 * % 25.9% 74.1%
7/30/2019 2004 _ anderson county _ elkhart isd _ 2004 texas school survey of drug and alcohol use _ elementary report
http://slidepdf.com/reader/full/2004-anderson-county-elkhart-isd-2004-texas-school-survey-of-drug-and 10/41
ElkhartSpring 2004
________________________________________________________________________________
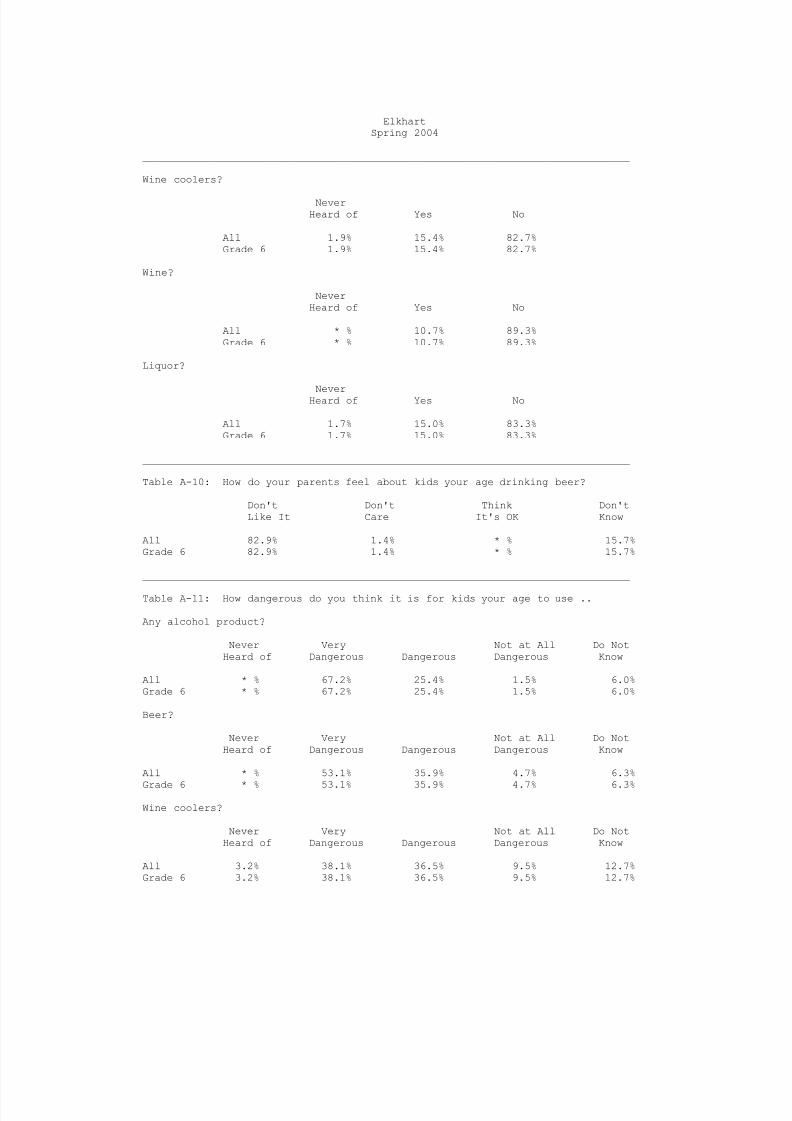
Wine coolers?
NeverHeard of Yes No
All 1.9% 15.4% 82.7%Grade 6 1.9% 15.4% 82.7%
Wine?
NeverHeard of Yes No
All * % 10.7% 89.3%Grade 6 * % 10.7% 89.3%
Liquor?
NeverHeard of Yes No
All 1.7% 15.0% 83.3%Grade 6 1.7% 15.0% 83.3%
________________________________________________________________________________
Table A-10: How do your parents feel about kids your age drinking beer?
Don't Don't Think Don'tLike It Care It's OK Know
All 82.9% 1.4% * % 15.7%Grade 6 82.9% 1.4% * % 15.7%
________________________________________________________________________________
Table A-11: How dangerous do you think it is for kids your age to use ..
Any alcohol product?
Never Very Not at All Do NotHeard of Dangerous Dangerous Dangerous Know
All * % 67.2% 25.4% 1.5% 6.0%Grade 6 * % 67.2% 25.4% 1.5% 6.0%
Beer?
Never Very Not at All Do NotHeard of Dangerous Dangerous Dangerous Know
All * % 53.1% 35.9% 4.7% 6.3%
Grade 6 * % 53.1% 35.9% 4.7% 6.3%
Wine coolers?
Never Very Not at All Do NotHeard of Dangerous Dangerous Dangerous Know
All 3.2% 38.1% 36.5% 9.5% 12.7%Grade 6 3.2% 38.1% 36.5% 9.5% 12.7%
7/30/2019 2004 _ anderson county _ elkhart isd _ 2004 texas school survey of drug and alcohol use _ elementary report
http://slidepdf.com/reader/full/2004-anderson-county-elkhart-isd-2004-texas-school-survey-of-drug-and 11/41
ElkhartSpring 2004
________________________________________________________________________________
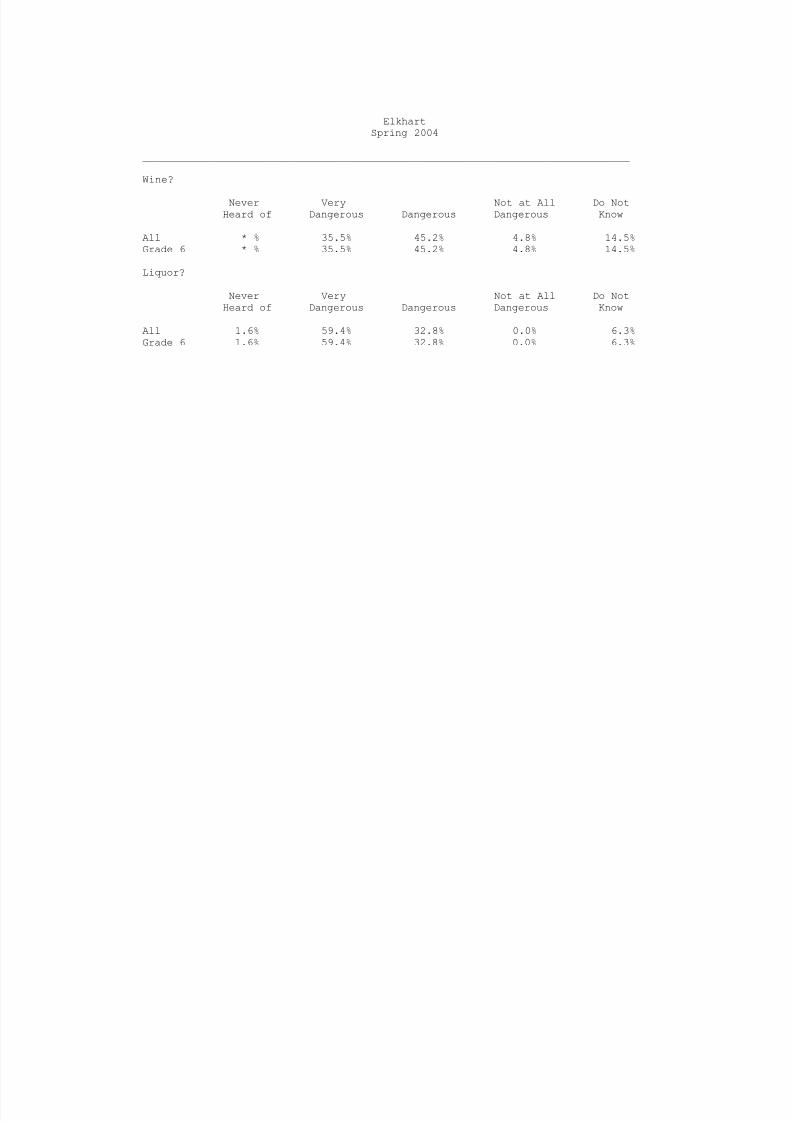
Wine?
Never Very Not at All Do NotHeard of Dangerous Dangerous Dangerous Know
All * % 35.5% 45.2% 4.8% 14.5%Grade 6 * % 35.5% 45.2% 4.8% 14.5%
Liquor?
Never Very Not at All Do NotHeard of Dangerous Dangerous Dangerous Know
All 1.6% 59.4% 32.8% 0.0% 6.3%Grade 6 1.6% 59.4% 32.8% 0.0% 6.3%

7/30/2019 2004 _ anderson county _ elkhart isd _ 2004 texas school survey of drug and alcohol use _ elementary report
http://slidepdf.com/reader/full/2004-anderson-county-elkhart-isd-2004-texas-school-survey-of-drug-and 12/41
ElkhartSpring 2004
________________________________________________________________________________
Table D-1: How recently, if ever, have you used..
Ever School Not Past NeverUsed Year Year Used
________________________________________________________________________________Marijuana All 3.1% * % 3.1% 96.9%
Grade 6 3.1% * % 3.1% 96.9%
________________________________________________________________________________
Table D-2: Average number of times marijuana was used by those reporting usage:
School LifetimeYear
All * *Grade 6 * *
________________________________________________________________________________
Table D-3: Average age of first use of marijuana:
Grade 6
Marijuana *
________________________________________________________________________________
Table D-4: Average age of first use of marijuana by family situation:
Two Parent Family
Never 7/Under 8 9 10 11 12/Over
All 100.0% * % * % * % * % * % * %
Grade 6 100.0% * % * % * % * % * % * %
Other Family Situation
Never 7/Under 8 9 10 11 12/Over
All 90.0% 5.0% * % 5.0% * % * % * %Grade 6 90.0% 5.0% * % 5.0% * % * % * %
________________________________________________________________________________
Table D-5 : Lifetime prevalence of use of marijuana by reported conductproblems this school year:
No Absences or Cut Sent toConduct Problems School Principal Both
Marijuana 4.5% * % * % * %

7/30/2019 2004 _ anderson county _ elkhart isd _ 2004 texas school survey of drug and alcohol use _ elementary report
http://slidepdf.com/reader/full/2004-anderson-county-elkhart-isd-2004-texas-school-survey-of-drug-and 13/41
ElkhartSpring 2004
________________________________________________________________________________
Table D-6: About how many of your close friends use marijuana?
NeverHeard of None Some Most
All 1.6% 88.7% 8.1% 1.6%Grade 6 1.6% 88.7% 8.1% 1.6%
________________________________________________________________________________
Table D-7: Have you ever been offered marijuana?
NeverHeard of Yes No
All 1.7% 5.2% 93.1%Grade 6 1.7% 5.2% 93.1%
________________________________________________________________________________
Table D-8: How do your parents feel about kids your age smoking marijuana?
Don't Don't Think Don'tLike It Care It's OK Know
All 89.9% 1.4% * % 8.7%Grade 6 89.9% 1.4% * % 8.7%
________________________________________________________________________________
Table D-9: How dangerous do you think it is for kids your age to use marijuana?
Never Very Not at All Do NotHeard of Dangerous Dangerous Dangerous Know
All * % 84.1% 9.5% 3.2% 3.2%Grade 6 * % 84.1% 9.5% 3.2% 3.2%
7/30/2019 2004 _ anderson county _ elkhart isd _ 2004 texas school survey of drug and alcohol use _ elementary report
http://slidepdf.com/reader/full/2004-anderson-county-elkhart-isd-2004-texas-school-survey-of-drug-and 14/41
ElkhartSpring 2004
________________________________________________________________________________
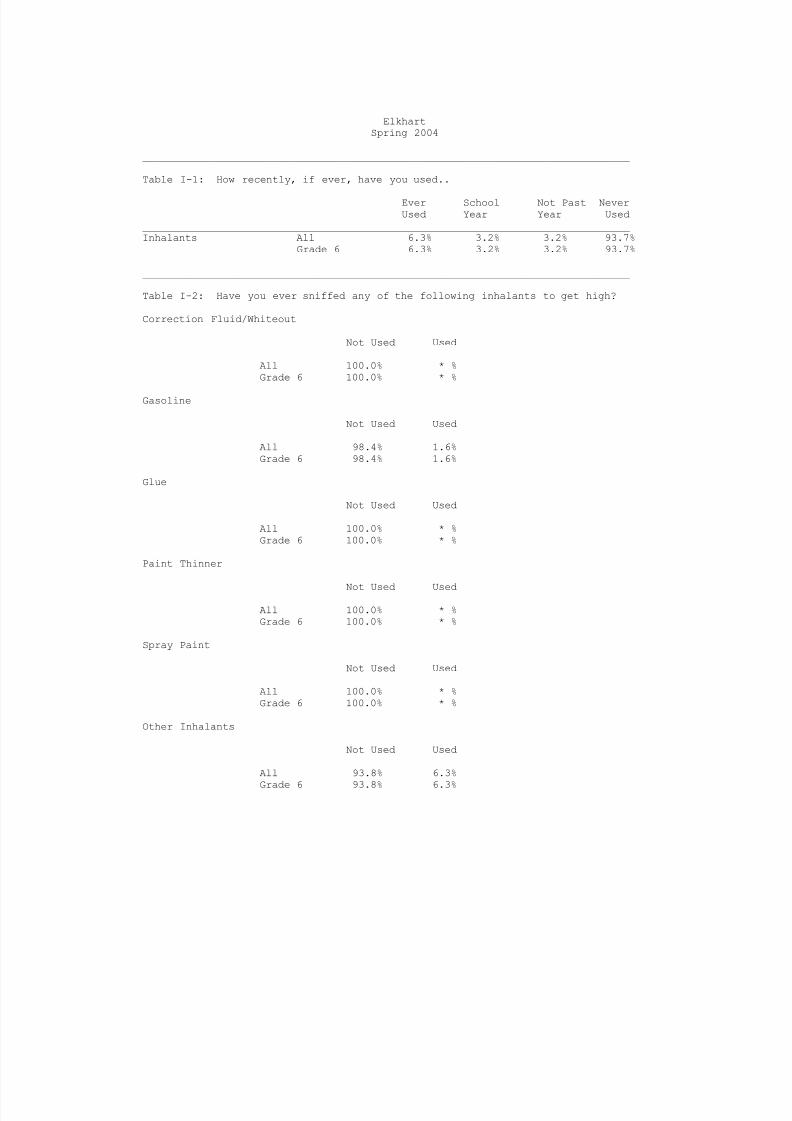
Table I-1: How recently, if ever, have you used..
Ever School Not Past NeverUsed Year Year Used
________________________________________________________________________________Inhalants All 6.3% 3.2% 3.2% 93.7%
Grade 6 6.3% 3.2% 3.2% 93.7%
________________________________________________________________________________
Table I-2: Have you ever sniffed any of the following inhalants to get high?
Correction Fluid/Whiteout
Not Used Used
All 100.0% * %Grade 6 100.0% * %
Gasoline
Not Used Used
All 98.4% 1.6%Grade 6 98.4% 1.6%
Glue
Not Used Used
All 100.0% * %Grade 6 100.0% * %
Paint Thinner
Not Used Used
All 100.0% * %Grade 6 100.0% * %
Spray Paint
Not Used Used
All 100.0% * %Grade 6 100.0% * %
Other Inhalants
Not Used Used
All 93.8% 6.3%
Grade 6 93.8% 6.3%

7/30/2019 2004 _ anderson county _ elkhart isd _ 2004 texas school survey of drug and alcohol use _ elementary report
http://slidepdf.com/reader/full/2004-anderson-county-elkhart-isd-2004-texas-school-survey-of-drug-and 15/41
ElkhartSpring 2004
________________________________________________________________________________
Table I-3: Average number of times inhalants were used by those reporting usage:
School LifetimeYear
All * *Grade 6 * *
________________________________________________________________________________
Table I-4: Number of different kinds of inhalants used:
0 1 2-3 4+
All 94.4% 4.2% 1.4% * %Grade 6 94.4% 4.2% 1.4% * %
________________________________________________________________________________
Table I-5: Average age of first use of inhalants:
Grade 6
Inhalants *
________________________________________________________________________________
Table I-6: Average age of first use of inhalants by family situation:
Two Parent Family
Never 7/Under 8 9 10 11 12/Over
All 95.3% * % * % 2.3% * % * % 2.3%Grade 6 95.3% * % * % 2.3% * % * % 2.3%
Other Family Situation
Never 7/Under 8 9 10 11 12/Over
All 94.4% * % * % * % * % * % 5.6%Grade 6 94.4% * % * % * % * % * % 5.6%
________________________________________________________________________________
Table I-7: Lifetime prevalence of use of inhalants by reported conductproblems this school year:
No Absences or Cut Sent toConduct Problems School Principal Both
Inhalants 5.0% * % 5.9% * %

7/30/2019 2004 _ anderson county _ elkhart isd _ 2004 texas school survey of drug and alcohol use _ elementary report
http://slidepdf.com/reader/full/2004-anderson-county-elkhart-isd-2004-texas-school-survey-of-drug-and 16/41
ElkhartSpring 2004
________________________________________________________________________________
Table I-8: About how many of your close friends use inhalants?
NeverHeard of None Some Most
All * % 80.6% 19.4% * %Grade 6 * % 80.6% 19.4% * %
________________________________________________________________________________
Table I-9: Have you ever been offered inhalants?
NeverHeard of Yes No
All 1.8% 10.5% 87.7%Grade 6 1.8% 10.5% 87.7%
________________________________________________________________________________
Table I-10: How dangerous do you think it is for kids your age to use inhalants?
Never Very Not at All Do NotHeard of Dangerous Dangerous Dangerous Know
All * % 69.0% 25.9% 1.7% 3.4%Grade 6 * % 69.0% 25.9% 1.7% 3.4%

7/30/2019 2004 _ anderson county _ elkhart isd _ 2004 texas school survey of drug and alcohol use _ elementary report
http://slidepdf.com/reader/full/2004-anderson-county-elkhart-isd-2004-texas-school-survey-of-drug-and 17/41
7/30/2019 2004 _ anderson county _ elkhart isd _ 2004 texas school survey of drug and alcohol use _ elementary report
http://slidepdf.com/reader/full/2004-anderson-county-elkhart-isd-2004-texas-school-survey-of-drug-and 18/41
ElkhartSpring 2004
________________________________________________________________________________
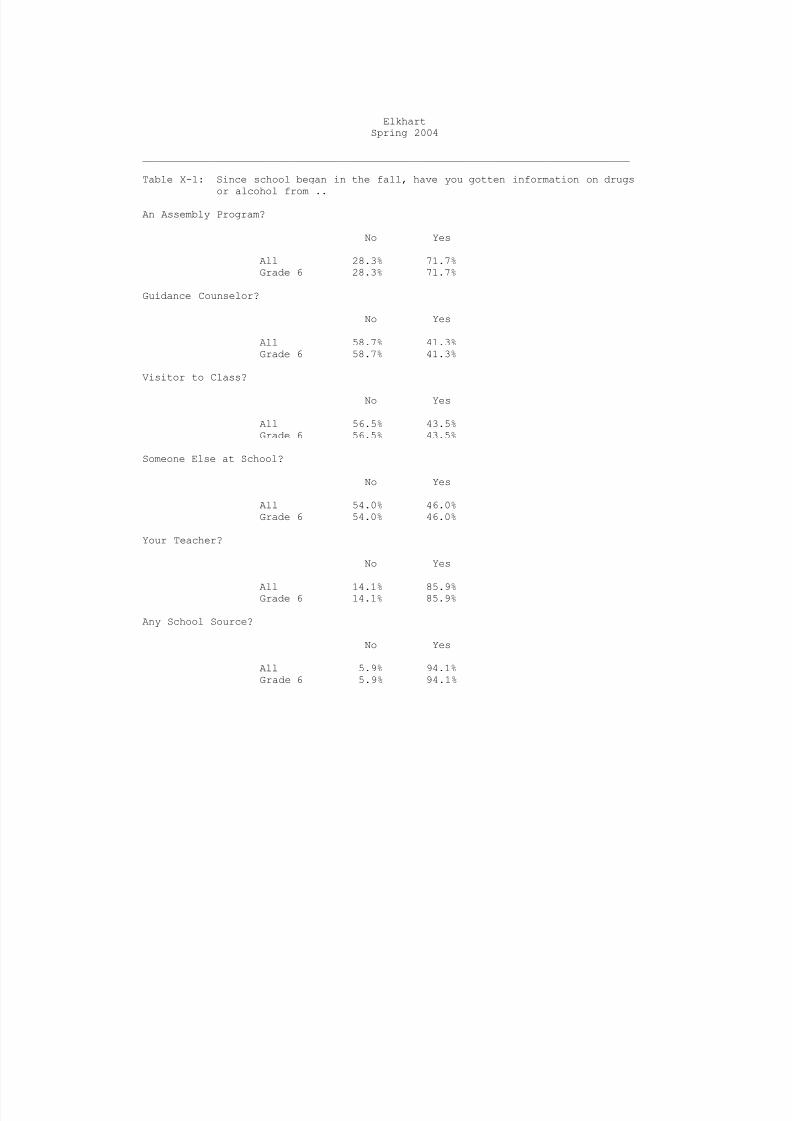
Table X-1: Since school began in the fall, have you gotten information on drugs
or alcohol from ..
An Assembly Program?
No Yes
All 28.3% 71.7%Grade 6 28.3% 71.7%
Guidance Counselor?
No Yes
All 58.7% 41.3%Grade 6 58.7% 41.3%
Visitor to Class?
No Yes
All 56.5% 43.5%Grade 6 56.5% 43.5%
Someone Else at School?
No Yes
All 54.0% 46.0%Grade 6 54.0% 46.0%
Your Teacher?
No Yes
All 14.1% 85.9%Grade 6 14.1% 85.9%
Any School Source?
No Yes
All 5.9% 94.1%Grade 6 5.9% 94.1%

7/30/2019 2004 _ anderson county _ elkhart isd _ 2004 texas school survey of drug and alcohol use _ elementary report
http://slidepdf.com/reader/full/2004-anderson-county-elkhart-isd-2004-texas-school-survey-of-drug-and 19/41
7/30/2019 2004 _ anderson county _ elkhart isd _ 2004 texas school survey of drug and alcohol use _ elementary report
http://slidepdf.com/reader/full/2004-anderson-county-elkhart-isd-2004-texas-school-survey-of-drug-and 20/41
ElkhartSpring 2004
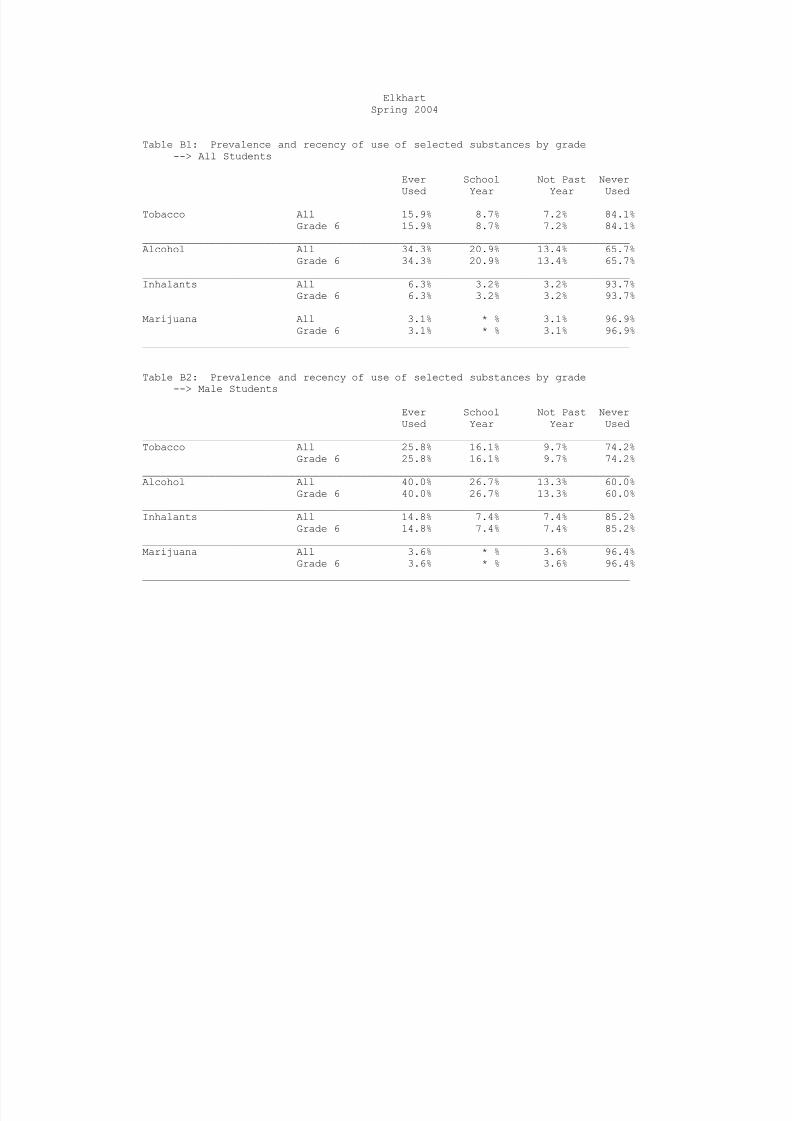
Table B1: Prevalence and recency of use of selected substances by grade--> All Students
Ever School Not Past Never
Used Year Year Used________________________________________________________________________________Tobacco All 15.9% 8.7% 7.2% 84.1%
Grade 6 15.9% 8.7% 7.2% 84.1%________________________________________________________________________________Alcohol All 34.3% 20.9% 13.4% 65.7%
Grade 6 34.3% 20.9% 13.4% 65.7%________________________________________________________________________________Inhalants All 6.3% 3.2% 3.2% 93.7%
Grade 6 6.3% 3.2% 3.2% 93.7%________________________________________________________________________________Marijuana All 3.1% * % 3.1% 96.9%
Grade 6 3.1% * % 3.1% 96.9%________________________________________________________________________________
Table B2: Prevalence and recency of use of selected substances by grade
--> Male Students
Ever School Not Past NeverUsed Year Year Used
________________________________________________________________________________Tobacco All 25.8% 16.1% 9.7% 74.2%
Grade 6 25.8% 16.1% 9.7% 74.2%________________________________________________________________________________Alcohol All 40.0% 26.7% 13.3% 60.0%
Grade 6 40.0% 26.7% 13.3% 60.0%________________________________________________________________________________Inhalants All 14.8% 7.4% 7.4% 85.2%
Grade 6 14.8% 7.4% 7.4% 85.2%________________________________________________________________________________Marijuana All 3.6% * % 3.6% 96.4%
Grade 6 3.6% * % 3.6% 96.4%________________________________________________________________________________

7/30/2019 2004 _ anderson county _ elkhart isd _ 2004 texas school survey of drug and alcohol use _ elementary report
http://slidepdf.com/reader/full/2004-anderson-county-elkhart-isd-2004-texas-school-survey-of-drug-and 21/41
ElkhartSpring 2004
Table B3: Prevalence and recency of use of selected substances by grade--> Female Students
Ever School Not Past Never
Used Year Year Used________________________________________________________________________________Tobacco All 7.9% 2.6% 5.3% 92.1%
Grade 6 7.9% 2.6% 5.3% 92.1%________________________________________________________________________________Alcohol All 29.7% 16.2% 13.5% 70.3%
Grade 6 29.7% 16.2% 13.5% 70.3%________________________________________________________________________________Inhalants All 0.0% * % * % 100.0%
Grade 6 0.0% * % * % 100.0%________________________________________________________________________________Marijuana All 2.7% * % 2.7% 97.3%
Grade 6 2.7% * % 2.7% 97.3%________________________________________________________________________________
Table B4: Prevalence and recency of use of selected substances by grade
--> White Students
Ever School Not Past NeverUsed Year Year Used
________________________________________________________________________________Tobacco All 17.2% 8.6% 8.6% 82.8%
Grade 6 17.2% 8.6% 8.6% 82.8%________________________________________________________________________________Alcohol All 34.5% 22.4% 12.1% 65.5%
Grade 6 34.5% 22.4% 12.1% 65.5%________________________________________________________________________________Inhalants All 7.3% 3.6% 3.6% 92.7%
Grade 6 7.3% 3.6% 3.6% 92.7%________________________________________________________________________________Marijuana All 1.8% * % 1.8% 98.2%
Grade 6 1.8% * % 1.8% 98.2%________________________________________________________________________________

7/30/2019 2004 _ anderson county _ elkhart isd _ 2004 texas school survey of drug and alcohol use _ elementary report
http://slidepdf.com/reader/full/2004-anderson-county-elkhart-isd-2004-texas-school-survey-of-drug-and 22/41
ElkhartSpring 2004
Table B5: Prevalence and recency of use of selected substances by grade--> African/American Students
Ever School Not Past Never
Used Year Year Used________________________________________________________________________________Tobacco All * % * % * % * %
Grade 6 * % * % * % * %________________________________________________________________________________Alcohol All * % * % * % * %
Grade 6 * % * % * % * %________________________________________________________________________________Inhalants All * % * % * % * %
Grade 6 * % * % * % * %________________________________________________________________________________Marijuana All * % * % * % * %
Grade 6 * % * % * % * %________________________________________________________________________________
Table B6: Prevalence and recency of use of selected substances by grade
--> Mexican/American Students
Ever School Not Past NeverUsed Year Year Used
________________________________________________________________________________Tobacco All * % * % * % * %
Grade 6 * % * % * % * %________________________________________________________________________________Alcohol All * % * % * % * %
Grade 6 * % * % * % * %________________________________________________________________________________Inhalants All * % * % * % * %
Grade 6 * % * % * % * %________________________________________________________________________________Marijuana All * % * % * % * %
Grade 6 * % * % * % * %________________________________________________________________________________

7/30/2019 2004 _ anderson county _ elkhart isd _ 2004 texas school survey of drug and alcohol use _ elementary report
http://slidepdf.com/reader/full/2004-anderson-county-elkhart-isd-2004-texas-school-survey-of-drug-and 23/41
ElkhartSpring 2004
Table B7: Prevalence and recency of use of selected substances by grade--> Students Reporting A and B Grades
Ever School Not Past Never
Used Year Year Used________________________________________________________________________________Tobacco All 12.3% 7.0% 5.3% 87.7%
Grade 6 12.3% 7.0% 5.3% 87.7%________________________________________________________________________________Alcohol All 35.7% 19.6% 16.1% 64.3%
Grade 6 35.7% 19.6% 16.1% 64.3%________________________________________________________________________________Inhalants All 5.6% 1.9% 3.7% 94.4%
Grade 6 5.6% 1.9% 3.7% 94.4%________________________________________________________________________________Marijuana All 1.8% * % 1.8% 98.2%
Grade 6 1.8% * % 1.8% 98.2%________________________________________________________________________________
Table B8: Prevalence and recency of use of selected substances by grade
--> Students Reporting C, D, and F Grades
Ever School Not Past NeverUsed Year Year Used
________________________________________________________________________________Tobacco All 36.4% 18.2% 18.2% 63.6%
Grade 6 36.4% 18.2% 18.2% 63.6%________________________________________________________________________________Alcohol All 30.0% 30.0% * % 70.0%
Grade 6 30.0% 30.0% * % 70.0%________________________________________________________________________________Inhalants All * % * % * % * %
Grade 6 * % * % * % * %________________________________________________________________________________Marijuana All * % * % * % * %
Grade 6 * % * % * % * %________________________________________________________________________________
7/30/2019 2004 _ anderson county _ elkhart isd _ 2004 texas school survey of drug and alcohol use _ elementary report
http://slidepdf.com/reader/full/2004-anderson-county-elkhart-isd-2004-texas-school-survey-of-drug-and 24/41
ElkhartSpring 2004
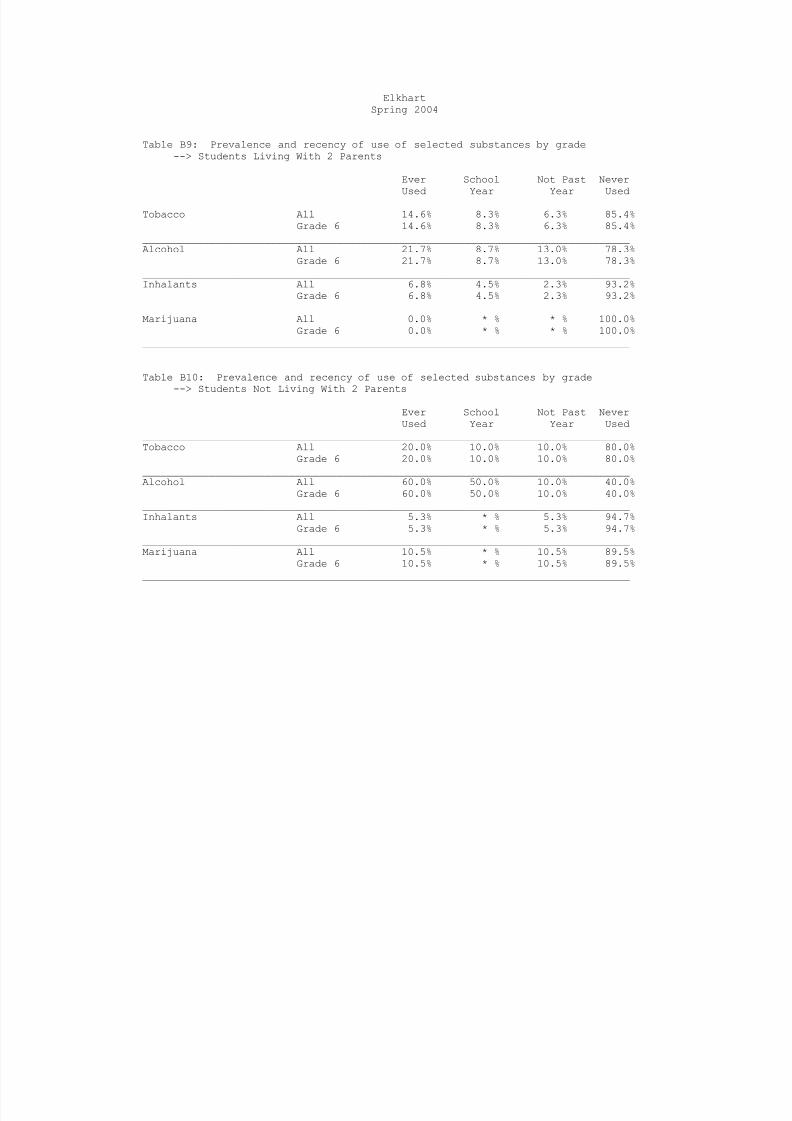
Table B9: Prevalence and recency of use of selected substances by grade--> Students Living With 2 Parents
Ever School Not Past Never
Used Year Year Used________________________________________________________________________________Tobacco All 14.6% 8.3% 6.3% 85.4%
Grade 6 14.6% 8.3% 6.3% 85.4%________________________________________________________________________________Alcohol All 21.7% 8.7% 13.0% 78.3%
Grade 6 21.7% 8.7% 13.0% 78.3%________________________________________________________________________________Inhalants All 6.8% 4.5% 2.3% 93.2%
Grade 6 6.8% 4.5% 2.3% 93.2%________________________________________________________________________________Marijuana All 0.0% * % * % 100.0%
Grade 6 0.0% * % * % 100.0%________________________________________________________________________________
Table B10: Prevalence and recency of use of selected substances by grade
--> Students Not Living With 2 Parents
Ever School Not Past NeverUsed Year Year Used
________________________________________________________________________________Tobacco All 20.0% 10.0% 10.0% 80.0%
Grade 6 20.0% 10.0% 10.0% 80.0%________________________________________________________________________________Alcohol All 60.0% 50.0% 10.0% 40.0%
Grade 6 60.0% 50.0% 10.0% 40.0%________________________________________________________________________________Inhalants All 5.3% * % 5.3% 94.7%
Grade 6 5.3% * % 5.3% 94.7%________________________________________________________________________________Marijuana All 10.5% * % 10.5% 89.5%
Grade 6 10.5% * % 10.5% 89.5%________________________________________________________________________________
7/30/2019 2004 _ anderson county _ elkhart isd _ 2004 texas school survey of drug and alcohol use _ elementary report
http://slidepdf.com/reader/full/2004-anderson-county-elkhart-isd-2004-texas-school-survey-of-drug-and 25/41
ElkhartSpring 2004
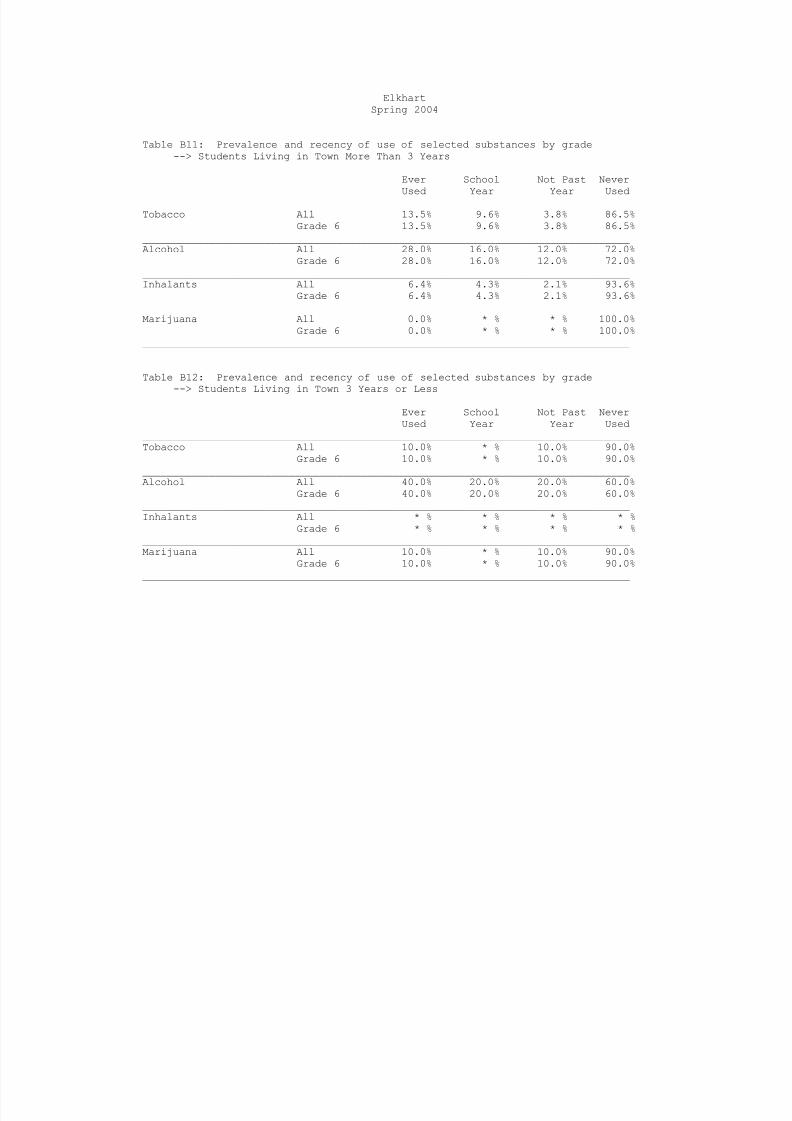
Table B11: Prevalence and recency of use of selected substances by grade--> Students Living in Town More Than 3 Years
Ever School Not Past Never
Used Year Year Used________________________________________________________________________________Tobacco All 13.5% 9.6% 3.8% 86.5%
Grade 6 13.5% 9.6% 3.8% 86.5%________________________________________________________________________________Alcohol All 28.0% 16.0% 12.0% 72.0%
Grade 6 28.0% 16.0% 12.0% 72.0%________________________________________________________________________________Inhalants All 6.4% 4.3% 2.1% 93.6%
Grade 6 6.4% 4.3% 2.1% 93.6%________________________________________________________________________________Marijuana All 0.0% * % * % 100.0%
Grade 6 0.0% * % * % 100.0%________________________________________________________________________________
Table B12: Prevalence and recency of use of selected substances by grade
--> Students Living in Town 3 Years or Less
Ever School Not Past NeverUsed Year Year Used
________________________________________________________________________________Tobacco All 10.0% * % 10.0% 90.0%
Grade 6 10.0% * % 10.0% 90.0%________________________________________________________________________________Alcohol All 40.0% 20.0% 20.0% 60.0%
Grade 6 40.0% 20.0% 20.0% 60.0%________________________________________________________________________________Inhalants All * % * % * % * %
Grade 6 * % * % * % * %________________________________________________________________________________Marijuana All 10.0% * % 10.0% 90.0%
Grade 6 10.0% * % 10.0% 90.0%________________________________________________________________________________

7/30/2019 2004 _ anderson county _ elkhart isd _ 2004 texas school survey of drug and alcohol use _ elementary report
http://slidepdf.com/reader/full/2004-anderson-county-elkhart-isd-2004-texas-school-survey-of-drug-and 26/41
ElkhartSpring 2004
The FREQ Procedure
GENDER
Q1 Frequency Percent
_______________________________Female 38 53.52Male 33 46.48
GRADE LEVEL
Q2 Frequency Percent________________________________Grade 6 71 100.00
DO YOU LIVE WITH BOTH PARENTS?
Q3 Frequency Percent___________________________________No 21 30.00
Yes 49 70.00
Frequency Missing = 1
AGE
Q4 Frequency Percent______________________________________11 19 27.1412 44 62.8613 or older 7 10.00
Frequency Missing = 1
ETHNICITY
Q5 Frequency Percent_________________________________________African/American 4 5.97Mexican/American 3 4.48Other 2 2.99White 58 86.57
Frequency Missing = 4
WHAT GRADES DO YOU USUALLY GET
Q6 Frequency Percent___________________________________Mostly A's 22 31.88Mostly B's 36 52.17
Mostly C's 6 8.70Mostly D's 3 4.35Mostly F's 2 2.90
Frequency Missing = 2
The frequencies have been weighted so that theanalysis reflects the distribution of students by grade
level in the district
7/30/2019 2004 _ anderson county _ elkhart isd _ 2004 texas school survey of drug and alcohol use _ elementary report
http://slidepdf.com/reader/full/2004-anderson-county-elkhart-isd-2004-texas-school-survey-of-drug-and 27/41
ElkhartSpring 2004
The FREQ Procedure
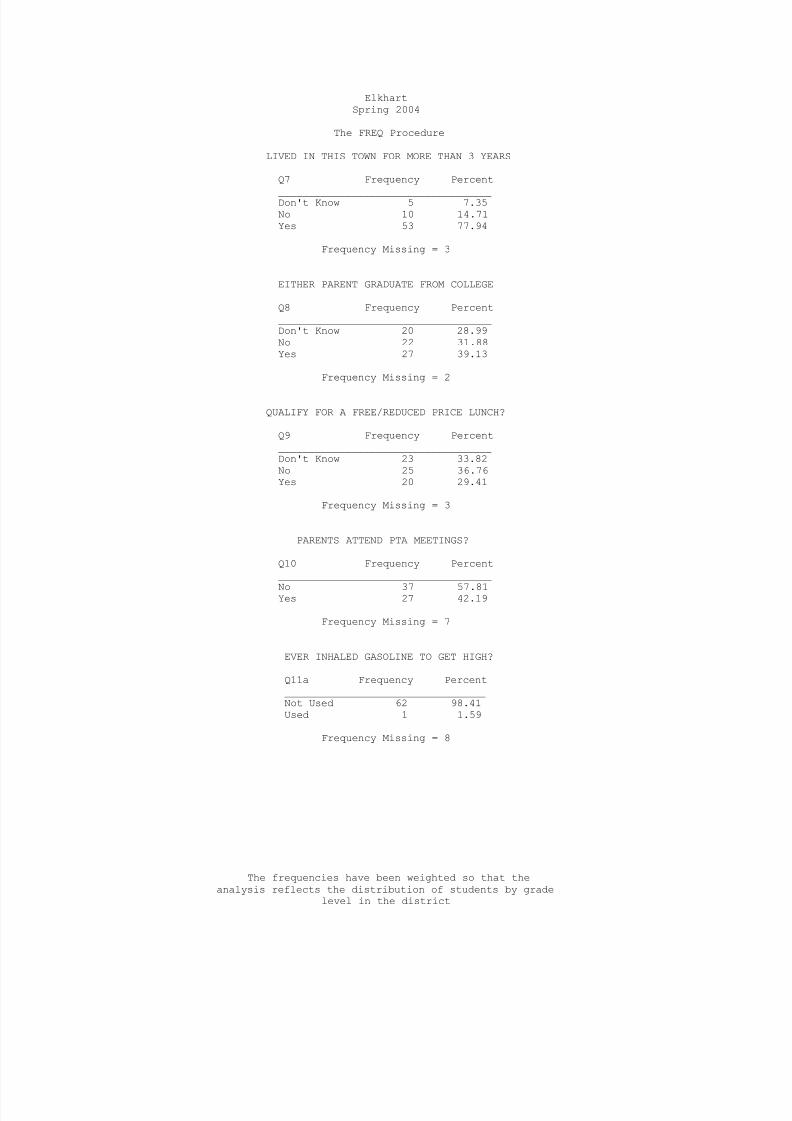
LIVED IN THIS TOWN FOR MORE THAN 3 YEARS
Q7 Frequency Percent
___________________________________Don't Know 5 7.35No 10 14.71Yes 53 77.94
Frequency Missing = 3
EITHER PARENT GRADUATE FROM COLLEGE
Q8 Frequency Percent___________________________________Don't Know 20 28.99No 22 31.88Yes 27 39.13
Frequency Missing = 2
QUALIFY FOR A FREE/REDUCED PRICE LUNCH?
Q9 Frequency Percent___________________________________Don't Know 23 33.82No 25 36.76Yes 20 29.41
Frequency Missing = 3
PARENTS ATTEND PTA MEETINGS?
Q10 Frequency Percent___________________________________
No 37 57.81Yes 27 42.19
Frequency Missing = 7
EVER INHALED GASOLINE TO GET HIGH?
Q11a Frequency Percent_________________________________Not Used 62 98.41Used 1 1.59
Frequency Missing = 8
The frequencies have been weighted so that theanalysis reflects the distribution of students by grade
level in the district

7/30/2019 2004 _ anderson county _ elkhart isd _ 2004 texas school survey of drug and alcohol use _ elementary report
http://slidepdf.com/reader/full/2004-anderson-county-elkhart-isd-2004-texas-school-survey-of-drug-and 28/41
ElkhartSpring 2004
The FREQ Procedure
EVER INHALED PAINT THINNER TO GET HIGH?
Q11b Frequency Percent
_________________________________Not Used 59 100.00
Frequency Missing = 12
EVER INHALED GLUE TO GET HIGH?
Q11c Frequency Percent_________________________________Not Used 62 100.00
Frequency Missing = 9
EVER INHALED WHITEOUT TO GET HIGH?
Q11d Frequency Percent_________________________________Not Used 59 100.00
Frequency Missing = 12
EVER INHALED SPRAY PAINT TO GET HIGH?
Q11e Frequency Percent_________________________________Not Used 62 100.00
Frequency Missing = 9
EVER USED OTHER INHALANTS TO GET HIGH?
Q11f Frequency Percent_________________________________Not Used 60 93.75Used 4 6.25
Frequency Missing = 7
CIGARETTE USE DURING LIFETIME
Q12a Frequency Percent_______________________________________Never heard of 2 3.17Never used 55 87.301-2 times 4 6.3511+ times 2 3.17
Frequency Missing = 8
The frequencies have been weighted so that theanalysis reflects the distribution of students by grade
level in the district

7/30/2019 2004 _ anderson county _ elkhart isd _ 2004 texas school survey of drug and alcohol use _ elementary report
http://slidepdf.com/reader/full/2004-anderson-county-elkhart-isd-2004-texas-school-survey-of-drug-and 29/41
ElkhartSpring 2004
The FREQ Procedure
SNUFF/CHEWING TOBACCO USE IN LIFETIME
Q12b Frequency Percent
_______________________________________Never used 54 91.531-2 times 3 5.0811+ times 2 3.39
Frequency Missing = 12
BEER USE DURING LIFETIME
Q12c Frequency Percent_______________________________________Never heard of 1 1.64Never used 52 85.251-2 times 6 9.843-10 times 1 1.6411+ times 1 1.64
Frequency Missing = 10
WINE COOLER USE DURING LIFETIME
Q12d Frequency Percent_______________________________________Never heard of 3 4.92Never used 44 72.131-2 times 14 22.95
Frequency Missing = 10
WINE USE DURING LIFETIME
Q12e Frequency Percent_______________________________________Never used 54 90.001-2 times 6 10.00
Frequency Missing = 11
LIQUOR USE DURING LIFETIME
Q12f Frequency Percent_______________________________________Never heard of 3 5.17Never used 47 81.031-2 times 7 12.073-10 times 1 1.72
Frequency Missing = 13
The frequencies have been weighted so that theanalysis reflects the distribution of students by grade
level in the district
7/30/2019 2004 _ anderson county _ elkhart isd _ 2004 texas school survey of drug and alcohol use _ elementary report
http://slidepdf.com/reader/full/2004-anderson-county-elkhart-isd-2004-texas-school-survey-of-drug-and 30/41
ElkhartSpring 2004
The FREQ Procedure
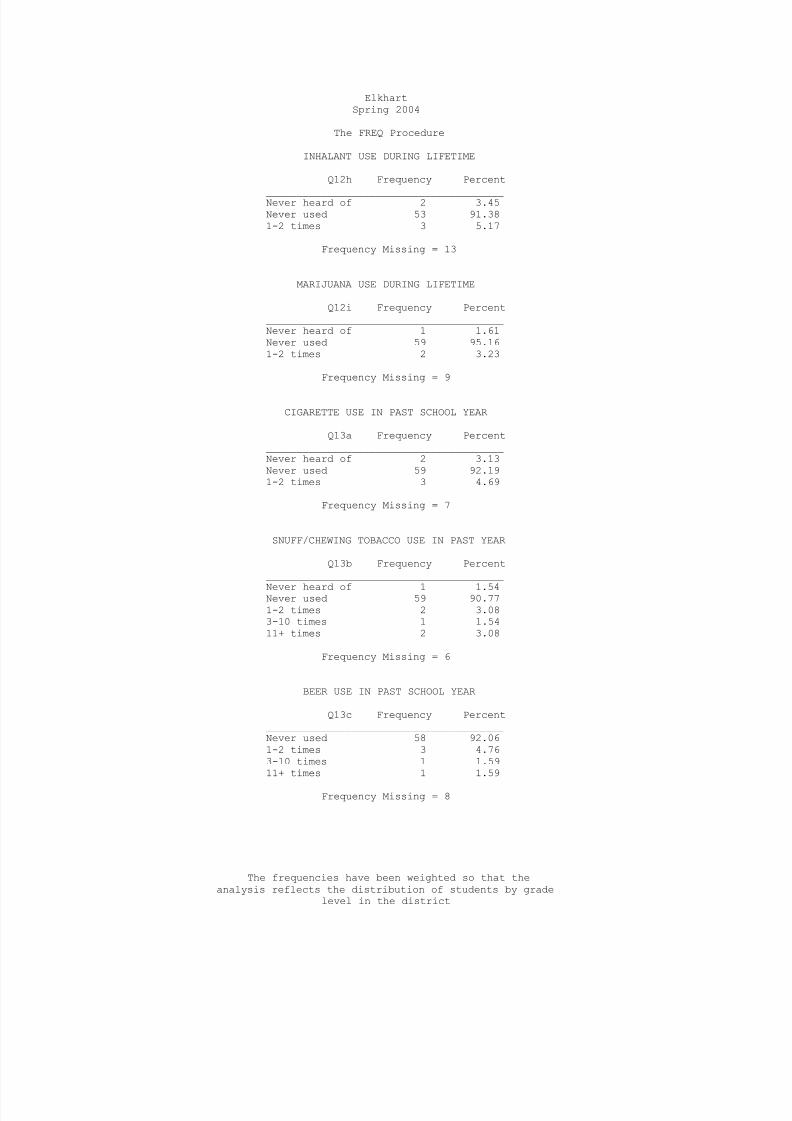
INHALANT USE DURING LIFETIME
Q12h Frequency Percent
_______________________________________Never heard of 2 3.45Never used 53 91.381-2 times 3 5.17
Frequency Missing = 13
MARIJUANA USE DURING LIFETIME
Q12i Frequency Percent_______________________________________Never heard of 1 1.61Never used 59 95.161-2 times 2 3.23
Frequency Missing = 9
CIGARETTE USE IN PAST SCHOOL YEAR
Q13a Frequency Percent_______________________________________Never heard of 2 3.13Never used 59 92.191-2 times 3 4.69
Frequency Missing = 7
SNUFF/CHEWING TOBACCO USE IN PAST YEAR
Q13b Frequency Percent_______________________________________
Never heard of 1 1.54Never used 59 90.771-2 times 2 3.083-10 times 1 1.5411+ times 2 3.08
Frequency Missing = 6
BEER USE IN PAST SCHOOL YEAR
Q13c Frequency Percent_______________________________________Never used 58 92.061-2 times 3 4.763-10 times 1 1.5911+ times 1 1.59
Frequency Missing = 8
The frequencies have been weighted so that theanalysis reflects the distribution of students by grade
level in the district

7/30/2019 2004 _ anderson county _ elkhart isd _ 2004 texas school survey of drug and alcohol use _ elementary report
http://slidepdf.com/reader/full/2004-anderson-county-elkhart-isd-2004-texas-school-survey-of-drug-and 31/41
ElkhartSpring 2004
The FREQ Procedure
WINE COOLER USE IN PAST SCHOOL YEAR
Q13d Frequency Percent
_______________________________________Never heard of 3 4.76Never used 54 85.711-2 times 5 7.943-10 times 1 1.59
Frequency Missing = 8
WINE USE IN PAST SCHOOL YEAR
Q13e Frequency Percent_______________________________________Never used 57 93.441-2 times 4 6.56
Frequency Missing = 10
LIQUOR USE IN PAST SCHOOL YEAR
Q13f Frequency Percent_______________________________________Never heard of 2 3.23Never used 55 88.711-2 times 5 8.06
Frequency Missing = 9
INHALANT USE IN PAST SCHOOL YEAR
Q13h Frequency Percent_______________________________________
Never heard of 1 1.69Never used 57 96.611-2 times 1 1.69
Frequency Missing = 12
MARIJUANA USE IN PAST SCHOOL YEAR
Q13i Frequency Percent_______________________________________Never heard of 1 1.59Never used 62 98.41
Frequency Missing = 8
The frequencies have been weighted so that theanalysis reflects the distribution of students by grade
level in the district

7/30/2019 2004 _ anderson county _ elkhart isd _ 2004 texas school survey of drug and alcohol use _ elementary report
http://slidepdf.com/reader/full/2004-anderson-county-elkhart-isd-2004-texas-school-survey-of-drug-and 32/41
ElkhartSpring 2004
The FREQ Procedure
AGE WHEN FIRST USED CIGARETTES
Q14a Frequency Percent
_________________________________________7 or younger 2 3.139 years old 1 1.56
10 years old 2 3.1311 years old 2 3.13Never heard/used 57 89.06
Frequency Missing = 7
AGE WHEN FIRST USED SNUFF/CHEW TOBACCO
Q14b Frequency Percent_________________________________________7 or younger 1 1.548 years old 1 1.54
10 years old 2 3.08
11 years old 2 3.08Never heard/used 59 90.77
Frequency Missing = 6
AGE WHEN FIRST USED BEER
Q14c Frequency Percent_________________________________________7 or younger 3 4.848 years old 2 3.23
10 years old 3 4.8411 years old 1 1.6112 or older 1 1.61Never heard/used 52 83.87
Frequency Missing = 9
AGE WHEN FIRST USED WINE COOLERS
Q14d Frequency Percent_________________________________________7 or younger 1 1.618 years old 1 1.619 years old 1 1.61
10 years old 2 3.2311 years old 4 6.4512 or older 5 8.06Never heard/used 48 77.42
Frequency Missing = 9
The frequencies have been weighted so that theanalysis reflects the distribution of students by grade
level in the district
7/30/2019 2004 _ anderson county _ elkhart isd _ 2004 texas school survey of drug and alcohol use _ elementary report
http://slidepdf.com/reader/full/2004-anderson-county-elkhart-isd-2004-texas-school-survey-of-drug-and 33/41
ElkhartSpring 2004
The FREQ Procedure
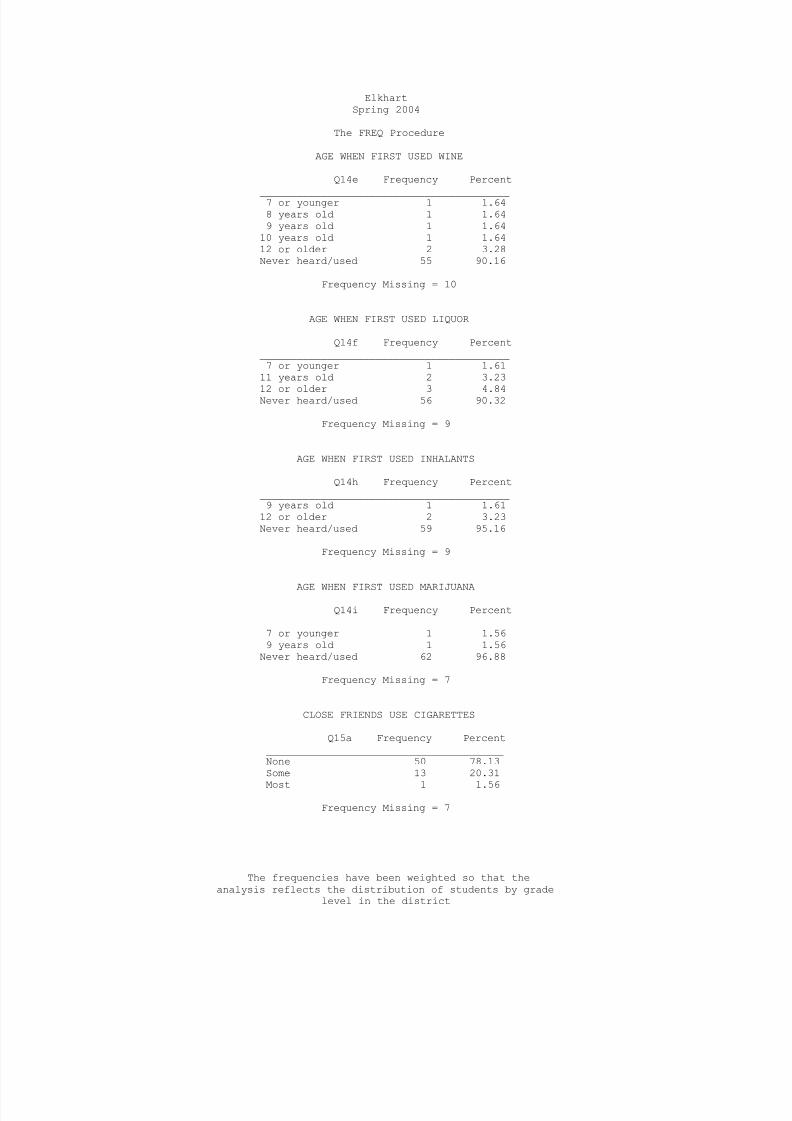
AGE WHEN FIRST USED WINE
Q14e Frequency Percent
_________________________________________7 or younger 1 1.648 years old 1 1.649 years old 1 1.64
10 years old 1 1.6412 or older 2 3.28Never heard/used 55 90.16
Frequency Missing = 10
AGE WHEN FIRST USED LIQUOR
Q14f Frequency Percent_________________________________________7 or younger 1 1.61
11 years old 2 3.23
12 or older 3 4.84Never heard/used 56 90.32
Frequency Missing = 9
AGE WHEN FIRST USED INHALANTS
Q14h Frequency Percent_________________________________________9 years old 1 1.61
12 or older 2 3.23Never heard/used 59 95.16
Frequency Missing = 9
AGE WHEN FIRST USED MARIJUANA
Q14i Frequency Percent_________________________________________7 or younger 1 1.569 years old 1 1.56
Never heard/used 62 96.88
Frequency Missing = 7
CLOSE FRIENDS USE CIGARETTES
Q15a Frequency Percent_______________________________________None 50 78.13Some 13 20.31
Most 1 1.56
Frequency Missing = 7
The frequencies have been weighted so that theanalysis reflects the distribution of students by grade
level in the district
7/30/2019 2004 _ anderson county _ elkhart isd _ 2004 texas school survey of drug and alcohol use _ elementary report
http://slidepdf.com/reader/full/2004-anderson-county-elkhart-isd-2004-texas-school-survey-of-drug-and 34/41
ElkhartSpring 2004
The FREQ Procedure
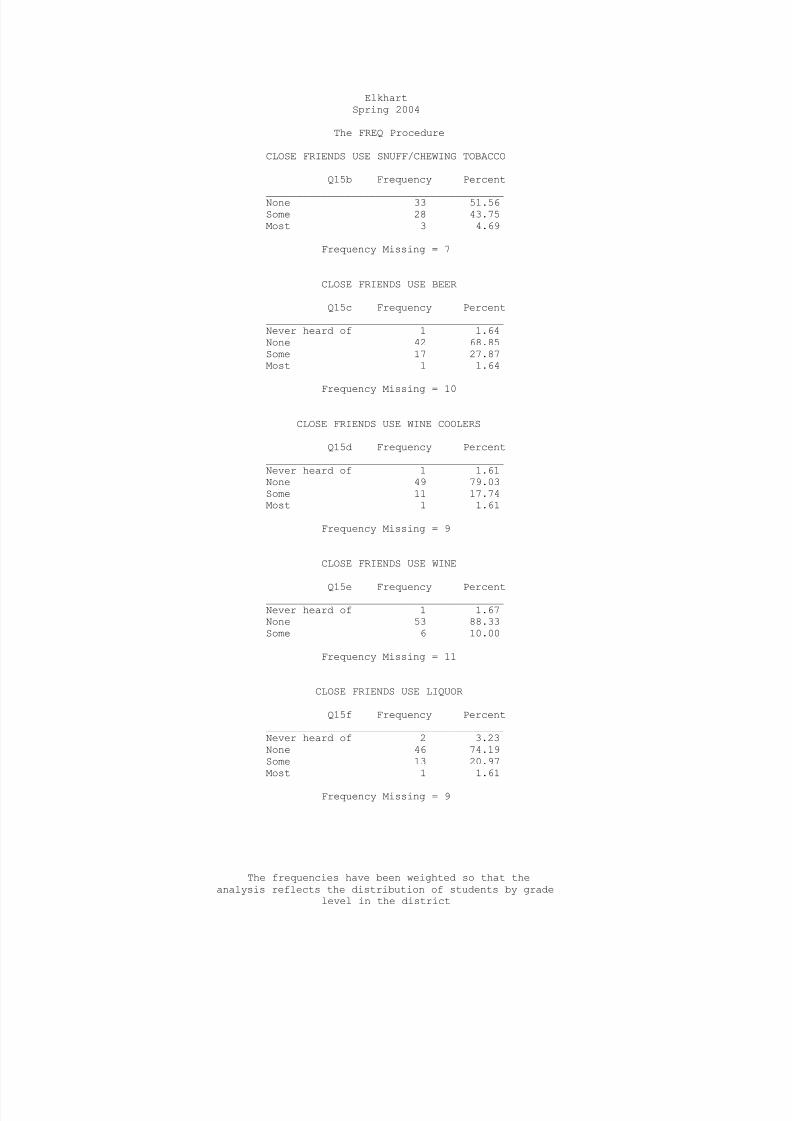
CLOSE FRIENDS USE SNUFF/CHEWING TOBACCO
Q15b Frequency Percent
_______________________________________None 33 51.56Some 28 43.75Most 3 4.69
Frequency Missing = 7
CLOSE FRIENDS USE BEER
Q15c Frequency Percent_______________________________________Never heard of 1 1.64None 42 68.85Some 17 27.87Most 1 1.64
Frequency Missing = 10
CLOSE FRIENDS USE WINE COOLERS
Q15d Frequency Percent_______________________________________Never heard of 1 1.61None 49 79.03Some 11 17.74Most 1 1.61
Frequency Missing = 9
CLOSE FRIENDS USE WINE
Q15e Frequency Percent_______________________________________Never heard of 1 1.67None 53 88.33Some 6 10.00
Frequency Missing = 11
CLOSE FRIENDS USE LIQUOR
Q15f Frequency Percent_______________________________________Never heard of 2 3.23None 46 74.19Some 13 20.97Most 1 1.61
Frequency Missing = 9
The frequencies have been weighted so that theanalysis reflects the distribution of students by grade
level in the district
7/30/2019 2004 _ anderson county _ elkhart isd _ 2004 texas school survey of drug and alcohol use _ elementary report
http://slidepdf.com/reader/full/2004-anderson-county-elkhart-isd-2004-texas-school-survey-of-drug-and 35/41
ElkhartSpring 2004
The FREQ Procedure
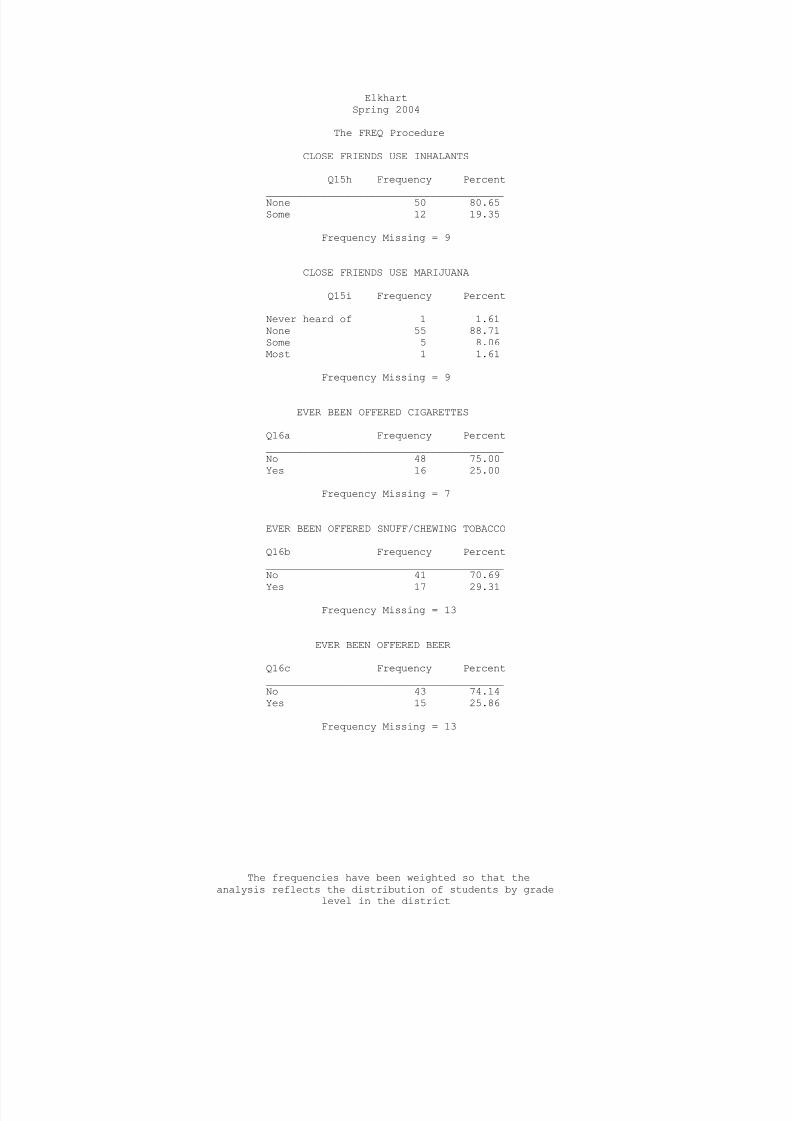
CLOSE FRIENDS USE INHALANTS
Q15h Frequency Percent
_______________________________________None 50 80.65Some 12 19.35
Frequency Missing = 9
CLOSE FRIENDS USE MARIJUANA
Q15i Frequency Percent_______________________________________Never heard of 1 1.61None 55 88.71Some 5 8.06Most 1 1.61
Frequency Missing = 9
EVER BEEN OFFERED CIGARETTES
Q16a Frequency Percent_______________________________________No 48 75.00Yes 16 25.00
Frequency Missing = 7
EVER BEEN OFFERED SNUFF/CHEWING TOBACCO
Q16b Frequency Percent_______________________________________No 41 70.69
Yes 17 29.31
Frequency Missing = 13
EVER BEEN OFFERED BEER
Q16c Frequency Percent_______________________________________No 43 74.14Yes 15 25.86
Frequency Missing = 13
The frequencies have been weighted so that theanalysis reflects the distribution of students by grade
level in the district

7/30/2019 2004 _ anderson county _ elkhart isd _ 2004 texas school survey of drug and alcohol use _ elementary report
http://slidepdf.com/reader/full/2004-anderson-county-elkhart-isd-2004-texas-school-survey-of-drug-and 36/41
ElkhartSpring 2004
The FREQ Procedure
EVER BEEN OFFERED WINE COOLERS
Q16d Frequency Percent
_______________________________________Never heard of 1 1.92No 43 82.69Yes 8 15.38
Frequency Missing = 19
EVER BEEN OFFERED WINE
Q16e Frequency Percent_______________________________________No 50 89.29Yes 6 10.71
Frequency Missing = 15
EVER BEEN OFFERED LIQUOR
Q16f Frequency Percent_______________________________________Never heard of 1 1.67No 50 83.33Yes 9 15.00
Frequency Missing = 11
EVER BEEN OFFERED INHALANTS
Q16h Frequency Percent_______________________________________Never heard of 1 1.75
No 50 87.72Yes 6 10.53
Frequency Missing = 14
EVER BEEN OFFERED MARIJUANA
Q16i Frequency Percent_______________________________________Never heard of 1 1.72No 54 93.10Yes 3 5.17
Frequency Missing = 13
The frequencies have been weighted so that theanalysis reflects the distribution of students by grade
level in the district
7/30/2019 2004 _ anderson county _ elkhart isd _ 2004 texas school survey of drug and alcohol use _ elementary report
http://slidepdf.com/reader/full/2004-anderson-county-elkhart-isd-2004-texas-school-survey-of-drug-and 37/41
ElkhartSpring 2004
The FREQ Procedure
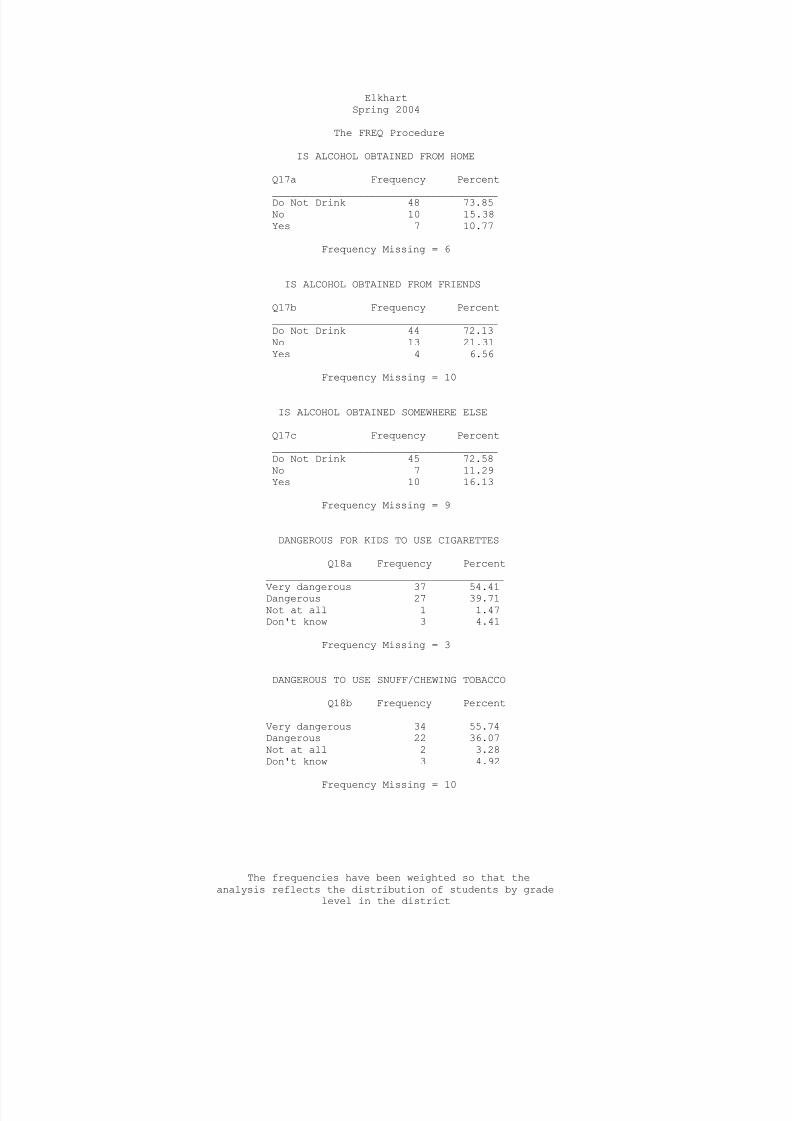
IS ALCOHOL OBTAINED FROM HOME
Q17a Frequency Percent
_____________________________________Do Not Drink 48 73.85No 10 15.38Yes 7 10.77
Frequency Missing = 6
IS ALCOHOL OBTAINED FROM FRIENDS
Q17b Frequency Percent_____________________________________Do Not Drink 44 72.13No 13 21.31Yes 4 6.56
Frequency Missing = 10
IS ALCOHOL OBTAINED SOMEWHERE ELSE
Q17c Frequency Percent_____________________________________Do Not Drink 45 72.58No 7 11.29Yes 10 16.13
Frequency Missing = 9
DANGEROUS FOR KIDS TO USE CIGARETTES
Q18a Frequency Percent_______________________________________
Very dangerous 37 54.41Dangerous 27 39.71Not at all 1 1.47Don't know 3 4.41
Frequency Missing = 3
DANGEROUS TO USE SNUFF/CHEWING TOBACCO
Q18b Frequency Percent_______________________________________Very dangerous 34 55.74Dangerous 22 36.07Not at all 2 3.28Don't know 3 4.92
Frequency Missing = 10
The frequencies have been weighted so that theanalysis reflects the distribution of students by grade
level in the district

7/30/2019 2004 _ anderson county _ elkhart isd _ 2004 texas school survey of drug and alcohol use _ elementary report
http://slidepdf.com/reader/full/2004-anderson-county-elkhart-isd-2004-texas-school-survey-of-drug-and 38/41
ElkhartSpring 2004
The FREQ Procedure
DANGEROUS FOR KIDS TO USE BEER
Q18c Frequency Percent
_______________________________________Very dangerous 34 53.13Dangerous 23 35.94Not at all 3 4.69Don't know 4 6.25
Frequency Missing = 7
DANGEROUS FOR KIDS TO USE WINE COOLERS
Q18d Frequency Percent_______________________________________Very dangerous 24 38.10Dangerous 23 36.51Not at all 6 9.52Don't know 8 12.70
Never heard of 2 3.17
Frequency Missing = 8
DANGEROUS FOR KIDS TO USE WINE
Q18e Frequency Percent_______________________________________Very dangerous 22 35.48Dangerous 28 45.16Not at all 3 4.84Don't know 9 14.52
Frequency Missing = 9
DANGEROUS FOR KIDS TO USE LIQUOR
Q18f Frequency Percent_______________________________________Very dangerous 38 59.38Dangerous 21 32.81Don't know 4 6.25Never heard of 1 1.56
Frequency Missing = 7
DANGEROUS FOR KIDS TO USE INHALANTS
Q18h Frequency Percent_______________________________________Very dangerous 40 68.97
Dangerous 15 25.86Not at all 1 1.72Don't know 2 3.45
Frequency Missing = 13
The frequencies have been weighted so that theanalysis reflects the distribution of students by grade
level in the district
7/30/2019 2004 _ anderson county _ elkhart isd _ 2004 texas school survey of drug and alcohol use _ elementary report
http://slidepdf.com/reader/full/2004-anderson-county-elkhart-isd-2004-texas-school-survey-of-drug-and 39/41
ElkhartSpring 2004
The FREQ Procedure
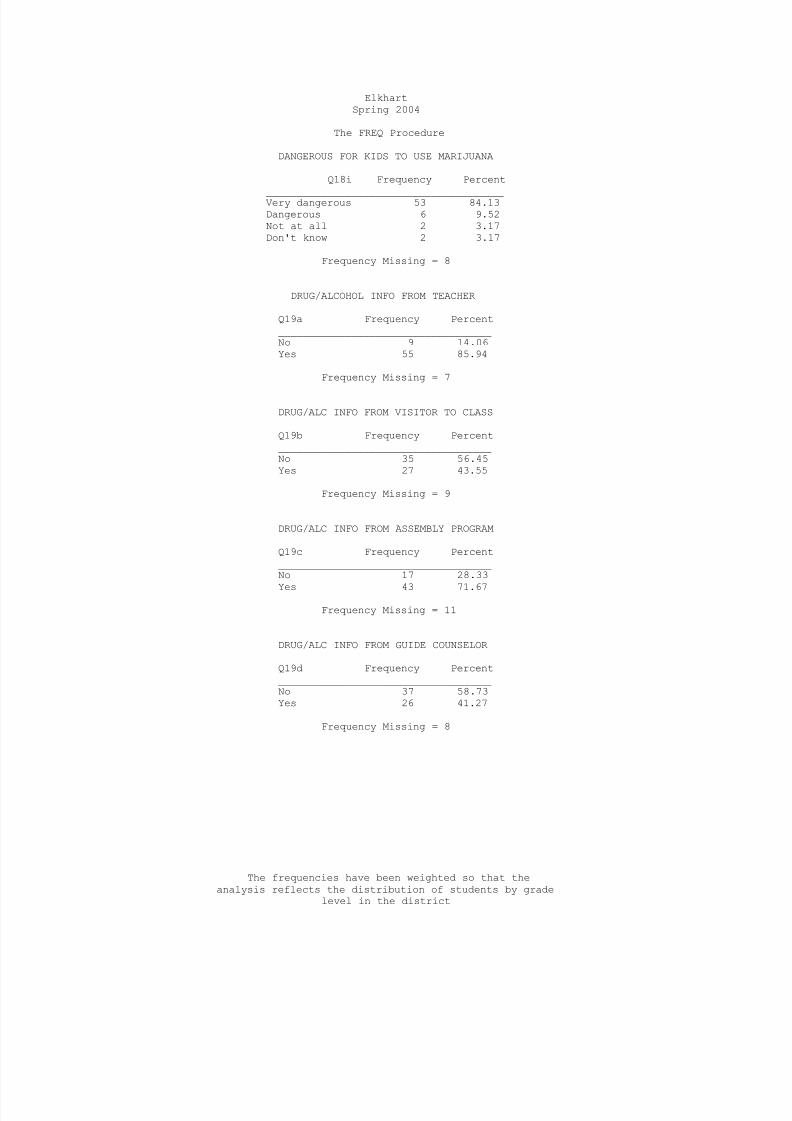
DANGEROUS FOR KIDS TO USE MARIJUANA
Q18i Frequency Percent
_______________________________________Very dangerous 53 84.13Dangerous 6 9.52Not at all 2 3.17Don't know 2 3.17
Frequency Missing = 8
DRUG/ALCOHOL INFO FROM TEACHER
Q19a Frequency Percent___________________________________No 9 14.06Yes 55 85.94
Frequency Missing = 7
DRUG/ALC INFO FROM VISITOR TO CLASS
Q19b Frequency Percent___________________________________No 35 56.45Yes 27 43.55
Frequency Missing = 9
DRUG/ALC INFO FROM ASSEMBLY PROGRAM
Q19c Frequency Percent___________________________________No 17 28.33
Yes 43 71.67
Frequency Missing = 11
DRUG/ALC INFO FROM GUIDE COUNSELOR
Q19d Frequency Percent___________________________________No 37 58.73Yes 26 41.27
Frequency Missing = 8
The frequencies have been weighted so that theanalysis reflects the distribution of students by grade
level in the district
7/30/2019 2004 _ anderson county _ elkhart isd _ 2004 texas school survey of drug and alcohol use _ elementary report
http://slidepdf.com/reader/full/2004-anderson-county-elkhart-isd-2004-texas-school-survey-of-drug-and 40/41
ElkhartSpring 2004
The FREQ Procedure
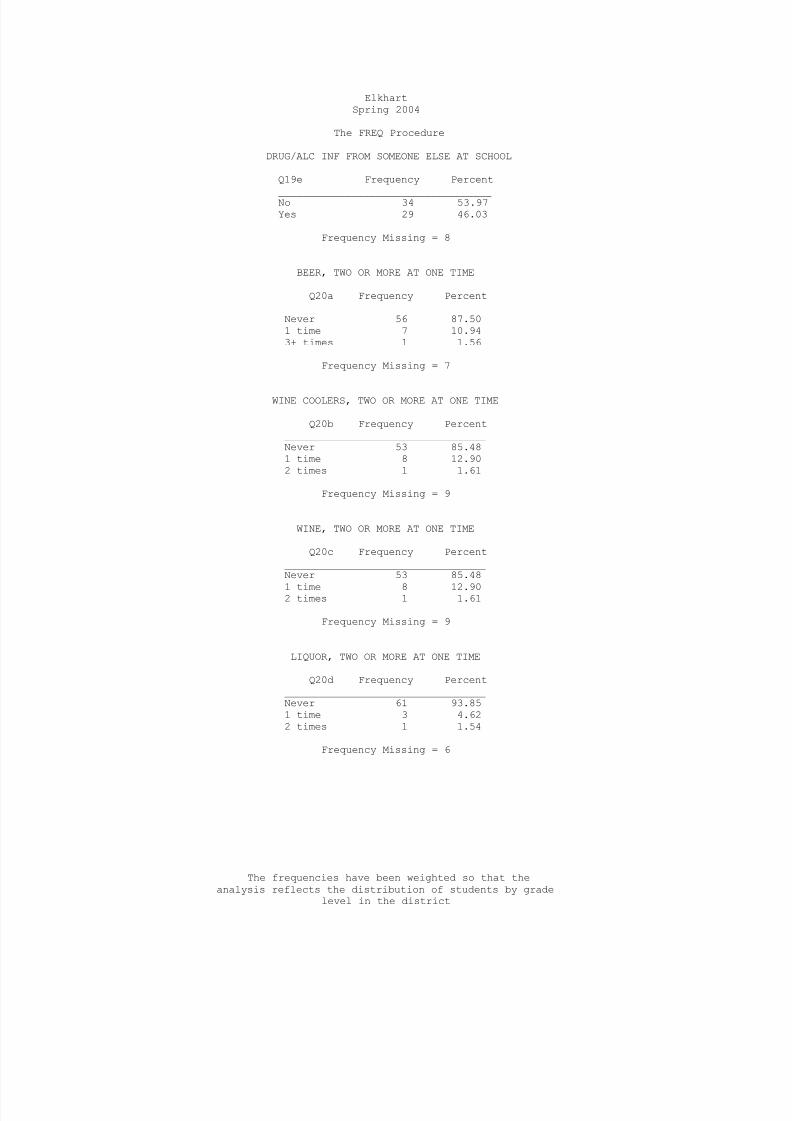
DRUG/ALC INF FROM SOMEONE ELSE AT SCHOOL
Q19e Frequency Percent
___________________________________No 34 53.97Yes 29 46.03
Frequency Missing = 8
BEER, TWO OR MORE AT ONE TIME
Q20a Frequency Percent_________________________________Never 56 87.501 time 7 10.943+ times 1 1.56
Frequency Missing = 7
WINE COOLERS, TWO OR MORE AT ONE TIME
Q20b Frequency Percent_________________________________Never 53 85.481 time 8 12.902 times 1 1.61
Frequency Missing = 9
WINE, TWO OR MORE AT ONE TIME
Q20c Frequency Percent_________________________________Never 53 85.48
1 time 8 12.902 times 1 1.61
Frequency Missing = 9
LIQUOR, TWO OR MORE AT ONE TIME
Q20d Frequency Percent_________________________________Never 61 93.851 time 3 4.622 times 1 1.54
Frequency Missing = 6
The frequencies have been weighted so that theanalysis reflects the distribution of students by grade
level in the district

7/30/2019 2004 _ anderson county _ elkhart isd _ 2004 texas school survey of drug and alcohol use _ elementary report
http://slidepdf.com/reader/full/2004-anderson-county-elkhart-isd-2004-texas-school-survey-of-drug-and 41/41
ElkhartSpring 2004
The FREQ Procedure
MISSED SCHOOL WITHOUT PARENT'S CONSENT
Q21 Frequency Percent
___________________________________No 69 100.00
Frequency Missing = 2
SENT TO PRINCIPAL/DEAN SINCE SEPTEMBER
Q22 Frequency Percent___________________________________No 47 68.12Yes 22 31.88
Frequency Missing = 2
PARENTS FEEL ABOUT KIDS DRINKING BEER
Q23 Frequency Percent________________________________________Don't like it 58 82.86Don't care 1 1.43Don't know 11 15.71
Frequency Missing = 1
PARENTS FEEL ABOUT KIDS USING MARIJUANA
Q24 Frequency Percent________________________________________Don't like it 62 89.86Don't care 1 1.45Don't know 6 8.70
Frequency Missing = 2
The frequencies have been weighted so that theanalysis reflects the distribution of students by grade
Related Documents