2003 Financial Report ® ™ McDonald’s Corporation

Welcome message from author
This document is posted to help you gain knowledge. Please leave a comment to let me know what you think about it! Share it to your friends and learn new things together.
Transcript

2003 Financial Report
®
™
McDonald’s Corporation

McDONALD’S ANNUAL REPORT ON FORM 10-K
Shareholders may obtain a copy of theCompany’s 2003 Annual Report to theSecurities and Exchange Commission(SEC) on Form 10-K by going to theinvestor section of McDonald’s website at www.mcdonalds.com, by going to the SEC’s website at www.sec.gov or by calling us at 1-630-623-7428. Thisinformation is also available at no charge by sending a request to theCompany’s Investor Relations ServiceCenter, Department 300, Kroc Drive, Oak Brook, Illinois 60523.
HOME OFFICE
McDonald’s Corporation McDonald’s Plaza Oak Brook IL 60523 1-630-623-3000 www.mcdonalds.com
The following trademarks used herein are property of McDonald’s Corporation and its affiliates: Boston Market; i’m lovin’ it; Made For you: McDonald’s;McGriddles; mcdonalds.com.
Printed on recycled paper with10% post-consumer content.© 2004 McDonald’s CorporationMcD 03-4286
CONTENTS
1 11-year summary
2 Management’s discussion and analysis
17 Consolidated statement of income
18 Consolidated balance sheet
19 Consolidated statement of cash flows
20 Consolidated statement of shareholders’ equity
21 Notes to consolidated financial statements
32 Quarterly results (unaudited)
33 Management’s report
33 Report of independent auditors
McDonald’s Corporation 1
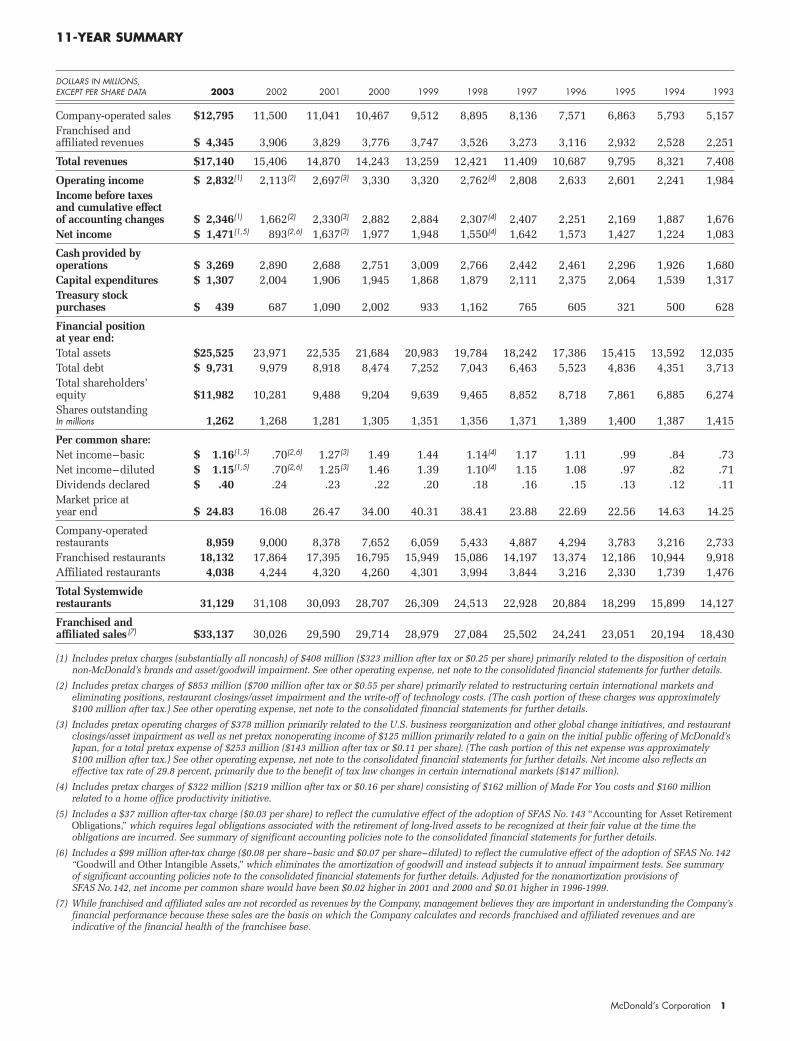
11-YEAR SUMMARY
DOLLARS IN MILLIONS, EXCEPT PER SHARE DATA 2003 2002 2001 2000 1999 1998 1997 1996 1995 1994 1993
Company-operated sales $12,795 11,500 11,041 10,467 9,512 8,895 8,136 7,571 6,863 5,793 5,157Franchised and affiliated revenues $ 4,345 3,906 3,829 3,776 3,747 3,526 3,273 3,116 2,932 2,528 2,251
Total revenues $17,140 15,406 14,870 14,243 13,259 12,421 11,409 10,687 9,795 8,321 7,408
Operating income $ 2,832(1) 2,113(2) 2,697(3) 3,330 3,320 2,762(4) 2,808 2,633 2,601 2,241 1,984Income before taxes and cumulative effect of accounting changes $ 2,346(1) 1,662(2) 2,330(3) 2,882 2,884 2,307(4) 2,407 2,251 2,169 1,887 1,676Net income $ 1,471(1,5) 893(2,6) 1,637(3) 1,977 1,948 1,550(4) 1,642 1,573 1,427 1,224 1,083
Cash provided by operations $ 3,269 2,890 2,688 2,751 3,009 2,766 2,442 2,461 2,296 1,926 1,680Capital expenditures $ 1,307 2,004 1,906 1,945 1,868 1,879 2,111 2,375 2,064 1,539 1,317Treasury stock purchases $ 439 687 1,090 2,002 933 1,162 765 605 321 500 628
Financial position at year end:Total assets $25,525 23,971 22,535 21,684 20,983 19,784 18,242 17,386 15,415 13,592 12,035Total debt $ 9,731 9,979 8,918 8,474 7,252 7,043 6,463 5,523 4,836 4,351 3,713Total shareholders’ equity $11,982 10,281 9,488 9,204 9,639 9,465 8,852 8,718 7,861 6,885 6,274Shares outstandingIn millions 1,262 1,268 1,281 1,305 1,351 1,356 1,371 1,389 1,400 1,387 1,415
Per common share: Net income–basic $ 1.16(1,5) .70(2,6) 1.27(3) 1.49 1.44 1.14(4) 1.17 1.11 .99 .84 .73Net income–diluted $ 1.15(1,5) .70(2,6) 1.25(3) 1.46 1.39 1.10(4) 1.15 1.08 .97 .82 .71Dividends declared $ .40 .24 .23 .22 .20 .18 .16 .15 .13 .12 .11Market price at year end $ 24.83 16.08 26.47 34.00 40.31 38.41 23.88 22.69 22.56 14.63 14.25
Company-operatedrestaurants 8,959 9,000 8,378 7,652 6,059 5,433 4,887 4,294 3,783 3,216 2,733Franchised restaurants 18,132 17,864 17,395 16,795 15,949 15,086 14,197 13,374 12,186 10,944 9,918Affiliated restaurants 4,038 4,244 4,320 4,260 4,301 3,994 3,844 3,216 2,330 1,739 1,476
Total Systemwide restaurants 31,129 31,108 30,093 28,707 26,309 24,513 22,928 20,884 18,299 15,899 14,127
Franchised and affiliated sales (7) $33,137 30,026 29,590 29,714 28,979 27,084 25,502 24,241 23,051 20,194 18,430
(1) Includes pretax charges (substantially all noncash) of $408 million ($323 million after tax or $0.25 per share) primarily related to the disposition of certainnon-McDonald’s brands and asset/goodwill impairment. See other operating expense, net note to the consolidated financial statements for further details.
(2) Includes pretax charges of $853 million ($700 million after tax or $0.55 per share) primarily related to restructuring certain international markets andeliminating positions, restaurant closings/asset impairment and the write-off of technology costs. (The cash portion of these charges was approximately$100 million after tax.) See other operating expense, net note to the consolidated financial statements for further details.
(3) Includes pretax operating charges of $378 million primarily related to the U.S. business reorganization and other global change initiatives, and restaurantclosings/asset impairment as well as net pretax nonoperating income of $125 million primarily related to a gain on the initial public offering of McDonald’sJapan, for a total pretax expense of $253 million ($143 million after tax or $0.11 per share). (The cash portion of this net expense was approximately $100 million after tax.) See other operating expense, net note to the consolidated financial statements for further details. Net income also reflects an effective tax rate of 29.8 percent, primarily due to the benefit of tax law changes in certain international markets ($147 million).
(4) Includes pretax charges of $322 million ($219 million after tax or $0.16 per share) consisting of $162 million of Made For You costs and $160 millionrelated to a home office productivity initiative.
(5) Includes a $37 million after-tax charge ($0.03 per share) to reflect the cumulative effect of the adoption of SFAS No. 143 “Accounting for Asset RetirementObligations,” which requires legal obligations associated with the retirement of long-lived assets to be recognized at their fair value at the time the obligations are incurred. See summary of significant accounting policies note to the consolidated financial statements for further details.
(6) Includes a $99 million after-tax charge ($0.08 per share–basic and $0.07 per share–diluted) to reflect the cumulative effect of the adoption of SFAS No.142“Goodwill and Other Intangible Assets,” which eliminates the amortization of goodwill and instead subjects it to annual impairment tests. See summaryof significant accounting policies note to the consolidated financial statements for further details. Adjusted for the nonamortization provisions of SFAS No.142, net income per common share would have been $0.02 higher in 2001 and 2000 and $0.01 higher in 1996-1999.
(7) While franchised and affiliated sales are not recorded as revenues by the Company, management believes they are important in understanding the Company’sfinancial performance because these sales are the basis on which the Company calculates and records franchised and affiliated revenues and are indicative of the financial health of the franchisee base.
2 McDonald’s Corporation
MANAGEMENT’S DISCUSSION AND ANALYSIS OF FINANCIAL CONDITION AND RESULTS OF OPERATIONS
OVERVIEW
DESCRIPTION OF THE BUSINESSThe Company primarily operates and franchises McDonald’srestaurants. In addition, the Company operates certain non-McDonald’s brands that are not material to the Company’soverall results. Of the more than 30,000 McDonald’s restau-rants in over 100 countries, more than 8,000 are operated by the Company, approximately 18,000 are operated byfranchisees and about 4,000 are operated by affiliates underlicense agreements. Regardless of who operates the restau-rant, the Company generally owns the land and building orsecures long-term leases for restaurant sites. This ensureslong-term occupancy rights and helps control related costs.
Revenues consist of sales by Company-operated restau-rants and fees from restaurants operated by franchisees and affiliates. These fees primarily include rent, service feesand/or royalties that are based on a percent of sales, withspecified minimum rent payments. Fees vary by type ofsite, investment by the Company and local business condi-tions. These fees, along with occupancy and operatingrights, are stipulated in franchise agreements that generallyhave 20-year terms.
We manage the business based on geographic segments:United States; Europe; Asia/Pacific, the Middle East andAfrica (APMEA); Latin America and Canada. In addition,throughout this report we present a segment entitled “Other”that includes non-McDonald’s brands. The U.S. and Europesegments account for approximately 70% of total revenues.France, Germany and the United Kingdom account forabout 65% of Europe’s revenues; Australia, China and Japan(a 50%-owned affiliate accounted for under the equitymethod) account for about 45% of APMEA’s revenues; andBrazil accounts for about 40% of Latin America’s revenues.These seven markets along with the U.S. and Canada arereferred to as “major markets” throughout this report andcomprise approximately 70% of total revenues.
In analyzing business trends, management considers avariety of performance and financial measures includingSystemwide sales growth, comparable sales growth andCompany-operated margins. Systemwide sales include salesby all restaurants, whether operated by the Company, byfranchisees or by affiliates. While sales by franchisees andaffiliates are not recorded as revenues by the Company,management believes the information is important inunderstanding the Company’s financial performance becausethey are the basis on which the Company calculates andrecords franchised and affiliated revenues and are indicativeof the financial health of our franchisee base. Comparablesales are a key performance indicator used within the retailindustry and are indicative of acceptance of the Company’sinitiatives as well as local economic and consumer trends.Increases or decreases in comparable sales represent thepercent change in constant currency sales from the same
period in the prior year for all Systemwide restaurants inoperation at least thirteen months. Constant currencyresults exclude the effects of foreign currency translationand are calculated by translating current year results atprior year average exchange rates. Management reviews and analyzes business results in constant currencies andbases certain compensation plans on these results becausethe Company believes they better represent the underlyingbusiness trends.
STRATEGIC DIRECTION AND 2003 FINANCIAL PERFORMANCEIn 2001 and 2002, the Company’s results reflected a focuson growth through adding new restaurants, with associatedhigh levels of capital expenditures and increasing levels of debt financing. This strategy, combined with challengingeconomic conditions and increased competition in certainkey markets, adversely affected results and returns oninvestment.
In 2003, the Company introduced a comprehensive revitalization plan to increase McDonald’s relevance totoday’s consumers as well as improve our financial disci-pline. We redefined our strategy to emphasize growththrough adding more customers to existing restaurants. In line with this, we took a more disciplined approach tocapital allocation and put a greater emphasis on controllingexpenses. We aligned the System around our customer-focused Plan to Win, designed to deliver operational excel-lence and leadership marketing. This Plan contains aggres-sive goals and measures for success based on the five driversof exceptional customer experiences—people, products,place, price and promotion.
Our near-term goal was to fortify the foundation of ourbusiness. Our long-term goal is to create a differentiatedcustomer experience —one that builds brand loyalty —andenables us to deliver attractive top- and bottom-line growthand returns on a sustained basis. For 2005 and beyond,McDonald’s is targeting annual Systemwide sales and rev-enue growth of 3 percent to 5 percent, annual operatingincome growth of 6 percent to 7 percent and annual returnson incremental invested capital in the high teens. (Returnon incremental invested capital is the change in operatingincome plus depreciation divided by the change in grossassets.) These targets exclude the impact of foreign currencytranslation.
We made significant progress in 2003 in operationalexcellence and leadership marketing. We improved our coremenu and added several successful new products. We usedmore consistent, rigorous measurements such as evaluationsby Company personnel, independent mystery shoppers and customer research to evaluate restaurant performance.Using this information, along with enhanced training andother processes, we have strengthened our operations. We have expanded our everyday value offerings, attractingmore customer visits. We began to create more relevant
McDonald’s Corporation 3
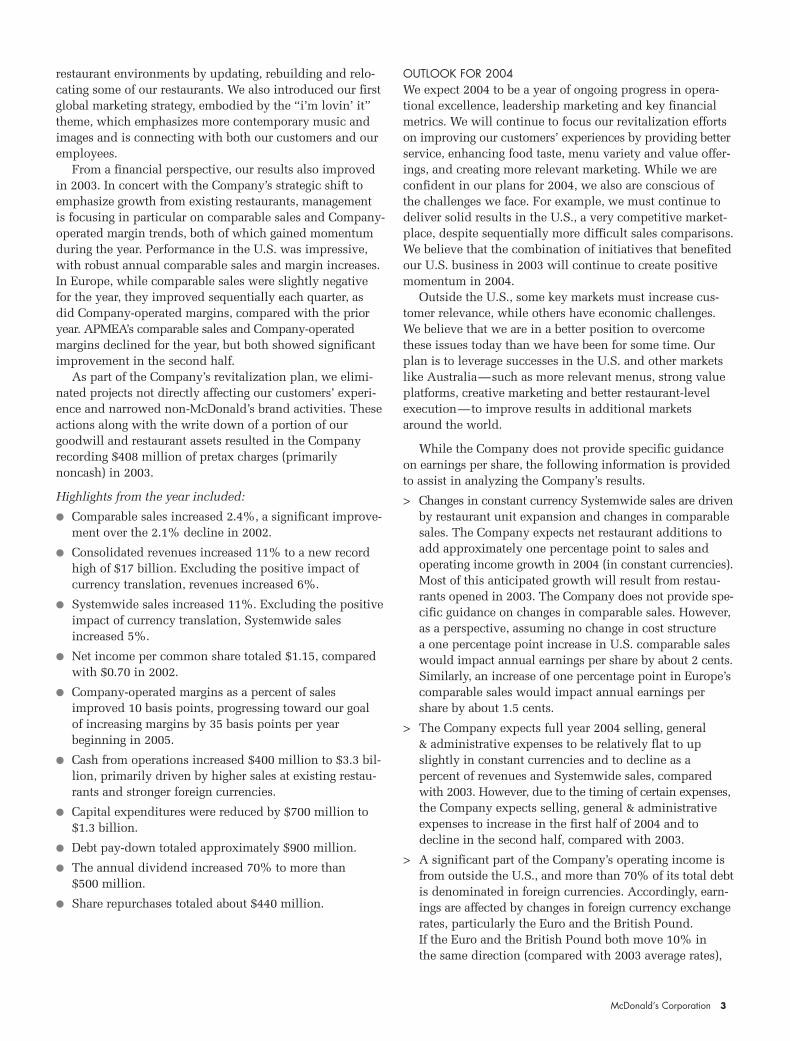
restaurant environments by updating, rebuilding and relo-cating some of our restaurants. We also introduced our firstglobal marketing strategy, embodied by the “i’m lovin’ it”theme, which emphasizes more contemporary music andimages and is connecting with both our customers and ouremployees.
From a financial perspective, our results also improvedin 2003. In concert with the Company’s strategic shift toemphasize growth from existing restaurants, management is focusing in particular on comparable sales and Company-operated margin trends, both of which gained momentumduring the year. Performance in the U.S. was impressive,with robust annual comparable sales and margin increases.In Europe, while comparable sales were slightly negative for the year, they improved sequentially each quarter, as did Company-operated margins, compared with the prioryear. APMEA’s comparable sales and Company-operated margins declined for the year, but both showed significantimprovement in the second half.
As part of the Company’s revitalization plan, we elimi-nated projects not directly affecting our customers’ experi-ence and narrowed non-McDonald’s brand activities. Theseactions along with the write down of a portion of our goodwill and restaurant assets resulted in the Companyrecording $408 million of pretax charges (primarily noncash) in 2003.
Highlights from the year included:
� Comparable sales increased 2.4%, a significant improve-ment over the 2.1% decline in 2002.
� Consolidated revenues increased 11% to a new recordhigh of $17 billion. Excluding the positive impact of currency translation, revenues increased 6%.
� Systemwide sales increased 11%. Excluding the positiveimpact of currency translation, Systemwide salesincreased 5%.
� Net income per common share totaled $1.15, comparedwith $0.70 in 2002.
� Company-operated margins as a percent of salesimproved 10 basis points, progressing toward our goal of increasing margins by 35 basis points per year beginning in 2005.
� Cash from operations increased $400 million to $3.3 bil-lion, primarily driven by higher sales at existing restau-rants and stronger foreign currencies.
� Capital expenditures were reduced by $700 million to$1.3 billion.
� Debt pay-down totaled approximately $900 million.
� The annual dividend increased 70% to more than $500 million.
� Share repurchases totaled about $440 million.
OUTLOOK FOR 2004We expect 2004 to be a year of ongoing progress in opera-tional excellence, leadership marketing and key financialmetrics. We will continue to focus our revitalization effortson improving our customers’ experiences by providing betterservice, enhancing food taste, menu variety and value offer-ings, and creating more relevant marketing. While we areconfident in our plans for 2004, we also are conscious ofthe challenges we face. For example, we must continue todeliver solid results in the U.S., a very competitive market-place, despite sequentially more difficult sales comparisons.We believe that the combination of initiatives that benefitedour U.S. business in 2003 will continue to create positivemomentum in 2004.
Outside the U.S., some key markets must increase cus-tomer relevance, while others have economic challenges.We believe that we are in a better position to overcomethese issues today than we have been for some time. Ourplan is to leverage successes in the U.S. and other marketslike Australia—such as more relevant menus, strong valueplatforms, creative marketing and better restaurant-levelexecution—to improve results in additional marketsaround the world.
While the Company does not provide specific guidanceon earnings per share, the following information is providedto assist in analyzing the Company’s results.
> Changes in constant currency Systemwide sales are drivenby restaurant unit expansion and changes in comparablesales. The Company expects net restaurant additions toadd approximately one percentage point to sales andoperating income growth in 2004 (in constant currencies).Most of this anticipated growth will result from restau-rants opened in 2003. The Company does not provide spe-cific guidance on changes in comparable sales. However,as a perspective, assuming no change in cost structure a one percentage point increase in U.S. comparable saleswould impact annual earnings per share by about 2 cents.Similarly, an increase of one percentage point in Europe’scomparable sales would impact annual earnings pershare by about 1.5 cents.
> The Company expects full year 2004 selling, general & administrative expenses to be relatively flat to upslightly in constant currencies and to decline as a percent of revenues and Systemwide sales, comparedwith 2003. However, due to the timing of certain expenses,the Company expects selling, general & administrativeexpenses to increase in the first half of 2004 and todecline in the second half, compared with 2003.
> A significant part of the Company’s operating income isfrom outside the U.S., and more than 70% of its total debtis denominated in foreign currencies. Accordingly, earn-ings are affected by changes in foreign currency exchangerates, particularly the Euro and the British Pound. If the Euro and the British Pound both move 10% in the same direction (compared with 2003 average rates),

4 McDonald’s Corporation
the Company's annual earnings per share would changeby about 5 cents to 6 cents. In 2003, foreign currencytranslation benefited earnings per share by 7 cents.
> For 2004, the Company expects its net debt principalrepayments to be approximately $400 million to $700 mil-lion. However, despite lower average debt balances, theCompany expects interest expense to be relatively flatcompared with 2003 due to stronger foreign currencies.
> The Company expects the effective income tax rate for 2004 to be between 32.5% and 33.5%.
STRATEGIC ACTIONSIn 2003, the Company eliminated projects not directly impact-ing its customers’ experience, narrowed its non-McDonald’sbrand activities, aligned its System around a single actionplan (Plan to Win), and reestablished McDonald’s marketingleadership through the introduction of its first ever globalbrand strategy embodied by the “i’m lovin’ it” theme. Theseactions were consistent with management's strategy of concentrating the Company’s capital and resources on thebest near-term opportunities and avoiding those that distractfrom restaurant-level execution.
In 2002, the Company initiated actions designed to opti-mize restaurant operations and improve the business. Theyincluded the restructuring of certain international markets,the closing of a significant number of underperformingrestaurants, the decision to terminate a long-term technologyproject, and the consolidation of certain home office facili-ties and elimination of positions to control costs, streamlineoperations and reallocate resources.
CONSOLIDATED OPERATING RESULTS
Operating results
2003 2002 2001
DOLLARS IN MILLIONS, Increase/ Increase/EXCEPT PER SHARE DATA Amount (decrease) Amount (decrease) Amount
RevenuesSales by Company-operated restaurants $12,795 11% $11,500 4% $11,041Revenues from franchised and affiliated restaurants 4,345 11 3,906 2 3,829
Total revenues 17,140 11 15,406 4 14,870
Operating costs and expensesCompany-operated restaurants 11,006 11 9,907 5 9,454Franchised restaurants 938 12 840 5 800Selling, general & administrative expenses 1,833 7 1,713 3 1,662Other operating expense, net 531 (36) 833 nm 257
Total operating costs and expenses 14,308 8 13,293 9 12,173
Operating income 2,832 34 2,113 (22) 2,697
Interest expense 388 4 374 (17) 452McDonald’s Japan IPO gain nm (137)Nonoperating expense, net 98 27 77 48 52
Income before provision for income taxes and cumulative effect of accounting changes 2,346 41 1,662 (29) 2,330
Provision for income taxes 838 25 670 (3) 693
Income before cumulative effect of accounting changes 1,508 52 992 (39) 1,637Cumulative effect of accounting changes, net of tax (37) nm (99) nm
Net income $ 1,471 65% $ 893 (45)% $ 1,637
Per common share–diluted:Income before cumulative effect of accounting changes $ 1.18 53% $ .77 (38)% $ 1.25Cumulative effect of accounting changes (.03) nm (.07) nmNet income $ 1.15 64% $ .70 (44)% $ 1.25
nm Not meaningful.
> The Company expects capital expenditures for 2004 to be approximately $1.5 billion to $1.6 billion.
> The Company expects to return about $1 billion to shareholders through dividends and share repurchasesin 2004.
A number of factors can affect our business, includingeffectiveness of operating initiatives and changes in globaland local business and economic conditions. These andother risks are noted in the Forward-looking statements atthe end of Management’s discussion and analysis.

McDonald’s Corporation 5
In 2001, the Company also implemented structuralchanges and restaurant initiatives, primarily in the U.S. The changes included streamlining operations by reducingthe number of U.S. regions and divisions, enabling theCompany to combine staff functions and improve efficiency.
The Company recorded charges associated with certain ofthe above actions as “special items.” Special items generallyrepresent actions or transactions related to the implementa-tion of strategic initiatives of the Company, items that areunusual or infrequent in nature (such as the dispositions ofcertain non-McDonald’s brands in 2003 and the Japan IPO
gain in 2001), and charges resulting from annual goodwilland asset impairment testing. McDonald’s managementdoes not include these items when reviewing business performance trends because they do not believe these itemsare indicative of expected ongoing results.
On a pretax basis, the Company recorded $408 million ofspecial charges in 2003, $853 million of special charges in2002 and $253 million of special items in 2001. All specialitems were recorded in other operating expense, except asnoted in the discussion that follows.
RestructuringIn 2003, the Company recorded $272 million of pretaxcharges consisting of: $237 million related to the loss on the sale of Donatos Pizzeria, the closing of all Donatos andBoston Market restaurants outside the U.S. and the exit of a domestic joint venture with Fazoli’s; and $35 millionrelated to revitalization plan actions of McDonald’s Japan,including headcount reductions, the closing of Pret A Mangerstores in Japan, and the early termination of a long-termmanagement services agreement.
In 2002, the Company recorded $267 million of net pretax charges consisting of: $201 million related to theanticipated transfer of ownership in five countries in theMiddle East and Latin America to developmental licenseesand ceasing operations in two countries in Latin America;$81 million primarily related to eliminating approximately600 positions (about half of which were in the U.S. and half of which were in international markets), reallocatingresources and consolidating certain home office facilities tocontrol costs; and a $15 million favorable adjustment to the2001 restructuring charge due to lower employee-relatedcosts than originally anticipated. Under the developmentallicense business structure, which the Company successfullyemploys in about 30 markets outside the U.S. (approximately400 restaurants), the licensee owns the business, includingthe real estate interest. While the Company generally doesnot have any capital invested in these markets, it receives a royalty based on a percent of sales.
In 2001, the Company recorded $200 million of pretaxrestructuring charges related to initiatives designed toimprove the restaurant experience, primarily in the U.S.These initiatives included streamlining operations byreducing the number of regions and divisions, enabling the Company to combine staff functions and improve efficiency. In connection with these initiatives, the Companyeliminated approximately 850 positions (700 in the U.S.,primarily in the divisions and regions, and 150 in interna-tional markets).
Restaurant closings/asset impairmentIn 2003, the Company recorded $136 million of net pretaxcharges consisting of: $148 million primarily related toasset/goodwill impairment, mainly in Latin America; $30 million for about 50 restaurant closings associated withstrategic actions in Latin America; and a $42 million favor-able adjustment to the 2002 charge for restaurant closings,primarily due to about 85 fewer closings than originallyanticipated. The lower closings were primarily due to management’s reassessment of the plans as a result of thenew strategic direction of the Company.
In 2002, the Company recorded $402 million of pretaxcharges consisting of: $302 million related to management'sdecision to close 751 underperforming restaurants primarilyin the U.S. and Japan; and $100 million primarily related to the impairment of assets for certain existing restaurantsin Europe and Latin America. Most of the restaurants identified for closing had negative cash flows and/or verylow annual sales volumes. Also, in many cases they wouldhave required significant capital investment to remainfinancially viable.
Special items–expense/(income)
Pretax After tax(2) Per common share–diluted
IN MILLIONS, EXCEPT PER SHARE DATA 2003 2002 2001 2003 2002 2001 2003 2002 2001
Restructuring $272 $267 $ 200 $183 $244 $ 136 $.14 $.19 $ .11Restaurant closings/asset impairment 136 402 135 140 336 107 .11 .26 .08Other 184 55 120 37 .10 .03McDonald’s Japan IPO gain (137) (137) (.11)
Total special items(1) $408 $853 $ 253 $323 $700 $ 143 $.25 $.55 $ .11
(1) See other operating expense, net note to the consolidated financial statements for a summary of the activity in the related liabilities. The Companyexpects to use cash provided by operations to fund the remaining employee severance and lease obligations associated with the special charges.
(2) Certain special items were not tax-effected.

6 McDonald’s Corporation
In 2001, the Company recorded $135 million of pretaxcharges consisting of: $91 million related to the closing of163 underperforming restaurants in international markets; a$24 million asset impairment charge in Turkey; and $20 mil-lion related to the disposition of Aroma Café in the U.K.
Although restaurant closings occur each year, theserestaurant closing charges in each year were identified as“special charges” because they were the result of separateintensive reviews by management in conjunction with other strategic actions.
OtherIn 2002, the Company recorded $184 million of pretaxcharges consisting of: $170 million primarily related to thewrite-off of software development costs as a result of man-agement's decision to terminate a long-term technologyproject; and $14 million primarily related to the write-off of receivables and inventory in Venezuela as a result of thetemporary closure of all McDonald's restaurants due to anational strike. Although the terminated technology projectwas expected to deliver long-term benefits, it was no longerviewed as the best use of capital, as the anticipated
Systemwide cost over several years was expected to bemore than $1 billion.
In 2001, the Company recorded $55 million of pretaxcharges consisting of: $18 million primarily related to thewrite-off of certain technology costs; $12 million (recordedin nonoperating expense) primarily related to the write-offof a corporate investment; and $25 million primarily relatedto the unrecoverable costs incurred in connection with thetheft of winning game pieces from the Company's Monopolyand certain other promotional games over an extended period of time, and the related termination of the supplierof the game pieces. Fifty individuals (none of whom wereCompany employees) were convicted of conspiracy and/ormail fraud charges.
McDonald's Japan IPO gainIn 2001, McDonald's Japan, the Company’s 50%-ownedaffiliate, completed an IPO of 12 million shares. The Companyrecorded a $137 million gain (pre and after tax) in nonoper-ating income to reflect an increase in the carrying value of its investment as a result of the cash proceeds from theIPO received by McDonald's Japan.
IMPACT OF FOREIGN CURRENCIES ON REPORTED RESULTSWhile changing foreign currencies affect reported results,McDonald's lessens exposures, where practical, by financingin local currencies, hedging certain foreign-denominatedcash flows, and by purchasing goods and services in localcurrencies.
In 2003, foreign currency translation had a positiveimpact on consolidated revenues, operating income andearnings per share due to the strengthening of several
major currencies, primarily the Euro. In 2002, foreign currency translation had a minimal impact on revenues asthe stronger Euro and British Pound were offset by weakerLatin American currencies (primarily the Argentine Peso,Brazilian Real and Venezuelan Bolivar). Operating incomein 2002 was positively impacted by foreign currency translation primarily due to the stronger Euro and BritishPound.
Impact of foreign currency translation on reported results
Currency translationReported amount benefit (loss)
IN MILLIONS, EXCEPT PER SHARE DATA 2003 2002 2001 2003 2002 2001
Revenues $17,140 $15,406 $14,870 $886 $ 15 $(457)Company-operated margins(1) 1,695 1,513 1,525 101 29 (49)Franchised margins(1) 3,405 3,064 3,028 195 39 (65)Selling, general & administrative expenses 1,833 1,713 1,662 (68) 8 35Operating income 2,832 2,113 2,697 189 90 (78)Income before cumulative effect of accounting changes 1,508 992 1,637 89 42 (50)Net income 1,471 893 1,637 89 42 (50)
Per common share–diluted:Income before cumulative effect of accounting changes 1.18 .77 1.25 .07 .03 (.04)Net income 1.15 .70 1.25 .07 .04 (.04)
(1) Includes McDonald’s restaurants only.
McDonald’s Corporation 7
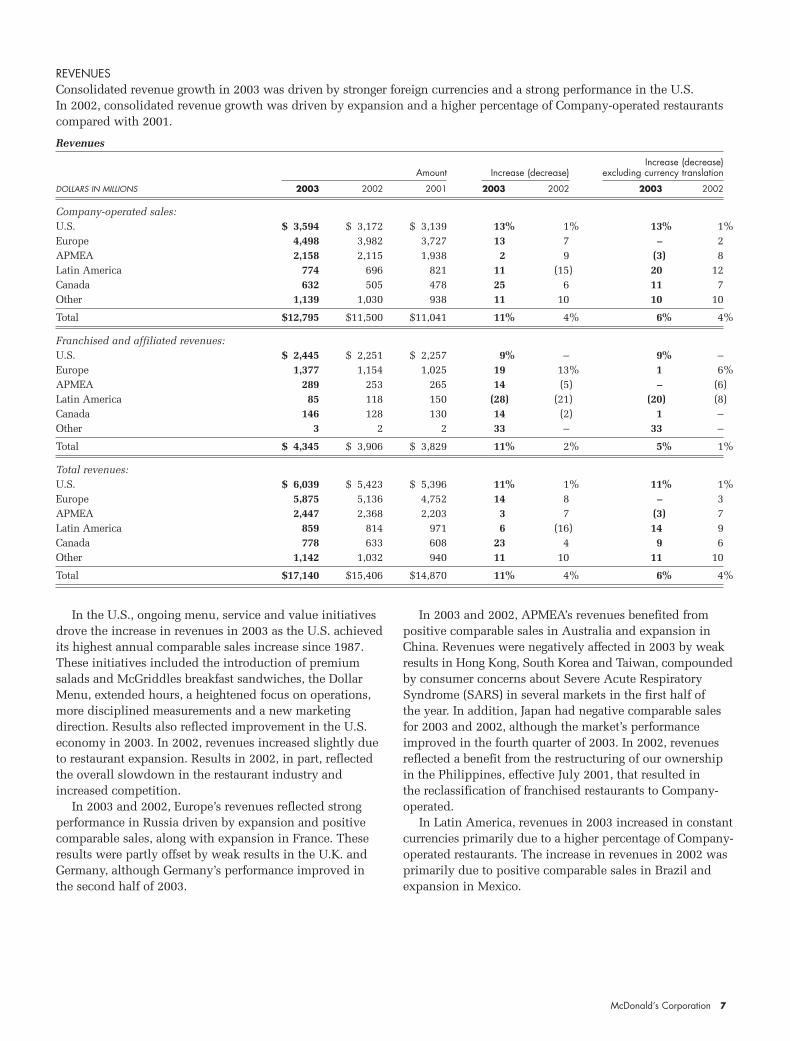
In the U.S., ongoing menu, service and value initiativesdrove the increase in revenues in 2003 as the U.S. achievedits highest annual comparable sales increase since 1987.These initiatives included the introduction of premium salads and McGriddles breakfast sandwiches, the DollarMenu, extended hours, a heightened focus on operations,more disciplined measurements and a new marketing direction. Results also reflected improvement in the U.S.economy in 2003. In 2002, revenues increased slightly dueto restaurant expansion. Results in 2002, in part, reflectedthe overall slowdown in the restaurant industry andincreased competition.
In 2003 and 2002, Europe’s revenues reflected strong performance in Russia driven by expansion and positivecomparable sales, along with expansion in France. Theseresults were partly offset by weak results in the U.K. andGermany, although Germany’s performance improved in the second half of 2003.
In 2003 and 2002, APMEA’s revenues benefited frompositive comparable sales in Australia and expansion inChina. Revenues were negatively affected in 2003 by weakresults in Hong Kong, South Korea and Taiwan, compoundedby consumer concerns about Severe Acute RespiratorySyndrome (SARS) in several markets in the first half of the year. In addition, Japan had negative comparable sales for 2003 and 2002, although the market’s performanceimproved in the fourth quarter of 2003. In 2002, revenuesreflected a benefit from the restructuring of our ownershipin the Philippines, effective July 2001, that resulted in the reclassification of franchised restaurants to Company-operated.
In Latin America, revenues in 2003 increased in constantcurrencies primarily due to a higher percentage of Company-operated restaurants. The increase in revenues in 2002 wasprimarily due to positive comparable sales in Brazil andexpansion in Mexico.
REVENUES Consolidated revenue growth in 2003 was driven by stronger foreign currencies and a strong performance in the U.S. In 2002, consolidated revenue growth was driven by expansion and a higher percentage of Company-operated restaurantscompared with 2001.
Revenues
Increase (decrease)Amount Increase (decrease) excluding currency translation
DOLLARS IN MILLIONS 2003 2002 2001 2003 2002 2003 2002
Company-operated sales:U.S. $ 3,594 $ 3,172 $ 3,139 13% 1% 13% 1%Europe 4,498 3,982 3,727 13 7 – 2APMEA 2,158 2,115 1,938 2 9 (3) 8Latin America 774 696 821 11 (15) 20 12Canada 632 505 478 25 6 11 7Other 1,139 1,030 938 11 10 10 10
Total $12,795 $11,500 $11,041 11% 4% 6% 4%
Franchised and affiliated revenues:U.S. $ 2,445 $ 2,251 $ 2,257 9% – 9% –Europe 1,377 1,154 1,025 19 13% 1 6%APMEA 289 253 265 14 (5) – (6)Latin America 85 118 150 (28) (21) (20) (8)Canada 146 128 130 14 (2) 1 –Other 3 2 2 33 – 33 –
Total $ 4,345 $ 3,906 $ 3,829 11% 2% 5% 1%
Total revenues:U.S. $ 6,039 $ 5,423 $ 5,396 11% 1% 11% 1%Europe 5,875 5,136 4,752 14 8 – 3APMEA 2,447 2,368 2,203 3 7 (3) 7Latin America 859 814 971 6 (16) 14 9Canada 778 633 608 23 4 9 6Other 1,142 1,032 940 11 10 11 10
Total $17,140 $15,406 $14,870 11% 4% 6% 4%

8 McDonald’s Corporation
Systemwide sales
Increase (decrease)Increase (decrease) excluding currency translation
2003 2002 2001 2003 2002 2001
U.S. 9% 1% 2% 9% 1% 2%Europe 18 11 1 2 5 5APMEA 6 (3) (6) (2) (3) 3Latin America (4) (17) (3) 4 4 6Canada 17 1 – 4 2 5Other 10 9 61 10 9 62
Total 11% 2% 1% 5% 2% 4%
Comparable sales–McDonald’s restaurants
Increase (decrease)
2003 2002 2001
U.S. 6.4% (1.5)% 0.1%Europe (0.9) 1.0 (1.4)APMEA (4.2) (8.5) (4.8)Latin America 2.3 1.0 (3.9)Canada – (2.5) 1.3
Total 2.4% (2.1)% (1.3)%
OPERATING INCOMEConsolidated operating income in 2003 included highercombined operating margin dollars, higher selling, general& administrative expenses and lower gains on sales ofrestaurant businesses compared with 2002. Operatingincome in 2002 included higher combined operating margin
dollars, higher selling, general & administrative expensesand a net loss from our Japanese affiliate compared withearnings in 2001. In all three years, the Company recordedspecial charges that are included in these results.
Operating income
Increase (decrease)Amount Increase (decrease) excluding currency translation
DOLLARS IN MILLIONS 2003 2002 2001 2003 2002 2003 2002
U.S. $1,982 $1,673 $1,622 18% 3% 18% 3%Europe 1,339 1,022 1,063 31 (4) 13 (8)APMEA 226 64 325 nm (80) nm (81)Latin America (171) (133) 11 (28) nm (7) nmCanada 163 125 124 30 1 15 3Other (295) (66) (66) nm – nm –Corporate (412) (572) (382) 28 (50) 28 (50)
Total $2,832 $2,113 $2,697 34% (22)% 25% (25)%
nm Not meaningful.
The following tables present Systemwide sales growth rates and the increase or decrease in comparable sales.
McDonald’s Corporation 9
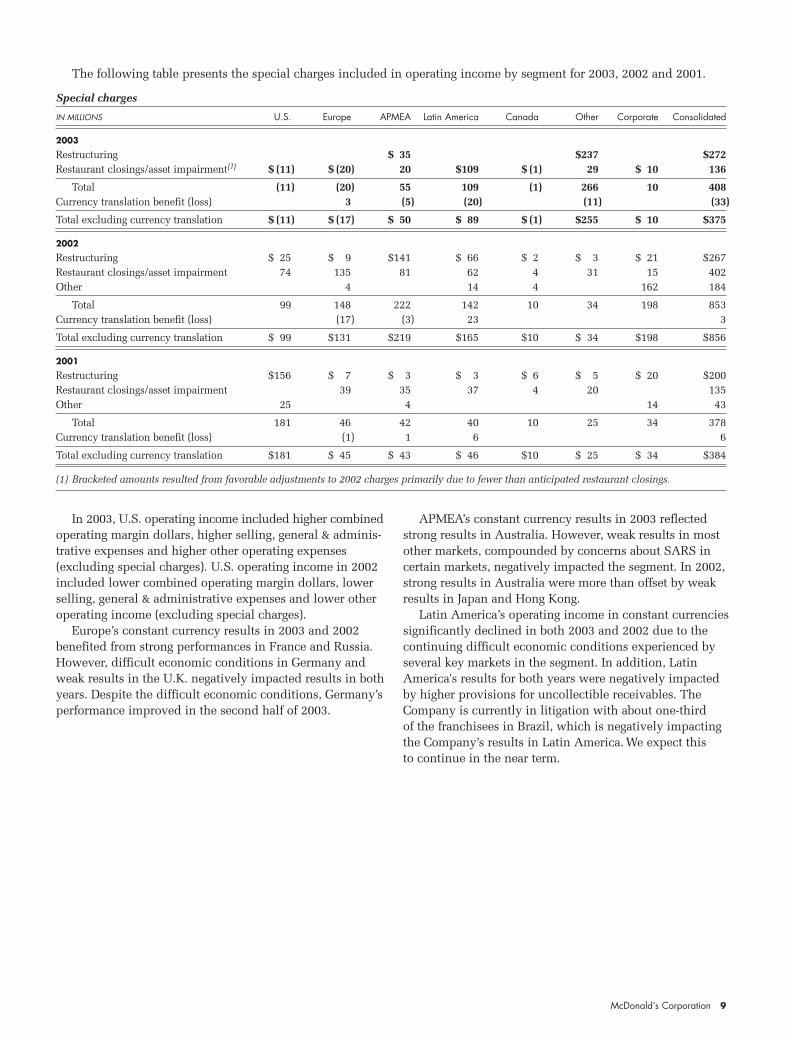
The following table presents the special charges included in operating income by segment for 2003, 2002 and 2001.
Special charges
IN MILLIONS U.S. Europe APMEA Latin America Canada Other Corporate Consolidated
2003
Restructuring $ 35 $237 $272Restaurant closings/asset impairment(1) $ (11) $ (20) 20 $109 $ (1) 29 $ 10 136
Total (11) (20) 55 109 (1) 266 10 408Currency translation benefit (loss) 3 (5) (20) (11) (33)
Total excluding currency translation $ (11) $ (17) $ 50 $ 89 $ (1) $255 $ 10 $375
2002
Restructuring $ 25 $ 9 $141 $ 66 $ 2 $ 3 $ 21 $267Restaurant closings/asset impairment 74 135 81 62 4 31 15 402Other 4 14 4 162 184
Total 99 148 222 142 10 34 198 853Currency translation benefit (loss) (17) (3) 23 3
Total excluding currency translation $ 99 $131 $219 $165 $10 $ 34 $198 $856
2001
Restructuring $156 $ 7 $ 3 $ 3 $ 6 $ 5 $ 20 $200Restaurant closings/asset impairment 39 35 37 4 20 135Other 25 4 14 43
Total 181 46 42 40 10 25 34 378Currency translation benefit (loss) (1) 1 6 6
Total excluding currency translation $181 $ 45 $ 43 $ 46 $10 $ 25 $ 34 $384
(1) Bracketed amounts resulted from favorable adjustments to 2002 charges primarily due to fewer than anticipated restaurant closings.
In 2003, U.S. operating income included higher combinedoperating margin dollars, higher selling, general & adminis-trative expenses and higher other operating expenses (excluding special charges). U.S. operating income in 2002included lower combined operating margin dollars, lowerselling, general & administrative expenses and lower otheroperating income (excluding special charges).
Europe’s constant currency results in 2003 and 2002 benefited from strong performances in France and Russia.However, difficult economic conditions in Germany andweak results in the U.K. negatively impacted results in bothyears. Despite the difficult economic conditions, Germany’sperformance improved in the second half of 2003.
APMEA’s constant currency results in 2003 reflectedstrong results in Australia. However, weak results in mostother markets, compounded by concerns about SARS incertain markets, negatively impacted the segment. In 2002,strong results in Australia were more than offset by weakresults in Japan and Hong Kong.
Latin America’s operating income in constant currenciessignificantly declined in both 2003 and 2002 due to thecontinuing difficult economic conditions experienced byseveral key markets in the segment. In addition, LatinAmerica's results for both years were negatively impactedby higher provisions for uncollectible receivables. TheCompany is currently in litigation with about one-third of the franchisees in Brazil, which is negatively impacting the Company’s results in Latin America. We expect this to continue in the near term.

10 McDonald’s Corporation
OPERATING MARGINSOperating margin information and discussions relate toMcDonald’s restaurants only and exclude non-McDonald’sbrands.
Company-operated marginsCompany-operated margin dollars represent sales byCompany-operated restaurants less the operating costs ofthese restaurants. Company-operated margin dollarsincreased $182 million or 12% (5% in constant currencies)in 2003 and declined $12 million or 1% (3% in constantcurrencies) in 2002. The constant currency increase in 2003was primarily due to strong comparable sales in the U.S.The constant currency decrease in 2002 was primarily dueto negative comparable sales and higher labor rates, partlyoffset by restaurant expansion.
Company-operated margins–McDonald’s restaurants
IN MILLIONS 2003 2002 2001
U.S. $ 635 $ 507 $ 501Europe 708 631 626APMEA 213 239 240Latin America 47 66 83Canada 92 70 75
Total $1,695 $1,513 $1,525
PERCENT OF SALES
U.S. 17.7% 16.0% 16.0%Europe 15.7 15.9 16.8APMEA 9.9 11.3 12.4Latin America 6.1 9.4 10.1Canada 14.6 13.7 15.6
Total 14.5% 14.4% 15.1%
Operating cost trends as a percent of sales were as follows:food & paper costs decreased in 2003 and 2002, payrollcosts were flat in 2003 and increased in 2002, and occupancy& other operating expenses increased in both years.
The U.S. Company-operated margin percent increased in2003 primarily due to positive comparable sales and lowerpayroll as a percent of sales due to improved productivityand lower wage inflation. Higher commodity costs partlyoffset these trends. In 2002, the U.S. Company-operatedmargin percent benefited from the elimination of goodwillamortization and a lower advertising contribution rate, whileweak comparable sales and higher labor costs negativelyimpacted the margin.
In 2003, Europe’s Company-operated margin percentreflected weak performance in the U.K. (which has thelargest number of Company-operated restaurants in Europe),partly offset by improved margin performance in Germanyand France. In 2002, Europe's Company-operated marginpercent reflected higher labor costs and an increase in occu-pancy & other operating expenses.
Franchised marginsFranchised margin dollars represent revenues from fran-chised and affiliated restaurants less the Company's occu-pancy costs (rent and depreciation) associated with thosesites. Franchised margin dollars represented more than 65% of the combined operating margins in 2003, 2002 and2001. Franchised margin dollars increased $341 million or11% (5% in constant currencies) in 2003 and $36 millionor 1% (flat in constant currencies) in 2002.
Franchised margins–McDonald’s restaurants
IN MILLIONS 2003 2002 2001
U.S. $1,945 $1,781 $1,799Europe 1,044 885 792APMEA 248 217 229Latin America 54 79 103Canada 114 102 105
Total $3,405 $3,064 $3,028
PERCENT OF REVENUES
U.S. 79.5% 79.1% 79.7%Europe 75.8 76.7 77.2APMEA 85.6 85.8 86.2Latin America 64.3 66.9 68.4Canada 78.2 79.2 80.4
Total 78.4% 78.5% 79.1%
The consolidated franchised margin percent declinedslightly in 2003 as positive comparable sales were offset byhigher occupancy costs, due in part to an increased propor-tion of leased sites. The decline in the consolidated fran-chised margin percent in 2002 reflected negative compara-ble sales, higher rent assistance to franchisees primarily in the U.S. and Europe, and higher occupancy costs, due in part to an increased proportion of leased sites.
SELLING, GENERAL & ADMINISTRATIVE EXPENSESConsolidated selling, general & administrative expensesincreased 7% in 2003 and 3% in 2002 (3% and 4% in con-stant currencies). The constant currency increase in 2003was primarily due to higher performance-based incentivecompensation, as well as severance and other costs associatedwith the strategic decision to reduce restaurant openings.The constant currency increase in 2002 was primarily dueto higher spending on technology in the Corporate segment,higher advertising expenses in the U.S. primarily related tothe introduction of the Dollar Menu, and higher expensesfor non-McDonald’s brands.

McDonald’s Corporation 11
OTHER OPERATING EXPENSE, NET
Other operating (income) expense, net
DOLLARS IN MILLIONS 2003 2002 2001
Gains on sales of restaurant businesses $ (55) $(114) $(112)Equity in earnings of unconsolidated affiliates (37) (24) (63)Special charges(1) 408 853 378Other expense 215 118 54
Total $531 $ 833 $ 257
(1) See other operating expense, net note to the consolidated financial statements for a discussion of the special charges and a summary of the activity in the related liabilities.
Gains on sales of restaurant businessesGains on sales of restaurant businesses include gains fromsales of Company-operated restaurants as well as gains fromexercises of purchase options by franchisees with businessfacilities lease arrangements (arrangements where theCompany leases the businesses, including equipment, tofranchisees who have options to purchase the businesses).The Company's purchases and sales of businesses with itsfranchisees and affiliates are aimed at achieving an optimalownership mix in each market. Resulting gains or losses are recorded in operating income because the transactionsare a recurring part of our business. The Company expectslower gains on sales of restaurant businesses in 2004 compared with 2003.
Equity in earnings of unconsolidated affiliatesEquity in earnings of unconsolidated affiliates—businessesin which the Company actively participates but does notcontrol—is reported after interest expense and incometaxes, except for U.S. restaurant partnerships, which arereported before income taxes. The increase in 2003 was
primarily due to strong results in the U.S. The decrease in 2002 was due to a net loss from our Japanese affiliate compared with earnings in 2001.
Other expenseOther expense in 2003 reflected higher losses on asset dispositions, higher provisions for uncollectible receivables(primarily in Latin America), and costs in the U.S. related to sites that will no longer be developed as a result of management’s decision to significantly reduce capitalexpenditures. Other expense in 2002 reflected payments toU.S. owner/operators to facilitate the introduction of a newfront counter service system and higher provisions foruncollectible receivables (primarily in Europe and LatinAmerica), partly offset by a benefit from the elimination ofgoodwill amortization. The Company expects lower otherexpense in 2004 compared with 2003.
INTEREST EXPENSEInterest expense increased in 2003 due to stronger foreigncurrencies, partly offset by lower average debt levels andinterest rates. Interest expense decreased in 2002 due tolower average interest rates, partly offset by higher averagedebt levels and stronger foreign currencies.
NONOPERATING EXPENSE, NETNonoperating expense includes miscellaneous income and expense items such as interest income, minority inter-ests, and gains and losses related to other investments,financings and foreign currency translation. Nonoperatingexpense in 2003 reflected an $11 million loss on the earlyextinguishment of $200 million of debt as well as higherforeign currency translation losses compared with 2002.Nonoperating expense in 2002 reflected higher minorityinterest expense and foreign currency translation losses in 2002 compared with foreign currency translation gains
Selling, general & administrative expenses
Increase (decrease)Amount Increase (decrease) excluding currency translation
DOLLARS IN MILLIONS 2003 2002 2001 2003 2002 2003 2002
U.S. $ 567 $ 558 $ 563 2% (1)% 2% (1)%Europe 424 359 328 18 9 2 4APMEA 173 158 152 10 4 2 3Latin America 102 102 126 – (19) 8 3Canada 54 49 51 9 (3) (3) (2)Other 115 114 102 1 13 – 12Corporate(1) 398 373 340 7 10 7 10
Total $1,833 $1,713 $1,662 7% 3% 3% 4%
(1) Corporate expenses consist of home office support costs in areas such as facilities, finance, human resources, information technology, legal, marketing, supply chain management and training.
Selling, general & administrative expenses as a percent of revenues declined to 10.7% in 2003 compared with11.1% in 2002 and 11.2% in 2001, and selling, general & administrative expenses as a percent of Systemwide salesdeclined to 4.0% in 2003 compared with 4.1% in 2002
and 2001. Management believes that analyzing selling, general & administrative expenses as a percent of Systemwidesales as well as revenues is meaningful because these costsare incurred to support Systemwide restaurants.
12 McDonald’s Corporation
in 2001. In addition, nonoperating expense in 2001 included$12 million primarily related to the write-off of a corporateinvestment as well as minority interest expense related tothe sale of real estate in Singapore.
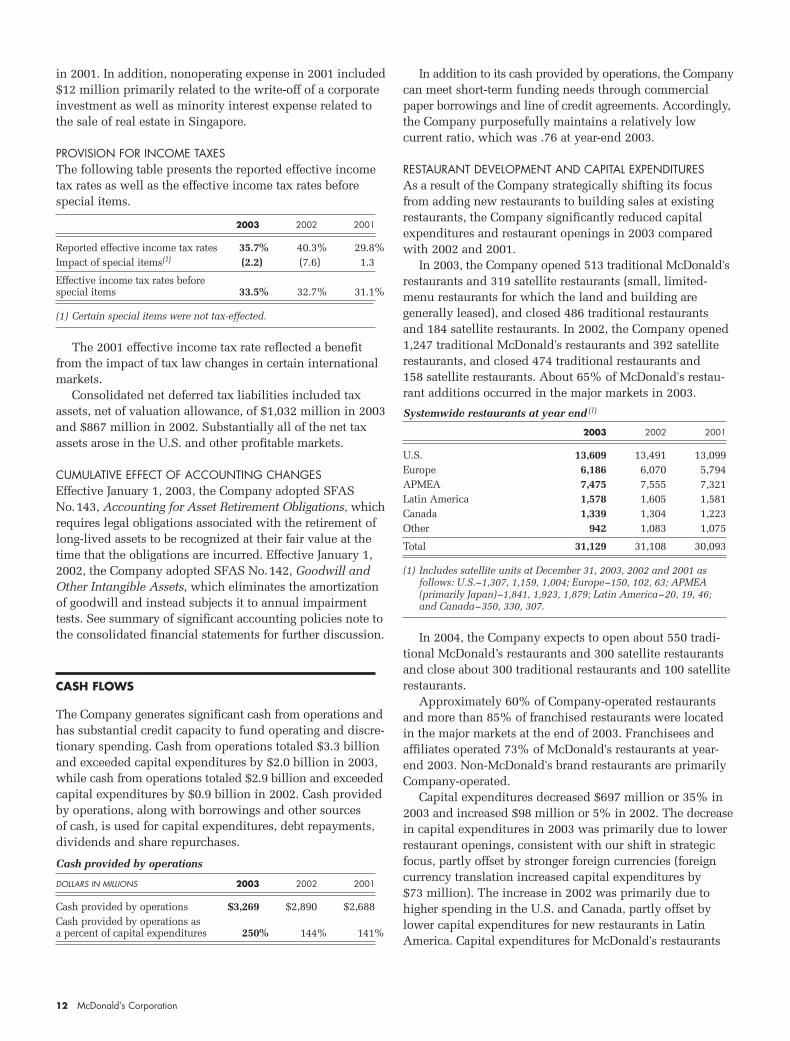
PROVISION FOR INCOME TAXESThe following table presents the reported effective incometax rates as well as the effective income tax rates before special items.
2003 2002 2001
Reported effective income tax rates 35.7% 40.3% 29.8%Impact of special items(1) (2.2) (7.6) 1.3
Effective income tax rates before special items 33.5% 32.7% 31.1%
(1) Certain special items were not tax-effected.
The 2001 effective income tax rate reflected a benefitfrom the impact of tax law changes in certain internationalmarkets.
Consolidated net deferred tax liabilities included taxassets, net of valuation allowance, of $1,032 million in 2003and $867 million in 2002. Substantially all of the net taxassets arose in the U.S. and other profitable markets.
CUMULATIVE EFFECT OF ACCOUNTING CHANGESEffective January 1, 2003, the Company adopted SFAS No.143, Accounting for Asset Retirement Obligations, whichrequires legal obligations associated with the retirement oflong-lived assets to be recognized at their fair value at thetime that the obligations are incurred. Effective January 1,2002, the Company adopted SFAS No.142, Goodwill andOther Intangible Assets, which eliminates the amortizationof goodwill and instead subjects it to annual impairmenttests. See summary of significant accounting policies note tothe consolidated financial statements for further discussion.
CASH FLOWS
The Company generates significant cash from operations andhas substantial credit capacity to fund operating and discre-tionary spending. Cash from operations totaled $3.3 billionand exceeded capital expenditures by $2.0 billion in 2003,while cash from operations totaled $2.9 billion and exceededcapital expenditures by $0.9 billion in 2002. Cash providedby operations, along with borrowings and other sources of cash, is used for capital expenditures, debt repayments, dividends and share repurchases.
Cash provided by operations
DOLLARS IN MILLIONS 2003 2002 2001
Cash provided by operations $3,269 $2,890 $2,688Cash provided by operations asa percent of capital expenditures 250% 144% 141%
In addition to its cash provided by operations, the Companycan meet short-term funding needs through commercialpaper borrowings and line of credit agreements. Accordingly,the Company purposefully maintains a relatively low current ratio, which was .76 at year-end 2003.
RESTAURANT DEVELOPMENT AND CAPITAL EXPENDITURESAs a result of the Company strategically shifting its focusfrom adding new restaurants to building sales at existingrestaurants, the Company significantly reduced capitalexpenditures and restaurant openings in 2003 comparedwith 2002 and 2001.
In 2003, the Company opened 513 traditional McDonald'srestaurants and 319 satellite restaurants (small, limited-menu restaurants for which the land and building are generally leased), and closed 486 traditional restaurants and 184 satellite restaurants. In 2002, the Company opened1,247 traditional McDonald's restaurants and 392 satelliterestaurants, and closed 474 traditional restaurants and 158 satellite restaurants. About 65% of McDonald's restau-rant additions occurred in the major markets in 2003.
Systemwide restaurants at year end (1)
2003 2002 2001
U.S. 13,609 13,491 13,099Europe 6,186 6,070 5,794APMEA 7,475 7,555 7,321Latin America 1,578 1,605 1,581Canada 1,339 1,304 1,223Other 942 1,083 1,075
Total 31,129 31,108 30,093
(1) Includes satellite units at December 31, 2003, 2002 and 2001 as follows: U.S.–1,307, 1,159, 1,004; Europe–150, 102, 63; APMEA (primarily Japan)–1,841, 1,923, 1,879; Latin America–20, 19, 46; and Canada–350, 330, 307.
In 2004, the Company expects to open about 550 tradi-tional McDonald’s restaurants and 300 satellite restaurantsand close about 300 traditional restaurants and 100 satelliterestaurants.
Approximately 60% of Company-operated restaurantsand more than 85% of franchised restaurants were locatedin the major markets at the end of 2003. Franchisees andaffiliates operated 73% of McDonald's restaurants at year-end 2003. Non-McDonald's brand restaurants are primarilyCompany-operated.
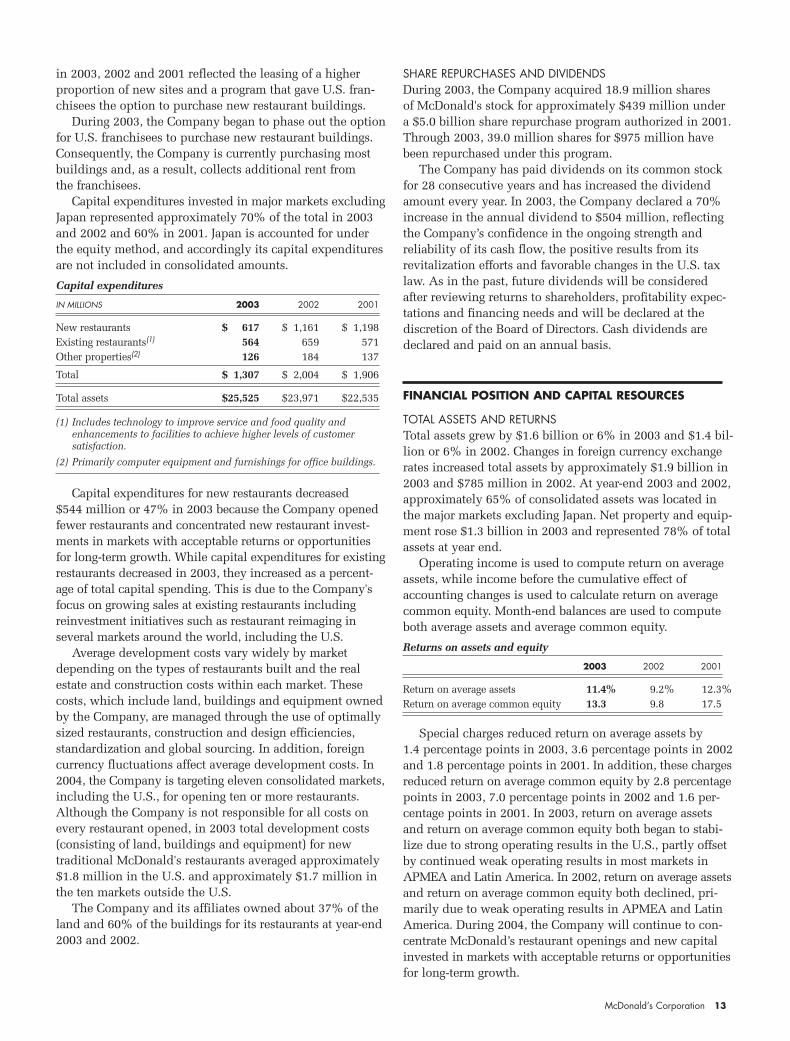
Capital expenditures decreased $697 million or 35% in2003 and increased $98 million or 5% in 2002. The decreasein capital expenditures in 2003 was primarily due to lowerrestaurant openings, consistent with our shift in strategicfocus, partly offset by stronger foreign currencies (foreigncurrency translation increased capital expenditures by $73 million). The increase in 2002 was primarily due tohigher spending in the U.S. and Canada, partly offset bylower capital expenditures for new restaurants in LatinAmerica. Capital expenditures for McDonald's restaurants
McDonald’s Corporation 13
in 2003, 2002 and 2001 reflected the leasing of a higher proportion of new sites and a program that gave U.S. fran-chisees the option to purchase new restaurant buildings.
During 2003, the Company began to phase out the option for U.S. franchisees to purchase new restaurant buildings.Consequently, the Company is currently purchasing mostbuildings and, as a result, collects additional rent from the franchisees.
Capital expenditures invested in major markets excludingJapan represented approximately 70% of the total in 2003and 2002 and 60% in 2001. Japan is accounted for underthe equity method, and accordingly its capital expendituresare not included in consolidated amounts.
Capital expenditures
IN MILLIONS 2003 2002 2001
New restaurants $ 617 $ 1,161 $ 1,198Existing restaurants(1) 564 659 571Other properties(2) 126 184 137
Total $ 1,307 $ 2,004 $ 1,906
Total assets $25,525 $23,971 $22,535
(1) Includes technology to improve service and food quality andenhancements to facilities to achieve higher levels of customer satisfaction.
(2) Primarily computer equipment and furnishings for office buildings.
Capital expenditures for new restaurants decreased $544 million or 47% in 2003 because the Company openedfewer restaurants and concentrated new restaurant invest-ments in markets with acceptable returns or opportunitiesfor long-term growth. While capital expenditures for existingrestaurants decreased in 2003, they increased as a percent-age of total capital spending. This is due to the Company'sfocus on growing sales at existing restaurants including reinvestment initiatives such as restaurant reimaging in several markets around the world, including the U.S.
Average development costs vary widely by marketdepending on the types of restaurants built and the realestate and construction costs within each market. Thesecosts, which include land, buildings and equipment ownedby the Company, are managed through the use of optimallysized restaurants, construction and design efficiencies, standardization and global sourcing. In addition, foreigncurrency fluctuations affect average development costs. In2004, the Company is targeting eleven consolidated markets,including the U.S., for opening ten or more restaurants.Although the Company is not responsible for all costs onevery restaurant opened, in 2003 total development costs(consisting of land, buildings and equipment) for new traditional McDonald's restaurants averaged approximately$1.8 million in the U.S. and approximately $1.7 million inthe ten markets outside the U.S.
The Company and its affiliates owned about 37% of theland and 60% of the buildings for its restaurants at year-end2003 and 2002.
SHARE REPURCHASES AND DIVIDENDSDuring 2003, the Company acquired 18.9 million shares of McDonald's stock for approximately $439 million undera $5.0 billion share repurchase program authorized in 2001.Through 2003, 39.0 million shares for $975 million havebeen repurchased under this program.
The Company has paid dividends on its common stockfor 28 consecutive years and has increased the dividendamount every year. In 2003, the Company declared a 70%increase in the annual dividend to $504 million, reflectingthe Company’s confidence in the ongoing strength and reliability of its cash flow, the positive results from its revitalization efforts and favorable changes in the U.S. taxlaw. As in the past, future dividends will be consideredafter reviewing returns to shareholders, profitability expec-tations and financing needs and will be declared at the discretion of the Board of Directors. Cash dividends aredeclared and paid on an annual basis.
FINANCIAL POSITION AND CAPITAL RESOURCES
TOTAL ASSETS AND RETURNSTotal assets grew by $1.6 billion or 6% in 2003 and $1.4 bil-lion or 6% in 2002. Changes in foreign currency exchangerates increased total assets by approximately $1.9 billion in2003 and $785 million in 2002. At year-end 2003 and 2002,approximately 65% of consolidated assets was located inthe major markets excluding Japan. Net property and equip-ment rose $1.3 billion in 2003 and represented 78% of totalassets at year end.
Operating income is used to compute return on averageassets, while income before the cumulative effect ofaccounting changes is used to calculate return on averagecommon equity. Month-end balances are used to computeboth average assets and average common equity.
Returns on assets and equity
2003 2002 2001
Return on average assets 11.4% 9.2% 12.3%Return on average common equity 13.3 9.8 17.5
Special charges reduced return on average assets by 1.4 percentage points in 2003, 3.6 percentage points in 2002and 1.8 percentage points in 2001. In addition, these chargesreduced return on average common equity by 2.8 percentagepoints in 2003, 7.0 percentage points in 2002 and 1.6 per-centage points in 2001. In 2003, return on average assetsand return on average common equity both began to stabi-lize due to strong operating results in the U.S., partly offsetby continued weak operating results in most markets inAPMEA and Latin America. In 2002, return on average assetsand return on average common equity both declined, pri-marily due to weak operating results in APMEA and LatinAmerica. During 2004, the Company will continue to con-centrate McDonald’s restaurant openings and new capitalinvested in markets with acceptable returns or opportunitiesfor long-term growth.
14 McDonald’s Corporation
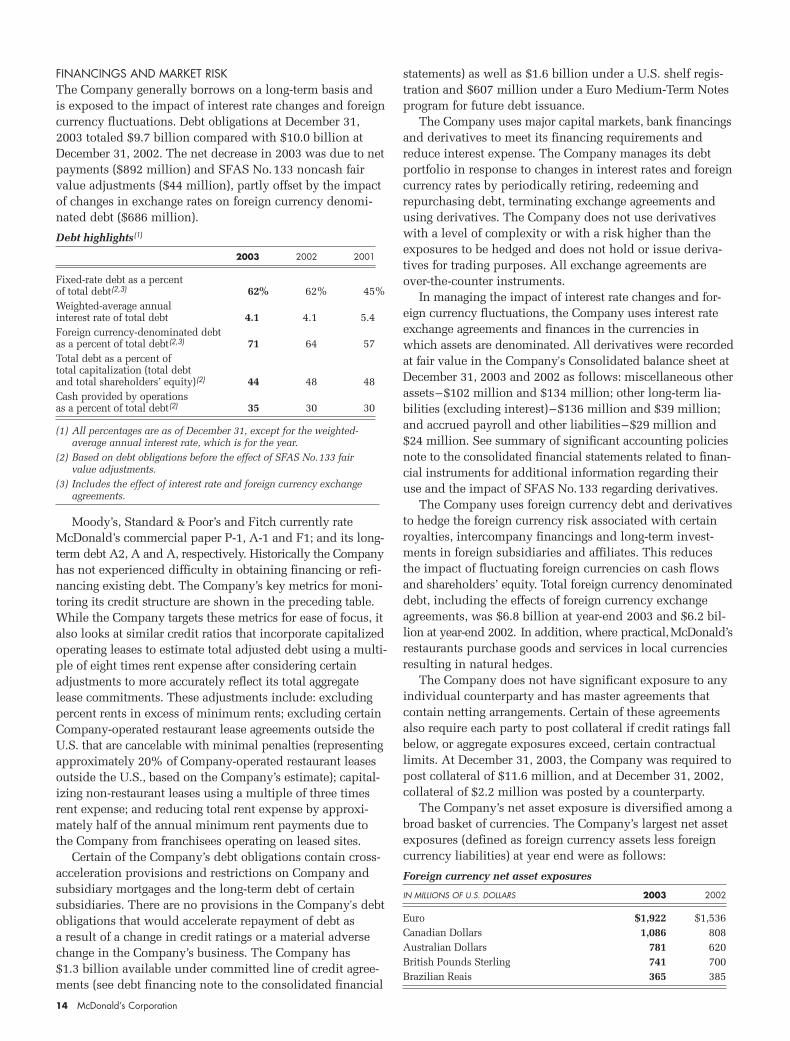
FINANCINGS AND MARKET RISK The Company generally borrows on a long-term basis and is exposed to the impact of interest rate changes and foreigncurrency fluctuations. Debt obligations at December 31,2003 totaled $9.7 billion compared with $10.0 billion atDecember 31, 2002. The net decrease in 2003 was due to netpayments ($892 million) and SFAS No.133 noncash fairvalue adjustments ($44 million), partly offset by the impactof changes in exchange rates on foreign currency denomi-nated debt ($686 million).
Debt highlights(1)
2003 2002 2001
Fixed-rate debt as a percent of total debt(2,3) 62% 62% 45%Weighted-average annual interest rate of total debt 4.1 4.1 5.4Foreign currency-denominated debt as a percent of total debt(2,3) 71 64 57Total debt as a percent of total capitalization (total debt and total shareholders’ equity)(2) 44 48 48Cash provided by operationsas a percent of total debt(2) 35 30 30
(1) All percentages are as of December 31, except for the weighted-average annual interest rate, which is for the year.
(2) Based on debt obligations before the effect of SFAS No.133 fair value adjustments.
(3) Includes the effect of interest rate and foreign currency exchangeagreements.
Moody’s, Standard & Poor’s and Fitch currently rateMcDonald’s commercial paper P-1, A-1 and F1; and its long-term debt A2, A and A, respectively. Historically the Companyhas not experienced difficulty in obtaining financing or refi-nancing existing debt. The Company’s key metrics for moni-toring its credit structure are shown in the preceding table.While the Company targets these metrics for ease of focus, italso looks at similar credit ratios that incorporate capitalizedoperating leases to estimate total adjusted debt using a multi-ple of eight times rent expense after considering certainadjustments to more accurately reflect its total aggregatelease commitments. These adjustments include: excludingpercent rents in excess of minimum rents; excluding certainCompany-operated restaurant lease agreements outside theU.S. that are cancelable with minimal penalties (representingapproximately 20% of Company-operated restaurant leasesoutside the U.S., based on the Company’s estimate); capital-izing non-restaurant leases using a multiple of three timesrent expense; and reducing total rent expense by approxi-mately half of the annual minimum rent payments due tothe Company from franchisees operating on leased sites.
Certain of the Company’s debt obligations contain cross-acceleration provisions and restrictions on Company andsubsidiary mortgages and the long-term debt of certain subsidiaries. There are no provisions in the Company's debtobligations that would accelerate repayment of debt as a result of a change in credit ratings or a material adversechange in the Company’s business. The Company has $1.3 billion available under committed line of credit agree-ments (see debt financing note to the consolidated financial
statements) as well as $1.6 billion under a U.S. shelf regis-tration and $607 million under a Euro Medium-Term Notesprogram for future debt issuance.
The Company uses major capital markets, bank financingsand derivatives to meet its financing requirements andreduce interest expense. The Company manages its debtportfolio in response to changes in interest rates and foreigncurrency rates by periodically retiring, redeeming andrepurchasing debt, terminating exchange agreements andusing derivatives. The Company does not use derivativeswith a level of complexity or with a risk higher than theexposures to be hedged and does not hold or issue deriva-tives for trading purposes. All exchange agreements areover-the-counter instruments.
In managing the impact of interest rate changes and for-eign currency fluctuations, the Company uses interest rateexchange agreements and finances in the currencies inwhich assets are denominated. All derivatives were recordedat fair value in the Company's Consolidated balance sheet atDecember 31, 2003 and 2002 as follows: miscellaneous otherassets–$102 million and $134 million; other long-term lia-bilities (excluding interest)–$136 million and $39 million;and accrued payroll and other liabilities–$29 million and$24 million. See summary of significant accounting policiesnote to the consolidated financial statements related to finan-cial instruments for additional information regarding theiruse and the impact of SFAS No.133 regarding derivatives.
The Company uses foreign currency debt and derivativesto hedge the foreign currency risk associated with certainroyalties, intercompany financings and long-term invest-ments in foreign subsidiaries and affiliates. This reduces the impact of fluctuating foreign currencies on cash flowsand shareholders’ equity. Total foreign currency denominateddebt, including the effects of foreign currency exchangeagreements, was $6.8 billion at year-end 2003 and $6.2 bil-lion at year-end 2002. In addition, where practical,McDonald’srestaurants purchase goods and services in local currenciesresulting in natural hedges.
The Company does not have significant exposure to anyindividual counterparty and has master agreements thatcontain netting arrangements. Certain of these agreementsalso require each party to post collateral if credit ratings fallbelow, or aggregate exposures exceed, certain contractuallimits. At December 31, 2003, the Company was required topost collateral of $11.6 million, and at December 31, 2002,collateral of $2.2 million was posted by a counterparty.
The Company’s net asset exposure is diversified among abroad basket of currencies. The Company’s largest net assetexposures (defined as foreign currency assets less foreigncurrency liabilities) at year end were as follows:
Foreign currency net asset exposures
IN MILLIONS OF U.S. DOLLARS 2003 2002
Euro $1,922 $1,536Canadian Dollars 1,086 808Australian Dollars 781 620British Pounds Sterling 741 700Brazilian Reais 365 385
McDonald’s Corporation 15
The Company prepared sensitivity analyses of its finan-cial instruments to determine the impact of hypotheticalchanges in interest rates and foreign currency exchange rateson the Company’s results of operations, cash flows and thefair value of its financial instruments. The interest rateanalysis assumed a one percentage point adverse change ininterest rates on all financial instruments but did not con-sider the effects of the reduced level of economic activity thatcould exist in such an environment. The foreign currencyrate analysis assumed that each foreign currency rate wouldchange by 10% in the same direction relative to the U.S.Dollar on all financial instruments; however, the analysisdid not include the potential impact on sales levels or localcurrency prices or the effect of fluctuating currencies on theCompany’s anticipated foreign currency royalties and otherpayments received in the U.S. Based on the results of theseanalyses of the Company’s financial instruments, neither a one percentage point adverse change in interest rates from2003 levels nor a 10% adverse change in foreign currencyrates from 2003 levels would materially affect the Company’sresults of operations, cash flows or the fair value of itsfinancial instruments.
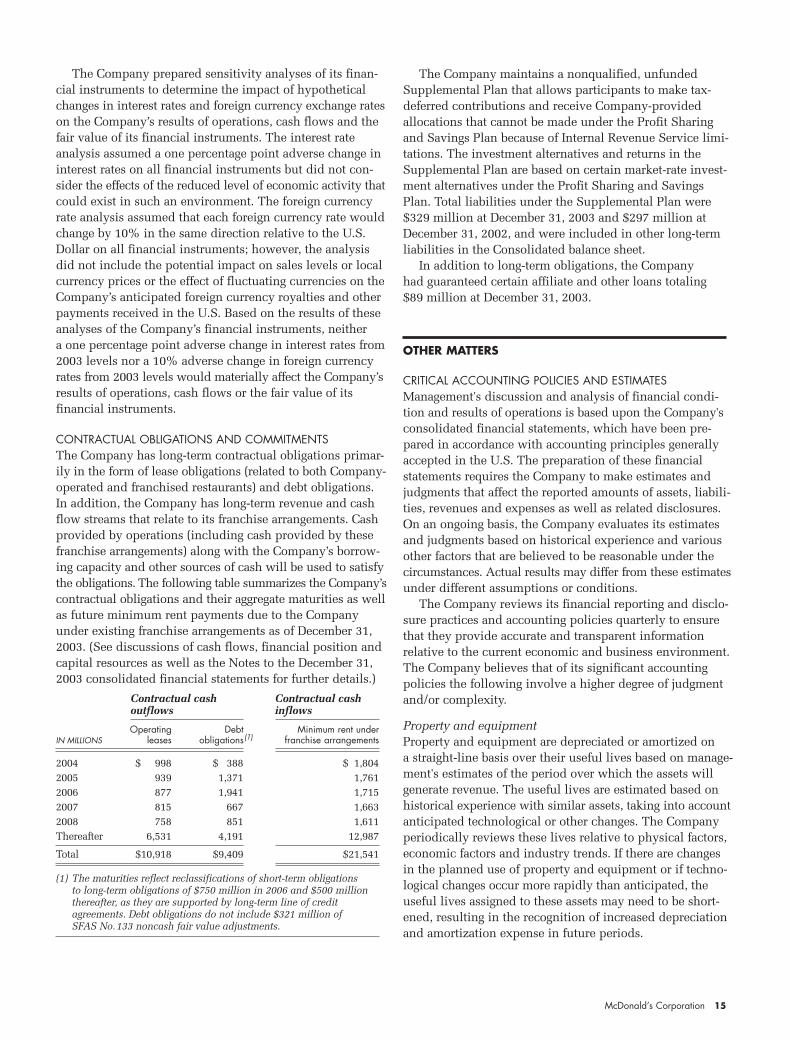
CONTRACTUAL OBLIGATIONS AND COMMITMENTSThe Company has long-term contractual obligations primar-ily in the form of lease obligations (related to both Company-operated and franchised restaurants) and debt obligations.In addition, the Company has long-term revenue and cashflow streams that relate to its franchise arrangements. Cashprovided by operations (including cash provided by thesefranchise arrangements) along with the Company’s borrow-ing capacity and other sources of cash will be used to satisfythe obligations. The following table summarizes the Company’scontractual obligations and their aggregate maturities as wellas future minimum rent payments due to the Companyunder existing franchise arrangements as of December 31,2003. (See discussions of cash flows, financial position andcapital resources as well as the Notes to the December 31,2003 consolidated financial statements for further details.)
Contractual cash Contractual cashoutflows inflows
Operating Debt Minimum rent underIN MILLIONS leases obligations(1) franchise arrangements
2004 $ 998 $ 388 $ 1,8042005 939 1,371 1,7612006 877 1,941 1,7152007 815 667 1,6632008 758 851 1,611Thereafter 6,531 4,191 12,987
Total $10,918 $9,409 $21,541
(1) The maturities reflect reclassifications of short-term obligations to long-term obligations of $750 million in 2006 and $500 million thereafter, as they are supported by long-term line of credit agreements. Debt obligations do not include $321 million of SFAS No.133 noncash fair value adjustments.
The Company maintains a nonqualified, unfundedSupplemental Plan that allows participants to make tax-deferred contributions and receive Company-provided allocations that cannot be made under the Profit Sharingand Savings Plan because of Internal Revenue Service limi-tations. The investment alternatives and returns in theSupplemental Plan are based on certain market-rate invest-ment alternatives under the Profit Sharing and SavingsPlan. Total liabilities under the Supplemental Plan were$329 million at December 31, 2003 and $297 million atDecember 31, 2002, and were included in other long-termliabilities in the Consolidated balance sheet.
In addition to long-term obligations, the Company had guaranteed certain affiliate and other loans totaling $89 million at December 31, 2003.
OTHER MATTERS
CRITICAL ACCOUNTING POLICIES AND ESTIMATES Management's discussion and analysis of financial condi-tion and results of operations is based upon the Company'sconsolidated financial statements, which have been pre-pared in accordance with accounting principles generallyaccepted in the U.S. The preparation of these financialstatements requires the Company to make estimates andjudgments that affect the reported amounts of assets, liabili-ties, revenues and expenses as well as related disclosures.On an ongoing basis, the Company evaluates its estimatesand judgments based on historical experience and variousother factors that are believed to be reasonable under thecircumstances. Actual results may differ from these estimatesunder different assumptions or conditions.
The Company reviews its financial reporting and disclo-sure practices and accounting policies quarterly to ensurethat they provide accurate and transparent information relative to the current economic and business environment.The Company believes that of its significant accountingpolicies the following involve a higher degree of judgmentand/or complexity.
Property and equipmentProperty and equipment are depreciated or amortized on a straight-line basis over their useful lives based on manage-ment's estimates of the period over which the assets willgenerate revenue. The useful lives are estimated based onhistorical experience with similar assets, taking into accountanticipated technological or other changes. The Companyperiodically reviews these lives relative to physical factors,economic factors and industry trends. If there are changesin the planned use of property and equipment or if techno-logical changes occur more rapidly than anticipated, the useful lives assigned to these assets may need to be short-ened, resulting in the recognition of increased depreciationand amortization expense in future periods.

16 McDonald’s Corporation
Long-lived assetsLong-lived assets (including goodwill) are reviewed forimpairment annually in the fourth quarter and wheneverevents or changes in circumstances indicate that the carryingamount of an asset may not be recoverable. In assessing therecoverability of the Company's long-lived assets, theCompany considers changes in economic conditions andmakes assumptions regarding estimated future cash flowsand other factors. (The biggest assumption impacting estimated future cash flows is the estimated change in comparable sales.) Estimates of future cash flows are highlysubjective judgments based on the Company's experienceand knowledge of operations. These estimates can be significantly impacted by many factors including changesin global and local business and economic conditions, operating costs, inflation, competition, and consumer anddemographic trends. If the Company's estimates or underly-ing assumptions change in the future, the Company may be required to record impairment charges.
Restructuring and litigation accrualsThe Company has recorded charges related to restructuringmarkets, closing restaurants, eliminating positions andother strategic changes. The accruals recorded included estimates pertaining to employee termination costs, numberof restaurants to be closed and remaining lease obligationsfor closed facilities. Although the Company does not antici-pate significant changes, the actual costs may differ fromthese estimates.
From time to time, the Company is subject to proceedings,lawsuits and other claims related to franchisees, suppliers,employees, customers, competitors and intellectual property.The Company is required to assess the likelihood of anyadverse judgments or outcomes to these matters as well aspotential ranges of probable losses. A determination of theamount of accrual required, if any, for these contingenciesis made after careful analysis of each matter. The requiredaccrual may change in the future due to new developmentsin each matter or changes in approach such as a change in settlement strategy in dealing with these matters. TheCompany does not believe that any such matter will have a material adverse effect on its financial condition or results of operations.
Income taxesThe Company records a valuation allowance to reduce itsdeferred tax assets if it is more likely than not that someportion or all of the deferred assets will not be realized.While the Company has considered future taxable incomeand ongoing prudent and feasible tax strategies in assessingthe need for the valuation allowance, if these estimates andassumptions change in the future, the Company may berequired to adjust its valuation allowance. This could resultin a charge to, or an increase in, income in the period suchdetermination is made.
Deferred U.S. income taxes have not been recorded forbasis differences totaling $4.2 billion related to investmentsin certain foreign subsidiaries or affiliates. The basis differ-ences consist primarily of undistributed earnings consideredpermanently invested in the businesses. If management'sintentions change in the future, deferred taxes may need to be provided.
In addition, the Company operates within multiple taxingjurisdictions and is subject to audit in these jurisdictions.The Company records accruals for the estimated outcomesof these audits, and the accruals may change in the futuredue to new developments in each matter.
EFFECTS OF CHANGING PRICES—INFLATIONThe Company has demonstrated an ability to manage infla-tionary cost increases effectively. This is because of rapidinventory turnover, the ability to adjust menu prices, costcontrols and substantial property holdings—many of whichare at fixed costs and partly financed by debt made lessexpensive by inflation.
FORWARD-LOOKING STATEMENTSCertain forward-looking statements are included in thisreport. They use such words as "may," "will," "expect,""believe," "plan" and other similar terminology. These state-ments reflect management's current expectations regardingfuture events and operating performance and speak only as of March 5, 2004. These forward-looking statementsinvolve a number of risks and uncertainties. The followingare some of the factors that could cause actual results to differ materially from those expressed in or underlying ourforward-looking statements: effectiveness of operating ini-tiatives; success in advertising and promotional efforts;changes in global and local business and economic condi-tions, including their impact on consumer confidence; fluctuations in currency exchange and interest rates; food,labor and other operating costs; political or economic insta-bility in local markets, including the effects of war and terrorist activities; competition, including pricing and marketing initiatives and new product offerings by theCompany's competitors; consumer preferences or percep-tions concerning the Company's product offerings; spendingpatterns and demographic trends; availability of qualifiedrestaurant personnel; severe weather conditions; existenceof positive or negative publicity regarding the Company or its industry generally; effects of legal claims; cost anddeployment of capital; changes in future effective tax rates;changes in governmental regulations; and changes in applicable accounting policies and practices. The foregoinglist of important factors is not all-inclusive.
The Company undertakes no obligation to publiclyupdate or revise any forward-looking statements, whetheras a result of new information, future events or otherwise.
McDonald’s Corporation 17
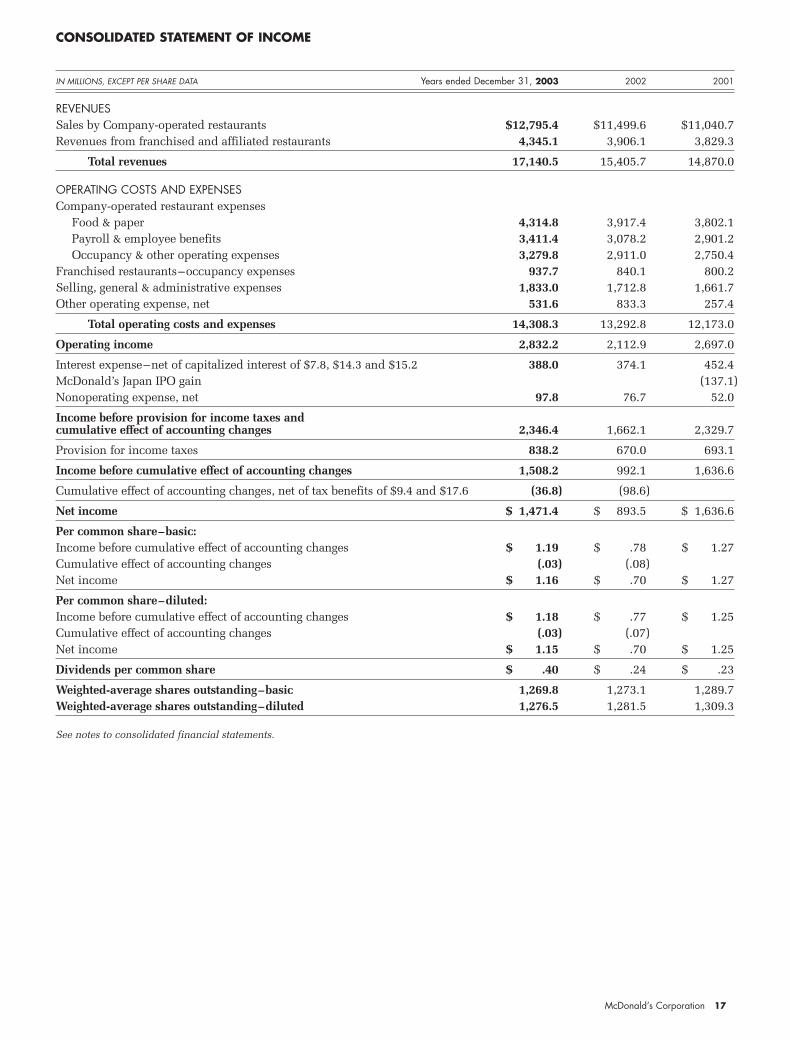
CONSOLIDATED STATEMENT OF INCOME
IN MILLIONS, EXCEPT PER SHARE DATA Years ended December 31, 2003 2002 2001
REVENUESSales by Company-operated restaurants $12,795.4 $11,499.6 $11,040.7Revenues from franchised and affiliated restaurants 4,345.1 3,906.1 3,829.3
Total revenues 17,140.5 15,405.7 14,870.0
OPERATING COSTS AND EXPENSESCompany-operated restaurant expenses
Food & paper 4,314.8 3,917.4 3,802.1Payroll & employee benefits 3,411.4 3,078.2 2,901.2Occupancy & other operating expenses 3,279.8 2,911.0 2,750.4
Franchised restaurants–occupancy expenses 937.7 840.1 800.2Selling, general & administrative expenses 1,833.0 1,712.8 1,661.7Other operating expense, net 531.6 833.3 257.4
Total operating costs and expenses 14,308.3 13,292.8 12,173.0
Operating income 2,832.2 2,112.9 2,697.0
Interest expense–net of capitalized interest of $7.8, $14.3 and $15.2 388.0 374.1 452.4McDonald’s Japan IPO gain (137.1)Nonoperating expense, net 97.8 76.7 52.0
Income before provision for income taxes andcumulative effect of accounting changes 2,346.4 1,662.1 2,329.7
Provision for income taxes 838.2 670.0 693.1
Income before cumulative effect of accounting changes 1,508.2 992.1 1,636.6
Cumulative effect of accounting changes, net of tax benefits of $9.4 and $17.6 (36.8) (98.6)
Net income $ 1,471.4 $ 893.5 $ 1,636.6
Per common share–basic:Income before cumulative effect of accounting changes $ 1.19 $ .78 $ 1.27Cumulative effect of accounting changes (.03) (.08)Net income $ 1.16 $ .70 $ 1.27
Per common share–diluted:Income before cumulative effect of accounting changes $ 1.18 $ .77 $ 1.25Cumulative effect of accounting changes (.03) (.07)Net income $ 1.15 $ .70 $ 1.25
Dividends per common share $ .40 $ .24 $ .23
Weighted-average shares outstanding–basic 1,269.8 1,273.1 1,289.7Weighted-average shares outstanding–diluted 1,276.5 1,281.5 1,309.3
See notes to consolidated financial statements.
18 McDonald’s Corporation
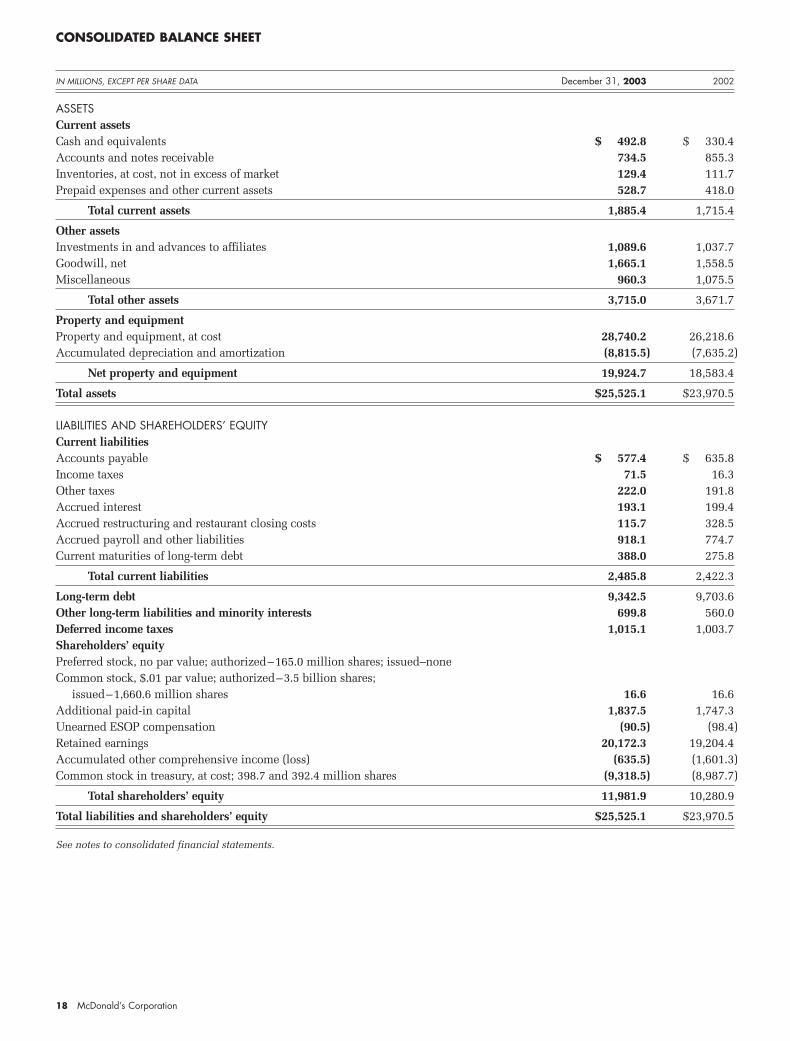
CONSOLIDATED BALANCE SHEET
IN MILLIONS, EXCEPT PER SHARE DATA December 31, 2003 2002
ASSETSCurrent assetsCash and equivalents $ 492.8 $ 330.4Accounts and notes receivable 734.5 855.3Inventories, at cost, not in excess of market 129.4 111.7Prepaid expenses and other current assets 528.7 418.0
Total current assets 1,885.4 1,715.4
Other assetsInvestments in and advances to affiliates 1,089.6 1,037.7Goodwill, net 1,665.1 1,558.5Miscellaneous 960.3 1,075.5
Total other assets 3,715.0 3,671.7
Property and equipmentProperty and equipment, at cost 28,740.2 26,218.6Accumulated depreciation and amortization (8,815.5) (7,635.2)
Net property and equipment 19,924.7 18,583.4
Total assets $25,525.1 $23,970.5
LIABILITIES AND SHAREHOLDERS’ EQUITYCurrent liabilitiesAccounts payable $ 577.4 $ 635.8Income taxes 71.5 16.3Other taxes 222.0 191.8Accrued interest 193.1 199.4Accrued restructuring and restaurant closing costs 115.7 328.5Accrued payroll and other liabilities 918.1 774.7Current maturities of long-term debt 388.0 275.8
Total current liabilities 2,485.8 2,422.3
Long-term debt 9,342.5 9,703.6Other long-term liabilities and minority interests 699.8 560.0Deferred income taxes 1,015.1 1,003.7Shareholders’ equityPreferred stock, no par value; authorized–165.0 million shares; issued–noneCommon stock, $.01 par value; authorized–3.5 billion shares;
issued–1,660.6 million shares 16.6 16.6Additional paid-in capital 1,837.5 1,747.3Unearned ESOP compensation (90.5) (98.4)Retained earnings 20,172.3 19,204.4Accumulated other comprehensive income (loss) (635.5) (1,601.3)Common stock in treasury, at cost; 398.7 and 392.4 million shares (9,318.5) (8,987.7)
Total shareholders’ equity 11,981.9 10,280.9
Total liabilities and shareholders’ equity $25,525.1 $23,970.5
See notes to consolidated financial statements.

McDonald’s Corporation 19
CONSOLIDATED STATEMENT OF CASH FLOWS
IN MILLIONS Years ended December 31, 2003 2002 2001
Operating activitiesNet income $ 1,471.4 $ 893.5 $ 1,636.6Adjustments to reconcile to cash provided by operations
Cumulative effect of accounting changes 36.8 98.6Depreciation and amortization 1,148.2 1,050.8 1,086.3Deferred income taxes 181.4 (44.6) (87.6)Changes in working capital items
Accounts receivable 64.0 1.6 (104.7)Inventories, prepaid expenses and other current assets (30.2) (38.1) (62.9)Accounts payable (77.6) (11.2) 10.2Taxes and other accrued liabilities (147.2) 448.0 270.4
Other (including noncash portion of special items) 622.0 491.5 (60.0)
Cash provided by operations 3,268.8 2,890.1 2,688.3
Investing activitiesProperty and equipment expenditures (1,307.4) (2,003.8) (1,906.2)Purchases of restaurant businesses (375.8) (548.4) (331.6)Sales of restaurant businesses and property 390.6 369.5 375.9Other (77.0) (283.9) (206.3)
Cash used for investing activities (1,369.6) (2,466.6) (2,068.2)
Financing activitiesNet short-term repayments (533.5) (606.8) (248.0)Long-term financing issuances 398.1 1,502.6 1,694.7Long-term financing repayments (756.2) (750.3) (919.4)Treasury stock purchases (391.0) (670.2) (1,068.1)Common stock dividends (503.5) (297.4) (287.7)Other 49.3 310.9 204.8
Cash used for financing activities (1,736.8) (511.2) (623.7)
Cash and equivalents increase (decrease) 162.4 (87.7) (3.6)
Cash and equivalents at beginning of year 330.4 418.1 421.7
Cash and equivalents at end of year $ 492.8 $ 330.4 $ 418.1
Supplemental cash flow disclosuresInterest paid $ 426.9 $ 359.7 $ 446.9Income taxes paid 608.5 572.2 773.8
See notes to consolidated financial statements.

20 McDonald’s Corporation
CONSOLIDATED STATEMENT OF SHAREHOLDERS’ EQUITY
Accumulated otherUnearned comprehensive income (loss)
Common stock Additional ESOP Deferred Foreign Common stock TotalIN MILLIONS, issued paid-in compen- Retained hedging currency in treasury shareholders’EXCEPT PER SHARE DATA Shares Amount capital sation earnings adjustment translation Shares Amount equity
Balance at December 31, 2000 1,660.6 $16.6 $1,441.8 $(115.0) $17,259.4 $ – $(1,287.3) (355.7) $(8,111.1) $ 9,204.4
Net income 1,636.6 1,636.6
Translation adjustments (including taxes of $65.7) (412.2) (412.2)
SFAS No.133 transition adjustment(including tax benefits of $9.2) (17.0) (17.0)
Fair value adjustments–cash flowhedges (including taxes of $1.4) 7.7 7.7
Comprehensive income 1,215.1
Common stock cash dividends ($.23 per share) (287.7) (287.7)
ESOP loan payment 8.0 8.0
Treasury stock purchases (36.1) (1,090.2) (1,090.2)
Common equity put option issuances and expirations, netand forward contracts 199.2 199.2
Stock option exercises and other (including tax benefits of $70.0) 149.4 0.3 11.9 89.9 239.6
Balance at December 31, 2001 1,660.6 16.6 1,591.2 (106.7) 18,608.3 (9.3) (1,699.5) (379.9) (8,912.2) 9,488.4
Net income 893.5 893.5
Translation adjustments (including tax benefits of $150.5) 106.7 106.7
Fair value adjustments–cash flowhedges (including tax benefits of $3.5) 0.8 0.8
Comprehensive income 1,001.0
Common stock cash dividends ($.24 per share) (297.4) (297.4)
ESOP loan payment 7.4 7.4
Treasury stock purchases (25.6) (686.9) (686.9)
Common equity put option expirations and forward contracts settled 500.8 500.8
Stock option exercises and other (including tax benefits of $61.3) 156.1 0.9 13.1 110.6 267.6
Balance at December 31, 2002 1,660.6 16.6 1,747.3 (98.4) 19,204.4 (8.5) (1,592.8) (392.4) (8,987.7) 10,280.9
Net income 1,471.4 1,471.4
Translation adjustments (including tax benefits of $203.2) 957.8 957.8
Fair value adjustments–cash flowhedges (including taxes of $1.6) 8.0 8.0
Comprehensive income 2,437.2
Common stock cash dividends ($.40 per share) (503.5) (503.5)
ESOP loan payment 7.2 7.2
Treasury stock purchases (18.9) (438.7) (438.7)
Stock option exercises and other (including tax benefits of $20.5) 90.2 0.7 12.6 107.9 198.8
Balance at December 31, 2003 1,660.6 $16.6 $1,837.5 $ (90.5) $20,172.3 $ (0.5) $ (635.0) (398.7) $(9,318.5) $11,981.9
See notes to consolidated financial statements.
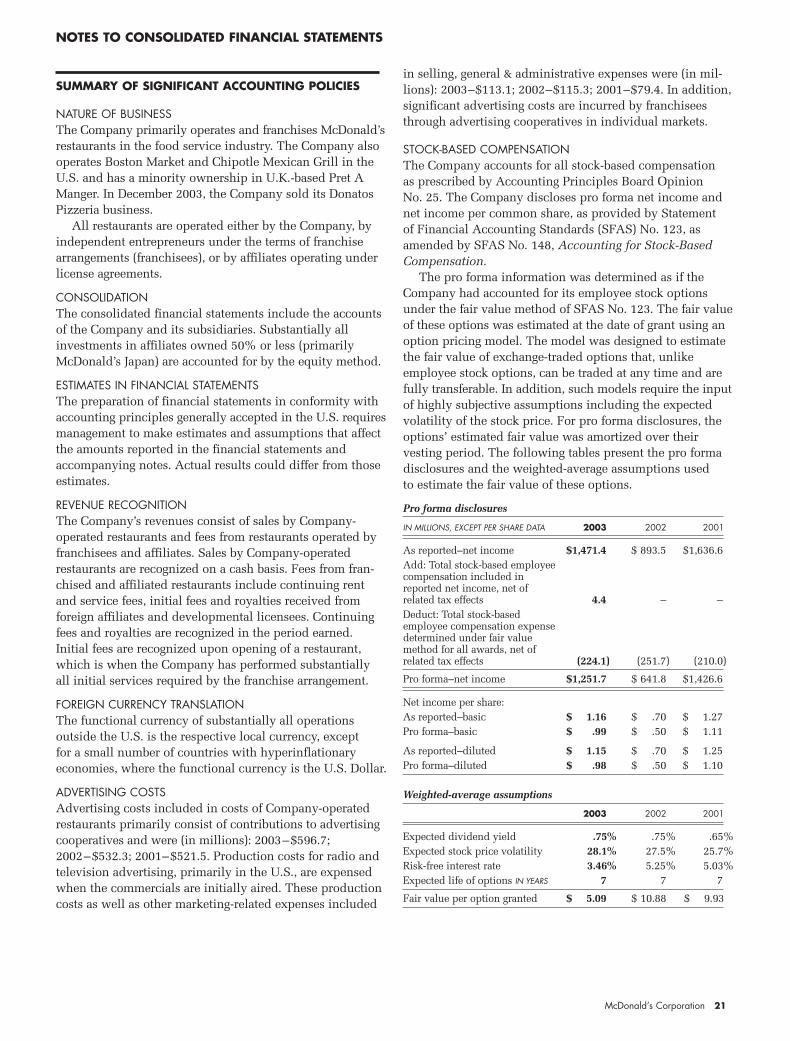
McDonald’s Corporation 21
SUMMARY OF SIGNIFICANT ACCOUNTING POLICIES
NATURE OF BUSINESSThe Company primarily operates and franchises McDonald’srestaurants in the food service industry. The Company alsooperates Boston Market and Chipotle Mexican Grill in theU.S. and has a minority ownership in U.K.-based Pret AManger. In December 2003, the Company sold its DonatosPizzeria business.
All restaurants are operated either by the Company, byindependent entrepreneurs under the terms of franchisearrangements (franchisees), or by affiliates operating underlicense agreements.
CONSOLIDATIONThe consolidated financial statements include the accountsof the Company and its subsidiaries. Substantially allinvestments in affiliates owned 50% or less (primarilyMcDonald’s Japan) are accounted for by the equity method.
ESTIMATES IN FINANCIAL STATEMENTSThe preparation of financial statements in conformity withaccounting principles generally accepted in the U.S. requiresmanagement to make estimates and assumptions that affectthe amounts reported in the financial statements andaccompanying notes. Actual results could differ from thoseestimates.
REVENUE RECOGNITIONThe Company’s revenues consist of sales by Company-operated restaurants and fees from restaurants operated by franchisees and affiliates. Sales by Company-operatedrestaurants are recognized on a cash basis. Fees from fran-chised and affiliated restaurants include continuing rentand service fees, initial fees and royalties received from foreign affiliates and developmental licensees. Continuingfees and royalties are recognized in the period earned.Initial fees are recognized upon opening of a restaurant,which is when the Company has performed substantiallyall initial services required by the franchise arrangement.
FOREIGN CURRENCY TRANSLATIONThe functional currency of substantially all operations outside the U.S. is the respective local currency, except for a small number of countries with hyperinflationaryeconomies, where the functional currency is the U.S. Dollar.
ADVERTISING COSTSAdvertising costs included in costs of Company-operatedrestaurants primarily consist of contributions to advertisingcooperatives and were (in millions): 2003–$596.7;2002–$532.3; 2001–$521.5. Production costs for radio andtelevision advertising, primarily in the U.S., are expensedwhen the commercials are initially aired. These productioncosts as well as other marketing-related expenses included
in selling, general & administrative expenses were (in mil-lions): 2003–$113.1; 2002–$115.3; 2001–$79.4. In addition,significant advertising costs are incurred by franchiseesthrough advertising cooperatives in individual markets.
STOCK-BASED COMPENSATIONThe Company accounts for all stock-based compensation as prescribed by Accounting Principles Board Opinion No. 25. The Company discloses pro forma net income andnet income per common share, as provided by Statement of Financial Accounting Standards (SFAS) No. 123, asamended by SFAS No. 148, Accounting for Stock-BasedCompensation.
The pro forma information was determined as if theCompany had accounted for its employee stock optionsunder the fair value method of SFAS No. 123. The fair valueof these options was estimated at the date of grant using anoption pricing model. The model was designed to estimatethe fair value of exchange-traded options that, unlikeemployee stock options, can be traded at any time and arefully transferable. In addition, such models require the inputof highly subjective assumptions including the expectedvolatility of the stock price. For pro forma disclosures, theoptions’ estimated fair value was amortized over their vesting period. The following tables present the pro formadisclosures and the weighted-average assumptions used to estimate the fair value of these options.
Pro forma disclosures
IN MILLIONS, EXCEPT PER SHARE DATA 2003 2002 2001
As reported–net income $1,471.4 $ 893.5 $1,636.6Add: Total stock-based employee compensation included in reported net income, net of related tax effects 4.4 – –Deduct: Total stock-based employee compensation expense determined under fair value method for all awards, net of related tax effects (224.1) (251.7) (210.0)
Pro forma–net income $1,251.7 $ 641.8 $1,426.6
Net income per share:As reported–basic $ 1.16 $ .70 $ 1.27Pro forma–basic $ .99 $ .50 $ 1.11
As reported–diluted $ 1.15 $ .70 $ 1.25Pro forma–diluted $ .98 $ .50 $ 1.10
Weighted-average assumptions
2003 2002 2001
Expected dividend yield .75% .75% .65%Expected stock price volatility 28.1% 27.5% 25.7%Risk-free interest rate 3.46% 5.25% 5.03%Expected life of options IN YEARS 7 7 7
Fair value per option granted $ 5.09 $ 10.88 $ 9.93
NOTES TO CONSOLIDATED FINANCIAL STATEMENTS
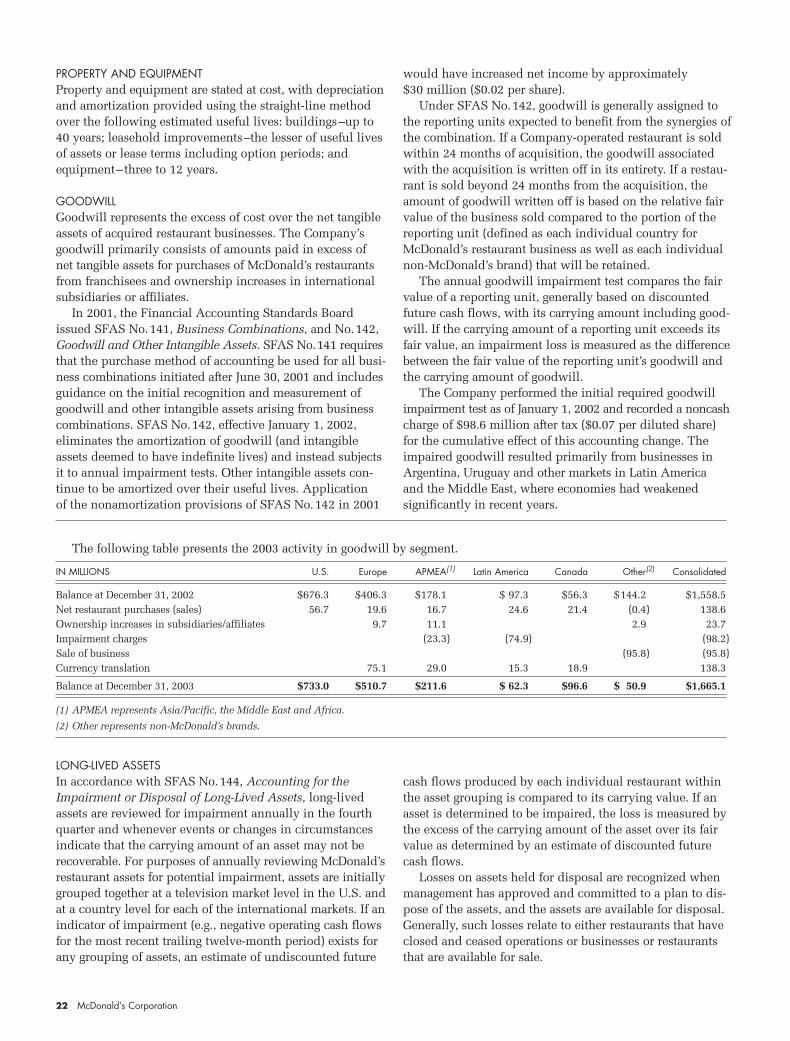
22 McDonald’s Corporation
PROPERTY AND EQUIPMENTProperty and equipment are stated at cost, with depreciationand amortization provided using the straight-line methodover the following estimated useful lives: buildings–up to40 years; leasehold improvements–the lesser of useful livesof assets or lease terms including option periods; and equipment–three to 12 years.
GOODWILLGoodwill represents the excess of cost over the net tangibleassets of acquired restaurant businesses. The Company’sgoodwill primarily consists of amounts paid in excess of net tangible assets for purchases of McDonald’s restaurantsfrom franchisees and ownership increases in internationalsubsidiaries or affiliates.
In 2001, the Financial Accounting Standards Boardissued SFAS No.141, Business Combinations, and No.142,Goodwill and Other Intangible Assets. SFAS No.141 requiresthat the purchase method of accounting be used for all busi-ness combinations initiated after June 30, 2001 and includesguidance on the initial recognition and measurement ofgoodwill and other intangible assets arising from businesscombinations. SFAS No.142, effective January 1, 2002,eliminates the amortization of goodwill (and intangibleassets deemed to have indefinite lives) and instead subjectsit to annual impairment tests. Other intangible assets con-tinue to be amortized over their useful lives. Application of the nonamortization provisions of SFAS No.142 in 2001
would have increased net income by approximately $30 million ($0.02 per share).
Under SFAS No.142, goodwill is generally assigned tothe reporting units expected to benefit from the synergies ofthe combination. If a Company-operated restaurant is soldwithin 24 months of acquisition, the goodwill associatedwith the acquisition is written off in its entirety. If a restau-rant is sold beyond 24 months from the acquisition, theamount of goodwill written off is based on the relative fairvalue of the business sold compared to the portion of thereporting unit (defined as each individual country forMcDonald’s restaurant business as well as each individualnon-McDonald’s brand) that will be retained.
The annual goodwill impairment test compares the fairvalue of a reporting unit, generally based on discountedfuture cash flows, with its carrying amount including good-will. If the carrying amount of a reporting unit exceeds itsfair value, an impairment loss is measured as the differencebetween the fair value of the reporting unit’s goodwill andthe carrying amount of goodwill.
The Company performed the initial required goodwillimpairment test as of January 1, 2002 and recorded a noncashcharge of $98.6 million after tax ($0.07 per diluted share)for the cumulative effect of this accounting change. Theimpaired goodwill resulted primarily from businesses inArgentina, Uruguay and other markets in Latin America and the Middle East, where economies had weakened significantly in recent years.
LONG-LIVED ASSETSIn accordance with SFAS No.144, Accounting for theImpairment or Disposal of Long-Lived Assets, long-livedassets are reviewed for impairment annually in the fourthquarter and whenever events or changes in circumstancesindicate that the carrying amount of an asset may not berecoverable. For purposes of annually reviewing McDonald’srestaurant assets for potential impairment, assets are initiallygrouped together at a television market level in the U.S. andat a country level for each of the international markets. If anindicator of impairment (e.g., negative operating cash flowsfor the most recent trailing twelve-month period) exists forany grouping of assets, an estimate of undiscounted future
cash flows produced by each individual restaurant withinthe asset grouping is compared to its carrying value. If anasset is determined to be impaired, the loss is measured bythe excess of the carrying amount of the asset over its fairvalue as determined by an estimate of discounted futurecash flows.
Losses on assets held for disposal are recognized whenmanagement has approved and committed to a plan to dis-pose of the assets, and the assets are available for disposal.Generally, such losses relate to either restaurants that haveclosed and ceased operations or businesses or restaurantsthat are available for sale.
The following table presents the 2003 activity in goodwill by segment.
IN MILLIONS U.S. Europe APMEA(1) Latin America Canada Other(2) Consolidated
Balance at December 31, 2002 $676.3 $406.3 $178.1 $ 97.3 $56.3 $144.2 $1,558.5Net restaurant purchases (sales) 56.7 19.6 16.7 24.6 21.4 (0.4) 138.6Ownership increases in subsidiaries/affiliates 9.7 11.1 2.9 23.7Impairment charges (23.3) (74.9) (98.2)Sale of business (95.8) (95.8)Currency translation 75.1 29.0 15.3 18.9 138.3
Balance at December 31, 2003 $733.0 $510.7 $211.6 $ 62.3 $96.6 $ 50.9 $1,665.1
(1) APMEA represents Asia/Pacific, the Middle East and Africa.
(2) Other represents non-McDonald’s brands.

McDonald’s Corporation 23
FINANCIAL INSTRUMENTS The Company generally borrows on a long-term basis and isexposed to the impact of interest rate changes and foreigncurrency fluctuations. The Company uses foreign currencydenominated debt and derivative instruments to manage theimpact of these changes. The Company does not use deriva-tives with a level of complexity or with a risk higher thanthe exposures to be hedged and does not hold or issuederivatives for trading purposes.
The counterparties to these agreements consist of a diversegroup of financial institutions. The Company continuallymonitors its positions and the credit ratings of its counter-parties and adjusts positions as appropriate. The Companydid not have significant exposure to any individual counter-party at December 31, 2003 and has master agreements thatcontain netting arrangements. Certain of these agreementsalso require each party to post collateral if credit ratings fallbelow or aggregate exposures exceed certain contractuallimits. At December 31, 2003, the Company was required topost collateral of $11.6 million, and at December 31, 2002,collateral of $2.2 million was posted by a counterparty.
Effective January 1, 2001, the Company adopted SFASNo.133, Accounting for Derivative Instruments and HedgingActivities, as amended. SFAS No.133 requires companies torecognize all derivatives as either assets or liabilities in thebalance sheet at fair value. SFAS No.133 also requires com-panies to designate all derivatives that qualify as hedginginstruments as either fair value hedges, cash flow hedges orhedges of net investments in foreign operations. This desig-nation is based upon the exposure being hedged.
The Company recorded a transition adjustment atJanuary 1, 2001 related to cash flow hedges, which reducedaccumulated other comprehensive income in shareholders'equity by $17.0 million, after tax. This adjustment was pri-marily related to interest rate exchange agreements used tolock in long-term borrowing rates. The cumulative effect ofadopting SFAS No.133 at January 1, 2001 was not materialto the Company's Consolidated statement of income.
All derivatives, primarily interest rate exchange agree-ments and foreign currency exchange agreements, wereclassified in the Company's Consolidated balance sheet atDecember 31, 2003 and 2002 respectively, as follows: miscellaneous other assets–$102.4 million and $133.9 mil-lion; other long-term liabilities (excluding accrued interest)–$135.5 million and $39.2 million; and accrued payroll andother liabilities–$29.2 million and $23.8 million.
There was no significant impact to the Company’s earn-ings related to the ineffective portion of any hedging instru-ments for the three years ended December 31, 2003.
Fair value hedges The Company enters into fair value hedges to reduce theexposure to changes in the fair values of certain assets or liabilities. The types of fair value hedges the Companyenters into include: (1) interest rate exchange agreements to convert a portion of its fixed-rate debt to floating-ratedebt and (2) foreign currency exchange agreements for the exchange of various currencies and interest rates.
The foreign currency exchange agreements are entered intoto hedge the currency risk associated with debt and inter-company loans denominated in foreign currencies, andessentially result in floating-rate assets or liabilities denomi-nated in U.S. Dollars or appropriate functional currencies.
For fair value hedges, the gains or losses on derivativesas well as the offsetting gains or losses on the relatedhedged items are recognized in current earnings.
Cash flow hedgesThe Company enters into cash flow hedges to reduce theexposure to variability in certain expected future cashflows. The types of cash flow hedges the Company entersinto include: (1) interest rate exchange agreements that effec-tively convert a portion of floating-rate debt to fixed-ratedebt and are designed to reduce the impact of interest ratechanges on future interest expense, (2) forward foreignexchange contracts and foreign currency options that aredesigned to protect against the reduction in value of fore-casted foreign currency cash flows such as royalties andother payments denominated in foreign currencies, and (3) foreign currency exchange agreements for the exchangeof various currencies and interest rates. The foreign currencyexchange agreements hedge the currency risk associatedwith debt and intercompany loans denominated in foreigncurrencies, and essentially result in fixed-rate assets or liabilities denominated in U.S. Dollars or appropriate functional currencies.
For cash flow hedges, the effective portion of the gains or losses on derivatives is reported in the deferred hedgingadjustment component of accumulated other comprehen-sive income in shareholders' equity and reclassified intoearnings in the same period or periods in which the hedgedtransaction affects earnings. The remaining gain or loss inexcess of the cumulative change in the present value offuture cash flows of the hedged item, if any, is recognizedin earnings during the period of change.
The Company recorded net increases to the deferredhedging adjustment component of accumulated other com-prehensive income in shareholders’ equity of $8.0 million,$0.8 million and $7.7 million, after tax, related to cash flowhedges during the years ended December 31, 2003, 2002and 2001, respectively. Based on interest rates and foreigncurrency exchange rates at December 31, 2003, no signifi-cant amount of deferred hedging adjustments, after tax,included in accumulated other comprehensive income inshareholders' equity at December 31, 2003 will be recog-nized in earnings in 2004 as the underlying hedged transac-tions are realized. The maximum maturity date of any cashflow hedge of forecasted transactions at December 31, 2003was 24 months, excluding instruments hedging forecastedpayments of variable interest on existing financial instru-ments that have various maturity dates through 2015.
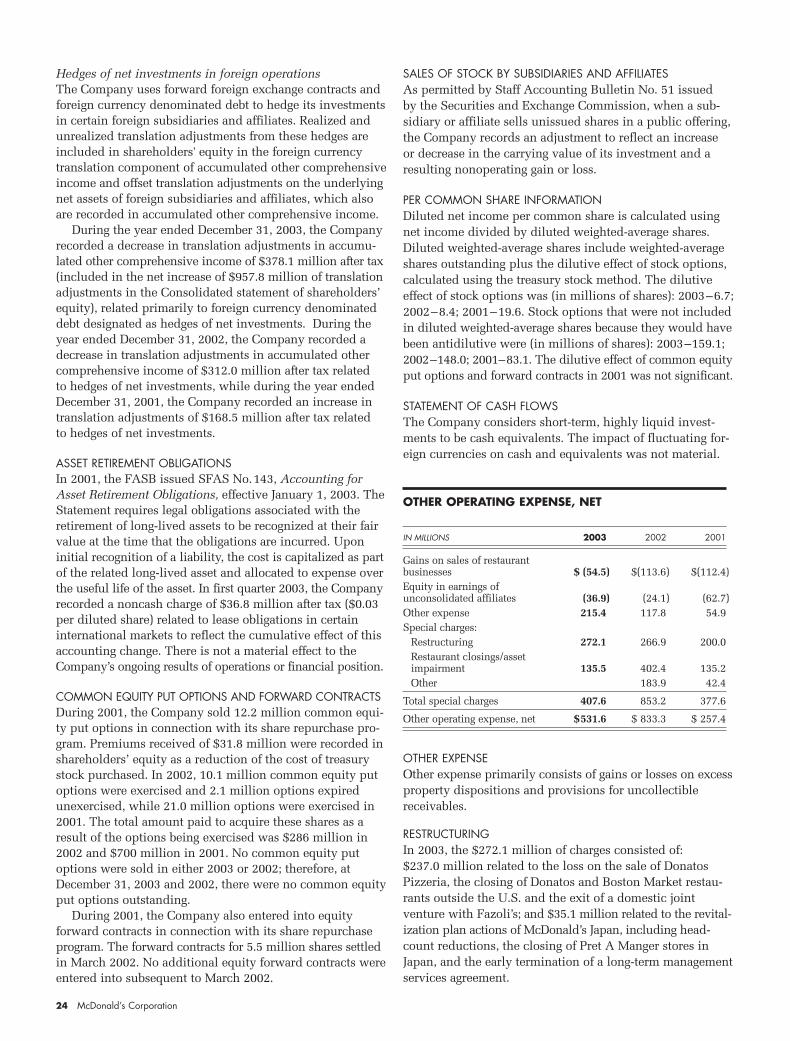
24 McDonald’s Corporation
Hedges of net investments in foreign operationsThe Company uses forward foreign exchange contracts andforeign currency denominated debt to hedge its investmentsin certain foreign subsidiaries and affiliates. Realized andunrealized translation adjustments from these hedges areincluded in shareholders' equity in the foreign currencytranslation component of accumulated other comprehensiveincome and offset translation adjustments on the underlyingnet assets of foreign subsidiaries and affiliates, which alsoare recorded in accumulated other comprehensive income.
During the year ended December 31, 2003, the Companyrecorded a decrease in translation adjustments in accumu-lated other comprehensive income of $378.1 million after tax(included in the net increase of $957.8 million of translationadjustments in the Consolidated statement of shareholders’equity), related primarily to foreign currency denominateddebt designated as hedges of net investments. During theyear ended December 31, 2002, the Company recorded adecrease in translation adjustments in accumulated othercomprehensive income of $312.0 million after tax related to hedges of net investments, while during the year endedDecember 31, 2001, the Company recorded an increase intranslation adjustments of $168.5 million after tax related to hedges of net investments.
ASSET RETIREMENT OBLIGATIONSIn 2001, the FASB issued SFAS No.143, Accounting forAsset Retirement Obligations, effective January 1, 2003. TheStatement requires legal obligations associated with theretirement of long-lived assets to be recognized at their fairvalue at the time that the obligations are incurred. Upon initial recognition of a liability, the cost is capitalized as partof the related long-lived asset and allocated to expense overthe useful life of the asset. In first quarter 2003, the Companyrecorded a noncash charge of $36.8 million after tax ($0.03per diluted share) related to lease obligations in certaininternational markets to reflect the cumulative effect of thisaccounting change. There is not a material effect to theCompany’s ongoing results of operations or financial position.
COMMON EQUITY PUT OPTIONS AND FORWARD CONTRACTSDuring 2001, the Company sold 12.2 million common equi-ty put options in connection with its share repurchase pro-gram. Premiums received of $31.8 million were recorded inshareholders’ equity as a reduction of the cost of treasurystock purchased. In 2002, 10.1 million common equity putoptions were exercised and 2.1 million options expiredunexercised, while 21.0 million options were exercised in2001. The total amount paid to acquire these shares as aresult of the options being exercised was $286 million in2002 and $700 million in 2001. No common equity putoptions were sold in either 2003 or 2002; therefore, atDecember 31, 2003 and 2002, there were no common equityput options outstanding.
During 2001, the Company also entered into equity forward contracts in connection with its share repurchaseprogram. The forward contracts for 5.5 million shares settledin March 2002. No additional equity forward contracts wereentered into subsequent to March 2002.
SALES OF STOCK BY SUBSIDIARIES AND AFFILIATESAs permitted by Staff Accounting Bulletin No. 51 issued by the Securities and Exchange Commission, when a sub-sidiary or affiliate sells unissued shares in a public offering,the Company records an adjustment to reflect an increase or decrease in the carrying value of its investment and aresulting nonoperating gain or loss.
PER COMMON SHARE INFORMATIONDiluted net income per common share is calculated usingnet income divided by diluted weighted-average shares.Diluted weighted-average shares include weighted-averageshares outstanding plus the dilutive effect of stock options,calculated using the treasury stock method. The dilutiveeffect of stock options was (in millions of shares): 2003–6.7;2002–8.4; 2001–19.6. Stock options that were not includedin diluted weighted-average shares because they would havebeen antidilutive were (in millions of shares): 2003–159.1;2002–148.0; 2001–83.1. The dilutive effect of common equityput options and forward contracts in 2001 was not significant.
STATEMENT OF CASH FLOWSThe Company considers short-term, highly liquid invest-ments to be cash equivalents. The impact of fluctuating for-eign currencies on cash and equivalents was not material.
OTHER OPERATING EXPENSE, NET
IN MILLIONS 2003 2002 2001
Gains on sales of restaurant businesses $ (54.5) $(113.6) $(112.4)Equity in earnings of unconsolidated affiliates (36.9) (24.1) (62.7)Other expense 215.4 117.8 54.9Special charges:
Restructuring 272.1 266.9 200.0Restaurant closings/asset impairment 135.5 402.4 135.2Other 183.9 42.4
Total special charges 407.6 853.2 377.6
Other operating expense, net $531.6 $ 833.3 $ 257.4
OTHER EXPENSEOther expense primarily consists of gains or losses on excessproperty dispositions and provisions for uncollectiblereceivables.
RESTRUCTURINGIn 2003, the $272.1 million of charges consisted of: $237.0 million related to the loss on the sale of DonatosPizzeria, the closing of Donatos and Boston Market restau-rants outside the U.S. and the exit of a domestic joint venture with Fazoli’s; and $35.1 million related to the revital-ization plan actions of McDonald’s Japan, including head-count reductions, the closing of Pret A Manger stores inJapan, and the early termination of a long-term managementservices agreement.
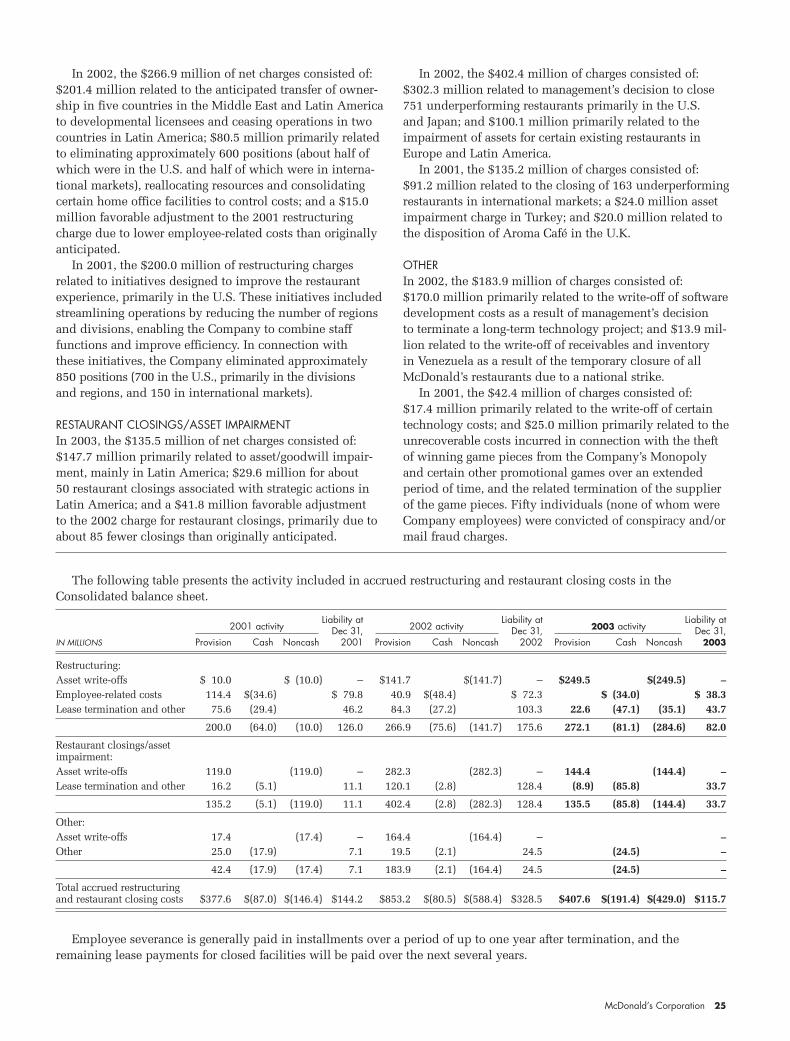
McDonald’s Corporation 25
In 2002, the $266.9 million of net charges consisted of:$201.4 million related to the anticipated transfer of owner-ship in five countries in the Middle East and Latin Americato developmental licensees and ceasing operations in twocountries in Latin America; $80.5 million primarily relatedto eliminating approximately 600 positions (about half ofwhich were in the U.S. and half of which were in interna-tional markets), reallocating resources and consolidatingcertain home office facilities to control costs; and a $15.0million favorable adjustment to the 2001 restructuringcharge due to lower employee-related costs than originallyanticipated.
In 2001, the $200.0 million of restructuring charges related to initiatives designed to improve the restaurantexperience, primarily in the U.S. These initiatives includedstreamlining operations by reducing the number of regionsand divisions, enabling the Company to combine staff functions and improve efficiency. In connection with these initiatives, the Company eliminated approximately850 positions (700 in the U.S., primarily in the divisions and regions, and 150 in international markets).
RESTAURANT CLOSINGS/ASSET IMPAIRMENTIn 2003, the $135.5 million of net charges consisted of:$147.7 million primarily related to asset/goodwill impair-ment, mainly in Latin America; $29.6 million for about 50 restaurant closings associated with strategic actions inLatin America; and a $41.8 million favorable adjustment to the 2002 charge for restaurant closings, primarily due toabout 85 fewer closings than originally anticipated.
In 2002, the $402.4 million of charges consisted of:$302.3 million related to management’s decision to close751 underperforming restaurants primarily in the U.S. and Japan; and $100.1 million primarily related to theimpairment of assets for certain existing restaurants inEurope and Latin America.
In 2001, the $135.2 million of charges consisted of: $91.2 million related to the closing of 163 underperformingrestaurants in international markets; a $24.0 million assetimpairment charge in Turkey; and $20.0 million related tothe disposition of Aroma Café in the U.K.
OTHERIn 2002, the $183.9 million of charges consisted of: $170.0 million primarily related to the write-off of softwaredevelopment costs as a result of management’s decision to terminate a long-term technology project; and $13.9 mil-lion related to the write-off of receivables and inventory in Venezuela as a result of the temporary closure of allMcDonald’s restaurants due to a national strike.
In 2001, the $42.4 million of charges consisted of: $17.4 million primarily related to the write-off of certaintechnology costs; and $25.0 million primarily related to theunrecoverable costs incurred in connection with the theft of winning game pieces from the Company’s Monopoly and certain other promotional games over an extended period of time, and the related termination of the supplierof the game pieces. Fifty individuals (none of whom wereCompany employees) were convicted of conspiracy and/ormail fraud charges.
The following table presents the activity included in accrued restructuring and restaurant closing costs in theConsolidated balance sheet.
Liability at Liability at Liability at2001 activity Dec 31, 2002 activity Dec 31, 2003 activity Dec 31,
IN MILLIONS Provision Cash Noncash 2001 Provision Cash Noncash 2002 Provision Cash Noncash 2003
Restructuring:Asset write-offs $ 10.0 $ (10.0) – $141.7 $(141.7) – $249.5 $(249.5) –Employee-related costs 114.4 $(34.6) $ 79.8 40.9 $(48.4) $ 72.3 $ (34.0) $ 38.3Lease termination and other 75.6 (29.4) 46.2 84.3 (27.2) 103.3 22.6 (47.1) (35.1) 43.7
200.0 (64.0) (10.0) 126.0 266.9 (75.6) (141.7) 175.6 272.1 (81.1) (284.6) 82.0
Restaurant closings/asset impairment:Asset write-offs 119.0 (119.0) – 282.3 (282.3) – 144.4 (144.4) –Lease termination and other 16.2 (5.1) 11.1 120.1 (2.8) 128.4 (8.9) (85.8) 33.7
135.2 (5.1) (119.0) 11.1 402.4 (2.8) (282.3) 128.4 135.5 (85.8) (144.4) 33.7
Other:Asset write-offs 17.4 (17.4) – 164.4 (164.4) – –Other 25.0 (17.9) 7.1 19.5 (2.1) 24.5 (24.5) –
42.4 (17.9) (17.4) 7.1 183.9 (2.1) (164.4) 24.5 (24.5) –
Total accrued restructuring and restaurant closing costs $377.6 $(87.0) $(146.4) $144.2 $853.2 $(80.5) $(588.4) $328.5 $407.6 $(191.4) $(429.0) $115.7
Employee severance is generally paid in installments over a period of up to one year after termination, and the remaining lease payments for closed facilities will be paid over the next several years.

26 McDonald’s Corporation
McDONALD’S JAPAN INITIAL PUBLIC OFFERING (IPO) GAIN
In 2001, McDonald’s Japan, the Company’s 50%-ownedaffiliate, completed an IPO of 12 million shares. The Companyrecorded a $137.1 million gain (pre and after tax) in nonop-erating income to reflect an increase in the carrying value of its investment as a result of the cash proceeds from theIPO received by McDonald’s Japan.
FRANCHISE ARRANGEMENTS
Individual franchise arrangements generally include a leaseand a license and provide for payment of initial fees, aswell as continuing rent and service fees to the Companybased upon a percent of sales with minimum rent payments.McDonald’s franchisees are granted the right to operate arestaurant using the McDonald's system and, in most cases,the use of a restaurant facility, generally for a period of 20 years. Franchisees pay related occupancy costs includingproperty taxes, insurance and maintenance. In addition,franchisees outside the U.S. generally pay a refundable,noninterest-bearing security deposit. Foreign affiliates anddevelopmental licensees pay a royalty to the Companybased upon a percent of sales.
The results of operations of restaurant businesses pur-chased and sold in transactions with franchisees, affiliatesand others were not material to the consolidated financialstatements for periods prior to purchase and sale.
Revenues from franchised and affiliated restaurants con-sisted of:
IN MILLIONS 2003 2002 2001
Minimum rents $1,600.3 $1,479.9 $1,477.9Percent rent and service fees 2,701.8 2,375.1 2,290.2Initial fees 43.0 51.1 61.2
Revenues from franchised and affiliated restaurants $4,345.1 $3,906.1 $3,829.3
Future minimum rent payments due to the Companyunder existing franchise arrangements are:
IN MILLIONS Owned sites Leased sites Total
2004 $ 1,035.6 $ 768.5 $ 1,804.12005 1,014.5 746.5 1,761.02006 990.1 724.4 1,714.52007 958.5 705.0 1,663.52008 926.1 684.8 1,610.9Thereafter 7,495.4 5,491.3 12,986.7
Total minimum payments $12,420.2 $9,120.5 $21,540.7
At December 31, 2003, net property and equipment underfranchise arrangements totaled $10.4 billion (including landof $3.0 billion) after deducting accumulated depreciationand amortization of $4.5 billion.
LEASING ARRANGEMENTS
At December 31, 2003, the Company was lessee at 6,781restaurant locations through ground leases (the Companyleases the land and the Company or franchisee owns thebuilding) and at 8,070 restaurant locations through improvedleases (the Company leases land and buildings). Lease terms for most restaurants are generally for 20 to 25 yearsand, in many cases, provide for rent escalations and renewaloptions, with certain leases providing purchase options. For most locations, the Company is obligated for the relatedoccupancy costs including property taxes, insurance andmaintenance. However, for franchised sites, the Companyrequires the franchisees to pay these costs. In addition, theCompany is lessee under noncancelable leases covering cer-tain offices and vehicles.
Future minimum payments required under existingoperating leases with initial terms of one year or more are:
IN MILLIONS Restaurant Other Total
2004 $ 930.9 $ 67.1 $ 998.02005 884.5 55.0 939.52006 831.2 45.4 876.62007 777.0 37.7 814.72008 725.9 31.8 757.7Thereafter 6,358.8 172.7 6,531.5
Total minimum payments $10,508.3 $409.7 $10,918.0
The following table provides detail of rent expense:
IN MILLIONS 2003 2002 2001
Company-operated restaurants:U.S. $ 136.9 $ 124.0 $115.5Outside the U.S. 398.4 358.4 326.1
Total $ 535.3 $ 482.4 $441.6
Franchised restaurants:U.S. $ 279.6 $ 254.4 $239.7Outside the U.S. 250.7 210.9 195.2
Total $ 530.3 $ 465.3 $434.9
Other 87.3 84.8 82.1
Total rent expense $1,152.9 $1,032.5 $958.6
Rent expense included percent rents in excess of mini-mum rents (in millions) as follows—Company-operatedrestaurants: 2003–$73.2; 2002–$64.1; 2001–$57.6.Franchised restaurants: 2003–$80.3; 2002–$67.2;2001–$62.0.
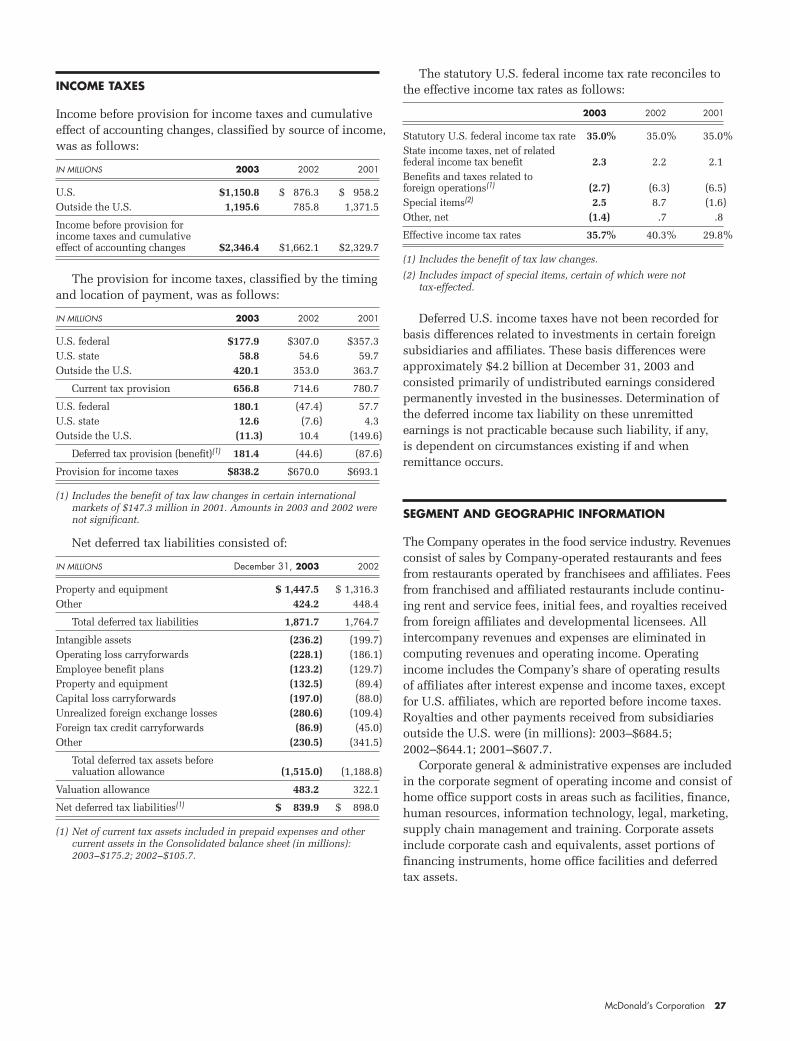
McDonald’s Corporation 27
INCOME TAXES
Income before provision for income taxes and cumulativeeffect of accounting changes, classified by source of income,was as follows:
IN MILLIONS 2003 2002 2001
U.S. $1,150.8 $ 876.3 $ 958.2Outside the U.S. 1,195.6 785.8 1,371.5
Income before provision for income taxes and cumulative effect of accounting changes $2,346.4 $1,662.1 $2,329.7
The provision for income taxes, classified by the timingand location of payment, was as follows:
IN MILLIONS 2003 2002 2001
U.S. federal $177.9 $307.0 $357.3U.S. state 58.8 54.6 59.7Outside the U.S. 420.1 353.0 363.7
Current tax provision 656.8 714.6 780.7
U.S. federal 180.1 (47.4) 57.7U.S. state 12.6 (7.6) 4.3Outside the U.S. (11.3) 10.4 (149.6)
Deferred tax provision (benefit)(1) 181.4 (44.6) (87.6)
Provision for income taxes $838.2 $670.0 $693.1
(1) Includes the benefit of tax law changes in certain international markets of $147.3 million in 2001. Amounts in 2003 and 2002 werenot significant.
Net deferred tax liabilities consisted of:
IN MILLIONS December 31, 2003 2002
Property and equipment $ 1,447.5 $ 1,316.3Other 424.2 448.4
Total deferred tax liabilities 1,871.7 1,764.7
Intangible assets (236.2) (199.7)Operating loss carryforwards (228.1) (186.1)Employee benefit plans (123.2) (129.7)Property and equipment (132.5) (89.4)Capital loss carryforwards (197.0) (88.0)Unrealized foreign exchange losses (280.6) (109.4)Foreign tax credit carryforwards (86.9) (45.0)Other (230.5) (341.5)
Total deferred tax assets before valuation allowance (1,515.0) (1,188.8)
Valuation allowance 483.2 322.1
Net deferred tax liabilities(1) $ 839.9 $ 898.0
(1) Net of current tax assets included in prepaid expenses and other current assets in the Consolidated balance sheet (in millions):2003–$175.2; 2002–$105.7.
The statutory U.S. federal income tax rate reconciles tothe effective income tax rates as follows:
2003 2002 2001
Statutory U.S. federal income tax rate 35.0% 35.0% 35.0%State income taxes, net of related federal income tax benefit 2.3 2.2 2.1Benefits and taxes related to foreign operations(1) (2.7) (6.3) (6.5)Special items(2) 2.5 8.7 (1.6)Other, net (1.4) .7 .8
Effective income tax rates 35.7% 40.3% 29.8%
(1) Includes the benefit of tax law changes.
(2) Includes impact of special items, certain of which were not tax-effected.
Deferred U.S. income taxes have not been recorded forbasis differences related to investments in certain foreign subsidiaries and affiliates. These basis differences wereapproximately $4.2 billion at December 31, 2003 and consisted primarily of undistributed earnings consideredpermanently invested in the businesses. Determination ofthe deferred income tax liability on these unremitted earnings is not practicable because such liability, if any, is dependent on circumstances existing if and when remittance occurs.
SEGMENT AND GEOGRAPHIC INFORMATION
The Company operates in the food service industry. Revenuesconsist of sales by Company-operated restaurants and feesfrom restaurants operated by franchisees and affiliates. Feesfrom franchised and affiliated restaurants include continu-ing rent and service fees, initial fees, and royalties receivedfrom foreign affiliates and developmental licensees. Allintercompany revenues and expenses are eliminated incomputing revenues and operating income. Operatingincome includes the Company’s share of operating results of affiliates after interest expense and income taxes, exceptfor U.S. affiliates, which are reported before income taxes.Royalties and other payments received from subsidiariesoutside the U.S. were (in millions): 2003–$684.5;2002–$644.1; 2001–$607.7.
Corporate general & administrative expenses are includedin the corporate segment of operating income and consist ofhome office support costs in areas such as facilities, finance,human resources, information technology, legal, marketing,supply chain management and training. Corporate assetsinclude corporate cash and equivalents, asset portions offinancing instruments, home office facilities and deferredtax assets.
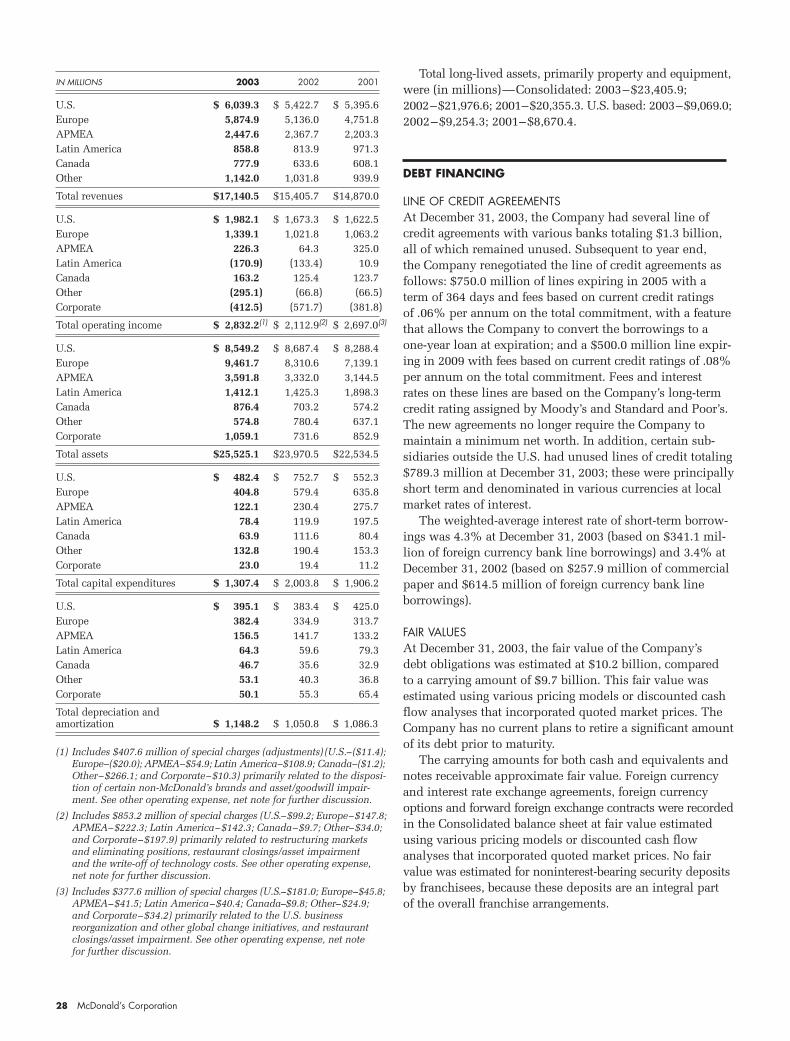
28 McDonald’s Corporation
IN MILLIONS 2003 2002 2001
U.S. $ 6,039.3 $ 5,422.7 $ 5,395.6Europe 5,874.9 5,136.0 4,751.8APMEA 2,447.6 2,367.7 2,203.3Latin America 858.8 813.9 971.3Canada 777.9 633.6 608.1Other 1,142.0 1,031.8 939.9
Total revenues $17,140.5 $15,405.7 $14,870.0
U.S. $ 1,982.1 $ 1,673.3 $ 1,622.5Europe 1,339.1 1,021.8 1,063.2APMEA 226.3 64.3 325.0Latin America (170.9) (133.4) 10.9Canada 163.2 125.4 123.7Other (295.1) (66.8) (66.5)Corporate (412.5) (571.7) (381.8)
Total operating income $ 2,832.2(1) $ 2,112.9(2) $ 2,697.0(3)
U.S. $ 8,549.2 $ 8,687.4 $ 8,288.4Europe 9,461.7 8,310.6 7,139.1APMEA 3,591.8 3,332.0 3,144.5Latin America 1,412.1 1,425.3 1,898.3Canada 876.4 703.2 574.2Other 574.8 780.4 637.1Corporate 1,059.1 731.6 852.9
Total assets $25,525.1 $23,970.5 $22,534.5
U.S. $ 482.4 $ 752.7 $ 552.3Europe 404.8 579.4 635.8APMEA 122.1 230.4 275.7Latin America 78.4 119.9 197.5Canada 63.9 111.6 80.4Other 132.8 190.4 153.3Corporate 23.0 19.4 11.2
Total capital expenditures $ 1,307.4 $ 2,003.8 $ 1,906.2
U.S. $ 395.1 $ 383.4 $ 425.0Europe 382.4 334.9 313.7APMEA 156.5 141.7 133.2Latin America 64.3 59.6 79.3Canada 46.7 35.6 32.9Other 53.1 40.3 36.8Corporate 50.1 55.3 65.4
Total depreciation and amortization $ 1,148.2 $ 1,050.8 $ 1,086.3
(1) Includes $407.6 million of special charges (adjustments) (U.S.–($11.4);Europe–($20.0); APMEA–$54.9; Latin America–$108.9; Canada–($1.2);Other–$266.1; and Corporate–$10.3) primarily related to the disposi-tion of certain non-McDonald’s brands and asset/goodwill impair-ment. See other operating expense, net note for further discussion.
(2) Includes $853.2 million of special charges (U.S.–$99.2; Europe–$147.8;APMEA–$222.3; Latin America–$142.3; Canada–$9.7; Other–$34.0;and Corporate–$197.9) primarily related to restructuring marketsand eliminating positions, restaurant closings/asset impairment and the write-off of technology costs. See other operating expense,net note for further discussion.
(3) Includes $377.6 million of special charges (U.S.–$181.0; Europe–$45.8;APMEA–$41.5; Latin America–$40.4; Canada–$9.8; Other–$24.9;and Corporate–$34.2) primarily related to the U.S. business reorganization and other global change initiatives, and restaurantclosings/asset impairment. See other operating expense, net note for further discussion.
Total long-lived assets, primarily property and equipment,were (in millions)—Consolidated: 2003–$23,405.9;2002–$21,976.6; 2001–$20,355.3. U.S. based: 2003–$9,069.0;2002–$9,254.3; 2001–$8,670.4.
DEBT FINANCING
LINE OF CREDIT AGREEMENTSAt December 31, 2003, the Company had several line ofcredit agreements with various banks totaling $1.3 billion,all of which remained unused. Subsequent to year end, the Company renegotiated the line of credit agreements asfollows: $750.0 million of lines expiring in 2005 with aterm of 364 days and fees based on current credit ratings of .06% per annum on the total commitment, with a featurethat allows the Company to convert the borrowings to aone-year loan at expiration; and a $500.0 million line expir-ing in 2009 with fees based on current credit ratings of .08%per annum on the total commitment. Fees and interest rates on these lines are based on the Company’s long-termcredit rating assigned by Moody’s and Standard and Poor’s.The new agreements no longer require the Company tomaintain a minimum net worth. In addition, certain sub-sidiaries outside the U.S. had unused lines of credit totaling $789.3 million at December 31, 2003; these were principallyshort term and denominated in various currencies at localmarket rates of interest.
The weighted-average interest rate of short-term borrow-ings was 4.3% at December 31, 2003 (based on $341.1 mil-lion of foreign currency bank line borrowings) and 3.4% atDecember 31, 2002 (based on $257.9 million of commercialpaper and $614.5 million of foreign currency bank line borrowings).
FAIR VALUESAt December 31, 2003, the fair value of the Company’s debt obligations was estimated at $10.2 billion, compared to a carrying amount of $9.7 billion. This fair value wasestimated using various pricing models or discounted cashflow analyses that incorporated quoted market prices. TheCompany has no current plans to retire a significant amountof its debt prior to maturity.
The carrying amounts for both cash and equivalents andnotes receivable approximate fair value. Foreign currencyand interest rate exchange agreements, foreign currencyoptions and forward foreign exchange contracts were recordedin the Consolidated balance sheet at fair value estimatedusing various pricing models or discounted cash flowanalyses that incorporated quoted market prices. No fairvalue was estimated for noninterest-bearing security depositsby franchisees, because these deposits are an integral part of the overall franchise arrangements.
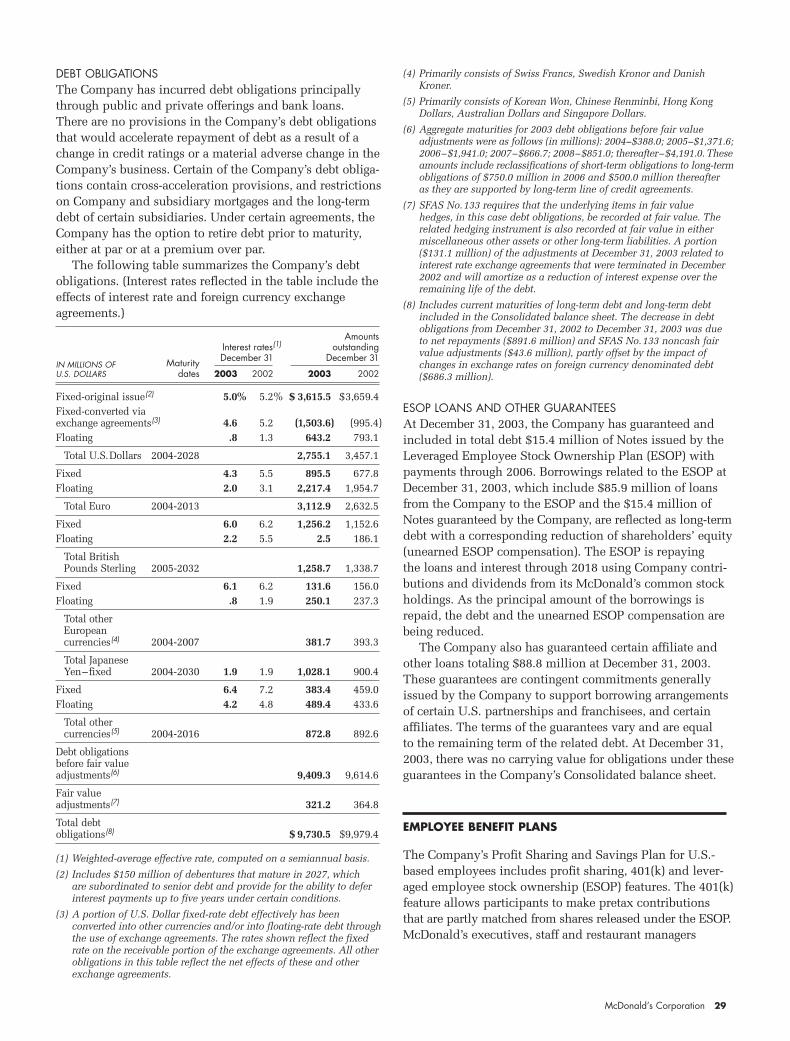
McDonald’s Corporation 29
DEBT OBLIGATIONSThe Company has incurred debt obligations principallythrough public and private offerings and bank loans. There are no provisions in the Company’s debt obligationsthat would accelerate repayment of debt as a result of achange in credit ratings or a material adverse change in theCompany’s business. Certain of the Company’s debt obliga-tions contain cross-acceleration provisions, and restrictionson Company and subsidiary mortgages and the long-termdebt of certain subsidiaries. Under certain agreements, theCompany has the option to retire debt prior to maturity,either at par or at a premium over par.
The following table summarizes the Company’s debtobligations. (Interest rates reflected in the table include theeffects of interest rate and foreign currency exchange agreements.)
AmountsInterest rates(1) outstanding
IN MILLIONS OF Maturity December 31 December 31
U.S. DOLLARS dates 2003 2002 2003 2002
Fixed-original issue(2) 5.0% 5.2% $ 3,615.5 $3,659.4Fixed-converted via exchange agreements(3) 4.6 5.2 (1,503.6) (995.4)Floating .8 1.3 643.2 793.1
Total U.S.Dollars 2004-2028 2,755.1 3,457.1
Fixed 4.3 5.5 895.5 677.8Floating 2.0 3.1 2,217.4 1,954.7
Total Euro 2004-2013 3,112.9 2,632.5
Fixed 6.0 6.2 1,256.2 1,152.6Floating 2.2 5.5 2.5 186.1
Total British Pounds Sterling 2005-2032 1,258.7 1,338.7
Fixed 6.1 6.2 131.6 156.0Floating .8 1.9 250.1 237.3
Total other European currencies(4) 2004-2007 381.7 393.3
Total Japanese Yen–fixed 2004-2030 1.9 1.9 1,028.1 900.4
Fixed 6.4 7.2 383.4 459.0Floating 4.2 4.8 489.4 433.6
Total other currencies(5) 2004-2016 872.8 892.6
Debt obligations before fair value adjustments(6) 9,409.3 9,614.6
Fair value adjustments(7) 321.2 364.8
Total debt obligations(8) $ 9,730.5 $9,979.4
(1) Weighted-average effective rate, computed on a semiannual basis.
(2) Includes $150 million of debentures that mature in 2027, which are subordinated to senior debt and provide for the ability to deferinterest payments up to five years under certain conditions.
(3) A portion of U.S. Dollar fixed-rate debt effectively has been converted into other currencies and/or into floating-rate debt throughthe use of exchange agreements. The rates shown reflect the fixedrate on the receivable portion of the exchange agreements. All other obligations in this table reflect the net effects of these and otherexchange agreements.
(4) Primarily consists of Swiss Francs, Swedish Kronor and DanishKroner.
(5) Primarily consists of Korean Won, Chinese Renminbi, Hong KongDollars, Australian Dollars and Singapore Dollars.
(6) Aggregate maturities for 2003 debt obligations before fair valueadjustments were as follows (in millions): 2004–$388.0; 2005–$1,371.6;2006–$1,941.0; 2007–$666.7; 2008–$851.0; thereafter–$4,191.0. Theseamounts include reclassifications of short-term obligations to long-termobligations of $750.0 million in 2006 and $500.0 million thereafter as they are supported by long-term line of credit agreements.
(7) SFAS No.133 requires that the underlying items in fair value hedges, in this case debt obligations, be recorded at fair value. Therelated hedging instrument is also recorded at fair value in eithermiscellaneous other assets or other long-term liabilities. A portion($131.1 million) of the adjustments at December 31, 2003 related tointerest rate exchange agreements that were terminated in December2002 and will amortize as a reduction of interest expense over theremaining life of the debt.
(8) Includes current maturities of long-term debt and long-term debtincluded in the Consolidated balance sheet. The decrease in debtobligations from December 31, 2002 to December 31, 2003 was due to net repayments ($891.6 million) and SFAS No.133 noncash fairvalue adjustments ($43.6 million), partly offset by the impact ofchanges in exchange rates on foreign currency denominated debt($686.3 million).
ESOP LOANS AND OTHER GUARANTEESAt December 31, 2003, the Company has guaranteed andincluded in total debt $15.4 million of Notes issued by theLeveraged Employee Stock Ownership Plan (ESOP) withpayments through 2006. Borrowings related to the ESOP atDecember 31, 2003, which include $85.9 million of loansfrom the Company to the ESOP and the $15.4 million ofNotes guaranteed by the Company, are reflected as long-termdebt with a corresponding reduction of shareholders’ equity(unearned ESOP compensation). The ESOP is repaying the loans and interest through 2018 using Company contri-butions and dividends from its McDonald’s common stockholdings. As the principal amount of the borrowings isrepaid, the debt and the unearned ESOP compensation arebeing reduced.
The Company also has guaranteed certain affiliate andother loans totaling $88.8 million at December 31, 2003.These guarantees are contingent commitments generallyissued by the Company to support borrowing arrangementsof certain U.S. partnerships and franchisees, and certainaffiliates. The terms of the guarantees vary and are equal to the remaining term of the related debt. At December 31,2003, there was no carrying value for obligations under theseguarantees in the Company’s Consolidated balance sheet.
EMPLOYEE BENEFIT PLANS
The Company’s Profit Sharing and Savings Plan for U.S.-based employees includes profit sharing, 401(k) and lever-aged employee stock ownership (ESOP) features. The 401(k)feature allows participants to make pretax contributionsthat are partly matched from shares released under the ESOP.McDonald’s executives, staff and restaurant managers

30 McDonald’s Corporation
participate in any additional ESOP allocations and profitsharing contributions, based on their compensation. Theprofit sharing contribution is discretionary, and the Companydetermines the amount each year.
Effective March 31, 2003, all contributions and relatedearnings can be invested among several investment alterna-tives, including McDonald’s common stock, in accordancewith each participant’s elections. Prior to March 31, 2003,ESOP allocations and earnings were generally invested inMcDonald’s common stock and all other contributions andrelated earnings could be invested among several invest-ment alternatives, including McDonald’s common stock.
In addition, the Company maintains a nonqualified,unfunded Supplemental Plan that allows participants to maketax-deferred contributions and receive Company-providedallocations that cannot be made under the Profit Sharing andSavings Plan because of Internal Revenue Service limitations.The investment alternatives in the Supplemental Plan arebased on certain of the market-rate investment alternativesunder the Profit Sharing and Savings Plan. Total liabilitiesunder the Supplemental Plan were $329.3 million atDecember 31, 2003 and $297.3 million at December 31,2002 and were included in other long-term liabilities in the Consolidated balance sheet.
The Company has entered into derivative contracts tohedge market-driven changes in certain of the SupplementalPlan liabilities. At December 31, 2003, derivatives with afair value of $51.6 million indexed to the Company’s stockand $49.4 million indexed to certain market indices wereincluded in miscellaneous other assets in the Consolidatedbalance sheet. All changes in Plan liabilities and in the fairvalue of the derivatives are recorded in selling, general &administrative expenses. Changes in fair value of the deriv-atives indexed to the Company’s stock are recorded in theincome statement because the contracts provide the coun-terparty with a choice to settle in cash or shares.
Total U.S. costs for the Profit Sharing and Savings Plan,including nonqualified benefits and related hedging activities, were (in millions): 2003–$60.3; 2002–$50.1;2001–$54.6.
Certain subsidiaries outside the U.S. also offer profitsharing, stock purchase or other similar benefit plans. Totalplan costs outside the U.S. were (in millions): 2003–$43.9;2002–$36.8; 2001–$39.7.
Other postretirement benefits and postemployment benefits, excluding severance benefits related to the 2002and 2001 restructuring charges, were immaterial.
PROPERTY AND EQUIPMENT
Net property and equipment consisted of:
IN MILLIONS December 31, 2003 2002
Land $ 4,483.0 $ 4,169.6Buildings and improvements on owned land 9,693.4 8,747.2Buildings and improvements on leased land 9,792.1 8,872.5Equipment, signs and seating 4,090.5 3,765.1Other 681.2 664.2
28,740.2 26,218.6
Accumulated depreciation and amortization (8,815.5) (7,635.2)
Net property and equipment $19,924.7 $18,583.4
Depreciation and amortization expense was (in millions):2003–$1,113.3; 2002–$971.1; 2001–$945.6.
STOCK-BASED COMPENSATION
At December 31, 2003, the Company had five stock-basedcompensation plans for employees and nonemployee direc-tors that authorize the granting of various equity-basedincentives including stock options, restricted stock andrestricted stock units. The number of shares of commonstock reserved for issuance under the plans was 206.0 mil-lion at December 31, 2003, including 11.8 million availablefor future grants.
STOCK OPTIONSOptions to purchase common stock are granted at the fairmarket value of the stock on the date of grant. Therefore, nocompensation cost has been recognized in the Consolidatedstatement of income for these stock options. Substantiallyall of the options become exercisable in four equal install-ments, beginning a year from the date of the grant, and generally expire 10 years from the grant date. Approximately44 million options granted between May 1, 1999 andDecember 31, 2000 expire 13 years from the date of grant.
In 2001, the Board of Directors approved a special grantof 11.9 million options at a price of $28.90 as an incentiveto meet an operating income performance goal for calendaryear 2003. The options vested on January 31, 2004 andexpire on June 30, 2004, rather than June 30, 2011, becausethe Company did not meet the performance goal.
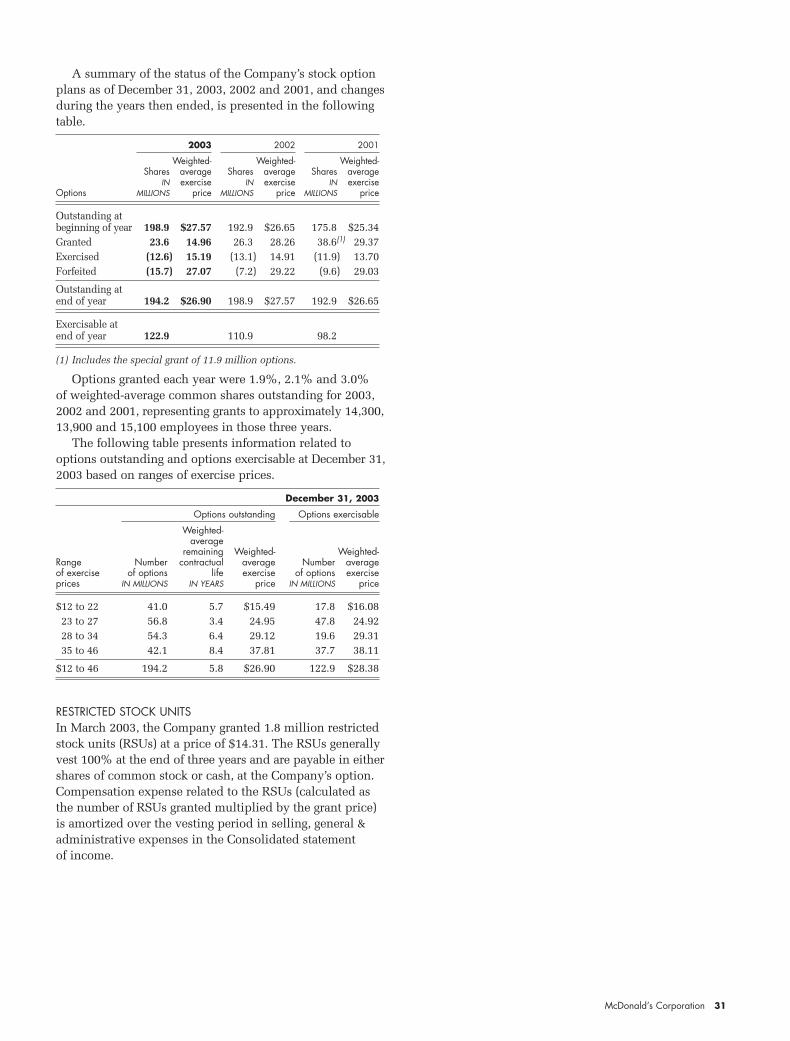
McDonald’s Corporation 31
A summary of the status of the Company’s stock optionplans as of December 31, 2003, 2002 and 2001, and changesduring the years then ended, is presented in the followingtable.
2003 2002 2001
Weighted- Weighted- Weighted-Shares average Shares average Shares average
IN exercise IN exercise IN exerciseOptions MILLIONS price MILLIONS price MILLIONS price
Outstanding at beginning of year 198.9 $27.57 192.9 $26.65 175.8 $25.34Granted 23.6 14.96 26.3 28.26 38.6(1) 29.37Exercised (12.6) 15.19 (13.1) 14.91 (11.9) 13.70Forfeited (15.7) 27.07 (7.2) 29.22 (9.6) 29.03
Outstanding at end of year 194.2 $26.90 198.9 $27.57 192.9 $26.65
Exercisable at end of year 122.9 110.9 98.2
(1) Includes the special grant of 11.9 million options.
Options granted each year were 1.9%, 2.1% and 3.0% of weighted-average common shares outstanding for 2003,2002 and 2001, representing grants to approximately 14,300,13,900 and 15,100 employees in those three years.
The following table presents information related tooptions outstanding and options exercisable at December 31,2003 based on ranges of exercise prices.
December 31, 2003
Options outstanding Options exercisable
Weighted-average
remaining Weighted- Weighted-Range Number contractual average Number averageof exercise of options life exercise of options exerciseprices IN MILLIONS IN YEARS price IN MILLIONS price
$12 to 22 41.0 5.7 $15.49 17.8 $16.0823 to 27 56.8 3.4 24.95 47.8 24.9228 to 34 54.3 6.4 29.12 19.6 29.3135 to 46 42.1 8.4 37.81 37.7 38.11
$12 to 46 194.2 5.8 $26.90 122.9 $28.38
RESTRICTED STOCK UNITSIn March 2003, the Company granted 1.8 million restrictedstock units (RSUs) at a price of $14.31. The RSUs generallyvest 100% at the end of three years and are payable in eithershares of common stock or cash, at the Company’s option.Compensation expense related to the RSUs (calculated asthe number of RSUs granted multiplied by the grant price)is amortized over the vesting period in selling, general &administrative expenses in the Consolidated statement of income.

32 McDonald’s Corporation
Quarterly results (unaudited)
Quarters ended Quarters ended Quarters ended Quarters endedDecember 31 September 30 June 30 March 31
In millions, except per share data 2003 2002 2003 2002 2003 2002 2003 2002
RevenuesSales by Company-operated restaurants $3,398.4 $2,932.8 $3,351.2 $3,019.3 $3,189.7 $2,869.0 $2,856.1 $2,678.5Revenues from franchised andaffiliated restaurants 1,157.0 966.4 1,153.4 1,027.7 1,091.1 993.1 943.6 918.9
Total revenues 4,555.4 3,899.2 4,504.6 4,047.0 4,280.8 3,862.1 3,799.7 3,597.4
Company-operated margin 486.4 374.5 510.6 434.5 445.7 415.1 346.7 368.9Franchised margin 909.6 749.2 917.4 813.5 860.1 787.1 720.3 716.2Operating income (loss) 367.5(1) (203.4)(2) 963.9 829.8 826.2 845.2 674.6 641.3(3)
Income (loss) before cumulative effect of accounting changes $ 125.7(1) $ (343.8)(2) $ 547.4 $ 486.7 $ 470.9 $ 497.5 $ 364.2 $ 351.7(3)
Cumulative effect of accounting changes, net of tax (36.8) (98.6)Net income (loss) $ 125.7(1) $ (343.8)(2) $ 547.4 $ 486.7 $ 470.9 $ 497.5 $ 327.4 $ 253.1(3)
Per common share–basic:Income (loss) before cumulative effect of accounting changes $ .10(1) $ (.27)(2) $ .43 $ .38 $ .37 $ .39 $ .29 $ .28(3)
Cumulative effect of accounting changes (.03) (.08)Net income (loss) $ .10(1) $ (.27)(2) $ .43 $ .38 $ .37 $ .39 $ .26 $ .20(3)
Per common share–diluted:Income (loss) before cumulative effect of accounting changes $ .10(1) $ (.27)(2) $ .43 $ .38 $ .37 $ .39 $ .29 $ .27(3)
Cumulative effect of accounting changes (.03) (.07)Net income (loss) $ .10(1) $ (.27)(2) $ .43 $ .38 $ .37 $ .39 $ .26 $ .20(3)
Dividends declared per common share $ – $ .235 $ .40 $ – $ – $ – $ – $ –
Weighted-average shares–basic 1,266.2 1,268.8 1,271.5 1,273.1 1,272.5 1,273.2 1,269.6 1,277.2Weighted-average shares–diluted 1,277.9 1,268.8 1,281.0 1,280.5 1,277.5 1,290.6 1,270.3 1,292.7
Market price per common shareHigh $ 27.01 $ 19.95 $ 24.37 $ 28.62 $ 22.95 $ 30.72 $ 17.38 $ 29.06Low 23.01 15.17 20.40 17.42 13.88 27.00 12.12 25.38Close 24.83 16.08 23.54 17.66 22.06 28.45 14.46 27.75
(1) Includes the following net charges totaling $0.25 per share:
> $272.1 million ($183.2 million after tax) related to the disposition of certain non-McDonald’s brands and the revitalization plan actions of our Japanese affiliate.
> $135.5 million ($140.0 million after tax) primarily related to asset/goodwill impairment mainly in Latin America, restaurant closings associated with strategic actions in Latin America and a favorable adjustment to the 2002 charge for restaurant closings, primarily due toabout 85 fewer closings than originally anticipated.
(2) Includes the following charges totaling $0.52 per share:
> $266.9 million ($243.6 million after tax) primarily related to the anticipated transfer of ownership in five countries in the Middle East andLatin America, ceasing operations in two countries in Latin America and eliminating positions, reallocating resources and consolidating certain home office facilities to control costs.
> $359.4 million ($292.8 million after tax) consisting of $292.2 million related to management’s decision to close 719 underperforming restaurants primarily in the U.S. and Japan, and $67.2 million primarily related to the impairment of assets for certain existing restaurantsin Europe and Latin America.
> $183.9 million ($120.5 million after tax) consisting of $170.0 million related to management’s decision to terminate a long-term technologyproject, and $13.9 million related to the write-off of receivables and inventory in Venezuela as a result of the temporary closure of allMcDonald’s restaurants due to a national strike.
(3) Includes $43.0 million of asset impairment charges (pre and after tax or $0.03 per share), primarily related to the impairment of assets in existing restaurants in Chile and other Latin American markets and the closing of 32 underperforming restaurants in Turkey.

McDonald’s Corporation 33
MANAGEMENT'S REPORT
Management is responsible for the preparation, integrityand fair presentation of the consolidated financial state-ments and notes to the consolidated financial statements.The financial statements were prepared in accordance withaccounting principles generally accepted in the U.S. andinclude certain amounts based on management's judgmentand best estimates. Other financial information presented is consistent with the financial statements.
The Company maintains a system of internal controlover financial reporting including safeguarding of assetsagainst unauthorized acquisition, use or disposition, whichis designed to provide reasonable assurance to theCompany's management and Board of Directors regardingthe preparation of reliable published financial statementsand asset safeguarding. The system includes a documentedorganizational structure and appropriate division of respon-sibilities; established policies and procedures that are communicated throughout the Company; careful selection,training and development of our people; and utilization of an internal audit program. Policies and procedures prescribe that the Company and all employees are to main-tain high standards of proper business practices throughoutthe world.
There are inherent limitations to the effectiveness of any system of internal control, including the possibility ofhuman error and the circumvention or overriding of con-trols. Accordingly, even an effective internal control systemcan provide only reasonable assurance with respect tofinancial statement preparation and safeguarding of assets.Furthermore, the effectiveness of an internal control system can change with circumstances. The Company believes that it maintains an effective system of internal control over financial reporting and safeguarding of assets against unauthorized acquisition, use or disposition.
The consolidated financial statements have been auditedby independent auditors, Ernst & Young LLP, who weregiven unrestricted access to all financial records and relateddata. The audit report of Ernst & Young LLP is presentedherein.
The Board of Directors, operating through its Audit Committee composed entirely of independent Directors,oversees the financial reporting process. Ernst & Young LLPhas unrestricted access to the Audit Committee and regularlymeets with the Committee to discuss accounting, auditingand financial reporting matters.
McDONALD’S CORPORATIONJanuary 26, 2004
REPORT OF INDEPENDENT AUDITORS
THE BOARD OF DIRECTORS AND SHAREHOLDERSMcDONALD'S CORPORATION
We have audited the accompanying Consolidated balancesheets of McDonald's Corporation as of December 31, 2003and 2002, and the related Consolidated statements ofincome, shareholders' equity and cash flows for each of thethree years in the period ended December 31, 2003. Thesefinancial statements are the responsibility of McDonald'sCorporation management. Our responsibility is to expressan opinion on these financial statements based on ouraudits.
We conducted our audits in accordance with auditingstandards generally accepted in the U.S. Those standardsrequire that we plan and perform the audit to obtain reason-able assurance about whether the financial statements arefree of material misstatement. An audit includes examining,on a test basis, evidence supporting the amounts and dis-closures in the financial statements. An audit also includesassessing the accounting principles used and significantestimates made by management, as well as evaluating theoverall financial statement presentation. We believe that ouraudits provide a reasonable basis for our opinion.
In our opinion, the financial statements referred to above present fairly, in all material respects, the consolidatedfinancial position of McDonald's Corporation at December 31,2003 and 2002, and the consolidated results of its opera-tions and its cash flows for each of the three years in theperiod ended December 31, 2003, in conformity withaccounting principles generally accepted in the U.S.
As discussed in the Notes to the consolidated financialstatements, effective January 1, 2003, the Company changedits method for accounting for asset retirement obligations to conform with SFAS No.143, Accounting for AssetRetirement Obligations. Effective January 1, 2002, theCompany changed its method for accounting for goodwill to conform with SFAS No.142, Goodwill and OtherIntangible Assets.
ERNST & YOUNG LLPChicago, IllinoisJanuary 26, 2004
®
™
McDonald’s CorporationMcDonald’s PlazaOak Brook IL 60523
www.mcdonalds.com
Related Documents