R efugio C ounty Profile Philip W . R hoades, Ph.D . V alerieV illarrealB.A . Stephanie Jackson B.A . Sw athiYarlagadda B.S. June 30,2005

2000 Refugio County Population by Age Source: 2000 U.S Census Bureau.
Jan 02, 2016
Welcome message from author
This document is posted to help you gain knowledge. Please leave a comment to let me know what you think about it! Share it to your friends and learn new things together.
Transcript

Refugio County Profile
Philip W. Rhoades, Ph.D.
Valerie Villarreal B.A.
Stephanie Jackson B.A.
Swathi Yarlagadda B.S.
June 30, 2005

2000 Refugio County Population by Age
Source: 2000 U.S Census Bureau
73.9%
18.0%
8.1%
12 and under 13-17 18 and over

2004 Refugio County Population by Age
18
8.4
74
12 & und
13-17
18+
Source: 2000 U.S Census Bureau
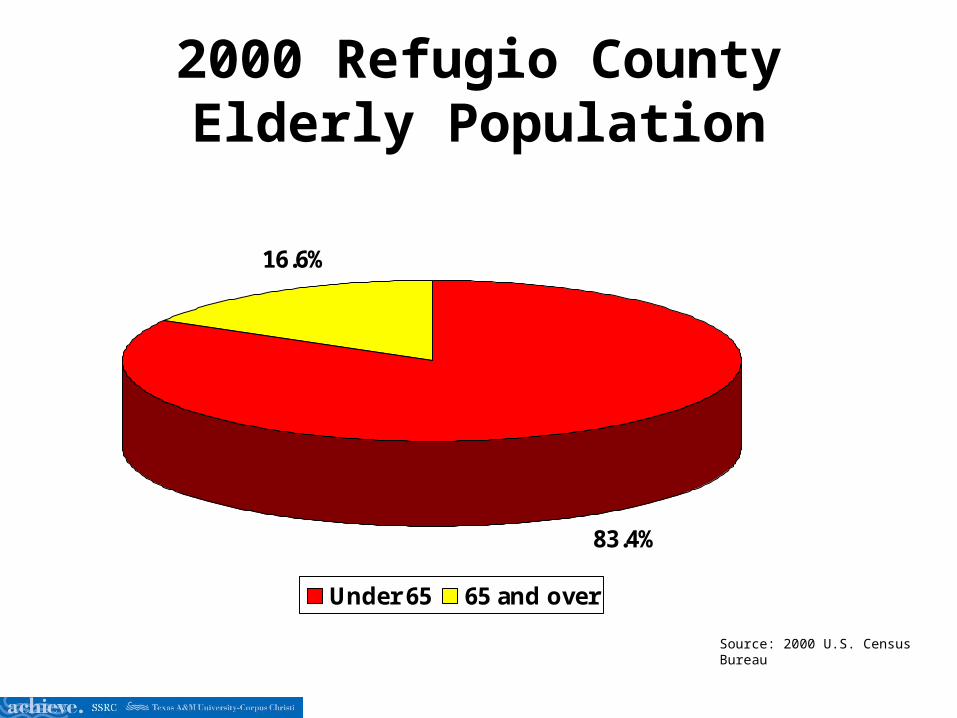
2000 Refugio County Elderly Population
Source: 2000 U.S. Census Bureau
83.4%
16.6%
Under 65 65 and over

2004 Refugio County Elderly Population
81.2
18.8
under 65
65 +
Source: 2000 U.S. Census Bureau

2000 Percent of Male and Female
Source: 2000 U.S Census Bureau
48.9%51.1%
Male Female

2004 Male / Female Population
48.2
51.8
Male
Female
Source: 2000 U.S Census Bureau
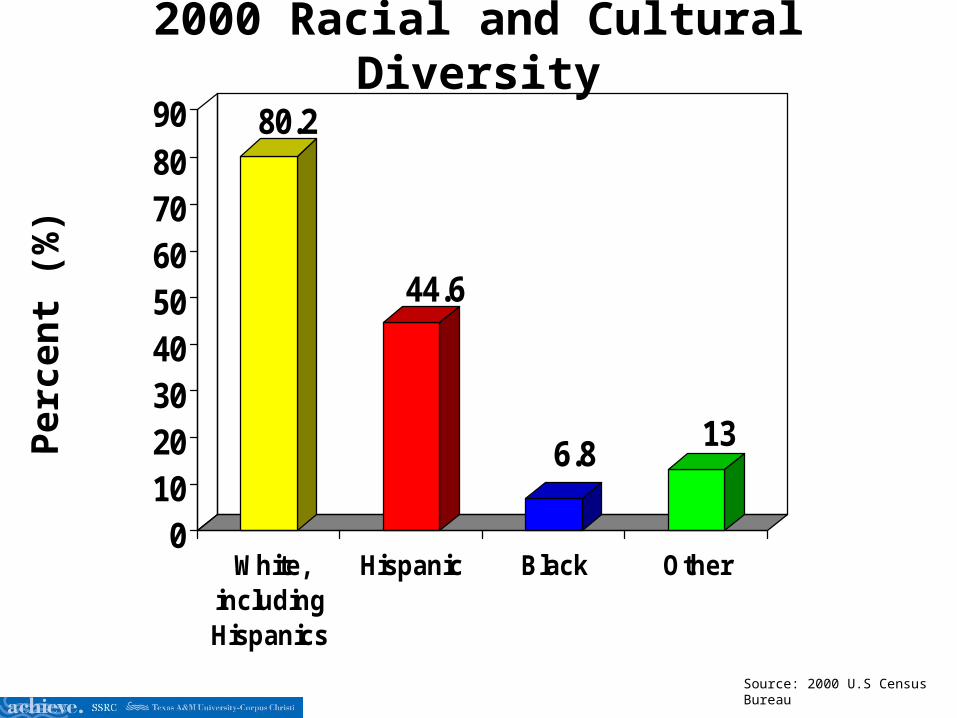
2000 Racial and Cultural Diversity
80.2
44.6
6.813
0102030405060708090
White,includingHispanics
Hispanic Black Other
Source: 2000 U.S Census Bureau
Per c
ent (
%)

2004 Racial and Cultural Diversity
80.1
44.5
6.9 13.1
0102030405060708090
White,includingHispanics
Hispanic Black Other
Source: 2000 U.S Census Bureau
Per c
ent (
%)

0
0.5
1
1.5
2
2.5
2000 2001 2002 2003 2004
State Refugio
Alcohol-Related Juvenile ArrestsPe
r 1,0
00 J
uven
iles
Source: Texas Uniform Crime Reports

0
0.5
1
1.5
2
2.5
3
3.5
2000 2001 2002 2003 2004
State Refugio
Drug-Related Juvenile ArrestsPe
r 1,0
00 J
uven
iles
Source: Texas Uniform Crime Reports

0
0.5
1
1.5
2
2000 2001 2002 2003 2004
State Refugio
Violent Crimes Juvenile ArrestsPe
r 1,0
00 J
uven
iles
Source: Texas Uniform Crime Reports

0
1
2
3
4
5
6
2000 2001 2002 2003 2004
State Refugio
Property Crimes Juvenile ArrestsPe
r 1,0
00 J
uven
iles
Source: Texas Uniform Crime Reports

0
0.5
1
1.5
2
2.5
3
3.5
2000 2001 2002 2003 2004
State Refugio
Runaway Juvenile ArrestsPe
r 1,0
00 J
uven
iles
Source: Texas Uniform Crime Reports

0
1
2
3
4
5
6
7
8
2000 2001 2002 2003 2004
State Refugio
Curfew, Vandalism, & Disorderly Conduct Juvenile Arrests
Per 1
,000
Juv
enile
s
Source: Texas Uniform Crime Reports
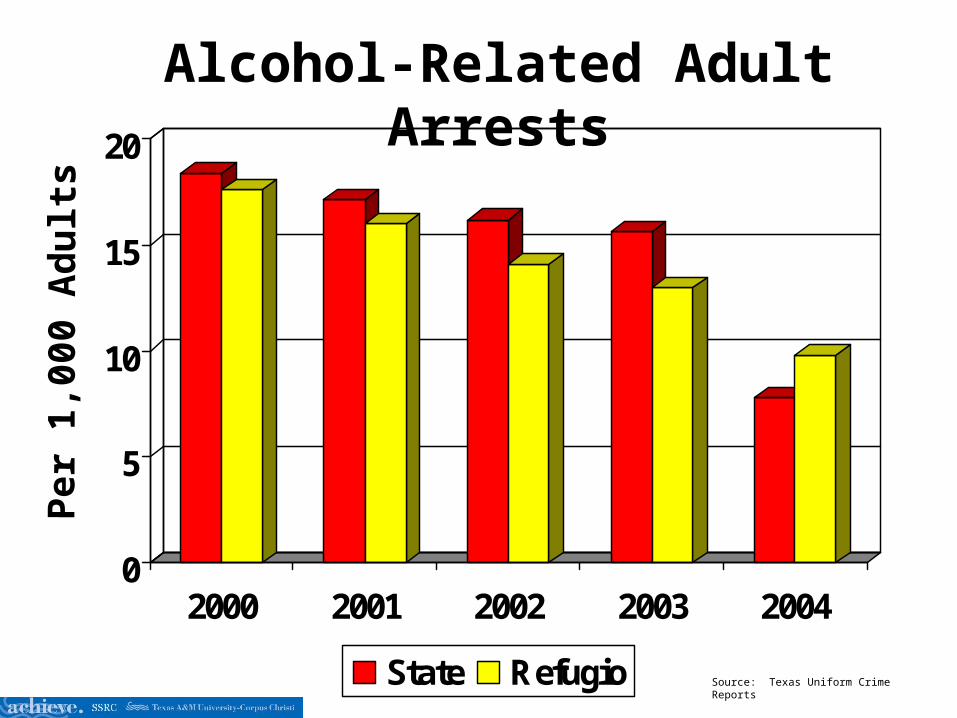
0
5
10
15
20
2000 2001 2002 2003 2004
State Refugio
Alcohol-Related Adult ArrestsPe
r 1,0
00 A
dults
Source: Texas Uniform Crime Reports

0
2
4
6
8
10
12
14
2000 2001 2002 2003 2004
State Refugio
Drug-Related Adult ArrestsPe
r 1,0
00 A
dults
Source: Texas Uniform Crime Reports

0
0.5
1
1.5
2
2.5
3
3.5
2000 2001 2002 2003 2004
State Refugio
Violent Crimes Adult ArrestsPe
r 1,0
00 A
dults
Source: Texas Uniform Crime Reports

0
1
2
3
4
5
6
7
2000 2001 2002 2003 2004
State Refugio
Property Crimes Adult ArrestsPe
r 1,0
00 A
dults
Source: Texas Uniform Crime Reports

0123456789
2000 2001 2002 2003
State Refugio
Rate of Family Violence IncidentsPe
r 1,0
00 p
opul
atio
n
Source: Texas Uniform Crime Report

0
2
4
6
8
10
12
14
2000 2001 2002 2003 2004
State Refugio
Confirmed Child Abuse VictimsPe
r 1,0
00 p
opul
atio
n
Source: Texas Dept. of Family & Protective Services

0
1
2
3
4
5
6
7
2000 2001 2002 2003 2004
State Refugio
2003 Confirmed Adult AbusePe
r 1,0
00 p
opul
atio
n
Source: 2003 Texas Dept. of Family & Protective Services

0
1
2
3
4
5
6
7
8
2002 2003
Refugio
Number of Family Violence Victims Served
Source: Texas Dept. of Human Services

0
200
400
600
800
1,000
1,200
Food Stamps Medicaid TANF
2002 2003 2004
Recipients of Food Stamps, Medicaid, & TANF
Source: Texas Department of Human Services

0
1
2
3
4
5
6
7
2001 2002 2003 2004
State Refugio
Unemployment Rate
Source: Texas Workforce Commission

0
10
20
30
40
50
60
2000 2004
% in Labor Force % not in Labor Force
Labor Force: 16 years & over
Source: Demographicsnow

0
5
10
15
20
Poverty
State Refugio
1999 Elderly Poverty Status (65 years and over)Pe
r cen
t (%
)
Source: 2000 U.S. Census Bureau

18
19
20
21
22
23
24
25
Poverty
State Refugio
1999 Poverty Status of Individuals Under 18 Years of AgePe
r cen
t bel
ow p
ove r
ty le
vel (
%)
Source: 2000 U.S. Census Bureau

0
5
10
15
20
25
Poverty
State Refugio
1999 Families in Poverty (with related children under 18)Pe
r cen
t bel
ow p
ove r
ty le
vel (
%)
Source: 2000 U.S. Census Bureau

19
20
21
22
23
24
Poverty
2000 2001 2002
Children in Poverty Pe
r cen
t bel
ow p
ove r
ty le
vel (
%)
Source: 2000 U.S. Census Bureau
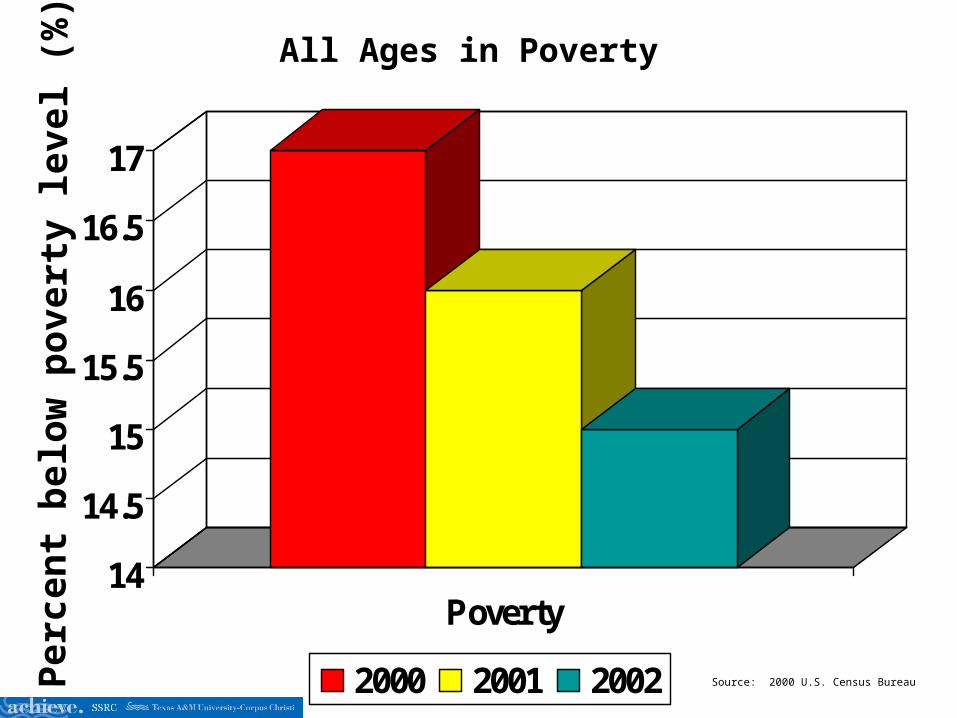
14
14.5
15
15.5
16
16.5
17
Poverty
2000 2001 2002
All Ages in Poverty Pe
r cen
t bel
ow p
ove r
ty le
vel (
%)
Source: 2000 U.S. Census Bureau

16,000
20,000
24,000
28,000
32,000
36,000
40,000
Income
State Refugio
2000 Median Household Income (Dollars)
Source: 2000 U.S. Census Bureau
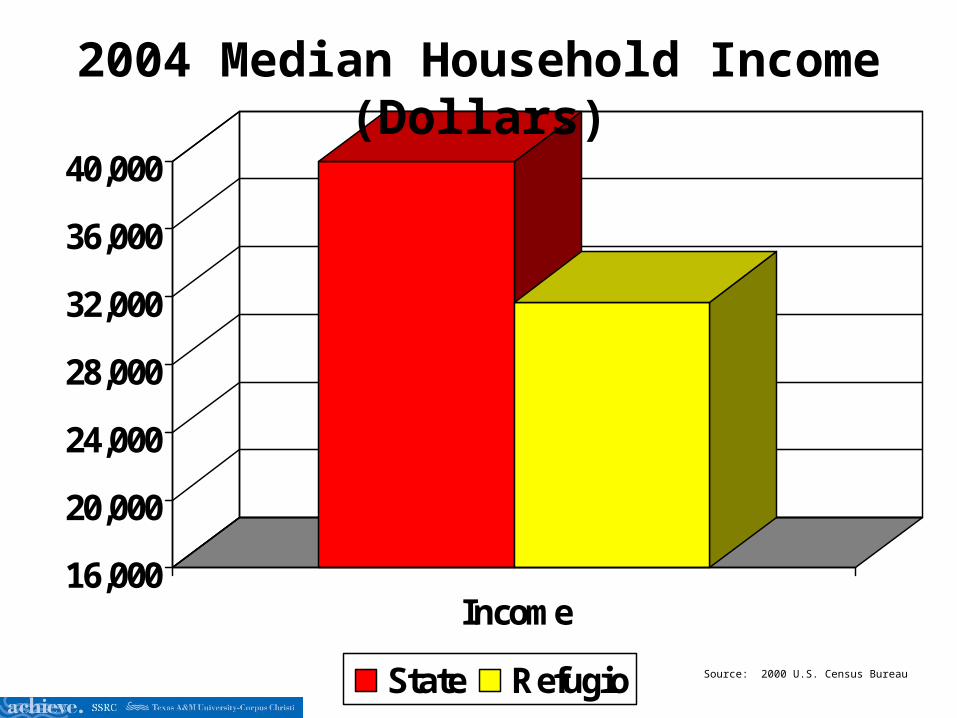
16,000
20,000
24,000
28,000
32,000
36,000
40,000
Income
State Refugio
2004 Median Household Income (Dollars)
Source: 2000 U.S. Census Bureau
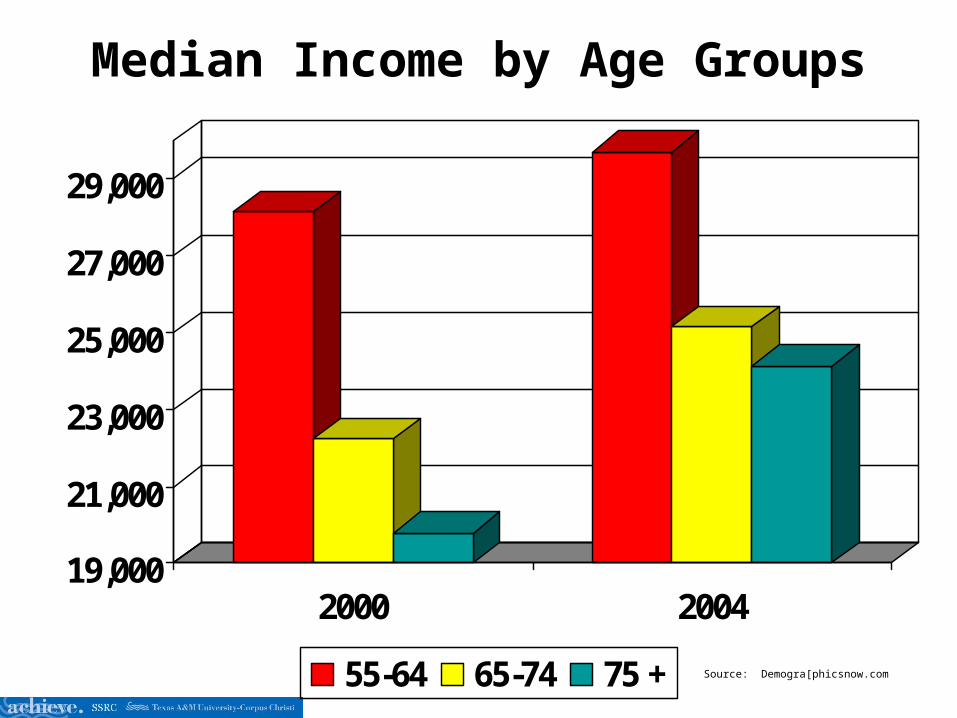
19,000
21,000
23,000
25,000
27,000
29,000
2000 2004
55-64 65-74 75 +
Median Income by Age Groups
Source: Demogra[phicsnow.com

0
10
20
30
40
50
60
Families with femalehouseholder
With relatedchildren < 18 yrs
State Refugio
1999 Single Parent HouseholdsPe
r cen
t bel
ow p
ove r
ty le
vel (
%)
Source: 2000 U.S. Census Bureau
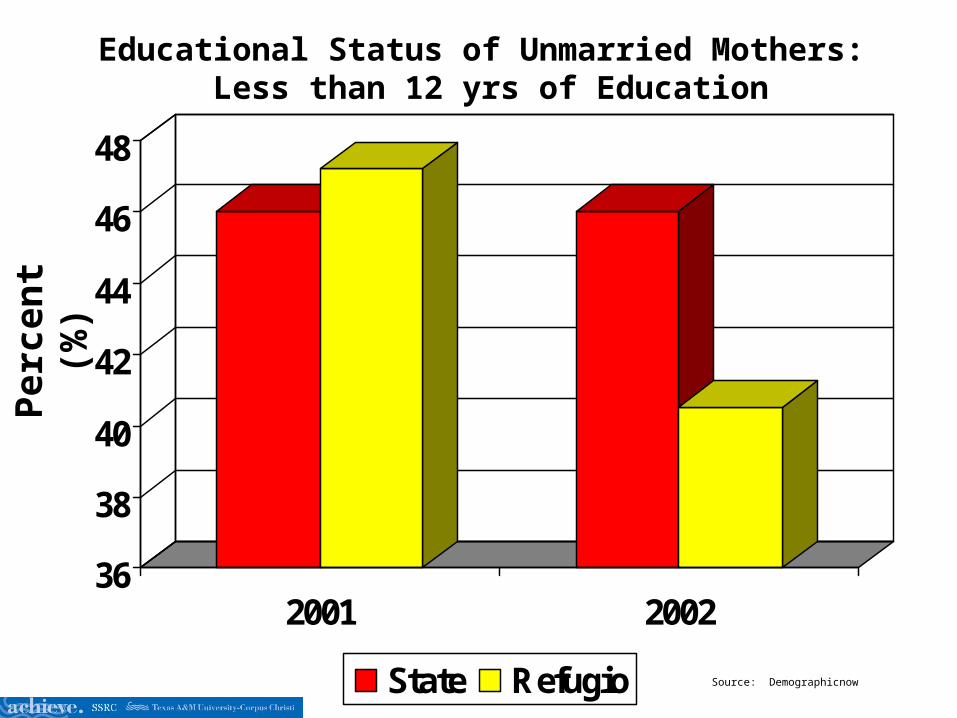
36
38
40
42
44
46
48
2001 2002
State Refugio
Educational Status of Unmarried Mothers: Less than 12 yrs of Education
Per c
ent (
%)
Source: Demographicnow

0
10
20
30
40
50
60
State Refugio
2000 Grandparents as CaregiversPe
r cen
t (%
)
Source: 2000 U.S. Census Bureau

1,130
1,135
1,140
1,145
1,150
1,155
1,160
1,165
1,170
1,175
1,180
2001 2002 2003 2004 2005
Refugio County Adults with Mental Illness: 2001-2003 Estimates
Source: Texas Dept. of Mental Health and Mental Retardation
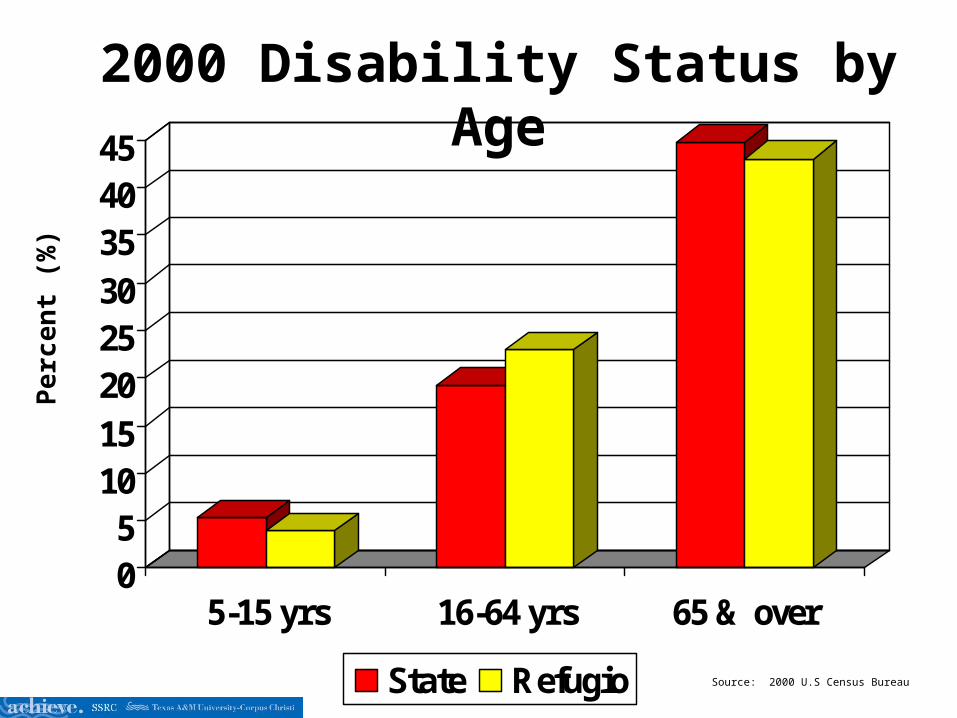
05
1015202530354045
5-15 yrs 16-64 yrs 65 & over
State Refugio
2000 Disability Status by Age
Source: 2000 U.S Census Bureau
Pe
rce
nt
(%)

0
2
4
6
8
10
12
14
16
2000 2001 2002 2003
State Refugio
Percent of Teen Births
Source: Texas Dept. of Health
Per c
ent (
%)

02468
1012141618
1999 2000 2001 2002
State Refugio
Infant Mortality RatePe
r 1,0
00 p
opul
atio
n
Source: Texas Department of Health

0
2
4
6
8
10
12
14
2000 2001 2002 2003
State Refugio
Mortality RatePe
r 1,0
00 p
opul
atio
n
Source: Texas Dept. of Health

0123456789
1999 2000 2001 2002 2003
State Refugio
Percent of Low Birth Weight
Source: Texas Dept. of Health
Per c
ent (
%)

0
1
2
3
4
5
6
2000 2001 2002 2003
State Refugio Source: Texas Department of Health
Chlamydia R
ate
per
1,0
00 p
op
ula
tio
n
Half year only

0
0.5
1
1.5
2
2.5
2000 2001 2002 2003
State Refugio Source: Texas Department of Health
Gonorrhea R
ate
per
1,0
00 p
op
ula
tio
n
Half year only

0
1
2
3
4
5
6
7
8
2000 2001 2002 2003
State Refugio
Chronic Liver Disease DeathsPe
r 10,
0 00
popu
latio
n
Source: Texas Dept. of Health: Texas Vital Statistics
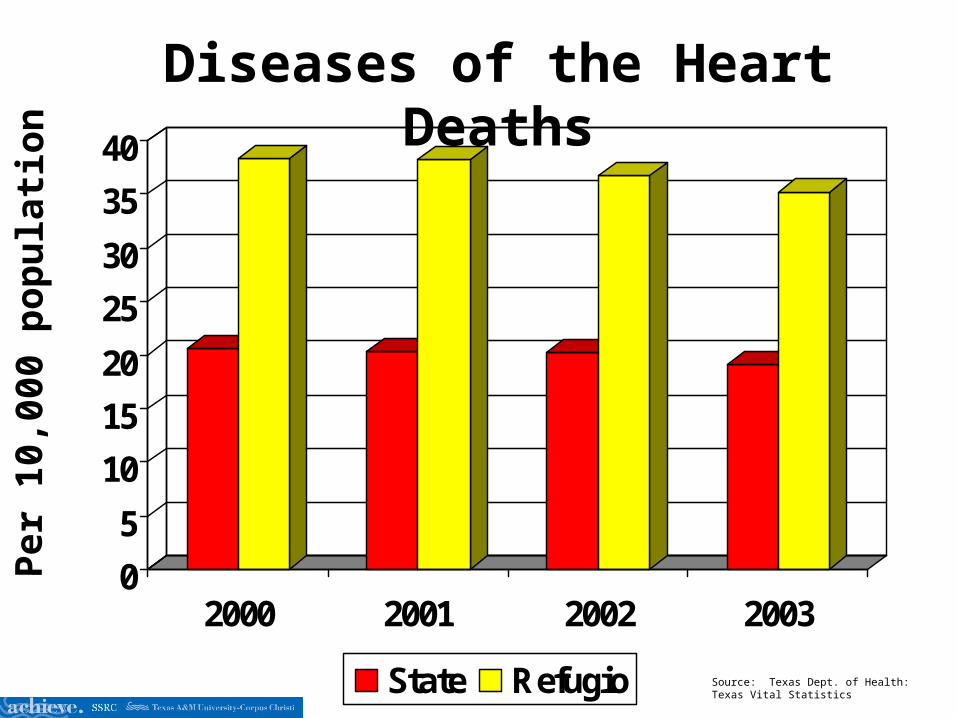
0
5
10
15
20
25
30
35
40
2000 2001 2002 2003
State Refugio
Diseases of the Heart DeathsPe
r 10,
000
popu
latio
n
Source: Texas Dept. of Health: Texas Vital Statistics
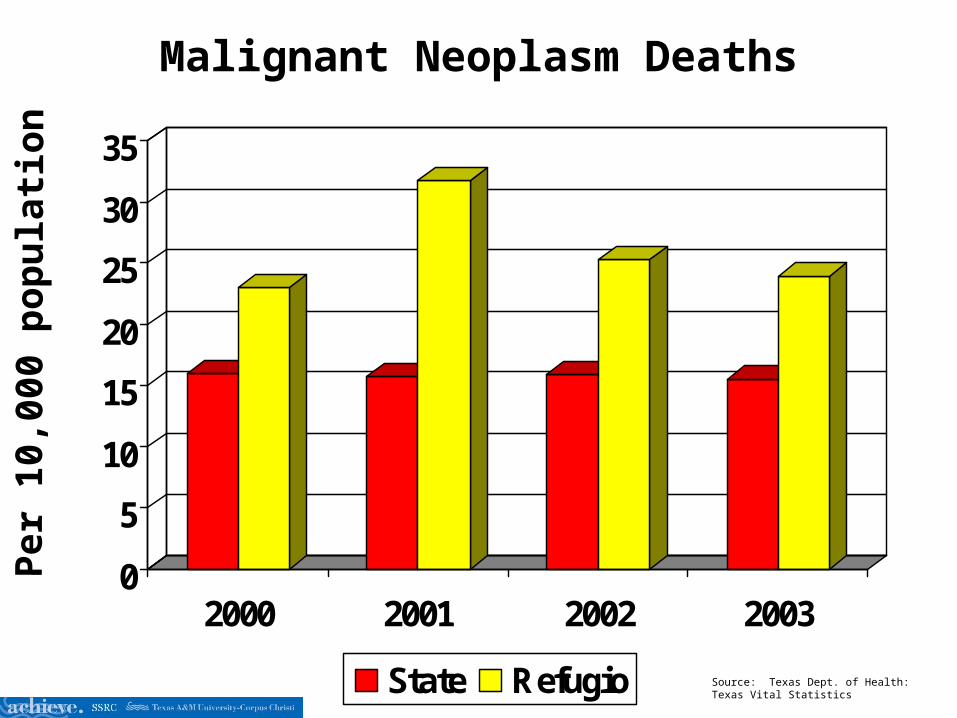
0
5
10
15
20
25
30
35
2000 2001 2002 2003
State Refugio
Malignant Neoplasm DeathsPe
r 10,
000
popu
latio
n
Source: Texas Dept. of Health: Texas Vital Statistics
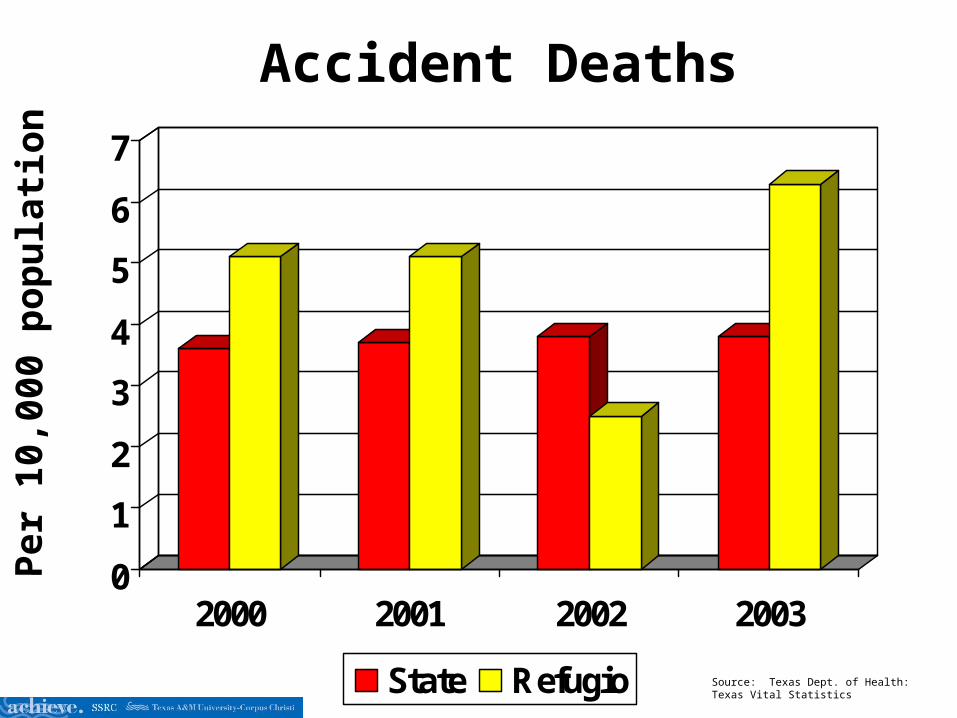
0
1
2
3
4
5
6
7
2000 2001 2002 2003
State Refugio
Accident DeathsPe
r 10,
000
popu
latio
n
Source: Texas Dept. of Health: Texas Vital Statistics

0
0.2
0.4
0.6
0.8
1
1.2
1.4
2000 2001 2002 2003
State Refugio
SuicidePe
r 10,
000
popu
latio
n
Source: Texas Dept. of Health: Texas Vital Statistics
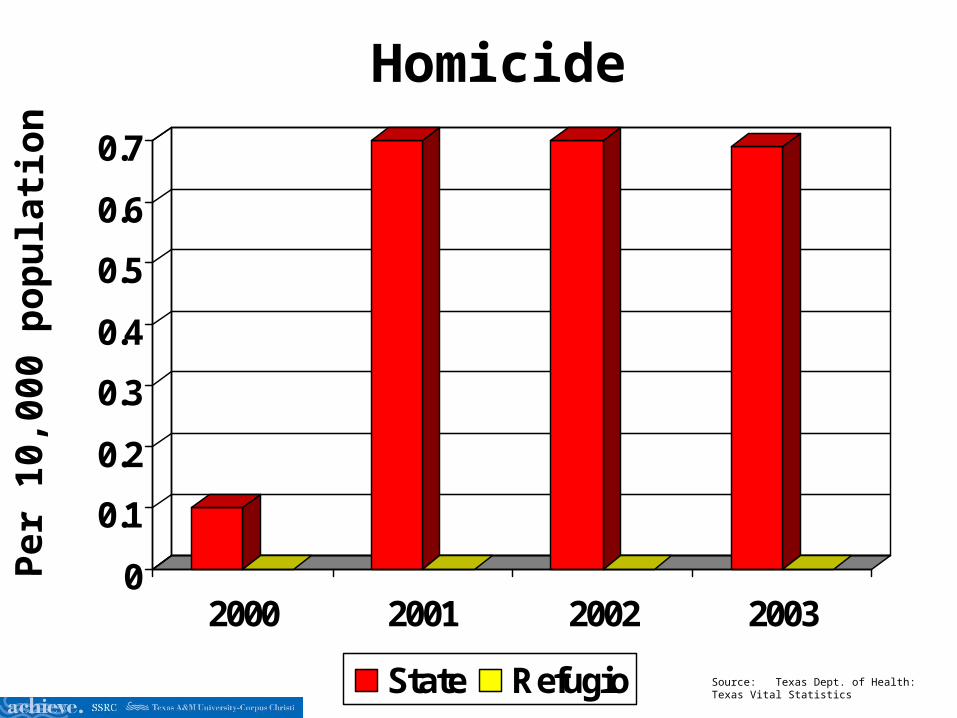
0
0.1
0.2
0.3
0.4
0.5
0.6
0.7
2000 2001 2002 2003
State Refugio
HomicidePe
r 10,
000
popu
latio
n
Source: Texas Dept. of Health: Texas Vital Statistics
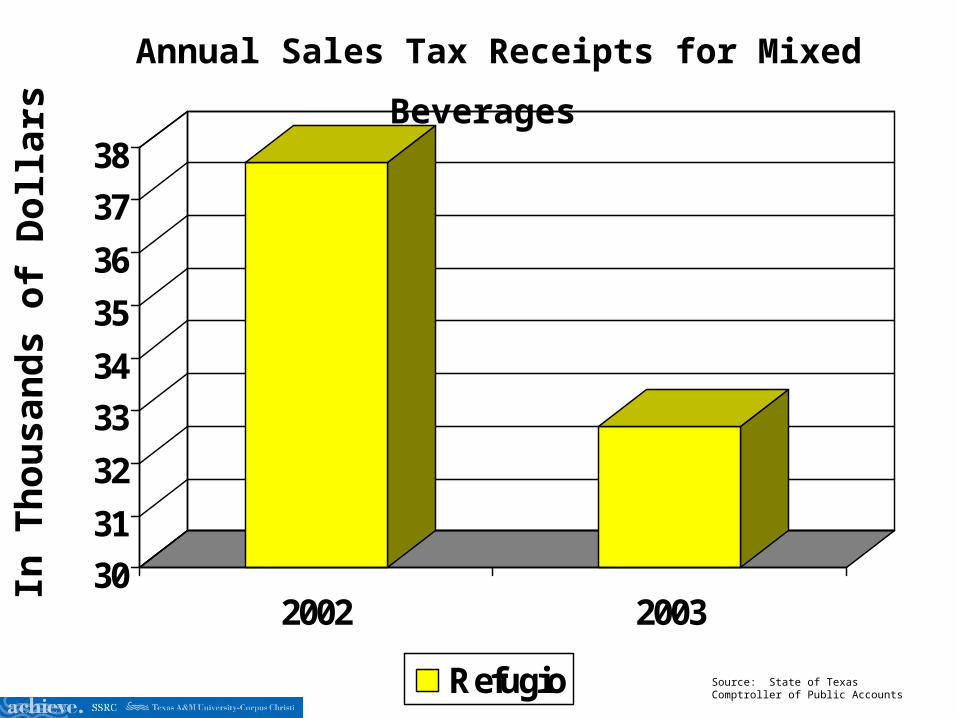
30
31
32
33
34
35
36
37
38
2002 2003
Refugio
Annual Sales Tax Receipts for Mixed Beverages In
Tho
usan
ds o
f Dol
lars
Source: State of Texas Comptroller of Public Accounts

0
10
20
30
40
50
60
70
2000 2004
Owner-Occupied Renter-Occupied Vacant
Total Housing UnitsPe
rce n
t
Source: Dmographicsnow
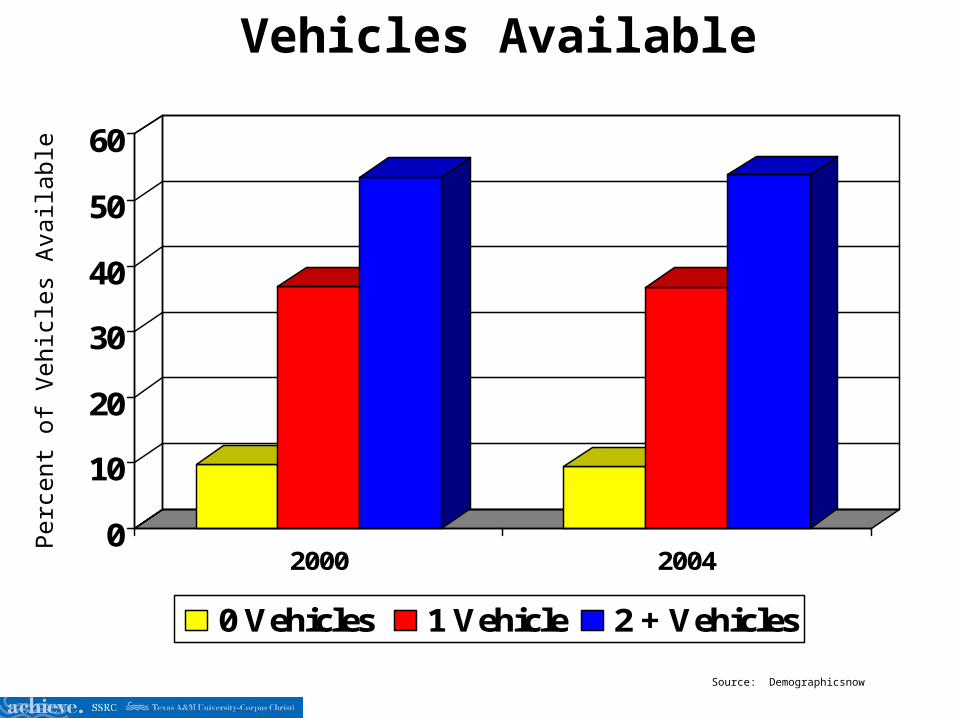
0
10
20
30
40
50
60
2000 2004
0 Vehicles 1 Vehicle 2 + Vehicles
Vehicles Available
Source: Demographicsnow
Per
cent
of
Veh
icle
s A
vaila
ble

0
5
10
15
20
25
30
Public Transportation (%) Travel Time (minutes)
State Refugio
2000 Public Transportation and Travel Time
Source: 2000 U.S. Census Bureau

2000 Residence County to Workplace County: Refugio County
Source: 2000 U.S. Census Bureau
70.9%
29.1%
Work in County Work outside County
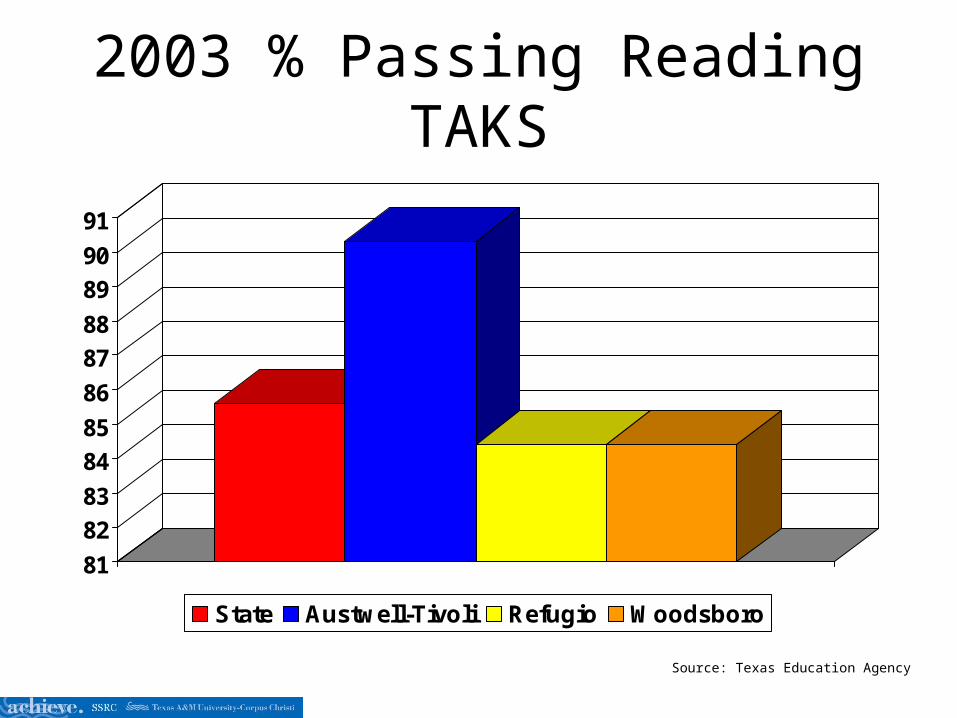
2003 % Passing Reading TAKS
81
82
83
84
85
86
87
88
89
90
91
State Austwell-Tivoli Refugio Woodsboro
Source: Texas Education Agency
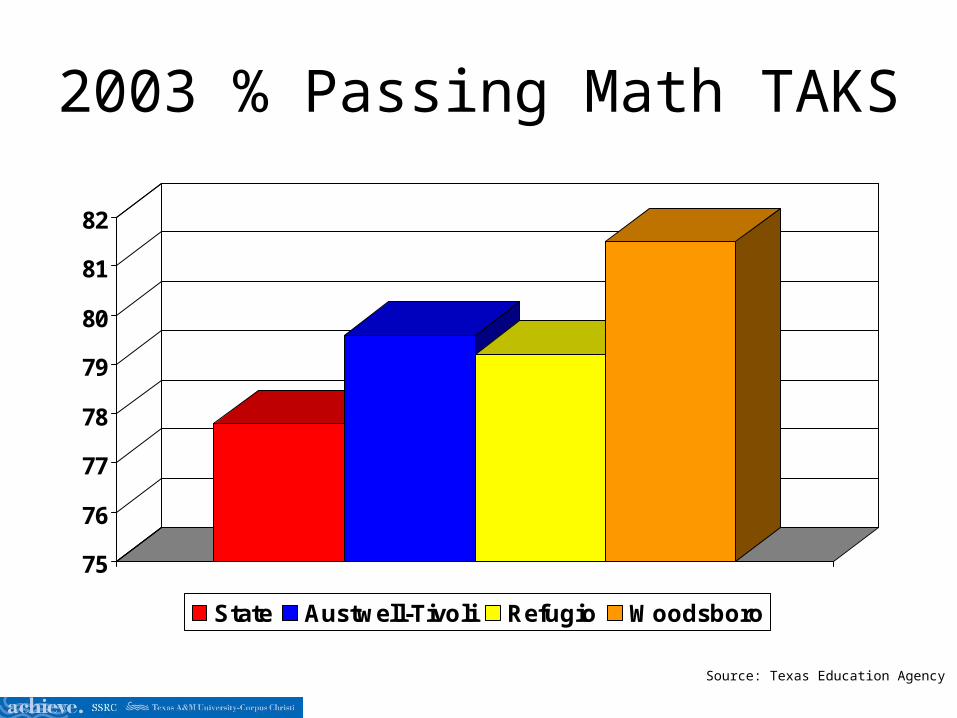
2003 % Passing Math TAKS
75
76
77
78
79
80
81
82
State Austwell-Tivoli Refugio Woodsboro
Source: Texas Education Agency

Reading TAKS Met Standards (Sum of All Grades Tested) (Panel Recommendation)
0
10
20
30
40
50
60
70
80
90
2003 2004
State Austwell Refugio Woodsboro

Math TAKS Met Standards (Sum of All Grades Tested) (Panel Recommendation)
0
10
20
30
40
50
60
70
2003 2004
State Austwell Refugio Woodsboro

2003 % Limited English Proficiency
0
0.2
0.4
0.6
0.8
1
1.2
1.4
1.6
1.8
Austwell-Tivoli Refugio Woodsboro
Source: Texas Education Agency

2003 % Students w/ Disciplinary Placements
0
0.2
0.4
0.6
0.8
1
1.2
1.4
1.6
1.8
Austwell-Tivoli Refugio Woodsboro
Source: Texas Education Agency

Percent of Economically Disadvantaged Students
0
10
20
30
40
50
60
2000 2001 2002 2003
State Austwell-Tivoli Refugio Woodsboro
Source: Texas Education Agency

Attendance Rate
94.6
94.895
95.2
95.495.695.8
96
96.296.496.6
1999 2000 2001 2002
State Austwell-Tivoli Refugio Woodsboro
Source: Texas Education Agency
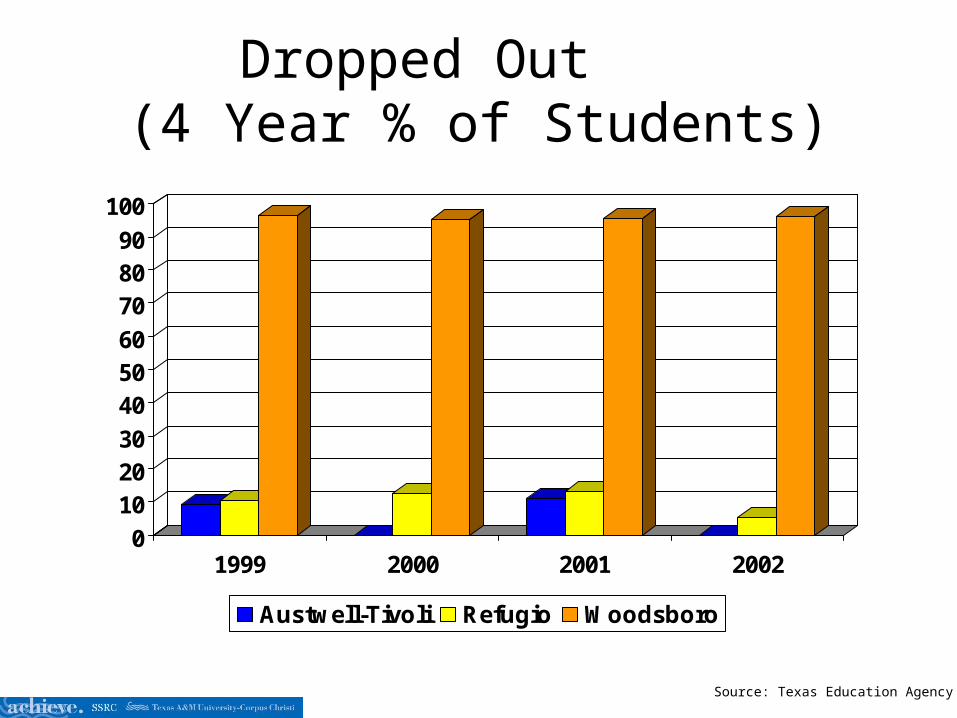
Dropped Out (4 Year % of Students)
0
102030
405060
708090
100
1999 2000 2001 2002
Austwell-Tivoli Refugio Woodsboro
Source: Texas Education Agency

Total Number of Students
0
100
200
300
400
500
600
700
800
900
2000 2001 2002 2003
Austwell-Tivoli Refugio Woodsboro
Source: Texas Education Agency

High School Rate of Graduation
0
102030
40506070
8090
100
2000 2001 2002 2003
Austwell-Tivoli Refugio Woodsboro State
Source: Texas Education Agency

2000 Percent of Students by Ethnicity/Race
0
10
20
30
40
50
60
70
80
White Hispanic African-American
Other
Austwell-Tivoli Refugio Woodsboro
Source: Texas Education Agency

2001 Percent of Students by Ethnicity/Race
0
10
20
30
40
50
60
70
80
White Hispanic African-American
Other
Austwell-Tivoli Refugio Woodsboro
Source: Texas Education Agency

2002 Percent of Students by Ethnicity/Race
0
10
20
30
40
50
60
70
White Hispanic African-American
Other
Austwell-Tivoli Refugio Woodsboro
Source: Texas Education Agency

2003 Percent of Students by Ethnicity/Race
0
10
20
30
40
50
60
70
White Hispanic African-American
Other
Austwell-Tivoli Refugio Woodsboro
Source: Texas Education Agency
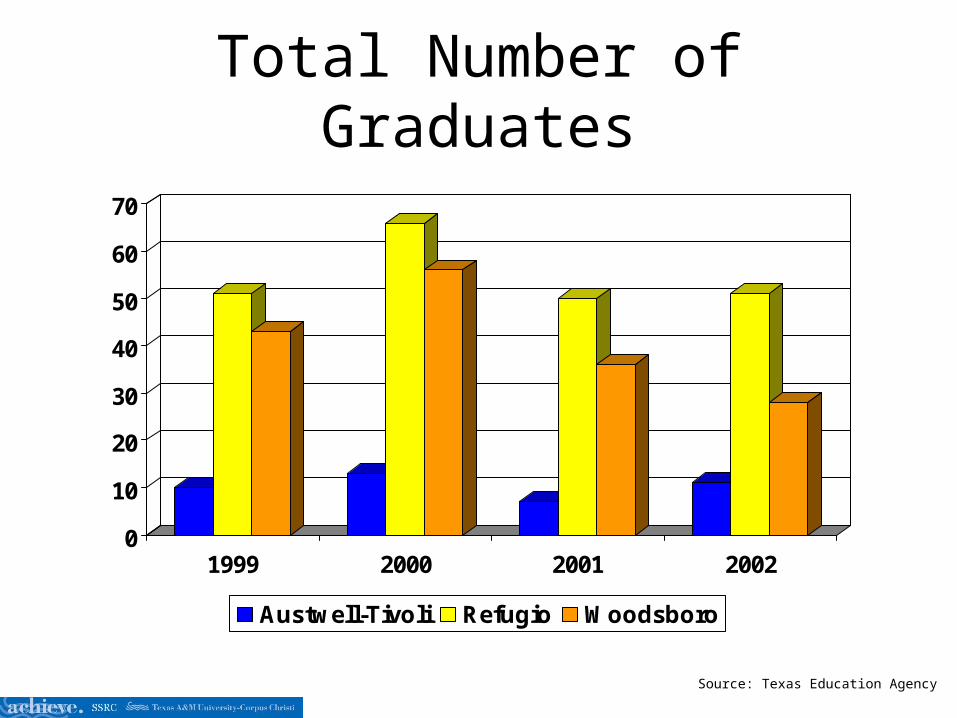
Total Number of Graduates
0
10
20
30
40
50
60
70
1999 2000 2001 2002
Austwell-Tivoli Refugio Woodsboro
Source: Texas Education Agency

1999 Percent of Graduates by Ethnicity/Race
0
10
20
30
40
50
60
70
White Hispanic African-American
Other
Austwell-Tivoli Refugio Woodsboro
Source: Texas Education Agency
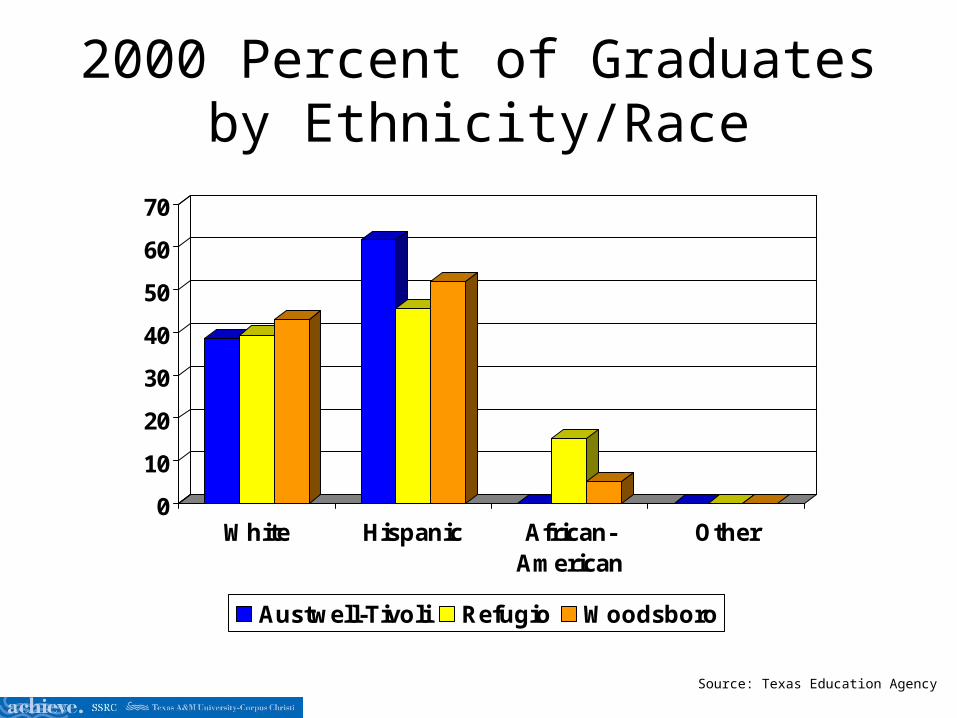
2000 Percent of Graduates by Ethnicity/Race
0
10
20
30
40
50
60
70
White Hispanic African-American
Other
Austwell-Tivoli Refugio Woodsboro
Source: Texas Education Agency
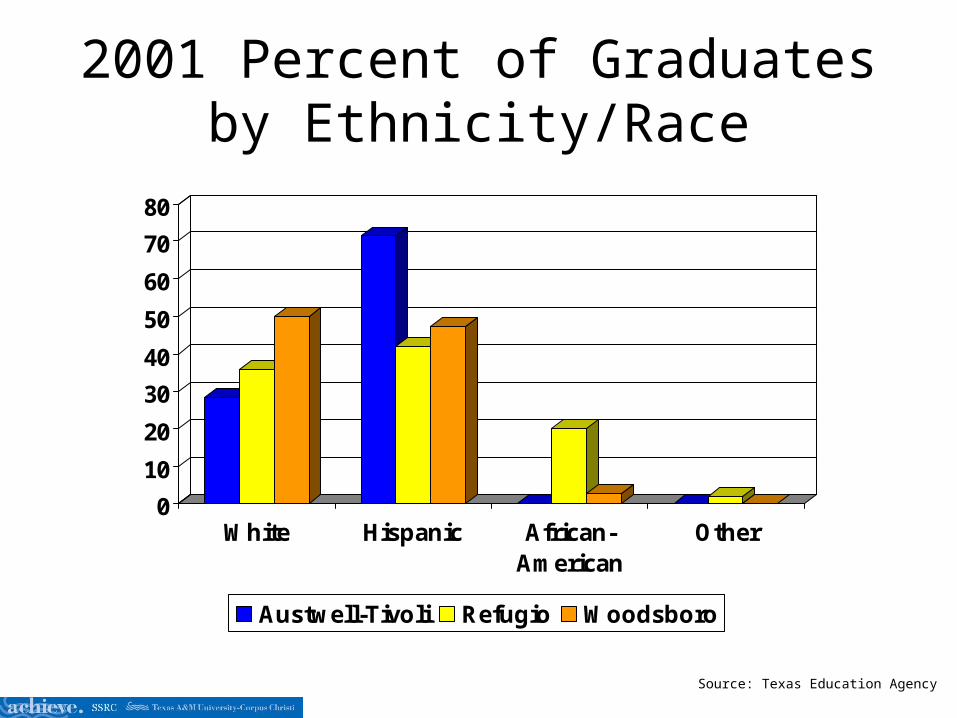
2001 Percent of Graduates by Ethnicity/Race
0
10
20
30
40
50
60
70
80
White Hispanic African-American
Other
Austwell-Tivoli Refugio Woodsboro
Source: Texas Education Agency
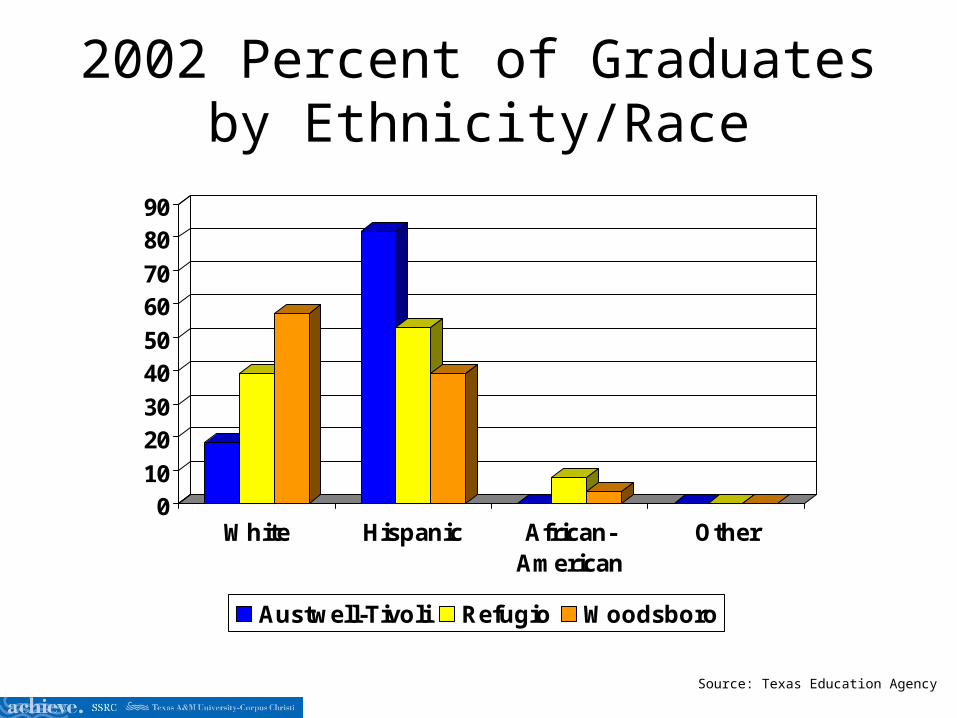
2002 Percent of Graduates by Ethnicity/Race
010
2030
4050
6070
8090
White Hispanic African-American
Other
Austwell-Tivoli Refugio Woodsboro
Source: Texas Education Agency

Educational AttainmentPopulation Age 25 +
0
5
10
15
20
25
30
35
2000 2004
Grade K-8 Grade 9-12 HS Graduate Associates
Bachelor Graduate Degree Some College No Schooling
Source: Demographicsnow
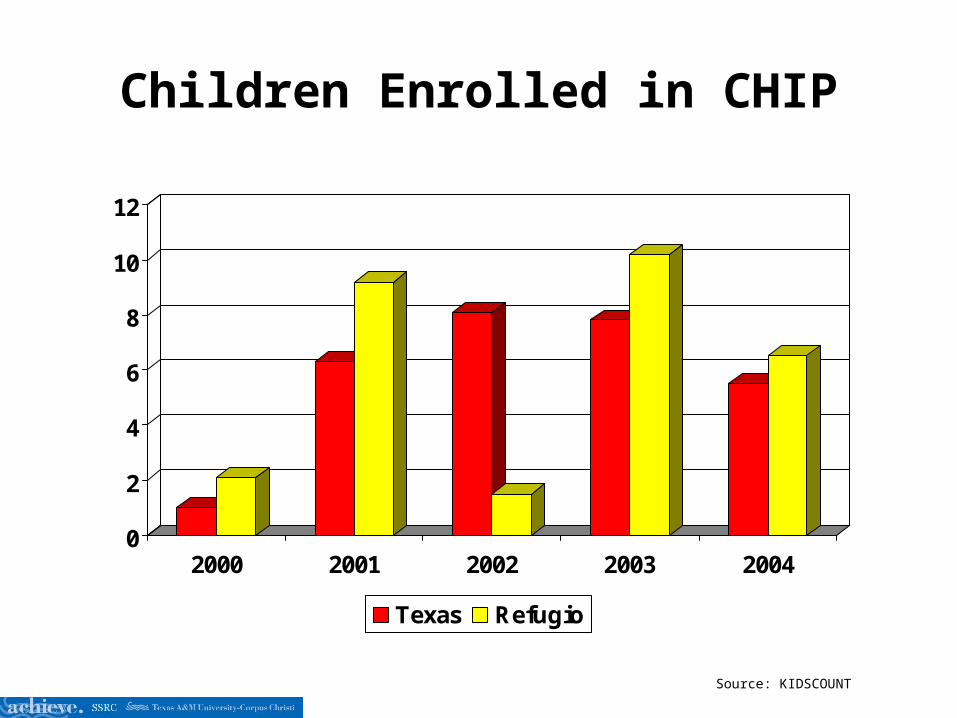
Children Enrolled in CHIP
0
2
4
6
8
10
12
2000 2001 2002 2003 2004
Texas Refugio
Source: KIDSCOUNT

Infants and Children Receiving WIC
05
10
152025303540
4550
2000 2001 2002 2003 2004
Texas Refugio
Source: WIC AUSTIN

% Taking SAT/ACT
01020
304050607080
90100
1999 2000 2001 2002 2003
Texas Refugio
Source: Texas Education Agency
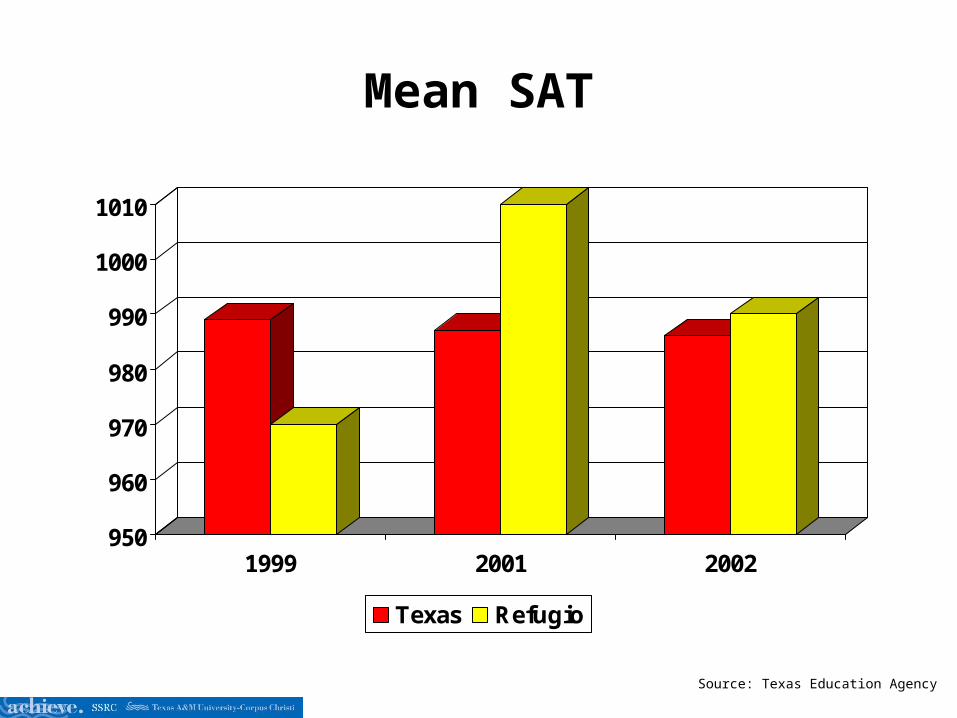
Mean SAT
950
960
970
980
990
1000
1010
1999 2001 2002
Texas Refugio
Source: Texas Education Agency

Mean ACT
16.5
17
17.5
18
18.5
19
19.5
20
20.5
1999 2000 2001 2002 2003
Texas Refugio
Source: Texas Education Agency
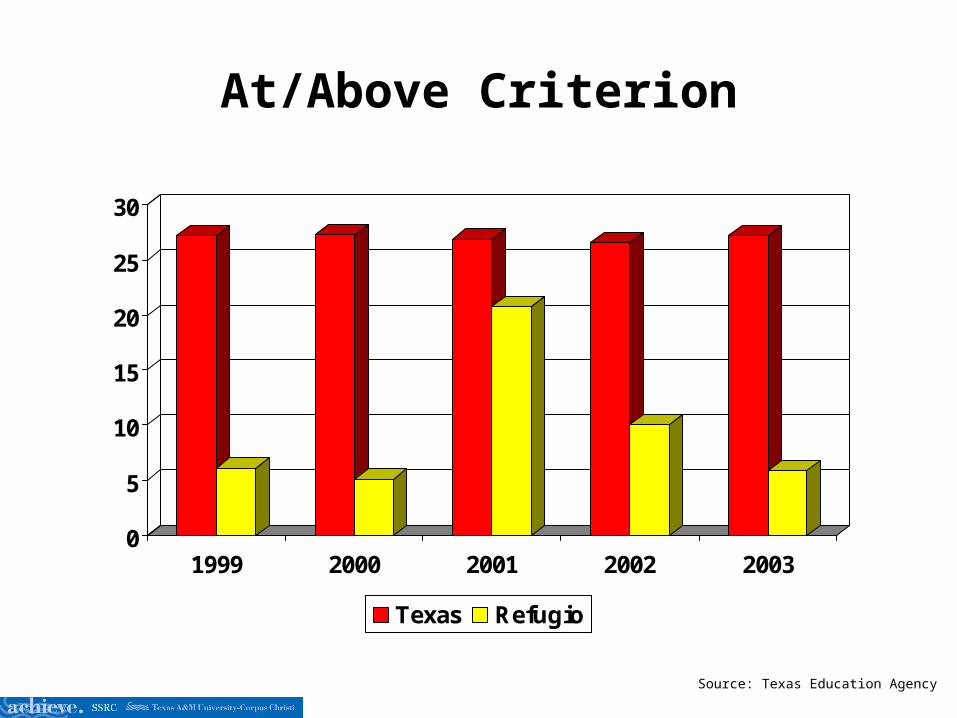
At/Above Criterion
0
5
10
15
20
25
30
1999 2000 2001 2002 2003
Texas Refugio
Source: Texas Education Agency
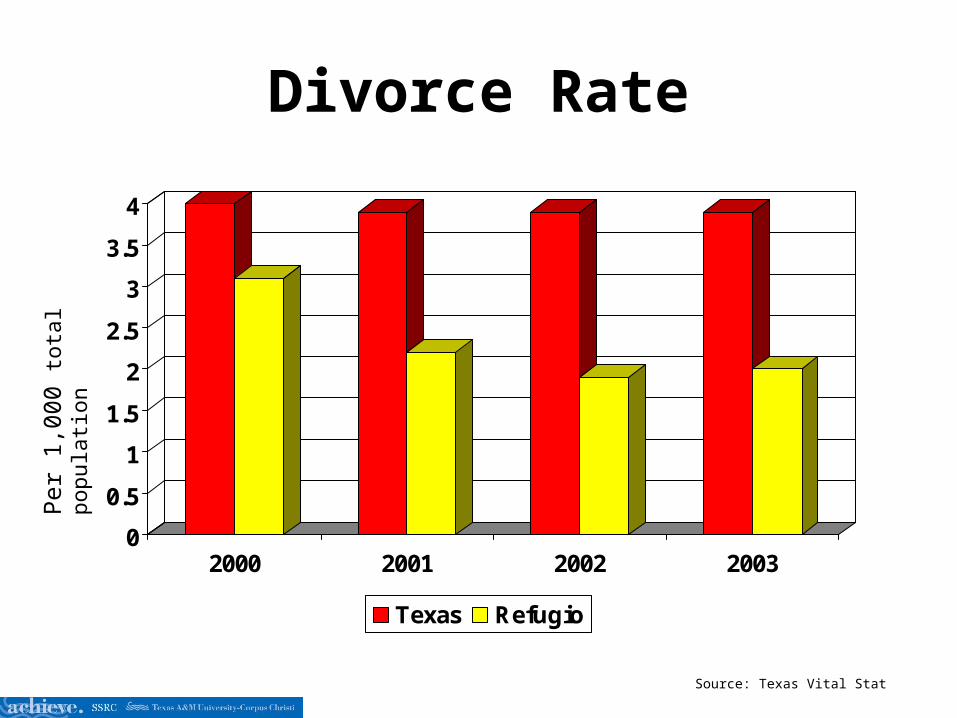
Divorce Rate
0
0.5
1
1.5
2
2.5
3
3.5
4
2000 2001 2002 2003
Texas Refugio
Per
1,0
00 to
tal p
opul
atio
n
Source: Texas Vital Stat

% of Children in Head Start Program ages 3 and 4
0
5
10
15
20
25
30
35
40
45
2000 2001 2002
Texas Refugio
Source: KIDSCOUNT

Marriage Percentage
0
1
2
3
4
5
6
7
8
9
10
2000 2001 2002 2003
State
Refugio
Source: Texas Vital Stat
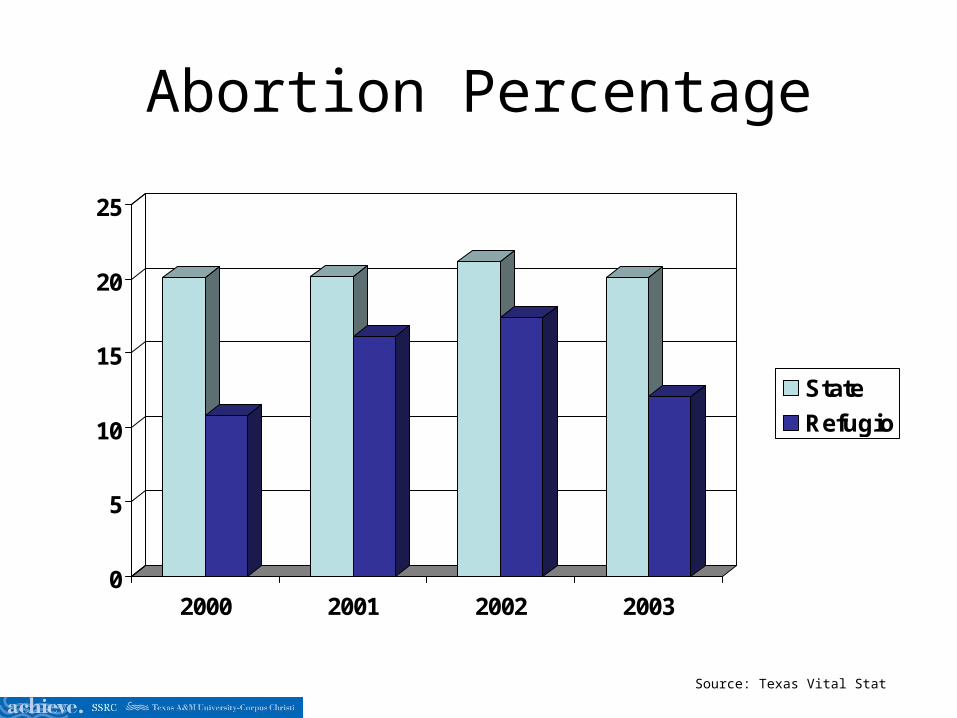
Abortion Percentage
0
5
10
15
20
25
2000 2001 2002 2003
State
Refugio
Source: Texas Vital Stat

HIV per 1,000
Source: Texas Vital Stat
0
0.1
0.2
0.3
0.4
0.5
0.6
0.7
0.8
0.9
2000 2001 2002 2003
State
Refugio

AIDS per 1,000
0
0.5
1
1.5
2
2.5
3
3.5
2000 2001 2002 2003
State
Refugio
Source: Texas Vital Stat
Related Documents