7 2.0 REVIEW OF PREVIOUS WORK 2.1 Introduction Since 1984, there have been an increasing number of case studies where aging effects in sands were observed. Most of the data from field studies come from quality control pro- grams, which were used to evaluate the effectiveness of ground modification at a site. Unfortunately, variables that may be potentially relevant to aging effects such as sand mineralogy, temperature, pore fluid composition, and variability of the soil properties are not usually recorded. Therefore, it is difficult to draw conclusions from individual stud- ies and a review of the general body of case studies is needed. A review of examples of aging effects in sands from the literature is presented in this chapter. The examples are grouped according to the property affected, and include small strain shear modulus, electrical and thermal conductivity, liquefaction resistance, stiffness and shear strength, and the penetration resistance of the sand. This review of examples of observed aging effects in sands draws heavily on a prior study by Human (1992). 2.2 Aging Effects on the Small Strain Shear Modulus of Sands The small strain shear modulus, G o , is an important parameter for many geotechnical analyses in earthquake engineering and soil dynamics. The value of G o depends on a number of parameters, including void ratio, confining stress, soil structure, degree of saturation, temperature, stress history, and time. Afifi and Woods (1971) performed resonant column tests on samples of air-dried medium sand, silt, and kaolinite clay to measure G o . A constant confining pressure was applied for up to 70 days, and results showed that the small strain shear modulus increased linearly with the logarithm of time. This is shown for Ottawa sand in Figure 2.1. This increase with time can be expressed by the equation

Welcome message from author
This document is posted to help you gain knowledge. Please leave a comment to let me know what you think about it! Share it to your friends and learn new things together.
Transcript

7
2.0 REVIEW OF PREVIOUS WORK
2.1 Introduction
Since 1984, there have been an increasing number of case studies where aging effects in
sands were observed. Most of the data from field studies come from quality control pro-
grams, which were used to evaluate the effectiveness of ground modification at a site.
Unfortunately, variables that may be potentially relevant to aging effects such as sand
mineralogy, temperature, pore fluid composition, and variability of the soil properties are
not usually recorded. Therefore, it is difficult to draw conclusions from individual stud-
ies and a review of the general body of case studies is needed.
A review of examples of aging effects in sands from the literature is presented in this
chapter. The examples are grouped according to the property affected, and include small
strain shear modulus, electrical and thermal conductivity, liquefaction resistance, stiffness
and shear strength, and the penetration resistance of the sand. This review of examples of
observed aging effects in sands draws heavily on a prior study by Human (1992).
2.2 Aging Effects on the Small Strain Shear Modulus of Sands
The small strain shear modulus, Go, is an important parameter for many geotechnical
analyses in earthquake engineering and soil dynamics. The value of Go depends on a
number of parameters, including void ratio, confining stress, soil structure, degree of
saturation, temperature, stress history, and time. Afifi and Woods (1971) performed
resonant column tests on samples of air-dried medium sand, silt, and kaolinite clay to
measure Go. A constant confining pressure was applied for up to 70 days, and results
showed that the small strain shear modulus increased linearly with the logarithm of time.
This is shown for Ottawa sand in Figure 2.1. This increase with time can be expressed by
the equation

8
( ) ( )G t G t Nt
to o o Go
= +
1 log (2.1)
where
Go(t) = Small strain shear modulus at some time t
Go(to) = Small strain shear modulus at an initial time to, usually taken at 1000 minutes
NG = Slope of the relationship between the small strain shear modulus,
normalized with respect to Go(to), and logarithm of time
Values of NG ranged from 2-5% for the air-dried sands to 5-12% for the air-dried silts
and clays. Afifi and Woods concluded from these results that the rate of increase in the
small strain shear modulus with time increased with decreasing particle size of the soil.
In similar studies, Afifi and Richart (1973) and Anderson and Stokoe (1978) reported NG
values for dry sand specimens of <3% and 1%, respectively.
Also shown in Figure 2.1 is the measured vertical strain during the test. In all of these
cases, there was very little change in the void ratio of the samples, and the measured in-
creases in small strain shear modulus could not be explained by an increase in density.
Jamiolkowski (1996) reported the values of NG for several sands, as shown in Table 2.1.
Note that sands with significant amounts of carbonate minerals show higher values of NG
than do silica sands.
The time-dependent increase in the small strain shear modulus is very sensitive to distur-
bance (Thomann 1990; Thomann and Hryciw 1990). A dynamic disturbance, which
could result from such things as earthquake loading, blast densification, and vibrocom-
paction, can partially or completely destroy any previous time-dependent increase in the
modulus. Thomann investigated the factors influencing the magnitude and duration of
disturbance by measuring the development of the small strain shear modulus during reso-
nant column tests. The magnitude of shear strain was found to be the governing factor in

9
the magnitude of the modulus decrease. For shear strains less than 0.1%, the decrease in
modulus was temporary. For shear strains larger than 0.1%, the small strain shear
modulus did not return to pre-disturbance values. However, the specimens were only
aged for three days following the shear deformations. This may have been too short a
time to regain the pre-disturbance values.
Table 2.1 Values of NG for various soils (after Jamiolkowski 1996).
Soil NG (%) NotesTicino sand 1.2 Predominantly silica
Hokksund sand 1.1 Predominantly silicaMessina sand and gravel 2.2-3.5 Predominantly silica
Messina sandy gravel 2.2-3.5 Predominantly silicaGlauconite sand 3.9 50% Quartz
50% GlauconiteQuiou sand 5.3 CarbonaticKenya sand 12 Carbonatic
Human (1992) performed a study on the effects of time on the shear wave velocity of dry
sand in triaxial tests using piezoceramic bender elements. Using bender elements for the
measurement of shear wave velocity is discussed in detail in chapter four. The shear
wave velocity can be related to the small strain shear modulus using the theory of elastic-
ity, and can be written as
Go = ρ vs2 (2.2)
where
Go = small strain shear modulus
ρ = mass, or total, density
vs = shear wave velocity
The effects of confining stress, density, stress anisotropy, and saturation on the rate of
velocity increase with time were measured. The term Vα, defined as the slope of the

10
shear wave velocity – logarithm time relationship, was used to assess the aging effects.
Vα is analogous to the term NG mentioned above.
For effective confining stresses of 50 to 300 kPa, there appeared to be no trend in how the
confining stress affected Vα. There was, however, an increase in Vα as the relative den-
sity decreased from 78% to 48%. Samples were tested at different ratios of σ’ 3/σ’ 1 (1,
0.7, 0.4), and as the degree of anisotropy increased, the value of Vα decreased. The two
samples that were saturated prior to aging showed no increase in the shear wave velocity
with time.
2.3 Aging Effects on the Thermal and Electrical Conductivity of Sands
In soil mechanics, conductivity refers to the ease with which something can pass through
soils and rocks (Mitchell 1993). The most common example is the flow of water through
soils, which is characterized by the hydraulic conductivity. Similarly, thermal conduc-
tivity can be used to quantify the heat transfer through a soil and the electrical conductiv-
ity for the flow of electricity through soil.
Thermal and electrical conductivity measurements in soils are relatively easy to make,
and they are thought to be non-destructive (i.e. they do not alter the properties of the
specimen being tested). Because of this, and because conductivity can be related to the
compositional and structural characteristics of a soil, conductivity measurements have
been used to observe aging effects in sands in the laboratory. Brandon and Mitchell
(1989) measured the thermal resistivity, which is the inverse of the conductivity, with
time for three sands: Monterey No. 60, Surge sand, and Crystal silica sand. The results,
shown in Figure 2.2, show that the thermal resistivity for the Crystal silica sand decreased
by approximately 20% over a period of 60 days before becoming constant. On the other
hand, the thermal resistivity of both the Monterey No. 60 and the Surge sand remained
constant over the same period of time. Scanning electron micrographs were reported to
show evidence of material accumulation between the grains of the Crystal silica sand. It

11
was postulated that there was formation of silica-acid gel at the grain contacts, and that
this accounted for the decreased resistivity.
Human (1992) studied aging effects in Crystal silica sand by measuring the electrical
conductivity. During this study, it was discovered that Crystal silica sand contains ap-
proximately 1% montmorillinite. Accordingly, it is possible that material that had accu-
mulated between sand grains in Brandon’s experiment was clay. The presence of clay
particles, which are negatively charged, confuses the results of electrical conductivity
measurements because of surface conductance effects of the particles. In effect, the dif-
fuse ionic double layer surrounding the clay particles provides an additional path for cur-
rent flow. Human was able to measure time-dependent property changes with electrical
conductivity measurements, however, the presence of the clay made interpretation of the
results difficult.
2.4 Aging Effects on Liquefaction Resistance
Seed (1979) recognized the significance of time on the liquefaction resistance of sand
deposits. He presented results of a laboratory testing program in which cyclic triaxial
tests were performed on Monterey No. 0 sand. Samples were prepared to a relative den-
sity of 50% and consolidated for different periods of time under an effective confining
stress of 155 kPa. The consolidation times were 0.1, 1, 10, and 100 days. A clear aging
effect was observed; there was a 12% increase in liquefaction resistance at 10 days and a
25% increase after 100 days of aging. This data was compared to the results of tests on
undisturbed specimens, as shown in Figure 2.3. From this, Seed concluded that the lique-
faction resistance of natural deposits might be as high as 75% greater than that of freshly
deposited laboratory specimens. He also postulated that some form of cementation or
cold welding was responsible for the aging effect, but no evidence of this was presented.
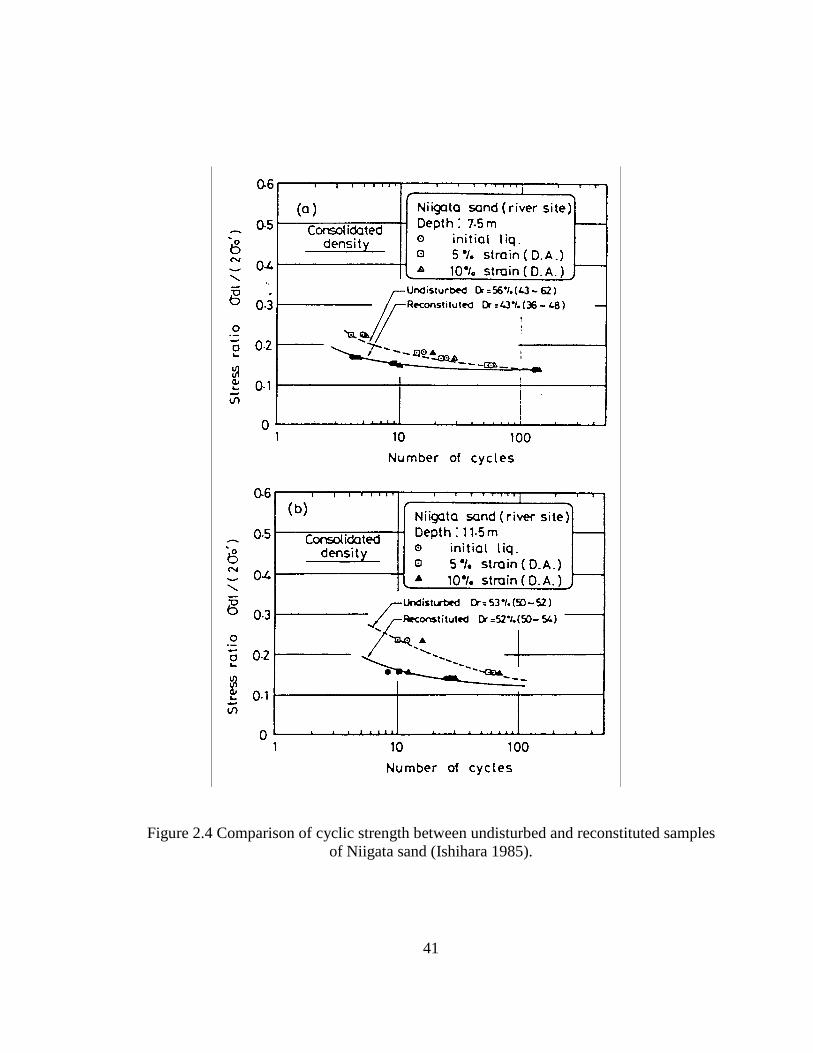
Ishihara (1985) also presented examples of the effect of aging on liquefaction resistance.
Instead of aging specimens in the laboratory, however, Ishihara compared undisturbed

12
and reconstituted specimens of Niigata sand. The undisturbed specimens were obtained
using a large diameter sampler, and the results of the tests are shown in Figure 2.4. It
was found that the cyclic shear resistance was consistently higher for the undisturbed
specimens than for the reconstituted specimens. The difference between the two was
more pronounced for samples subjected to a higher cyclic stress ratio, which then failed
in a fewer number of cycles of loading.
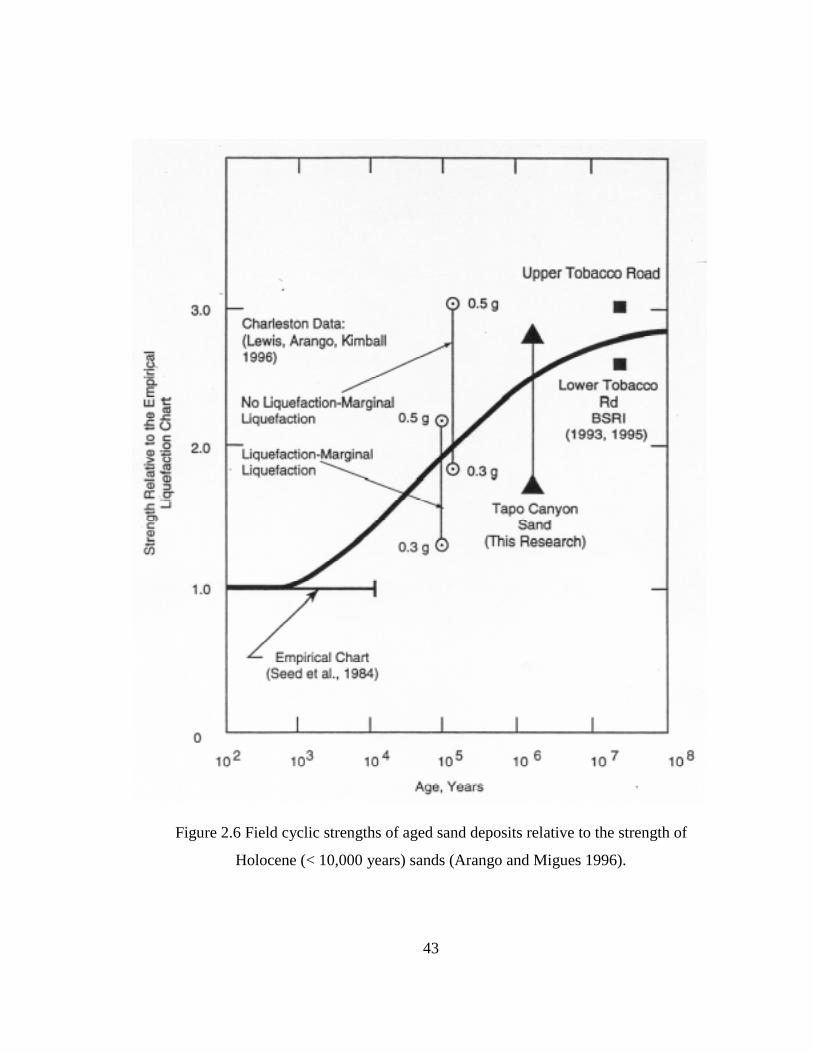
More recently, Arango and Migues (1996) investigated the performance of sand deposits
older than 10,000 years within the area affected by the Northridge earthquake in January
1994. A search was undertaken to find sites of older sand deposits near sites that had liq-
uefied. The Tapo Canyon sand met the search criteria and 18 cyclic triaxial tests were
performed on both undisturbed and reconstituted samples. Figure 2.5 shows a typical
pore pressure response due to cycles of loading for an undisturbed (cut from a block
sample) and reconstituted sample. The pore pressure ratio, r(u), is defined as the change
in pore pressure divided by the effective confining stress. The results showed that the
development of pore pressure was much less in the undisturbed sample, corresponding to
an undisturbed cyclic strength that was significantly higher than the reconstituted cyclic
strength.
In order to investigate the hypothesis that cementation at the particle contacts was re-
sponsible for the increased strength, Arango and Migues (1996) performed controlled
freezing and thawing of the undisturbed samples. This was done to impose small but uni-
form volumetric strains that might break any brittle bonds without altering the fabric of
the samples. The results showed that the pore pressure response under cyclic loading was
not changed significantly by the freeze/thaw process, and it was postulated that increased
interlocking caused by infilling or overgrowth was responsible for the aging effects.
The undisturbed cyclic strength of the Tapo Canyon sand was also compared to the cyclic
strength that would correspond to a “young” (<10,000 years) sand deposit. From the

13
measured blow counts at the site, a cyclic stress ratio corresponding to liquefaction was
estimated using the empirical chart developed by Seed et al. (1984). The chart was de-
veloped from field data of “young” deposits, and did not reflect the behavior of sand de-
posits greater than 10,000 years old. The measured cyclic strength of the Tapo Canyon
sand was 1.6 to 2.7 times greater than the estimated cyclic strength using the empirical
approach. This data, along with data obtained in a similar manner from two sites in
South Carolina, is shown in Figure 2.6.
2.5 Aging Effects on the Stiffness and Shear Strength of Sands
Some of the earliest work on the time-dependent properties of sands was performed in the
former Soviet Union. Denisov and Reltov (1961) studied the development of adhesion
between sand grains and a quartz plate with time. An experimental program was devel-
oped which involved placing the grains on a vibrating quartz or glass plate and measuring
the shear force necessary to move the grains. The equipment setup used in the experi-
ments is shown in Figure 2.7. The dry grains were allowed to sit on the plate for varying
times (up to 20 hours), after which the sand and plate were submerged in water and vi-
brated. The amount of time that the sand was submerged before vibration occurred was
also varied (42 hours, 6 days, and 14 days).
Figure 2.8 shows the results of the vibrating plate experiments. The ordinate is the shear
force required to move the sand grain normalized with the shear force measured after 20
hours of dry contact. The abscissa is the time of dry contact before the sand was sub-
merged, and each line represents different periods of soaking. These results show that the
shear force required to move the sand grains increased as the amount of time the plate
was submerged increased. In fact, there was an approximately 320% increase in the
measured shear force between the grains that were submerged for 14 days after 20 hours
of dry contact and the grains that had only had a 20 hour period of dry contact.

14
Denisov and Reltov hypothesized that the increase in shear force with time was caused by
the formation of a thin layer of silicic acid gel around the sand grains, resulting from dis-
solution of the sand by the water. However, there was no explanation of the increase in
shear force during the 20 hours of dry contact only.
As a part of a larger study on the influence of stress history on the stress-strain behavior
of sand, Daramola (1980) investigated the effects of aging on both the stiffness and shear
strength. Four consolidated drained tests on Ham River sand were performed. Each
sample was prepared to the same density but consolidated for different periods of time (0,
10, 30 and 152 days). The effective confining stress was 400 kPa throughout the tests.
The results, shown in Figure 2.9, show that the stiffness increased and the strain to failure
decreased with increasing time of consolidation. The volumetric strain data also shows
that the axial strain at which the soil became dilatant decreased with increasing time.
From the results, the author concluded that a 50% increase in modulus occurs for each
log cycle of time. Despite the increase in modulus and dilatancy, however, there was no
increase in the shear strength of the sand with time.
Schmertmann (1991) postulated that the aging process for both clays and sands was en-
tirely frictional in nature, resulting from some combination of dispersive particle move-
ments, internal stress arching, and increased interlocking. Evidence presented to support
this hypothesis relied heavily on the results of IDS tests, which were developed
(Schmertmann 1976; 1981) to separate the frictional and cohesive components of shear
strength. Details of this evidence are presented in section 3.2.
Schmertmann also presented the results of a new test in which a quasi-preconsolidation
pressure was measured for the first time in a sand specimen. This term was first used by
Leonards and Ramiah (1959) to describe the reduction in stiffness and increase in pre-
consolidation pressure that occurs during periods of secondary compression in normally
consolidated clays. An 8-inch diameter plate load test was performed in a large box

15
containing dry quartz sand. The load on the plate was incrementally increased and the
corresponding settlements were measured. One of the loads was kept on the sand for 844
minutes before the next load was applied. Figure 2.10 shows that, after 844 minutes, the
stiffness of the sand to loading increased significantly, and this effect continued until a
quasi-preconsolidation pressure of 350 pounds was exceeded. Prior to performing the
load test, however, the sand was first loaded laterally to passive failure for a few minutes
and then unloaded to active horizontal stress conditions for approximately 30 minutes.
This was accomplished with lateral air bags mounted on the sides of the box. It is not
clear how the above loading cycles affected the soil, but without it Schmertmann was un-
able to produce the quasi-preconsolidation effect.
Human (1992) conducted three consolidated drained triaxial tests in a study similar to
that of Daramola (1980). These tests were part of a larger study to determine the effect of
time on the shear wave velocity of sand as described in section 2.2. Dry Crystal silica
sand was used for the tests, and the samples were prepared to a relative density of 78%.
Each sample was consolidated for different periods of time (1 hour, 3 days, 28 days), and
the results of the tests are shown in Figure 2.11. Shear wave velocity measurements were
made throughout each test and Figure 2.11 (a) shows a consistent increase in the shear
wave velocity, and thus in the small strain shear modulus, with time. Despite this, how-
ever, there was very little difference between the modulus during shear and strength of
the three samples, as shown in Figure 2.11 (b).
Pender et al. (1992) reported the results of cyclic simple shear tests done on different
types of pavement base course materials to measure changes in the density and stiffness
under repeated loading. Strain controlled tests were performed with up to 500,000 cycles
of deformation. These tests were conducted over a five-day period, with 100,000 cycles
per day. After each day, the specimens were rested overnight before the next stage of
cycles resumed. At the resumption of testing each morning, the measured secant shear
modulus was found to have increased 10 to 17%, as shown in Figure 2.12 (a). It was also

16
found that the magnitude of the increase was larger for tests run at smaller strain levels.
Figure 2.12 (b) shows that there was no corresponding increase in density during the time
between loadings to account for the measured increase in secant modulus. The ordinate in
Figure 2.11 (b) is the current density divided by the initial density.
Most recently, Martin et al. (1996) found that time-dependent changes in stiffness can be
caused by bacterial growth. A study was conducted on the feasibility of using bacteria
and biopolymers for the construction of impervious barriers. Triaxial tests were per-
formed on samples with up to 45 days of aging. Results of the laboratory tests showed
that bacteria and biopolymer (Xanthan gum) laden pore water reduced the hydraulic con-
ductivity of a silty soil by 100 times and increased the shear strength by 50%. Results of
the strength testing are shown in Figure 2.13. The dashed line in Figure 2.13 shows the
baseline strength of the soil without bacteria or biopolymers. However, it is not clear if
the “clean” specimens were actually aged or whether the curve was extrapolated from the
strength of the fresh specimens.
2.6 Aging Effects on the Penetration Resistance of Sands
Most of the examples of aging effects in the literature involve in situ tests such as the
cone penetration test. Fifteen separate case studies are presented and discussed below.
2.6.1 Jebba Dam Project (Mitchell and Solymar 1984)
The Jebba Dam project was the first well-documented field case where aging effects were
both significant and widespread. The project involved the improvement of the founda-
tion soils beneath a proposed 42 m high dam and seepage blanket on the Niger river in
Nigeria. The foundation soils consisted of deep deposits of alluvial sand, the properties
of which are summarized in Table 2.2. In some areas the depth to bedrock was greater
than 70 m. Due to the variable relative density of the deposit, the large loads associated
with the dam, and the potential for liquefaction during an earthquake, differential settle-
17
ments that would cause cracking of both the dam core and the seepage blanket were a
major concern.
Table 2.2 Properties of Jebba Sand.
Sand DescriptionSubrounded to rounded coarse silica sand
91.8% quartz, 2.2% granites,2% volcanics, 1.6% feldspar,
1.4% gneiss, 1% chertUniformity Coefficient, Cu 2.94
Average Saturated Unit Weight* 20.1 kN/m3
D50 0.17 – 4.30 mm* Ranged from 19.3 kN/m3 to 21.1 kN/m3
A two stage densification program was designed to deal with the large depths of the loose
zones in the sand deposit. The upper 25 m of sand (and a 5 to 10 m thick sand pad placed
by hydraulic filling of the river) was densified using vibrocompaction. Blast densifica-
tion was used to densify the deeper loose zones between 25 and 40 m depth.
During blasting, it was observed that the sand exhibited both sensitivity (i.e. strength loss
on disturbance) and aging effects. A typical example of the initial decrease in penetration
resistance after blasting densification and subsequent increase with time is shown in Fig-
ure 2.14. This phenomenon occurred throughout the site and followed a general pattern.
Initially after improvement, there would be a decrease in penetration resistance despite
the fact that surface settlements ranging from 0.3 m - 1.1 m were measured, which would
imply an increase in density. With time (measured up to 124 days after improvement),
however, the cone penetration resistance was found to increase by approximately 50-
100% of the original values.
Aging effects were also observed after both placement of hydraulic fill and vibrocom-
paction. In the case of vibrocompaction, however, there was considerable variability in
the magnitude of the aging effects throughout the site. It is interesting to note that, unlike

18
the areas where blast densification was performed, the penetration resistance immediately
after vibrocompaction was always higher than before compaction. Examples of the in-
crease in penetration resistance with time after vibrocompaction and placement of hy-
draulic fill are shown in Figures 2.15 and 2.16, respectively.
Mitchell and Solymar discussed a number of possible mechanisms that could have been
responsible for the phenomenon. Time-dependent strength gain due to pore pressure dis-
sipation was discounted because complete dissipation occurred in the order of hours,
whereas, the aging effects were measured over a period of days and months. Thixotropy
was also discounted as a possible mechanism because it is thought to be caused by small
net differences in attractive/repulsive forces in fine-grained soils (Mitchell 1993), which
are not relevant in sands. Mitchell and Solymar believed that the mechanism most likely
responsible for the aging effects was formation of silica acid gel films on the surface of
particles. It was suggested that these films could develop with time to act as a cementing
agent between sand grains, however, no direct evidence was presented to support this hy-
pothesis.
2.6.2 Laboratory Study of Blast Densification (Dowding and Hryciw 1986)
Mini-cone penetration tests were used to assess the effectiveness of blast densification of
saturated sand under controlled conditions in the laboratory. As part of the study, the ef-
fects of aging on penetration resistance were also investigated. A large (1 m diameter, 1
m high) circular liquefaction tank was used for all the tests, and a local beach sand from
the campus of Northwestern University was used for all the tests. The properties of the
Evanston sand are shown in Table 2.3.
The sand was prepared to an initial relative density of 50% for all tests. The height of the
samples in the tank was approximately 66 cm. The testing program was set up so that,
following a blast that was set off in the center of the tank, penetration tests could be per-
formed at different radial distances (10, 20, 30, and 40 cm) and at different times (pre-

19
blast, 1 day, 5 days, and 15 days). After blasting, the relative density ranged from 63% to
78%. Time-dependent increases in penetration resistance were found in both a control
test, in which no blasting was done, as well as in the tests with blasting. The results from
these tests are shown in Figure 2.17. These results are plotted as the change in penetra-
tion resistance from pre-blast values as a function of time and radial distance from the
point of detonation. It can be clearly seen that the penetration resistance increased with
time for all cases, and that the aging effects were larger for the tests involving blasting.
In addition, the greatest increases were consistently found to occur near the blast location.
It is also apparent, however, that near the center of the blast, the 1 day readings either de-
creased or were unchanged compared to the no blast readings. This may be the result of a
cavity that was created by the blast or blast gases, rather than the “sensitivity” discussed
in the previous example. Dowding and Hryciw postulated that the increase in penetration
resistance with time could be caused by the gradual dissipation of the blast gases, which
may have created an arching effect in the soil.
Table 2.3 Properties of Evanston Beach Sand.
Description Fine, poorly graded, brown, silica sandCoefficient of Uniformity, Cu 1.5
Specific Gravity, Gs 2.67Minimum Dry Unit Weight, γmin 14.5 kN/m3
Maximum Dry Unit Weight, γmax 16.5 kN/m3
D50 0.2 mm
2.6.3 Field Study of Blast Densification (Hryciw 1986)
In conjunction with the laboratory study described above, Hryciw (1986) performed a
field test to assess the effectiveness of blast densification of a saturated sand deposit. The
site of the experiment was in southeastern Georgia, and consisted of 3 to 9 m of loose
saturated sand overlain by 1.5 – 2 m of stiff clay and vegetation. The sand was very fine
(D50 = 0.10 to 0.15 mm) and was poorly graded with 5 to 15% silt. Blasting was per-
formed in a single hole at a depth of 7 m and cone penetration tests were performed at
various radii (0.9, 3.0, 5.5, 7.6, and 12.2 m) away from the blast. A series of these tests
20
was performed prior to blasting, 1 to 2 days after, and 30 days after blasting to study any
change in penetration resistance with time.
Following blasting, there was an immediate decrease in the penetration resistance. This
decrease occurred despite the observation of surface settlement radially about the blast
hole. During these cone penetration tests, water was reported to have flowed out of the
boreholes as the stiff clay layer was penetrated. This made it difficult to determine if the
decrease was due to sensitivity of the deposit or due to excess pore pressures. After 30
days, however, there was still no change in the values of cone penetration resistance from
the 1 to 2 day tests.
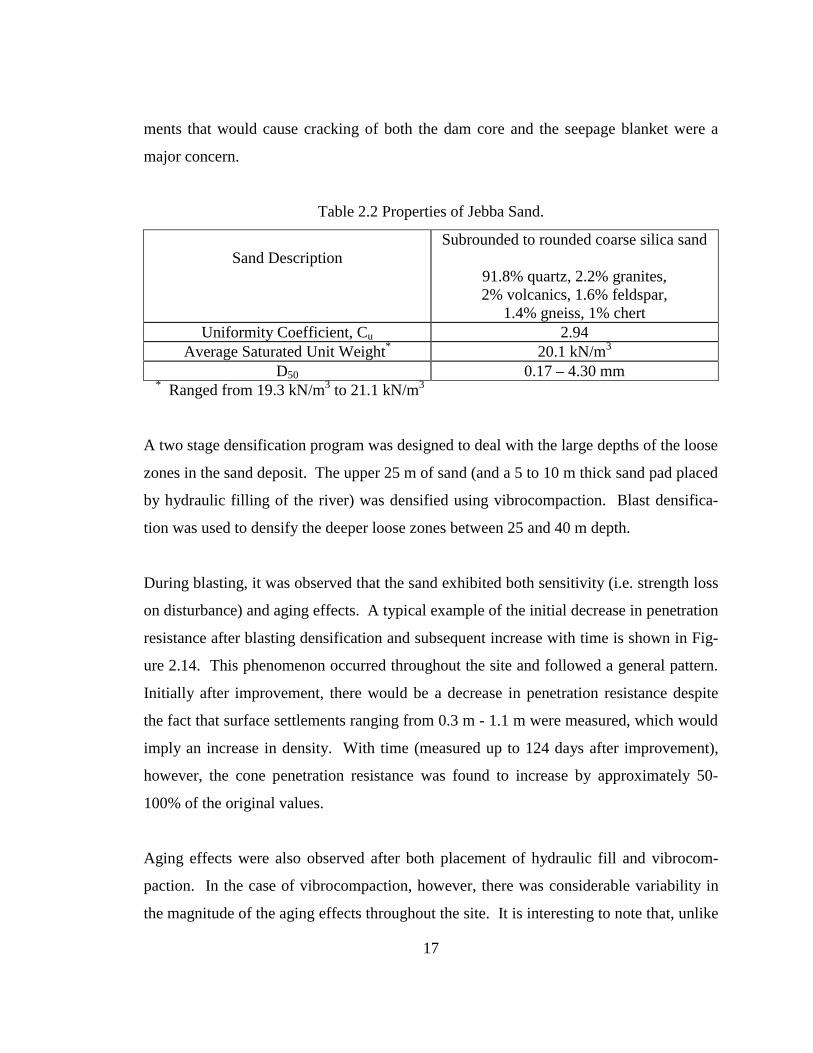
2.6.4 St. Johns River Power Park (Schmertmann et al. 1986; Schmertmann 1987)
Schmertmann et al. (1986) reported on a case study in which the foundation soils for a
large power plant near Jacksonville, Florida were improved using both dynamic compac-
tion and compaction grouting. The quality control program was extensive and involved
908 cone penetration tests and 33 flat plate dilatometer tests (DMT).
The site was located in a naturally filled-in former marine estuary. The upper 10 m con-
sisted of an uncemented loose, relatively clean quartz sand. From approximately 10 to 17
m depth the clean quartz sand was interspersed with fine layers of silt and clay.
The effects of aging were studied on a test section at the site where there had been densi-
fication by dynamic compaction. The results of these tests are shown in Figure 2.18.
The increase in penetration resistance with time was correlated to the number of drops
used for the dynamic compaction and the depth within the soil profile. From this figure,
time improvement factors for cone penetration resistance were developed and were used
to adjust measured post-densification penetration resistance values to specific times after
compaction. These improvement factors are listed in Table 2.4.

21
Table 2.4 Time Improvement Factors for qc at Power Plant Site.
Time Between DC and CPT(days)
Factor by Which to Multiplyqc
5 1.3510 1.2015 1.1520 1.1230 1.0640 1.0350 1.0160 1.00
Two things are worth noting in Figure 2.18. First, the results suggest that the amount of
energy input by the dynamic compaction process not only affects immediate improve-
ment but also affects the subsequent time-dependent increase in penetration resistance.
This is indicated by the fact that the aging effect increased as the number of drops in-
creased. Second, there is significant scatter in the data, and the trend lines chosen by
Schmertmann are very subjective.
2.6.5 Pointe Noire Deep Sea Harbor (Dumas and Beaton 1988)
In Sept-Iles, Quebec, dynamic compaction was performed as part of a deep sea harbor
project. The densified deposit was 6 to 17 m thick and was hydraulically placed by end
dumping from the surface. The hydraulic fill was a medium to coarse grained sand with
an average grain size of 0.79 mm and a uniformity coefficient of 3.06.
It was reported that, in some locations, there was a 100% increase in cone penetration
resistance between tests performed immediately after compaction and subsequent tests
performed 18 days later. Figure 2.19 shows cone penetration test results at one area at
three different times: immediately after placement of hydraulic fill, immediately after dy-
namic compaction, and 8 days after the first pass of dynamic compaction.

22
The authors compared these results with the Jebba Dam case study. The increase in
penetration resistance occurred much more quickly than at Jebba and no sensitivity of the
sand deposit was observed. The lack of sensitivity was attributed to the fact that the fill
was freshly deposited, and thus did not have time to develop any structure. It is also pos-
sible that, like vibrocompaction, the densification from dynamic compaction could have
been large enough to overcome any initial strength loss caused by sensitivity. It was also
suggested that the aging effects were related to the energy input during densification, be-
cause as shown in Figure 2.19, the increase in penetration resistance with time was
greater near the surface and diminished with depth. This trend is qualitatively similar to
how energy from the dynamic compaction process attenuates with depth.
2.6.6 Tarsiut P-45 Caisson, Beaufort Sea (Jefferies et al. 1988)
Jefferies et al. (1988) present a brief study of aging effects during the construction of an
artificial island in the Beaufort Sea. The island was actually a large mobile caisson,
called Molikpaq, used for offshore oil drilling in the Arctic. To form the island, desig-
nated Tarsiut P-45, approximately 20 m of sand fill was placed hydraulically through
seawater. The sand used was called Erksak fill, with a D50 of 0.3-0.4 mm and <8% silt.
As placed, the relative density of the fill was approximately 60%. The average tempera-
ture of the sand was ~0o C. Penetration tests were performed six days and eleven months
after placement to assess any aging effects. The eleven month penetration tests were per-
formed within 1.5 m of the location of the six day tests. There was no measured increase
in the penetration resistance with time.
2.6.7 Amauligak F-24 Caisson, Beaufort Sea (Rogers et al. 1990; Jefferies and
Rogers 1993)
Another mobile Arctic caisson, Amauligak F-24, was hydraulically filled with the same
sand described above. However, in this case, blast densification was used to increase the
density of the fill. Cone penetration test results from before and at two times after blast-
ing are shown in Figure 2.20. It was reported that there was a substantial increase in the
23
penetration resistance after two to five days, and there was continued improvement for
several weeks. No sensitivity of the deposit was observed.
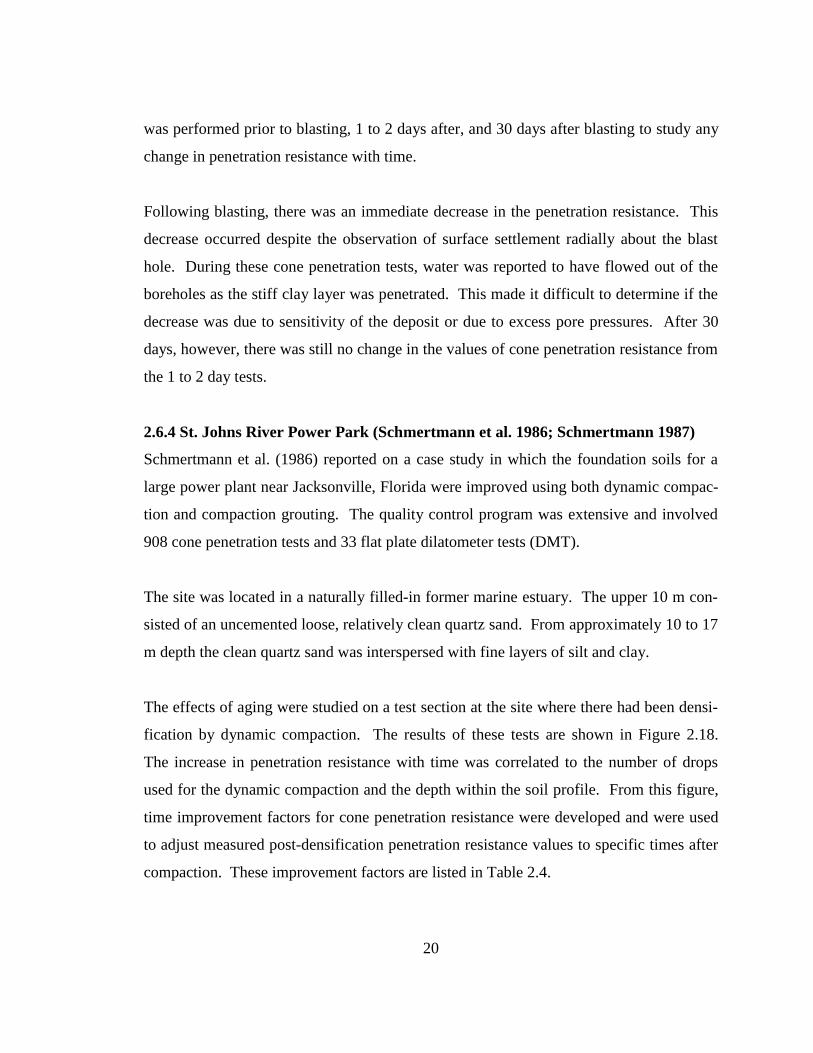
2.6.8 Field Study of Blast Densification (Thomann 1990)
Thomann (1990) performed a field study on the effect of blast densification on both the
cone penetration resistance and the shear wave velocity with time. This field study was
done in conjunction with the laboratory testing program on the effect of disturbance on
the small strain shear modulus discussed in section 2.2. The tests were performed at
Douglas Lake in Cheboygan county, Michigan in a partially saturated, medium dense
sand deposit. The properties of Douglas Lake sand are shown in Table 2.5.
Table 2.5 Properties of Douglas Lake sand.
Sand Description Poorly graded, fine to medium,subangular sand
Uniformity Coefficient, Cu 2.42D50 0.25 mm
Minimum void ratio, emin 0.54Maximum void ratio, emax 0.82
Penetration tests and shear wave velocity measurements were performed with a seismic
cone before and at four times following blasting (1, 3, 4, and 217 days). There were no
measured increases in either the cone penetration resistance or the shear wave velocity
with time. In fact, both the cone penetration resistance and the shear wave velocity de-
creased immediately following blasting and never reached the pre-blast values. Thomann
postulated that the property decreases may have resulted because the sand was initially
dense and that the blasting actually caused some loosening of the deposit.
2.6.9 Compaction of a Deep Hydraulic Fill (Massarch and Heppel 1991)
An example of aging effects was presented as part of a report on the use of the Müller
Resonance Compaction system (MRC), a type of vibratory probe for deep vibratory
compaction. A 26 m layer of hydraulic fill, consisting of a very loose to loose sand inter-

24
spersed with layers of clay and silt, was compacted using the MRC system at a site in
Hong Kong. The groundwater table at the site was located approximately 3 m below
ground surface. Penetration tests were performed some time (not stated) after compac-
tion and also 1 year after compaction. It was reported that after 1 year the penetration
resistance had increased 50% since the first readings. The data presented, however, con-
tained considerable scatter, which was attributed to the interspersed silt and clay layers.
2.6.10 Cone Penetration Testing Following the Loma Prieta Earthquake
(Human 1992)
The magnitude 7.1 Loma Prieta earthquake, which struck the San Francisco, CA area on
October 17, 1989, caused widespread liquefaction at Bay Farm island in Alameda. Bay
Farm Island is a man-made island formed by hydraulic filling in the 1960’s. Because
there were cone penetration records from before the earthquake, Human (1992) per-
formed additional penetration tests with time after the earthquake to assess the effect of
the earthquake on the soil properties at the site. Tests were performed 4, 14, 30, 65, and
317 days after the earthquake. For each time, four penetration tests were performed to
assess the variability of the readings.
The site consisted of 4 m hydraulically placed fine silty sand underlain by a soft clay
layer of variable thickness (also fill). Beneath the fill was 3 m of soft to medium stiff
clay (Bay Mud) and Holocene sands. The groundwater table was 2 m below the ground
surface.
Four days after the earthquake, there was no change in the penetration resistance from the
pre-earthquake values, despite the presence of sand boils on the site. Over the 317 days,
there was some increases in the penetration resistance, however, it was not consistent
with depth. Furthermore, the variability at each was assessed from the four cone pene-
tration tests. It was determined that the observed increases were within the natural vari-
ability of the deposit, which made interpretation of the aging effects very difficult. Most

25
of the examples in this chapter present only one cone penetration test at each time, and
this case study point out how important it is to assess the natural variability of a site.
2.6.11 Field Blasting Experiment in Greeley, Colorado (Charlie et al. 1992)
An investigation of the effects of blasting and time on the three components of the cone
penetration test (tip resistance, skin friction, and friction ratio) was undertaken by Charlie
et al. (1992). Blast densification was performed in Greeley, Colorado between Novem-
ber and March of 1987. The site consisted of 1.5 m of a poorly graded medium to fine
sand overlying 3.6 m of a poorly graded gravelly sand. Beneath the gravelly sand was a
layer of inorganic silt. The properties of the two sands are shown in Table 2.6. The rela-
tive densities of the sands classified them as dense to very dense deposits.
Table 2.6 Properties of Sand from Greeley, Colorado.
Description Poorly graded medium tofine sand (SP)
Poorly graded gravellysand (SP)
Coefficient of Uniformity, Cu 4.9-5.6 4.17-5.75D50 0.80-1.80 mm 2.1-2.3 mmD10 0.19-0.30 mm 0.51-0.62 mm
Specific Gravity, Gs 2.62 2.62Petrographic Analysis 80% quartz; 10% igneous
and metamorphic;5% feldspar
80% quartz; 10% igneousand metamorphic;
5% feldsparMinimum Dry Unit Weight
γd min
- 16.5-16.6 kN/m3
Maximum Dry Unit Weightγd max
- 18.8-19.4 kN/m3
Relative Density, Dr 70-90% 70-85%
Cone penetration tests were performed before and at several times after blasting. One
week after blasting, both the tip resistance and sleeve friction were less than pre-blast
values. Additional penetration testing was then performed 3 weeks, 18 weeks, and 5 1/2
years (Charlie et al. 1993) after blasting. After 18 weeks, the normalized tip resistance
was found to have increased 18%, while the sleeve friction was found to have decreased
39% with respect to the 1 week values. After 5 1/2 years, the tip resistance had increased

26
211% and the sleeve friction had decreased 42%, again with respect to the 1 week values.
Only the 5 1/2 year penetration resistance was greater than the pre-blast values, which
was attributed to the initial high relative density of the sands. The sleeve friction contin-
ued to decrease from 1 to 18 weeks, and this led the authors to conclude that the hori-
zontal stresses were decreasing with time.
Charlie et al. (1992) also compiled data on the increase in penetration resistance follow-
ing ground improvement from a number of other cases found in the literature. The results
of the compilation were plotted in the form of normalized penetration vs. time, as shown
in Figure 2.21. Based on this data, the following empirical equation was presented:
( )( )q
qK N
c N weeks
c week1
1= + log (2.3)
where
qc = tip resistance
N = number of weeks since improvement
K = the slope of the penetration resistance – log time relationship
The values for the empirical constant, K, as determined from Figure 2.21, are listed in
Table 2.7.
Table 2.7 Empirical Constants for Aging Effects in Penetration Resistance
(Charlie et al. 1992).
Reference Type of Densification KMitchell and Solymar (1984) vibrocompaction 1Mitchell and Solymar (1984) blast densification 0.7Schmertmann et al. (1986) dynamic compaction 0.3
Charlie et al. (1992) blast densification 0.13Jefferies et al. (1988) hydraulic fill 0.02
The rate of increase of aging effects (quantified by K) was then correlated to the assumed
air temperatures of the published case histories, as shown in Figure 2.22. The results
showed K was larger at sites in warm climates than at sites in colder climates. Based on

27
this, the authors concluded that the aging process was temperature dependent and that
cementation may be the mechanism responsible.
However, in a discussion of this study, Jefferies and Rogers (1993) disagreed with the
temperature data that was used by Charlie et al. to suggest that the aging process was
temperature dependent. Specifically, they asserted that actual ground temperature rather
than mean air temperature data should be used. Figures 2.20 and 2.21 are the revised
plots using the actual ground temperature data from Jefferies et al. (1988) and Rogers et
al. (1990). With the revised results the effect of temperature on the increase in the pene-
tration resistance was shown to be much smaller than originally indicated.
2.6.12 Field Blasting Experiment in Kelowna, B. C. (Gohl et al. 1994)
In order to gain experience with blast densification, Gohl et al. (1994) performed blasting
at a test site in Kelowna, British Columbia. The site consisted of approximately 2 to 3 m
of random fill overlying loose sands. Blasting caused liquefaction of the sand layer,
which was apparent by large amounts of water that bubbled to the surface and by meas-
ured settlements of up to 1 m. Two passes of blasting were performed and cone penetra-
tion tests were performed up to 450 days after blasting. A time-dependent increase in
penetration resistance was measured in some locations. However, it was reported that the
increase was not consistent throughout the site. It was not reported whether the site ex-
hibited any sensitivity immediately after blasting.
2.6.13 Blast Densification at the SM-3 site (AGRA 1995; Ground Engineering 1995)
A large blast densification project in the Saint Marguerite River northwest of Sept-Iles,
Quebec was performed between February and April of 1995. A 100 m by 120 m area of
the river bed was densified in order to reduce the potential for static liquefaction and im-
prove the stability of an excavation for a cofferdam during construction of a main dam.
Drilling and blasting were done from a compacted layer of snow and ice, which covered
the river up to a thickness of 1.3 m.

28
The soils at the site consisted of 10 to 20 m of loose sand overlying dense sand, underlain
by more loose sand. The properties of the sands found at the site are shown in Table 2.8.
The initial relative density of the loose sand was estimated from cone penetration tests to
be 40%. The blasting program improved the relative density throughout the site to an
average of 60%. In one area of the site, cone penetration testing was performed before
and after blasting at intervals of 2, 12, and 35 days. The results, shown in Figure 2.23,
indicate that after 2 days there was either no improvement or even a slight decrease in the
penetration resistance. Twelve days after blasting, the penetration resistance was found
to be 2 to 3 times higher than pre-blast values. After 30 days, however, there was only
slight improvement over the 12 day values.
Table 2.8 Properties of Sand from the Saint Marguerite River.
Coefficient of Uniformity, Cu 1.9-4.5Coefficient of Curvature, Cc 0.9-1.8
D50 0.3-1.5(0.75 average)
Minimum Dry Unit Weight γd min
14.4-15.2 kN/m3
Maximum Dry Unit Weightγd max
17.6-18.8 kN/m3
2.6.14 Laboratory Test on the Penetration Resistance of Sand (Joshi et al. 1995)
A laboratory study was performed by Joshi et al. (1995) specifically to study the effect of
time on the penetration resistance. The influences of both sand type and pore fluid com-
position on the magnitude of aging effects were investigated. Two different sands were
tested: a local river sand and Beaufort Sea sand. The properties of these sands are listed
in Table 2.9. The sands were tested dry and in distilled and seawater.

29
Table 2.9 Properties of River sand and Beaufort Sea sand.
River sand Beaufort Sea sandDescription More angular, less rounded Less angular, more
rounded, with some flakyparticles
Coefficient of Uniformity,Cu
2.39 2.67
D50 0.41 mm 0.34 mmMinimum Dry Unit
Weight γd min
14.6 kN/m3 14.3 kN/m3
Maximum Dry UnitWeightγd max
16.6 kN/m3 16.5 kN/m3
The sand was placed in 36 cm diameter by 37 cm high PVC cells and subjected to a static
vertical stress of 100 kPa. Each specimen was prepared by pluviating the sand through
either air or water (depending on the test) and vibrating the specimen under the static load
until the desired density was achieved. This method of preparation resulted in the fol-
lowing calculated relative densities:
Dry river sand 87%
Saturated river sand 95%
Saturated Beaufort Sea sand 100%
After loading, the specimens were aged for two years, and values of penetration resis-
tance were obtained at various times in each specimen. Penetration tests in each speci-
men were performed with a series of four, 1 cm diameter penetrometers so that redundant
data could be obtained at each time. For each penetration test, the probe was advanced
~2 mm. Aging effects were observed in all cases. A typical plot of load vs. displacement
at various times for one of the penetrometers is shown in Figure 2.24 and appears to
clearly show an aging effect. The normalized increase in penetration resistance with time

30
for the same case is shown in Figure 2.25. Based on these results, it was proposed that
the increase in penetration resistance with time follows a general form
( )P
Pa tt b
1
= (2.4)
where
Pt = penetration resistance at some time, t, in days
P1 = penetration resistance at 1 day
a, b = curve fitting parameters with the following values:
a b
Dry sand 0.9 0.06
Distilled water 0.75 0.15
Seawater 0.7 0.17
Note that increases in penetration resistance were measured in all three cases. Parameters
a and b were determined by curve fitting data from each of the tests. These results sug-
gest that the effect of aging was greatest for sand submerged in seawater and least for dry
sand. Equation 2.4 would predict that a sand aged for 1 year would have penetration re-
sistance increases of 90%, 80%, and 30% if saturated in seawater, distilled water, or air,
respectively.
In addition to the penetration tests, detailed mineralogical studies using X-ray diffraction
and electron microscopy showed the presence of precipitates on the grains of the sub-
merged samples after aging. For the samples of River sand submerged in distilled water,
the composition of the precipitates was found to calcium and possibly silica. In the case
of the samples submerged in seawater, sodium and chlorine were also found as precipi-
tates. Because aging was observed in dry sand, the authors concluded that, for sands in
the dry state, aging effects were caused by rearrangement of particles. In the submerged
state, it was hypothesized that the aging effects were the result of a combination of rear-
rangement of particles and precipitation of the soluble fractions of the sand.

31
2.6.15 Chek Lap Kok Airport, Hong Kong (Ng et al. 1996)
A recent example of aging effects in sands was reported by Ng et al. (1996) during con-
struction of the Chek Lap Kok airport in Hong Kong. Vibrocompaction was performed
in specific areas to improve the penetration resistance of hydraulically placed sand fill.
Cone penetration testing was performed at one location at different times, up to 47 days
after improvement. A clear increase in penetration resistance was observed, as shown in
Figure 2.26. As with the other case studies involving vibrocompaction, there was no sen-
sitivity observed, and the time-dependent increase in cone penetration resistance occurred
with little corresponding increase in density.
2.7 Trends
Three tables are included at the end of this section that summarize trends in the case
studies presented in this chapter. Table 2.10 provides a summary of the examples pre-
sented above. Table 2.10 includes the following specific information (when available)
about each example:
• Median particle size
• Coefficient of uniformity
• Relative density
• Vertical effective stress range
• Temperature
• Type of densification
• Measured time period
• Amount of improvement
Tables 2.11 and 2.12 highlight the significant findings of each case study. Table 2.11
includes the examples of time-dependent increases of the small strain shear modulus,
conductivity, liquefaction resistance, and stiffness and shear strength, whereas Table 2.12
highlights the main points from the examples of aging effects on the cone penetration re-
sistance.

32
The median grain size, D50, ranged from 0.10-4.30 mm for the examples shown in Table
2.10. In most of the cases, fine to medium sands were the primary sands studied. How-
ever, there are three examples (Mitchell and Solymar 1984; Charlie et al. 1992; AGRA
1995) in which large aging effects were measured in coarse sands. The only example in
Table 2.10 that measured no aging effects in the field (Jefferies et al. 1998) involved a
medium sand. From these examples, it does not appear that any generalizations can be
made with regard to the median grain size.
In all the cases the sands were poorly graded, with most of the sands in the examples
having coefficient of uniformity (Cu) values less than 3. Although this is a definite trend
within the examples presented, this may not be a good indicator of the potential for aging.
Aging effects are usually of interest in loose sand deposits, such as with hydraulically
placed fills, or deposits that are to be densified by ground improvement. These types of
deposits are frequently uniform, because well-graded sands in nature are generally denser
and have smaller void ratios due to the wide range of particle sizes.
The relative density, Dr, in the examples ranges from approximately 20% (very loose) to
100% (very dense). Some of the best examples of aging effects (the Jebba Dam project
and the laboratory penetration tests performed by Joshi et al. 1995) involved very loose
and dense sands, respectively. There appears to be no correlation between Dr and the rate
or magnitude of aging effects. The same can be said for the vertical effective stress range.
In the various examples, a wide range of stress levels existed (0-400 kPa), all of which
are within the normal range of engineering practice.
From the available data, there also does not appear to be a simple relationship between
the amount of aging and temperature. For example, there was no aging reported by Jef-
feries et al. (1988) for the hydraulic fill placed at 0° C. However, a similar fill under the
same conditions showed clear increases in penetration resistance following blast densifi-

33
cation. In the case of the SM-3 site in Quebec (AGRA 1995), also at approximately 0° C,
there was a 200-300% increase in penetration resistance within 12 days.
It is very difficult to draw any significant conclusions on the effect of different methods
of placement and densification on aging effects,. For the hydraulic fill that was placed at
the Jebba Dam project (Mitchell and Solymar 1986), the cone penetration resistance in-
creased between 30% and 100% between the second set of readings (4 to 10 days after
placement) and the third set (50 to 80 days after placement). In contrast, the hydraulic fill
placed in the Tarsiut P-45 caisson in the Beaufort Sea (Jefferies et al. 1988) showed no
increase in penetration resistance after 11 months of aging.
For densification by blasting, again it is difficult to observe definite trends. In seven of
the eight examples, a time-dependent increase was observed. However, in two of the
cases (Hryciw 1986; Thomann 1990) the aging effects were not enough to offset the ini-
tial reduction in penetration immediately after blasting. Both of these involved medium
to dense sands, and it is likely that the blasting actually loosened the deposits. The one
example where no aging effects were observed following blast densification in loose
sands was at a site where the top 1.5 to 2 m consisted of stiff clay and vegetation (Hryciw
1986). There were clearly excess pore pressures 1 to 2 days after blasting, as evidenced
by water flowing out of the bore holes. After 30 days, however, there was still no in-
crease in penetration resistance despite observed surface settlements indicating an in-
crease in the average density of the deposit. Finally, one of the case studies (Gohl et al.
1994) reported some increases in penetration resistance following blast densification;
however, the effect was not consistent throughout the site.
Sensitivity does appear to be a common occurrence following blast densification in natu-
ral sand deposits. There was only one case where no sensitivity was measured in the
field, and it involved the densification of a freshly placed hydraulic fill (Rogers et al.
1990). Likewise, in a laboratory blasting experiment in a liquefaction tank, the only re-

34
duction in penetration resistance was close to the blast hole, where a cavity or blast gases
may have caused the effect.
In the cases where either vibrocompaction or dynamic compaction were performed, there
did not appear to be any significant sensitivity measured. In all the examples, there was
some initial increase in penetration resistance followed by a variable amount of additional
time-dependent increase. In all these cases, the variability from site to site and the scatter
in the data make it very difficult to make generalizations about the magnitude or rate of
sand aging effects.
It is very difficult to make comparisons between the various examples because of the lack
of comprehensive information about each site. Aging effects are rarely the primary goal
of a field study, and as such, many of the examples are based on one or two cone pene-
tration tests at random times after ground modification. In most cases, little attention is
given to potentially significant details, such as pore fluid composition, temperature, sand
mineralogy, and spatial variation of soil properties. It would be useful if there were a
standard approach to studying aging effects in the field. Standardization would require
guidelines on which properties to measure, when to measure them, and location and
number of the tests.

35
Table 2.10 Summary of aging effects in sands reported in the literature.
Reference D50
(mm)Cu Dr
%
1σv’(kPa)
T(°C)
Densification MeasuredTime Period
Improvementwith Time
Notes
Afifi and Woods(1971)
0.44 1.6 92 138, 207 20 - 108 days NG increased 2-5% Ottawa Sand, air driedLaboratory tests
Afifi and Woods(1971)
0.10 1.5 dense 69, 138 20 - 430 days NG increased 2-5% Agsco No. 2, air driedLaboratory tests
Seed (1979) 0.41 1.4 50 155 202 - 100 days 12% increase in liquefactionresistance at 10 days; 25%increase after 100 days
Monterey No. 0Laboratory tests
Ishihara (1985) 0.30 2.5 40-70 20-120 202 - - Undisturbed liquefactionresistance higher thanreconstituted samples
Niigata sand, saturatedLaboratory tests
Daramola (1980) NA NA 66 400 202 - 152 days 50% increase in shearmodulus per log cycle oftime
Ham River sand,saturated; Laboratorytests
Mitchell andSolymar (1984)
0.44-0.90 2.94(1.52-8.83)
40-70 0-200 27 Hydraulic fill 50-80 days 30-110% increase in qc
between 4-10 day readingsand 50-80 day readings
Alluvial sand; 91.8%quartz, 2.2% granites,2% volcanics, 1.6%feldspar, 1.4% gneiss,1% chert
Mitchell andSolymar (1984)
0.33-2.5 2.94(1.52-8.83)
40-70 100-460 27 Vibrocompaction 24 days Variable increase in qc.No sensitivity.
Alluvial sand; 91.8%quartz, 2.2% granites,2% volcanics, 1.6%feldspar, 1.4% gneiss,1% chert
Mitchell andSolymar (1984)
0.18-4.3 2.94(1.52-8.83)
40-70 360-610 27 Blasting 124 days 50-100% increase in qc
Sensitivity immediately afterblasting
Alluvial sand; 91.8%quartz, 2.2% granites,2% volcanics, 1.6%feldspar, 1.4% gneiss,1% chert
Dowding andHryciw (1986)
0.20 1.5 50 ~0 202 Blasting 15 days Penetration resistanceincreased 75-90% in 15days. Effects also observedw/out blasting. Agingeffects greatest near blast.Little sensitivity.
Evanston Beach sand;Laboratory tests

36
Reference D50
(mm)Cu Dr
%
1σv’(kPa)
T(°C)
Densification MeasuredTime Period
Improvementwith Time
Notes
Schmertmann etal. (1986)
NA NA 20-60 0-100 20 DynamicCompaction
80 days As much as 240% increasein qc in 80 days. Nosensitivity.
Florida coastline. Veryloose to dense fine sandwith trace silt and siltyclay seams.
Jefferies et al.(1988)
0.30-0.40 NA NA 0-200 0 Hydraulic Fill 257 days No Aging Effects Erksak fill; < 8% silt
Massarch andHeppel (1991)
NA NA NA 0-200 NA MRC VibratoryProbe
~1 year qc increased 50% after 1year
Considerable scatter inthe time dependent data;Marine environment
Charlie et al.(1992)
2.1-2.3 4.17-5.75 70-85 30-90 10 Blasting 5.5 years Tip resistance increased18% after 18 weeks;increased 211% after 5.5years; sleeve frictiondecreased 39% after 18weeks (42% after 5.5 years);Initial sensitivity
80% quartz; 10%igneous andmetamorphic;5% feldspar
Gohl et al. (1992) NA NA loose NA NA Blasting 450 days After 450 days, someincreases in qc wasmeasured, but it was notconsistent throughout site
Kelowna, BritishColumbia
AGRA (1995) 40 0-200 0 Blasting 30 days 200-300% increase in qc
after 12 days; no furtherincrease after 30 days
Sept. Iles, Quebec
Joshi et al. (1995) 2.39 87-95 100 202 - 2 years 90% increase in penetrationresistance in 1 year for sandsubmerged in sea water;80% increase for submergedin distilled water; 30%increase for air dried
River sandLaboratory tests
Joshi et al. (1995) 2.39 87-95 100 202 - 2 years 90% increase in penetrationresistance in 1 year for sandsubmerged in sea water;80% increase for submergedin distilled water; 30%increase for air dried
Beaufort sandLaboratory tests
Notes: 1. For determining stress ranges for field cases, a buoyant unit weight of 10 kN/m3 was used.2. Assumed to be 20 °C because tests were performed in a laboratory.NA = Not available

37
Table 2.11 Main points of examples of aging effects in sands.
Small Strain Shear Modulus
REFERENCE MAIN CONCLUSIONSAfifi and Woods (1971) As particle size decreases, NG increases.
Human (1992)Stress level has no effect on Vα.As relative density decreases, Vα increases.As stress anisotropy increases, Vα decreases.No increase in Vα observed for saturated specimens.
Jamiolkowski (1996) NG higher for carbonatic sands than for silica sands.
Conductivity
Brandon and Mitchell (1989)Human (1992)
Thermal resistivity decreased with time and electricalconductivity increased with time for Crystal silicasand. Clay fraction present makes interpretation ofeffects difficult.
Liquefaction Resistance
Seed (1979) Liquefaction resistance increased 25% in 100 days inlaboratory specimens.
Ishihara (1985)Arango and Migues(1996)
Liquefaction of undisturbed specimens greater thanreconstituted specimens.
Stiffness and Shear Strength
Denisov and Reltov (1961) Sand seemed to “stick” to quartz plate. Difficult todraw conclusions.
Daramola (1980) 50% increase in modulus per log cycle of time.Slight increase in dilatancy with time.
Schmertmann (1991) Quasi-preconsolidation pressure in sand. Non-standard loading conditions were used.
Human (1992) No significant increase in modulus or strength withtime.
Pender et al. (1992) Periods of rest caused a repeatable increase inmodulus.
Martin et al. (1996) Biological activity can increase the strength anddecrease the hydraulic conductivity of a silty soil.

38
Table 2.12 Main points of examples of aging effects involving cone penetration tests.
REFERENCE MAIN CONCLUSIONS
Mitchell and Solymar (1984)Increases in qc in hydraulic fill, as well as after blastdensification and vibrocompaction. Sensitivityobserved following blasting.
Dowding and Hryciw (1986)Increases in penetration resistance observed at near-zero effective stress conditions in both hydraulic filland after blast densification in the laboratory.
Hryciw (1986) No increase in qc following blasting in saturatedloose sands. Presence of surficial clay layer mayhave hindered drainage.
Schmertmann et al. (1986)Increases in qc increased with the number of drops fordynamic compaction (related to energy input). Nosensitivity was observed.
Dumas and Beaton (1988)Profile of improvement with depth followingdynamic compaction suggested that increases in qc
were related to energy input. No sensitivity wasobserved.
Jefferies et al. (1988)Rogers et al. (1990)
Jefferies and Rogers (1993)
No increases in qc for hydraulic fill in sea water at0oC. Increases in qc were observed after blastdensification in the same sand at the sametemperature. No sensitivity was observed.
Thomann (1990)Blast densification in a medium dense sand. qc
decreased and never reached pre-blast values.
Massarch and Heppel (1991)After vibrocompaction, some increases in qc wereobserved. However, a lot of scatter was reported.
Human (1992)Following an earthquake, some increases in qc wereobserved. However, they were discounted becauseof large variability in qc at the site.
Charlie et al. (1992)Following blast densification in dense sand, qc
decreased and took 5.5 years to reach pre-blastvalues.
Charlie et al. (1992)Jefferies et al. (1993)
Suggested that increases in qc can be related totemperature. However, a discussion showed thattemperature did not have a big influence on theobserved increases in qc .
Gohl et al. (1994) Following blast densification, scattered increases inqc were observed throughout the site. No mention ofsensitivity.
AGRA (1995)Ground Engineering (1995)
Following blast densification, some sensitivity wasobserved. Significant increase in qc observed after12 days. Temperature was ~0o C.
Joshi et al. (1995) Increases in penetration resistance in the laboratoryfor both dry and saturated conditions. Micrographevidence of precipitation.
Ng et al. (1996) Following vibrocompaction, increases in qc observedwith no sensitivity.

39
Figure 2.1 Increase in shear modulus with time (Afifi and Woods 1971).
Figure 2.2 Thermal resistivity of three sands with time (Brandon and Mitchell 1989).
0.0
0.1
0.2
0.3
Ver
tical
Str
ain
(%)
1 1 10 100 1000 10000
Time (minutes)
She
ar M
odul
us (
ksi)
29
28
27
26
25
24
Vertical Strain
Shear Modulus
Ottawa SandAir-Dry
σ’ = 30 psie = 0.49

40
Figure 2.3 Increased Resistance to Liquefaction with Time (Seed 1979).
41
Figure 2.4 Comparison of cyclic strength between undisturbed and reconstituted samplesof Niigata sand (Ishihara 1985).

42
Figure 2.5 Comparison of pore pressure generation in cyclic tests for undisturbed and
reconstituted Tapo Canyon sands (Arango and Migues 1996).
Number of Loading Cycles, N
1 10 100
Por
e P
ress
ure
Rat
io, r
(u)
%
0
10
20
30
40
50
60
70
80
90
100
ReconstitutedUndisturbed
43
Figure 2.6 Field cyclic strengths of aged sand deposits relative to the strength of
Holocene (< 10,000 years) sands (Arango and Migues 1996).

oscillation generator
glass orquartz plate
without soaking42 hr soaking6 days soaking14 days soaking
Time of Dry Contact
10 min 2 hr 20 hr0
1.0
2.0
3.0
Figure 2.7 Schematic of the vibrating plate experiment (Denisov and Reltov 1961).
Figure 2.8 Results from the vibrating test experiment (Denisov and Reltov 1961).
44

45
Figure 2.9 Results of triaxial tests on aged samples of Ham River sand
(Daramola 1980).

46
Figure 2.10 Example of quasi-preconsolidation pressure in sand
(Schmertmann 1991).

47
Figure 2.11 Results of three triaxial tests showing (a.) increase in shear wave velocity
with time, and (b.) stress – strain relationships (Human 1992).

48
Figure 2.12 Aging effects in simple shear showing (a) an increase in modulus after
periods of rest, and (b) changes in density. (Pender et al. 1992).

49
Figure 2.13 Effect of Xanthan gum on the strength of a silt
(Martin et al. 1996).

0
5
10
15
20
25
30
35
40
45
50
0 10 20 30 40
Fugro Static Cone Resistance (MPa)
Before blast densification
1 day after 3rd coverage
100 days after 3rd coverage
*
* Distribution of charges
Figure 2.14 Effect of aging after blast densification at Jebba Dam
(after Solymar 1984).
50

0 10 20 30 40
Fugro Static Cone Resistance (MPa)
0
5
10
20
15
25
30
10 days before vibrocompaction9 days after vibrocompaction
24 days after vibrocompaction
Figure 2.15 Effect of aging after vibrocompaction at Jebba Dam
(after Mitchell and Solymar 1984).
51

0 4 8 120
2
4
6
8
10
0 4 8 12 0 4 8 12
0 4 8 120
2
4
6
8
10
0 4 8 12 0 4 8 12
Static Cone Resistance (MPa)
4 - 10 days after placement
50 - 80 days after placement
Figure 2.16 Effect of Aging on a hydraulic fill at Jebba Dam
(after Mitchell and Solymar 1984).
52

53
Figure 2.17 Results of aging effects on a laboratory blasting experiment
(Dowding and Hryciw 1986).

54
Figure 2.18 Aging effects after dynamic compaction at power park site
(Schmertmann et al. 1986).

55
Figure 2.19 Aging effects after dynamic compaction at Pointe Noire
deep sea harbor (Dumas and Beaton 1988).

56
Figure 2.20 Aging effects after blast densification at Moliqpak
Amauligak F-24 (Jefferies and Rogers 1993).

57
Figure 2.21 Normalized penetration resistance vs. time(Jefferies and Rogers 1993).
Figure 2.22 Rate of increase in penetration resistance as a function of temperature
(Jefferies and Rogers 1993).

58
Figure 2.23 Aging effects after blasting at SM-3 Site in Quebec
(AGRA 1995).

59
Figure 2.24 Load displacement curves for penetration tests in the laboratory (Joshi et al. 1995).
Figure 2.25 Increase in penetration resistance with time for laboratory specimens
(Joshi et al. 1995).

0 10 20 30 40 50
0
5
10
15
20
25
Tip Resistance (MPa)
Pre-compactionAfter compaction24 days after compaction47 days after compaction
Figure 2.26 Effect of aging after vibrocompaction at Chek Lap Kok airport
(after Ng et al. 1996).
60
Related Documents