Page 1 of 25 2.0 ECONOMIC FEASIBILITY STUDY 2.1 Definition of Terms 2.1.1 Project or Product Life The life cycle of an engineering project or product consists of several stages, namely: 1) Planning and design; 2) Manufacture or construction; 3) Operation and maintenance. 2.1.2 Value of product or services The human needs which are targeted by the project or product are only satisfied during the last stage of the product or project life cycle, the stage of operation and maintenance. The services that satisfy the targeted human needs are valued by attaching a market price to them and counting them. In this way, the utility value of the product or service is determined. 2.1.3 Cost of product or services The various stages in the life cycle of an engineering product or project are also associated with costs , or value sacrificed to create utility value. These costs are incurred during all the stages, namely: a) Planning and design costs; b) Manufacture or construction costs; c) Operation and maintenance costs. 2.1.4 Accounting profit The accounting concept of profit is defined as value created in excess of value sacrificed , by an economic unit or investment project, during an accounting period (usually not exceeding one year). This can also be expressed through the accounting principles of revenue (value created during the period), and expense (value sacrificed to create revenue). Investment projects or businesses regularly produce two types of financial reports to measure their financial performance. These are the income statement , more often called the profit and loss account , and the statement of financial position , more often called the balance sheet . An example of such statements is shown in the annual reports of Kenya Airways Ltd 1 , and that of East African Breweries Ltd 2 . The income statement or profit and loss account states that for the quoted calendar period, Income or Revenue , less Expenditure equals Profit . 1 Kenya Airways Ltd, Annual Report for year ending March 2006, Page 48, 49 2 East African Breweries Ltd. Annual Report for the year ending June 2005, page 31, 32

Welcome message from author
This document is posted to help you gain knowledge. Please leave a comment to let me know what you think about it! Share it to your friends and learn new things together.
Transcript

Page 1 of 25
2.0 ECONOMIC FEASIBILITY STUDY 2.1 Definition of Terms 2.1.1 Project or Product Life
The life cycle of an engineering project or product consists of several stages, namely: 1) Planning and design; 2) Manufacture or construction; 3) Operation and maintenance.
2.1.2 Value of product or services The human needs which are targeted by the project or product are only satisfied during the last stage of the product or project life cycle, the stage of operation and maintenance. The services that satisfy the targeted human needs are valued by attaching a market price to them and counting them. In this way, the utility value of the product or service is determined.
2.1.3 Cost of product or services
The various stages in the life cycle of an engineering product or project are also associated with costs, or value sacrificed to create utility value. These costs are incurred during all the stages, namely: a) Planning and design costs; b) Manufacture or construction costs; c) Operation and maintenance costs.
2.1.4 Accounting profit The accounting concept of profit is defined as value created in excess of value sacrificed, by an economic unit or investment project, during an accounting period (usually not exceeding one year). This can also be expressed through the accounting principles of revenue (value created during the period), and expense (value sacrificed to create revenue). Investment projects or businesses regularly produce two types of financial reports to measure their financial performance. These are the income statement, more often called the profit and loss account, and the statement of financial position, more often called the balance sheet. An example of such statements is shown in the annual reports of Kenya Airways Ltd1, and that of East African Breweries Ltd2. The income statement or profit and loss account states that for the quoted calendar period, Income or Revenue, less Expenditure equals Profit.
1 Kenya Airways Ltd, Annual Report for year ending March 2006, Page 48, 49 2 East African Breweries Ltd. Annual Report for the year ending June 2005, page 31, 32

Economic Feasibility Study Nyangasi
14 March 2012 Page 2 of 25
The balance sheet shows the value of assets, liabilities, and owner’s equity (net assets) at particular points in time, the beginning and the end of the accounting period.
2.1.5 Return on investment
The accounting concept of profit can be used to study economic feasibility and to measure the financial performance of an investment project. This is done by measuring the return on investment or profitability, defined as the profit at the end of the accounting period, divided by the net assets or owner’s equity (capital employed) at the beginning of the period.
Table 1 below shows a summary of the financial statements for the two businesses, namely Kenya Airways and East African Breweries, and how the accounting concepts of net assets (owner’s equity) and net profit are used to measure return on investment for the two companies for the specified period.
Table 1: Rate of return based on accounting statements Company-Period
Net assets (MKshs).
Net profit (MKshs).
Return on assets
Shares issued
Net Assets Per share
Earnings per Share
KQ-2005/6 12340 4829 39% 461615484 26.7 10.45
EABL-2004/5 13544.51 4770 35% 658978530 20.6 7.24
The return on investment is 39 % and 35 % for Kenya Airways and East African Breweries respectively.
2.1.6 Dividend Yield-AN INDICATOR OF RETURN ON INVESTMENT
The Dividend Yield is an investment performance indicator that is similar to the return on investment defined at section 2.1.5 above. It is used for measuring the investment performance of businesses quoted in the stock exchange. This indicator is included in the Weekly Market Report on the Nairobi Stock Exchange shown at Table 2 for the week ending 18th August, 2006.
The indicator is computed from the ratio of the latest annual dividend paid per share (DPS) to the current price per share (Closing Price This Week), and reported as a percentage.
This indicator of investment performance therefore measures return on investment in terms of profit actually distributed to shareholders through payment of dividends. It ignores profit withheld in the business as retained earnings, which is still a return to the investment. Secondly, the performance indicator is based on the current market value of net assets, instead of the value of net assets shown in the balance sheet.

Economic Feasibility Study Nyangasi
14 March 2012 Page 3 of 25
TABLE 2: WEEKLY MARKET STATISTICS-NAIROBI STOCK EXCHANGE
WEEK ENDING 18TH AUGUST 2006
Ordinary Shares Average Average Shares Total Mkt Cap EPS DPS P/E DividendPrices Prices Traded Shares Million YieldLast Fri: This Fri: During Issued Kshs
MAIN INVESTMENT MARKET SEGMENT (MIMS) weekAgriculturalUnilever Tea 88.50 88.50 2,729 48,875,000 4,325 1.41 2.00 62.8 2.26%
Kakuzi 34.50 35.25 1,800 19,599,999 691 (3.76) 0.00 -9.4 0.00%
Rea Vipingo 19.00 21.00 331,939 60,000,000 1,260 2.07 0.80 10.1 3.81%
Sasini 29.75 29.75 105,081 38,009,250 1,131 -10.17 0.00 -2.9 0.00%
Commerc.and AlliedCar & Gen 37.00 34.25 46,300 22,279,616 763 8.71 0.67 3.9 1.96%
CMC 82.00 89.00 ####### 48,559,120 4,322 7.00 1.50 12.7 1.69%
Hutchings Biemer 20.25 20.25 - 360,000 7 -18.34 0.00 -1.1 0.00%
Kenya Airways ltd 117.00 115.00 ####### 461,615,484 53,086 10.45 1.75 11.0 1.52%
Marshalls 32.75 32.75 - 14,393,106 471 3.11 1.00 10.5 3.05%
Nation Media Group. 202.00 201.00 113,241 71,305,260 14,332 10.04 6.00 20.0 2.99%
TPS Eastern Africa (Serena) Ltd 100.00 101.00 98,262 89,865,588 9,076 4.96 1.25 20.4 1.24%
Uchumi Supermarkets 14.50 14.50 - 180,000,000 2,610 -6.82 0.00 -2.1 0.00%
Finance & Invest.Barclays Bank 290.00 294.00 123,503 203,682,600 59,883 18.00 14.00 16.3 4.76%
CFC Bank 82.00 82.00 162,720 156,000,000 12,792 3.17 0.84 25.9 1.02%
Diamond Trust 72.00 68.50 398,634 124,218,750 8,509 2.43 0.00 28.2 0.00%
Equity Bank Ltd 122.00 120.00 614,267 90,564,550 10,868 3.80 2.00 31.6 1.67%
Housing Finance 36.50 41.00 ####### 115,000,000 4,715 0.51 0.00 80.4 0.00%
ICDC 135.00 145.00 173,532 54,995,188 7,974 5.37 3.00 27.0 2.07%
Jubilee Holdings Ltd 163.00 163.00 18,526 36,000,000 5,868 9.66 4.00 16.9 2.45%
K.C.B Bank 179.00 176.00 ####### 199,600,000 35,130 6.00 4.00 29.3 2.27%
National Bank 54.00 49.25 875,586 200,000,000 9,850 1.29 0.00 38.2 0.00%
National Industrial Credit 96.50 96.00 164,891 82,414,551 7,912 3.34 2.50 28.7 2.60%
Pan Africa Insurance Holdings Ltd 52.00 85.00 51,334 48,000,000 4,080 3.68 1.20 23.1 1.41%
Standard Chartered Bank 155.00 156.00 91,126 271,967,810 42,427 8.72 7.50 17.9 4.81%
D.Indust. & AlliedAthi River Mining Ltd 79.00 84.50 528,317 94,000,000 7,943 2.10 0.75 40.2 0.89%
BOC (K) 160.00 160.00 - 19,525,446 3,124 10.62 5.50 15.1 3.44%
Bamburi 150.00 164.00 198,225 362,959,275 59,525 5.52 5.30 29.7 3.23%
British American Tobacco 192.00 192.00 20,318 100,000,000 19,200 13.82 12.50 13.9 6.51%
Carbacid 137.00 137.00 - 11,326,755 1,552 10.01 5.00 13.7 3.65%
Crown Berger 35.00 34.25 32,034 23,727,000 813 1.45 1.00 23.6 2.92%
E.A.Cables 524.00 525.00 370,852 20,250,000 10,631 10.40 5.00 50.5 0.95%
E.A.Portland 130.00 130.00 14,100 90,000,000 11,700 6.75 2.50 19.3 1.92%
E.A.Breweries 135.00 138.00 681,000 658,978,630 90,939 7.24 4.50 19.1 3.26%
Kenol 130.00 117.00 5,939 100,796,120 11,793 8.92 2.25 13.1 1.92%
K.Pow.& L. 150.00 183.00 985,535 79,128,000 14,480 16.05 1.50 11.4 0.82%
KenGen 32.75 32.00 ####### ########### 70,348 0.80 0.23 40.0 0.72%
Mumias 56.00 55.50 ####### 510,000,000 28,305 2.53 1.50 21.9 2.70%
Olympia Capital Holdings 14.70 14.70 1,000 10,000,000 147 1.14 0.00 12.9 0.00%
Sameer Africa Ltd 15.25 14.90 784,306 278,342,393 4,147 0.74 0.50 20.1 3.36%
Total 37.25 37.50 332,788 175,064,706 6,565 3.04 2.50 12.3 6.67%
Unga 15.85 15.50 197,487 63,090,728 978 1.15 0.00 13.5 0.00%
WEEKLY MARKET STATISTICS FOR THE WEEK ENDING FRIDAY 18th AUGUST 2006

Economic Feasibility Study Nyangasi
14 March 2012 Page 4 of 25
The dividend yield indicator is similar to the return on investment defined at section 2.1.5, except that profit is replaced by dividend, while the balance sheet value of net assets is replaced by market value. The dividend yield is therefore more relevant to the short-term investing shareholder buying the shares currently in expectation of the next dividend. To such an investor, the market value paid today and represented by the price of share, is more realistic than the value of net assets per share shown in the balance sheet. Secondly, the dividend expected at end of the year is more certain than the future growth of investment that might arise from retained earnings. The dividend yields of the two companies quoted are reproduced in Table 3 below for comparison: TABLE 3: KENYA AIRWAYS AND EAST AFRICAN BREWERIES NAIROBI STOCK EXCHANGE-WEEK ENDING 18TH AUGUST 200 Ordinary Shares Average Average Shares Total Mkt Cap EPS DPS P/E Dividend
Prices Prices Traded Shares Million YieldLast Fri: This Fri: During week Issued Kshs
MAIN INVESTMENT MARKET SEGMENT (MIMS)Commerc.and AlliedKenya Airways ltd 117.00 115.00 1,360,621 461,615,484 53,086 10.45 1.75 11.0 1.52%D.Indust. & AlliedE.A.Breweries 135.00 138.00 681,000 658,978,630 90,939 7.24 4.50 19.1 3.26% For the two businesses quoted, dividend yield as shown in Table 3 is 1.52 % and 3.26 % for Kenya Airways and East African Breweries respectively. East African Breweries is therefore a better investment when the dividend yield is used as the indicator. The return on investment measured as dividend yield in Table 3 is however much lower that the return on investment measured by the accounting statements (return on net assets) shown in Table 1. This is firstly because the market value of net assets (current share prices), used to measure dividend yield in Table 3, is higher than the balance sheet value of net assets used in Table 1, and secondly because dividend paid used in Dividend yield, is lower than earnings per share or net profit used in Table 1. The Weekly Market Report of the Nairobi Stock Exchange shown at Table 2 therefore reveals an investment opportunity. The dividend yields for the various quoted companies indicate short-term returns on investment that can be compared to other short term Investment opportunities such as the savings accounts in banks, unit trusts managed by fund managers of investment banks, or Government of Kenya (GOK) securities, such as treasury bills and bonds. A word of caution however. Dividends are returns, which fluctuate from year to year, depending on the actual investment performance of the business for that year, and the company’s dividend policy. There is therefore greater uncertainty in the dividend yields than in the fixed interest investments such as bank savings accounts, unit trusts in the money market, and GOK securities. The investor must therefore consider this difference in risk. For the period considered of the year 2005/6, the return on investment of the two companies can be compared with other investment alternatives such as:

Economic Feasibility Study Nyangasi
14 March 2012 Page 5 of 25
1) Money market unit trusts, Old Mutual was offering a rate of 6.95%, for a minimum investment of Kshs. 500000 on 22 August 2006.
2) Treasury bill rate3 were reported as shown below The average 91 days Treasury Bill rate, the TB rate has steadily increased from a low of 5.5 per cent in to a high of 7.5 per cent as of last week.
The short-term Treasury Bill rate increased from an average of 5.52 per cent in the week ending August 9, to an average of 5.63 per cent in the week ending August 16.
3) The interest rates for savings accounts in banks were lower than the TB rates, and money market unit trusts. 2.1.7 Economic feasibility (worthwhileness) of an investment project The return on investment computation, based on the accounting concept of profit (see section 2.1.5), is only valid for the accounting period (not exceeding one year), rather than the entire project life. The economic feasibility (worthwhileness) of a project or product, on the other hand, is measured by the extent to which the utility value received during the entire project or product life, exceeds the proper costs incurred in creating the utility value. In economic feasibility study, utility value (over the project or product life) is equivalent to accounting revenue, while costs (also over the project life) are equivalent to the accounting expense. However, the terms are not synonymous, because the accounting terms are applicable to short periods (not exceeding one year), during which period, the time value of money is ignored. The equivalent terms for the economic feasibility, apply to the entire project or product life (usually of several years), during which period, the time value of money must be taken into consideration.
2.1.7 Time value of money Time value of money is the recognition that one shilling received today is worth more than one shilling received in the future. The rent or interest each investor charges for its use can quantify this time value money. Time value of money therefore depends on the investment opportunities available to each investor. For example, in August 2006, an investor who could set aside Kshs. 500000, could invest in unit trusts with a return of 6.95%. A second investor could invest Kshs. 1 million in GOK securities (Treasury Bills) with a return on investment of 5.5 %. A third investor who could not raise the minimum required for investment in money market unit trusts or GOK securities, but was able to set aside Kshs. 30,000 could invest in a savings account with a commercial bank or finance company with a return on investment or interest that is lower than the 6.95 % in the money market unit trusts or 5.5 % in the TB rates. The first investor could therefore rightly consider 6.95 % per annum as the minimum return on investment or interest he should accept for his money. The second investor would consider 5.5 % per annum as his minimum return. On the other hand, the third investor would consider a lower interest (possibly 3% per annum in commercial banks) as the practical minimum return 3 The Standard, 23 August 2006, Banks hold 48pc of T-Bills, Kimathi Njoka and Benson Kathuri

Economic Feasibility Study Nyangasi
14 March 2012 Page 6 of 25
on investment he should accept. All the three investment opportunities have similar and low risks (provided the bank or finance company is carefully chosen). These investment opportunities with lowest risks and offering the minimum returns to a particular investor comprise the opportunity that the investor would forego for any other alternative investment. Economists refer to the returns offered by such investments as the opportunity cost for the investor. Clearly, the opportunity cost varies with each investor and with time. Other factors influencing an investor’s opportunity cost is the information available to the individual investor regarding available investment opportunities. Such factors are assumed equal, but this is often not so. For example, an investor may not be aware that GOK Securities such as treasury bills or bonds offer higher returns on investment, at risks, which are similar to savings accounts at commercial banks. This similarity in levels of risk is indicated by the fact that commercial banks4 and finance companies invest the deposits of other investors in GOK securities as quoted below. Close to 48 per cent of Treasury Bills and Bonds investments are held by commercial banks, according to data released by Central Bank of Kenya….CBK says in its weekly bulletin released yesterday that demand for the securities from banks has been rising steadily in the last three months despite the investments’ low return…."Banking institutions continue to dominate the Government securities market," says the bulletin. The fact that investors other than commercial banks do not invest directly in GOK securities is therefore due largely to lack of information. Because the opportunity cost is the minimum return on investment that a particular investor is willing to accept, other alternative investment projects will only be attractive if they offer higher returns, other factors such as risks, remaining equal. The opportunity cost therefore represents the minimum rent or interest that the investor will charge for the use of his money. The opportunity costs of different investors therefore represent the minimum time value of money for each investor. Engineering projects are investments undertaken by either individuals or business organisations. They are therefore subject to the opportunity cost of the prospective investor in the same manner as any other investment. The only difference will be that Engineering projects may involve large investments requiring huge resources. 2.2.0 Methods for Economic Feasibility Studies Several methods are available for carrying out economic feasibility study of engineering (investment) projects. These are:
1) Payback period method 2) Present worth method-Net Present value (NPV) 3) Rate of return method-Internal Rate of Return (IRR) 4) Benefit–cost ratio method 5) Annual cost (capital recovery) method-Present Value of Costs (NPV)
4 The Standard, 23 August 2006, Banks hold 48pc of T-Bills, Kimathi Njoka and Benson Kathuri
Economic Feasibility Study Nyangasi
14 March 2012 Page 7 of 25
2.2.1 Payback Period Method
The payback period5 is the time it takes for the cumulative present value of benefits to become equal to the cumulative present value of costs. In general, shorter payback periods are better
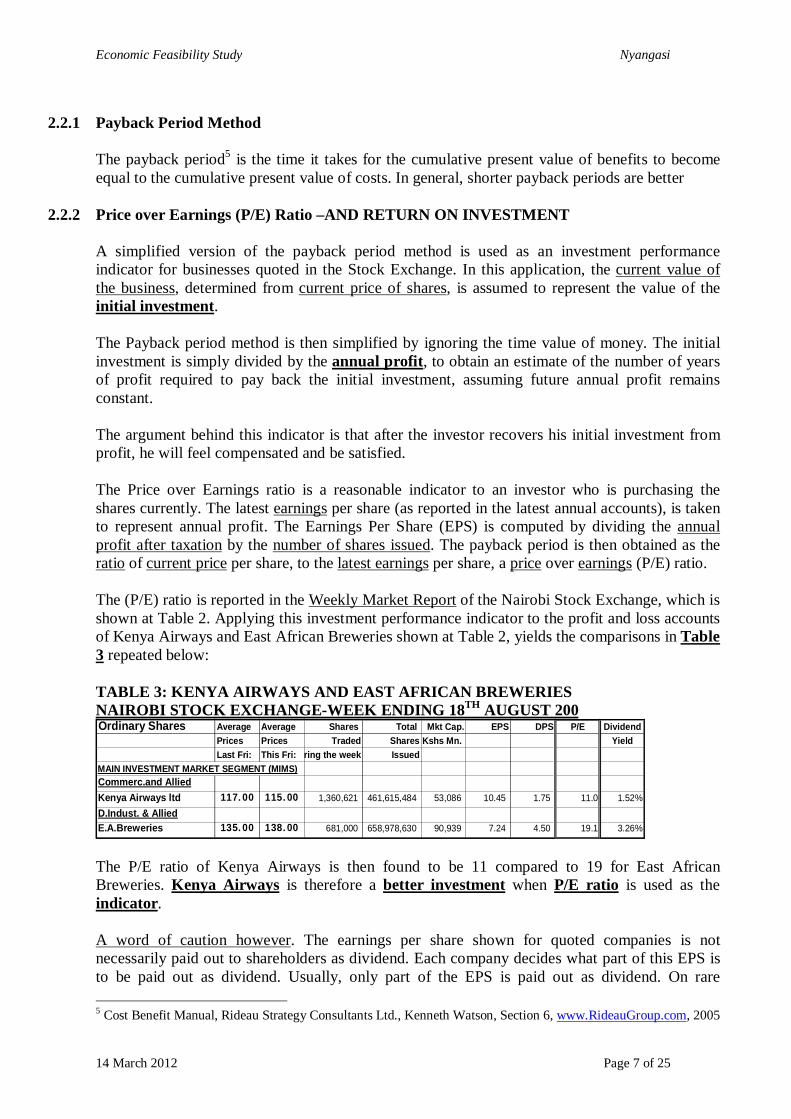
2.2.2 Price over Earnings (P/E) Ratio –AND RETURN ON INVESTMENT A simplified version of the payback period method is used as an investment performance indicator for businesses quoted in the Stock Exchange. In this application, the current value of the business, determined from current price of shares, is assumed to represent the value of the initial investment. The Payback period method is then simplified by ignoring the time value of money. The initial investment is simply divided by the annual profit, to obtain an estimate of the number of years of profit required to pay back the initial investment, assuming future annual profit remains constant. The argument behind this indicator is that after the investor recovers his initial investment from profit, he will feel compensated and be satisfied. The Price over Earnings ratio is a reasonable indicator to an investor who is purchasing the shares currently. The latest earnings per share (as reported in the latest annual accounts), is taken to represent annual profit. The Earnings Per Share (EPS) is computed by dividing the annual profit after taxation by the number of shares issued. The payback period is then obtained as the ratio of current price per share, to the latest earnings per share, a price over earnings (P/E) ratio. The (P/E) ratio is reported in the Weekly Market Report of the Nairobi Stock Exchange, which is shown at Table 2. Applying this investment performance indicator to the profit and loss accounts of Kenya Airways and East African Breweries shown at Table 2, yields the comparisons in Table 3 repeated below: TABLE 3: KENYA AIRWAYS AND EAST AFRICAN BREWERIES NAIROBI STOCK EXCHANGE-WEEK ENDING 18TH AUGUST 200 Ordinary Shares Average Average Shares Total Mkt Cap. EPS DPS P/E Dividend
Prices Prices Traded Shares Kshs Mn. YieldLast Fri: This Fri:During the week Issued
MAIN INVESTMENT MARKET SEGMENT (MIMS)Commerc.and AlliedKenya Airways ltd 117.00 115.00 1,360,621 461,615,484 53,086 10.45 1.75 11.0 1.52%D.Indust. & AlliedE.A.Breweries 135.00 138.00 681,000 658,978,630 90,939 7.24 4.50 19.1 3.26% The P/E ratio of Kenya Airways is then found to be 11 compared to 19 for East African Breweries. Kenya Airways is therefore a better investment when P/E ratio is used as the indicator. A word of caution however. The earnings per share shown for quoted companies is not necessarily paid out to shareholders as dividend. Each company decides what part of this EPS is to be paid out as dividend. Usually, only part of the EPS is paid out as dividend. On rare 5 Cost Benefit Manual, Rideau Strategy Consultants Ltd., Kenneth Watson, Section 6, www.RideauGroup.com, 2005

Economic Feasibility Study Nyangasi
14 March 2012 Page 8 of 25
occasions, a dividend exceeding the EPS is paid out using part of previously retained earnings. When the dividend is less than the EPS, the balance of the EPS is retained in the business, often to finance expansion or for similar reasons. The payback period represented by the (P/E) ratio in the Weekly Market Report of the Nairobi Stock Exchange, shown at Table 3, is therefore more relevant to the long term business, rather than to the short term investing shareholder. The short-term shareholder may not be prepared to wait for the 11 or 19 years payback period, to benefit from any earnings retained in the business. The indicator is however relevant to the long-term investor who would benefit from the growth or capital gains in value of shares that would arise from retained earnings being used to expand or modernise the business. The various methods for investment analysis, namely: Payback period method, Net Present value (NPV), Internal Rate of Return (IRR), Benefit–cost ratio method, Present Value of Costs (NPV), are summarised in the cost benefit manual6
6 Cost Benefit Manual, Rideau Strategy Consultants Ltd., Kenneth Watson, Section 6, www.RideauGroup.com, 2005

Economic Feasibility Study Nyangasi
14 March 2012 Page 9 of 25
EXAMPLE 1: UGUNJA WATER SUPPLY PROJECT
ANNUAL COST METHOD CAPITAL COSTS FOR THE PROJECT TABLE 2.1: CONSTRUCTION, INSTALLATION, AND COMMISSIONING COSTS
ASSET DESCRIPTION COST (KSHS.) 1 MECHANICAL & ELECTRICAL EQUIPMENT 150,000.00 Submersible pump, Electrical Cabling, Switch-gear & Controls, Power
Supply equipment
2 PIPELINES 833,000.00 Excavation (Kshs. 268,000.00) Purchase and laying pipes (Kshs. 565,000) 3 RESERVOIRS (MASONRY) 20,000.00 5 BUILDINGS 950,000.00 Power house (Kshs. 50,000.00) Staff Housing (Kshs. 500,000.00) Offices (Kshs. 400,000.00) 7 WATER KIOSKS 50,000.00 TOTAL CAPITAL COST 2,003,000.00
2.4.1 Annual cost of Capital for Project The annual cost of each capital item is computed as the product of the capital cost of the asset, and the capital recovery factor for the asset. The capital recovery factor in turn is a function of the interest charged for capital and the expected economic life of the asset. Capital recovery factors for various asset lives and interest rates are shown in Appendix 1. The resulting values of annual cost of capital for various assets in the Ugunja Water project are tabulated Table 2.2 below. TABLE 2.2: CAPITAL RECOVERY COSTS (Interest RATE -20% per year)
ASSET TYPE LIFE (YEARS)
CAPITAL COST (KSHS.)
C.R. FACTOR
ANNUAL COST (KSHS.)
1 Mech./Elect. 10 150,000.00 0.2385 37,775.00 2 Pipelines 15 833,000.00 0.2139 178,1789.00 3 Tanks 20 20,000.00 0.2054 4108.00 4 Buildings 30 900,000.00 0.2008 180,720.00 5 Kiosks 10 50,000.00 0.2385 11,925.00 TOTAL ********** 2,003,000.00 ********** 412,707.00

Economic Feasibility Study Nyangasi
14 March 2012 Page 10 of 25
2.4.2 Unit Cost of Capital for Service or Product The annual cost of capital for Ugunja Water Project is Kshs. 412,707.00 annually. The volume of services or product delivered is 98 cubic metres of water per day for 365 days annually. The unit capital cost of water delivered is therefore Kshs. 11.50 for every cubic metre. 2.4.3 Operation and Maintenance Costs for Project annually Table 2.3: Manpower costs
Manpower category Number Monthly Rate Kshs.
Annual cost Kshs.
1 Operator/Pump attendant 1 2500.00 30,000.00 2 Pipe fitter 2 1500.00 36,000.00 3 Labour, un-skilled 3 950.00 34,200.00 Total annual labour cost 100,200.00
Electric Power cost Power rating of borehole pump (estimated during preliminary design) = 3.1 Kw. Operating hours of pump annually = 10*365 hours per year; Electric energy consumed = 3.1* 10 * 365 kWh per year; Current charges for electric power = 11.00 Kshs. Per kWh Annual cost of power = 11.00 * 3.1 *10 * 365 Kshs. Per year =Kshs. 124,465.00 per year. Annual cost of power =Kshs. 124,465.00 per year. Table 2.4: Maintenance costs
Asset category Capital cost (Kshs) Annual Rate % of Capital
Annual cost Kshs.
1 Borehole Existing 1 20,000.00 2 Elect./Mech Plant 150,000.00 5 7,500.00 3 Pipelines 833,000.00 2 16,660.00 4 Storage tanks (masonry) 20,000.00 1 200.00 5 Buildings (masonry) 900,000.00 1 90,000.00 6 Buildings (wooden) 50,000.00 2 1,000.00 Annual maintenance cost ******** *********** 135,360.00
Table 2.5: Annual cost of Operation and Maintenance
Cost Item Annual cost (Kshs.) 1 Annual Manpower costs 100,200.00 2 Annual Electrical power costs 124,465.00 3 Annual Asset Maintenance costs 135,360.00 Total annual costs for Operation and Maintenance 360,025.00
2.4.4 Unit cost of Operation and Maintenance The unit cost of operation and maintenance is obtained by dividing the total annual cost by the volume of product or services delivered during the period. This is 98 * 365 cubic metres of water. The unit (O&M) cost is therefore Kshs. 10.1 per cubic metre of water. 2.4.5 Annual Cost computed from Equivalent Uniform Annual Costs (EUAC) This is summarised in Table 2.6 below.
Economic Feasibility Study Nyangasi
14 March 2012 Page 11 of 25
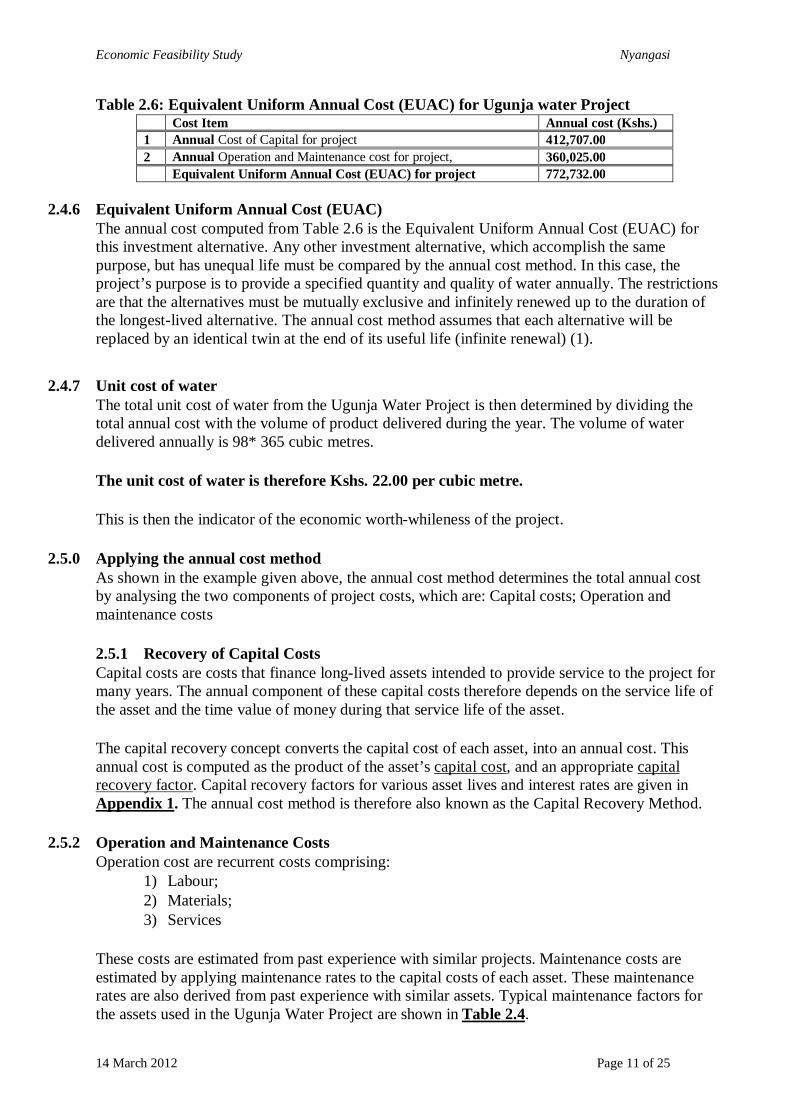
Table 2.6: Equivalent Uniform Annual Cost (EUAC) for Ugunja water Project Cost Item Annual cost (Kshs.) 1 Annual Cost of Capital for project 412,707.00 2 Annual Operation and Maintenance cost for project, 360,025.00 Equivalent Uniform Annual Cost (EUAC) for project 772,732.00
2.4.6 Equivalent Uniform Annual Cost (EUAC)
The annual cost computed from Table 2.6 is the Equivalent Uniform Annual Cost (EUAC) for this investment alternative. Any other investment alternative, which accomplish the same purpose, but has unequal life must be compared by the annual cost method. In this case, the project’s purpose is to provide a specified quantity and quality of water annually. The restrictions are that the alternatives must be mutually exclusive and infinitely renewed up to the duration of the longest-lived alternative. The annual cost method assumes that each alternative will be replaced by an identical twin at the end of its useful life (infinite renewal) (1).
2.4.7 Unit cost of water
The total unit cost of water from the Ugunja Water Project is then determined by dividing the total annual cost with the volume of product delivered during the year. The volume of water delivered annually is 98* 365 cubic metres. The unit cost of water is therefore Kshs. 22.00 per cubic metre. This is then the indicator of the economic worth-whileness of the project.
2.5.0 Applying the annual cost method As shown in the example given above, the annual cost method determines the total annual cost by analysing the two components of project costs, which are: Capital costs; Operation and maintenance costs 2.5.1 Recovery of Capital Costs Capital costs are costs that finance long-lived assets intended to provide service to the project for many years. The annual component of these capital costs therefore depends on the service life of the asset and the time value of money during that service life of the asset. The capital recovery concept converts the capital cost of each asset, into an annual cost. This annual cost is computed as the product of the asset’s capital cost, and an appropriate capital recovery factor. Capital recovery factors for various asset lives and interest rates are given in Appendix 1. The annual cost method is therefore also known as the Capital Recovery Method.
2.5.2 Operation and Maintenance Costs Operation cost are recurrent costs comprising:
1) Labour; 2) Materials; 3) Services
These costs are estimated from past experience with similar projects. Maintenance costs are estimated by applying maintenance rates to the capital costs of each asset. These maintenance rates are also derived from past experience with similar assets. Typical maintenance factors for the assets used in the Ugunja Water Project are shown in Table 2.4.

Economic Feasibility Study Nyangasi
14 March 2012 Page 12 of 25
APPENDIX 1: CAPITAL RECOVERY FACTORS FOR ASSET LIVES AND INTEREST RATES LIFE IN YEARS )(n ASSET TYPE INTEREST %)(i per year C.R.F7
5 MOTOR VEHICLES
6 8 10 12 15 20 25 30
0.2374 0.2505 0.2638 0.2774 0.2983 0.3344 0.3718 0.4106
10 MECHANICAL ELECTRICAL PLANT & MACHINERY
6 8 10 12 15 20 25 30
0.1359 0.1490 0.1627 0.1770 0.1993 0.2385 0.2801 0.3235
15 UPVC PIPELINES MECHANICAL ELECTRICAL PLANT
6 8 10 12 15 20 25 30
0.1030 0.1168 0.1315 0.1468 0.1710 0.2139 0.2591 0.3060
20 ELECTRICAL POWER PLANT TRANSMISSION LINES
6 8 10 12 15 20 25 30
0.0872 0.1019 0.1175 0.1339 0.1598 0.2054 0.2529 0.3016
25 RAILWAY TRACTION EQUIPMENT
6 8 10 12 15 20 25 30
0.0782 0.0937 0.1102 0.1275 0.1547 0.2021 0.2509 0.3004
30 RAILWAY ROLLING STOCK BUILDING STRUCTURES CIVIL WORKS
6 8 10 12 15 20 25 30
0.0726 0.0888 0.1061 0.1241 0.1523 0.2008 0.2503 0.3001
40 STRUCTURES BUILDINGS CIVIL WORKS
6 8 10 12 15 20 25 30
0.0665 0.0839 0.1023 0.1213 0.1506 0.2001 0.2500 0.3000
7 Capital Recovery Factor (CRF) = )1)1((
)1(
n
n
iii
CRF converts present amount P to an annuity A recovered at )(i % interest rate per year for )(n years
Economic Feasibility Study Nyangasi
14 March 2012 Page 13 of 25
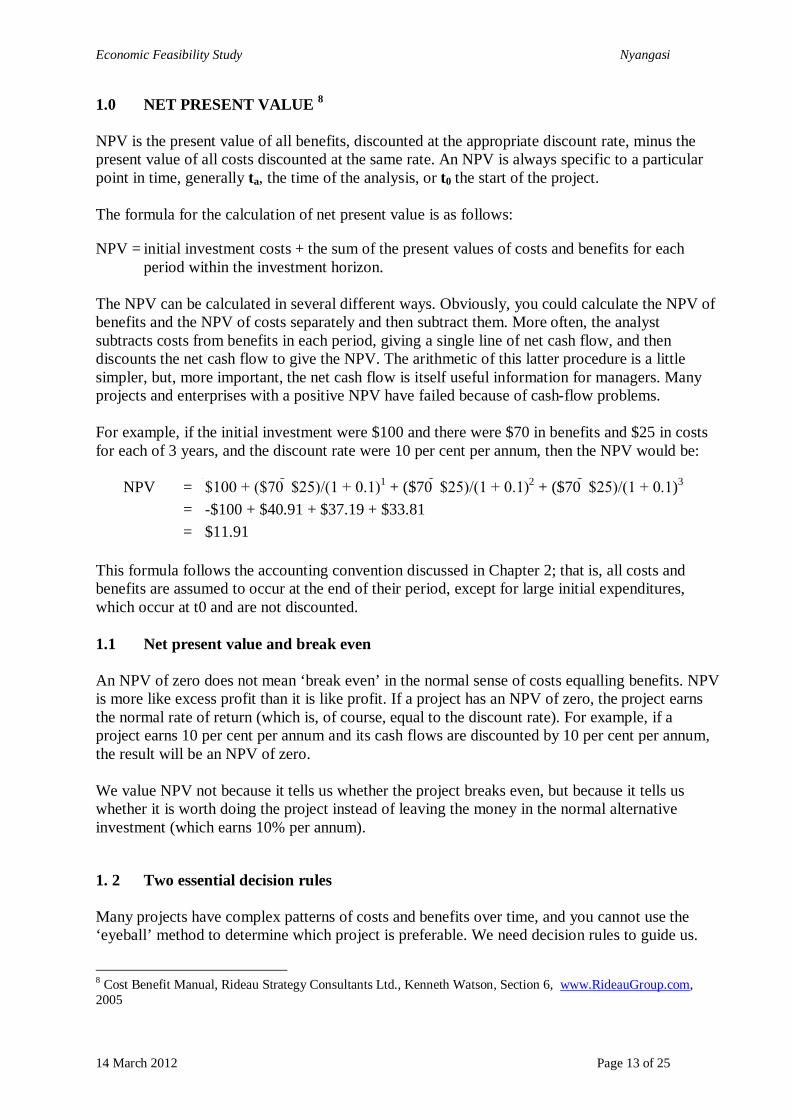
1.0 NET PRESENT VALUE 8 NPV is the present value of all benefits, discounted at the appropriate discount rate, minus the present value of all costs discounted at the same rate. An NPV is always specific to a particular point in time, generally ta, the time of the analysis, or t0 the start of the project. The formula for the calculation of net present value is as follows:
NPV = initial investment costs + the sum of the present values of costs and benefits for each period within the investment horizon.
The NPV can be calculated in several different ways. Obviously, you could calculate the NPV of benefits and the NPV of costs separately and then subtract them. More often, the analyst subtracts costs from benefits in each period, giving a single line of net cash flow, and then discounts the net cash flow to give the NPV. The arithmetic of this latter procedure is a little simpler, but, more important, the net cash flow is itself useful information for managers. Many projects and enterprises with a positive NPV have failed because of cash-flow problems. For example, if the initial investment were $100 and there were $70 in benefits and $25 in costs for each of 3 years, and the discount rate were 10 per cent per annum, then the NPV would be:
NPV = $100 + ($70 $25)/(1 + 0.1)1 + ($70 $25)/(1 + 0.1)2 + ($70 $25)/(1 + 0.1)3 = -$100 + $40.91 + $37.19 + $33.81 = $11.91
This formula follows the accounting convention discussed in Chapter 2; that is, all costs and benefits are assumed to occur at the end of their period, except for large initial expenditures, which occur at t0 and are not discounted. 1.1 Net present value and break even An NPV of zero does not mean ‘break even’ in the normal sense of costs equalling benefits. NPV is more like excess profit than it is like profit. If a project has an NPV of zero, the project earns the normal rate of return (which is, of course, equal to the discount rate). For example, if a project earns 10 per cent per annum and its cash flows are discounted by 10 per cent per annum, the result will be an NPV of zero. We value NPV not because it tells us whether the project breaks even, but because it tells us whether it is worth doing the project instead of leaving the money in the normal alternative investment (which earns 10% per annum).
1. 2 Two essential decision rules Many projects have complex patterns of costs and benefits over time, and you cannot use the ‘eyeball’ method to determine which project is preferable. We need decision rules to guide us.
8 Cost Benefit Manual, Rideau Strategy Consultants Ltd., Kenneth Watson, Section 6, www.RideauGroup.com, 2005

Economic Feasibility Study Nyangasi
14 March 2012 Page 14 of 25
Many decision rules have been proposed. Some work well only in particular situations; others are prone to error. Only two rules are consistently accurate and reliable. These are given below.
Case 1: Single project, unconstrained budget, ‘go’ or ‘no go’ decision
Decision rule 1: Do not undertake projects whose NPV is less than zero, unless you are willing to ‘lose money’ to achieve a non-economic objective.
Example 1 NPV Decision Project A +$3 Accept Project B +$0 Indifferent Project C - $1 Reject 1.3 Unreliable decision rules 1.3.1 The internal rate of return The Internal Rate of Return (IRR) is the discount rate that makes the NPV of the project zero. An IRR higher than the standard discount rate indicates that you should go ahead with the project, and when you are choosing among alternative projects, a higher IRR is preferred. If project A earns an IRR of 15 per cent, for example, whereas the ordinary project earns 10 per cent, then project A is an attractive investment. The IRR has three important limitations (see boxes below) that make it a poor substitute for NPV as a decision rule. Nevertheless, many managers find the IRR intuitively appealing in a way that the NPV is not. They tend to think that the meaning of an IRR is transparent, but it is not. When you calculate the IRR, you need to interpret it with care. The underlying formula for the IRR is the same as for the NPV. If you know the discount rate, you can calculate the NPV and vice versa. The mathematics of the IRR calculation, however, is not based on a proof and a formula. In practice, the analyst uses a computer to calculate the IRR by trial and error iterations. Given a guess at the likely IRR, the computer enters higher and lower values for i in the formula until it results in an NPV of zero. Most spreadsheets in common use have a limit on the number of iterations the computer will try. If the computer does not find a discount rate that gives an NPV of zero within this limited number of iterations, it gives an error message. The analyst then has to start the process again with a different guess at the value of the IRR. In addition to this procedural awkwardness, the IRR has two other limitations that make its use doubtful. These are given below.
Limitation 1: Simple comparisons between IRRs may be misleading if the projects are not the same size. A project with an IRR of 7 per cent is not necessarily a better choice than one with an IRR of 6 per cent. The size of each project and the discount rate can influence which project is best.

Economic Feasibility Study Nyangasi
14 March 2012 Page 15 of 25
EXAMPLE 2 PROJECT A PROJECT B TOTAL COST $100 $10000 IRR 6% 7% DISCOUNT RATE 5% 5% If you choose project A, you will have $100 earning 7 per cent plus the residual $9,900 earning 5 per cent (total return = $7 + $495 = $502). If you choose project B, you will have the whole $10,000 earning 6 per cent ($600). Project B is better, even though it has a lower IRR than project A Limitation 2: In many cases, more than one value of the IRR will solve the equation, and it may not be apparent to the analyst that other equally good values exists because the computer typically stops when it finds any acceptable value of the IRR. Multiple values of the IRR (some negative, some positive) are especially likely if the annual net cash flow of the project alternates between positive and negative figures, a common event because of the cyclical re-capitalisation requirements of projects and/or fluctuations in the prices of inputs and outputs. In some cases, analysts 'bend' the accounting rules to obtain a cash-flow pattern that gives a single value for the IRR, but this is not a satisfactory solution. At best, the possible existence of multiple values of the IRR throws a shadow over its use; at worst, it may lead to incorrect choices among projects.

Economic Feasibility Study Nyangasi
14 March 2012 Page 16 of 25
EXAMPLE 2: SONDU-MIRIU HYDRO-ELECTRIC POWER PROJECT
COST-BENEFIT ANALYSIS METHOD An example of the type of studies required to properly inform investment policy decisions is the “River Profile studies”9 carried out for the Lake Basin development Authority in 1986, by C. Lotti & Associates and WLPU consultants. In those studies, the catchment areas of the seven rivers that flow into in Lake Victoria were examined for irrigation and hydro-electric power production potential. Four rivers were found to have viable hydro-electric power potential. The outcome of these studies for hydro-electric power production without irrigation are summarized as shown in Table 1. Table 1:Benefit/Cost ratios for river development based on power benefits alone Hydro power project Rivers in the catchment of Lake Victoria Basin
Installed capacity (MW)
Costs of Dam, Transfer, Power station (Million Kshs.)
Benefit/cost ratio (Power benefits alone)
Miriu Scheme, Sondu River 84 2639 1.73 Nandi Forest, Yala River 50 1564 1.31 Hemsted Bridge, Nzoia River 60 2700 0.98 Gogo Falls, Kuja River 18 770 0.72
9 Summary Report, United Nations project KEN/82/001; Lake Basin River Catchment Development, River Profile Studies. 1986.

Economic Feasibility Study Nyangasi
14 March 2012 Page 17 of 25
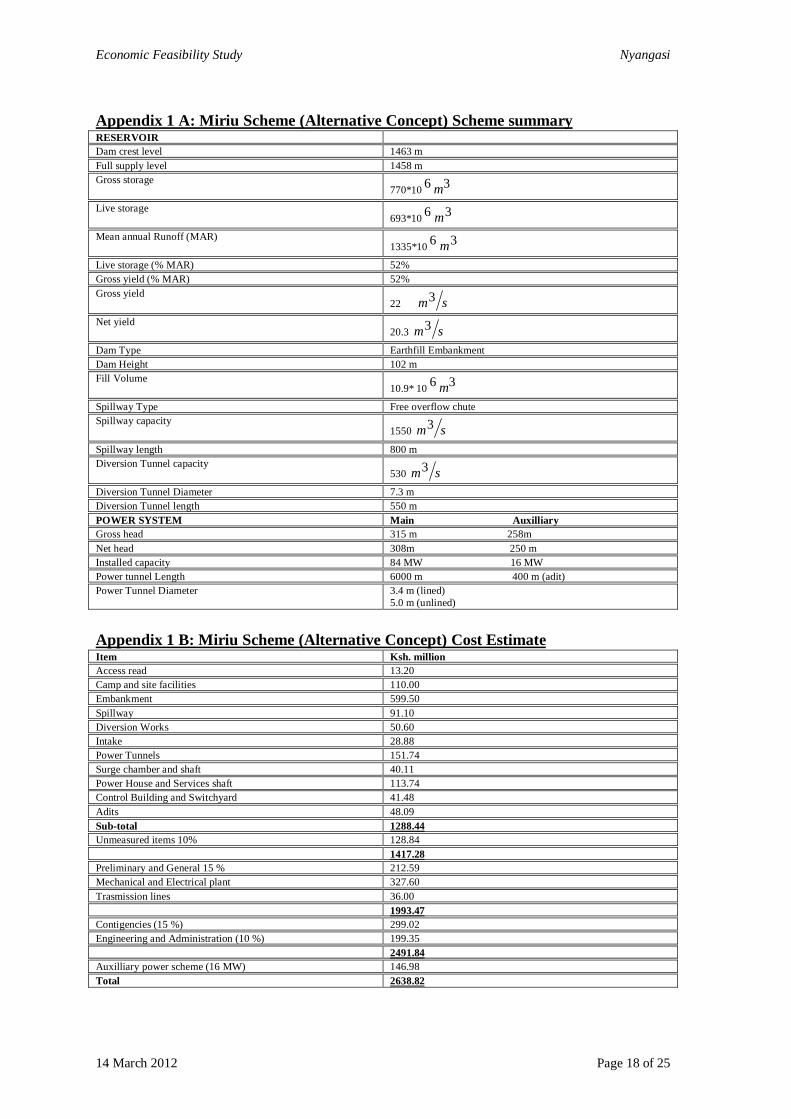
The concepts and the cost estimates for the various potential power projects are summarized in Appendix 1 (Miriu Scheme), Appendix 2 (Nandi Forest), Appendix 3 (Hemsted Bridge), Appendix 4 (Gogo Falls). It an be seen that the benefit/cost ratios of the various projects shows that while the Miriu Scheme, and the Nandi Forest project were both financially viable, the Miriu scheme had a higher profitability and would therefore be the first option in a phased programme. The Miriu scheme was therefore initiated first in the year 2001.This example illustrates the value of cost/benefit analysis as a tool for guiding investment policy decisions. Similar cost/benefit analysis is required to inform investment decisions in all other sectors of the economy.
Economic Feasibility Study Nyangasi
14 March 2012 Page 18 of 25
Appendix 1 A: Miriu Scheme (Alternative Concept) Scheme summary RESERVOIR Dam crest level 1463 m Full supply level 1458 m Gross storage
770*10 36 m
Live storage 693*10 36 m
Mean annual Runoff (MAR) 1335*10 36 m
Live storage (% MAR) 52% Gross yield (% MAR) 52% Gross yield
22 sm3
Net yield 20.3 sm3
Dam Type Earthfill Embankment Dam Height 102 m Fill Volume
10.9* 10 36 m
Spillway Type Free overflow chute Spillway capacity
1550 sm3
Spillway length 800 m Diversion Tunnel capacity
530 sm3
Diversion Tunnel Diameter 7.3 m Diversion Tunnel length 550 m POWER SYSTEM Main Auxilliary Gross head 315 m 258m Net head 308m 250 m Installed capacity 84 MW 16 MW Power tunnel Length 6000 m 400 m (adit) Power Tunnel Diameter 3.4 m (lined)
5.0 m (unlined)
Appendix 1 B: Miriu Scheme (Alternative Concept) Cost Estimate Item Ksh. million Access read 13.20 Camp and site facilities 110.00 Embankment 599.50 Spillway 91.10 Diversion Works 50.60 Intake 28.88 Power Tunnels 151.74 Surge chamber and shaft 40.11 Power House and Services shaft 113.74 Control Building and Switchyard 41.48 Adits 48.09 Sub-total 1288.44 Unmeasured items 10% 128.84 1417.28 Preliminary and General 15 % 212.59 Mechanical and Electrical plant 327.60 Trasmission lines 36.00 1993.47 Contigencies (15 %) 299.02 Engineering and Administration (10 %) 199.35 2491.84 Auxilliary power scheme (16 MW) 146.98 Total 2638.82

Economic Feasibility Study Nyangasi
14 March 2012 Page 19 of 25
Appendix 2 A: Nandi Forest (Kano Plain Transfer) Scheme summary RESERVOIR Dam crest level 1837.5 m Full supply level 1832.5 m Gross storage
305 *10 36 m
Live storage 275* 10 36 m
Mean annual Runoff (MAR) 361* 10 36 m
Live storage % Mar 76 % Gross yoeld % Mar 57 % Gross yield
6.6 sm3
Net yield 6.0 sm3
Dam Type Earthfill Embankment Dam Height 58 m Fill Volume
3.1 * 10 36 m
POWER SYSTEM Gross head 552.5 m Net head 542 m Installed capacity 50 mw Power tunnel Length 17.2 km Power Tunnel Diameter 3 m Spillway Type Free overflow Chute Spillway capacity
400 sm3
Appendix 2 B: Nandi Forest (Kano Plain Transfer) Cost Estimate Item Ksh. million Access road 48.40 Camp and site facilities 100.00 Embankment 172.43 Spillway 23.48 Diversion and Outlet Works 31.83 Intake 28.43 Headrace and tailrace tunnels 195.62 Surge chamber and riser 15.81 Shaft and penstocks 25.15 Services Adit 47.02 Control building and switchyard 41.92 Underground powerhouse 67.76 Acess Adits 47.02 Sub-total 826.10 Unmeasured items 10% 82.61 Preliminary and General 15 % 136.31 Mechanical and Electrical plant 200.00 Trasmission lines 6.00 1251.02 Contigencies (15 %) 187.65 Engineering and Administration (10 %) 125.10 Total 1563.77

Economic Feasibility Study Nyangasi
14 March 2012 Page 20 of 25
Appendix 3 A: Hemsted Bridge (Kerio Transfer) Scheme summary RESERVOIR Dam crest level 1778.5 m Full supply level 1773.5 m Gross storage
252*10 36 m Live storage
226*10 36 m Mean annual Runoff (MAR)
505*10 36 m Live storage % Mar 45 % Gross yield % Mar 62 % Gross yield
9.9 sm3 Net yield
9.0 sm3 Dam Type Earthfill Embanlment Dam Height 47.5 m Fill Volume
3.60*10 36 m
POWER SYSTEM Gross head 553.5 m Net head 498.5 m Installed capacity 60 mw Power tunnel Length 53400 m Power Tunnel Diameter (lined) 2.5 m Power Tunnel Diameter (unlined) 3.2 m Spillway Type Free overflow Chute Spillway capacity
1000 sm3 Diversion Type Conduit Diversion capacity
340 sm3
Appendix 3 B: Hemsted Bridge (Kerio Transfer) Cost Estimate Item Ksh. million Access road 22.00 Camp and site facilities 160.00 Embankment 198.00 Spillway 75.51 Diversion and Outlet Works 43.04 Power Intake 27.21 Tunnel and shafts 860.87 Surge chamber and riser 15.96 Penstocks 67.36 Power House 53.50 Tailrace Channel 4.35 Sub-Total 1527.80 Unmeasured items 10% 152.78 1680.58 Preliminary and General 15 % 252.09 Mechanical and Electrical plant 240.00 Transmission lines 35.00 2207.67 Contigencies (15 %) 331.15 Engineering and Administration (10 %) 220.77 Total 2759.59

Economic Feasibility Study Nyangasi
14 March 2012 Page 21 of 25
24
FEASIBILITY STUDY: ANNUAL COST-WATER SUPPLY PROJECT-20 % DISCOUNT RATEANNUAL COST OF CAPITAL BY CAPITAL RECOVERY METHODDAILY WATER DEMAND/SUPPLY 420 CUBIC METRES CRF
Item Description of Capital Asset Asset Capital Discount 1+i (1+i )n i (1+i )n (1+i )n-1 AnnualNo. life cost Rate cost
years Shs %1 Mechanical and Electrical equipment and plant15 2,750,000 20 0.2138821 588,1762 GI Water pipelines 20 1,250,000 20 0.2053565 256,6963 Reservoirs, concrete and masonry 30 550,000 20 0.2008461 110,4654 Buildings and structures, concrete and masonry30 750,000 20 0.2008461 150,6355 Water kiosks, wooden 5 250,000 20 0.3343797 83,595
TOTAL ANNUAL COST OF CAPITAL 1,189,566
ANNUAL COST OF LABOUR ANNUAL COST OF ELECTRIC POWER
Item Description of Labour category Monthly Number Annual Power Operating Electric Electric ElectricNo. Cost cost Rating duty Energy Power Power
Kshs Kshs of Hours per charges costs1 Operator/Pump attendant 8,000 1 96,000 Pump per year Shs per per2 Pipe fitter 8,000 1 96,000 in Kw day Kwh Kwh year3 Labour, unskilled 6,000 1 72,000 Kshs
ANNUAL LABOUR COST 264,00018 10 65700 11 722,700
ANNUAL COST OF MAINTENANCE
Item Description of Capital Asset Maint. Capital Ann.Maint. SUMMARY OF ANNUAL COSTSNo. Factor cost Cost
% Capital Shs Kshs. ANNUAL CAPITAL COST 1,189,5661 Mechanical and Electrical equipment and plant 5 2,750,000 137,500 ANNUAL LABOUR COST 264,0002 GI Water pipelines 2 1,250,000 25,000 ANNUAL POWER COST 722,7003 Reservoirs, concrete and masonry 1 550,000 5,500 ANNUAL MAINTENANCE COST 180,5004 Buildings and structures, concrete and masonry1 750,000 7,5005 Water kiosks, wooden 2 250,000 5,000 EUAC 2,356,766
Total annual maintenance cost 180,500COST STRUCTURE OF WATER SUPPLY SERVICES
Equivalent Uniform Annual Cost (EUAC) Kshs 2,356,766 UNIT CAPITAL COST SHS/M3 7.8UNIT LABOUR COST SHS/M3 1.7
Annual water demand-supply (cubic metres) 153,300 UNIT POWER COST SHS/M3 4.7UNIT MAINT. COST SHS/M3 1.2
Unit cost of water per cubic metre (Kshs/m3) 15 UNIT COST OF WATER SHS/M3 15.4
11
1
n
n
i
ii

Economic Feasibility Study Nyangasi
14 March 2012 Page 22 of 25
FEASIBILITY STUDY: ANNUAL COST-WATER SUPPLY PROJECT-35 % DISCOUNT RATEANNUAL COST OF CAPITAL BY CAPITAL RECOVERY METHODDAILY WATER DEMAND/SUPPLY 420 CUBIC METRES CRF
Item Description of Capital Asset Asset Capital Discount 1+i (1+i )n i (1+i )n (1+i )n-1 AnnualNo. life cost Rate cost
years Shs %1 Mechanical and Electrical equipment and plant15 2,750,000 35 0.3539256 973,2952 GI Water pipelines 20 1,250,000 35 0.3508679 438,5853 Reservoirs, concrete and masonry 30 550,000 35 0.3500431 192,5244 Buildings and structures, concrete and masonry30 750,000 35 0.3500431 262,5325 Water kiosks, wooden 5 250,000 35 0.4504583 112,615
TOTAL ANNUAL COST OF CAPITAL 1,979,551
ANNUAL COST OF LABOUR ANNUAL COST OF ELECTRIC POWER
Item Description of Labour category Monthly Number Annual Power Operating Electric Electric ElectricNo. Cost cost Rating duty Energy Power Power
Kshs Kshs of Hours per charges costs1 Operator/Pump attendant 8,000 1 96,000 Pump per year Shs per per2 Pipe fitter 8,000 1 96,000 in Kw day Kwh Kwh year3 Labour, unskilled 6,000 1 72,000 Kshs
ANNUAL LABOUR COST 264,00018 10 65700 11 722,700
ANNUAL COST OF MAINTENANCE
Item Description of Capital Asset Maint. Capital Ann.Maint. SUMMARY OF ANNUAL COSTSNo. Factor cost Cost
% Capital Shs Kshs. ANNUAL CAPITAL COST 1,979,5511 Mechanical and Electrical equipment and plant 5 2,750,000 137,500 ANNUAL LABOUR COST 264,0002 GI Water pipelines 2 1,250,000 25,000 ANNUAL POWER COST 722,7003 Reservoirs, concrete and masonry 1 550,000 5,500 ANNUAL MAINTENANCE COST 180,5004 Buildings and structures, concrete and masonry1 750,000 7,5005 Water kiosks, wooden 2 250,000 5,000 EUAC 3,146,751
Total annual maintenance cost 180,500COST STRUCTURE OF WATER SUPPLY SERVICES
Equivalent Uniform Annual Cost (EUAC) Kshs 3,146,751 UNIT CAPITAL COST SHS/M3 12.9UNIT LABOUR COST SHS/M3 1.7
Annual water demand-supply (cubic metres) 153,300 UNIT POWER COST SHS/M3 4.7UNIT MAINT. COST SHS/M3 1.2
Unit cost of water per cubic metre (Kshs/m3) 21 UNIT COST OF WATER SHS/M3 20.5
11
1
n
n
i
ii

Economic Feasibility Study Nyangasi
14 March 2012 Page 23 of 25
FEASIBILITY STUDY: ANNUAL COST-WATER SUPPLY PROJECT-45 % DISCOUNT RATEANNUAL COST OF CAPITAL BY CAPITAL RECOVERY METHODDAILY WATER DEMAND/SUPPLY 420 CUBIC METRES CRF
Item Description of Capital Asset Asset Capital Discount 1+i (1+i )n i (1+i )n (1+i )n-1 AnnualNo. life cost Rate cost
years Shs %1 Mechanical and Electrical equipment and plant15 2,750,000 45 0.4517153 1,242,2172 GI Water pipelines 20 1,250,000 45 0.4502668 562,8333 Reservoirs, concrete and masonry 30 550,000 45 0.4500065 247,5044 Buildings and structures, concrete and masonry30 750,000 45 0.4500065 337,5055 Water kiosks, wooden 5 250,000 45 0.5331834 133,296
TOTAL ANNUAL COST OF CAPITAL 2,523,355
ANNUAL COST OF LABOUR ANNUAL COST OF ELECTRIC POWER
Item Description of Labour category Monthly Number Annual Power Operating Electric Electric ElectricNo. Cost cost Rating duty Energy Power Power
Kshs Kshs of Hours per charges costs1 Operator/Pump attendant 8,000 1 96,000 Pump per year Shs per per2 Pipe fitter 8,000 1 96,000 in Kw day Kwh Kwh year3 Labour, unskilled 6,000 1 72,000 Kshs
ANNUAL LABOUR COST 264,00018 10 65700 11 722,700
ANNUAL COST OF MAINTENANCE
Item Description of Capital Asset Maint. Capital Ann.Maint. SUMMARY OF ANNUAL COSTSNo. Factor cost Cost
% Capital Shs Kshs. ANNUAL CAPITAL COST 2,523,3551 Mechanical and Electrical equipment and plant 5 2,750,000 137,500 ANNUAL LABOUR COST 264,0002 GI Water pipelines 2 1,250,000 25,000 ANNUAL POWER COST 722,7003 Reservoirs, concrete and masonry 1 550,000 5,500 ANNUAL MAINTENANCE COST 180,5004 Buildings and structures, concrete and masonry1 750,000 7,5005 Water kiosks, wooden 2 250,000 5,000 EUAC 3,690,555
Total annual maintenance cost 180,500COST STRUCTURE OF WATER SUPPLY SERVICES
Equivalent Uniform Annual Cost (EUAC) Kshs 3,690,555 UNIT CAPITAL COST SHS/M3 16.5UNIT LABOUR COST SHS/M3 1.7
Annual water demand-supply (cubic metres) 153,300 UNIT POWER COST SHS/M3 4.7UNIT MAINT. COST SHS/M3 1.2
Unit cost of water per cubic metre (Kshs/m3) 24 UNIT COST OF WATER SHS/M3 24.1
11
1
n
n
i
ii

Economic Feasibility Study Nyangasi
14 March 2012 Page 24 of 25
ENGINEERING ECONOMY STUDY: WATER SUPPLY PROJECT- NET PRESENT VAJUE-INTERNAL RATE OF RETURNNET PRESENT VALUE FOR DISCOUNT RATES OF 10, 15 % UNTIL FIRST NEGATIVE VALUE OF NPV
SINGLE PAYMENT PRESENT WORTHWATER HAULAGE PROJECT Annual water demand-supply (cubic metres)
ONE WATER TANKER AND ONE DRIVER 365 days*2 Trips *5 m3/day = 3650 m3/yearTWO TRIPS PER DAY Price of water = 250 shs/m3
DISCOUNT YEAR OF PAYMENTRATE
YEAR 0 1 2 3 4 5 6 7 8 9 10CAPITAL ASSET 10 0.9091 0.8264 0.7513 0.6830 0.6209 0.5645 0.5132 0.4665 0.4241 0.3855
WATER TANKER -2,500,000CAPACITY
5 M3
Revenue 912,500 912,500 912,500 912,500 912,500 912,500 912,500 912,500 912,500 912,500O&MOperations(Staff) -240,000 -240,000 -240,000 -240,000 -240,000 -240,000 -240,000 -240,000 -240,000 -240,000Operations(Fuel) -10,000 -10,000 -10,000 -10,000 -10,000 -10,000 -10,000 -10,000 -10,000 -10,000Operations(services)Operations(services)Maintenance-% Asset 5 -125,000 -125,000 -125,000 -125,000 -125,000 -125,000 -125,000 -125,000 -125,000 -125,000NET CASH -2,500,000 537,500 537,500 537,500 537,500 537,500 537,500 537,500 537,500 537,500 537,500PRESENT VALUE 488,636 444,215 403,832 367,120 333,745 303,405 275,822 250,748 227,952 207,230NPV 802,705Discount rate 15 0.8696 0.7561 0.6575 0.5718 0.4972 0.4323 0.3759 0.3269 0.2843 0.2472Presesnt Value 467,391 406,427 353,415 307,317 267,232 232,376 202,066 175,710 152,791 132,862NPV 197,588Discount rate 20 0.8333 0.6944 0.5787 0.4823 0.4019 0.3349 0.2791 0.2326 0.1938 0.1615Presesnt Value 447,917 373,264 311,053 259,211 216,009 180,008 150,006 125,005 104,171 86,809NPV -246,546Discount rate 16 0.8621 0.7432 0.6407 0.5523 0.4761 0.4104 0.3538 0.3050 0.2630 0.2267Presesnt Value 463,362 399,450 344,353 296,856 255,911 220,613 190,183 163,951 141,337 121,842NPV 97,860Discount rate 17 0.8547 0.7305 0.6244 0.5337 0.4561 0.3898 0.3332 0.2848 0.2434 0.2080Presesnt Value 459,402 392,651 335,599 286,837 245,160 209,538 179,093 153,071 130,830 111,820NPV 3,999Discount rate 18 0.8475 0.7182 0.6086 0.5158 0.4371 0.3704 0.3139 0.2660 0.2255 0.1911Presesnt Value 455,508 386,024 327,139 277,237 234,946 199,107 168,735 142,996 121,183 102,697NPV -84,429
ni )1/(1
n
5i
s

Economic Feasibility Study Nyangasi
14 March 2012 Page 25 of 25
ENGINEERING ECONOMY STUDY: WATER SUPPLY PROJECT- NET PRESENT VALUE-INTERNAL RATE OF RETURNNET PRESENT VALUE FOR DISCOUNT RATES 10, 15 % UNTIL FIRST NEGATIVE VALUE OF NPV
SINGLE PAYMENT PRESENT WORTHWATER HAULAGE PROJECT Annual water demand-supply (cubic metres)
ONE WATER TANKER AND ONE DRIVER 365 days*2 Trips *5 m3/day = 3650 m3/yearTWO TRIPS PER DAY Price of water = 250 shs/m3
DISCOUNT YEAR OF PAYMENTRATE
YEAR 0 1 2 3 4 5 6 7 8 9 10CAPITAL ASSET 10 0.9091 0.8264 0.7513 0.6830 0.6209 0.5645 0.5132 0.4665 0.4241 0.3855
WATER TANKER -1,750,000CAPACITY
5 M3
Revenue 912,500 912,500 912,500 912,500 912,500 912,500 912,500 912,500 912,500 912,500O&MOperations(Staff) -240,000 -240,000 -240,000 -240,000 -240,000 -240,000 -240,000 -240,000 -240,000 -240,000Operations(Fuel) -10,000 -10,000 -10,000 -10,000 -10,000 -10,000 -10,000 -10,000 -10,000 -10,000Operations(services)Operations(services)Maintenance-% Asset 5 -87,500 -87,500 -87,500 -87,500 -87,500 -87,500 -87,500 -87,500 -87,500 -87,500NET CASH -1,750,000 575,000 575,000 575,000 575,000 575,000 575,000 575,000 575,000 575,000 575,000PRESENT VALUE 522,727 475,207 432,006 392,733 357,030 324,573 295,066 268,242 243,856 221,687NPV 1,783,126Discount rate 15 0.8696 0.7561 0.6575 0.5718 0.4972 0.4323 0.3759 0.3269 0.2843 0.2472Presesnt Value 500,000 434,783 378,072 328,758 285,877 248,588 216,164 187,969 163,451 142,131NPV 1,135,792Discount rate 20 0.8333 0.6944 0.5787 0.4823 0.4019 0.3349 0.2791 0.2326 0.1938 0.1615Presesnt Value 479,167 399,306 332,755 277,296 231,080 192,566 160,472 133,727 111,439 92,866NPV 660,671Discount rate 25 0.8000 0.6400 0.5120 0.4096 0.3277 0.2621 0.2097 0.1678 0.1342 0.1074Presesnt Value 460,000 368,000 294,400 235,520 188,416 150,733 120,586 96,469 77,175 61,740NPV 303,039Discount rate 30 0.7692 0.5917 0.4552 0.3501 0.2693 0.2072 0.1594 0.1226 0.0943 0.0725Presesnt Value 442,308 340,237 261,721 201,323 154,864 119,126 91,636 70,489 54,222 41,709NPV 27,635Discount rate 35 0.7407 0.5487 0.4064 0.3011 0.2230 0.1652 0.1224 0.0906 0.0671 0.0497Presesnt Value 425,926 315,501 233,704 173,114 128,233 94,987 70,361 52,119 38,607 28,598NPV -188,850
ni )1/(1
n
5i
Related Documents