January 22, 2009 2. VISIBILITY CONDITIONS AT CALIFORNIA CLASS 1 AREAS 2.1 Monitoring Data and Measuring Visibility Conditions As discussed in Chapter 1, the Regional Haze Rule requires tracking visibility conditions at all Class 1 Areas in deciviews (dv). Deciview levels are not measured directly; they are derived from direct measurement of the haze pollutant species that impair visibility. The measurements are made at 17 IMPROVE monitors in California, assigned to the 29 Class 1 Areas shown in Figure 1-2 in Chapter 1. California used only this monitoring data to determine visibility conditions, so the baseline and current visibility will be the same for Class 1 Areas sharing an IMPROVE monitor. For this first Plan submittal, the 2000-2004 baseline conditions are the reference point against which visibility improvement is tracked. For subsequent Plan updates (in the year 2018 and every 10 years thereafter), these baseline conditions will be used to calculate progress from the beginning of the regional haze program. Describing the average “Best Days” and “Worst Days” for Natural Conditions (background visibility in the absence of anthropogenic source visibility impairment) and Baseline Conditions (visibility considering all pollution sources) shows the typical range in visibility for each Class 1 Area during the baseline period. The Plan can be understood as a way to continually shrink the gap between worst days of the baseline period and worst days under Natural Conditions by reducing anthropogenic source visibility impairment. Table 2-1 shows the deciview values for the baseline best and worst days at each IMPROVE monitor and describes the hurdle to overcome in bringing the current worst visibility days to that of Natural Conditions at each Class 1 Area. In the future, the best days for the Baseline Conditions must be maintained or constantly bettered in subsequent planning periods. The Class 1 Areas with the highest baseline deciview levels and therefore the biggest hurdles to overcome to reach Natural Conditions are Agua Tibia Wilderness Area (68 percent reduction), Kings Canyon and Sequoia National Parks (70 percent reduction), and San Gorgonio and San Jacinto Wilderness Areas (67 percent reduction). These Class 1 Areas are all situated at or near the edge of air basins with high density populations, many different land uses, and large interstate transportation corridors. The Class 1 Areas with the least change needed in deciview level by 2064 are Redwoods National Park (25 percent reduction) and Point Reyes National Park (31 percent reduction). Because these two areas are located within 10 km of the coastline, they are exposed to large concentrations of sea salt, a natural cause of haze that will remain constant into the future. Therefore, the expected Natural Conditions at these two sites are much higher than for sites located further inland and hence the reductions needed to meet natural levels are much less. 2-1

Welcome message from author
This document is posted to help you gain knowledge. Please leave a comment to let me know what you think about it! Share it to your friends and learn new things together.
Transcript

January 22, 2009
2. VISIBILITY CONDITIONS AT CALIFORNIA CLASS 1 AREAS 2.1 Monitoring Data and Measuring Visibility Conditions As discussed in Chapter 1, the Regional Haze Rule requires tracking visibility conditions at all Class 1 Areas in deciviews (dv). Deciview levels are not measured directly; they are derived from direct measurement of the haze pollutant species that impair visibility. The measurements are made at 17 IMPROVE monitors in California, assigned to the 29 Class 1 Areas shown in Figure 1-2 in Chapter 1. California used only this monitoring data to determine visibility conditions, so the baseline and current visibility will be the same for Class 1 Areas sharing an IMPROVE monitor. For this first Plan submittal, the 2000-2004 baseline conditions are the reference point against which visibility improvement is tracked. For subsequent Plan updates (in the year 2018 and every 10 years thereafter), these baseline conditions will be used to calculate progress from the beginning of the regional haze program. Describing the average “Best Days” and “Worst Days” for Natural Conditions (background visibility in the absence of anthropogenic source visibility impairment) and Baseline Conditions (visibility considering all pollution sources) shows the typical range in visibility for each Class 1 Area during the baseline period. The Plan can be understood as a way to continually shrink the gap between worst days of the baseline period and worst days under Natural Conditions by reducing anthropogenic source visibility impairment. Table 2-1 shows the deciview values for the baseline best and worst days at each IMPROVE monitor and describes the hurdle to overcome in bringing the current worst visibility days to that of Natural Conditions at each Class 1 Area. In the future, the best days for the Baseline Conditions must be maintained or constantly bettered in subsequent planning periods. The Class 1 Areas with the highest baseline deciview levels and therefore the biggest hurdles to overcome to reach Natural Conditions are Agua Tibia Wilderness Area (68 percent reduction), Kings Canyon and Sequoia National Parks (70 percent reduction), and San Gorgonio and San Jacinto Wilderness Areas (67 percent reduction). These Class 1 Areas are all situated at or near the edge of air basins with high density populations, many different land uses, and large interstate transportation corridors. The Class 1 Areas with the least change needed in deciview level by 2064 are Redwoods National Park (25 percent reduction) and Point Reyes National Park (31 percent reduction). Because these two areas are located within 10 km of the coastline, they are exposed to large concentrations of sea salt, a natural cause of haze that will remain constant into the future. Therefore, the expected Natural Conditions at these two sites are much higher than for sites located further inland and hence the reductions needed to meet natural levels are much less.
2-1

January 22, 2009
Class 1 Areas at higher elevations in the Sierra Nevada such as Desolation Wilderness, Mokelumne Wilderness, and Hoover Wilderness, as well as those in the far northeastern corner of California such as Lava Beds National Monument and the South Warner Wilderness have the lowest deciview levels because these sites tend to be the furthest removed from the most highly urbanized portions of the State. These include the Caribou Wilderness and Thousand Lakes Wilderness in the northern, rural, high terrain areas close to Lassen Volcanic National Park. These sites need an approximately 50 percent reduction from current visibility levels, as measured by deciviews, to achieve Natural Conditions. The terrain, ecology, land use, and weather patterns around each IMPROVE monitor in California are unique. Emission sources producing haze species or their precursors can have seasonal fluctuations that vary from one area to another. Additionally, after pollutants are emitted from the various sources, their transformation and transport in ambient air is affected by weather patterns. Detailed examination of the resultant ambient air monitoring data does show similarities within definable intra-State regions. These sub-regions are different from each other based on physiographic features, as well as land use patterns. Therefore California has grouped its Class 1 Areas by geographic sub-region, as shown in Table 2-1. This facilitates comparison of different landscapes, meteorological conditions, and the impacts of local and regional emissions. The map in Figure 2-1 illustrates these sub-regions.
2-2

January 22, 2009
Table 2-1 IMPROVE monitors and Visibility at California Class 1Areas California Class 1 Areas (Visibility Calculated in Deciviews)
Current Conditions(2000-2004 Baseline)
Future Natural Conditions (2064 Goals)
IMPROVE Monitor (name and elevation
in meters) CLASS 1 AREA(s)
Worst Days
Best Days (maintain in future years)
Natural Worst Days
Deciview Hurdle
(baseline to 2064)
Improvement from Current Visibility on Worst Days
NORTHERN CALIFORNIA Marble Mountain Wilderness 55% TRIN
(1014 m.) Trinity
Yolla Bolly-Middle Eel Wilderness
17.4 3.4 7.9 9.5
Lava Beds National Monument 48% LABE (1460 m.)
Lava Beds South Warner Wilderness
15.1 3.2 7.9 7.2
Lassen Volcanic National Park 48% Caribou Wilderness
LAVO (1733 m.)
Lassen Volcanic
Thousand Lakes Wilderness
14.1 2.7 7.3 6.8
SIERRA CALIFORNIA
Desolation Wilderness 52% BLIS (2131 m.)
Bliss Mokelumne Wilderness
12.6 2.5 6.1 6.5
HOOV (2561m.)
Hoover Hoover Wilderness 12.9 1.4 7.7 5.2 40%
Yosemite National Park 57% YOSE (1603 m.)
Yosemite Emigrant Wilderness
17.6 3.4 7.6 10.0
Ansel Adams Wilderness 54% Kaiser Wilderness
KAIS (2598 m.)
Kaiser
John Muir Wilderness
15.5 2.3 7.1 8.4
Sequoia National Park 70% SEQU
(519 m.) Sequoia
Kings Canyon National Park 25.4 8.8 7.7 17.7
DOME (927 m.)
Dome Lands
Dome Lands Wilderness 19.4 5.1 7.5 11.9 61%
COASTAL CALIFORNIA REDW * (244 m.)
Redwood Redwood National Park 18.5 6.1 13.9 4.6 25%
PORE (97 m.)
Point Reyes
Point Reyes National Seashore 22.8 10.5 15.8 7.0 31%
Pinnacles Wilderness 57% PINN (302 m.)
Pinnacles Ventana Wilderness
18.5 8.9 8 10.5
RAFA (957 m.)
San Rafael San Rafael Wilderness 18.8 6.4 7.6 11.2 60%
SOUTHERN CALIFORNIA San Gabriel Wilderness 65% SAGA *
(1791 m.) San Gabriel Cucamonga Wilderness
19.9 4.8 7.0 12.9
San Gorgonio Wilderness 67% SAGO (1726m.)
San Gorgonio San Jacinto Wilderness
22.2 5.4 7.3 14.9
AGTI * (508 m.)
Agua Tibia Agua Tibia 23.5 9.6 7.6 15.9 68%
JOSH (1235 m.)
Joshua Tree
Joshua Tree National Park 19.6 6.1 7.2 12.4 63%
* REDW is influenced by transport from the same regions as the Northern California sites, which are different from the regions influencing the other monitors close to the coast. However, sea salt is a major component of haze at Redwoods National Park, characteristic of coastal sites. Also, a sparsely populated coastal mountain range, cresting around 7000 feet, separates REDW from many inland source influences. Therefore REDW is aligned with Coastal sites for analysis purposes.
SAGA and AGTI are closer to the Pacific Ocean than the other Southern California sites. However, commercial marine shipping, port activities, sources in the Los Angeles Basin, and transport from Mexico impact all the southern sites. Also, sea salt’s contribution to haze on worst days at all the southern sites is <0.1%. All the Southern sites are separated from the other sites by transverse mountain ranges and the Antelope Valley, hence their grouping for analysis purposes.
2-3

January 22, 2009
2.2 Haze Species Contributions to Light Extinction The deciview level describes the visibility, or relative clarity of view, for every day that haze species are measured at a particular IMPROVE monitor. The deciview value for a given day is the natural logarithm of the total light extinction on that day. As air pollution is reduced, light extinction lessens, visibility improves, and the deciview value gets lower. Although the deciview number does not distinguish how much there is of each haze species or where it came from, the fundamental monitoring data which is used to derive deciview levels reveals what causes haze at each monitor. Differences in the key species which contribute to light extinction in different areas of California provide important insights into the sources of haze. The IMPROVE monitors measure the concentration of six particulate haze species in the PM2.5 size fraction: nitrates, sulfates, organic carbon (OC), elemental carbon (EC), soil, sea salt. The total amount of mass in the PM10-2.5 size fraction is also measured and denoted as coarse mass. Most importantly, each haze species has a different capability to absorb and scatter light, so the measured pollutant concentration must be converted to light extinction to get the true impact or contribution of each haze species to visibility impairment each measured day. The relationship between haze species concentrations and light extinction is described below. Haze Species Concentration: These are the particulate matter species concentrations that are measured in micrograms per cubic meter (ug/m3) every three days at each IMPROVE monitor. Since each species does not have the same capability to extinguish light, sometimes a low concentration of one species can have the same effect as a high concentration of another species. For this reason, California has focused on the contribution to light extinction of each species to describe what causes haze at each IMPROVE monitor. Light Extinction: This is calculated by the Haze Algorithm II equation (see Appendix A) which gives different weight to the concentrations of the various haze species according to their ability to absorb or scatter light and expresses total extinction at the monitor for that day in inverse megameters (Mm-1). Humidity and temperature affect the light extinction strength of some of species. The Haze Algorithm II incorporates these factors into the light extinction calculation, on each day of measurement, as the cold/wet and hot/dry seasons change in California, according to the location of the monitor. The Haze Algorithm II also accounts for Rayleigh scattering by natural gases which contribute a relatively small, constant amount to light extinction at each monitor. For the purpose of determining which haze species drive poor visibility on worst days, the “reconstructed” light extinction for the seven major haze species is used as an analysis tool rather than total extinction. That is because these haze species are the aerosol particles that need to be reduced to improve visibility.
2-4
January 22, 2009
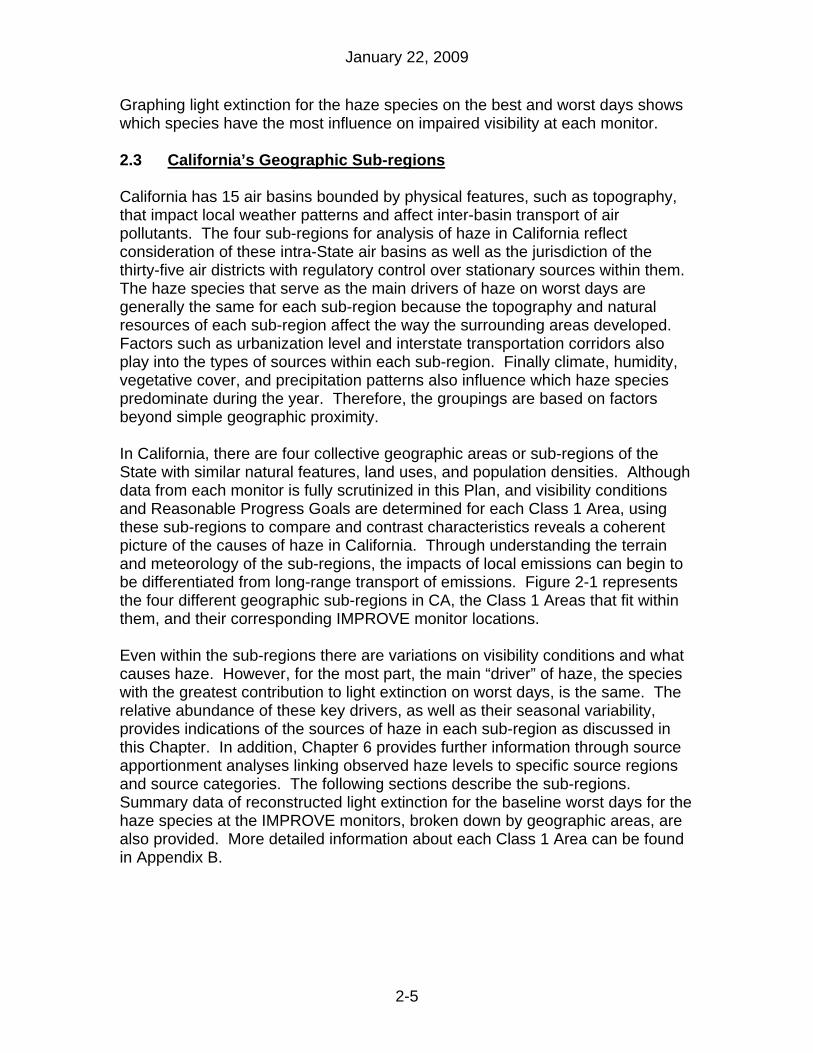
Graphing light extinction for the haze species on the best and worst days shows which species have the most influence on impaired visibility at each monitor. 2.3 California’s Geographic Sub-regions California has 15 air basins bounded by physical features, such as topography, that impact local weather patterns and affect inter-basin transport of air pollutants. The four sub-regions for analysis of haze in California reflect consideration of these intra-State air basins as well as the jurisdiction of the thirty-five air districts with regulatory control over stationary sources within them. The haze species that serve as the main drivers of haze on worst days are generally the same for each sub-region because the topography and natural resources of each sub-region affect the way the surrounding areas developed. Factors such as urbanization level and interstate transportation corridors also play into the types of sources within each sub-region. Finally climate, humidity, vegetative cover, and precipitation patterns also influence which haze species predominate during the year. Therefore, the groupings are based on factors beyond simple geographic proximity. In California, there are four collective geographic areas or sub-regions of the State with similar natural features, land uses, and population densities. Although data from each monitor is fully scrutinized in this Plan, and visibility conditions and Reasonable Progress Goals are determined for each Class 1 Area, using these sub-regions to compare and contrast characteristics reveals a coherent picture of the causes of haze in California. Through understanding the terrain and meteorology of the sub-regions, the impacts of local emissions can begin to be differentiated from long-range transport of emissions. Figure 2-1 represents the four different geographic sub-regions in CA, the Class 1 Areas that fit within them, and their corresponding IMPROVE monitor locations. Even within the sub-regions there are variations on visibility conditions and what causes haze. However, for the most part, the main “driver” of haze, the species with the greatest contribution to light extinction on worst days, is the same. The relative abundance of these key drivers, as well as their seasonal variability, provides indications of the sources of haze in each sub-region as discussed in this Chapter. In addition, Chapter 6 provides further information through source apportionment analyses linking observed haze levels to specific source regions and source categories. The following sections describe the sub-regions. Summary data of reconstructed light extinction for the baseline worst days for the haze species at the IMPROVE monitors, broken down by geographic areas, are also provided. More detailed information about each Class 1 Area can be found in Appendix B.
2-5

January 22, 2009
Figure 2-1 California’s Geographic Sub-Regions
COASTAL
NORTHERN
SIERRA
SOUTHERN
REDW LABE
TRIN LAVO
YOSE
BLIS
HOOV
SEQU
KAIS
PORE
DOME
PINN
RAFA
AGTISAGA
JOSHSAGO
IMPROVE Monitor CLASS 1 AREA
2-6

January 22, 2009
2.3.1 Northern California The Northern California sub-region encompasses most of the Northeast Plateau Air Basin, the northeastern portion of the North Coast Air Basin, and the northern part of the Sacramento Valley Air Basin. The IMPROVE monitors in this sub-region are LABE (Lava Beds and South Warner Wilderness), LAVO (Lassen Volcanic National Park, Caribou Wilderness, and Thousand Lakes Wilderness), and TRIN (Marble Mountain Wilderness and Yolla Bolly-Middle Eel Wilderness). Emission sources are primarily from rural land uses as there are few small cities and towns. However, the I-5 corridor has considerable traffic, particularly truck traffic. Major rail freight corridors also pass through the region. Figure 2-2 depicts the average haze species makeup on the worst days during the 2000-2004 baseline period at each IMPROVE site in the Northern California region. The baseline days with the worst air quality are dominated by organic aerosols. Figure 2-3 illustrates the seasonal nature of the species that contribute to haze at Lassen Volcanic National Park in 2002. Organic aerosols peak during the summer months. Evaluation of this data has shown a strong correlation with the incidence of wildfires. For example, in 2002, the Biscuit Fire burned nearly 500,000 acres in the Siskiyou National Forest in the states of Oregon and California. Figure 2-4 provides a satellite image of the Biscuit Fire in 2002 highlighting the broad regional extent of smoke from this fire which impacted Class 1 Areas throughout much of Northern California. Smoke from the smaller Umpqua Complex Area Fires northwest of Crater Lake in Oregon also impaired visibility in both states. In addition to wildfires, natural biogenic emissions from plants play an important role in contributing to elevated organic aerosol levels observed during the spring and summer months.
2-7
January 22, 2009
Figure 2-2 Baseline Conditions for 20 Percent Worst Days: Northern California
0
10
20
30
40
50
60
Reco
nstr
ucte
d Ex
tinct
ion
[1/M
m]
LABE1 LAVO1 TRIN1
Northern CA Area Monitors
Average Extinction for Worst Days over baseline period (2000-2004)
SoilSea SaltOrganic CarbonElemental CarbonCoarse MassSulfatesNitrates
Figure 2-3 Seasonal Variation in Haze Species at Lassen Volcanic NP in 2002
2-8

January 22, 2009
Figure 2-4 Smoke Impacts from the 2002 Biscuit Fire in Siskiyou National Forest
OREGON
CALIFORNIA
Biscuit Fire Plume
Umpqua Area Complex Fire Plume
2.3.2 Sierra California
The Sierra sub-region of California encompasses the Sierra Nevada Mountains and foothills, from the Mountain Counties Air Basin, the Lake Tahoe Air Basin, the northern portion of the Great Basin Valleys, and the eastern part of the San Joaquin Valley Air Basin. The IMPROVE monitors representing the Sierra Nevada region are BLIS (Desolation Wilderness and Mokelumne Wilderness) , HOOV (Hoover Wilderness), YOSE (Yosemite National Park and Emigrant Wilderness), KAIS (Ansel Adams Wilderness, Kaiser Wilderness, and John Muir Wilderness), SEQU (Sequoia National Park and Kings Canyon National Park), and DOME (Dome Lands Wilderness). Emissions are primarily from forest biogenic sources, wildfires, transport from the Central Valley, and from the highway and major rail transportation corridors through the mountains. Figure 2-5 depicts the average haze species makeup on the worst days during the 2000-2004 baseline period at each IMPROVE site in the Sierra sub-region. As with the far Northern California region, the baseline days with the worst air quality are dominated by organic aerosols, with the majority coming from wildfire smoke and biogenic forest emissions. Sulfates and nitrates are also high on the worst case days in the Sierra sub-region, particularly at the SEQU monitor. Figure 2-6 illustrates the seasonal variations in the species that contribute to haze at Sequoia National Park. Nitrate peaks in the winter months, similar to the seasonal variability observed within the San Joaquin Valley. Because the SEQU monitor is at 519 meters, it is exposed to urban, agriculture, and transportation corridor emissions from the San Joaquin Valley to the west of the Park. As a result, the SEQU monitor represents the highest aerosol concentrations and
2-9

January 22, 2009
most severe visibility impacts within the Class 1 Areas. Other sites in the Sierra sub-region are at a higher elevation and therefore experience more limited impacts from the San Joaquin Valley, and corresponding greater impacts from wildfires and biogenic emissions, which peak during the summer months.
Figure 2-5 Baseline Conditions for 20 Percent Worst Days: Sierra California
0
20
40
60
80
100
120
Rec
onst
ruct
ed E
xtin
ctio
n [1
/Mm
]
BLIS1 DOME1 HOOV1 KAIS1 SEQU1 YOSE1
Sierra CA area monitors
Average Extinction for Worst Days over baseline period (2000-2004)
SoilSea SaltOrganic CarbonElemental CarbonCoarse MassSulfatesNitrates
Figure 2-6 Seasonal Variation in Haze Species at Sequoia 2004
2-10

January 22, 2009
2.3.3. Southern California
The Southern California sub-region includes the South Coast Air Basin, the northern portion of the Salton Sea Air Basin, and the central and western portions of the Mojave Desert Air Basin. The IMPROVE monitors representing the Southern California sub-region are AGTI (Agua Tibia), SAGA (San Gabriel Wilderness and Cucamonga Wilderness), JOSH (Joshua Tree National Park), and SAGO (San Gorgonio Wilderness and San Jacinto Wilderness). These areas are located generally downwind of the South Coast Air Basin and therefore, upwind urban emissions are key sources of haze. Emissions from offshore shipping and international transport are also important. Figure 2-7 depicts the average haze species makeup on the worst days during the 2000-2004 baseline period at each IMPROVE site in the Southern California sub-region. The sites in Southern California have some of the most impaired visibility in the State, with the largest contribution to haze coming from nitrate. Sulfates and organic carbon are also contributors. Due to their proximity to the urban areas of southern California and general transport patterns, urban sources are a major contributor to haze at all of these sites. Elevated sulfate contributions at Agua Tibia in part reflect the fact that this site is closer to the coast, with corresponding impacts from both offshore shipping emissions, as well as natural marine sources of sulfate. It is also the Class 1 Area closest to Mexico and tracer analysis show that AGTI receives the largest impact from Mexican stationary and area source SOx emissions of all the IMPROVE monitors in California. Figure 2-8 depicts the seasonal variation in haze species at San Gorgonio Wilderness. Unlike other areas of the State, there is less of a pronounced seasonal pattern to individual haze species contributions, with high nitrate concentrations occurring throughout the year. Sulfate contributions are slightly higher during the summer months due to greater photochemical production during this time of year. Organic carbon contributions are also slightly higher during the summer, likely reflecting some impacts from wildfires and biogenic sources.
2-11

January 22, 2009
Figure 2-7 Baseline Conditions for 20 Percent Worst Days: Southern California
0
1020
304050
6070
8090
100
Reco
nstru
cted
Ext
inct
ion
[1/M
m]
AGTI1 JOSH1 SAGA1 SAGO1
Southern CA Area Monitors
Average Extinction for Worst Days over baseline period (2000-2004)
SoilSea SaltOrganic CarbonElemental CarbonCoarse MassSulfatesNitrates
Figure 2-8 Seasonal Variation in Haze Species at San Gorgonio 2004
2-12

January 22, 2009
2.3.4 Coastal California
The Coastal sub-region is represented by the IMPROVE monitors close to the Pacific Ocean coastline. Based on population density and climate, there are actually several sub-areas in this California sub-region. The northern tip encompasses the coastal regions of the North Coast Air Basin, effectively separated from far northern inland California by the Trinity Alps. The San Francisco Bay Area Air Basin around Point Reyes, and the Central Coast Air Basins from Monterey to Ventura include Class 1 Areas with similar exposure to emissions species from oceanic and coastal sources, both offshore, and from urban and agricultural uses along the coast. In general, the IMPROVE monitors representing the Coastal California region are REDW (Redwoods National Park), PORE (Point Reyes National Seashore), PINN (Pinnacles Wilderness and Ventana Wilderness), and RAFA (San Rafael Wilderness). Figure 2-9 depicts the average haze species makeup on the worst days during the 2000-2004 baseline period at each IMPROVE site in the Coastal sub-region. Contributions on the worst days come from sulfates, nitrates, and sea salt. Point Reyes has higher nitrate concentrations as compared to the other coastal monitors. This is partly because of its location close to a significant metropolitan area, immediately southeast of the IMPROVE monitor and because the monitor is downwind, and within a few nautical miles, of a major commercial shipping lane. The sea salt contribution is especially pronounced at REDW and PORE because these two sites are located within 10 km of the coastline, at elevations close to sea level. In contrast, both PINN and RAFA are located further inland, with a lesser influence from sea salt on worst days than on best days. Sea salt is a natural contributor to haze, and as explained earlier in this section will remain constant in the future, resulting in higher natural conditions at these sites as compared to sites further inland.
2-13

January 22, 2009
Figure 2-9 Baseline Conditions for 20 Percent Worst Days: Coastal California
0
10
20
30
40
50
60
70
80
90
100
Reco
nstru
cted
Ext
inct
ion
[1/M
m]
PINN1 PORE1 RAFA1 REDW1
Coastal CA Area Monitors
Average Extinction for Worst Days over baseline period (2000-2004)
SoilSea SaltOrganic CarbonElemental CarbonCoarse MassSulfatesNitrates
The pattern of sulfate concentration measured at the monitors throughout the year is similar at all the IMPROVE monitors in California. It increases slightly mid-year compared with slightly lower levels during the winter months. Compared with the other sub-regions, the contribution to light extinction from sulfates is generally higher at the coastal sites. Sulfates are the key driver of haze on worst days at the coastal monitors, except on winter worst days at Point Reyes when nitrates predominate.
2-14
January 22, 2009
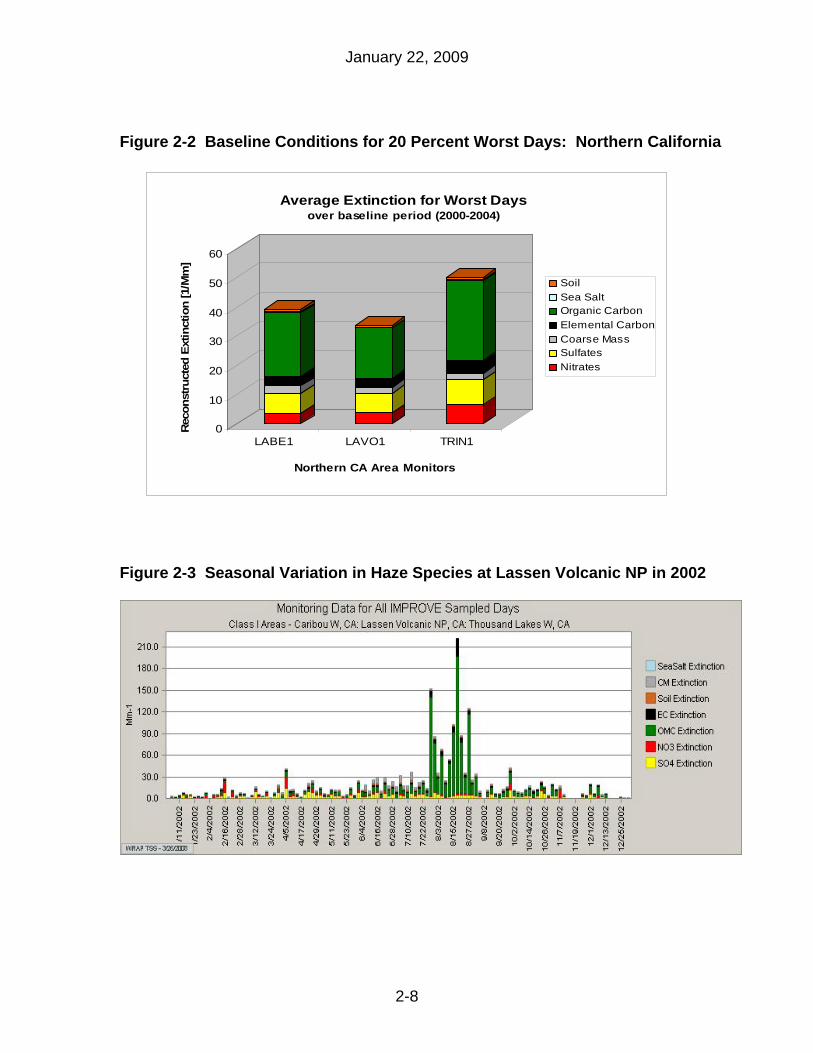
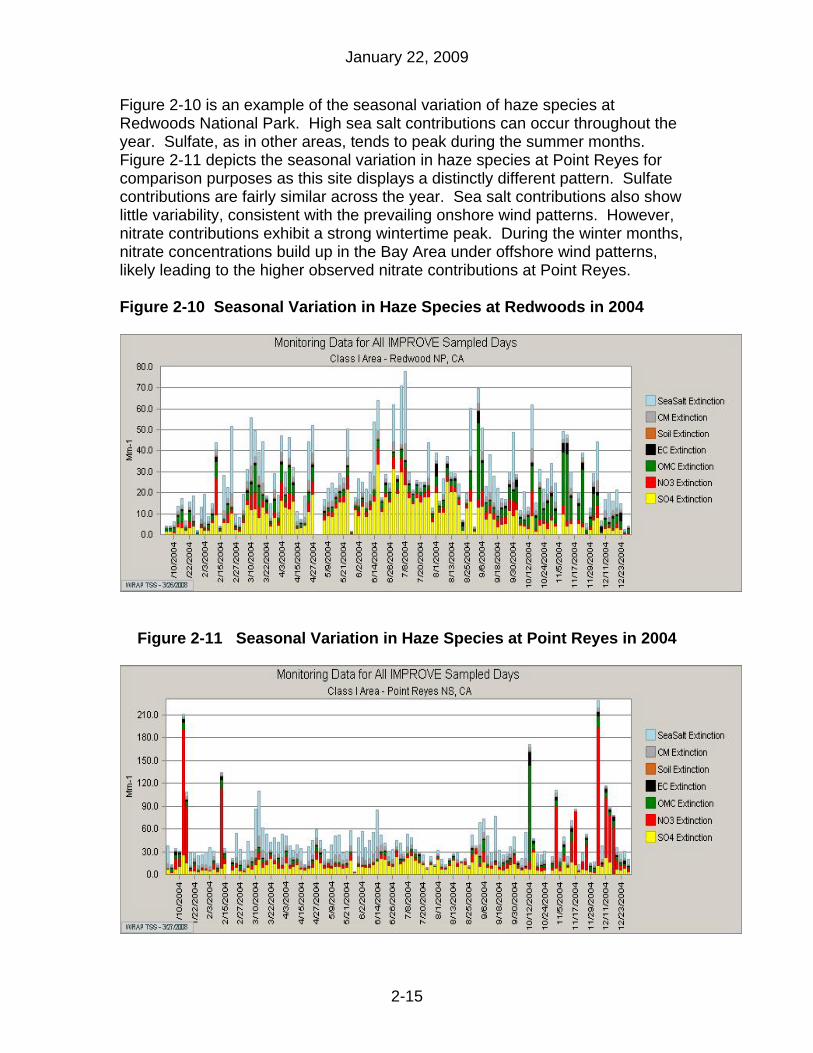
Figure 2-10 is an example of the seasonal variation of haze species at Redwoods National Park. High sea salt contributions can occur throughout the year. Sulfate, as in other areas, tends to peak during the summer months. Figure 2-11 depicts the seasonal variation in haze species at Point Reyes for comparison purposes as this site displays a distinctly different pattern. Sulfate contributions are fairly similar across the year. Sea salt contributions also show little variability, consistent with the prevailing onshore wind patterns. However, nitrate contributions exhibit a strong wintertime peak. During the winter months, nitrate concentrations build up in the Bay Area under offshore wind patterns, likely leading to the higher observed nitrate contributions at Point Reyes. Figure 2-10 Seasonal Variation in Haze Species at Redwoods in 2004
Figure 2-11 Seasonal Variation in Haze Species at Point Reyes in 2004
2-15

January 22, 2009
This Page Intentionally Left Blank
2-16
Related Documents


![33 VISIBILITY - California State University, Northridgectoth/Handbook/chap33.pdf · 4.Counting: concerned with the number of visibility graphs under various re-strictions [HN01].](https://static.cupdf.com/doc/110x72/5f1161299fd09722a84511bc/33-visibility-california-state-university-ctothhandbookchap33pdf-4counting.jpg)