18 Macroeconomic Review, April 2017 Monetary Authority of Singapore Economic Policy Group 2 The Singapore Economy Cyclical Impulses And Structural Trends Following relatively sluggish growth outturns in the first three quarters of 2016, domestic economic activity improved over the subsequent two quarters. Notwithstanding this pickup, there was some unevenness in the sectoral outcomes. While the trade-related sectors and modern services recorded a step-up, growth of the domestic-oriented cluster was relatively weaker, as it had to contend with a contraction in private construction and lacklustre consumer spending. Overall, the economy should expand by 1–3% in 2017, not markedly different from the 2% recorded in 2016. Growth this year will be anchored by the trade-related sectors, particularly the IT-associated segments. On the global front, new mobile phone product launches, together with increasing semiconductor intensity in electronics products, will provide support for the domestic electronics industry. However, while firm external demand will continue to benefit the semiconductor and precision engineering industries, recovery in the rest of the manufacturing sector would remain patchy, at least in the near term. Meanwhile, the underlying demographic and technological trends driving financial and ICT services, respectively, should continue to bolster the modern services cluster. In contrast, spending on discretionary retail items and other services is expected to be dampened by the subdued labour market. Apart from cyclical developments, the retail sector has had to adjust to structural factors, including the rise of e-commerce. Nevertheless, domestic retailers can tap on new and growing opportunities in the region through the digital channel.

Welcome message from author
This document is posted to help you gain knowledge. Please leave a comment to let me know what you think about it! Share it to your friends and learn new things together.
Transcript
18 Macroeconomic Review, April 2017
Monetary Authority of Singapore Economic Policy Group
2 The Singapore Economy
Cyclical Impulses And Structural Trends
Following relatively sluggish growth outturns in the first three quarters of 2016, domestic economic activity improved over the subsequent two quarters. Notwithstanding this pickup, there was some unevenness in the sectoral outcomes. While the trade-related sectors and modern services recorded a step-up, growth of the domestic-oriented cluster was relatively weaker, as it had to contend with a contraction in private construction and lacklustre consumer spending. Overall, the economy should expand by 1–3% in 2017, not markedly different from the 2% recorded in 2016. Growth this year will be anchored by the trade-related sectors, particularly the IT-associated segments. On the global front, new mobile phone product launches, together with increasing semiconductor intensity in electronics products, will provide support for the domestic electronics industry. However, while firm external demand will continue to benefit the semiconductor and precision engineering industries, recovery in the rest of the manufacturing sector would remain patchy, at least in the near term. Meanwhile, the underlying demographic and technological trends driving financial and ICT services, respectively, should continue to bolster the modern services cluster. In contrast, spending on discretionary retail items and other services is expected to be dampened by the subdued labour market. Apart from cyclical developments, the retail sector has had to adjust to structural factors, including the rise of e-commerce. Nevertheless, domestic retailers can tap on new and growing opportunities in the region through the digital channel.
The Singapore Economy 19
Monetary Authority of Singapore Economic Policy Group
2.1 Recent Economic Developments
An Uneven Growth Outcome
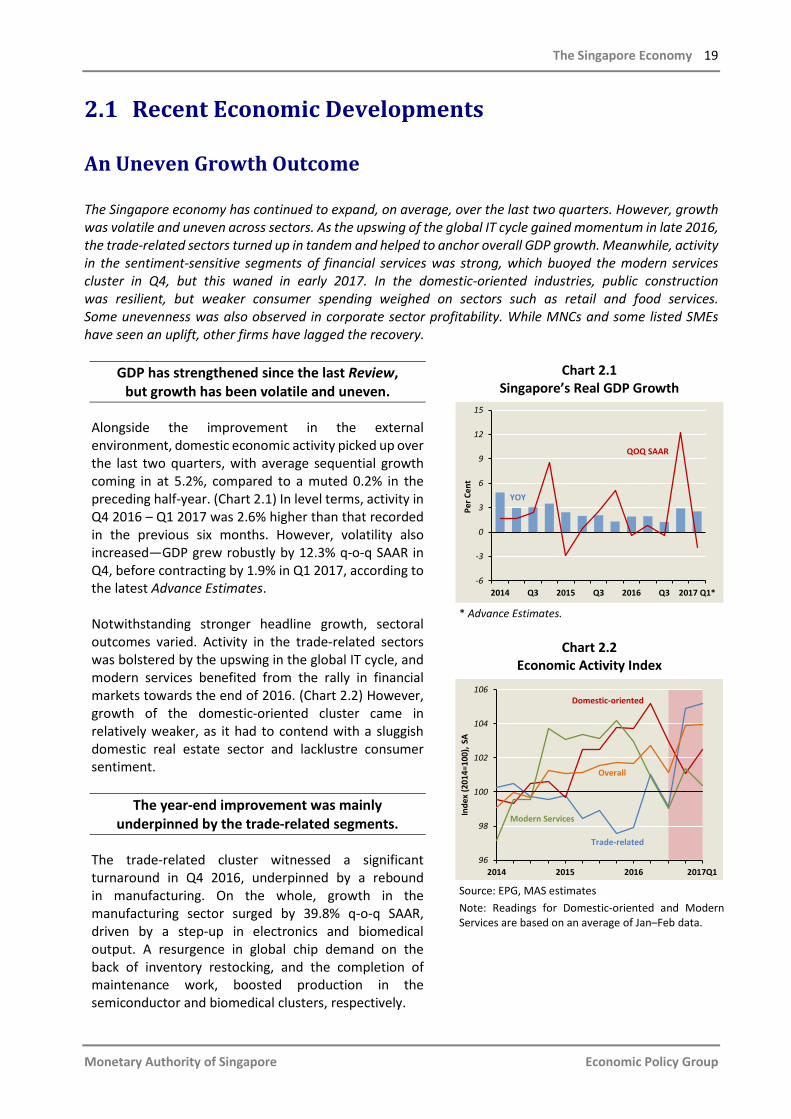
The Singapore economy has continued to expand, on average, over the last two quarters. However, growth was volatile and uneven across sectors. As the upswing of the global IT cycle gained momentum in late 2016, the trade-related sectors turned up in tandem and helped to anchor overall GDP growth. Meanwhile, activity in the sentiment-sensitive segments of financial services was strong, which buoyed the modern services cluster in Q4, but this waned in early 2017. In the domestic-oriented industries, public construction was resilient, but weaker consumer spending weighed on sectors such as retail and food services. Some unevenness was also observed in corporate sector profitability. While MNCs and some listed SMEs have seen an uplift, other firms have lagged the recovery.
GDP has strengthened since the last Review, but growth has been volatile and uneven.
Alongside the improvement in the external environment, domestic economic activity picked up over the last two quarters, with average sequential growth coming in at 5.2%, compared to a muted 0.2% in the preceding half-year. (Chart 2.1) In level terms, activity in Q4 2016 – Q1 2017 was 2.6% higher than that recorded in the previous six months. However, volatility also increased—GDP grew robustly by 12.3% q-o-q SAAR in Q4, before contracting by 1.9% in Q1 2017, according to the latest Advance Estimates. Notwithstanding stronger headline growth, sectoral outcomes varied. Activity in the trade-related sectors was bolstered by the upswing in the global IT cycle, and modern services benefited from the rally in financial markets towards the end of 2016. (Chart 2.2) However, growth of the domestic-oriented cluster came in relatively weaker, as it had to contend with a sluggish domestic real estate sector and lacklustre consumer sentiment.
The year-end improvement was mainly underpinned by the trade-related segments.
The trade-related cluster witnessed a significant turnaround in Q4 2016, underpinned by a rebound in manufacturing. On the whole, growth in the manufacturing sector surged by 39.8% q-o-q SAAR, driven by a step-up in electronics and biomedical output. A resurgence in global chip demand on the back of inventory restocking, and the completion of maintenance work, boosted production in the semiconductor and biomedical clusters, respectively.
Chart 2.1 Singapore’s Real GDP Growth
* Advance Estimates.
Chart 2.2
Economic Activity Index
Source: EPG, MAS estimates Note: Readings for Domestic-oriented and Modern Services are based on an average of Jan–Feb data.
2014 Q3 2015 Q3 2016 Q3 2017 Q1*-6
-3
0
3
6
9
12
15
Per C
ent
QOQ SAAR
YOY
96
98
100
102
104
106
2014 2015 2016 2017Q1
Inde
x (2
014=
100)
, SA
Modern Services
Trade-related
Domestic-oriented
Overall

20 Macroeconomic Review, April 2017
Monetary Authority of Singapore Economic Policy Group
Firmer manufacturing activity, in turn, had positive spillovers on trade-related services. Air and sea cargo handled were 2.8% and 6.1% q-o-q SA higher than Q3, respectively. The recovery in sea cargo volumes was also attributable to a sharp increase in the bulk cargo oil handled. In Q1 however, there was a moderation in manufacturing activity as the volatile biomedical cluster experienced a sharp decline after registering a particularly strong performance in the quarter before. (Chart 2.3) Abstracting from this, industrial production continued to expand, albeit at a slower pace. The electronics cluster lost some momentum, with growth slowing to 5.2% q-o-q SA from 13.5% in Q4, likely due to temporary plant shutdowns as companies chose to take advantage of the Chinese New Year holiday to carry out maintenance work. For similar reasons, electronics production in regional countries, such as Taiwan and Malaysia, also registered a downshift in early Q1. Nonetheless, the level of Singapore’s electronics output remained elevated and was still 33% higher compared to the corresponding period a year ago. The moderation in industrial production, in turn, dampened activity in the transport & storage industry. In Q1 2017, the volume of air cargo handled contracted by 0.3% q-o-q SA, while the growth of sea cargo eased to 0.1%.
Following robust growth in Q4 2016, modern services lost momentum early this year …
The sharp shift in outturn of the modern services cluster largely reflected the volatile performance of the financial services sector, which recorded growth of 36.5% q-o-q SAAR in Q4 2016, compared with a marginal 0.7% in the preceding quarter. In particular, the fund management industry benefited from its year-end recognition of performance-based fees, which caused a significant rise in net fees and commissions. The rally in the global financial markets also helped buttress sentiment-sensitive activities, such as securities dealings and forex trading. Meanwhile, domestic non-bank lending grew modestly, supported by a recovery in business lending to companies in the trade-related segments, in line with the pickup in trade. (Chart 2.4)
Chart 2.3 Industrial Production
Chart 2.4 DBU Non-bank Lending
2015 Q2 Q3 Q4 2016 Q2 Q3 Q4 2017-5
0
5
10
15
% P
oint
Con
trib
utio
n to
QO
Q S
A G
row
th
Electronics ChemicalsBiomedical Precision EngineeringTransport Engineering General Mfg Industries
Q1
2014 Q3 2015 Q3 2016 Q3 2017-2
-1
0
1
2
3
% P
oint
Con
trib
utio
n to
QO
Q G
row
th
Business Consumer
Jan–Feb
The Singapore Economy 21
Monetary Authority of Singapore Economic Policy Group
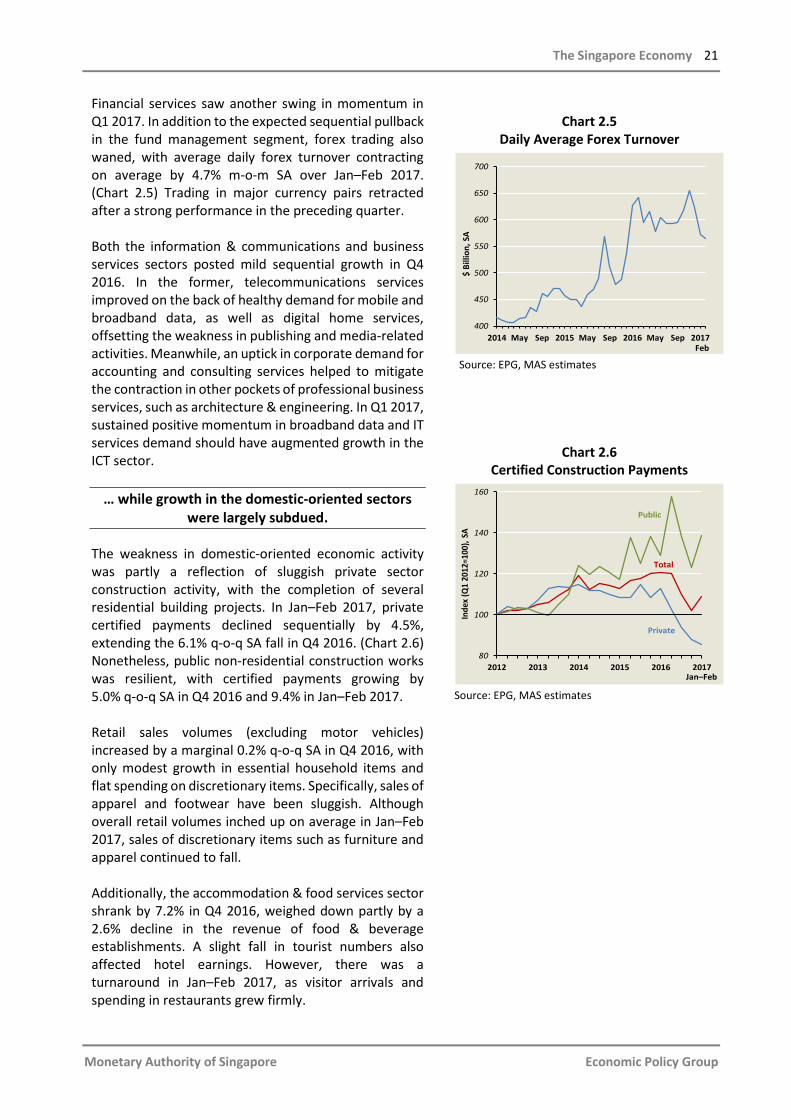
Financial services saw another swing in momentum in Q1 2017. In addition to the expected sequential pullback in the fund management segment, forex trading also waned, with average daily forex turnover contracting on average by 4.7% m-o-m SA over Jan–Feb 2017. (Chart 2.5) Trading in major currency pairs retracted after a strong performance in the preceding quarter. Both the information & communications and business services sectors posted mild sequential growth in Q4 2016. In the former, telecommunications services improved on the back of healthy demand for mobile and broadband data, as well as digital home services, offsetting the weakness in publishing and media-related activities. Meanwhile, an uptick in corporate demand for accounting and consulting services helped to mitigate the contraction in other pockets of professional business services, such as architecture & engineering. In Q1 2017, sustained positive momentum in broadband data and IT services demand should have augmented growth in the ICT sector.
… while growth in the domestic-oriented sectors were largely subdued.
The weakness in domestic-oriented economic activity was partly a reflection of sluggish private sector construction activity, with the completion of several residential building projects. In Jan–Feb 2017, private certified payments declined sequentially by 4.5%, extending the 6.1% q-o-q SA fall in Q4 2016. (Chart 2.6) Nonetheless, public non-residential construction works was resilient, with certified payments growing by 5.0% q-o-q SA in Q4 2016 and 9.4% in Jan–Feb 2017. Retail sales volumes (excluding motor vehicles) increased by a marginal 0.2% q-o-q SA in Q4 2016, with only modest growth in essential household items and flat spending on discretionary items. Specifically, sales of apparel and footwear have been sluggish. Although overall retail volumes inched up on average in Jan–Feb 2017, sales of discretionary items such as furniture and apparel continued to fall. Additionally, the accommodation & food services sector shrank by 7.2% in Q4 2016, weighed down partly by a 2.6% decline in the revenue of food & beverage establishments. A slight fall in tourist numbers also affected hotel earnings. However, there was a turnaround in Jan–Feb 2017, as visitor arrivals and spending in restaurants grew firmly.
Chart 2.5
Daily Average Forex Turnover
Source: EPG, MAS estimates
Chart 2.6 Certified Construction Payments
Source: EPG, MAS estimates
400
450
500
550
600
650
700
2014 May Sep 2015 May Sep 2016 May Sep 2017
$ Bi
llion
, SA
Feb
80
100
120
140
160
2012 2013 2014 2015 2016 2017
Inde
x (Q
1 20
12=1
00),
SA
Jan–Feb
Public
Private
Total
22 Macroeconomic Review, April 2017
Monetary Authority of Singapore Economic Policy Group
The unevenness in growth was reflected in the corporate sector as well.
From the corporate perspective, strong GDP growth in the latter half of 2016 was supported by a small number of large enterprises. This reflected the corporate structure of the Singapore economy, where slightly over 0.5% of firms account for 35% of total employment and 53% of nominal VA. The remaining 99% of firms are small and medium enterprises (SMEs) that hire close to two-thirds of all workers, but account for only 47% of total nominal VA in the economy.1 The performance of large enterprises and SMEs has differed recently. While the large enterprises saw signs of a recovery in the latter half of 2016, most SMEs did not seem to have experienced an uplift, consistent with the still-guarded outlook expressed in recent surveys.
Revenues of global MNCs increased in the latter half of 2016.
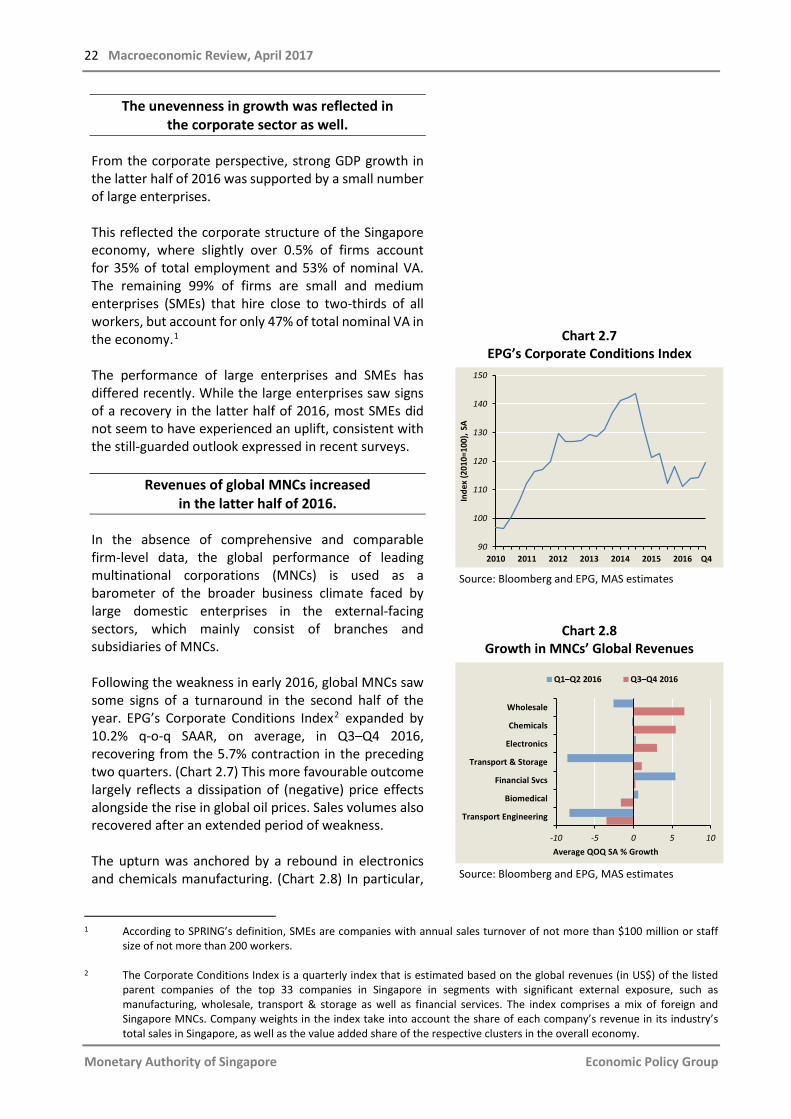
In the absence of comprehensive and comparable firm-level data, the global performance of leading multinational corporations (MNCs) is used as a barometer of the broader business climate faced by large domestic enterprises in the external-facing sectors, which mainly consist of branches and subsidiaries of MNCs. Following the weakness in early 2016, global MNCs saw some signs of a turnaround in the second half of the year. EPG’s Corporate Conditions Index2 expanded by 10.2% q-o-q SAAR, on average, in Q3–Q4 2016, recovering from the 5.7% contraction in the preceding two quarters. (Chart 2.7) This more favourable outcome largely reflects a dissipation of (negative) price effects alongside the rise in global oil prices. Sales volumes also recovered after an extended period of weakness. The upturn was anchored by a rebound in electronics and chemicals manufacturing. (Chart 2.8) In particular,
Chart 2.7 EPG’s Corporate Conditions Index
Source: Bloomberg and EPG, MAS estimates
Chart 2.8 Growth in MNCs’ Global Revenues
Source: Bloomberg and EPG, MAS estimates
1 According to SPRING’s definition, SMEs are companies with annual sales turnover of not more than $100 million or staff
size of not more than 200 workers. 2 The Corporate Conditions Index is a quarterly index that is estimated based on the global revenues (in US$) of the listed
parent companies of the top 33 companies in Singapore in segments with significant external exposure, such as manufacturing, wholesale, transport & storage as well as financial services. The index comprises a mix of foreign and Singapore MNCs. Company weights in the index take into account the share of each company’s revenue in its industry’s total sales in Singapore, as well as the value added share of the respective clusters in the overall economy.
2010 2011 2012 2013 2014 2015 201690
100
110
120
130
140
150
Inde
x (2
010=
100)
, SA
Q4
Wholesale
Chemicals
Electronics
Transport & Storage
Financial Svcs
Biomedical
Transport Engineering
-10 -5 0 5 10Average QOQ SA % Growth
Q1–Q2 2016 Q3–Q4 2016
The Singapore Economy 23
Monetary Authority of Singapore Economic Policy Group
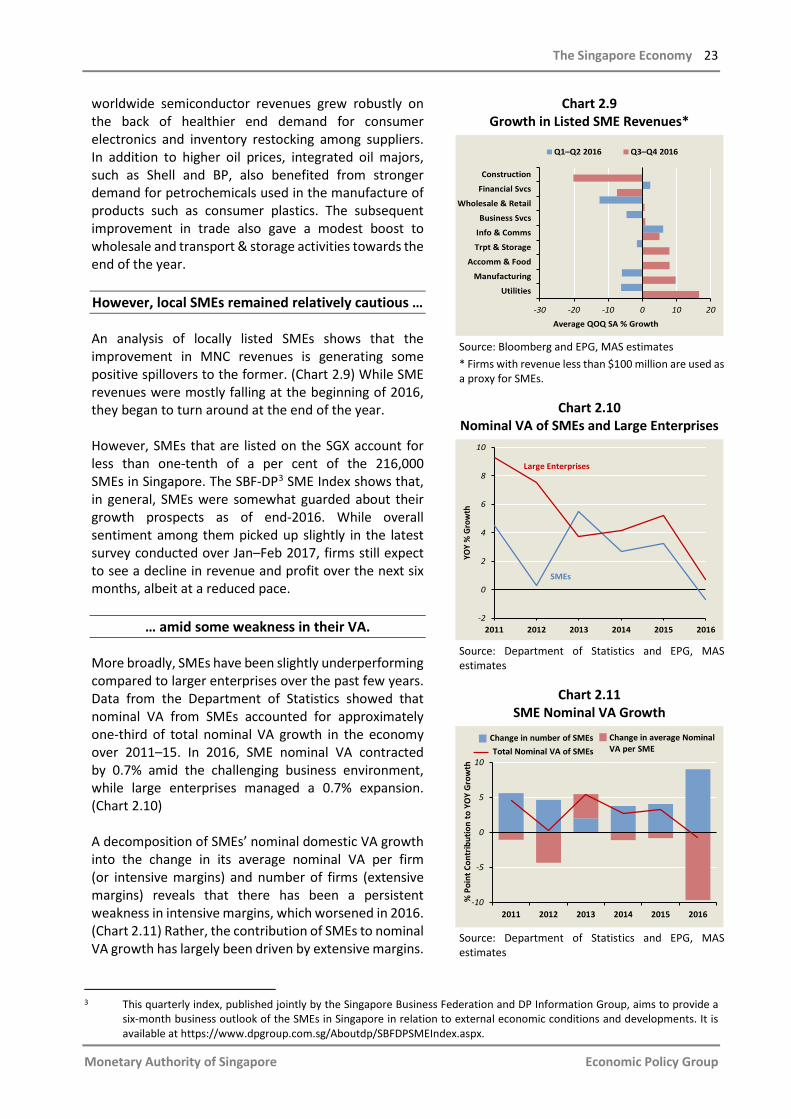
worldwide semiconductor revenues grew robustly on the back of healthier end demand for consumer electronics and inventory restocking among suppliers. In addition to higher oil prices, integrated oil majors, such as Shell and BP, also benefited from stronger demand for petrochemicals used in the manufacture of products such as consumer plastics. The subsequent improvement in trade also gave a modest boost to wholesale and transport & storage activities towards the end of the year. However, local SMEs remained relatively cautious …
An analysis of locally listed SMEs shows that the improvement in MNC revenues is generating some positive spillovers to the former. (Chart 2.9) While SME revenues were mostly falling at the beginning of 2016, they began to turn around at the end of the year. However, SMEs that are listed on the SGX account for less than one-tenth of a per cent of the 216,000 SMEs in Singapore. The SBF-DP3 SME Index shows that, in general, SMEs were somewhat guarded about their growth prospects as of end-2016. While overall sentiment among them picked up slightly in the latest survey conducted over Jan–Feb 2017, firms still expect to see a decline in revenue and profit over the next six months, albeit at a reduced pace.
… amid some weakness in their VA.
More broadly, SMEs have been slightly underperforming compared to larger enterprises over the past few years. Data from the Department of Statistics showed that nominal VA from SMEs accounted for approximately one-third of total nominal VA growth in the economy over 2011–15. In 2016, SME nominal VA contracted by 0.7% amid the challenging business environment, while large enterprises managed a 0.7% expansion. (Chart 2.10) A decomposition of SMEs’ nominal domestic VA growth into the change in its average nominal VA per firm (or intensive margins) and number of firms (extensive margins) reveals that there has been a persistent weakness in intensive margins, which worsened in 2016. (Chart 2.11) Rather, the contribution of SMEs to nominal VA growth has largely been driven by extensive margins.
Chart 2.9 Growth in Listed SME Revenues*
Source: Bloomberg and EPG, MAS estimates * Firms with revenue less than $100 million are used as a proxy for SMEs.
Chart 2.10
Nominal VA of SMEs and Large Enterprises
Source: Department of Statistics and EPG, MAS estimates
Chart 2.11
SME Nominal VA Growth
Source: Department of Statistics and EPG, MAS estimates
3 This quarterly index, published jointly by the Singapore Business Federation and DP Information Group, aims to provide a
six-month business outlook of the SMEs in Singapore in relation to external economic conditions and developments. It is available at https://www.dpgroup.com.sg/Aboutdp/SBFDPSMEIndex.aspx.
Construction
Financial Svcs
Wholesale & Retail
Business Svcs
Info & Comms
Trpt & Storage
Accomm & Food
Manufacturing
Utilities
-30 -20 -10 0 10 20
Average QOQ SA % Growth
Q1–Q2 2016 Q3–Q4 2016
2011 2012 2013 2014 2015 2016-2
0
2
4
6
8
10
YOY
% G
row
th
SMEs
Large Enterprises
2011 2012 2013 2014 2015 2016-10
-5
0
5
10
% P
oint
Con
trib
utio
n to
YO
Y G
row
th
Change in average NominalVA per SME
Change in number of SMEsTotal Nominal VA of SMEs
24 Macroeconomic Review, April 2017
Monetary Authority of Singapore Economic Policy Group
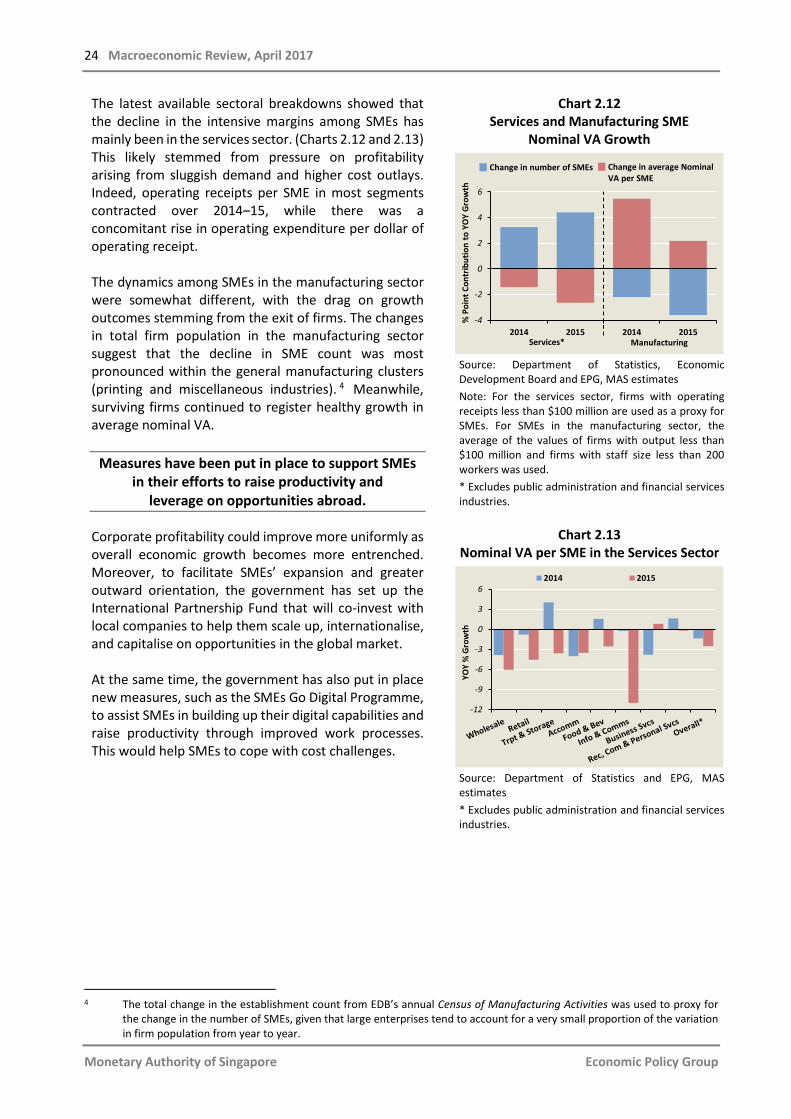
The latest available sectoral breakdowns showed that the decline in the intensive margins among SMEs has mainly been in the services sector. (Charts 2.12 and 2.13) This likely stemmed from pressure on profitability arising from sluggish demand and higher cost outlays. Indeed, operating receipts per SME in most segments contracted over 2014–15, while there was a concomitant rise in operating expenditure per dollar of operating receipt. The dynamics among SMEs in the manufacturing sector were somewhat different, with the drag on growth outcomes stemming from the exit of firms. The changes in total firm population in the manufacturing sector suggest that the decline in SME count was most pronounced within the general manufacturing clusters (printing and miscellaneous industries). 4 Meanwhile, surviving firms continued to register healthy growth in average nominal VA.
Measures have been put in place to support SMEs in their efforts to raise productivity and
leverage on opportunities abroad.
Corporate profitability could improve more uniformly as overall economic growth becomes more entrenched. Moreover, to facilitate SMEs’ expansion and greater outward orientation, the government has set up the International Partnership Fund that will co-invest with local companies to help them scale up, internationalise, and capitalise on opportunities in the global market. At the same time, the government has also put in place new measures, such as the SMEs Go Digital Programme, to assist SMEs in building up their digital capabilities and raise productivity through improved work processes. This would help SMEs to cope with cost challenges.
Chart 2.12 Services and Manufacturing SME
Nominal VA Growth
Source: Department of Statistics, Economic Development Board and EPG, MAS estimates Note: For the services sector, firms with operating receipts less than $100 million are used as a proxy for SMEs. For SMEs in the manufacturing sector, the average of the values of firms with output less than $100 million and firms with staff size less than 200 workers was used. * Excludes public administration and financial services industries.
Chart 2.13 Nominal VA per SME in the Services Sector
Source: Department of Statistics and EPG, MAS estimates * Excludes public administration and financial services industries.
4 The total change in the establishment count from EDB’s annual Census of Manufacturing Activities was used to proxy for
the change in the number of SMEs, given that large enterprises tend to account for a very small proportion of the variation in firm population from year to year.
2014 2015 2014 2015-4
-2
0
2
4
6
% P
oint
Con
trib
utio
n to
YO
Y G
row
th
Services* Manufacturing
Change in average NominalVA per SME
Change in number of SMEs
-12
-9
-6
-3
0
3
6
YOY
% G
row
th
2014 2015
The Singapore Economy 25
Monetary Authority of Singapore Economic Policy Group
2.2 Economic Outlook
Firming External Demand To Provide Cyclical Support
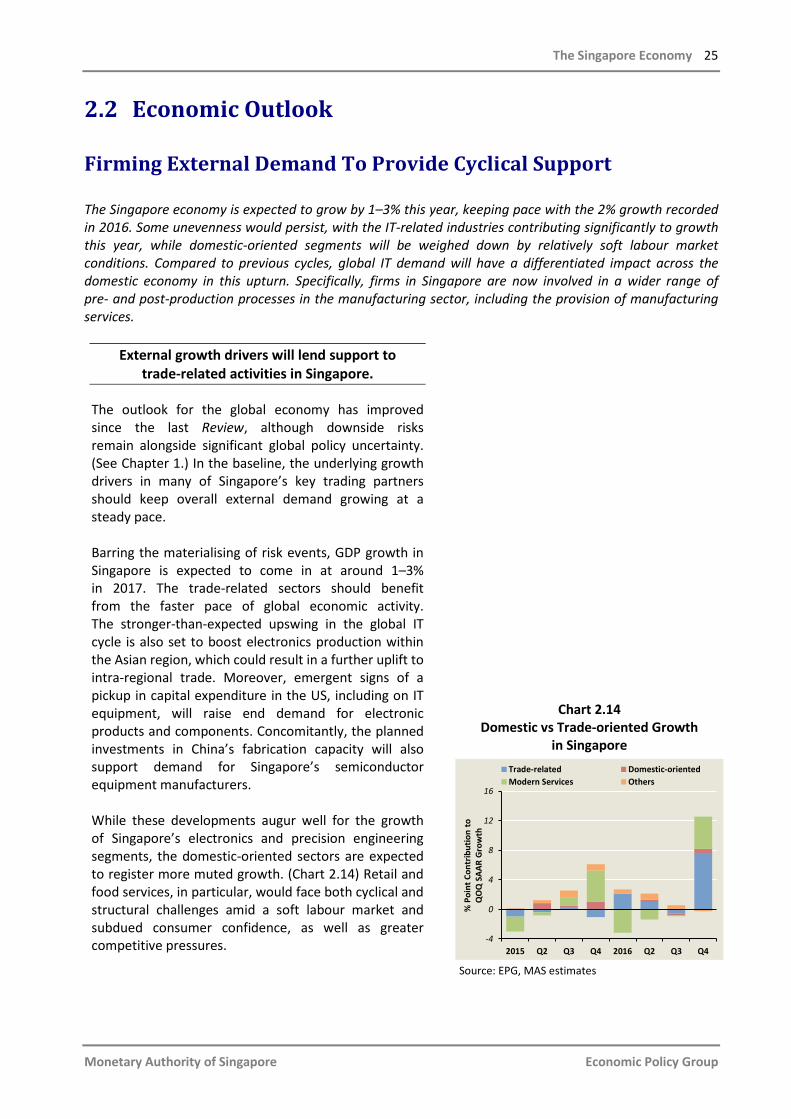
The Singapore economy is expected to grow by 1–3% this year, keeping pace with the 2% growth recorded in 2016. Some unevenness would persist, with the IT-related industries contributing significantly to growth this year, while domestic-oriented segments will be weighed down by relatively soft labour market conditions. Compared to previous cycles, global IT demand will have a differentiated impact across the domestic economy in this upturn. Specifically, firms in Singapore are now involved in a wider range of pre- and post-production processes in the manufacturing sector, including the provision of manufacturing services.
External growth drivers will lend support to trade-related activities in Singapore.
The outlook for the global economy has improved since the last Review, although downside risks remain alongside significant global policy uncertainty. (See Chapter 1.) In the baseline, the underlying growth drivers in many of Singapore’s key trading partners should keep overall external demand growing at a steady pace. Barring the materialising of risk events, GDP growth in Singapore is expected to come in at around 1–3% in 2017. The trade-related sectors should benefit from the faster pace of global economic activity. The stronger-than-expected upswing in the global IT cycle is also set to boost electronics production within the Asian region, which could result in a further uplift to intra-regional trade. Moreover, emergent signs of a pickup in capital expenditure in the US, including on IT equipment, will raise end demand for electronic products and components. Concomitantly, the planned investments in China’s fabrication capacity will also support demand for Singapore’s semiconductor equipment manufacturers. While these developments augur well for the growth of Singapore’s electronics and precision engineering segments, the domestic-oriented sectors are expected to register more muted growth. (Chart 2.14) Retail and food services, in particular, would face both cyclical and structural challenges amid a soft labour market and subdued consumer confidence, as well as greater competitive pressures.
Chart 2.14 Domestic vs Trade-oriented Growth
in Singapore
Source: EPG, MAS estimates
2015 Q2 Q3 Q4 2016 Q2 Q3 Q4-4
0
4
8
12
16
% P
oint
Con
trib
utio
n to
Q
OQ
SAA
R G
row
th
Trade-related Domestic-orientedModern Services Others
26 Macroeconomic Review, April 2017
Monetary Authority of Singapore Economic Policy Group
Manufacturing is finally gaining momentum on the back of a strong IT up-cycle.
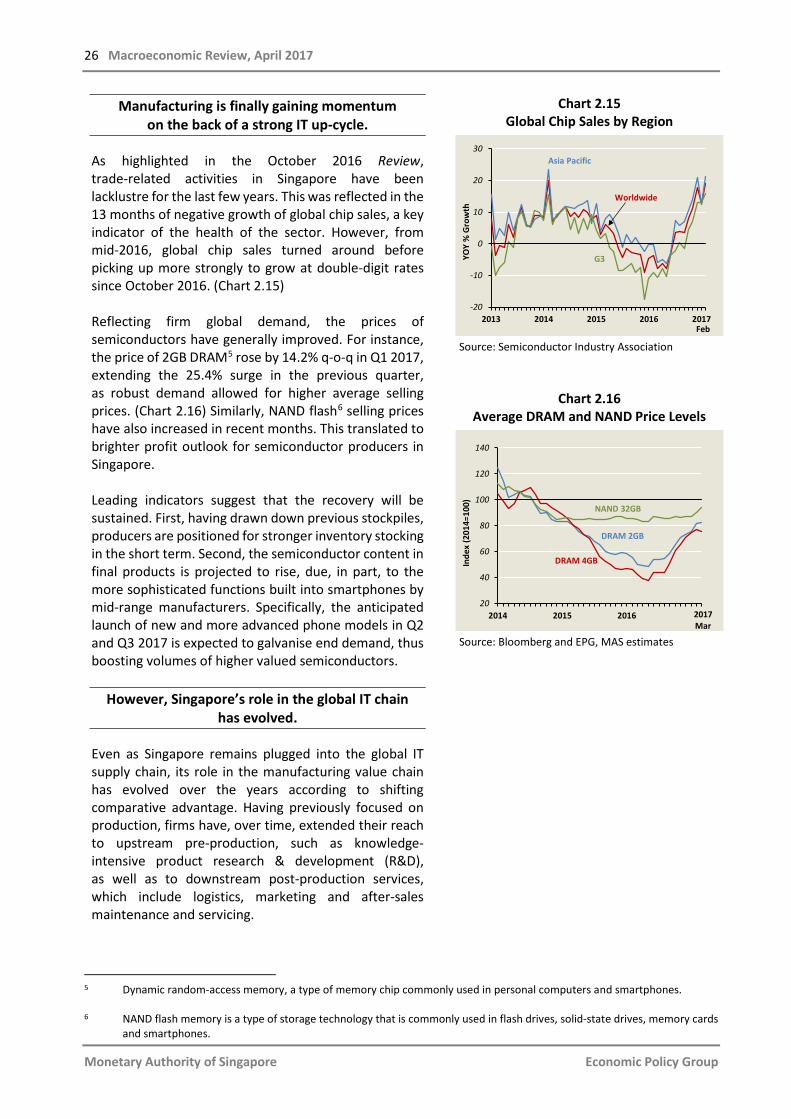
As highlighted in the October 2016 Review, trade-related activities in Singapore have been lacklustre for the last few years. This was reflected in the 13 months of negative growth of global chip sales, a key indicator of the health of the sector. However, from mid-2016, global chip sales turned around before picking up more strongly to grow at double-digit rates since October 2016. (Chart 2.15) Reflecting firm global demand, the prices of semiconductors have generally improved. For instance, the price of 2GB DRAM5 rose by 14.2% q-o-q in Q1 2017, extending the 25.4% surge in the previous quarter, as robust demand allowed for higher average selling prices. (Chart 2.16) Similarly, NAND flash6 selling prices have also increased in recent months. This translated to brighter profit outlook for semiconductor producers in Singapore. Leading indicators suggest that the recovery will be sustained. First, having drawn down previous stockpiles, producers are positioned for stronger inventory stocking in the short term. Second, the semiconductor content in final products is projected to rise, due, in part, to the more sophisticated functions built into smartphones by mid-range manufacturers. Specifically, the anticipated launch of new and more advanced phone models in Q2 and Q3 2017 is expected to galvanise end demand, thus boosting volumes of higher valued semiconductors.
However, Singapore’s role in the global IT chain has evolved.
Even as Singapore remains plugged into the global IT supply chain, its role in the manufacturing value chain has evolved over the years according to shifting comparative advantage. Having previously focused on production, firms have, over time, extended their reach to upstream pre-production, such as knowledge-intensive product research & development (R&D), as well as to downstream post-production services, which include logistics, marketing and after-sales maintenance and servicing.
Chart 2.15 Global Chip Sales by Region
Source: Semiconductor Industry Association
Chart 2.16 Average DRAM and NAND Price Levels
Source: Bloomberg and EPG, MAS estimates
5 Dynamic random-access memory, a type of memory chip commonly used in personal computers and smartphones. 6 NAND flash memory is a type of storage technology that is commonly used in flash drives, solid-state drives, memory cards
and smartphones.
-20
-10
0
10
20
30
2013 2014 2015 2016 2017
YOY
% G
row
th
Feb
Worldwide
Asia Pacific
G3
20
40
60
80
100
120
140
2014 2015 2016
Inde
x (2
014=
100)
2017Mar
DRAM 2GB
DRAM 4GB
NAND 32GB
The Singapore Economy 27
Monetary Authority of Singapore Economic Policy Group
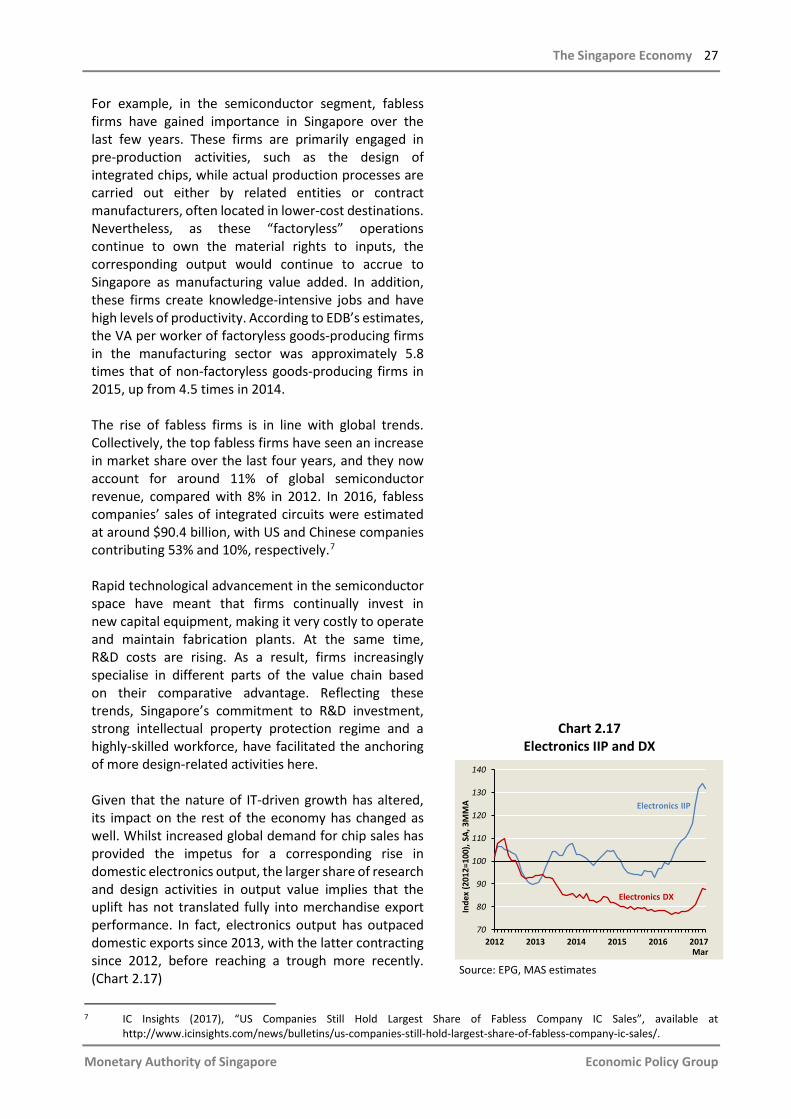
For example, in the semiconductor segment, fabless firms have gained importance in Singapore over the last few years. These firms are primarily engaged in pre-production activities, such as the design of integrated chips, while actual production processes are carried out either by related entities or contract manufacturers, often located in lower-cost destinations. Nevertheless, as these “factoryless” operations continue to own the material rights to inputs, the corresponding output would continue to accrue to Singapore as manufacturing value added. In addition, these firms create knowledge-intensive jobs and have high levels of productivity. According to EDB’s estimates, the VA per worker of factoryless goods-producing firms in the manufacturing sector was approximately 5.8 times that of non-factoryless goods-producing firms in 2015, up from 4.5 times in 2014. The rise of fabless firms is in line with global trends. Collectively, the top fabless firms have seen an increase in market share over the last four years, and they now account for around 11% of global semiconductor revenue, compared with 8% in 2012. In 2016, fabless companies’ sales of integrated circuits were estimated at around $90.4 billion, with US and Chinese companies contributing 53% and 10%, respectively.7 Rapid technological advancement in the semiconductor space have meant that firms continually invest in new capital equipment, making it very costly to operate and maintain fabrication plants. At the same time, R&D costs are rising. As a result, firms increasingly specialise in different parts of the value chain based on their comparative advantage. Reflecting these trends, Singapore’s commitment to R&D investment, strong intellectual property protection regime and a highly-skilled workforce, have facilitated the anchoring of more design-related activities here. Given that the nature of IT-driven growth has altered, its impact on the rest of the economy has changed as well. Whilst increased global demand for chip sales has provided the impetus for a corresponding rise in domestic electronics output, the larger share of research and design activities in output value implies that the uplift has not translated fully into merchandise export performance. In fact, electronics output has outpaced domestic exports since 2013, with the latter contracting since 2012, before reaching a trough more recently. (Chart 2.17)
Chart 2.17 Electronics IIP and DX
Source: EPG, MAS estimates
7 IC Insights (2017), “US Companies Still Hold Largest Share of Fabless Company IC Sales”, available at
http://www.icinsights.com/news/bulletins/us-companies-still-hold-largest-share-of-fabless-company-ic-sales/.
70
80
90
100
110
120
130
140
2012 2013 2014 2015 2016 2017
Inde
x (2
012=
100)
, SA,
3M
MA
Mar
Electronics IIP
Electronics DX

28 Macroeconomic Review, April 2017
Monetary Authority of Singapore Economic Policy Group
The composition of Singapore’s exports has always been dynamic.
One way to measure the extent to which the composition of a country’s export basket has changed structurally is to calculate the rank correlation of the basket between two time periods. A low correlation means there is little overlap of products across the two periods.8 Chart 2.18 shows the rank correlation of Singapore’s export basket between 2005 and 2014, compared to selected countries. At 0.23, this is lower than the global average, of 0.29, as well as that of countries such as the US, China and Switzerland, implying that its export product mix has changed more substantially. The frequent changes in export product rankings have also been accompanied by shifts in firm rankings. Based on data from the DP Singapore 1000 database, out of the top 20 manufacturing firms in operation a decade ago, just over half remained in the top 20 list in 2014. Most of the firms that fell out of the top 20 rankings now operate on a smaller scale, although a few firms have since ceased operations. In comparison, the rankings of firms at the global level have been more stable. The constant churn in exports and firms reflects, to some extent, the dynamism of the domestic economy. As a small open economy, Singapore has had to constantly re-invent itself amid unrelenting changes in global demand and shifting comparative advantages, in its drive to attract quality investment and create new business opportunities. Indeed, from 2005 to 2016, EDB secured over $154 billion worth of investment commitments, a large proportion of which was from firms operating at the frontier of their industries.
Structural trends will continue to drive financial and ICT services.
After a subdued outturn in 2016, activity in selected areas of the financial services sector is projected to pick up. Banking intermediation should see some improvement alongside the gradual rise in domestic economic activity. In addition, pockets of insurance services catering to the incremental needs of an ageing
Chart 2.18 Rank Correlations of the Top 20 Exports
between 2005 and 2014 for Selected Countries
Source: UN Comtrade and EPG, MAS estimates
8 See Daruich, D, Easterly, W and Reshef, A (2016), “The Surprising Instability of Export Specializations”, NBER Working Paper
No. 22869. The authors used the rank correlation measure to characterise the instability of hyper-specialisation of exports over time. In a sample of 127 countries, they found that the average country rank correlation for the top 20 goods exports between 1998 and 2010 was 0.27, indicating that high churn in the export basket is pervasive.
-0.2
0.0
0.2
0.4
0.6
0.8
1.0
Corr
elat
ion
AdvancedEconomies
Small, Open Economies
Global Average = 0.29
RegionalEconomies
The Singapore Economy 29
Monetary Authority of Singapore Economic Policy Group
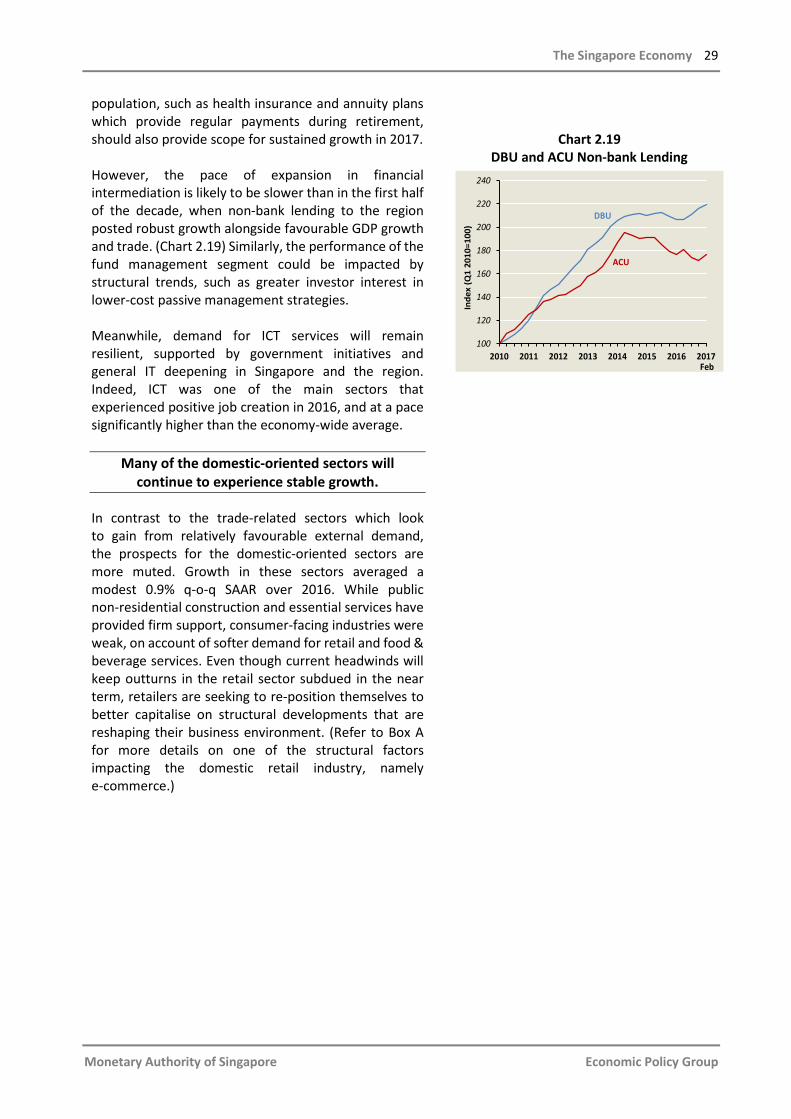
population, such as health insurance and annuity plans which provide regular payments during retirement, should also provide scope for sustained growth in 2017. However, the pace of expansion in financial intermediation is likely to be slower than in the first half of the decade, when non-bank lending to the region posted robust growth alongside favourable GDP growth and trade. (Chart 2.19) Similarly, the performance of the fund management segment could be impacted by structural trends, such as greater investor interest in lower-cost passive management strategies. Meanwhile, demand for ICT services will remain resilient, supported by government initiatives and general IT deepening in Singapore and the region. Indeed, ICT was one of the main sectors that experienced positive job creation in 2016, and at a pace significantly higher than the economy-wide average.
Many of the domestic-oriented sectors will continue to experience stable growth.
In contrast to the trade-related sectors which look to gain from relatively favourable external demand, the prospects for the domestic-oriented sectors are more muted. Growth in these sectors averaged a modest 0.9% q-o-q SAAR over 2016. While public non-residential construction and essential services have provided firm support, consumer-facing industries were weak, on account of softer demand for retail and food & beverage services. Even though current headwinds will keep outturns in the retail sector subdued in the near term, retailers are seeking to re-position themselves to better capitalise on structural developments that are reshaping their business environment. (Refer to Box A for more details on one of the structural factors impacting the domestic retail industry, namely e-commerce.)
Chart 2.19 DBU and ACU Non-bank Lending
100
120
140
160
180
200
220
240
2010 2011 2012 2013 2014 2015 2016 2017
Inde
x (Q
1 20
10=1
00)
Feb
DBU
ACU

30 Macroeconomic Review, April 2017
Monetary Authority of Singapore Economic Policy Group
Box A
The Opportunities For E-commerce In The Retail Sector Introduction Singapore’s retail sector has had to adapt to evolving domestic and global consumer demand and other structural trends over the years. In this Box, the implications of the rise of e-commerce will be examined. While e-commerce has provided an access point for retailers abroad to tap the Singapore market, it has also opened up opportunities for local retailers to take advantage of the new and growing sources of consumption, including from the region. Rising Prevalence of E-commerce Spending online in Singapore has increased strongly in recent years, with an increasing number of e-commerce sites offering consumers greater variety and convenience. Credit and debit card statistics collected by MAS were used to estimate the growth in internet shopping. In particular, the value of “card not present” (CNP) transactions1/ is used as a proxy for online shopping, and this has grown by an average of 20.2% annually in 2012–16. The increasing popularity of e-commerce could have had some negative shift-share effect on local retail sales. Table A1 shows the top e-commerce websites in Singapore, based on their share of domestic traffic to shopping-related websites, together with those owned by companies headquartered overseas, which are shaded in orange. Many of these latter e-commerce sites are from the US and China, which have expanded aggressively.
Table A1 Top E-commerce Sites in Singapore
Website Share of
Traffic (%) Company HQ qoo10.sg 8.6 SG amazon.com 8.2 US taobao.com 4.7 CN lazada.sg 4.5 SG carousell.com 3.8 SG ebay.com 2.9 US aliexpress.com 2.1 CN tmall.com 2.0 CN zalora.sg 1.2 SG alibaba.com 1.1 CN asos.com 0.7 UK redmart.com 0.6 SG
Source: SimilarWeb Rankings, December 2016 ____________________________________________________________________
1/ Transactions which do not require the physical presence of a card. For example, card details could be provided in writing (e.g., through mail transactions) or via electronic means (e.g., through the Internet).

The Singapore Economy 31
Monetary Authority of Singapore Economic Policy Group
Leveraging on Growth Drivers These developments suggest that local retailers should look beyond the domestic market and traditional brick and mortar distribution channels for the next phase of their expansion. With greater internet penetration across the region, traditional brick and mortar retailers can unlock new income streams by utilising e-commerce channels. In fact, there are indications that domestic retailers have already made forays into the e-commerce space. For example, from 2013 to 2015, the domestic retail sector spent more on professional services and outsourcing (work given out), while their expenditures on remuneration and rentals recorded slower growth. (Chart A1) The increase in the former type of expenses could in part reflect retailers’ efforts to develop their e-commerce platforms, while the latter could be the consequence of a reduced reliance on brick and mortar channels that require more labour and physical space. A scan of local brick and mortar retailers that have gained increasing web presence shows that these cover a wide range of retail goods such as furniture, household appliances, and supermarket products.
Chart A1 Contribution to Operating Expenditure Growth in the Retail Sector
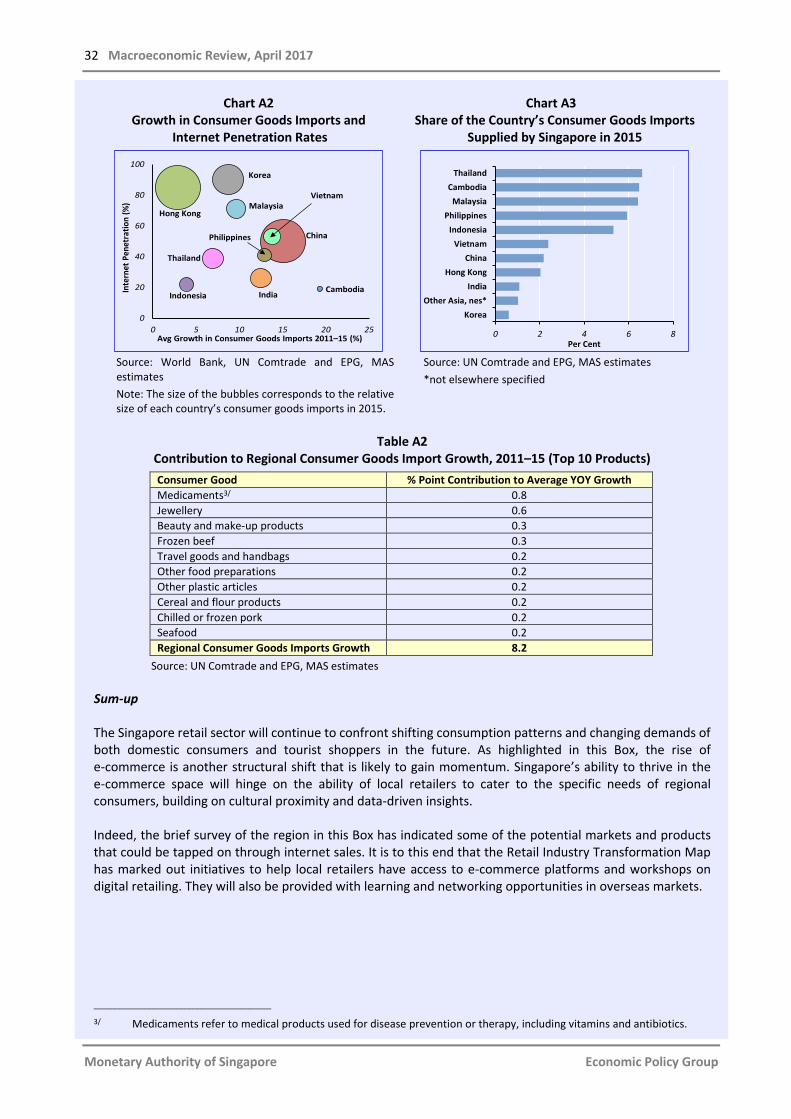
Singapore is well-positioned to leverage on the growing e-commerce trend, given its sophisticated logistics and ICT infrastructure. Table A1 above also shows that among the top five online shopping sites in Singapore, three are based locally, affirming the ability of local setups to attract internet shoppers. Moreover, based on a Forrester Research study, around 60% of Singapore’s e-commerce sales are attributed to cross-border and international orders, significantly higher than for other countries in the region.2/ Notwithstanding the inroads made thus far, there remains ample scope for local retailers to capture the wider regional market, some of which have made significant strides in improving technological access. For example, countries such as China and Vietnam, which have internet penetration rates of more than 50%, are relatively large and fast growing markets for consumer goods. (Chart A2) Singapore’s market share in these countries is currently low, suggesting room for further growth. (Chart A3) Table A2 also lists the top 10 products contributing the most to the growth of regional consumer goods imports over 2011–15. Fuelled by the growing middle class, there is strong demand for non-essential goods, such as fashion accessories, medical supplements, and beauty products, many of which are already commonly transacted online. ___________________________________________________________________
2/ Singapore Post Limited (2014), “Ecommerce in Singapore: 9 Must Knows”, available at http://www.singpost.com/sites/default/files/knowledge_centre_files/2015/10/141211_fs_singapore_factsheet.pdf.
-0.2
0.0
0.2
0.4
0.6
0.8
1.0
% P
oint
Con
trib
utio
n to
YOY
Gro
wth
2014 2015
32 Macroeconomic Review, April 2017
Monetary Authority of Singapore Economic Policy Group
Chart A2 Growth in Consumer Goods Imports and
Internet Penetration Rates
Chart A3 Share of the Country’s Consumer Goods Imports
Supplied by Singapore in 2015
Source: World Bank, UN Comtrade and EPG, MAS estimates Note: The size of the bubbles corresponds to the relative size of each country’s consumer goods imports in 2015.
Source: UN Comtrade and EPG, MAS estimates *not elsewhere specified
Table A2
Contribution to Regional Consumer Goods Import Growth, 2011–15 (Top 10 Products)
Consumer Good % Point Contribution to Average YOY Growth Medicaments3/ 0.8 Jewellery 0.6 Beauty and make-up products 0.3 Frozen beef 0.3 Travel goods and handbags 0.2 Other food preparations 0.2 Other plastic articles 0.2 Cereal and flour products 0.2 Chilled or frozen pork 0.2 Seafood 0.2 Regional Consumer Goods Imports Growth 8.2
Source: UN Comtrade and EPG, MAS estimates Sum-up The Singapore retail sector will continue to confront shifting consumption patterns and changing demands of both domestic consumers and tourist shoppers in the future. As highlighted in this Box, the rise of e-commerce is another structural shift that is likely to gain momentum. Singapore’s ability to thrive in the e-commerce space will hinge on the ability of local retailers to cater to the specific needs of regional consumers, building on cultural proximity and data-driven insights. Indeed, the brief survey of the region in this Box has indicated some of the potential markets and products that could be tapped on through internet sales. It is to this end that the Retail Industry Transformation Map has marked out initiatives to help local retailers have access to e-commerce platforms and workshops on digital retailing. They will also be provided with learning and networking opportunities in overseas markets. ___________________________________________________________________
3/ Medicaments refer to medical products used for disease prevention or therapy, including vitamins and antibiotics.
0
20
40
60
80
100
0 5 10 15 20 25
Inte
rnet
Pen
etra
tion
(%)
Avg Growth in Consumer Goods Imports 2011–15 (%)
China
Cambodia
Hong Kong
IndiaIndonesia
Korea
Malaysia
Thailand
Philippines
Vietnam
0 2 4 6 8
KoreaOther Asia, nes*
IndiaHong Kong
ChinaVietnam
IndonesiaPhilippines
MalaysiaCambodia
Thailand
Per Cent
Related Documents