1 HANTEC RESEARCH WEBINARS - TECHNICAL ANALYSIS SERIES As can be seen in the above chart, support is the price level through which a price seldom falls (illustrated by the blue arrows), while resistance is the price level that a price seldom surpasses (illustrated by the red arrows). These support and resistance levels are important in terms of market psychology, and are the graphical illustration of supply and demand. Supports are the levels at which a lot of traders are willing to buy, while resistances are thee levels at which traders are looking to sell. Once these levels have been broken, the supply and demand and the psychology behind the price movement are thought to have shifted. Subsequently, new levels of support and resistance will be established. What is support and resistance? A key to technical analysis is the battle between the bulls and the bears. Or in other words the buyers (demand) and sellers (supply). In technical analysis, this is referred to as resistance and support levels. When the price reaches a level where demand is outstripped by supply, the price rise will be stunted and there will be a ceiling or resistance in place, at which level the price begins to fall. On the other hand, when a falling price is met with increased demand at a level where there are more buyers than sellers, a floor is reached which acts as support, at which the price begins to rise again. BEGINNER 2. The Secrets of Support & Resistance Figure 1: Support and Resistance

Welcome message from author
This document is posted to help you gain knowledge. Please leave a comment to let me know what you think about it! Share it to your friends and learn new things together.
Transcript
1
HANTEC RESEARCH WEBINARS - TECHNICAl ANAlySIS SERIES
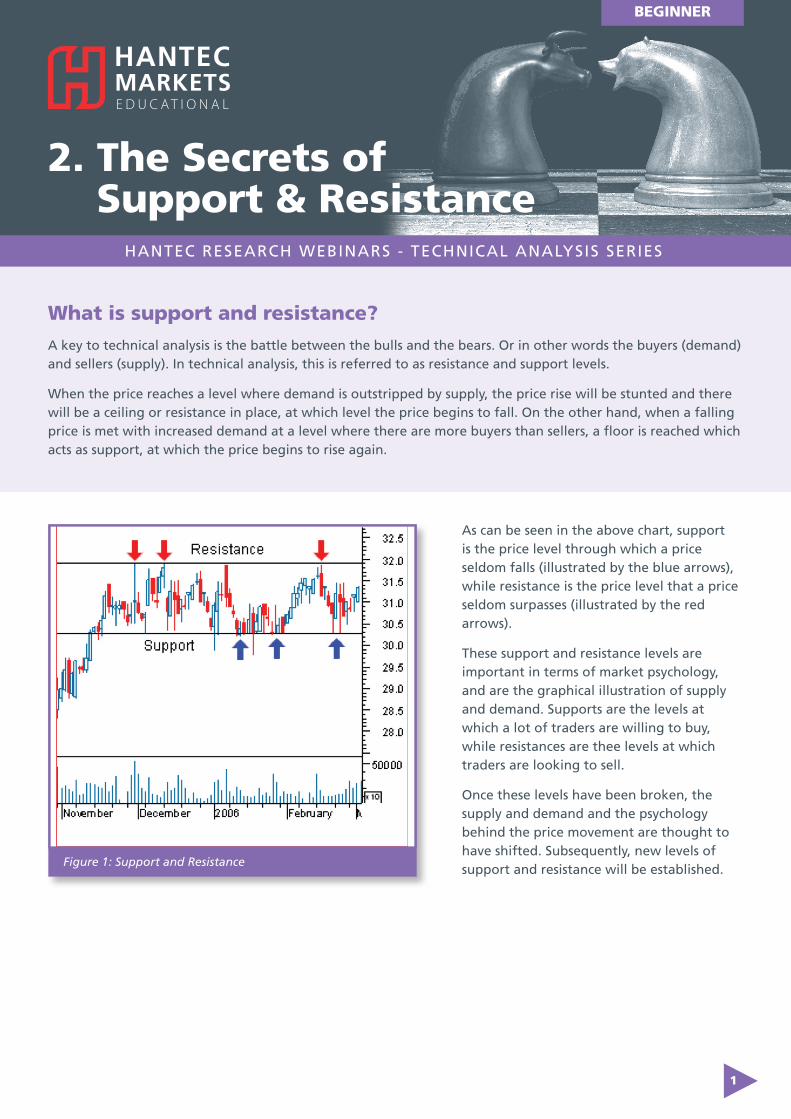
As can be seen in the above chart, support is the price level through which a price seldom falls (illustrated by the blue arrows), while resistance is the price level that a price seldom surpasses (illustrated by the red arrows).
These support and resistance levels are important in terms of market psychology, and are the graphical illustration of supply and demand. Supports are the levels at which a lot of traders are willing to buy, while resistances are thee levels at which traders are looking to sell.
Once these levels have been broken, the supply and demand and the psychology behind the price movement are thought to have shifted. Subsequently, new levels of support and resistance will be established.
What is support and resistance?
A key to technical analysis is the battle between the bulls and the bears. Or in other words the buyers (demand) and sellers (supply). In technical analysis, this is referred to as resistance and support levels.
When the price reaches a level where demand is outstripped by supply, the price rise will be stunted and there will be a ceiling or resistance in place, at which level the price begins to fall. On the other hand, when a falling price is met with increased demand at a level where there are more buyers than sellers, a floor is reached which acts as support, at which the price begins to rise again.
BEGINNER
2. The Secrets of Support & Resistance
Figure 1: Support and Resistance
2
HANTEC RESEARCH WEBINARS - TECHNICAl ANAlySIS SERIES
2. The Secrets of Support & Resistance
Old support becomes new resistance, and vice versa
Once a resistance or support level is broken, its role is reversed. If the price falls below a support level, that level will become resistance. If the price rises above a resistance level, it will become a basis of support.
As the price moves past a level of support or resistance, it is thought that supply and demand has shifted, causing the breached level to reverse its role. For a true reversal to occur, however, it is important that the price makes a strong move through either the support or resistance.
Often you will see a pullback to the breakout level, before continuing in the direction of the breakout.
How to trade Supports and Resistances
Support and resistance analysis is an important part of trends because it can be used to make trading decisions and identify when a trend is reversing.
For example, if a trader identifies an important level of resistance that has been tested several times but never broken, he/she may decide to take profits as the security moves toward this point as it is unlikely that it will move past this level.
The reverse can be true on a break of a key level. Many traders will trade in the direction of a breakout.
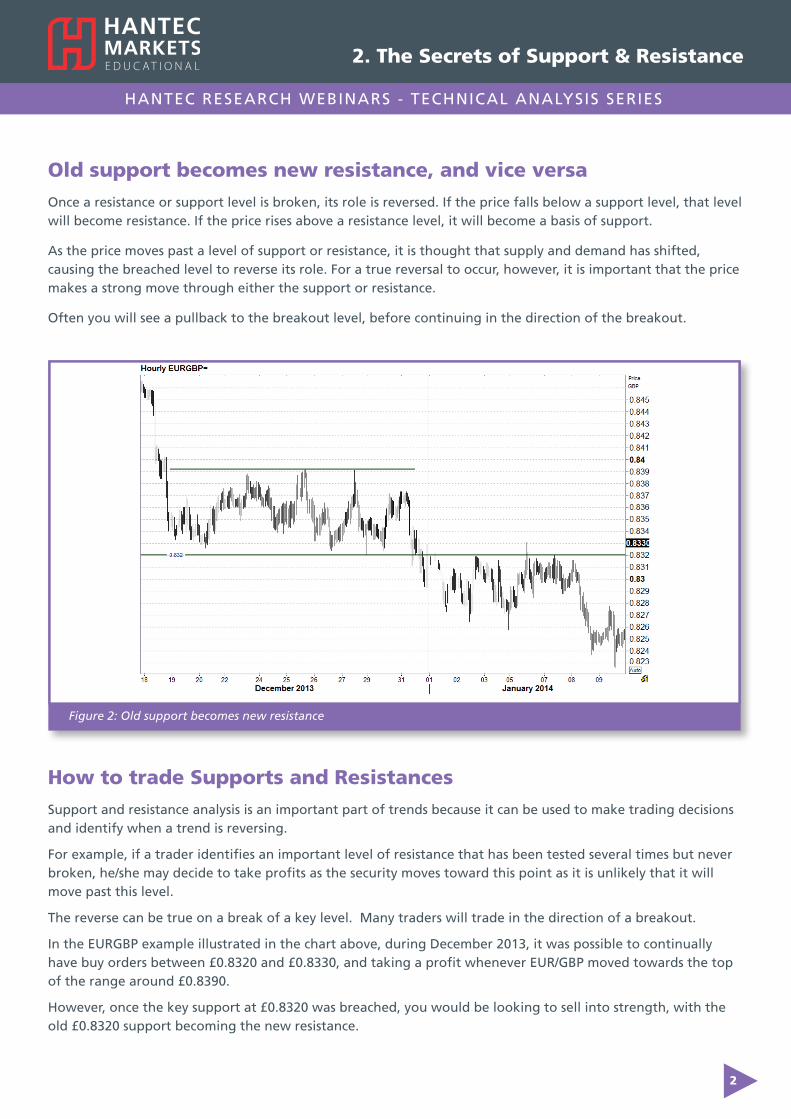
In the EURGBP example illustrated in the chart above, during December 2013, it was possible to continually have buy orders between £0.8320 and £0.8330, and taking a profit whenever EUR/GBP moved towards the top of the range around £0.8390.
However, once the key support at £0.8320 was breached, you would be looking to sell into strength, with the old £0.8320 support becoming the new resistance.
Figure 2: Old support becomes new resistance

Figure 4: Range trading using the Bollinger Bands on Silver
Risk Warning for Educational Material
This document is issued by Hantec Markets limited, who is authorised and regulated by the Financial Conduct Authority (FCA) in the UK, No. 502635. The document is prepared and distributed for information and education purposes only. Trading in Foreign Exchange (FX), Bullion and Contracts for Differences (CFDs) is not suitable for all investors due to the high risk nature of these products. Forex, Bullion and CFDs are leveraged products that can result in losses greater than your initial deposit. The value of an FX, Bullion or CFD position may be affected by a variety of factors, including but not limited to, price volatility, market volume, foreign exchange rates and liquidity. you may lose your entire initial stake and you may be required to make additional payments. Please ensure you fully understand the risks involved, seeking independent advice if necessary prior to entering into such transactions. Before deciding to enter into FX, Bullion and/or CFD trading, you should carefully consider your investment objectives, level of experience, and risk appetite. you should only invest in FX, Bullion and/or CFD trading with funds you are prepared to lose entirely. Therefore, only your excess funds should be placed at risk and anyone who does not have such excess funds should completely refrain from engaging in FX and/or CFD trading. Do not rely on past performance figures. If you are in any doubt, please seek further independent advice. This document does not constitute personal investment advice, nor does it take into account the individual financial circumstances or objectives of the clients who receive it. All information and research produced by Hantec Markets is intended to be general in nature; it does not constitute a recommendation or offer for the purchase or sale of any financial instrument, nor should it be construed as such. All of the views or suggestions within this document are those solely and exclusively of the author, and accurately reflect his personal views about any and all of the subject instruments and are presented to the best of the author’s knowledge. Any person relying on this document to undertake trading does so entirely at his/her own risk and Hantec Markets does not accept any liability.
T: +44 (0) 20 7036 0888 │| F: +44 (0) 20 7036 0899 |│ E: [email protected] │| W: hantecfx.com
Hantec House, 12-14 Wilfred Street, london SW1E 6PlT: +44 (0) 20 7036 0888F: +44 (0) 20 7036 0899E: [email protected]
W: hantecfx.com
Trust Through Transparency
HANTEC RESEARCH WEBINARS - TECHNICAl ANAlySIS SERIES
Related Documents
![Support and-resistance-simplified[1]](https://static.cupdf.com/doc/110x72/5553baa1b4c905d4448b4f90/support-and-resistance-simplified1.jpg)