USER'S MANUAL 990-301 Revision B, January 2002 WELD SENTRY 2 RESISTANCE WELDING PROCESS CONTROL MONITOR PART NUMBER STOCK NUMBER WS2 3-131-XX WS2/230 3-131-XX-01 WS2/10X 3-131-XX-02 WS2/230/10X 3-131-XX-03

Welcome message from author
This document is posted to help you gain knowledge. Please leave a comment to let me know what you think about it! Share it to your friends and learn new things together.
Transcript
USER'S MANUAL 990-301 Revision B, January 2002
WELD SENTRY 2 RESISTANCE WELDING PROCESS
CONTROL MONITOR
PART NUMBER STOCK NUMBER
WS2 3-131-XX WS2/230 3-131-XX-01 WS2/10X 3-131-XX-02 WS2/230/10X 3-131-XX-03

Copyright© 1996, 2002 Unitek Miyachi Corporation The engineering designs, drawings and data contained herein are the proprietary work of UNITEK MIYACHI CORPORATION and may not be reproduced, copied, exhibited or otherwise used without the written authorization of UNITEK MIYACHI CORPORATION.
Printed in the United States of America.
Revision Record
Revision EO Date Basis of Revision A 16678 8/96 Correct Calibration Procedure.
B 19146 1/02 Add Unitek Peco™ Name

FOREWORD
Thank you for purchasing a Unitek Peco™ Weld Sentry 2.
Upon receipt of your equipment, please thoroughly inspect it for shipping damage prior to its installation. Should there be any damage, please immediately contact the shipping company to file a claim, and notify Unitek Miyachi at:
1820 South Myrtle Avenue P.O. Box 5033 Monrovia, California 91017-7133 Telephone: (626) 303-5676 FAX: (626) 358-8048 e-mail: [email protected]
The purpose of this manual is to supply operating and maintenance personnel with the information needed to properly and safely operate and maintain the Unitek Peco Weld Sentry 2.
We have made every effort to ensure that the information in this manual is accurate and adequate.
Should questions arise, or if you have suggestions for improvement of this manual, please contact us at the above location/numbers.
Unitek Miyachi Corporation is not responsible for any loss due to improper use of this product.
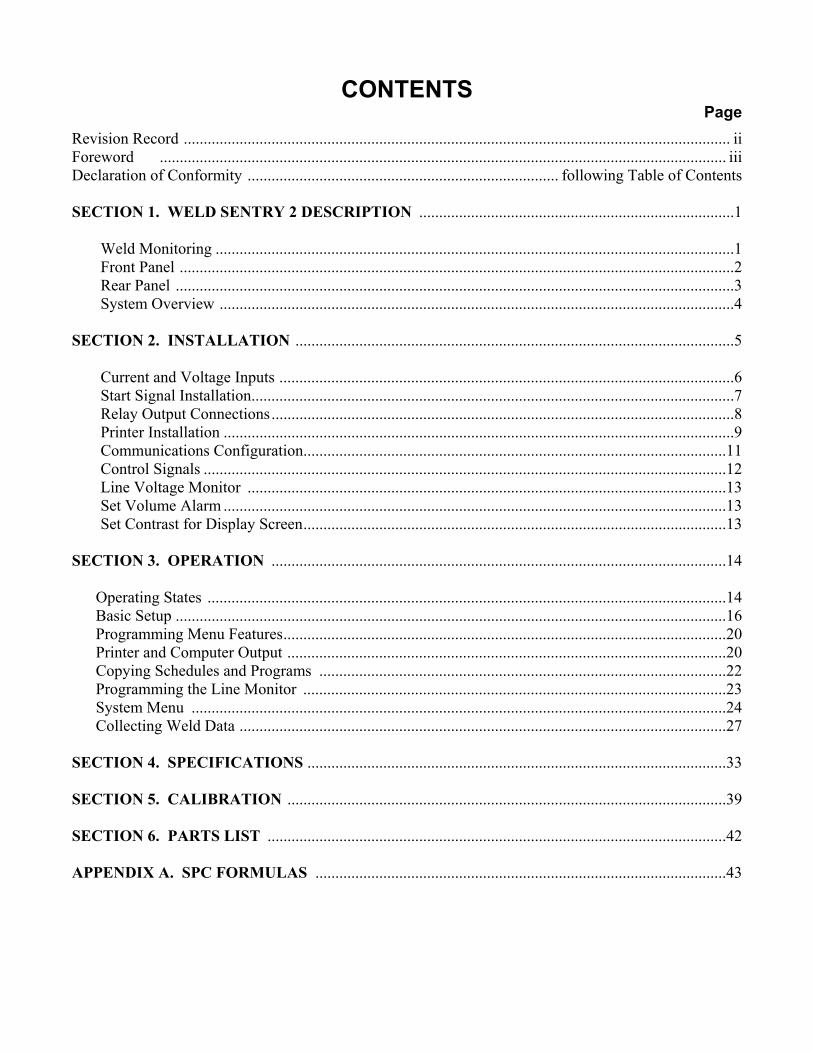
CONTENTS
Page Revision Record ......................................................................................................................................... ii Foreword .............................................................................................................................................. iii Declaration of Conformity .............................................................................. following Table of Contents SECTION 1. WELD SENTRY 2 DESCRIPTION ...............................................................................1 Weld Monitoring ..................................................................................................................................1 Front Panel ...........................................................................................................................................2 Rear Panel ............................................................................................................................................3 System Overview .................................................................................................................................4 SECTION 2. INSTALLATION ..............................................................................................................5 Current and Voltage Inputs ..................................................................................................................6 Start Signal Installation.........................................................................................................................7 Relay Output Connections....................................................................................................................8 Printer Installation ................................................................................................................................9 Communications Configuration..........................................................................................................11 Control Signals ...................................................................................................................................12 Line Voltage Monitor ........................................................................................................................13 Set Volume Alarm ..............................................................................................................................13 Set Contrast for Display Screen..........................................................................................................13 SECTION 3. OPERATION ..................................................................................................................14
Operating States ..................................................................................................................................14 Basic Setup ..........................................................................................................................................16 Programming Menu Features...............................................................................................................20 Printer and Computer Output ..............................................................................................................20 Copying Schedules and Programs ......................................................................................................22 Programming the Line Monitor ..........................................................................................................23 System Menu ......................................................................................................................................24 Collecting Weld Data ..........................................................................................................................27
SECTION 4. SPECIFICATIONS .........................................................................................................33 SECTION 5. CALIBRATION ..............................................................................................................39 SECTION 6. PARTS LIST ...................................................................................................................42 APPENDIX A. SPC FORMULAS .......................................................................................................43

WELD SENTRY 2 Page 1
SECTION 1 - WELD SENTRY 2 DESCRIPTION
WELD MONITORING Two conditions must be met to produce a good weld. First, the oxide layer covering the metal surfaces must be eliminated. Second, the irregular surface of the metals must be brought into intimate contact with each other. All present day welding processes are just different ways of achieving these two goals by using various combinations of heat, pressure and time. In the resistance welding process, the pressure is applied by the electrodes which are mounted on a welding head. These electrodes carry a very high electrical current for a fraction of a second. Heat, generated by the resistance of the workpieces to the flow of electricity, either melts the workpieces at their interface or at least reduces their strength to a level where their surfaces become plastic. When the flow of current stops, the electrode force is maintained, for another fraction of a second, while the weld rapidly cools and solidifies. The size and shape of the weld is generally limited by the size and contour of the faces of the electrodes. General practice in resistance spot welding is to base quality control on weld properties as well as on the uniformity and consistency of results. The quality of spot welds is usually checked by visual inspection and by destructive testing. Nondestructive testing methods tend to be inconsistent and are not ordinarily used as an inspection criteria except in the semiconductor industry. Quality standards should be related to the requirements of the specific application. For example, it is rarely possible to obtain maximum joint strength and minimum indentation using the same machine settings. Weld monitors are devices which measure one or more specific electrical and/or mechanical parameters which dynamically change during the welding process. Somewhat in order of popularity, these measurements include weld current, the voltage drop across the electrodes, workpiece expansion and deformation, the electrode force, the size of the electrode face, the acoustic energy emitted while the weld is being formed, and the temperature of the workpieces. Variations in the thickness, tensile strength, hardness, surface finish and cleanliness of the workpieces have a significant effect on weld quality. The shape of the electrode face also affects weld quality. Modern measurement techniques make it possible to accurately measure the energy and pressure used to make a resistance weld. Weld monitoring is effective to the extent that the electrical and mechanical measurements made during the welding process reflect the variations in the physical properties of the workpieces and the welding equipment. The successful user of a weld monitor usually conducts extensive experiments in order to determine which combination of measurement parameters correlates with the quality of their specific parts. Once correlation is verified in a production environment over a reasonable time, the weld monitor becomes a vital manufacturing tool. To date no weld monitor has been commercially marketed which simultaneously monitors all of the possible parameters; nor has any monitor been successful in predicting the quality of all parts which might be welded in a given manufacturing area. The Unitek Peco Weld Sentry accurately and consistently measures the voltage and current used to make a direct energy (AC), stored energy (DC), constant current (CI), or constant voltage (CV) resistance weld. This makes it superior to any other precision instrument of its type. Testing, on the production line, has shown that the precision of the measurements made by the Sentry allows users to logically evaluate the quality of their welding processes. If the user carefully controls the quality of the workpieces and uses good manufacturing process control, the Sentry can provide the necessary electrical data for statistical process control which in turn should increase quality and reduce manufacturing costs.
Page 2 WELD SENTRY 2
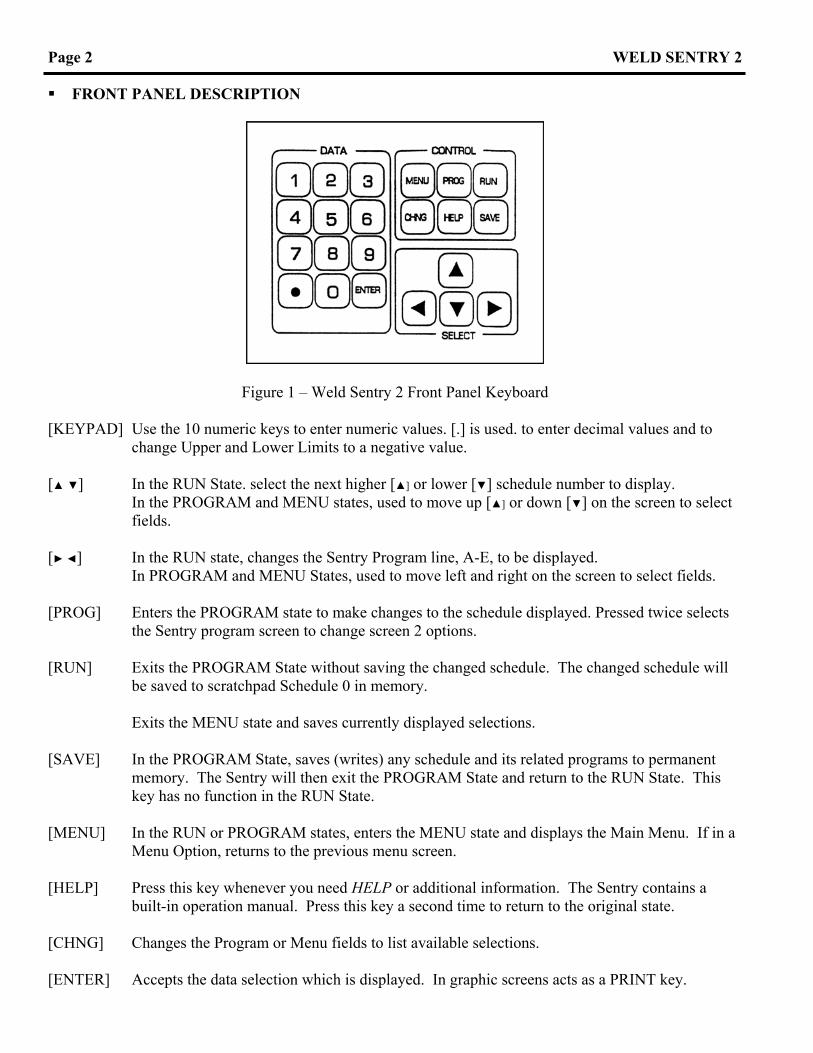
FRONT PANEL DESCRIPTION
Figure 1 – Weld Sentry 2 Front Panel Keyboard
[KEYPAD] Use the 10 numeric keys to enter numeric values. [.] is used. to enter decimal values and to
change Upper and Lower Limits to a negative value. [ ] In the RUN State. select the next higher [] or lower [] schedule number to display.
In the PROGRAM and MENU states, used to move up [] or down [] on the screen to select fields.
[ ] In the RUN state, changes the Sentry Program line, A-E, to be displayed. In PROGRAM and MENU States, used to move left and right on the screen to select fields. [PROG] Enters the PROGRAM state to make changes to the schedule displayed. Pressed twice selects
the Sentry program screen to change screen 2 options. [RUN] Exits the PROGRAM State without saving the changed schedule. The changed schedule will
be saved to scratchpad Schedule 0 in memory.
Exits the MENU state and saves currently displayed selections. [SAVE] In the PROGRAM State, saves (writes) any schedule and its related programs to permanent
memory. The Sentry will then exit the PROGRAM State and return to the RUN State. This key has no function in the RUN State.
[MENU] In the RUN or PROGRAM states, enters the MENU state and displays the Main Menu. If in a
Menu Option, returns to the previous menu screen. [HELP] Press this key whenever you need HELP or additional information. The Sentry contains a
built-in operation manual. Press this key a second time to return to the original state. [CHNG] Changes the Program or Menu fields to list available selections. [ENTER] Accepts the data selection which is displayed. In graphic screens acts as a PRINT key.
WELD SENTRY 2 Page 3
REAR PANEL DESCRIPTION
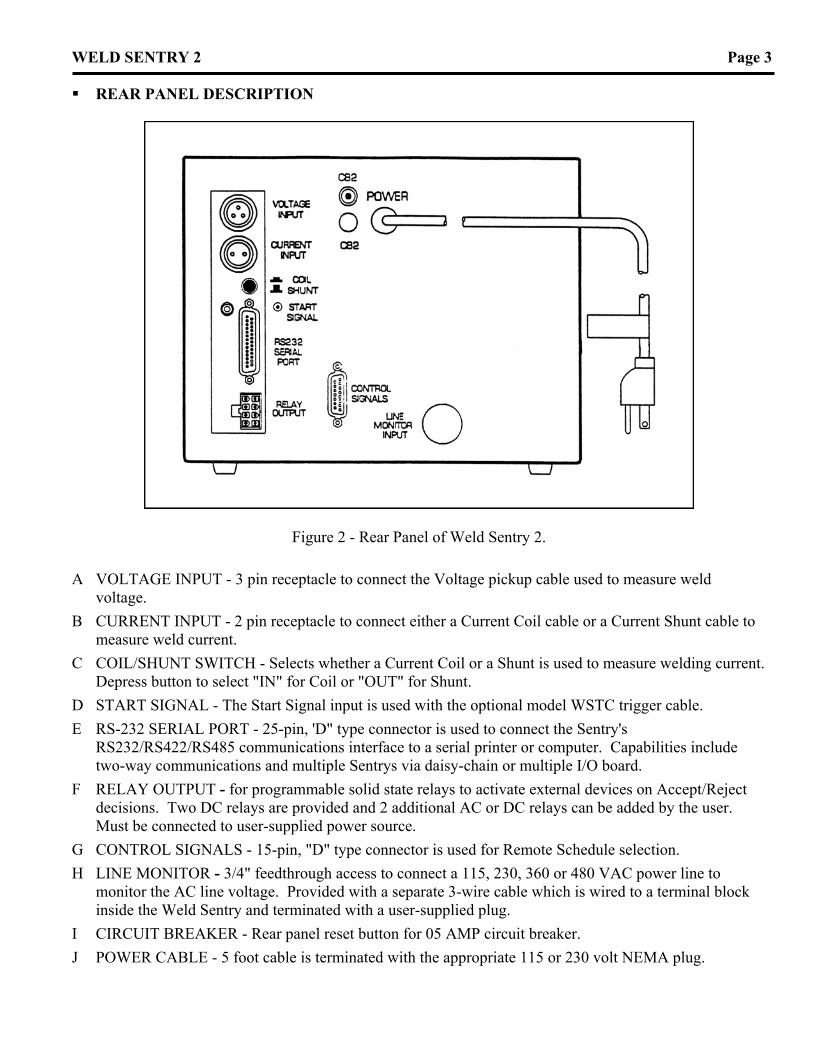
Figure 2 - Rear Panel of Weld Sentry 2. A VOLTAGE INPUT - 3 pin receptacle to connect the Voltage pickup cable used to measure weld
voltage. B CURRENT INPUT - 2 pin receptacle to connect either a Current Coil cable or a Current Shunt cable to
measure weld current. C COIL/SHUNT SWITCH - Selects whether a Current Coil or a Shunt is used to measure welding current.
Depress button to select "IN" for Coil or "OUT" for Shunt. D START SIGNAL - The Start Signal input is used with the optional model WSTC trigger cable. E RS-232 SERIAL PORT - 25-pin, 'D" type connector is used to connect the Sentry's
RS232/RS422/RS485 communications interface to a serial printer or computer. Capabilities include two-way communications and multiple Sentrys via daisy-chain or multiple I/O board.
F RELAY OUTPUT - for programmable solid state relays to activate external devices on Accept/Reject decisions. Two DC relays are provided and 2 additional AC or DC relays can be added by the user. Must be connected to user-supplied power source.
G CONTROL SIGNALS - 15-pin, "D" type connector is used for Remote Schedule selection. H LINE MONITOR - 3/4" feedthrough access to connect a 115, 230, 360 or 480 VAC power line to
monitor the AC line voltage. Provided with a separate 3-wire cable which is wired to a terminal block inside the Weld Sentry and terminated with a user-supplied plug.
I CIRCUIT BREAKER - Rear panel reset button for 05 AMP circuit breaker. J POWER CABLE - 5 foot cable is terminated with the appropriate 115 or 230 volt NEMA plug.

Page 4 WELD SENTRY 2
SYSTEM OVERVlEW The following is an overview outline of the tasks required to begin monitoring. Refer to the sections noted for detailed instructions and information.
SETUP WELD SENTRY SYSTEM 1. Connect the Voltage and Current Pickup Cables. (Refer to Section 2 - Installation and Section 4
Specifications)
2. Turn POWER ON. Press [MENU] to display the Main Menu.
3. Select System Help from the Main Menu to access the on-line users's manual.
4. Press [HELP] for help related to the current screen or cursor position.
5. Select Main Menu and setup system configuration options, Some standard selections are as follows:
a. System Menu/System Setup - select type of current pickup and turn on extended modes.
b. System Menu/Set Time and Date - to set time in 24 hour format and data in mo/da/yr format.
c. Weld Counters - reset count to zero or set to an existing count corresponding to the welder.
d. System Menu/Communications - select printer or computer protocol.
e. Print Options - select data output options for printer or computer.
6. Press [RUN] to return to the Run State.
SETUP WELD SENTRY SCHEDULE 7. Select a Weld Sentry Schedule number which will correspond with the weld schedule you want to
monitor. NOTE: In order to effectively use the Weld Sentry as a monitoring tool, you must develop a Weld Schedule which produces consistent, repeatable results.
8. Select Basic Setup from the Main Menu. Basic Setup is always used to create a specific Sentry Schedule for each corresponding Weld Schedule.
9. Make sample welds and SAVE new Weld Sentry schedule in memory. Refer to Section 3 - Operation, Basic Setup.
10. Use Program features to enter Reject Limits, add additional programs or modify the Sentry schedule. Refer to Section 3 - Operation.
11. Select Display Graph from the Main Menu to display a waveform graph of the last weld. You can also weld when this graph is displayed.
12. Select SPC to access statistics, run charts, histograms, control charts and related summary calculations.
13. Select Print Utilities from the Main Menu to print out System Parameters, Schedules, Programs or Graph of Last Weld.
WELD SENTRY 2 Page 5
SECTION 2 - INSTALLATION The basic connections required to monitor are the Current and Voltage inputs. The optional connections are the Start Signal, Line Monitor, Control Signals, Relay Output and the RS-232/RS-422/RS-485. Refer to the corresponding sections in Specifications for more detailed information and technical specifications. CURRENT AND VOLTAGE INPUTS
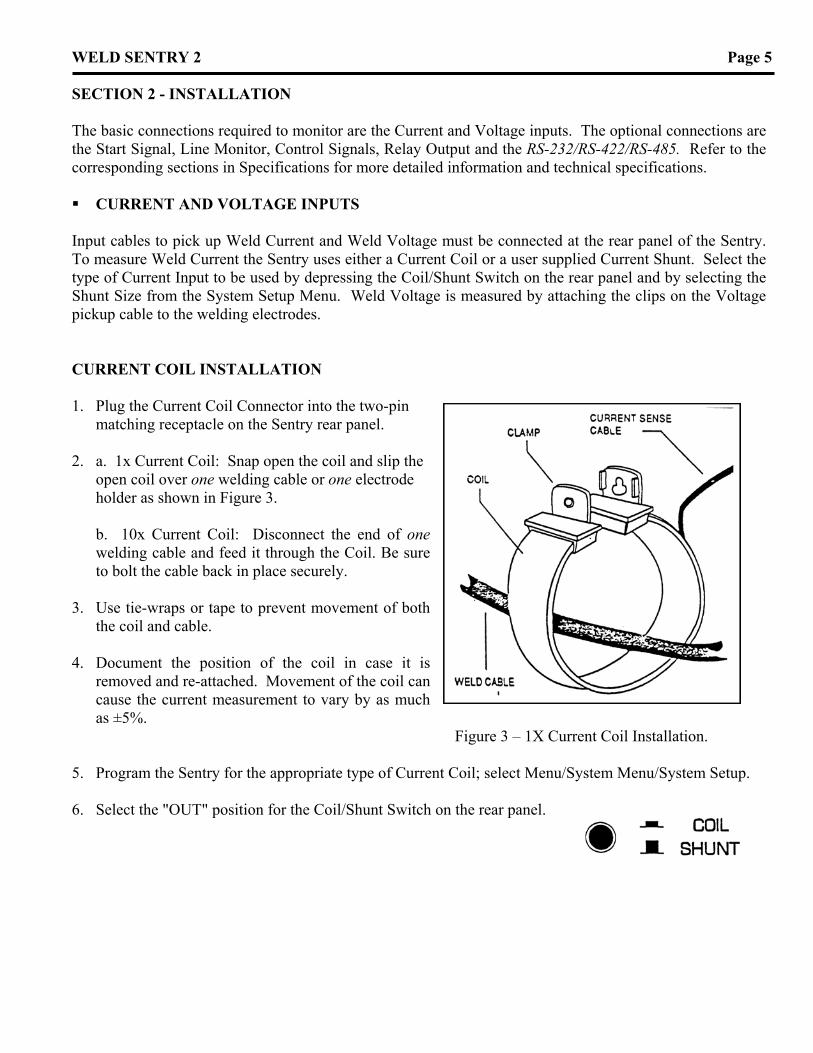
Input cables to pick up Weld Current and Weld Voltage must be connected at the rear panel of the Sentry. To measure Weld Current the Sentry uses either a Current Coil or a user supplied Current Shunt. Select the type of Current Input to be used by depressing the Coil/Shunt Switch on the rear panel and by selecting the Shunt Size from the System Setup Menu. Weld Voltage is measured by attaching the clips on the Voltage pickup cable to the welding electrodes. CURRENT COIL INSTALLATION 1. Plug the Current Coil Connector into the two-pin
matching receptacle on the Sentry rear panel.
2. a. 1x Current Coil: Snap open the coil and slip the open coil over one welding cable or one electrode holder as shown in Figure 3.
b. 10x Current Coil: Disconnect the end of one welding cable and feed it through the Coil. Be sure to bolt the cable back in place securely.
3. Use tie-wraps or tape to prevent movement of both
the coil and cable. 4. Document the position of the coil in case it is
removed and re-attached. Movement of the coil can cause the current measurement to vary by as much as ±5%.
Figure 3 – 1X Current Coil Installation.
5. Program the Sentry for the appropriate type of Current Coil; select Menu/System Menu/System Setup. 6. Select the "OUT" position for the Coil/Shunt Switch on the rear panel.

Page 6 WELD SENTRY 2
Table 1
CURRENT SHUNT INSTALLATION 1. Select a user-supplied current shunt from Table 1. 2. Disconnect the welding cable coming from one of
the terminals on the weld head. 3. Place the Current Shunt between the open
connections and then securely re-attach all connections.
4. Plug the Current Input cable into the Current Input
connector on the rear panel. 5. a. Attach the alligator clips on the Input Cable to
the voltage terminals on the Current Shunt. Polarity is not important.
Figure 4 – Current Shunt Installation
b. For a more permanent installation, replace the alligator clips with terminals and screw the leads to the voltage terminals.
6. Select the "OUT" position for the Coil/Shunt Switch on the rear panel. 7. Program the Sentry for the appropriate size Shunt, select Menu/System Menu/System Setup. CURRENT SHUNT SELECTION Current Shunts are precision resistors capable of handling very large currents. The shunt is connected in series with the weld cable so that the weld current passes through. The Current Pickup leads are connected to terminals on the shunt so that the voltage drop can be measured by the Weld Sentry. Current Shunt voltage drop should be limited to 0.5 volts in order to minimize weld energy losses. Use the formula Volts ÷ Amps = Resistance to determine the proper shunt size. The table at right provides a guide to Current Shunt selection.
Weld Current (Max Amps)
Shunt Resistance (milliohms)
50 10 500 1
5,000 0.1 50,000 0.01

WELD SENTRY 2 Page 7
VOLTAGE CABLE INSTALLATION 1. Attach each of the voltage pickup leads to the electrodes.
Polarity is not critical, the Sentry uses the current signal to detect polarity.
Note: The leads should be as close as is practical to the tip end of each electrode.
The ideal objective would be is to measure only the weld voltage across the workpiece.
2. For production installations replace the clip leads with terminals and screw the leads to the electrode or electrode holder to prevent movement.
3. Attach the cable in a fixed position along the weld head and back to the Weld Sentry.
Once attached, the position must be maintained to prevent variation in the voltage measurements,
4. Twist together any excess length of the two lead wires. This prevents pickup of voltage caused by induction.
5. Figure 5 shows the typical attachments for measuring weld voltage.
Figure 5 - Connecting the Voltage Input cable to electrodes. START SIGNAL INSTALLATION
The Start signal is designed as a means to detect "missing welds' or to prevent 'false triggering' in an electrically noisy environment. Use of the Start Signal is optional and is not required for normal operation of the Weld Sentry.
1. Obtain the optional cable accessory, catalog number WSTC.
2. Plug cable end with the jack plug to the two-pin Current Input connector on rear panel of the Sentry.
3. Connect the end with the two wires to a signal source or device.
The signal can be originated by the actuation of the weld head or by the electrode force or a pressure switch. It is not necessary for the start signal to be synchronized with the start of the weld pulse.
4. The signal must occur just before the weld and remain ON for the duration of the weld. Refer to Section 4 - Specifications.
Page 8 WELD SENTRY 2
RELAY OUTPUT CONNECTIONS
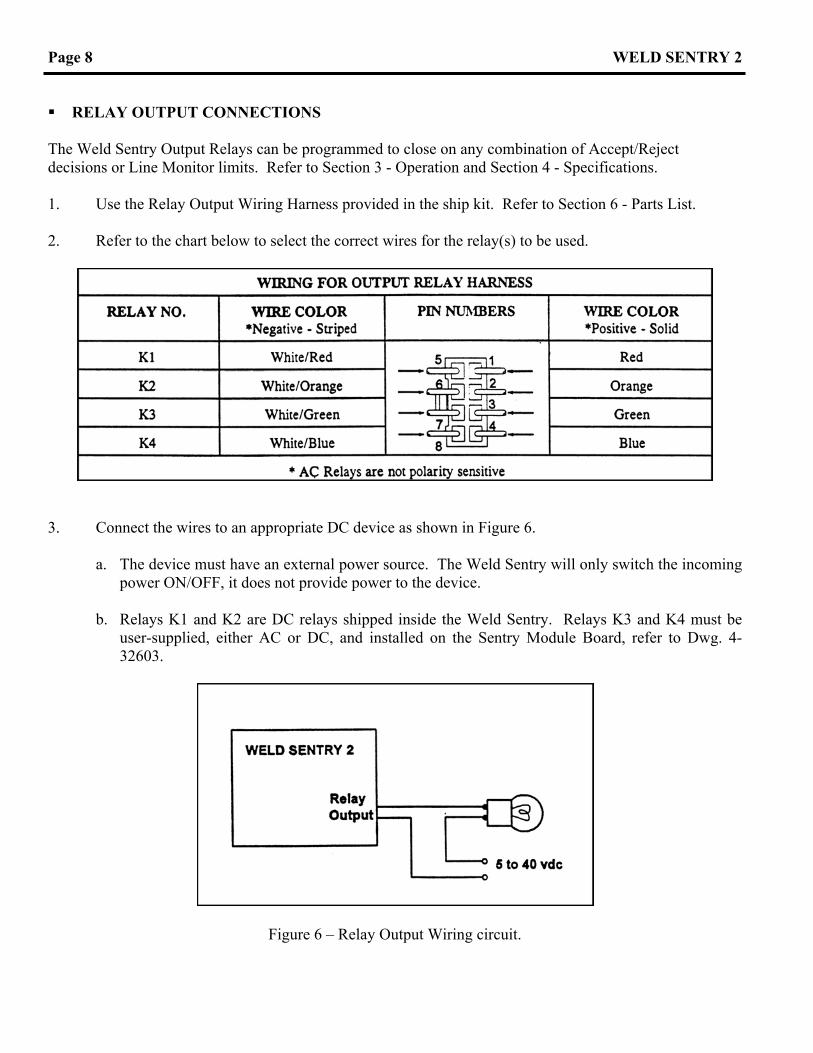
The Weld Sentry Output Relays can be programmed to close on any combination of Accept/Reject decisions or Line Monitor limits. Refer to Section 3 - Operation and Section 4 - Specifications. 1. Use the Relay Output Wiring Harness provided in the ship kit. Refer to Section 6 - Parts List. 2. Refer to the chart below to select the correct wires for the relay(s) to be used.
3. Connect the wires to an appropriate DC device as shown in Figure 6.
a. The device must have an external power source. The Weld Sentry will only switch the incoming power ON/OFF, it does not provide power to the device.
b. Relays K1 and K2 are DC relays shipped inside the Weld Sentry. Relays K3 and K4 must be
user-supplied, either AC or DC, and installed on the Sentry Module Board, refer to Dwg. 4-32603.
Figure 6 – Relay Output Wiring circuit.

WELD SENTRY 2 Page 9
PRINTER INSTALLATION - Kodak Diconix 180si Printer/Unitek Catalog No. PTR:
1. Use the standard male-to-male RS232 Cable supplied with the printer. 2. Connect one end to the RS232 Serial Port on the rear of the Weld Sentry. 3. QUICK REFERENCE CARD - Detailed instructions for printer installation and operation are provided
in the printer's User's Guide and Technical Reference Manual which are included with the printer. Also included with the printer is a Quick Reference Card as shown below:
Page 10 WELD SENTRY 2
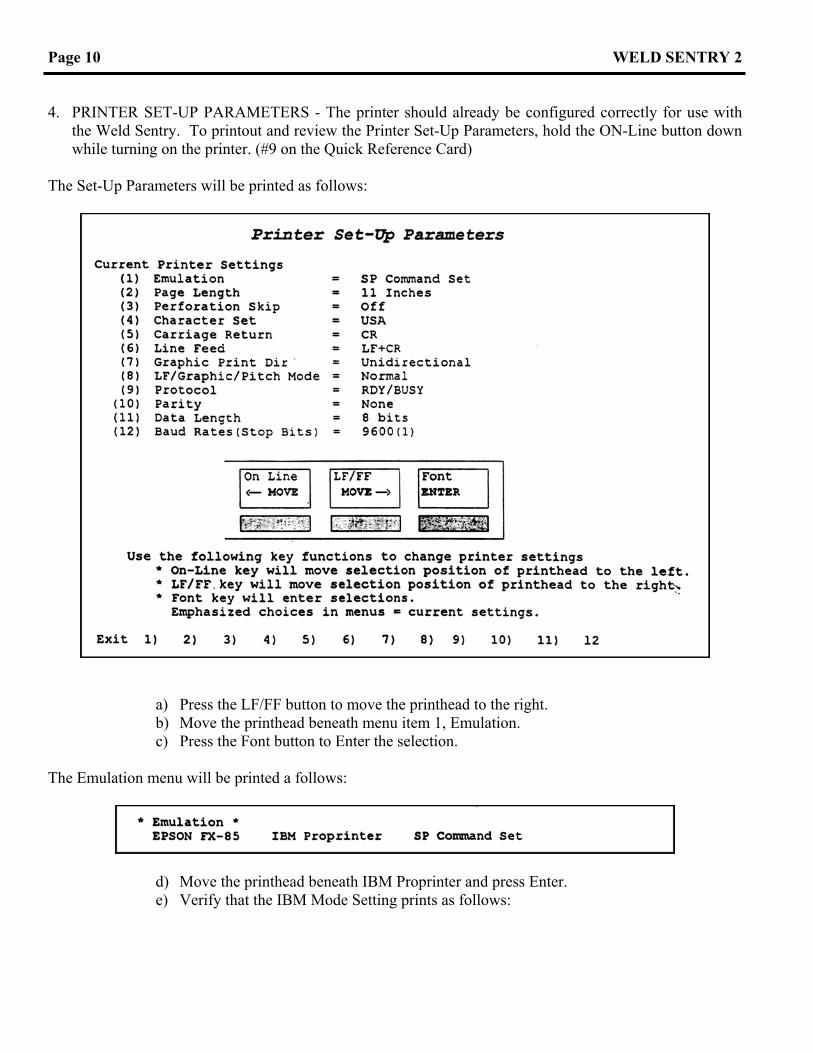
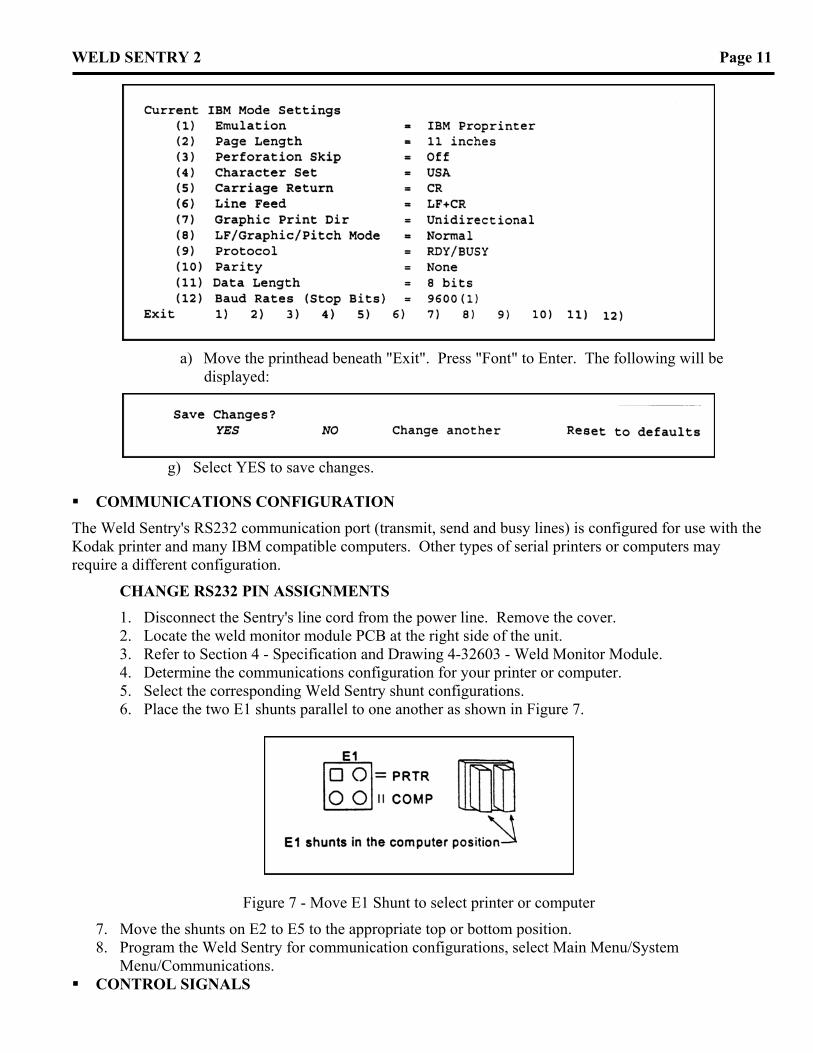
4. PRINTER SET-UP PARAMETERS - The printer should already be configured correctly for use with
the Weld Sentry. To printout and review the Printer Set-Up Parameters, hold the ON-Line button down while turning on the printer. (#9 on the Quick Reference Card)
The Set-Up Parameters will be printed as follows:
a) Press the LF/FF button to move the printhead to the right. b) Move the printhead beneath menu item 1, Emulation. c) Press the Font button to Enter the selection.
The Emulation menu will be printed a follows:
d) Move the printhead beneath IBM Proprinter and press Enter. e) Verify that the IBM Mode Setting prints as follows:
WELD SENTRY 2 Page 11
a) Move the printhead beneath "Exit". Press "Font" to Enter. The following will be
displayed:
g) Select YES to save changes.
COMMUNICATIONS CONFIGURATION The Weld Sentry's RS232 communication port (transmit, send and busy lines) is configured for use with the Kodak printer and many IBM compatible computers. Other types of serial printers or computers may require a different configuration.
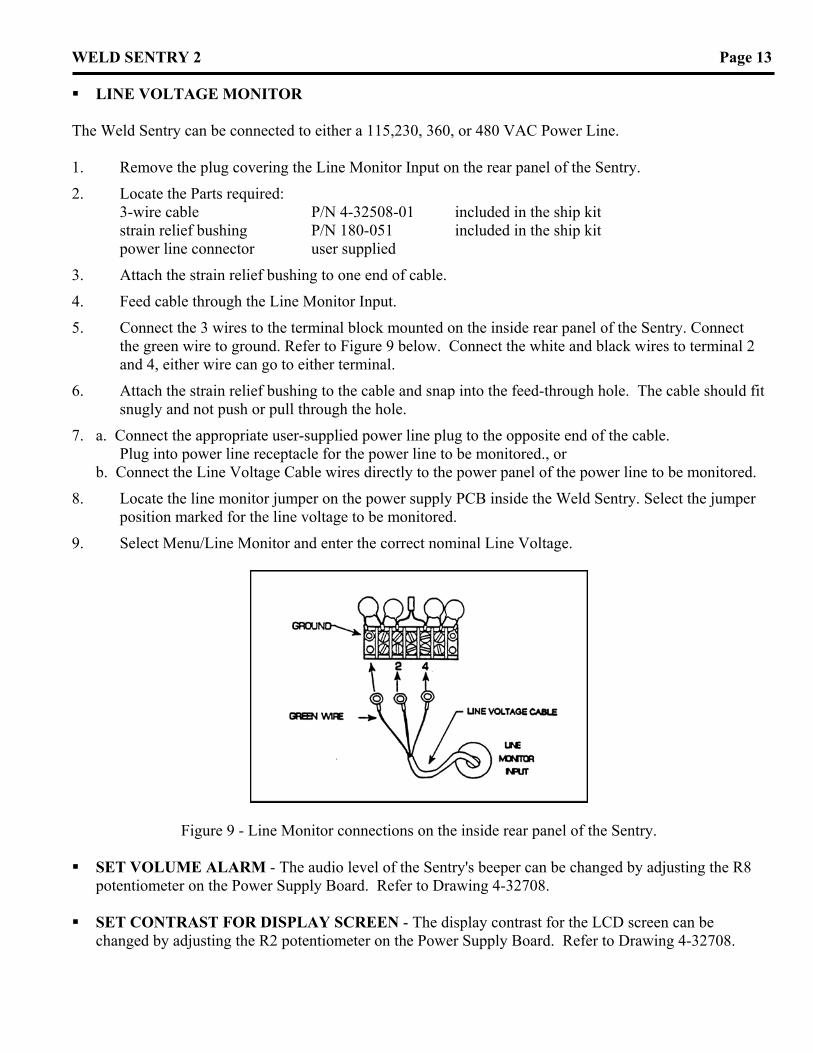
CHANGE RS232 PIN ASSIGNMENTS 1. Disconnect the Sentry's line cord from the power line. Remove the cover. 2. Locate the weld monitor module PCB at the right side of the unit. 3. Refer to Section 4 - Specification and Drawing 4-32603 - Weld Monitor Module. 4. Determine the communications configuration for your printer or computer. 5. Select the corresponding Weld Sentry shunt configurations. 6. Place the two E1 shunts parallel to one another as shown in Figure 7.
Figure 7 - Move E1 Shunt to select printer or computer
7. Move the shunts on E2 to E5 to the appropriate top or bottom position. 8. Program the Weld Sentry for communication configurations, select Main Menu/System
Menu/Communications. CONTROL SIGNALS

Page 12 WELD SENTRY 2 The 15-pin "D" sub connector on the rear panel of the Sentry is used for remote schedule selection and to remotely clear error status.
1. Use the mating connector provided in the ship kit of the Sentry. 2. Determine the correct pin number positions on the Control Signals connector, refer to Figure 8. 3. Wire the corresponding pins of the mating connector to a dry contact or logic level switch. Refer to
Section 4 - Specifications. 4. Plug the wired connector to the Control Signals input on the rear panel of the Sentry.
Figure 8 - Control Signals Connector on Rear Panel.
REMOTE SCHEDULE SELECTION
1. Pins 1, 2, 3, 4, 5, 12 and 14 of the Control Signals connector are used for remote schedule selection using the BCD* codes from Table 2.
2. Select Schedules by shorting the appropriate pin(s) to ground Pin 11 using an external switch closure (or logic level). The front panel Screen will change to display the selected schedule.
3. Maintain the switch closure during operation. Front panel selection of schedules will not be not possible, however, Menu functions can be performed.
TABLE 2 SCHEDULE SELECTION CODES
BCD* CODE 0 1 2 3 4 5 6
PIN NUMBER Pin 1 Pin 2 Pin 3 Pin 4 Pin 12 Pin 5 Pin 14
SCHEDULE SELECTED
1 2 4 8 16 32 64
*Binary Coded Decimal - combine pins to select any other schedules,
CLEAR ERROR STATUS VIA EXTERNAL SWITCH
Any error status which can be cleared by pressing [RUN] can also be cleared externally by using the remote schedule selection connections.
1. The current schedule must be selected using Remote Schedule Selection. 2. During operation the schedule lines must remain CLOSED. 3. To clear an Error Status, OPEN the schedule selection lines momentarily and then CLOSED.
WELD SENTRY 2 Page 13 LINE VOLTAGE MONITOR
The Weld Sentry can be connected to either a 115,230, 360, or 480 VAC Power Line. 1. Remove the plug covering the Line Monitor Input on the rear panel of the Sentry.
2. Locate the Parts required: 3-wire cable P/N 4-32508-01 included in the ship kit strain relief bushing P/N 180-051 included in the ship kit power line connector user supplied
3. Attach the strain relief bushing to one end of cable.
4. Feed cable through the Line Monitor Input.
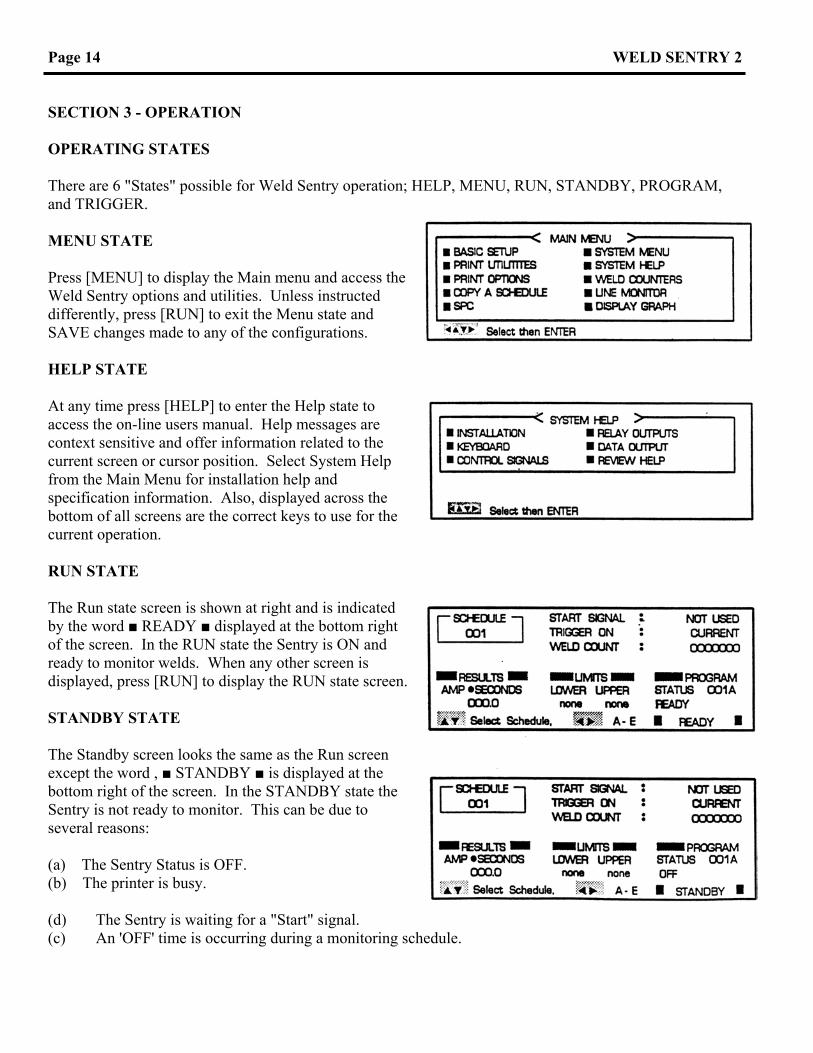
5. Connect the 3 wires to the terminal block mounted on the inside rear panel of the Sentry. Connect the green wire to ground. Refer to Figure 9 below. Connect the white and black wires to terminal 2 and 4, either wire can go to either terminal.
6. Attach the strain relief bushing to the cable and snap into the feed-through hole. The cable should fit snugly and not push or pull through the hole.
7. a. Connect the appropriate user-supplied power line plug to the opposite end of the cable. Plug into power line receptacle for the power line to be monitored., or
b. Connect the Line Voltage Cable wires directly to the power panel of the power line to be monitored.
8. Locate the line monitor jumper on the power supply PCB inside the Weld Sentry. Select the jumper position marked for the line voltage to be monitored.
9. Select Menu/Line Monitor and enter the correct nominal Line Voltage.
Figure 9 - Line Monitor connections on the inside rear panel of the Sentry. SET VOLUME ALARM - The audio level of the Sentry's beeper can be changed by adjusting the R8
potentiometer on the Power Supply Board. Refer to Drawing 4-32708. SET CONTRAST FOR DISPLAY SCREEN - The display contrast for the LCD screen can be
changed by adjusting the R2 potentiometer on the Power Supply Board. Refer to Drawing 4-32708.
Page 14 WELD SENTRY 2 SECTION 3 - OPERATION OPERATING STATES There are 6 "States" possible for Weld Sentry operation; HELP, MENU, RUN, STANDBY, PROGRAM, and TRIGGER. MENU STATE
Press [MENU] to display the Main menu and access the Weld Sentry options and utilities. Unless instructed differently, press [RUN] to exit the Menu state and SAVE changes made to any of the configurations. HELP STATE At any time press [HELP] to enter the Help state to access the on-line users manual. Help messages are context sensitive and offer information related to the current screen or cursor position. Select System Help from the Main Menu for installation help and specification information. Also, displayed across the bottom of all screens are the correct keys to use for the current operation. RUN STATE The Run state screen is shown at right and is indicated by the word READY displayed at the bottom right of the screen. In the RUN state the Sentry is ON and ready to monitor welds. When any other screen is displayed, press [RUN] to display the RUN state screen. STANDBY STATE The Standby screen looks the same as the Run screen except the word , STANDBY is displayed at the bottom right of the screen. In the STANDBY state the Sentry is not ready to monitor. This can be due to several reasons: (a) The Sentry Status is OFF. (b) The printer is busy. (d) The Sentry is waiting for a "Start" signal. (c) An 'OFF' time is occurring during a monitoring schedule.
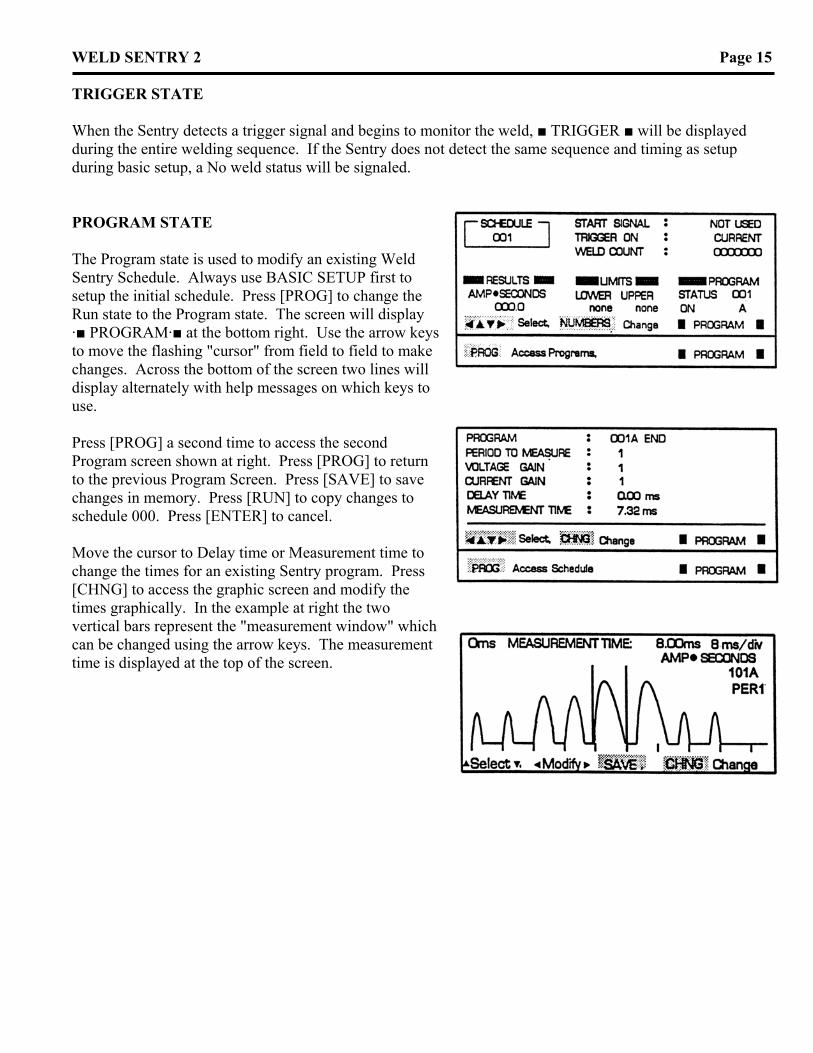
WELD SENTRY 2 Page 15 TRIGGER STATE When the Sentry detects a trigger signal and begins to monitor the weld, TRIGGER will be displayed during the entire welding sequence. If the Sentry does not detect the same sequence and timing as setup during basic setup, a No weld status will be signaled. PROGRAM STATE The Program state is used to modify an existing Weld Sentry Schedule. Always use BASIC SETUP first to setup the initial schedule. Press [PROG] to change the Run state to the Program state. The screen will display · PROGRAM· at the bottom right. Use the arrow keys to move the flashing "cursor" from field to field to make changes. Across the bottom of the screen two lines will display alternately with help messages on which keys to use. Press [PROG] a second time to access the second Program screen shown at right. Press [PROG] to return to the previous Program Screen. Press [SAVE] to save changes in memory. Press [RUN] to copy changes to schedule 000. Press [ENTER] to cancel. Move the cursor to Delay time or Measurement time to change the times for an existing Sentry program. Press [CHNG] to access the graphic screen and modify the times graphically. In the example at right the two vertical bars represent the "measurement window" which can be changed using the arrow keys. The measurement time is displayed at the top of the screen.
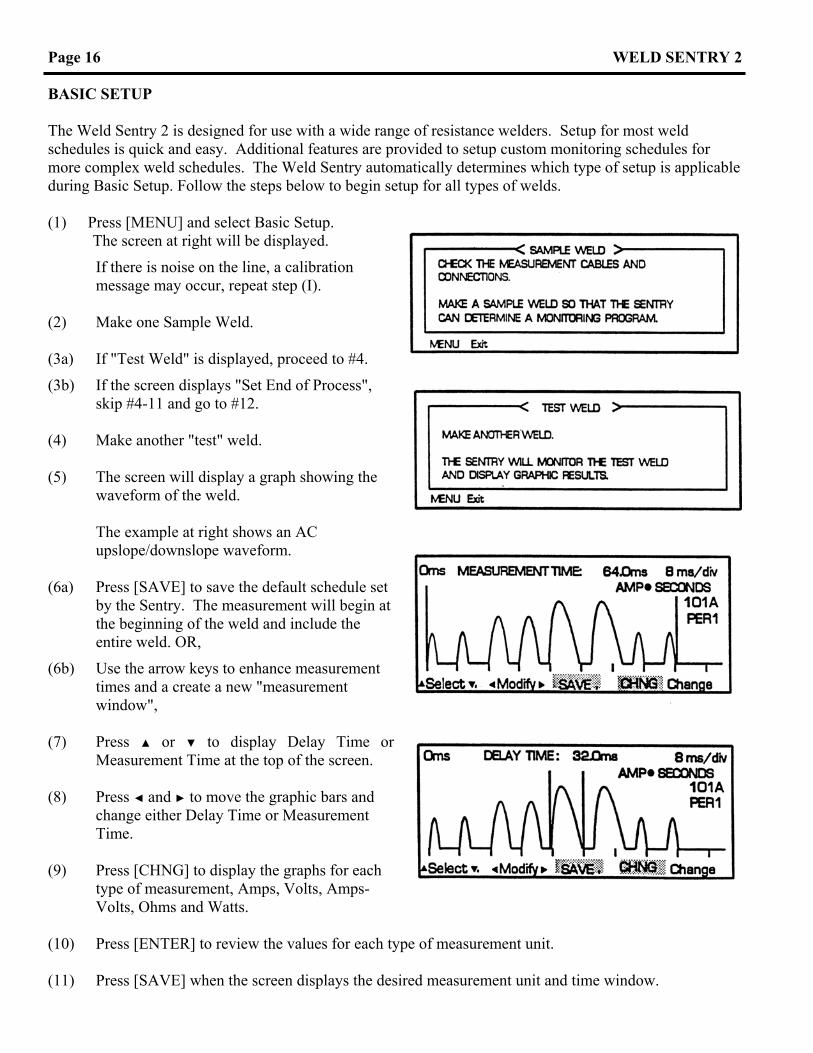
Page 16 WELD SENTRY 2 BASIC SETUP The Weld Sentry 2 is designed for use with a wide range of resistance welders. Setup for most weld schedules is quick and easy. Additional features are provided to setup custom monitoring schedules for more complex weld schedules. The Weld Sentry automatically determines which type of setup is applicable during Basic Setup. Follow the steps below to begin setup for all types of welds. (1) Press [MENU] and select Basic Setup. The screen at right will be displayed.
If there is noise on the line, a calibration message may occur, repeat step (I).
(2) Make one Sample Weld. (3a) If "Test Weld" is displayed, proceed to #4.
(3b) If the screen displays "Set End of Process", skip #4-11 and go to #12.
(4) Make another "test" weld. (5) The screen will display a graph showing the
waveform of the weld.
The example at right shows an AC upslope/downslope waveform.
(6a) Press [SAVE] to save the default schedule set
by the Sentry. The measurement will begin at the beginning of the weld and include the entire weld. OR,
(6b) Use the arrow keys to enhance measurement times and a create a new "measurement window",
(7) Press or to display Delay Time or Measurement Time at the top of the screen. (8) Press and to move the graphic bars and change either Delay Time or Measurement Time. (9) Press [CHNG] to display the graphs for each
type of measurement, Amps, Volts, Amps-Volts, Ohms and Watts.
(10) Press [ENTER] to review the values for each type of measurement unit. (11) Press [SAVE] when the screen displays the desired measurement unit and time window.
WELD SENTRY 2 Page 17
BASIC SETUP - SET END OF PROCESS
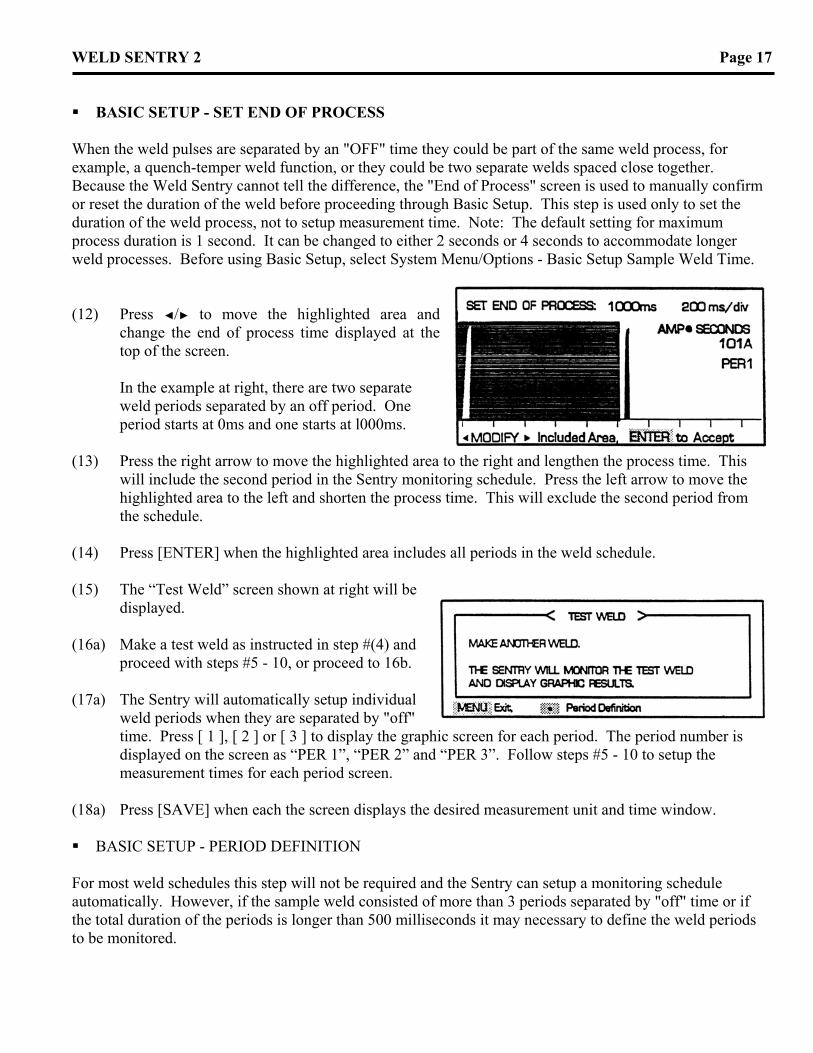
When the weld pulses are separated by an "OFF" time they could be part of the same weld process, for example, a quench-temper weld function, or they could be two separate welds spaced close together. Because the Weld Sentry cannot tell the difference, the "End of Process" screen is used to manually confirm or reset the duration of the weld before proceeding through Basic Setup. This step is used only to set the duration of the weld process, not to setup measurement time. Note: The default setting for maximum process duration is 1 second. It can be changed to either 2 seconds or 4 seconds to accommodate longer weld processes. Before using Basic Setup, select System Menu/Options - Basic Setup Sample Weld Time.
(12) Press / to move the highlighted area and
change the end of process time displayed at the top of the screen.
In the example at right, there are two separate weld periods separated by an off period. One period starts at 0ms and one starts at l000ms.
(13) Press the right arrow to move the highlighted area to the right and lengthen the process time. This
will include the second period in the Sentry monitoring schedule. Press the left arrow to move the highlighted area to the left and shorten the process time. This will exclude the second period from the schedule.
(14) Press [ENTER] when the highlighted area includes all periods in the weld schedule. (15) The “Test Weld” screen shown at right will be
displayed. (16a) Make a test weld as instructed in step #(4) and
proceed with steps #5 - 10, or proceed to 16b. (17a) The Sentry will automatically setup individual
weld periods when they are separated by "off" time. Press [ 1 ], [ 2 ] or [ 3 ] to display the graphic screen for each period. The period number is displayed on the screen as “PER 1”, “PER 2” and “PER 3”. Follow steps #5 - 10 to setup the measurement times for each period screen.
(18a) Press [SAVE] when each the screen displays the desired measurement unit and time window. BASIC SETUP - PERIOD DEFINITION
For most weld schedules this step will not be required and the Sentry can setup a monitoring schedule automatically. However, if the sample weld consisted of more than 3 periods separated by "off" time or if the total duration of the periods is longer than 500 milliseconds it may necessary to define the weld periods to be monitored.

Page 18 WELD SENTRY 2 (16b) When the "Test Weld" screen is displayed do not make another weld, instead, press the period on the
keypad. The "Period Definition" screen shown below will be displayed. (17b) Press [ 1 ], [ 2 ] or [ 3 ] to highlight and select
either the first weld period, the second weld period or the third weld period. In the example, the first period is selected and "Period 1” is displayed at top of screen.
(18b) Press [CHNG] to display the period "Start',
"Stop" and "End" time at top of screen and to select the flashing arrows under the highlighted period.
Note: The time between period "start" and period “stop” is the "acquisition' time for the period. The maximum total acquisition time for all 3 periods is 500 milliseconds. The time between period “stop” and period “end” is used to “filter” out noise and prevent re-triggering or false triggering, it is not included in the acquisition time and does not count against the 500 millisecond.
(19) Press / to move the ↑ arrow which is flashing and change the period start, stop or end times. This
does not set the actual measurement window, which is done in another step, however, it does set the maximum measurement times. When the measurement window is set, it can be no longer than the acquisition period.
Example, Weld Schedule longer than 500 ms (30 cycles): To measure the first 500ms, set "start" time at 0ms, stop time at 500ms and end time past the end of the weld cycles. If any weld cycles occur after "end" time, the Sentry will re-trigger. To measure the last 500ms, set "start" time 500ms before the end of the weld, "stop" time at the end of the weld. “End” time should be set at a time after the electrodes have lifted from the part to prevent any re-triggering.
(20) After the monitoring periods have been defined, press [ENTER] to accept the configuration. The
Test Weld Screen will be displayed. (21) Make a Test Weld as instructed in step #15. Setup the Measurement times and SAVE the Sentry
Schedule. CHANGING SENTRY PROGRAMS A-E
Each Sentry schedule may be setup to consist of up to 5 individual programs, A - E. For example, Schedule 001 could be setup to consist of Program 00lA, Program 00lB, Program 00lC, Program 001D and Program 001E. Each program can be setup to monitor any combination of weld periods, weld windows or measurement units.
MONITOR MULTIPLE MEASUREMENT UNITS
(1) First, setup and save a monitoring schedule using Basic Setup. (2) In the Run state, press [PROG] twice to display the Sentry Program screen as shown below. (3) Use the arrow keys and move the cursor to the right of Program 001A to END.

WELD SENTRY 2 Page 19 (4) Press [CHNG] to change END to a right arrow and add Program B which is a copy of Program A.
Program A will be used to monitor one measurement unit and Program B will be used to monitor another.
(5) Move the arrow to 00lB and press [PROG] to display the Schedule program screen shown at the
right. (6) Program B should be displayed at the right under Program 001. Move the cursor to the "A" and
press [CHNG] to display 'B'. (7) Move the cursor underneath "Results" and use [CHNG] to change to a different measurement unit. (8) Press [SAVE] to save the new Schedule with Programs A and B. (9) Repeat steps #2 - 8 to add additional Programs C, D and E. DISPLAY GRAPH OF LAST WELD
Every time a weld is monitored, the graphic information is held in memory until another weld is
made. (1) Press [MENU] and move the cursor to Display Graph. The screen shown below will be displayed. (2) Press [CLING] to display each of the graphs available;
Amps, Volts, Ohms, Watts and Amps-Volts. (3) Press [ENTER] to print the displayed graph to a serial
printer. (4) Time divisions are marked across the bottom of the
graph, the milliseconds per division is shown at the upper right, lms/div. (5) Press / to change the time divisions for a larger or smaller graph size. (6) Press / to move the graph to the left or right to view a lengthy graph. (7) The maximum scale of the graph is shown at the top, 10.00KAMPS, (determined by Gain Setting).
The Program number, 101A, and the Period number, PER1, are shown at the right.

Page 20 WELD SENTRY 2 PROGRAMMING MENU FEATURES PRINTER and COMPUTER OUTPUT (1) Select PRINT OPTIONS to configure the type of data output which will be transmitted to a printer
or computer through the RS232 port. Any data sent to a printer would also be sent to a computer. Note: Data transmission increases the time required for the Sentry to return to the Ready state to monitor the next weld. To increase the monitoring rate turn off unnecessary data output.
PRINT RESULTS FOR: Determines if data will be output automatically after each weld.
NONE: Turns off all data output after each weld. ALL WELDS: Data is output after every weld.
REJECT ONLY: Data is output only when the measurement results are Reject Hi or Reject Lo.
WHICH UNIT OF MEASURE: Determines which measurement units will be printed when
results are output. This selection is not applicable when "Print Results For:" is NONE.
ALL: Results of all 6 measurement units will be printed for each Program. If extended modes are ON, all 12 units will be printed. ONE SELECTED: Results for only the programmed measurement unit will be output.
PRINT GRAPHS: Determines if the Graphic data will be output along with the results. This selection is not applicable when "Print Results For:" is NONE.
NO: Turns off all graphic output after each weld. YES: A graph is output with each measurement result.
RAW DATA: The A/D value for each Voltage and Current sample will be output along with each result. See Section 4 - Specifications.
DATA FORMAT: Select either ASCII or Binary. Only applicable if RAW DATA is
selected.
EXPANSION SCALE: Determines the expansion scale for the graphic printouts and sets the milliseconds per division marked on the graph. The larger the scale the longer the graph.
x1: 10 milliseconds per division x5: 2 milliseconds per division x2: 5 milliseconds per division x10: l millisecond per division
PRINT SCHEDULES/PROGRAMS:
YES: Each time a Schedule or Program change is Saved, a summary printout will be printed automatically.
NO: Turns off the summary output. (2) Select PRINT UTILITIES to transmit data or graphs from memory.
PRINT GRAPH OF LAST WELD: Graphic data is always saved in memory until another weld is monitored. The type of graph printed will be the same type last selected for "Display Graph", Amps, Volts, Ohms, Watts or Amps-Volts.
WELD SENTRY 2 Page 21
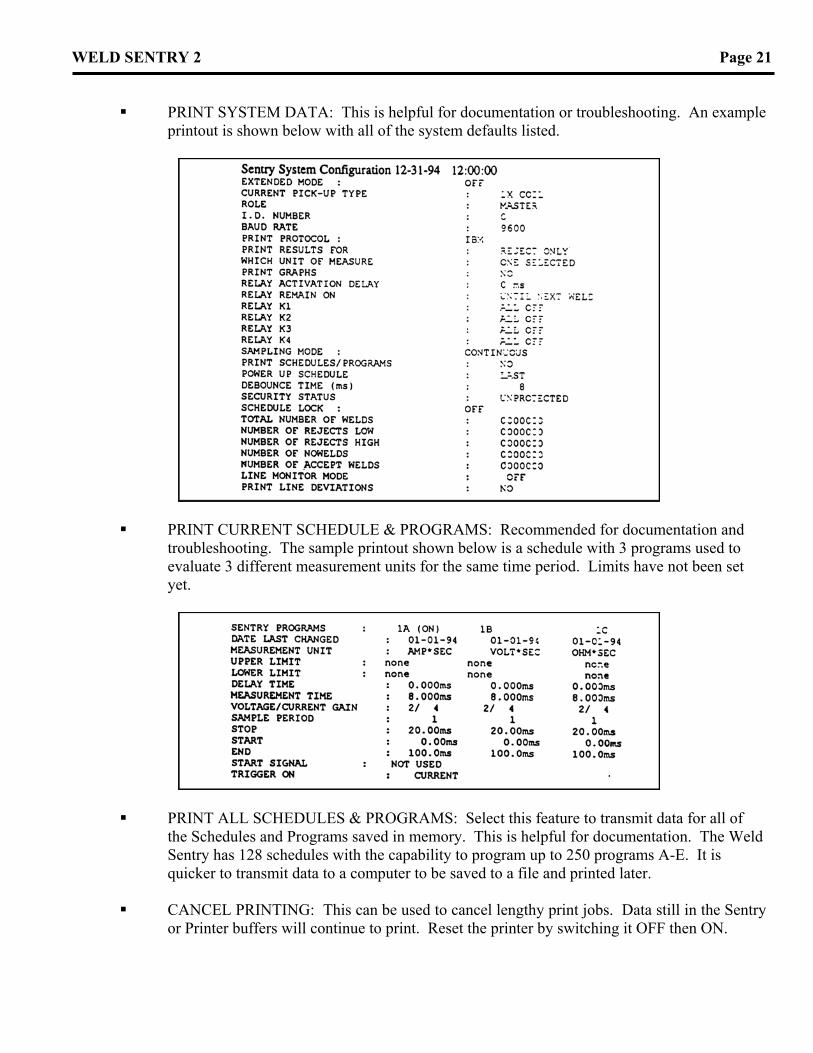
PRINT SYSTEM DATA: This is helpful for documentation or troubleshooting. An example printout is shown below with all of the system defaults listed.
PRINT CURRENT SCHEDULE & PROGRAMS: Recommended for documentation and troubleshooting. The sample printout shown below is a schedule with 3 programs used to evaluate 3 different measurement units for the same time period. Limits have not been set yet.
PRINT ALL SCHEDULES & PROGRAMS: Select this feature to transmit data for all of the Schedules and Programs saved in memory. This is helpful for documentation. The Weld Sentry has 128 schedules with the capability to program up to 250 programs A-E. It is quicker to transmit data to a computer to be saved to a file and printed later.
CANCEL PRINTING: This can be used to cancel lengthy print jobs. Data still in the Sentry
or Printer buffers will continue to print. Reset the printer by switching it OFF then ON.

Page 22 WELD SENTRY 2 COPYING SCHEDULES AND PROGRAMS COPY A SCHEDULE - Select this feature from the Main Menu to transfer all of the information
from one schedule to another. All associated programs and limits will be copied also. This is recommended for any schedules developed in Schedule 0. Schedule 0 is a designed to be used as a scratchpad and can inadvertently be replaced at any time.
USING WELD COUNTERS WELD COUNTERS - Select this feature from the Main Menu to access the weld counter screen
shown below.
TOTAL NUMBER OF WELDS increments each time the Sentry is triggered to evaluate a weld regardless of which schedule is selected. “Total Welds” corresponds to “Weld Count” which is displayed on the Run state screen. To reset, enter 0 or any number up to 9999999. It may be desired to enter an existing weld count to coordinate the Sentry with the welder. Or, it may be helpful to reset Total Welds to zero at the same time that SPC history is reset, so that the weld counts will match.
REJECT HI or REJECT LOW will increment once if any or all of the Programs A-E are evaluated as a "Reject Hi" or "Reject Lo".
NOWELD will be incremented only for "No Welds" which are due to a "missing weld" (no current flow). "No Welds" which are caused by an in-complete weld sequence are not counted by the NO WELD counter and are not counted in the Weld Count.
ACCEPT is incremented for all welds which are not counted as Reject Hi or Low and are not counted as No Weld.
Total Welds is equal to Accept + No Weld + Reject Hi + Reject Low.

WELD SENTRY 2 Page 23 PROGRAMMING THE LINE MON'ITOR LINE MONITOR: Select this feature from the Main Menu to setup the Sentry to monitor an
external Power Line. Refer to Section 2 - Installation and Section 4 - Specifications.
The Line Monitor screen is shown below. If no voltage is sensed at the Line Monitor input on the rear panel, an error message will flash at the bottom. “No Line Monitor Input” and the Line Monitor Mode cannot be changed.
NOMINAL LINE - This is the specified line voltage of the power line connected to the line monitor input on the rear panel of the Sentry. Refer to Section 2 - Installation.
ACTUAL LINE - The result of the power line voltage measured by the Weld Sentry.
LINE MONITOR MODE - Defines the way the line monitor operates.
STOP will cause the sentry to assert a "line out of limit" status alarm. This status alarm will be canceled by pressing [RUN]. The Sentry cannot monitor while this status alarm is active. When the relay output is set for line stop: yes, the relay will also stay closed while the status alarm is active.
DYNAMIC will cause the alarms and the relay to stay closed until the line remains within limits for the set number of cycles (restart time).
ALARM ONLY will cause the alarm to sound and “Line Voltage is Outside of Limits” will be displayed at the bottom of the screen. The alarm condition will clear immediately when the line returns within limits. If the out of limits time is very short, the relay signal may be too short to be recognized.
OFF will disable the line monitor. However, if "Print Deviations" is YES, power line deviations will still print. Note: An incoming power line must be connected at the rear panel of the sentry and line monitor jumper, E2, on the control board must be set in the correct position.
UPPER/LOWER LINE LIMITS - When the line voltage is above the upper line limit or below the lower line limit, an alarm condition will signal depending on the mode selected. These limits are separate from the Upper and Lower Limits programmed for each Sentry Schedule. One set of Line Limits is in effect for all Schedules.
DYNAMIC RESTART -Applicable only when the line monitor mode is "Dynamic".
The line voltage must remain inside the upper and lower limits for this many cycles before the sentry will reset the line deviation alarm condition. The alarm can be cleared manually before the end of the restart time by pressing [RUN].
PRINT DEVIATIONS - Prints the power line deviations which occur when the Sentry is not actively monitoring a weld. Information printed includes: date & time, number of cycles outside line limits and maximum or minimum line voltage (extreme point).

Page 24 WELD SENTRY 2 SYSTEM MENU - SETUP SYSTEM CONFIGURATION (1) Press [MENU] and move the cursor to SYSTEM MENU. Press [ENTER] to display the menu
shown at the right.
(2) Select SYSTEM SETUP to confirm or change the settings listed below. Default settings are listed first.
EXTENDED MODE - selects the measurement units available for monitoring.
OFF: AmpSeconds, VoltSeconds, OhmSeconds, WattSeconds, (Amp-Volt)Seconds, RMS Amps. ON: Adds; Peak Volts, Peak Amps, Peak Watts, Amp2
Seconds, Volt2Seconds, Ohm@Peak.
CURRENT PICKUP TYPE - selects the method used to measure current.
COIL: 1x Coil, standard, has a range of 150 to 100,000 Amps peak. 10x Coil, optional, has a range of 15 to 10,000 Amps peak.
SHUNT: Not included with Sentry, must be supplied by user. Resistance Values: 10mΩ, 1mΩ, 0.1mΩ, or 0.01mΩ
(3) Select OPTIONS from the Menu to configure the System Options listed below.
POWER UP SCHEDULE - determines which schedule will be displayed each time the unit is turned ON. LAST: the last schedule used before it was turned off. SCHEDULE #: any schedule number can be entered and it will be used on power up.
DISPLAY POLARITY MARKS - ON will display the ± polarity marks on graphics of weld pulses.
BASIC SETUP SAMPLE WELD TIME - 1 second, 2 seconds, 4 seconds Sets the maximum time allowed for a sample weld including all off times and hold times. This sets the time scale for the "End of Process Screen". Default is 1 second.
START SIGNAL DEBOUNCE TIME - 0 milliseconds, 8 milliseconds, 16 milliseconds, 30 milliseconds Refers to the "start signal" displayed on the Run screen. Debounce time is not applicable if the start signal is not used. If it is being used refer to Specifications - Start Signal.
(4) Select SET TIME & DATE to set time in 24 hour format and date in MO-DA-YR format.
(5) Select COMMUNICATIONS from the System Menu to configure the following:
ROLE - Master is the default and is used in most applications. Slave is used only with two-way communications with a host computer.
I.D. NUMBER - Any 3 digit number can be entered. Used with the communications interface.
BAUD RATE - 9600/4800/2400/1200 - determines data transmission speed. Must be set the same as the printer or computer. Default is 9600 baud which is used with the Kodak serial printer.
PRINT PROTOCOL - IBM/EPSON - determines the configuration of the data sent to printer or computer. Default is IBM which is used with the Kodak serial printer and most IBM type computers.
WELD SENTRY 2 Page 25
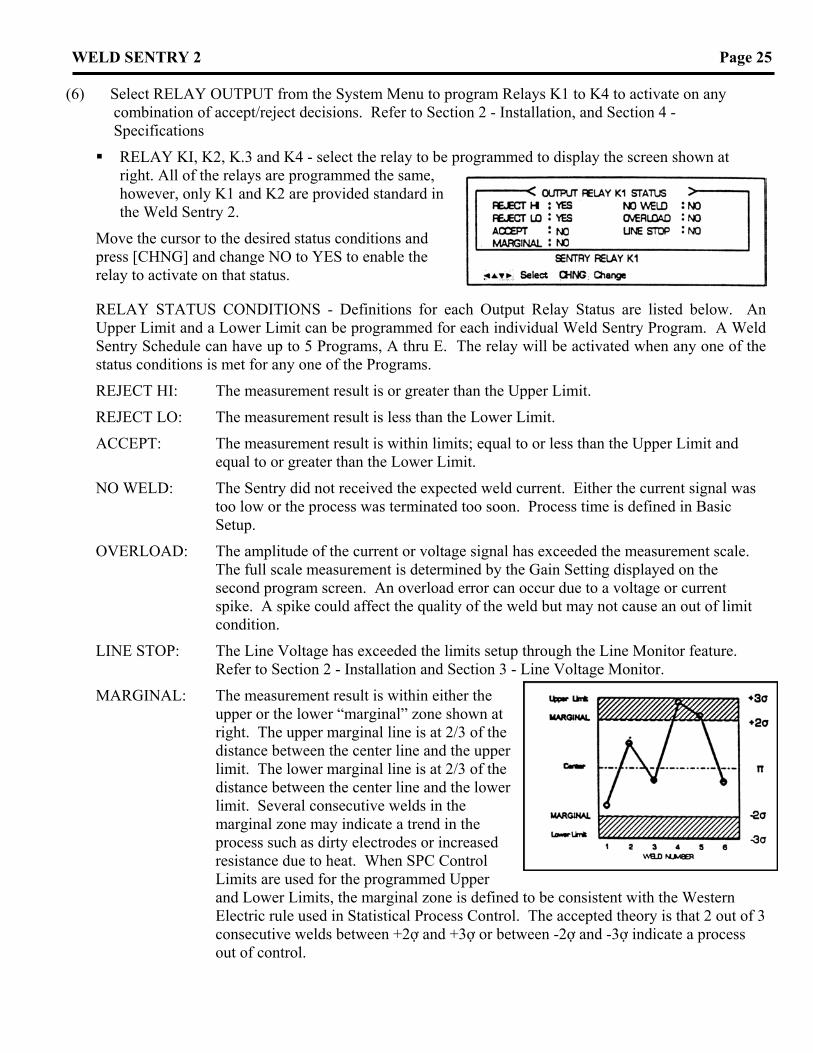
(6) Select RELAY OUTPUT from the System Menu to program Relays K1 to K4 to activate on any combination of accept/reject decisions. Refer to Section 2 - Installation, and Section 4 - Specifications
RELAY KI, K2, K.3 and K4 - select the relay to be programmed to display the screen shown at right. All of the relays are programmed the same, however, only K1 and K2 are provided standard in the Weld Sentry 2.
Move the cursor to the desired status conditions and press [CHNG] and change NO to YES to enable the relay to activate on that status.
RELAY STATUS CONDITIONS - Definitions for each Output Relay Status are listed below. An Upper Limit and a Lower Limit can be programmed for each individual Weld Sentry Program. A Weld Sentry Schedule can have up to 5 Programs, A thru E. The relay will be activated when any one of the status conditions is met for any one of the Programs.
REJECT HI: The measurement result is or greater than the Upper Limit.
REJECT LO: The measurement result is less than the Lower Limit.
ACCEPT: The measurement result is within limits; equal to or less than the Upper Limit and equal to or greater than the Lower Limit.
NO WELD: The Sentry did not received the expected weld current. Either the current signal was too low or the process was terminated too soon. Process time is defined in Basic Setup.
OVERLOAD: The amplitude of the current or voltage signal has exceeded the measurement scale. The full scale measurement is determined by the Gain Setting displayed on the second program screen. An overload error can occur due to a voltage or current spike. A spike could affect the quality of the weld but may not cause an out of limit condition.
LINE STOP: The Line Voltage has exceeded the limits setup through the Line Monitor feature. Refer to Section 2 - Installation and Section 3 - Line Voltage Monitor.
MARGINAL: The measurement result is within either the upper or the lower “marginal” zone shown at right. The upper marginal line is at 2/3 of the distance between the center line and the upper limit. The lower marginal line is at 2/3 of the distance between the center line and the lower limit. Several consecutive welds in the marginal zone may indicate a trend in the process such as dirty electrodes or increased resistance due to heat. When SPC Control Limits are used for the programmed Upper and Lower Limits, the marginal zone is defined to be consistent with the Western Electric rule used in Statistical Process Control. The accepted theory is that 2 out of 3 consecutive welds between +2ợ and +3ợ or between -2ợ and -3ợ indicate a process out of control.
Page 26 WELD SENTRY 2 (7) Select SYSTEM MENU/RESET TO DEFAULTS to reset the Weld Sentry to factory settings. RESET SYSTEM PARAMETERS - will reset all of the Menu selections and Options to the default
settings. Schedules and Programs will not be affected. RESET ALL SCHEDULES/PROGRAMS - will reset all of the Sentry Schedule information
including Programs A- E on the second program screen. System Parameters will not be affected.
Move the cursor to Reset System Parameters and press [ENTER]. The following will be displayed:
To confirm your selection, press [CHNG] to display YES and press [ENTER] to accept. The Sentry will beep and display "SYSTEM PARAMETERS ARE RESET" across the bottom. If desired, move the cursor to reset Schedules or press [RUN] to leave the screen.
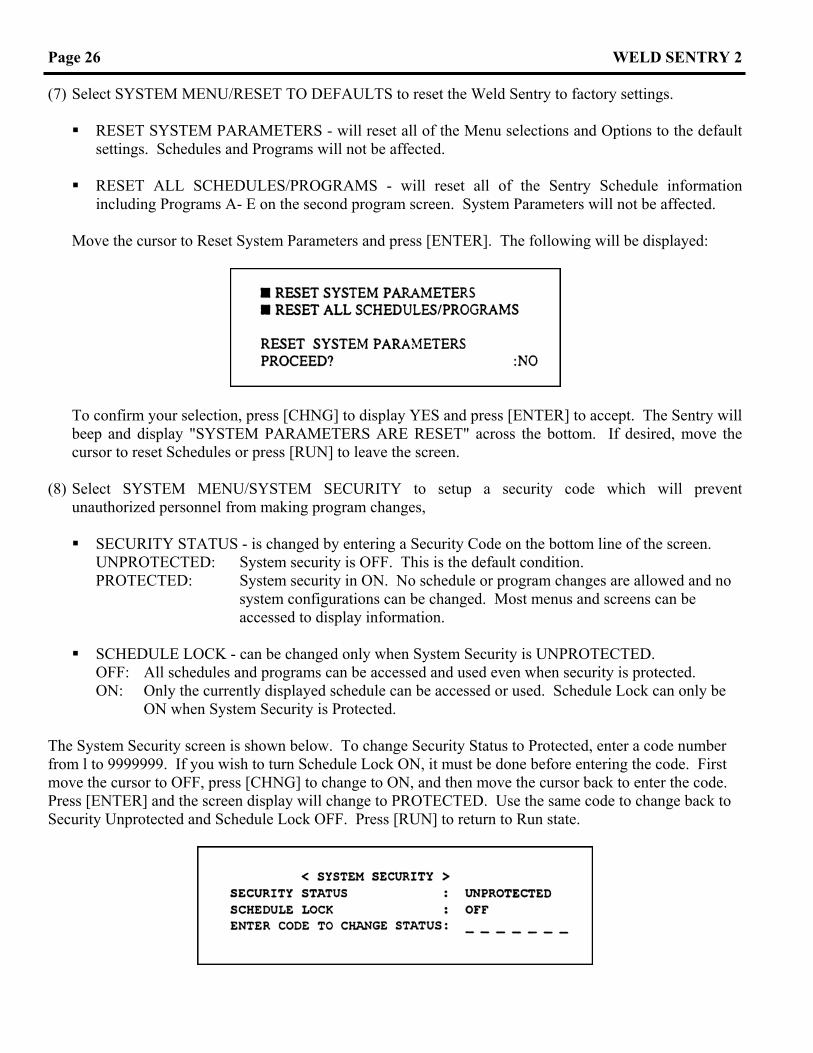
(8) Select SYSTEM MENU/SYSTEM SECURITY to setup a security code which will prevent
unauthorized personnel from making program changes, SECURITY STATUS - is changed by entering a Security Code on the bottom line of the screen.
UNPROTECTED: System security is OFF. This is the default condition. PROTECTED: System security in ON. No schedule or program changes are allowed and no
system configurations can be changed. Most menus and screens can be accessed to display information.
SCHEDULE LOCK - can be changed only when System Security is UNPROTECTED.
OFF: All schedules and programs can be accessed and used even when security is protected. ON: Only the currently displayed schedule can be accessed or used. Schedule Lock can only be
ON when System Security is Protected. The System Security screen is shown below. To change Security Status to Protected, enter a code number from l to 9999999. If you wish to turn Schedule Lock ON, it must be done before entering the code. First move the cursor to OFF, press [CHNG] to change to ON, and then move the cursor back to enter the code. Press [ENTER] and the screen display will change to PROTECTED. Use the same code to change back to Security Unprotected and Schedule Lock OFF. Press [RUN] to return to Run state.
WELD SENTRY 2 Page 27 COLLECTING WELD DATA The objective in using the Weld Sentry is to obtain a measured value from weld voltage and weld current which will alert the user to a change in the weld process. If the process is stable, or "in control", the weld quality will be consistent and repeatable, with consistent and repeatable measurement results. A variation in the process which causes unacceptable weld quality should also cause the Sentry measurement results to change. The Weld Sentry is used in four different stages:
1) Evaluation: determine if the process is stable, use SPC tools. 2) Setup: establish a measurement range for acceptable welds, set Upper/Lower Limits. 3) Verification: document that the process remains stable, save results using Data Collection. 4) Monitor: signal when results fall outside the acceptable range, use Alarms and Relays.
An important point in the evaluation and setup process is that only "good" welds should be included initially. Each weld process is unique and there is no pre-defined range for the Sentry measurement values. Unlike quality criteria such as pull strength or shear strength, there are no specification limits for the Sentry. The limits must be developed during the evaluation stage by correlating a range of Sentry results with a range of "good" welds. After an acceptable range is established, identify the variables which cause problems in your process. Simulate the specific conditions which are causing problems and collect data on "bad" welds. The measurement values for "bad" welds should fall outside the range set by "good" welds. Then, you can program trial Upper and Lower reject limits.
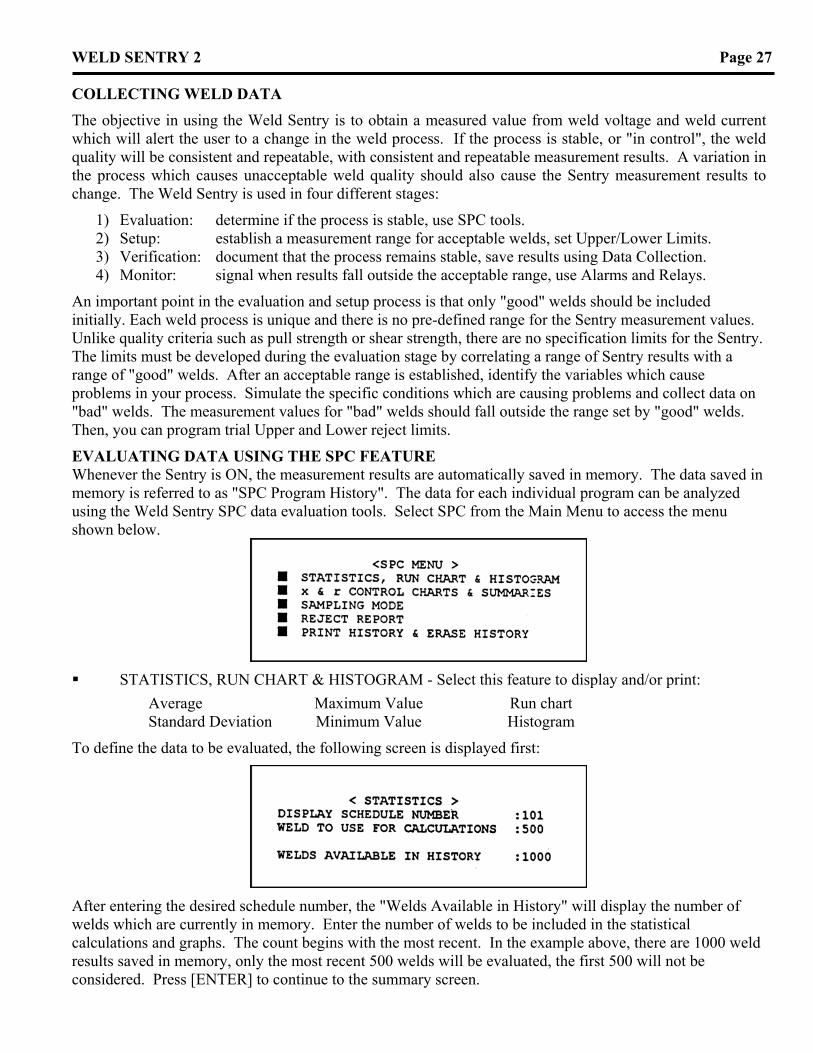
EVALUATING DATA USING THE SPC FEATURE Whenever the Sentry is ON, the measurement results are automatically saved in memory. The data saved in memory is referred to as "SPC Program History". The data for each individual program can be analyzed using the Weld Sentry SPC data evaluation tools. Select SPC from the Main Menu to access the menu shown below.
STATISTICS, RUN CHART & HISTOGRAM - Select this feature to display and/or print:
Average Maximum Value Run chart Standard Deviation Minimum Value Histogram
To define the data to be evaluated, the following screen is displayed first:
After entering the desired schedule number, the "Welds Available in History" will display the number of welds which are currently in memory. Enter the number of welds to be included in the statistical calculations and graphs. The count begins with the most recent. In the example above, there are 1000 weld results saved in memory, only the most recent 500 welds will be evaluated, the first 500 will not be considered. Press [ENTER] to continue to the summary screen.
Page 28 WELD SENTRY 2
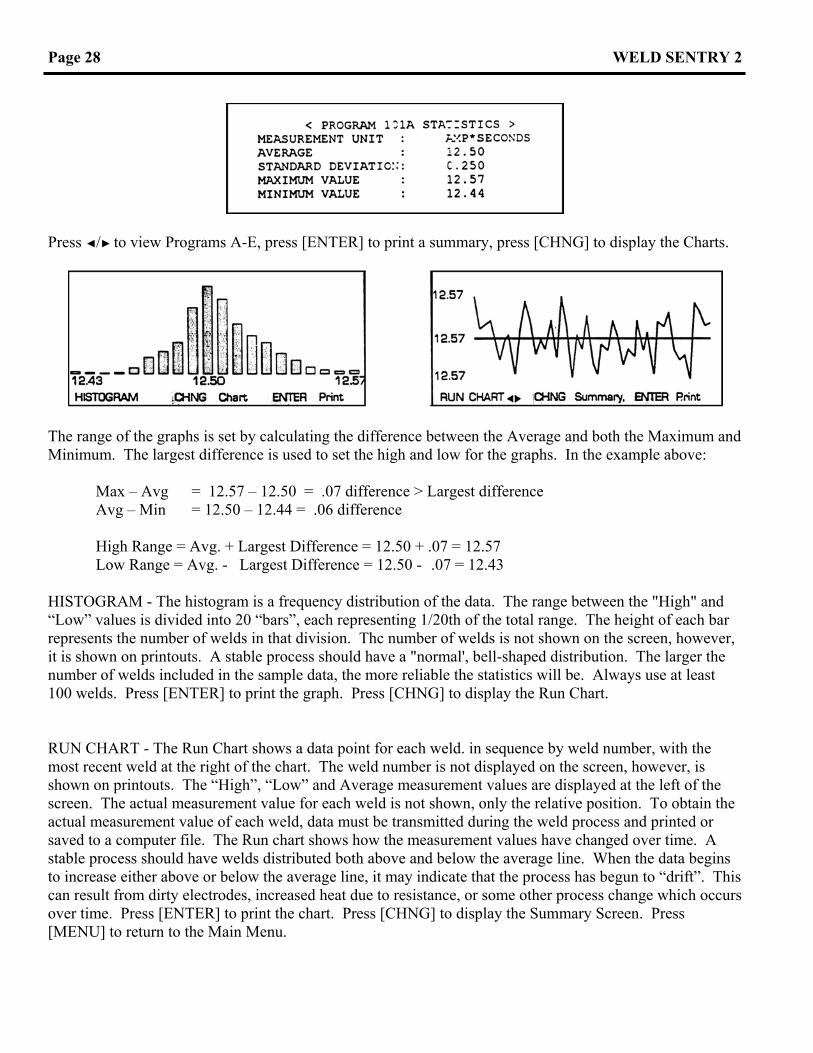
Press / to view Programs A-E, press [ENTER] to print a summary, press [CHNG] to display the Charts.
The range of the graphs is set by calculating the difference between the Average and both the Maximum and Minimum. The largest difference is used to set the high and low for the graphs. In the example above: Max – Avg = 12.57 – 12.50 = .07 difference > Largest difference Avg – Min = 12.50 – 12.44 = .06 difference High Range = Avg. + Largest Difference = 12.50 + .07 = 12.57 Low Range = Avg. - Largest Difference = 12.50 - .07 = 12.43 HISTOGRAM - The histogram is a frequency distribution of the data. The range between the "High" and “Low” values is divided into 20 “bars”, each representing 1/20th of the total range. The height of each bar represents the number of welds in that division. Thc number of welds is not shown on the screen, however, it is shown on printouts. A stable process should have a "normal', bell-shaped distribution. The larger the number of welds included in the sample data, the more reliable the statistics will be. Always use at least 100 welds. Press [ENTER] to print the graph. Press [CHNG] to display the Run Chart. RUN CHART - The Run Chart shows a data point for each weld. in sequence by weld number, with the most recent weld at the right of the chart. The weld number is not displayed on the screen, however, is shown on printouts. The “High”, “Low” and Average measurement values are displayed at the left of the screen. The actual measurement value for each weld is not shown, only the relative position. To obtain the actual measurement value of each weld, data must be transmitted during the weld process and printed or saved to a computer file. The Run chart shows how the measurement values have changed over time. A stable process should have welds distributed both above and below the average line. When the data begins to increase either above or below the average line, it may indicate that the process has begun to “drift”. This can result from dirty electrodes, increased heat due to resistance, or some other process change which occurs over time. Press [ENTER] to print the chart. Press [CHNG] to display the Summary Screen. Press [MENU] to return to the Main Menu.

WELD SENTRY 2 Page 29 X & R CONTROL CHARTS & SUMMARIES - Select this feature from the SPC menu to calculate,
and display or print, Statistical Process Control (SPC) information for any program with data in memory.
To define the data to be evaluated, the following screen is displayed first:
This screen is also used to access the R Control Chart. To change to the R Chart, move the cursor up to the "X" field and press [CHNG] . The title line will change to R (Range) Control Chart. After entering the desired schedule number, the "Welds Available in History" line will show the number of welds which are currently in memory. Enter the number of welds to be included in the SPC calculations and charts. The count begins with the most recent. In the example above, only the most recent 600 welds will be evaluated, the first 400 will not be considered. Then. move the cursor to "Sub Group Sample Size". SUBGROUPS - It is typical in SPC to evaluate sample data in groups to calculate an average and a range for each group. This produces more statistically reliable results. In the illustration below, data is grouped into sub groups of 3 welds each. To continue the groupings, sub group #4 would consist of welds 10, 11 & 12. When the "Sampling Period" is CONTINUOUS, weld data is grouped in this way "continuously" until the total 600 "Welds to use for Calculations" is reached. This would result in a total of 200 sub groups whose "Sub Group Sample Size" is 3. Refer to the section on SAMPLING MODE, if the sampling period is PERIODIC.
Enter a "Sub Group Sample Size" from 2 to 25. Press [ENTER] to continue to the summary screen.
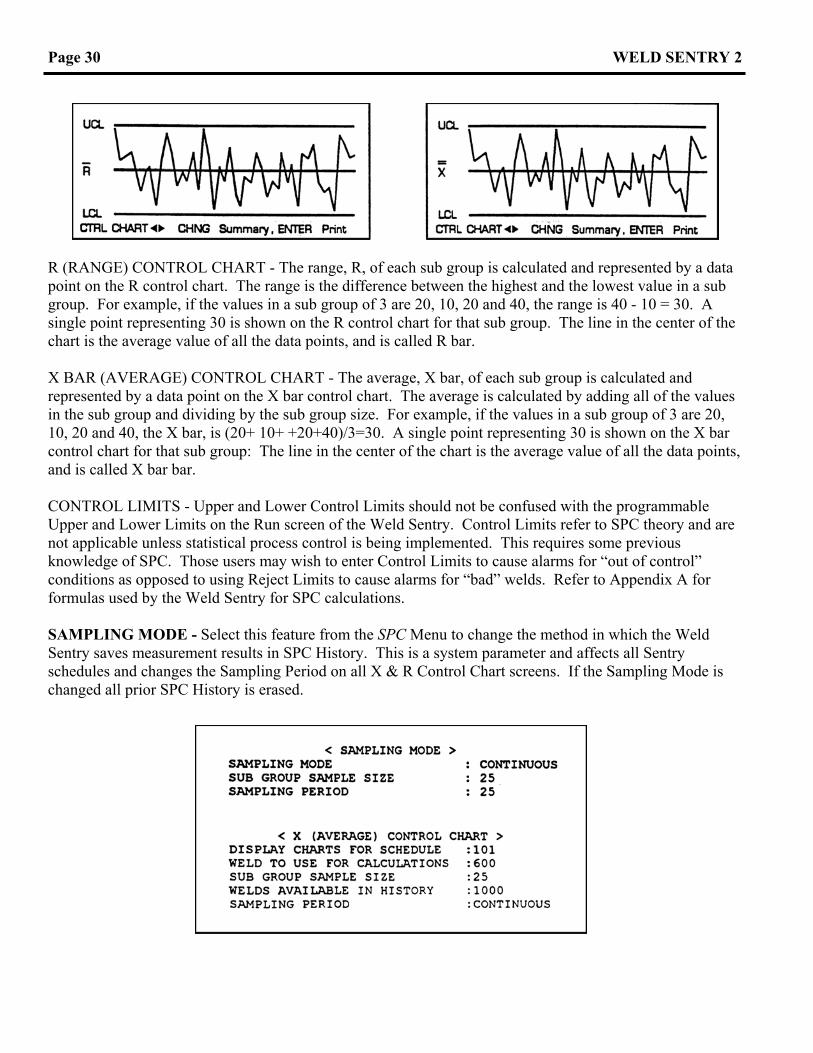
If the R Chart were selected, the screen would display “Average R” in place of "Average X". Press / to access the summary screen for any of the other Programs A-E for the current schedule. Press [ENTER] to print the summary screen. Press [CHNG] to continue to the X bar or R Chart. R CHART X BAR CHART
Page 30 WELD SENTRY 2
R (RANGE) CONTROL CHART - The range, R, of each sub group is calculated and represented by a data point on the R control chart. The range is the difference between the highest and the lowest value in a sub group. For example, if the values in a sub group of 3 are 20, 10, 20 and 40, the range is 40 - 10 = 30. A single point representing 30 is shown on the R control chart for that sub group. The line in the center of the chart is the average value of all the data points, and is called R bar. X BAR (AVERAGE) CONTROL CHART - The average, X bar, of each sub group is calculated and represented by a data point on the X bar control chart. The average is calculated by adding all of the values in the sub group and dividing by the sub group size. For example, if the values in a sub group of 3 are 20, 10, 20 and 40, the X bar, is (20+ 10+ +20+40)/3=30. A single point representing 30 is shown on the X bar control chart for that sub group: The line in the center of the chart is the average value of all the data points, and is called X bar bar. CONTROL LIMITS - Upper and Lower Control Limits should not be confused with the programmable Upper and Lower Limits on the Run screen of the Weld Sentry. Control Limits refer to SPC theory and are not applicable unless statistical process control is being implemented. This requires some previous knowledge of SPC. Those users may wish to enter Control Limits to cause alarms for “out of control” conditions as opposed to using Reject Limits to cause alarms for “bad” welds. Refer to Appendix A for formulas used by the Weld Sentry for SPC calculations. SAMPLING MODE - Select this feature from the SPC Menu to change the method in which the Weld Sentry saves measurement results in SPC History. This is a system parameter and affects all Sentry schedules and changes the Sampling Period on all X & R Control Chart screens. If the Sampling Mode is changed all prior SPC History is erased.
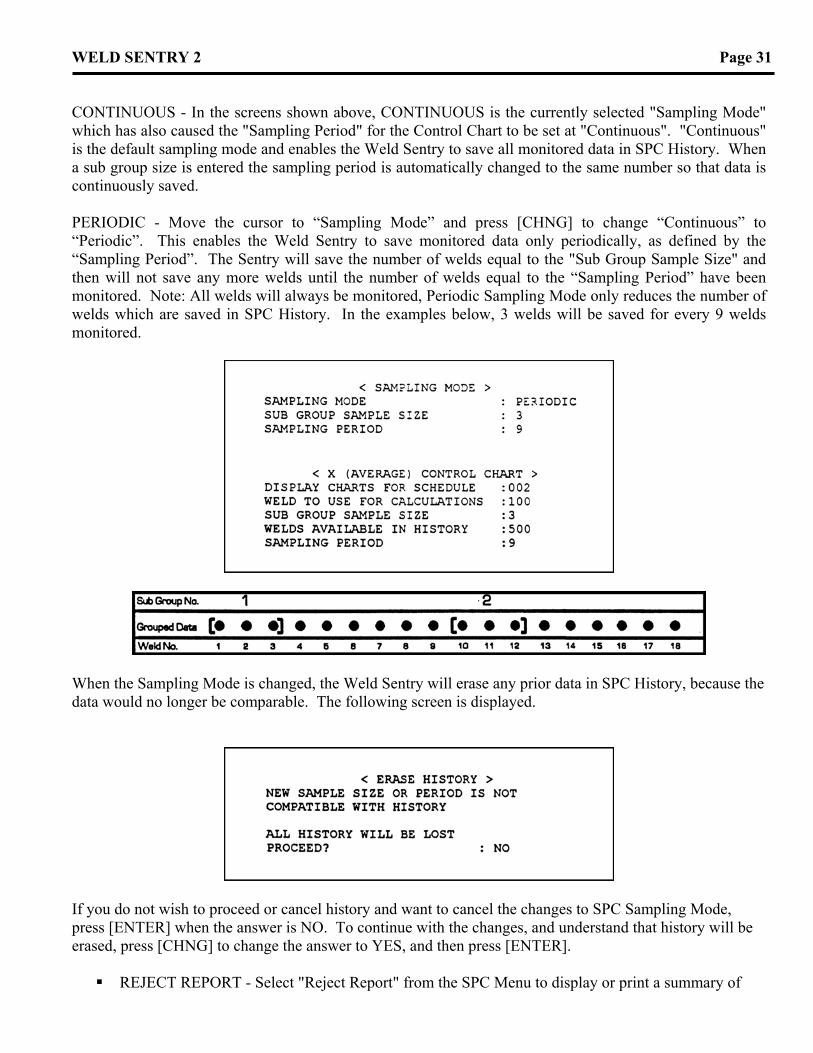
WELD SENTRY 2 Page 31 CONTINUOUS - In the screens shown above, CONTINUOUS is the currently selected "Sampling Mode" which has also caused the "Sampling Period" for the Control Chart to be set at "Continuous". "Continuous" is the default sampling mode and enables the Weld Sentry to save all monitored data in SPC History. When a sub group size is entered the sampling period is automatically changed to the same number so that data is continuously saved. PERIODIC - Move the cursor to “Sampling Mode” and press [CHNG] to change “Continuous” to “Periodic”. This enables the Weld Sentry to save monitored data only periodically, as defined by the “Sampling Period”. The Sentry will save the number of welds equal to the "Sub Group Sample Size" and then will not save any more welds until the number of welds equal to the “Sampling Period” have been monitored. Note: All welds will always be monitored, Periodic Sampling Mode only reduces the number of welds which are saved in SPC History. In the examples below, 3 welds will be saved for every 9 welds monitored.
When the Sampling Mode is changed, the Weld Sentry will erase any prior data in SPC History, because the data would no longer be comparable. The following screen is displayed.
If you do not wish to proceed or cancel history and want to cancel the changes to SPC Sampling Mode, press [ENTER] when the answer is NO. To continue with the changes, and understand that history will be erased, press [CHNG] to change the answer to YES, and then press [ENTER]. REJECT REPORT - Select "Reject Report" from the SPC Menu to display or print a summary of

Page 32 WELD SENTRY 2
weld counts from SPC Program History. Enter a Schedule number to display the summary screen.
Press [ENTER] to print the Reject Report. Press / to display Reject Reports for any other Programs A-E. Note: The SPC weld count is different than the system Weld Counters or Weld Count on the Run screen. Those counters increment whenever any weld is monitored for any Schedule. The SPC weld count includes only the welds counted in SPC History for an individual program. When collecting data, it may be helpful to both reset the system weld counters and erase SPC history to coordinate the system and program counts. TOTAL WELDS: Total number of welds saved in Program History. Total Welds = 100%. ACCEPT COUNT: Number of welds which are inside the programmed Upper and Lower Limits.
% = Accept Count ÷ Total Welds REJECT HIGH: Number of welds which were higher than the programmed Upper Limit.
% = Reject High ÷ Total Welds REJECT LOW: Number of welds which were lower higher than the programmed Upper Limit.
% = Reject Low ÷ Total Welds

WELD SENTRY 2 Page 33
SECTION 4 - SPECIFICATIONS VOLTAGE INPUTS
The Weld Voltage measurement range is 0.10 to 40 volts peak. The pickup cable (4-32409-01) is a 7 foot (2.1 m) shielded cable assembly with a 3-pin plug (520-110) on one end which mates with a 3-pin receptacle (550-070) mounted on the rear panel of the Sentry. The two pickup leads end in alligator clips, black for negative and red for positive.
CURRENT INPUTS
The Weld Current measurement range is 15 to 100,000 amps peak depending on the type of current pickup which is used. Current can be measured using either a magnetic induction current coil or a user-supplied current shunt.
CURRENT COIL - The current coil has a 6 foot (l.8m) cable with a 2-pin plug (520-1-109) on one end which plugs into a 2-pin receptacle (550-1-069) mounted on the rear panel of the Sentry. The Weld Sentry is supplied with a 1x current coil (10-309-01) with a current measurement range of 150 to 100,000 peak Amps. A 10x current coil (10-310-01) is available which is 10 times more sensitive and has a current measurement range of 15 to 10,000 peak Amps.
CURRENT SHUNT - A user-supplied current shunt can be connected directly in series with the weld current path. The voltage caused by the weld current passing through the shunt is measured using the Current Shunt Pick Up Cable (32410-01) provided with the Weld Sentry. The shunt resistance values which can be used with the Sentry are: 10, 1, 0.1 and 0.01 milliohms. The corresponding voltage input range is 0.10 to 40 volts peak. The current measurement is calculated by the Sentry using the voltage measurement and the resistance value of the shunt (I=V+R). Theoretically, up to 400,00A could be measured, however, due to power losses this would not be practical. A current shunt will cause additional resistance in the weld loop which should be kept as small as possible. If there are excessive variations in resistance due to cable or shunt heating, the monitoring process will be ineffective.
TRIGGER INPUTS
The Weld Sentry can be setup to start the monitoring process on either the Weld Voltage or the Weld Current. The signal required to trigger the process is between 5% and 10% of full scale relative to the gain setting used. It is possible for a "false" trigger to occur due to transient voltage in the weld loop or inductance caused by other equipment. During Basic Setup the Weld Sentry checks the inputs and automatically sets the optimum Trigger. For electrically “noisy” environments a Start Signal should be used.
START SIGNAL
The start signal is an additional input which is used to signal the Sentry to expect a trigger signal momentarily. The Sentry remains on “Standby” ignoring all signals until the Start Signal is recognized. The Sentry can be programmed for a dry contact closure (open or closed) or a + 5V logic level (high or low). The cable used is an optional accessory, catalog number WSTC (10-308-01) which plugs into the rear panel of the Sentry.
MEASUREMENT ACCURACY
The voltage and current signals are measured using a microprocessor based 8 bit, analog-to-digital converter. The absolute accuracy of the measurements is 2% of reading, with a minimum of ± 0.5% of full scale for the specific selected measurement range. The repeatability is better than ± 0.5% of full scale for the specific selected measurement range.
Page 34 WELD SENTRY 2 SAMPLING RATE
One voltage and current measurement is "sampled" every 40 microseconds during the programmed acquisition period. This corresponds to a sampling rate of 25,000 samples per second, or 25KHz. The sample data is used as calculations for measurement units. ACQUISITION TIME
The maximum allowed acquisition time is 500 milliseconds. The time during the weld when the Sentry is actively collecting measurement data is called the acquisition period. The acquisition period is defined by a "start" time and a “stop” time referenced from the trigger. A total of 3 separate acquisition periods can be defined for a schedule, however, the total time cannot exceed 500ms. MEASUREMENT TIME
The maximum allowed measurement time is 500 milliseconds. The time during the acquisition period for which the Sentry calculates measurement results is called the measurement window. The Measurement Window is defined by a "delay time" and a "measurement time" beginning at the start of an acquisition period. The measurement window must be equal to or smaller than the acquisition period. MONITORING RATE
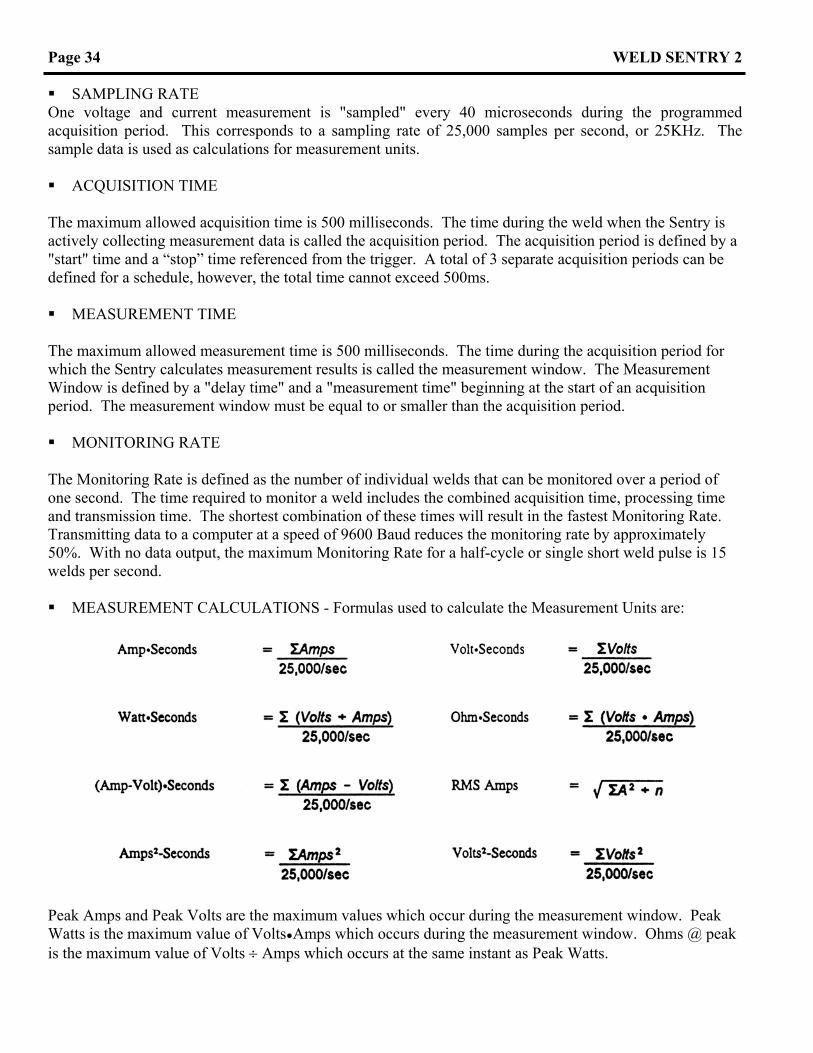
The Monitoring Rate is defined as the number of individual welds that can be monitored over a period of one second. The time required to monitor a weld includes the combined acquisition time, processing time and transmission time. The shortest combination of these times will result in the fastest Monitoring Rate. Transmitting data to a computer at a speed of 9600 Baud reduces the monitoring rate by approximately 50%. With no data output, the maximum Monitoring Rate for a half-cycle or single short weld pulse is 15 welds per second. MEASUREMENT CALCULATIONS - Formulas used to calculate the Measurement Units are:
Peak Amps and Peak Volts are the maximum values which occur during the measurement window. Peak Watts is the maximum value of VoltsAmps which occurs during the measurement window. Ohms @ peak is the maximum value of Volts ÷ Amps which occurs at the same instant as Peak Watts.
WELD SENTRY 2 Page 35 GAIN SETTINGS
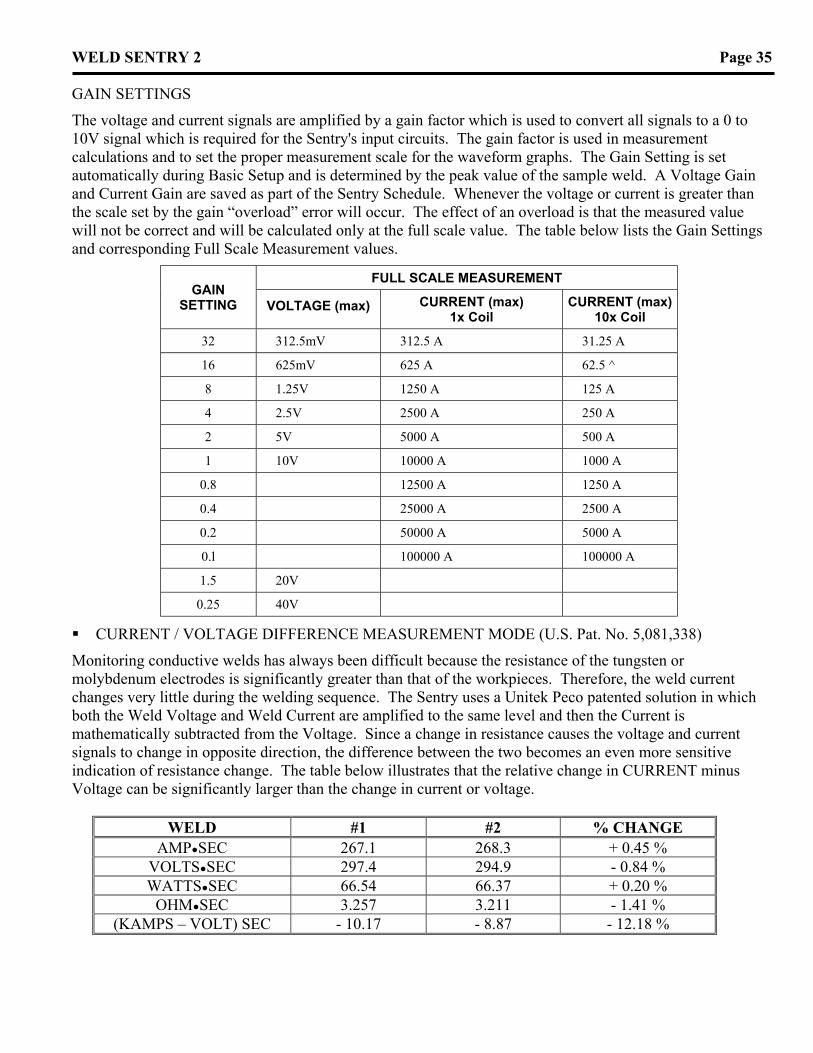
The voltage and current signals are amplified by a gain factor which is used to convert all signals to a 0 to 10V signal which is required for the Sentry's input circuits. The gain factor is used in measurement calculations and to set the proper measurement scale for the waveform graphs. The Gain Setting is set automatically during Basic Setup and is determined by the peak value of the sample weld. A Voltage Gain and Current Gain are saved as part of the Sentry Schedule. Whenever the voltage or current is greater than the scale set by the gain “overload” error will occur. The effect of an overload is that the measured value will not be correct and will be calculated only at the full scale value. The table below lists the Gain Settings and corresponding Full Scale Measurement values.
FULL SCALE MEASUREMENT GAIN
SETTING VOLTAGE (max) CURRENT (max) 1x Coil
CURRENT (max) 10x Coil
32 312.5mV 312.5 A 31.25 A
16 625mV 625 A 62.5 ^
8 1.25V 1250 A 125 A
4 2.5V 2500 A 250 A
2 5V 5000 A 500 A
1 10V 10000 A 1000 A
0.8 12500 A 1250 A
0.4 25000 A 2500 A
0.2 50000 A 5000 A
0.l 100000 A 100000 A
1.5 20V
0.25 40V
CURRENT / VOLTAGE DIFFERENCE MEASUREMENT MODE (U.S. Pat. No. 5,081,338)
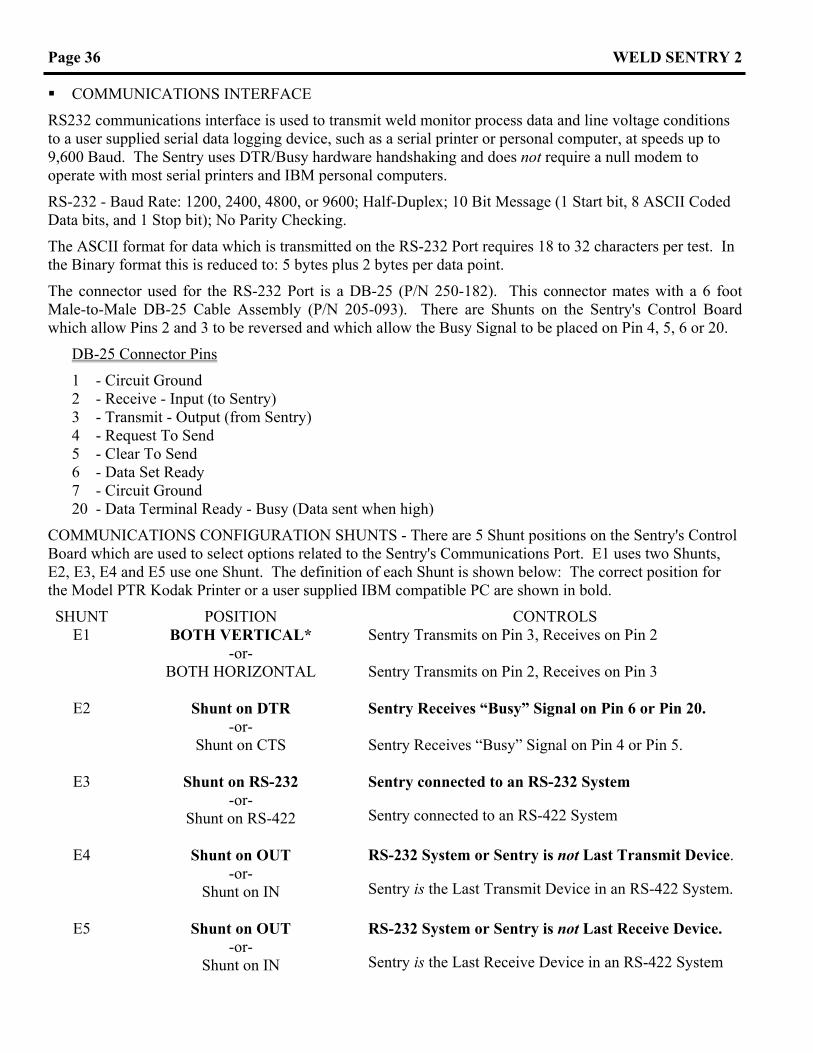
Monitoring conductive welds has always been difficult because the resistance of the tungsten or molybdenum electrodes is significantly greater than that of the workpieces. Therefore, the weld current changes very little during the welding sequence. The Sentry uses a Unitek Peco patented solution in which both the Weld Voltage and Weld Current are amplified to the same level and then the Current is mathematically subtracted from the Voltage. Since a change in resistance causes the voltage and current signals to change in opposite direction, the difference between the two becomes an even more sensitive indication of resistance change. The table below illustrates that the relative change in CURRENT minus Voltage can be significantly larger than the change in current or voltage.
WELD #1 #2 % CHANGE AMPSEC 267.1 268.3 + 0.45 %
VOLTSSEC 297.4 294.9 - 0.84 % WATTSSEC 66.54 66.37 + 0.20 %
OHMSEC 3.257 3.211 - 1.41 % (KAMPS – VOLT) SEC - 10.17 - 8.87 - 12.18 %
Page 36 WELD SENTRY 2 COMMUNICATIONS INTERFACE
RS232 communications interface is used to transmit weld monitor process data and line voltage conditions to a user supplied serial data logging device, such as a serial printer or personal computer, at speeds up to 9,600 Baud. The Sentry uses DTR/Busy hardware handshaking and does not require a null modem to operate with most serial printers and IBM personal computers.
RS-232 - Baud Rate: 1200, 2400, 4800, or 9600; Half-Duplex; 10 Bit Message (1 Start bit, 8 ASCII Coded Data bits, and 1 Stop bit); No Parity Checking.
The ASCII format for data which is transmitted on the RS-232 Port requires 18 to 32 characters per test. In the Binary format this is reduced to: 5 bytes plus 2 bytes per data point.
The connector used for the RS-232 Port is a DB-25 (P/N 250-182). This connector mates with a 6 foot Male-to-Male DB-25 Cable Assembly (P/N 205-093). There are Shunts on the Sentry's Control Board which allow Pins 2 and 3 to be reversed and which allow the Busy Signal to be placed on Pin 4, 5, 6 or 20.
DB-25 Connector Pins
1 - Circuit Ground 2 - Receive - Input (to Sentry) 3 - Transmit - Output (from Sentry) 4 - Request To Send 5 - Clear To Send 6 - Data Set Ready 7 - Circuit Ground 20 - Data Terminal Ready - Busy (Data sent when high)
COMMUNICATIONS CONFIGURATION SHUNTS - There are 5 Shunt positions on the Sentry's Control Board which are used to select options related to the Sentry's Communications Port. E1 uses two Shunts, E2, E3, E4 and E5 use one Shunt. The definition of each Shunt is shown below: The correct position for the Model PTR Kodak Printer or a user supplied IBM compatible PC are shown in bold.
SHUNT POSITION CONTROLS E1 BOTH VERTICAL*
-or- BOTH HORIZONTAL
Sentry Transmits on Pin 3, Receives on Pin 2 Sentry Transmits on Pin 2, Receives on Pin 3
E2 Shunt on DTR
-or- Shunt on CTS
Sentry Receives “Busy” Signal on Pin 6 or Pin 20. Sentry Receives “Busy” Signal on Pin 4 or Pin 5.
E3 Shunt on RS-232
-or- Shunt on RS-422
Sentry connected to an RS-232 System Sentry connected to an RS-422 System
E4 Shunt on OUT
-or- Shunt on IN
RS-232 System or Sentry is not Last Transmit Device. Sentry is the Last Transmit Device in an RS-422 System.
E5 Shunt on OUT
-or- Shunt on IN
RS-232 System or Sentry is not Last Receive Device. Sentry is the Last Receive Device in an RS-422 System

WELD SENTRY 2 Page 37 FORMAT OF DATA OUTPUT
Data can be Prints or transmits summary data for each measurement. When the Graph Mode prints Graphs for any one or all of the Basic Measurement Parameters. In the Raw Data Mode, prints, or transmits voltage and current data for each data point in either ASCII or Binary Format. The Sentry can use either DTR / DSR or RTS / CTS Busy hardware handshaking and generally does not require a null modem to operate with most serial printers and IBM personal computers.
If the "Raw" data is sent to the communications port rather than "Graph" data. In this mode data can be transmitted in "ASCII" or "binary" format. "Binary" sends the same data as ASCII except the data is in binary format which can be sent 5 times faster than ASCII format. The raw data consists of both a voltage and current measurement every 40 microseconds, (25KHz sample rate). The ASCII format is: "VVV AAACRLF". Voltage (VVV) and Current (CCC) are the A/D values which can range from 0 to 255.
The device which is connected to the Sentry's Communications Interface should be configured for the following protocol: 9600 Baud; Half-Duplex; 10 bit message (8 ASCII Coded Data Bits, 1 Start and 1 Stop Bit). In order to communicate with another device, such as a printer or a computer, the Sentry's Receive Line must be connected to the other device's Transmit Line and the other device's Transmit Line must be connected to the Sentry's Receive Line. If the device to which the Sentry is connected is defined as a Data Terminal, its Transmit and Receive Lines are on Pins 2 and 3, respectively. If the device is defined as a Data Set, then its Transmit and Receive Lines are on Pins 3 and 2. respectively. The Sentry's Configuration Shunts allow it to communicate with either Data Terminals or Data Sets.
A Data Terminal will indicate that it is present by placing a "high" signal on its Request To Send Line (Pin 4) which should be connected to the Sentry's Clear To Send (Pin 5). The Data Terminal will indicate that it is ready to receive information by placing a "high" signal on its Data Terminal Ready Line (Pin 20) which should be connected to the Sentry's Data Set Ready Line (Pin 6). There is a Shunt on the Sentry's Control Board which will allow the Sentry to detect "busy" signals from either Data Terminals or Data Sets.
After each weld, the Sentry maintains the data in memory until another weld occurs.

Page 38 WELD SENTRY 2 SENTRY RELAY OUTPUTS
The Sentry is supplied with 2 DC solid state relays, K1 and K2, rated 3 to 60 volts, 1 amp (P/N 4-33049-01). Two additional sockets, K3 and K4, are provided for user-supplied relays to be added. Either AC or DC solid state relays can be used. AC solid state relays are rated 12 to 280 volts, 1 amp (P/N 555-086). Connections are made at the rear panel Relay Outputs connector (P/N 250-187) using the wiring harness (4-31982-01) which is provided with the Sentry. The following table lists the specifications for wiring the relay harness.
RELAY SIGNAL TIMING The “Activation Delay” and signal duration for the Sentry's Output Relays can be programmed. The Relays are not switched on until after the calculations for the measurement are completed and the specified “Activation Delay” expires. The Activation Delay can be set from 0 to 500 milliseconds. The Relays will “Remain On” until the next weld or for the specified time, from 0 to 500 milliseconds.
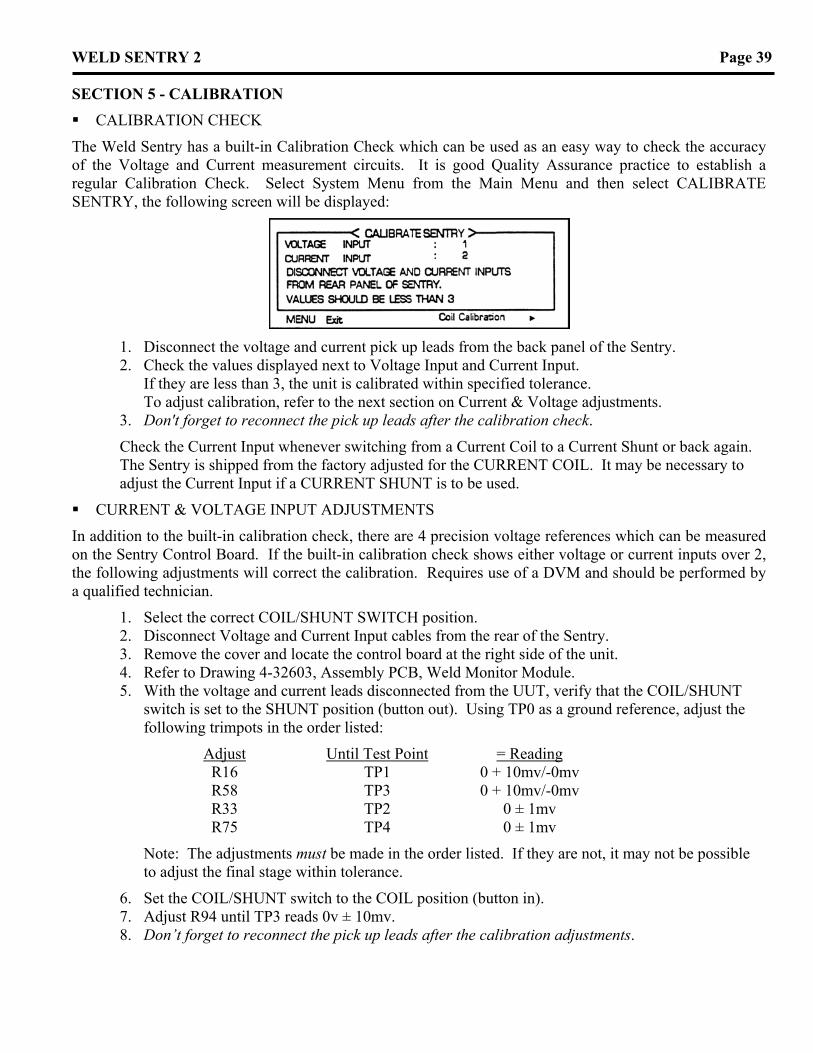
WELD SENTRY 2 Page 39 SECTION 5 - CALIBRATION CALIBRATION CHECK
The Weld Sentry has a built-in Calibration Check which can be used as an easy way to check the accuracy of the Voltage and Current measurement circuits. It is good Quality Assurance practice to establish a regular Calibration Check. Select System Menu from the Main Menu and then select CALIBRATE SENTRY, the following screen will be displayed:
1. Disconnect the voltage and current pick up leads from the back panel of the Sentry. 2. Check the values displayed next to Voltage Input and Current Input.
If they are less than 3, the unit is calibrated within specified tolerance. To adjust calibration, refer to the next section on Current & Voltage adjustments.
3. Don't forget to reconnect the pick up leads after the calibration check.
Check the Current Input whenever switching from a Current Coil to a Current Shunt or back again. The Sentry is shipped from the factory adjusted for the CURRENT COIL. It may be necessary to adjust the Current Input if a CURRENT SHUNT is to be used.
CURRENT & VOLTAGE INPUT ADJUSTMENTS
In addition to the built-in calibration check, there are 4 precision voltage references which can be measured on the Sentry Control Board. If the built-in calibration check shows either voltage or current inputs over 2, the following adjustments will correct the calibration. Requires use of a DVM and should be performed by a qualified technician.
1. Select the correct COIL/SHUNT SWITCH position. 2. Disconnect Voltage and Current Input cables from the rear of the Sentry. 3. Remove the cover and locate the control board at the right side of the unit. 4. Refer to Drawing 4-32603, Assembly PCB, Weld Monitor Module. 5. With the voltage and current leads disconnected from the UUT, verify that the COIL/SHUNT
switch is set to the SHUNT position (button out). Using TP0 as a ground reference, adjust the following trimpots in the order listed:
Adjust Until Test Point = Reading R16 TP1 0 + 10mv/-0mv R58 TP3 0 + 10mv/-0mv R33 TP2 0 ± 1mv R75 TP4 0 ± 1mv
Note: The adjustments must be made in the order listed. If they are not, it may not be possible to adjust the final stage within tolerance.
6. Set the COIL/SHUNT switch to the COIL position (button in). 7. Adjust R94 until TP3 reads 0v ± 10mv. 8. Don’t forget to reconnect the pick up leads after the calibration adjustments.

Page 40 WELD SENTRY 2 VOLTAGE MEASUREMENT CHECK
If desired, the following procedure can be used to check the accuracy of the voltage measurement result.
Required Equipment
1. Stable DC Voltage Source (calibrated)
2. Precision Shunt (.01 to 10 milliohm resistance)(2)
Setup Welder
1. Setup an appropriate weld schedule. AC Welders: .5 - 1 Cycle, 20% Current (lowest transformer tap) DC Welders Single Pulse, < 50 Watt*seconds Energy
Setup Sentry
2. Use to move to the Sentry Program line and enter:
Measurement Unit: Volt*Seconds Lower Limit: None Upper Limit: None Sentry: ON
3. Press [PROGl again to display the Sentry Program screen and enter: Voltage Gain : 1 Current Gain : 4 Delay Time : 0.000ms Measurement Time : 10 ms
4. Press [SAVE] to save the schedule and program in memory.
Test Procedure 1. Use weld cables to connect each end of the shunt to each output terminal of the power supply or
transformer.' 2. Attach the voltage pickup leads to the output of the Voltage Source. 3. Attach the current coil around one weld cable. 4. Set the voltage source to output 9 volts DC. 5. Fire the welder to trigger the Sentry. 6. The Weld Sentry measurement should equal 90 millivolt*Seconds ±: 2%. 7. If the voltage measurement is not correct, refer to Section 5.02 and adjust the voltage
input.
* If the current coil calibration will not be performed, you can fire the weld head across a length of weld cable or any standard load of measured resistance.

WELD SENTRY 2 Page 41 CURRENT COIL CALIBRATION
The Weld Sentry has a built-in calibration procedure for the Current Coil measurement circuit. If changing current pickup type, Coil or Shunt, it may be necessary to calibrate the coil input circuit. Coil Calibration requires the use of a precision shunt of known resistance. The value used at the factory is. 1 milliohm. Select Weld Sentry from the Main Menu. Move the cursor to CALIBRATE SENTRY and press [ENTER]. First. check that the Voltage and Current Inputs are less than 3 (see Section previous section on Voltage and Current Input Adjustments.) then press [] to display the screen:
1. Use weld cables to connect each end of the shunt to each output terminal of the welder. 2. Attach the current pickup coil around one cable. 3. Attach the voltage pickup leads to terminals on the shunt. 4. Fire two "calibration" welds spaced between 0.2 and 2 seconds apart.
The first weld should be at 30% power and the second at 99% power. 5. Check the Low Range and High Range values displayed on the screen. 6. If the values equal the resistance value of the shunt ± 1%, calibration is OK.
If not, the current coil input circuit should be adjusted as follows: a. Remove the cover and locate the PCB at right side of the unit. b. Refer to Drawing 4-32603, Assembly PCB, Weld Monitor Module. c. Adjust each trimpot until displayed values equal the resistance of the shunt ± 1%.
First, adjust R85 for the "Low Range", then, adjust R92 for the "High Range".
d. After each adjustment repeat the "calibration" weld from step 4, then check the newly displayed resistance values.
7. Do not fire pulses in rapid succession so that the cables or shunt become hot. Heat will cause the resistance values to change and the calibration to be inaccurate.
8. Coil calibration is based on the electrical circuit, Resistance = Volts ÷ Amps Voltage is measured across the precision shunt. Current is measured using the current coil. Calculated resistance = resistance of the shunt when unit is calibrated.
CALIBRATION SUMMARY
1. Calibration Check - Quick and easy, technician not needed, check regularly for good QA.
2. Voltage & Current Input Adjustments - Need DVM, requires technician, precision voltage references, may want to check yearly for certification.
3. Voltage Measurement Check - Need stable voltage source, requires technician, practical demonstration of measurement accuracy.
4. Coil Calibration - Need precision shunt, may be required if changing current pickup type.

Page 42 WELD SENTRY 2 SECTION 6 - PARTS LIST WELD SENTRY 2 SHIP KIT
990-333 4-32878-01 10-309-01* 10-310-01** 4-32409-01 4-32410-01 4-31982-01 4-32508-01 180-051 250-199 250-200
Weld Sentry 2 Users Manual 3-1/2" Data Acquisition Software disk Current Pickup Coil, lx, 150- 100,000 Amps Current Pickup Coil, 10x, 15 - 10,000 Amps Current Pickup cable Current Shunt cable 8-pin wiring harness, Relay Output 18AWG 3-wire hookup cable, Line Monitor Strain Relief Bushing 15-pin connector plug, Control Signals 15-pin connector hood
* shipped with Sentry P/N 3-131-01
** shipped with Sentry P/N 3-131-01-02 OPTIONAL ACCESSORIES
10-312-01 10-310-01 10-308-01 4-33049-01 555-086 520-110 520-109 550-070 550-069
Kodak Model 180si serial printer w/RS-232 cable Current Pickup coil, 10X, 15 - 10,000 Amps Start Signal trigger cable Solid State Relay, DC Solid State Relay, AC 3-pin voltage plug 2-pin current plug 3-pin panel receptacle (voltage) 2-pin panel receptacle (current)
REPLACEMENT PARTS
680-242 270-036 4-32603-01 4-35708-01
Rocker switch, Power/Off LCD Display Replacement PCB, Weld Monitor Module Replacement PCB, Control Board
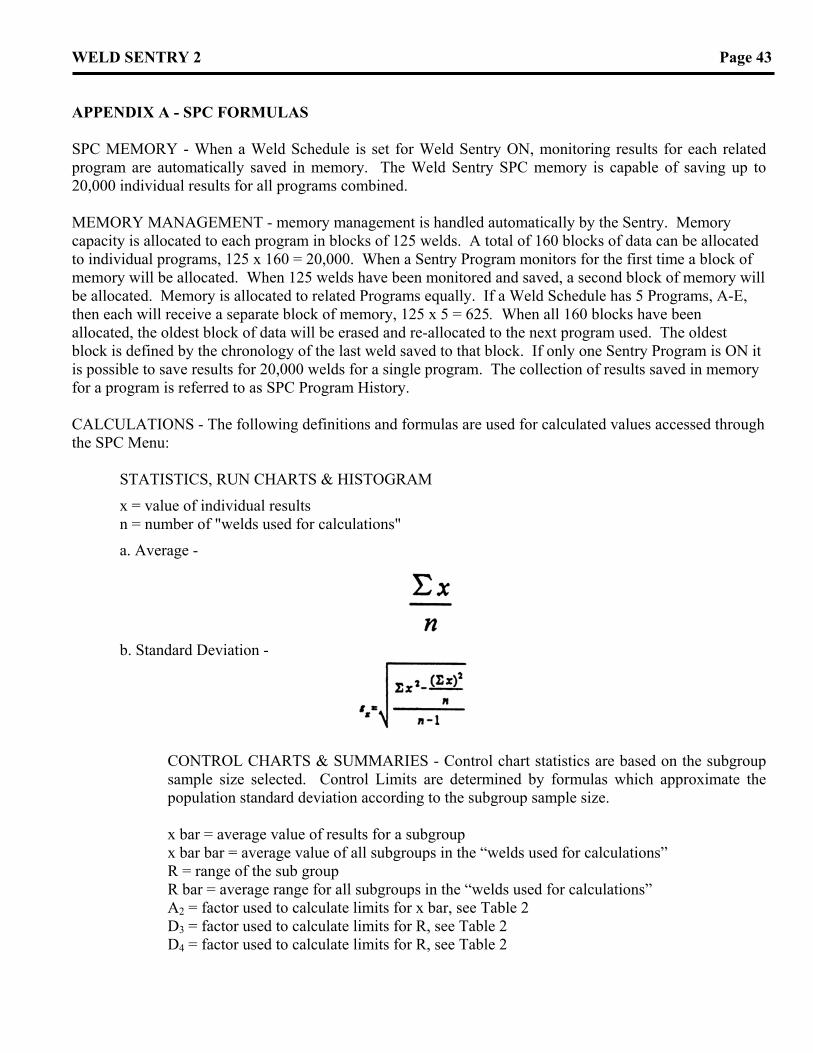
WELD SENTRY 2 Page 43 APPENDIX A - SPC FORMULAS SPC MEMORY - When a Weld Schedule is set for Weld Sentry ON, monitoring results for each related program are automatically saved in memory. The Weld Sentry SPC memory is capable of saving up to 20,000 individual results for all programs combined. MEMORY MANAGEMENT - memory management is handled automatically by the Sentry. Memory capacity is allocated to each program in blocks of 125 welds. A total of 160 blocks of data can be allocated to individual programs, 125 x 160 = 20,000. When a Sentry Program monitors for the first time a block of memory will be allocated. When 125 welds have been monitored and saved, a second block of memory will be allocated. Memory is allocated to related Programs equally. If a Weld Schedule has 5 Programs, A-E, then each will receive a separate block of memory, 125 x 5 = 625. When all 160 blocks have been allocated, the oldest block of data will be erased and re-allocated to the next program used. The oldest block is defined by the chronology of the last weld saved to that block. If only one Sentry Program is ON it is possible to save results for 20,000 welds for a single program. The collection of results saved in memory for a program is referred to as SPC Program History. CALCULATIONS - The following definitions and formulas are used for calculated values accessed through the SPC Menu:
STATISTICS, RUN CHARTS & HISTOGRAM
x = value of individual results n = number of "welds used for calculations"
a. Average -
b. Standard Deviation -
CONTROL CHARTS & SUMMARIES - Control chart statistics are based on the subgroup sample size selected. Control Limits are determined by formulas which approximate the population standard deviation according to the subgroup sample size.
x bar = average value of results for a subgroup x bar bar = average value of all subgroups in the “welds used for calculations” R = range of the sub group R bar = average range for all subgroups in the “welds used for calculations” A2 = factor used to calculate limits for x bar, see Table 2 D3 = factor used to calculate limits for R, see Table 2 D4 = factor used to calculate limits for R, see Table 2
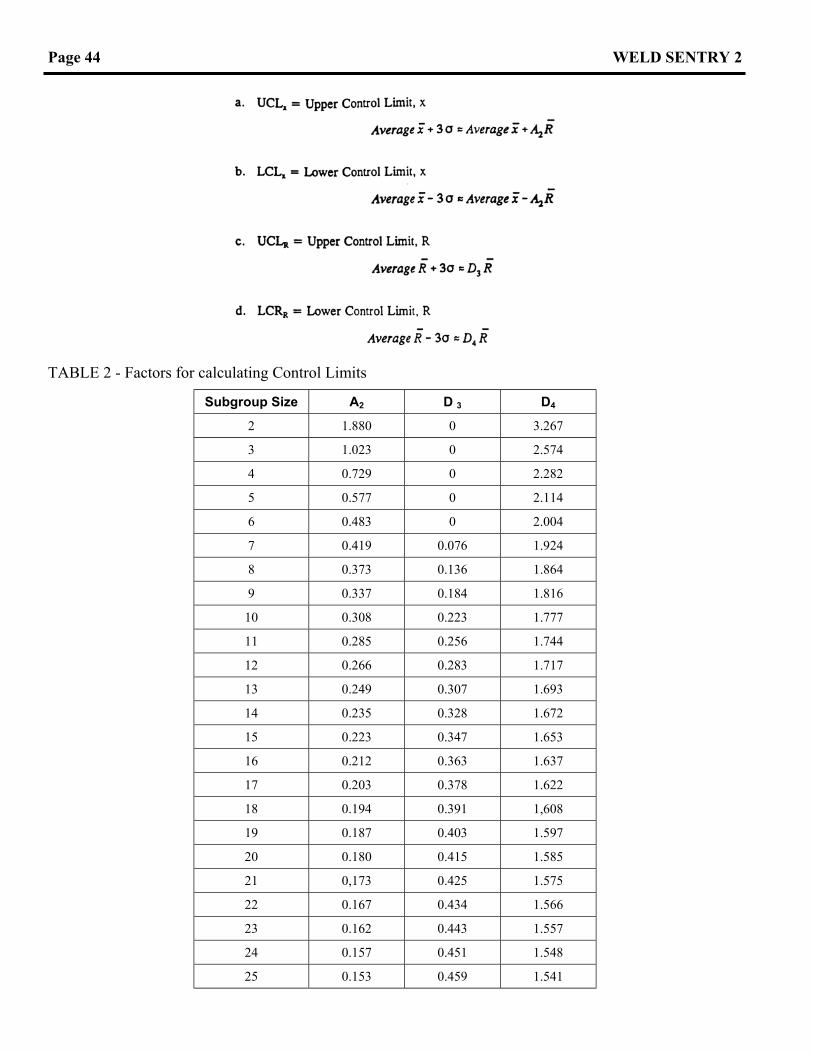
Page 44 WELD SENTRY 2
TABLE 2 - Factors for calculating Control Limits
Subgroup Size A2 D 3 D4
2 1.880 0 3.267
3 1.023 0 2.574
4 0.729 0 2.282
5 0.577 0 2.114
6 0.483 0 2.004
7 0.419 0.076 1.924
8 0.373 0.136 1.864
9 0.337 0.184 1.816
10 0.308 0.223 1.777
11 0.285 0.256 1.744
12 0.266 0.283 1.717
13 0.249 0.307 1.693
14 0.235 0.328 1.672
15 0.223 0.347 1.653
16 0.212 0.363 1.637
17 0.203 0.378 1.622
18 0.194 0.391 1,608
19 0.187 0.403 1.597
20 0.180 0.415 1.585
21 0,173 0.425 1.575
22 0.167 0.434 1.566
23 0.162 0.443 1.557
24 0.157 0.451 1.548
25 0.153 0.459 1.541
Related Documents