2Q09 Consolidated Results August 11 th , 2009

2 q09 earnings presentation
Jan 12, 2015
Welcome message from author
This document is posted to help you gain knowledge. Please leave a comment to let me know what you think about it! Share it to your friends and learn new things together.
Transcript
2Q09 Consolidated Results
August 11th, 2009
Highlights 2Q09
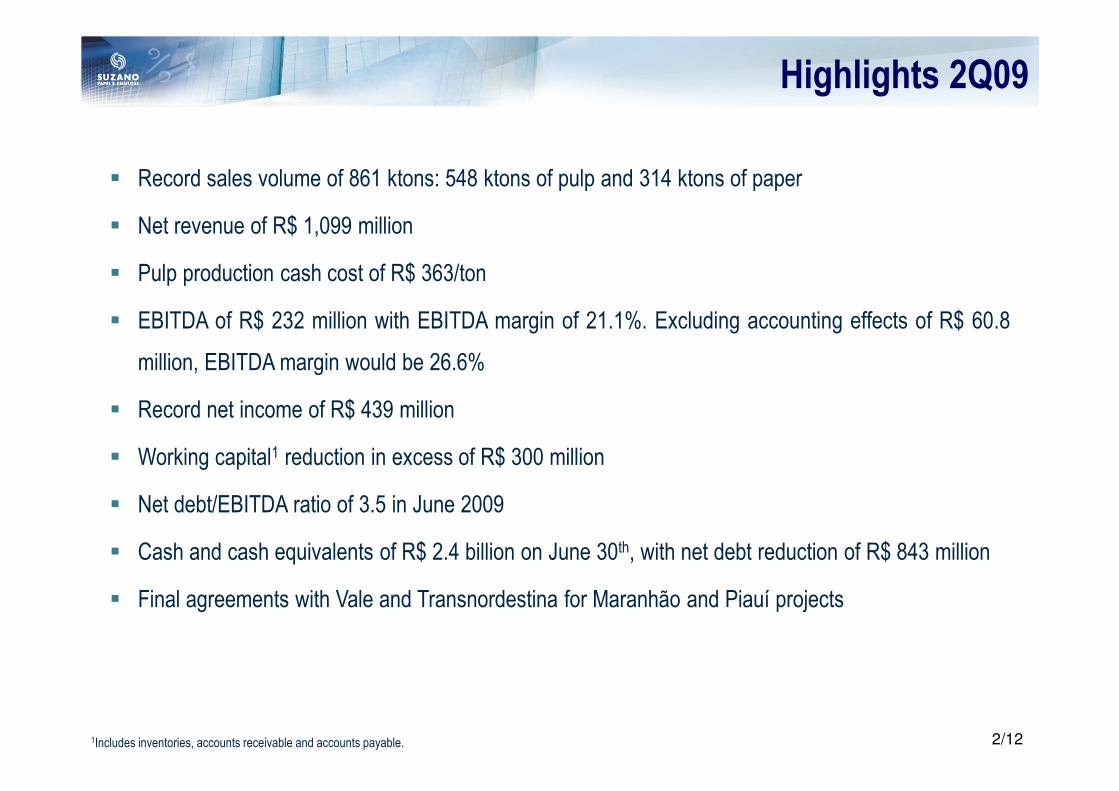
� Record sales volume of 861 ktons: 548 ktons of pulp and 314 ktons of paper
� Net revenue of R$ 1,099 million
� Pulp production cash cost of R$ 363/ton
� EBITDA of R$ 232 million with EBITDA margin of 21.1%. Excluding accounting effects of R$ 60.8
million, EBITDA margin would be 26.6%
� Record net income of R$ 439 million
� Working capital1 reduction in excess of R$ 300 million
� Net debt/EBITDA ratio of 3.5 in June 2009
� Cash and cash equivalents of R$ 2.4 billion on June 30th, with net debt reduction of R$ 843 million
� Final agreements with Vale and Transnordestina for Maranhão and Piauí projects
2/121Includes inventories, accounts receivable and accounts payable.
Pulp Business Unit2Q
09
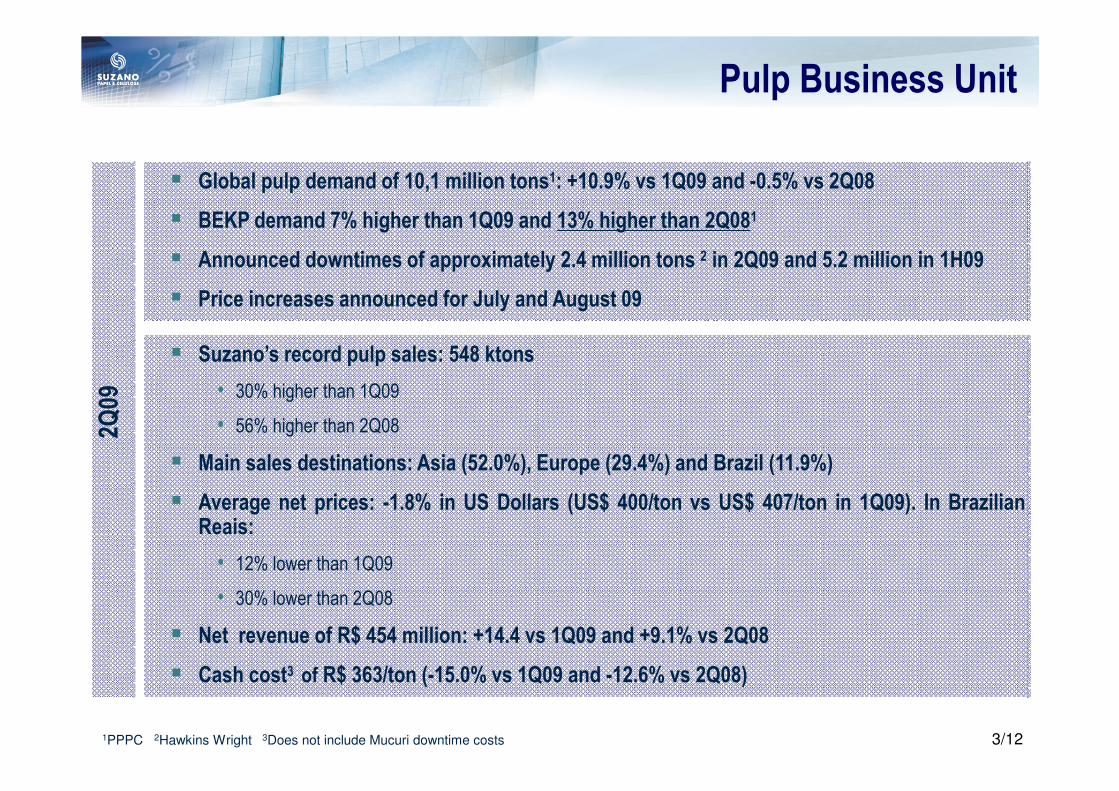
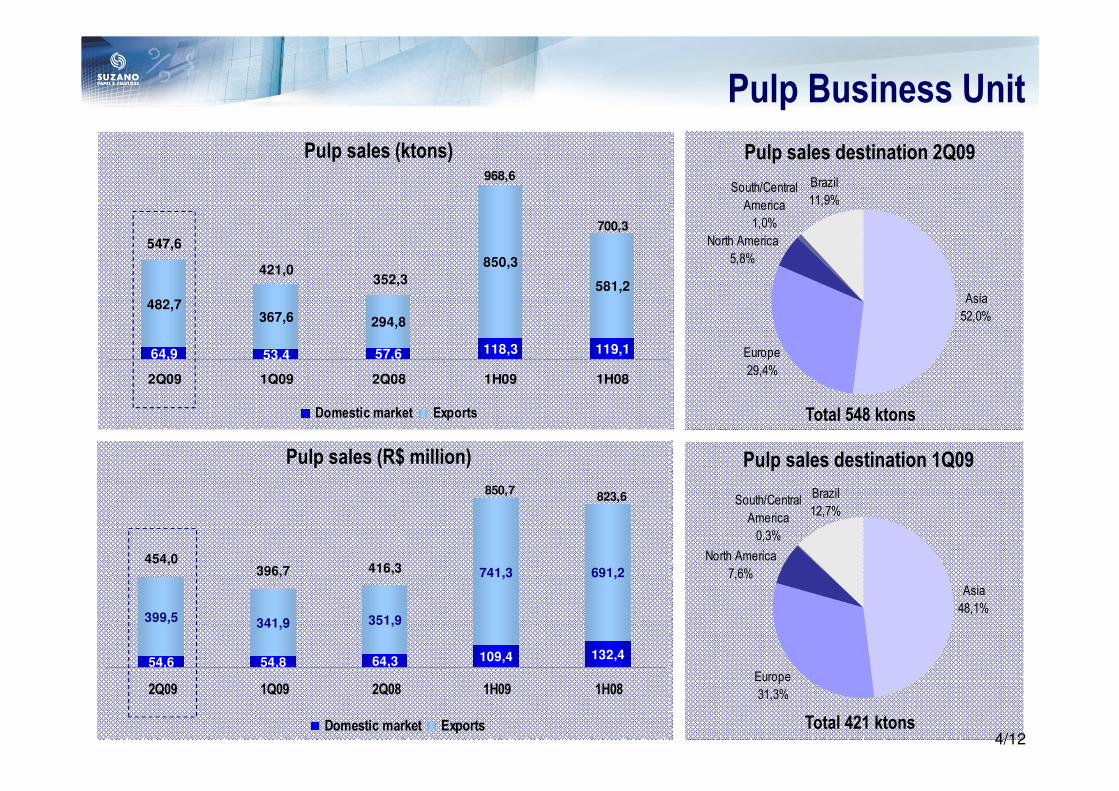
� Suzano’s record pulp sales: 548 ktons
• 30% higher than 1Q09
• 56% higher than 2Q08
� Main sales destinations: Asia (52.0%), Europe (29.4%) and Brazil (11.9%)
� Average net prices: -1.8% in US Dollars (US$ 400/ton vs US$ 407/ton in 1Q09). In BrazilianReais:
• 12% lower than 1Q09
• 30% lower than 2Q08
� Net revenue of R$ 454 million: +14.4 vs 1Q09 and +9.1% vs 2Q08
� Cash cost3 of R$ 363/ton (-15.0% vs 1Q09 and -12.6% vs 2Q08)
1PPPC 2Hawkins Wright 3Does not include Mucuri downtime costs 3/12
� Global pulp demand of 10,1 million tons1: +10.9% vs 1Q09 and -0.5% vs 2Q08
� BEKP demand 7% higher than 1Q09 and 13% higher than 2Q081
� Announced downtimes of approximately 2.4 million tons 2 in 2Q09 and 5.2 million in 1H09
� Price increases announced for July and August 09
Asia
52,0%
Europe
29,4%
South/Central
America
1,0%
North America
5,8%
Brazil
11,9%
Pulp Business Unit
Pulp sales (ktons)
Pulp sales (R$ million)
4/12
Pulp sales destination 2Q09
Pulp sales destination 1Q09
Total 548 ktons
Total 421 ktons
64,9 53,4 57,6 118,3 119,1
482,7367,6 294,8
850,3
581,2
547,6
421,0352,3
2Q09 1Q09 2Q08 1H09 1H08
Domestic market Exports
968,6
700,3
54,6 54,8 64,3 109,4 132,4
399,5 341,9 351,9
741,3 691,2416,3396,7454,0
2Q09 1Q09 2Q08 1H09 1H08
Domestic market Exports
850,7823,6
Asia
48,1%
Europe
31,3%
Brazil
12,7%
North America
7,6%
South/Central
America
0,3%
Paper Business Unit2Q
09
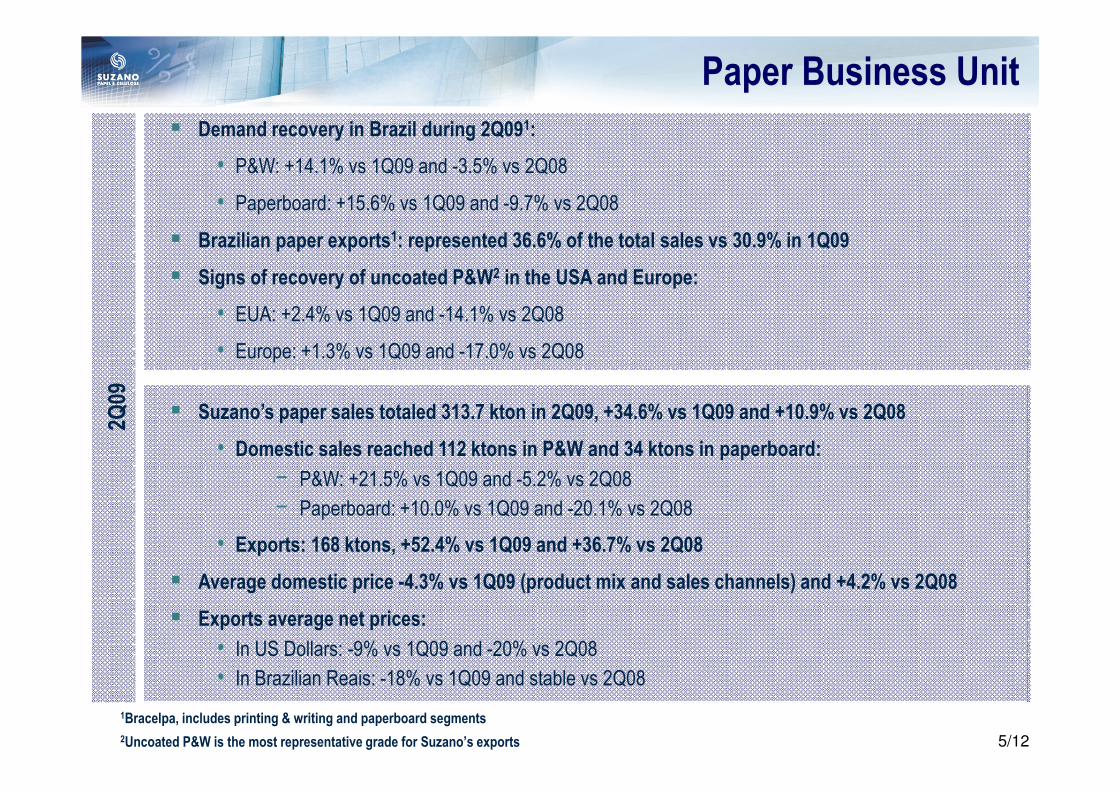
1Bracelpa, includes printing & writing and paperboard segments
2Uncoated P&W is the most representative grade for Suzano’s exports
� Demand recovery in Brazil during 2Q091:
• P&W: +14.1% vs 1Q09 and -3.5% vs 2Q08
• Paperboard: +15.6% vs 1Q09 and -9.7% vs 2Q08
� Brazilian paper exports1: represented 36.6% of the total sales vs 30.9% in 1Q09
� Signs of recovery of uncoated P&W2 in the USA and Europe:
• EUA: +2.4% vs 1Q09 and -14.1% vs 2Q08
• Europe: +1.3% vs 1Q09 and -17.0% vs 2Q08
5/12
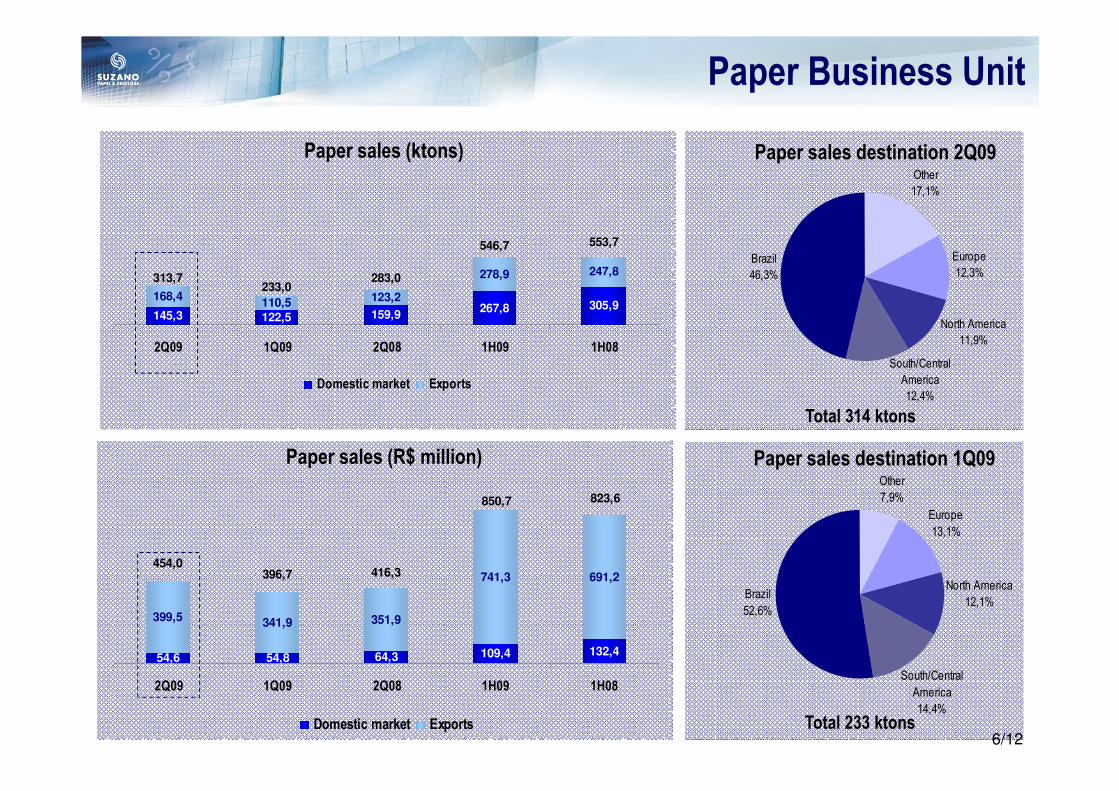
� Suzano’s paper sales totaled 313.7 kton in 2Q09, +34.6% vs 1Q09 and +10.9% vs 2Q08
• Domestic sales reached 112 ktons in P&W and 34 ktons in paperboard:
− P&W: +21.5% vs 1Q09 and -5.2% vs 2Q08
− Paperboard: +10.0% vs 1Q09 and -20.1% vs 2Q08
• Exports: 168 ktons, +52.4% vs 1Q09 and +36.7% vs 2Q08
� Average domestic price -4.3% vs 1Q09 (product mix and sales channels) and +4.2% vs 2Q08
� Exports average net prices:
• In US Dollars: -9% vs 1Q09 and -20% vs 2Q08
• In Brazilian Reais: -18% vs 1Q09 and stable vs 2Q08
Paper Business Unit
6/12
Paper sales (ktons)
Paper sales (R$ million)
Paper sales destination 2Q09
Paper sales destination 1Q09
Total 314 ktons
Total 233 ktons
Other
7,9%
Europe
13,1%
Brazil
52,6%
North America
12,1%
South/Central
America
14,4%
Other
17,1%
Europe
12,3%
South/Central
America
12,4%
North America
11,9%
Brazil
46,3%
145,3 122,5 159,9267,8 305,9
168,4110,5 123,2
278,9 247,8
553,7546,7
313,7233,0
283,0
2Q09 1Q09 2Q08 1H09 1H08
Domestic market Exports
54,6 54,8 64,3 109,4 132,4
399,5341,9 351,9
741,3 691,2416,3396,7454,0
2Q09 1Q09 2Q08 1H09 1H08
Domestic market Exports
850,7 823,6
2Q09 Results
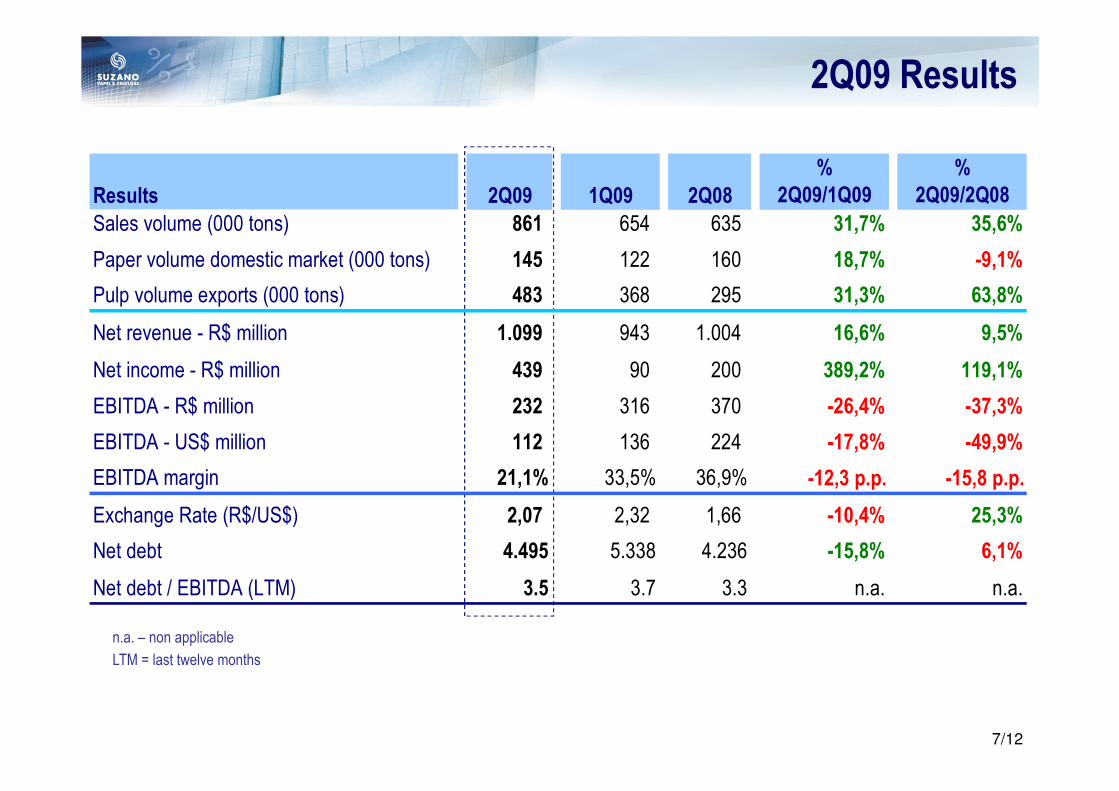
n.a. – non applicable
7/12
LTM = last twelve months
Results 2Q09 1Q09 2Q08
%
2Q09/1Q09
%
2Q09/2Q08
Sales volume (000 tons) 861 654 635 31,7% 35,6%
Paper volume domestic market (000 tons) 145 122 160 18,7% -9,1%
Pulp volume exports (000 tons) 483 368 295 31,3% 63,8%
Net revenue - R$ million 1.099 943 1.004 16,6% 9,5%
Net income - R$ million 439 90 200 389,2% 119,1%
EBITDA - R$ million 232 316 370 -26,4% -37,3%
EBITDA - US$ million 112 136 224 -17,8% -49,9%
EBITDA margin 21,1% 33,5% 36,9% -12,3 p.p. -15,8 p.p.
Exchange Rate (R$/US$) 2,07 2,32 1,66 -10,4% 25,3%
Net debt 4.495 5.338 4.236 -15,8% 6,1%
Net debt / EBITDA (LTM) 3.5 3.7 3.3 n.a. n.a.
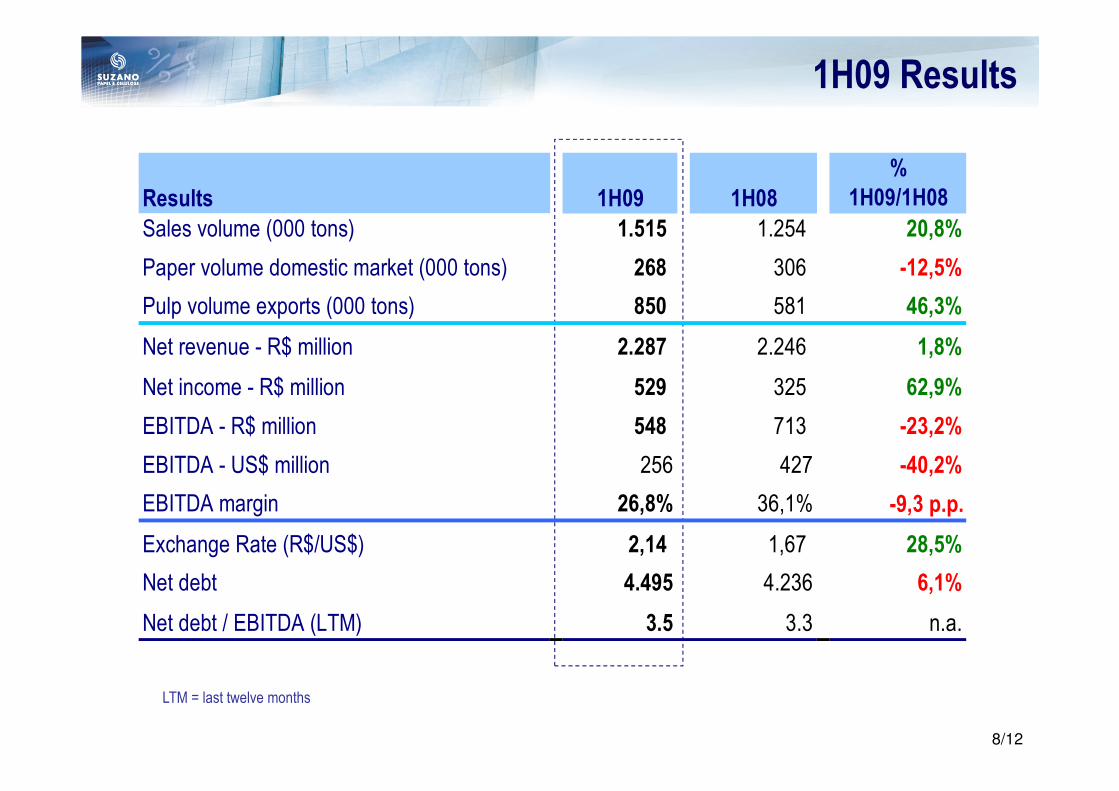
1H09 Results
8/12
LTM = last twelve months
Results 1H09 1H08
%
1H09/1H08
Sales volume (000 tons) 1.515 1.254 20,8%
Paper volume domestic market (000 tons) 268 306 -12,5%
Pulp volume exports (000 tons) 850 581 46,3%
Net revenue - R$ million 2.287 2.246 1,8%
Net income - R$ million 529 325 62,9%
EBITDA - R$ million 548 713 -23,2%
EBITDA - US$ million 256 427 -40,2%
EBITDA margin 26,8% 36,1% -9,3 p.p.
Exchange Rate (R$/US$) 2,14 1,67 28,5%
Net debt 4.495 4.236 6,1%
Net debt / EBITDA (LTM) 3.5 3.3 n.a.
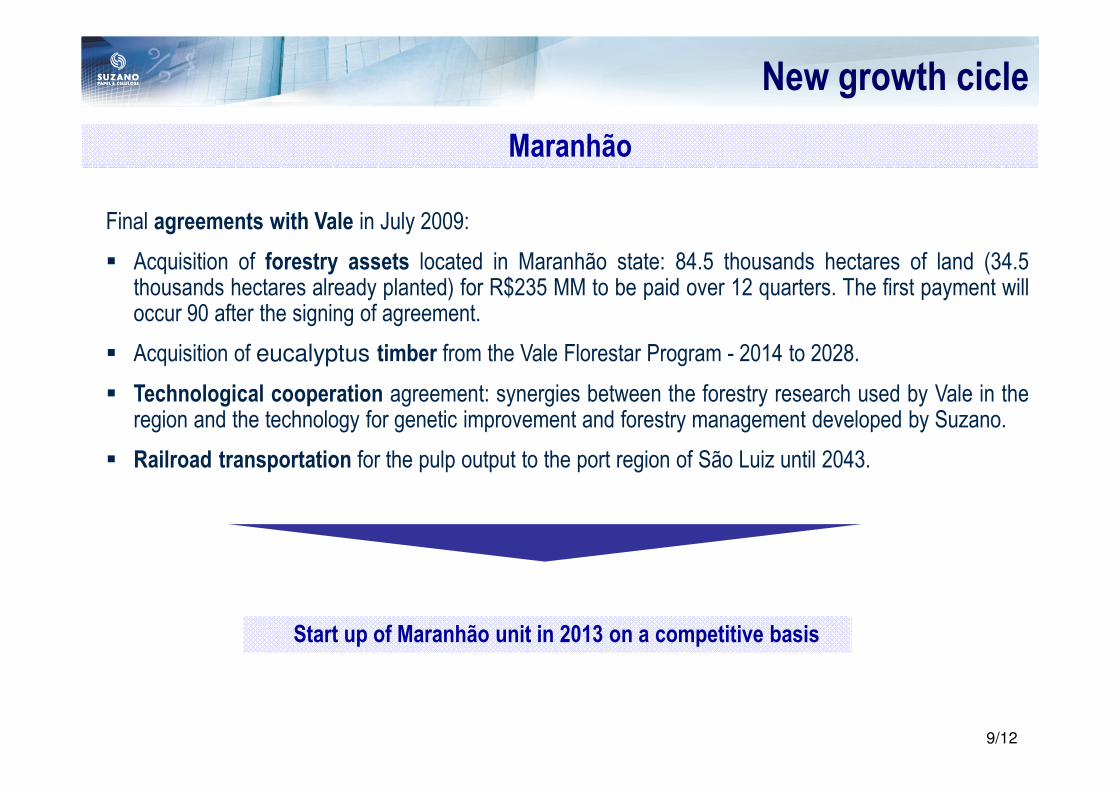
New growth cicle
Final agreements with Vale in July 2009:
� Acquisition of forestry assets located in Maranhão state: 84.5 thousands hectares of land (34.5thousands hectares already planted) for R$235 MM to be paid over 12 quarters. The first payment willoccur 90 after the signing of agreement.
� Acquisition of eucalyptus timber from the Vale Florestar Program - 2014 to 2028.
� Technological cooperation agreement: synergies between the forestry research used by Vale in theregion and the technology for genetic improvement and forestry management developed by Suzano.
� Railroad transportation for the pulp output to the port region of São Luiz until 2043.
Maranhão
9/12
Start up of Maranhão unit in 2013 on a competitive basis
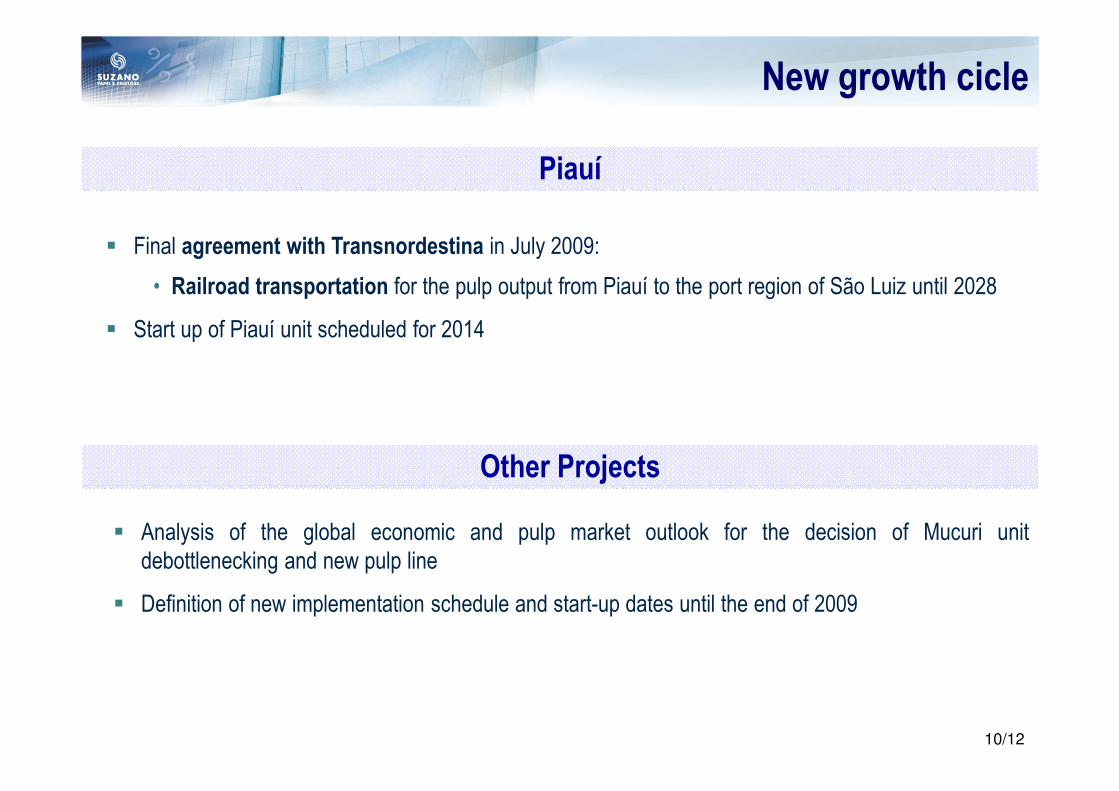
New growth cicle
� Final agreement with Transnordestina in July 2009:
• Railroad transportation for the pulp output from Piauí to the port region of São Luiz until 2028
� Start up of Piauí unit scheduled for 2014
Piauí
Other Projects
� Analysis of the global economic and pulp market outlook for the decision of Mucuri unitdebottlenecking and new pulp line
� Definition of new implementation schedule and start-up dates until the end of 2009
10/12
Key Messages
� Signs of demand recovery in pulp and paper markets:
• Paper: Brazilian P&W and paperboard demand 14.4% higher than 1Q09
• Pulp: reduction in global producers inventories and new price increases
� Focus on operational performance:
• Record sales volume and pulp price increases
• Costs and expenses reduction: pulp cash cost of R$ 363/ton
• Working capital reduction in excess R$ 300 million
� Solid financial position:
• Adequate debt profile and competitive debt cost
• Strong cash position: R$ 2.4 bi, with net debt reduction of R$ 843 million
� Solid growth strategy:
• Final agreements with Vale and Transnordestina for the Maranhão and Piauí projects
11/12
Investor Relationswww.suzano.com.br/ri55 11 [email protected]
Related Documents