2.1 2. Population and Water Demand Projections This section presents the population and water demand projections for Region C and describes the development of those projections. For the purposes of water supply planning, projections of dry year water demands are used. Demands are generally greater in dry years than in normal years, and it is important to develop a water supply system that is able to meet those greater demands when they occur. 2.1 Previous Texas Water Development Board Projections The estimated 1996 population of Region C was 4,609,060. Table 2.1 shows TWDB’s previous population projections for Region C counties developed for the 1997 Texas Water Plan (1) , which projected a 2050 population of 8,843,253. Figure 2.1 shows the historical population for Region C from 1900 through 1990 and the TWDB projection from the 1997 water plan. The estimated 1996 water use in Region C was 1,126,518 acre-feet. Table 2.2 shows the projected water demand for Region C counties from the 1997 Texas Water Plan, with a total region-wide demand of 1,967,916 acre-feet per year projected by 2050. Figure 2.2 shows TWDB’s projected water demand for Region C from the 1997 water plan by type of use. 2.2 Region C Population and Water Use Patterns The sixteen counties in Region C can be divided into four classifications from the standpoint of population and water use: • Urbanized counties • Partially urbanized counties • Urban fringe counties • Rural counties. Figure 2.3 shows the classification of counties in Region C. Urbanized counties are characterized by dense population and by residential, industrial, and commercial development covering most of the land area. Population growth will come from development of the remaining open land and from redevelopment. Increased water

Welcome message from author
This document is posted to help you gain knowledge. Please leave a comment to let me know what you think about it! Share it to your friends and learn new things together.
Transcript

2.1
2. Population and Water Demand Projections
This section presents the population and water demand projections for Region C and
describes the development of those projections. For the purposes of water supply planning,
projections of dry year water demands are used. Demands are generally greater in dry years
than in normal years, and it is important to develop a water supply system that is able to meet
those greater demands when they occur.
2.1 Previous Texas Water Development Board Projections
The estimated 1996 population of Region C was 4,609,060. Table 2.1 shows TWDB’s
previous population projections for Region C counties developed for the 1997 Texas Water
Plan(1), which projected a 2050 population of 8,843,253. Figure 2.1 shows the historical
population for Region C from 1900 through 1990 and the TWDB projection from the 1997
water plan.
The estimated 1996 water use in Region C was 1,126,518 acre-feet. Table 2.2 shows the
projected water demand for Region C counties from the 1997 Texas Water Plan, with a total
region-wide demand of 1,967,916 acre-feet per year projected by 2050. Figure 2.2 shows
TWDB’s projected water demand for Region C from the 1997 water plan by type of use.
2.2 Region C Population and Water Use Patterns
The sixteen counties in Region C can be divided into four classifications from the
standpoint of population and water use:
• Urbanized counties
• Partially urbanized counties
• Urban fringe counties
• Rural counties.
Figure 2.3 shows the classification of counties in Region C.
Urbanized counties are characterized by dense population and by residential, industrial,
and commercial development covering most of the land area. Population growth will come
from development of the remaining open land and from redevelopment. Increased water
2.2
Table 2.1 Texas Water Development Board
County Population Projections from the 1997 Texas Water Plan
Projected Population County
Historical 1996 2000 2010 2020 2030 2040 2050
Collin 373,095 387,598 527,712 706,997 873,323 1,019,350 1,162,482 Cooke 33,196 32,139 33,714 35,241 36,360 37,142 37,821 Dallas 1,999,926 2,074,858 2,286,828 2,556,793 2,784,704 3,045,931 3,259,995 Denton 349,566 385,876 523,205 679,279 845,595 985,370 1,135,566 Ellis 94,097 106,921 130,867 156,521 181,711 194,893 205,487 Fannin 27,435 26,692 26,966 27,408 27,835 28,173 28,396 Freestone 17,757 17,291 17,854 18,382 18,848 19,164 19,433 Grayson 100,611 102,119 106,277 110,643 114,702 117,864 120,982 Henderson (Partial) 45,761 46,562 51,261 55,514 57,704 58,689 60,476 Jack 7,435 7,148 7,530 7,896 8,358 8,865 9,352 Kaufman 61,646 63,741 76,272 89,203 100,144 107,283 112,964 Navarro 42,875 42,441 45,665 48,265 50,691 51,563 53,312 Parker 73,897 80,436 99,095 118,287 139,094 156,023 171,216 Rockwall 34,287 41,174 61,392 88,135 121,288 160,588 203,530 Tarrant 1,306,457 1,415,759 1,594,218 1,798,893 1,915,375 2,111,193 2,205,610 Wise 41,019 39,743 45,428 50,540 55,596 56,476 56,631 Region C Total 4,609,060 4,870,498 5,634,284 6,547,997 7,331,328 8,158,567 8,843,253
Table 2.2 Texas Water Development Board
County Water Demand Projections from the 1997 Texas Water Plan
Projected Water Demand (Acre-Feet per Year) County
Historical 1996 2000 2010 2020 2030 2040 2050
Collin 89,230 91,275 109,344 134,062 159,642 183,209 202,680 Cooke 8,429 8,266 8,113 8,073 8,075 8,079 8,147 Dallas 505,423 597,945 649,055 700,728 729,819 802,988 860,588 Denton 65,075 80,037 98,815 117,821 132,349 151,155 172,338 Ellis 19,721 24,756 27,812 30,050 33,422 35,127 36,857 Fannin 17,515 13,199 15,896 15,582 20,398 25,247 30,147 Freestone 20,608 17,939 17,857 17,738 17,717 17,674 17,691 Grayson 29,152 25,738 25,981 26,139 26,719 27,354 28,553 Henderson (Partial) 10,785 11,550 18,771 28,791 33,945 38,881 44,014 Jack 3,337 2,365 2,290 2,259 2,265 2,294 2,346 Kaufman 10,653 12,434 13,503 14,503 15,669 16,359 17,035 Navarro 10,558 9,405 9,585 9,675 9,875 9,917 10,159 Parker 12,372 13,603 15,147 16,304 18,362 20,125 21,858 Rockwall 6,566 8,375 10,929 14,562 19,709 25,952 32,219 Tarrant 291,406 346,372 375,680 379,846 401,915 437,950 462,745 Wise 25,688 16,845 17,493 18,276 19,287 19,863 20,539 Region C Total 1,126,518 1,280,104 1,416,271 1,534,409 1,649,168 1,822,174 1,967,916

Figure 2.1Texas Water Development Board Historical and Projected
Population for Region C from the 1997 Water Plan
0
1,000,000
2,000,000
3,000,000
4,000,000
5,000,000
6,000,000
7,000,000
8,000,000
9,000,000
10,000,000
1900 1910 1920 1930 1940 1950 1960 1970 1980 1990 2000 2010 2020 2030 2040 2050
Year
Popu
latio
n Historical
TWDB 1997Projections
Figure 2.2Texas Water Development Board 1997 Water Plan Projections
for Water Use by Category in Region C
0
200,000
400,000
600,000
800,000
1,000,000
1,200,000
1,400,000
1,600,000
1,800,000
2,000,000
2000 2010 2020 2030 2040 2050
Year
Wat
er U
se (A
cre-
Fee
t)
Livestock
Mining
IrrigationSteam Electric
Manufacturing
Municipal

JACK WISE
FANNIN
PARKER
NAVARRO
KAUFMAN
FREESTONE
HENDERSON
ROCKWALL
COOKE GRAYSON
DENTON COLLIN
TARRANT
DALLAS
N
EW
S
Urbanized CountiesPartially Urbanized CountiesUrban Fringe CountiesRural Counties
ELLIS
Figure 2.3 Region C County Classifications
0 20
SCALE IN MILES

2.3
demand will come primarily from population and employment growth (partially offset by
water conservation). Dallas and Tarrant Counties are the urbanized counties in Region C.
Partially urbanized counties have a significant land area that is highly developed, with
dense population and industrial and commercial development. These counties also have
significant undeveloped areas. Population growth in these counties is expected to be
significant and to be driven primarily by new development. Increased water demand will
also come primarily from new development. Growth rates in these counties cannot be
predicted from historical trends alone. Per capita municipal water demand is likely to
increase with population in developing areas, even though conservation measures are
implemented. The increase in per capita municipal demand occurs as a result of changes in
the type of housing. Newly constructed homes in developing areas are likely to have higher
per capita demand than existing development because of irrigation systems, swimming pools,
and water-using appliances. Collin, Denton, and Rockwall Counties are partially urbanized
counties in Region C.
Urban fringe counties are located adjacent to urban counties, but they currently have
minimal urbanized development. They generally have higher population density than rural
counties, but most of the land area is undeveloped. These counties are expected to
experience relatively high growth in the next fifty years as urban development expands from
the urbanized counties. Population growth in the urban fringe counties can be expected to be
significant and will be derived primarily from new development. Water demand will grow
with the growing population, and per capita municipal demand will generally increase even
with water conservation measures because of changes in housing type. The urban fringe
counties in Region C are Ellis, Kaufman, Parker, and Wise.
Rural counties are located beyond the immediate influence of the urban counties.
Growth in these counties will generally be generated from local expansion and be dependent
on local economic factors. In most cases, historical trends are a reasonable indication of
future population growth. In some cases, recent economic or demographic changes, such as
prison construction, have altered population growth trends. The rural counties in Region C
are Cooke, Fannin, Freestone, Grayson, Henderson, Jack, and Navarro.

2.4
2.3 Methodology for Projections of Population and Water Demand
TWDB’s Regional Water Planning Guidelines (1) require the regional water planning
groups to use TWDB population and water demand projections from the 1997 Texas Water
Plan (11) unless revisions are approved by TWDB. TWDB provided guidelines allowing for
revisions based on changed conditions or new information (35).
TWDB projects water demand in several categories, including municipal, manufacturing,
steam electric power generation, mining, irrigation, and livestock. Municipal demand is
developed separately for each community with a population of over 500 and includes
commercial, institutional, and residential demands but does not include manufacturing water
use. A “county other” group for each county covers municipal use in rural areas and
communities with less than 500 people. The other demand categories are developed on a
countywide basis for each county.
The basic data provided by TWDB included historical population and water use data and
the projections from the 1997 Texas Water Plan (9, 11). For the Senate Bill One planning
process, these data were assembled in tables and figures that could be reviewed by counties,
cities, water suppliers, industries, and other interested entities. The TWDB data and a
questionnaire were sent to all Region C counties, cities with a population over 1,000,
regional water suppliers, retail water suppliers (supplying over 0.2 mgd), and large industries.
The questionnaires sought information on population and water use projections and other
water supply issues. Copies of the questionnaires are included in Appendix C. The response
rate for all questionnaire recipients was 51 percent, and 61 percent of the cities, counties, and
regional water suppliers responded. Many cities and counties responded with suggestions for
revisions to the previous projections, as did several major water providers.
In addition to data provided by TWDB and replies from the surveys, population data
were gathered from the State Data Center (3) and the North Central Texas Council of
Governments (NCTCOG) (36). The State Data Center provided historical population
estimates for each city and county and a 1998 population projection by county based on
1990-1996 migration rates. NCTCOG provided historical population estimates for cities and
counties in its service area and projected populations for 1999 and 2000.

2.5
Revisions to Population Projections
Figures showing historical and projected population were developed for each Region C
county. The figures are included in Appendix D, which has back-up data for population and
water demand projections. The figures show the following:
• Historical population estimates from the State Data Center
• TWDB population projections through 2050 developed for the 1997 water plan
• State Data Center population projections through 2030 based on 1990-96 migration rates
• Projections provided from responses to the surveys
• Projections adopted by the Region C committee and approved by TWDB.
The State Data Center and TWDB population projections are based on analysis of
projected birth rates, death rates, and migration into and out of each county. In the 1997
water plan, the TWDB developed at least three different population projections for each
county, based on different assumptions about future migration rates:
• Future migration rates equal to 100 percent of the rates that actually occurred in the 1980s
• Future migration rates equal to 50 percent of the rates in the 1980s
• No net future migration into or out of the county.
The TWDB then adopted one of these three population projections as the “most likely”
for the county or ran a fourth projection as the most likely set. The State Data Center
projection is a single projection showing future population if migration rates are the same as
those from 1990 through 1996.
The existing population projections for each county were reviewed, and changes to
projections were recommended where current populations deviate significantly from the
previous TWDB projections. The 1998 State Data Center projections were considered
carefully in this process since they are based on the most recent available migration
information.
Once the county population projections were completed, city population projections were
adjusted based on historical trends and knowledge of expected future development. The
county population projections served as controls in this process, and all population not
assigned to a particular city was included as “county other” for that county.

2.6
Revisions to Water Demand Projections
As discussed in Section 1, municipal use is over 85 percent of the total water use in
Region C. TWDB estimates of municipal demand are based on projections of population and
per capita municipal water demand. The projected population is multiplied by the projected
per capita municipal demand to determine the projected municipal water use. TWDB’s
projections of per capita municipal water demand from the 1997 Texas Water Plan (11) were
compared with per capita water demand in the 1990s from TWDB data (9). In addition, data
were developed on 1998 per capita water use for many Region C water providers. Previous
TWDB projections in per capita water demand were adjusted to reflect actual use in the
1990s, trends in water use, water conservation, reasonable minimum demands for water,
knowledge of future development that might affect per capita needs, and other factors.
Tables and graphs were developed for each city in the region. They are not included in this
report due to space limitations, but they were provided to the Region C Technical Review
Committee and the TWDB to assist in the review of the recommended projections.
Projections of water demand for steam electric power generation were revised based on
input from TXU Electric. The revised projections are higher than previous TWDB
projections because of the surge in power plant development that is presently occurring.
Previous TWDB projections for manufacturing, mining, irrigation, and livestock use were
left unchanged after comparison with recent historical data.
Review of Initial Recommendations for Population and Water Use Projections
The Region C Water Planning Group formed a Technical Review Committee consisting
of experienced water resource planners to review the recommendations of the consultants on
population and water use and report to the planning group. The Technical Review
Committee met with the Region C consultants five times for a total of 35 hours to review and
finalize the population and water demand projections for the region. These meetings
included a thorough review and discussion of the population and municipal demand
projections for each water user group in the region. The report of the Technical Review
Committee is included as Appendix E. The Region C Water Planning Group also held a
public meeting to receive input on the water demand projections.

2.7
The TWDB staff conducted a thorough review of the revisions to projected population
and water demand recommended by the Region C Water Planning Group. A number of
additional changes were made as a result of TWDB input, and the TWDB board approved the
revised projections in December of 1999.
2.4. Population Projections
Table 2.3 presents the population projections by county for Region C as recommended by
the Region C water planning group and approved by TWDB. Figure 2.4 shows the historical
and projected population for the region. Figure 2.5 is a map of the projected 2050 population
and the projected change between 1996 and 2050 by county. All counties are projected to
increase in population between now and 2050, and the new 2050 population projection for
Region C is 9,481,157, which is 7.2 percent higher than the previous TWDB projection. The
newly adopted 2050 population projections are higher than the previous TWDB projections
for Collin, Cooke, Denton, Fannin, Freestone, Grayson, Kaufman, Navarro, and Wise
Counties. They are lower than the previous projections for Ellis County, and they are the
same for Dallas, Henderson, Jack, Parker, Rockwall, and Tarrant Counties. The reasons for
the changes to county population projections are as follows:
Collin. The estimated 1998 population for Collin County exceeds TWDB’s projected
population for the year 2000. In the 1990s, population growth has been slightly above
TWDB’s highest projection and well above TWDB’s most likely projection. The
adopted projection follows TWDB’s highest projection through 2020 and shows slower
growth thereafter.
Cooke. The estimated 1998 population for Cooke County exceeds TWDB’s projections
for 2000 and 2010. The adopted projection follows the 1998 State Data Center projection
through 2020 and continues slow growth thereafter.
Denton. Based on growth through 1998, the expected year 2000 population for Denton
County will exceed TWDB’s most likely projection. The adopted projection for 2000 is
based on extending the 1990-98 growth trend. The adopted projection parallels the State
Data Center projection for 2010 through 2030 and shows slower growth thereafter.
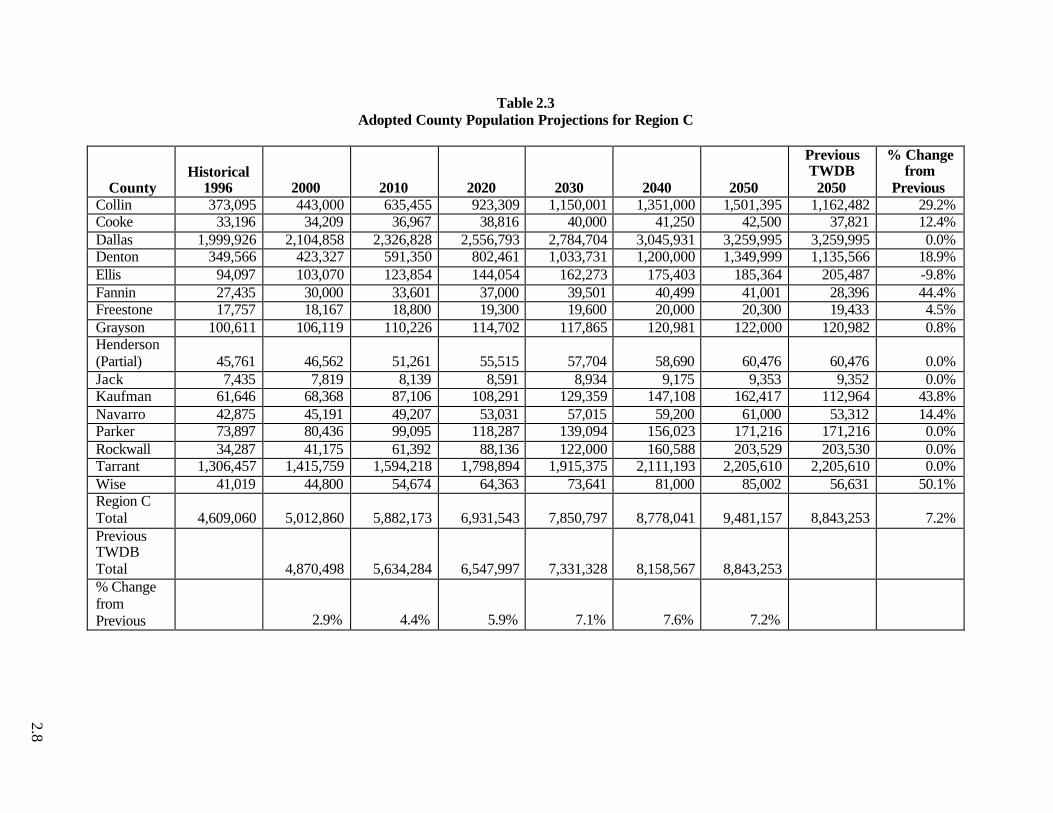
Table 2.3 Adopted County Population Projections for Region C
County Historical
1996 2000 2010 2020 2030 2040 2050
Previous TWDB
2050
% Change from
Previous Collin 373,095 443,000 635,455 923,309 1,150,001 1,351,000 1,501,395 1,162,482 29.2% Cooke 33,196 34,209 36,967 38,816 40,000 41,250 42,500 37,821 12.4% Dallas 1,999,926 2,104,858 2,326,828 2,556,793 2,784,704 3,045,931 3,259,995 3,259,995 0.0% Denton 349,566 423,327 591,350 802,461 1,033,731 1,200,000 1,349,999 1,135,566 18.9% Ellis 94,097 103,070 123,854 144,054 162,273 175,403 185,364 205,487 -9.8% Fannin 27,435 30,000 33,601 37,000 39,501 40,499 41,001 28,396 44.4% Freestone 17,757 18,167 18,800 19,300 19,600 20,000 20,300 19,433 4.5% Grayson 100,611 106,119 110,226 114,702 117,865 120,981 122,000 120,982 0.8% Henderson (Partial) 45,761 46,562 51,261 55,515 57,704 58,690 60,476 60,476 0.0% Jack 7,435 7,819 8,139 8,591 8,934 9,175 9,353 9,352 0.0% Kaufman 61,646 68,368 87,106 108,291 129,359 147,108 162,417 112,964 43.8% Navarro 42,875 45,191 49,207 53,031 57,015 59,200 61,000 53,312 14.4% Parker 73,897 80,436 99,095 118,287 139,094 156,023 171,216 171,216 0.0% Rockwall 34,287 41,175 61,392 88,136 122,000 160,588 203,529 203,530 0.0% Tarrant 1,306,457 1,415,759 1,594,218 1,798,894 1,915,375 2,111,193 2,205,610 2,205,610 0.0% Wise 41,019 44,800 54,674 64,363 73,641 81,000 85,002 56,631 50.1% Region C Total 4,609,060 5,012,860 5,882,173 6,931,543 7,850,797 8,778,041 9,481,157 8,843,253 7.2% Previous TWDB Total 4,870,498 5,634,284 6,547,997 7,331,328 8,158,567 8,843,253 % Change from Previous 2.9% 4.4% 5.9% 7.1% 7.6% 7.2%
2.8

Figure 2.4Historical and Projected Population for Region C
0
1,000,000
2,000,000
3,000,000
4,000,000
5,000,000
6,000,000
7,000,000
8,000,000
9,000,000
10,000,000
1900 1910 1920 1930 1940 1950 1960 1970 1980 1990 2000 2010 2020 2030 2040 2050
Year
Popu
latio
n
HistoricalTWBD ProjectionsAdopted Projections

JACK WISE
FANNIN
NAVARRO
FREESTONE
HENDERSON
ROCKWALL
COOKE
ELLIS
N
EW
S
0 – 10,00010,000 – 50,00050,000 – 100,000100,000 – 500,000500,000 – 1,500,0001,500,000 +
GRAYSON
DENTON
PARKER TARRANT DALLAS
KAUFMAN
COLLIN
JACK WISE
FANNIN
NAVARRO
FREESTONE
HENDERSON
ROCKWALL
COOKE
ELLIS
N
EW
S
0%– 10%10%– 25%25% – 50%50% – 100%100% - 200%200% +
GRAYSON
DENTON
PARKER TARRANT DALLAS
KAUFMAN
COLLIN
Figure 2.5 Adopted Population Projections for 2050
Approved Relative Population 2050
Approved % Increase 1996 - 2050
2.9
Ellis. Based on growth through 1998, the expected year 2000 population for Ellis County
will be less than TWDB’s most likely projection. The adopted projection follows the State
Data Center projection, which is lower than TWDB’s most likely projection, through 2030
and parallels TWDB’s most likely projection from 2030 through 2050.
Fannin. The estimated 1998 population for Fannin County exceeds TWDB’s projections for
2000, 2010, and 2020. The adopted projection follows information provided by the county
through 2010 and shows slower growth thereafter.
Grayson. The estimated 1998 population projection for Grayson County exceeds TWDB’s
projection for 2000. The adopted population for 2000 is based on extending the 1990-98
growth trend. After 2000, the adopted projection shows slightly slower growth than
TWDB’s most likely scenario. The adopted projection for 2050 is almost the same as
TWDB’s previous most likely projection.
Kaufman. Based on growth through 1998, the expected year 2000 population for Kaufman
will exceed the TWDB’s most likely projection. The adopted projections through 2050 are
the average of TWDB’s 100 percent migration and most likely projections.
Navarro. The estimated 1998 population for Navarro County exceeds the TWDB’s
projection for 2000. The adopted projection follows a projection provided by the county
(very close to the State Data Center projection) through 2030 and parallels TWDB’s 100
percent migration projection thereafter.
Wise. Based on growth through 1998, the estimated 2000 population for Wise County will
exceed TWDB’s projection. The adopted projection follows a projection provided by the
county (very close to the State Data Center projection) through 2030 and projects slower
growth thereafter.
Although the adopted year 2050 population projections for Dallas and Jack Counties are the
same as the previous TWDB projections, they are slightly different in the early decades. Dallas
County requires a slight adjustment for 2000 and 2010 in order to balance the projections for the
individual cities. Jack County’s estimated 1998 population is greater than TWDB’s projections
for 2000 and 2010. The adopted projection uses 1990-98 growth to estimate 2000 population,

2.10
uses the State Data Center projection for 2010-2030 and uses TWDB’s most likely projection for
2050.
In summary, changes were made to the previous TWDB county population projections for
the following reasons:
• Estimated 1998 population exceeds TWDB’s projected population for 2000 (Collin, Cooke, Fannin, Freestone, Grayson, Jack, Navarro).
• Projected 2000 population based on 1990-98 growth rate exceeds TWDB’s projected population for 2000 (Denton, Kaufman, Wise).
• Projected 2000 population based on the 1990-98 growth rate is less than TWDB’s projected population for 2000 (Ellis).
• Small adjustments made to balance city populations (Dallas County, 2000 and 2010).
Table 2.4 presents a summary of the change in the projected 2050 population for each Region C
county and the reasons for the changes.
Once the county population projections were completed, city population projections were
adjusted based on historical trends and knowledge of expected future development. The county
populations served as controls in this process, and all population not assigned to a particular city
was included as county other. Appendix F includes the adopted Region C population projections
by county, water user group, and basin. Table D-2 in Appendix D shows the reasons for the
changes from previous TWDB population projections for each city. Population changes for
cities are based on one or more of the following factors:
Current population exceeds TWDB year 2000 projection. In some cities, recent
population estimates by the State Data Center indicate that the current population exceeds
TWDB projections for 2000. This indicates that the city is growing faster than previously
projected by TWDB.
Recent growth trends exceed TWDB’s projected trends. Some cities have experienced a
change in growth trends in recent years. These are often areas in partially urbanized or urban
fringe counties. In these cases, growth trends in the 1990s support a higher growth rate than
was used in the previous TWDB projections.
Urbanization. Some cities are in transition from undeveloped rural areas into more urban
areas. Others are expected to make such a transition between now and 2050. In these
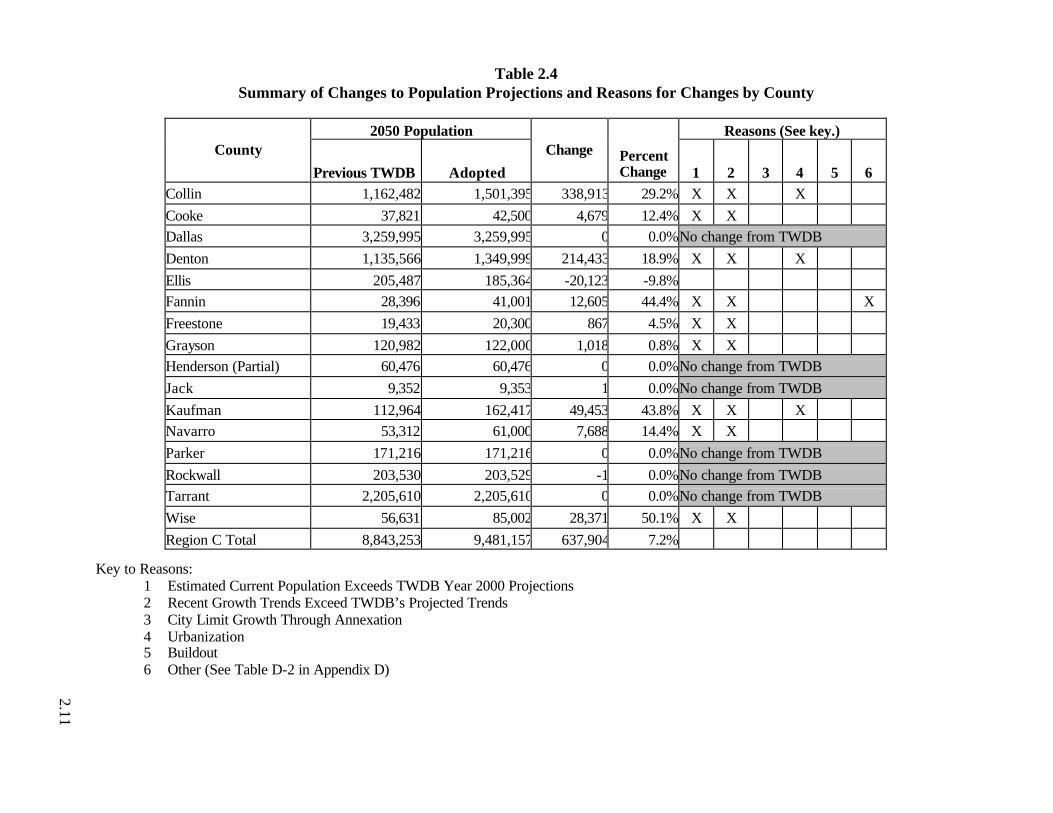
Table 2.4 Summary of Changes to Population Projections and Reasons for Changes by County
2050 Population Reasons (See key.) County
Previous TWDB Adopted
Change Percent Change 1 2 3 4 5 6
Collin 1,162,482 1,501,395 338,913 29.2% X X X Cooke 37,821 42,500 4,679 12.4% X X Dallas 3,259,995 3,259,995 0 0.0%No change from TWDB Denton 1,135,566 1,349,999 214,433 18.9% X X X Ellis 205,487 185,364 -20,123 -9.8% Fannin 28,396 41,001 12,605 44.4% X X X Freestone 19,433 20,300 867 4.5% X X Grayson 120,982 122,000 1,018 0.8% X X Henderson (Partial) 60,476 60,476 0 0.0%No change from TWDB Jack 9,352 9,353 1 0.0%No change from TWDB Kaufman 112,964 162,417 49,453 43.8% X X X Navarro 53,312 61,000 7,688 14.4% X X Parker 171,216 171,216 0 0.0%No change from TWDB Rockwall 203,530 203,529 -1 0.0%No change from TWDB Tarrant 2,205,610 2,205,610 0 0.0%No change from TWDB Wise 56,631 85,002 28,371 50.1% X X Region C Total 8,843,253 9,481,157 637,904 7.2%
Key to Reasons:
1 Estimated Current Population Exceeds TWDB Year 2000 Projections 2 Recent Growth Trends Exceed TWDB’s Projected Trends 3 City Limit Growth Through Annexation 4 Urbanization 5 Buildout 6 Other (See Table D-2 in Appendix D)
2.11

2.12
situations, historical growth trends are not accurate indicators of future trends. The
growth experienced by similar areas that have already gone through such urbanization is
a better guide. For example, growth trends experienced by Plano from 1980 through
2000 can be used as a model for McKinney and Frisco. Growth trends experienced by
Lewisville and Flower Mound can serve as models for adjacent communities in Denton
County.
Build Out. For some cities, the expected build out population is less than the previous
TWDB projection for 2050. The area available for development and the expected
population density will limit population in these cities.
Other. Other reasons for changes in population projections are covered on a case-by-
case basis in Table D-2.
2.5 Water Demand Projections
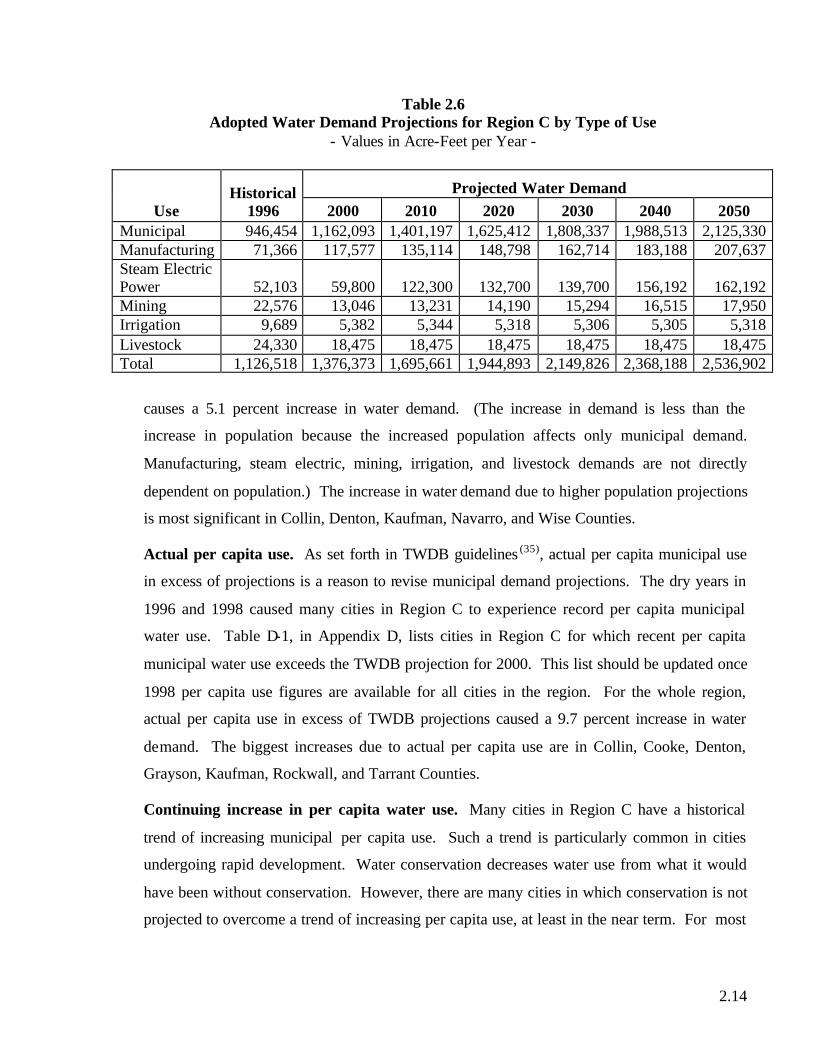
Table 2.5 shows adopted water demand projections for Region C by county. Table 2.6
and Figure 2.6 show the projected water demand for the region by type of use. Figure 2.7 is
a map of the projected 2050 water demand and the projected change between 1996 and 2050
by county. The projected 2050 water demand for Region C is 2,536,902 acre-feet per year,
which is 28.9 percent higher than the previous TWDB projection. The projected year 2050
demand is more than double the 1996 use in the region. The newly adopted projections are
higher than the previous TWDB projections for all counties except Fannin and Henderson.
For both Fannin and Henderson Counties, the reduction in projected 2050 water demand is
due to a reduction in projected water demand for steam electric power generation. Most of
the change from previous TWDB projections is in projected municipal demands, with a
smaller change in steam electric power demands. No changes were made to TWDB’s
previous projections for manufacturing, mining, irrigation, or livestock demands.
Table 2.7 presents a summary of the specific reasons for changes to projected water
demand for each county. Specific reasons for the increases include the following:
Population change. As set forth in TWDB guidelines (35), a change in projected
population requires a change in projected water use. The adopted 2050 population
projection for Region C is 7.2 percent higher than the previous TWDB guidelines, which

Table 2.5 Adopted County Water Demand Projections for Region C
Projected Water Demand (Acre-Feet per Year)
County
Historical 1996
(Acre-Feet per Year) 2000 2010 2020 2030 2040 2050
Previous TWDB 2050
(Acre-Feet per Year)
% Change
from Previous
Collin 89,230 129,015 199,964 262,520 312,307 363,821 401,007 202,680 97.9%Cooke 8,429 9,054 9,133 9,238 9,304 9,581 9,879 8,147 21.3%Dallas 505,423 594,937 683,097 751,767 810,356 883,850 940,289 860,588 9.3%Denton 65,075 90,209 135,740 185,725 230,286 257,410 281,989 172,338 63.6%Ellis 19,721 24,372 43,204 46,030 49,309 53,991 55,575 36,857 50.8%Fannin 17,515 12,100 13,330 14,500 15,597 16,572 17,515 30,147 -41.9%Freestone 20,608 20,074 31,058 33,000 33,036 37,260 37,290 17,691 110.8%Grayson 29,152 29,060 29,760 30,242 31,347 32,508 33,688 28,553 18.0%Henderson (Partial) 10,785 12,697 13,169 13,478 13,697 13,737 13,908 44,014 -68.4%Jack 3,337 2,644 2,589 2,574 2,591 2,615 2,652 2,346 13.0%Kaufman 10,653 21,219 24,401 27,392 32,361 34,832 42,017 17,035 146.7%Navarro 10,558 10,301 10,845 11,210 11,850 12,303 12,735 10,159 25.4%Parker 12,372 14,120 24,528 28,455 37,697 42,853 45,725 21,858 109.2%Rockwall 6,566 9,160 19,805 26,027 33,061 41,320 50,249 32,219 56.0%Tarrant 291,406 379,205 423,578 468,728 490,960 527,716 553,302 462,745 19.6%Wise 25,688 18,206 31,460 34,007 36,067 37,819 39,082 20,539 90.3%Region C Total 1,126,518 1,376,373 1,695,661 1,944,893 2,149,826 2,368,188 2,536,902 1,967,916 28.9%Previous TWDB Total 1,280,104 1,416,271 1,534,409 1,649,168 1,822,174 1,967,916 % Change from Previous 7.5% 19.7% 26.8% 30.4% 30.0% 28.9% 2.13
2.14
Table 2.6 Adopted Water Demand Projections for Region C by Type of Use
- Values in Acre-Feet per Year -
Projected Water Demand Use
Historical 1996 2000 2010 2020 2030 2040 2050
Municipal 946,454 1,162,093 1,401,197 1,625,412 1,808,337 1,988,513 2,125,330 Manufacturing 71,366 117,577 135,114 148,798 162,714 183,188 207,637 Steam Electric Power 52,103 59,800 122,300 132,700 139,700 156,192 162,192 Mining 22,576 13,046 13,231 14,190 15,294 16,515 17,950 Irrigation 9,689 5,382 5,344 5,318 5,306 5,305 5,318 Livestock 24,330 18,475 18,475 18,475 18,475 18,475 18,475 Total 1,126,518 1,376,373 1,695,661 1,944,893 2,149,826 2,368,188 2,536,902
causes a 5.1 percent increase in water demand. (The increase in demand is less than the
increase in population because the increased population affects only municipal demand.
Manufacturing, steam electric, mining, irrigation, and livestock demands are not directly
dependent on population.) The increase in water demand due to higher population projections
is most significant in Collin, Denton, Kaufman, Navarro, and Wise Counties.
Actual per capita use. As set forth in TWDB guidelines (35), actual per capita municipal use
in excess of projections is a reason to revise municipal demand projections. The dry years in
1996 and 1998 caused many cities in Region C to experience record per capita municipal
water use. Table D-1, in Appendix D, lists cities in Region C for which recent per capita
municipal water use exceeds the TWDB projection for 2000. This list should be updated once
1998 per capita use figures are available for all cities in the region. For the whole region,
actual per capita use in excess of TWDB projections caused a 9.7 percent increase in water
demand. The biggest increases due to actual per capita use are in Collin, Cooke, Denton,
Grayson, Kaufman, Rockwall, and Tarrant Counties.
Continuing increase in per capita water use. Many cities in Region C have a historical
trend of increasing municipal per capita use. Such a trend is particularly common in cities
undergoing rapid development. Water conservation decreases water use from what it would
have been without conservation. However, there are many cities in which conservation is not
projected to overcome a trend of increasing per capita use, at least in the near term. For most

Figure 2.6Adopted Projections
for Water Use by Category in Region C
0
500,000
1,000,000
1,500,000
2,000,000
2,500,000
3,000,000
2000 2010 2020 2030 2040 2050
Year
Wat
er U
se (
Acr
e-F
eet)
Livestock
Mining
Irrigation
Steam Electric
Manufacturing
Municipal

Figure 2.7 Adopted Water Demand Growth 1996-2050
JACK WISE
FANNIN
NAVARRO
FREESTONE
COOKE
DENTON COLLIN
TARRANT
DALLAS
N
EW
S
Decrease0% - 25%25% - 50%50% - 100%100% +
ELLISHENDERSON
KAUFMAN
PARKER
GRAYSON
ROCKWALL
Water Use in Acre-Feet Per Year
J A C K W I S E
F A N N I N
P A R K E R
N A V A R R O
K A U F M A N
F R E E S T O N E
H E N D E R S O N
R O C K W A L L
C O O K E G R A Y S O N
D E N T O N C O L L I N
T A R R A N T D A L L A S
N
E W
S
1,000 – 10,000 10,000 – 25,000 25,000 – 50,000 50,000 – 100,000 100,000 – 250,000 250,000 – 500,000 500,000 + ELLIS
0 20
SCALE IN MILES
0 20
SCALE IN MILES
Approved 2050 Water Demand Projection Percent Change, 1996 To 2050 Recommended Projection

Table 2.7 Summary of Water Demand Changes and Reasons for Changes by County
- Values in Acre-Feet per Year -
2050 Water Demand Reasons (See key.) County Previous
TWDB Adopted Change
1 2 3 4 5 6 7
Collin 202,680 401,007 198,327 50,798 78,424 57,466 15 4,271 6,500 853
Cooke 8,147 9,879 1,732 636 697 238 169 0 0 -8
Dallas 860,588 940,289 79,701 1,257 35,365 24,925 0 4,107 2,000 12,047
Denton 172,039 281,989 109,950 39,132 13,123 13,907 3,051 21,238 5,000 14,499
Ellis 36,674 55,575 18,901 -1,676 1,643 461 101 890 18,000 -518
Fannin 30,147 17,515 -12,632 1,628 432 187 21 0 -15,000 100
Freestone 17,691 37,290 19,599 95 206 47 93 0 19,192 -34
Grayson 28,553 33,688 5,135 276 3,468 416 29 939 0 7
Henderson (Partial) 44,014 13,908 -30,106 90 1,229 4 278 0 -31,000 -707
Jack 2,346 2,652 306 -1 187 64 17 0 0 39
Kaufman 17,035 42,017 24,982 4,801 2,791 2,132 33 233 15,000 -8
Navarro 10,342 12,735 2,393 1,575 739 0 58 0 0 21
Parker 21,858 45,725 23,867 1,889 2,413 2,963 1,098 3,605 11,900 -1
Rockwall 32,219 50,249 18,030 -1,697 5,804 7,264 0 0 6,000 659
Tarrant 462,903 553,302 90,399 -521 43,061 37,875 662 907 6,800 1,615
Wise 20,680 39,082 18,402 2,530 760 0 893 3,038 11,200 -19
Region C Total 1,967,916 2,536,902 568,986 100,812 190,342 147,949 6,518 39,228 55,592 28,545
Region C Total % 28.9% 5.1% 9.7% 7.5% 0.3% 2.0% 2.8% 1.5%
Key to Reasons for Change: 1 Population change is the change in projected water demand caused by changes to population projections. 2 Actual per capita use is the change in projected water demand caused by per capita use in the late 1990s being higher than projected for 2000 by TWDB. 3 Continuing increase is the change in projected water demand caused by an increase in per capita use in the future consistent with trends seen in the 1990s. 4 Minimum per capita is the change in projected water demand caused by assuming a minimum level of per capita use. 5 Future development is the change in projected water demand caused by assuming an increase in per capita use as cities change from rural to suburban in
character. 6 Steam electric is the change in projected water demand caused by increased use for steam electric power production. 7 Other is the change in projected water demand cause by other factors, including anticipated commercial development. 2.15

2.16
Region C cities with increasing per capita use in the 1990s, the trend is assumed to continue
through 2010, partially offset by conservation. For some cities expected to grow rapidly until
2020, per capita use is assumed to increase through 2020, again partially offset by
conservation. For Region C as a whole, accounting for the continuing increase in per capita
use causes a 7.5 percent increase in projected 2050 water demand, with the biggest change in
rapidly growing areas such as Collin, Denton, Kaufman, Rockwall, and Tarrant Counties.
Minimum per capita use. In the process of determining projected water demands, Region C
adopted a minimum dry year per capita municipal water use – a level designed to provide an
adequate water supply and an adequate quality of life. Based on experience in the region, it
was felt that most per capita municipal use less than 115 gallons per person per day occurs in
systems with inadequate supplies and represents supply and delivery limitations rather than
the true demand for water. With few exceptions, a minimum municipal water demand of 115
gallons per capita per day was adopted for Region C, reducing over 50 years to 95 gallons
per capita per day. This change increases the overall regional projected 2050 water demand
by about 0.3 percent, with the biggest increases in Denton, Parker, and Wise Counties.
Future development. As cities in Region C have changed from rural to suburban, the per
capita municipal water use has historically risen. This occurs because the nature of the
housing changes. The new suburban housing generally has irrigated lawns, swimming pools,
water-using appliances and other features that tend to increase water use. Communities with
low existing per capita water use expected to undergo rapid development are also expected to
see a rise in per capita use, partially offset by water conservation. This assumption causes a
2.0 percent increase to the projected 2050 water demand for Region C, with the biggest
impact in Denton, Parker, and Wise Counties.
Steam electric. TXU Electric provided revised steam electric power demands reflecting
known development plans for TXU and other utilities. These revised numbers reflect the
current trend toward development of new merchant power plants in Region C. The increase
to the projected 2050 steam electric demand causes a 2.8 percent increase to total water
demand for the region.
Other factors. Other factors that influence water demand projections include anticipated
major commercial development, anticipated employment growth, changes in the rate at

2.17
which water conservation is achieved (slower or faster), and increased water demand due to
the development of better supplies in some areas. These other factors increase the overall
Region C water demand by 1.5 percent. They are discussed on a case-by-case basis in Table
D-3 in Appendix D.
Appendix G includes the adopted water demand projections by county, water user group, and
basin. Table D-3 in Appendix D shows the reasons for the changes from previous TWDB
demand projections for each water user group. Appendix H includes the adopted demand
projections by major water provider.
One of the most important factors determining the increase to projected per capita demand
for Region C over previous TWDB projections is the high water use recorded for many Region C
water suppliers in 1996 and 1998. This high water use occurred despite significant efforts to
implement water conservation in the region and despite the impact of low flow plumbing
fixtures. There are several factors that tend to increase per capita municipal water use in the
region:
• In many communities, new development is large houses with large lots, sprinkler systems, swimming pools, and other water-using amenities.
• The number of people per household is decreasing in most of Region C. This tends to cause an increase in per capita use because household uses are spread over fewer people.
• Many Region C communities are experiencing rapid commercial development, which also drives up per capita water use.
Table D-4 in Appendix D shows 1997 unaccounted water data for Region C water suppliers.
(The table is based on TWDB records and includes only entities for which TWDB had data
available.) Unaccounted water is potable water put into the distribution system but not metered
as sold. Causes of unaccounted water can include inaccurate metering, unmetered uses, fire
flows, line flushing flows, and losses to leaks. In general, unaccounted water less than 10
percent is excellent in a municipal distribution system, and values in the 15 to 20 percent range
are acceptable. Rural water suppliers, which tend to have more pipeline per customer, may
experience somewhat higher losses. For Region C as a whole, unaccounted water was 10.1
percent in 1997, which is excellent. Some water suppliers show high values for unaccounted
water. For the most part, these are smaller cities and rural water suppliers. A continual pattern

2.18
of high unaccounted water might indicate that the supplier should investigate the problem and
make appropriate improvements.
In summary, the reasons for the 28.9 percent increase in projected 2050 water demands over
previous TWDB projections, which would have been greater without the incorporated water
conservation assumptions, are as follows:
• 5.1 percent due to increased population projections.
• 9.7 percent due to actual per capita municipal demand in recent years above the previous TWDB projection for 2000.
• 7.5 percent due to continuing recent trends of increasing per capita municipal demand through 2010 or 2020. (These trends have been reduced by conservation efforts, but per capita municipal demand is still increasing overall in many cities.)
• 0.3 percent due to adoption of a minimum per capita municipal demand.
• 2.0 percent due to increases in per capita municipal demand assumed to occur with rapid suburban development in rural areas.
• 2.8 percent due to increased projections for steam-electric power generation.
• 1.5 percent due to other factors, including commercial development and employment growth.
Related Documents