2 nd Year, M.Planning (2008-10) Department of Environmental Planning Contributions by: Ashish, Debashish, Garfield, Jyoti , Priyanka, Raina, Rajni, Roshni, Ruth, Sneha, Tamosi, Vivekanand SCHOOL OF PLANNING AND ARCHITECTURE, NEW DELHI SCHOOL OF PLANNING AND ARCHITECTURE, NEW DELHI Seminar on Indo-British Perspectives on Planning and Indo-British Perspectives on Planning and Architecture Education Architecture Education August 19-20, 2010 August 19-20, 2010 USE OF TOOLS AND TECHNIQUES USE OF TOOLS AND TECHNIQUES Integrated Water Resource Management Plan, Integrated Water Resource Management Plan, Bharatpur Bharatpur

2 nd Year, M.Planning (2008-10) Department of Environmental Planning
Dec 31, 2015
2 nd Year, M.Planning (2008-10) Department of Environmental Planning Contributions by: Ashish, Debashish, Garfield, Jyoti , Priyanka, Raina, Rajni, Roshni, Ruth, Sneha, Tamosi, Vivekanand. SCHOOL OF PLANNING AND ARCHITECTURE, NEW DELHI Seminar on - PowerPoint PPT Presentation
Welcome message from author
This document is posted to help you gain knowledge. Please leave a comment to let me know what you think about it! Share it to your friends and learn new things together.
Transcript

2nd Year, M.Planning (2008-10)Department of Environmental Planning
Contributions by: Ashish, Debashish, Garfield, Jyoti , Priyanka, Raina, Rajni, Roshni, Ruth, Sneha, Tamosi, Vivekanand
SCHOOL OF PLANNING AND ARCHITECTURE, NEW DELHISCHOOL OF PLANNING AND ARCHITECTURE, NEW DELHI
Seminar onIndo-British Perspectives on Planning and Architecture EducationIndo-British Perspectives on Planning and Architecture Education
August 19-20, 2010August 19-20, 2010
USE OF TOOLS AND TECHNIQUESUSE OF TOOLS AND TECHNIQUESIntegrated Water Resource Management Plan,Integrated Water Resource Management Plan,
Bharatpur Bharatpur
INTRODUCTION
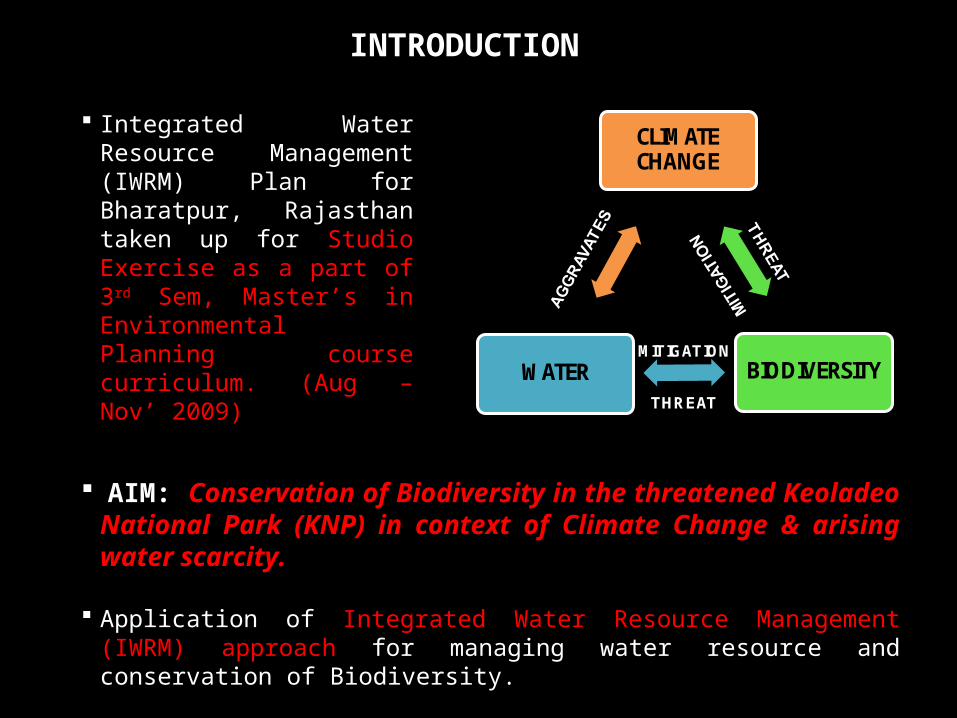
Integrated Water Resource Management (IWRM) Plan for Bharatpur, Rajasthan taken up for Studio Exercise as a part of 3rd Sem, Master’s in Environmental Planning course curriculum. (Aug – Nov’ 2009)
AIM: Conservation of Biodiversity in the threatened Keoladeo National Park (KNP) in context of Climate Change & arising water scarcity.
Application of Integrated Water Resource Management (IWRM) approach for managing water resource and conservation of Biodiversity.
WATER BIODIVERSITY
CLIMATE CHANGE
MITIGATION
THREAT
STRUCTURE of PRESENTATION
• PROJECT INTRODUCTION
• DATA COLLECTION AND ISSUE IDENTIFICATION
• FORMULATION OF STUDY APPROACH
• METHODOLOGY
• SOFTWARE TOOLS USED FOR ANALYSIS
• FRAMEWORK OF ANALYSIS
• PLANNING APPROACH

PROJECT INTRODUCTION Spatial extents of KNP 27º7’6”N – 27º 12’2”N and 77º 29’5” E – 77º 33’9”E Area of 29 sq.km, situated on the western edge of the Gangetic basin on confluence of
R. Ruparel and R. Banganga in Bharatpur, Rajasthan. Created 250 years ago by flooding a natural depression through Ajan Bund. It is a freshwater marshy wetland. One of the 25 Ramsar Wetlands in India & an outstanding important bird areas . Only wetland to be a Protected area (1928), Ramsar site (1981) & World Heritage site (1985)
in north India.
BharatpurDistt
--Source: Envis centre on Wetland, MOEF
Location of Keoladeo National Park in Bharatpur District

DATA COLLECTION & ISSUE IDENTIFICATIONDATA COLLECTION & ISSUE IDENTIFICATION
Literature ReviewLiterature ReviewNEWS ReviewNEWS ReviewPrimary SurveysPrimary SurveysData Collection from Secondary sourcesData Collection from Secondary sourcesStakeholder ConsultationsStakeholder Consultations
• Local Govt. OfficialsLocal Govt. Officials• Non-Govt Organizations Non-Govt Organizations • Academicians & Environmental Research GroupsAcademicians & Environmental Research Groups• Local Public RepresentativesLocal Public Representatives• Local CommunityLocal Community
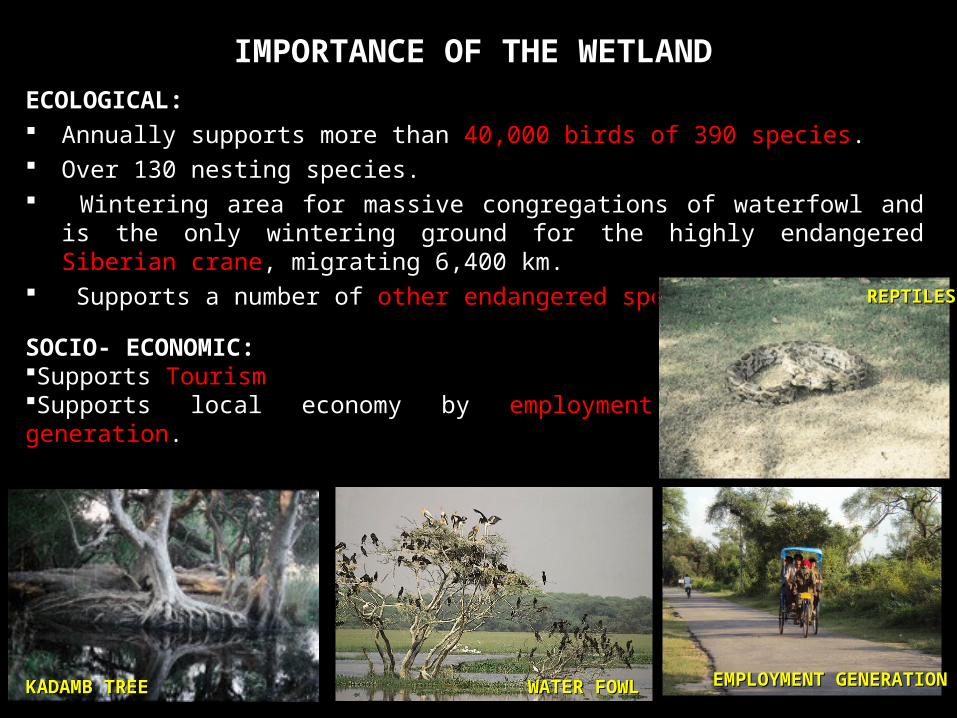
ECOLOGICAL: Annually supports more than 40,000 birds of 390 species. Over 130 nesting species. Wintering area for massive congregations of waterfowl and is the only wintering ground
for the highly endangered Siberian crane, migrating 6,400 km. Supports a number of other endangered species.
KADAMB TREEKADAMB TREE EMPLOYMENT GENERATIONEMPLOYMENT GENERATION
IMPORTANCE OF THE WETLAND
WATER FOWLWATER FOWL
REPTILESREPTILES
SOCIO- ECONOMIC:Supports Tourism Supports local economy by employment generation.

BIODIVERSITY HOTSPOT UNDER THREAT
“The Keoladeo National Park in Rajasthan, better known as the Bharatpur bird sanctuary, is in the danger of losing its Unesco World Heritage Site status if the state government fails to build a drain to bring water into the reserve. The bird sanctuary, which receives more than 300 species of birds, including the Siberian crane, has been facing a severe water crisis.”
The Times of India“Normally thronged by different varieties of winged guests during this time of the year, Keoladeo National Park in Bharatpur district this time wears a deserted look due to delayed and scanty rainfall.”
The Tribune
“The world-renowned park is in dire need of immediate intervention to restore its past glory by ensuring supply of 550-mcft water annually. Several species of birds have deserted the park following failure of projects to bring in water.”
December 5, 2009, The Hindu
“India's famous Keoladeo National Park at Bharatpur in Rajasthan is facing de-recognition from the list of Unesco's world heritage site after a two-member team of the world organisation pointed out the persistent water crisis in the sanctuary”. March 13, 2008, The Hindustan Times
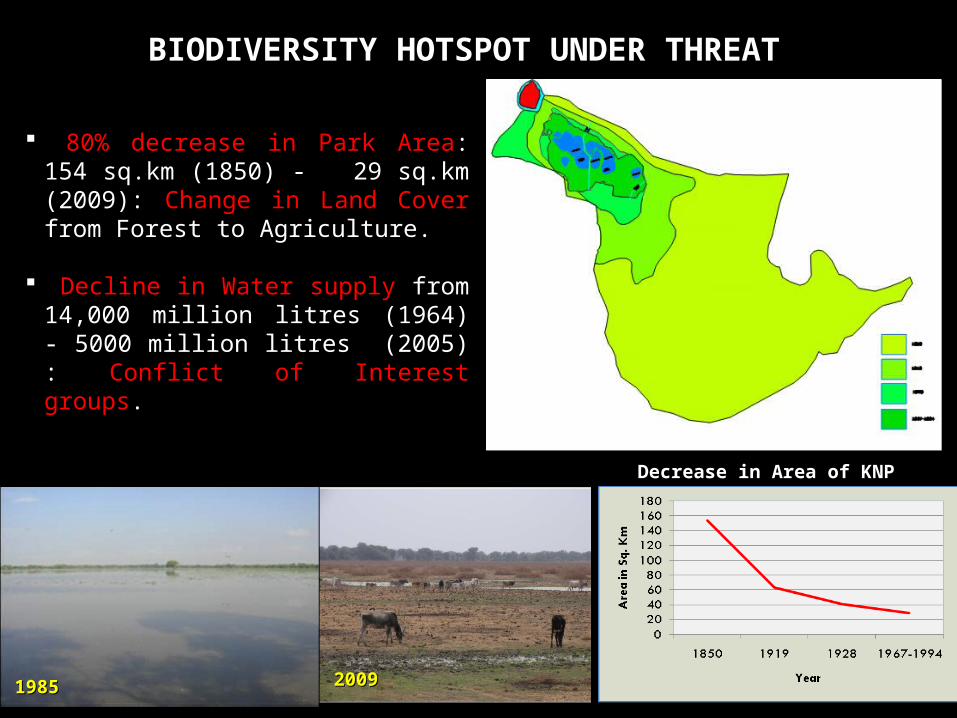
80% decrease in Park Area: 154 sq.km (1850) - 29 sq.km (2009): Change in Land Cover from Forest to Agriculture.
Decline in Water supply from 14,000 million litres (1964) - 5000 million litres (2005) : Conflict of Interest groups.
BIODIVERSITY HOTSPOT UNDER THREAT
19851985 20092009
Decrease in Area of KNPDecrease in Area of KNP

Declining bird population and changing habitats: grassland birds over dry marshlands
Increase in dead trees. Occurrence of dry land vegetation like cactus. Invasion of prosopis juliflora: threat to native
species. Mining of groundwater for supply to wetland
resulted in lowering of water table and affected soil quality.
Steep Decline in population of Siberian Crane & Sarus Crane.
IMPLICATIONS
0
50
100
150
200
250
NO
.OF
SIB
ER
IAN
CR
AN
E
YEARS
WINTERING POPULATION OF SIBERIAN CRANE IN KNP
Decrease in Population of Siberian CraneDecrease in Population of Siberian Crane Incidence of Dead TreesIncidence of Dead Trees
Issues Issues

FORMULATION OF STUDY APPROACHFORMULATION OF STUDY APPROACH
International Case StudiesInternational Case Studies• Murray Basin Strategic Wetland Management Plan, AustraliaMurray Basin Strategic Wetland Management Plan, Australia• Peri-Urban Wetland Management, East Calsutta, IndiaPeri-Urban Wetland Management, East Calsutta, India• Watershed Management in Alwar District, Rajasthan, IndiaWatershed Management in Alwar District, Rajasthan, India
National & State Policy FrameworkNational & State Policy Framework
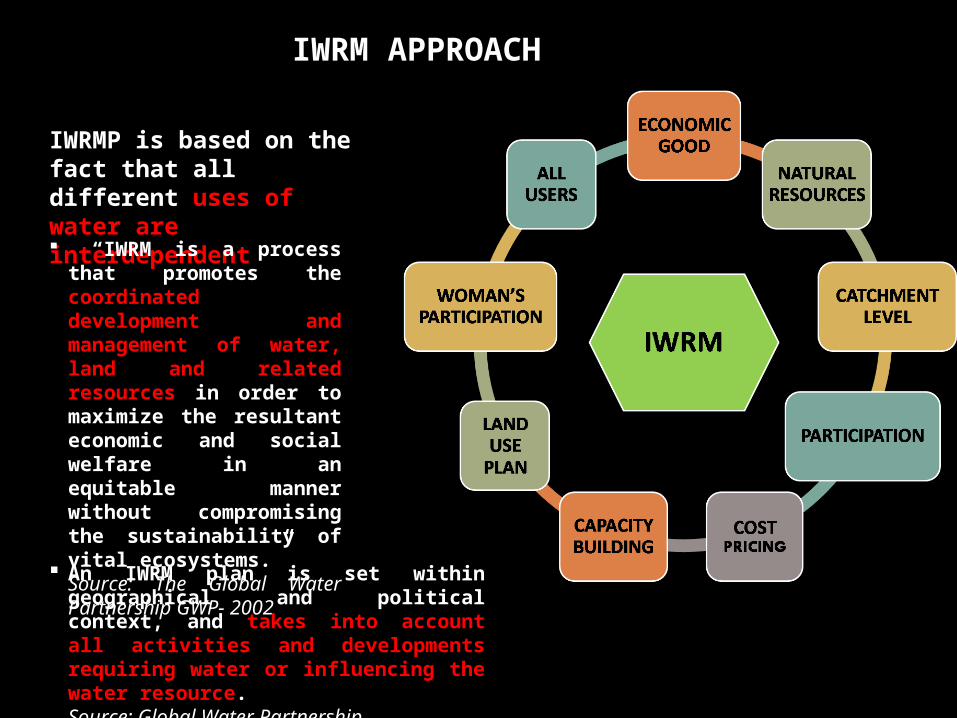
IWRM APPROACH
IWRMP is based on the fact that all different uses of water are interdependent
“IWRM is a process that promotes the coordinated development and management of water, land and related resources in order to maximize the resultant economic and social welfare in an equitable manner without compromising the sustainability of vital ecosystems.” Source: The Global Water Partnership GWP- 2002
An IWRM plan is set within geographical and political context, and takes into account all activities and developments requiring water or influencing the water resource. Source: Global Water Partnership

IWRM AT POLICY LEVEL
National Action Plan on Climate Change
Conservation of wetland through catchment area planning with importance to Land Use & Land Cover.
The National Environmental Policy, 2005
It underlines the need of water resource conservation and appropriate management through an integrated approach.
The Rajasthan State Water Policy (1999), Draft State Water Policy (2005)
National Water Policy (2002)
The adoption and implementation of Integrated Water Resources Management, involving the community.
Paradigm Shift in National & State level Policy for Water Management: from water supply to integrated management of water resources.
Wetland Policy under E(P) Act, 1986 Integrate wetland conservation, including conservation of village ponds and tanks, into sectoral development plans for poverty alleviation and livelihood improvement
The Plan of Implementation adopted at The World Summit on Sustainable Development in Johannesburg In 2002 called for countries To “Develop Integrated Water Resources
Management and Water Efficiency Plans by 2005”.
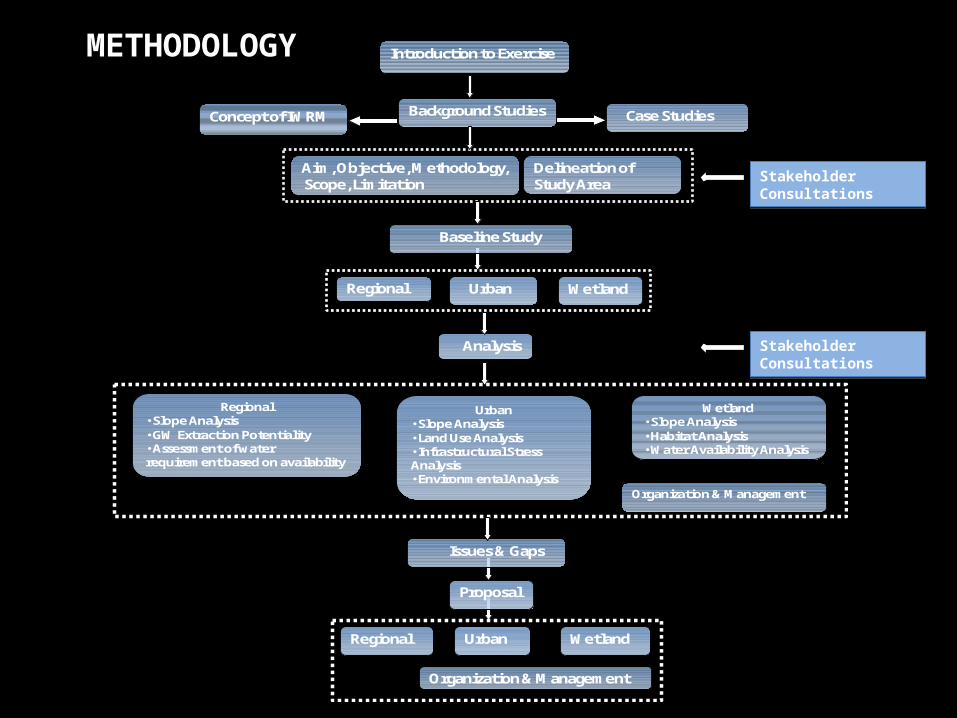
METHODOLOGY Introduction to Exercise
Background Studies
Aim, Objective, Methodology,Scope, Limitation
Concept of IWRM Case Studies
Delineation of Study Area
Baseline Study
Regional Urban Wetland
Analysis
Regional•Slope Analysis•GW Extraction Potentiality•Assessment of water requirement based on availability
Urban•Slope Analysis•Land Use Analysis•Infrastructural Stress Analysis•Environmental Analysis
Wetland•Slope Analysis•Habitat Analysis•Water Availability Analysis
Organization & Management
Issues & Gaps
Proposal
Regional Urban Wetland
Organization & Management
Stakeholder ConsultationsStakeholder Consultations
Stakeholder ConsultationsStakeholder Consultations

SOFTWARE TOOLS USED FOR ANALYSIS AND SOFTWARE TOOLS USED FOR ANALYSIS AND PRESENTATIONPRESENTATION
ADOBE PhotoshopADOBE PhotoshopArc GISArc GISAuto CADAuto CADMS OfficeMS Office
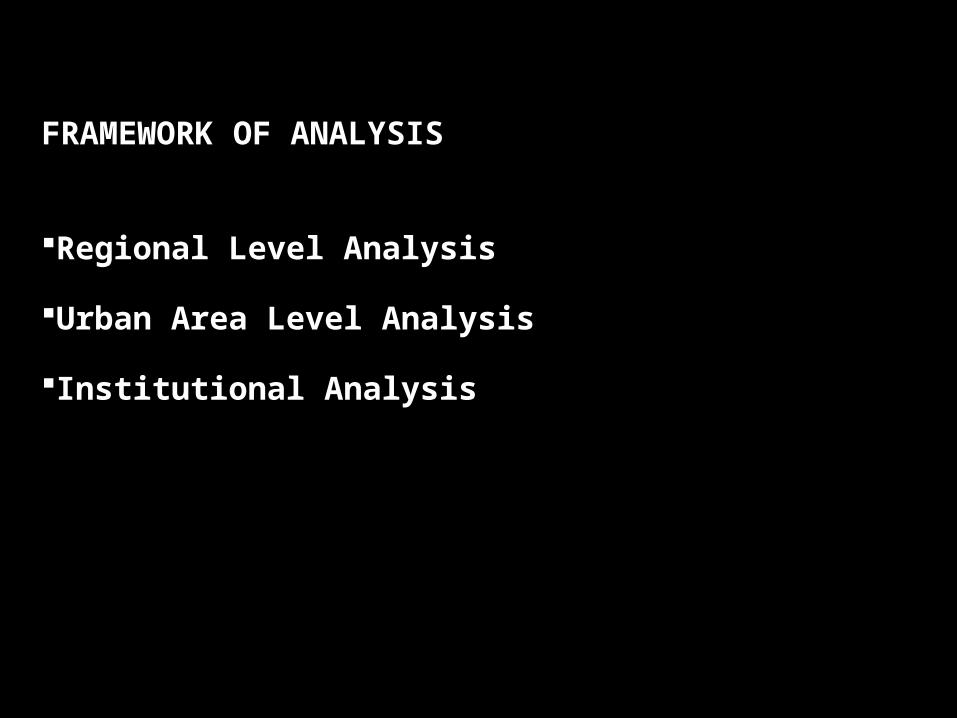
FRAMEWORK OF ANALYSISFRAMEWORK OF ANALYSIS
Regional Level AnalysisRegional Level Analysis
Urban Area Level AnalysisUrban Area Level Analysis
Institutional AnalysisInstitutional Analysis

REGIONAL LEVEL ANALYSISREGIONAL LEVEL ANALYSIS
K.N.P. Watershed Area Delineation K.N.P. Watershed Area Delineation Surface Water Hydrology StatusSurface Water Hydrology Status Ground Water Extraction PotentialGround Water Extraction Potential Water Availability and Requirement ProjectionsWater Availability and Requirement Projections
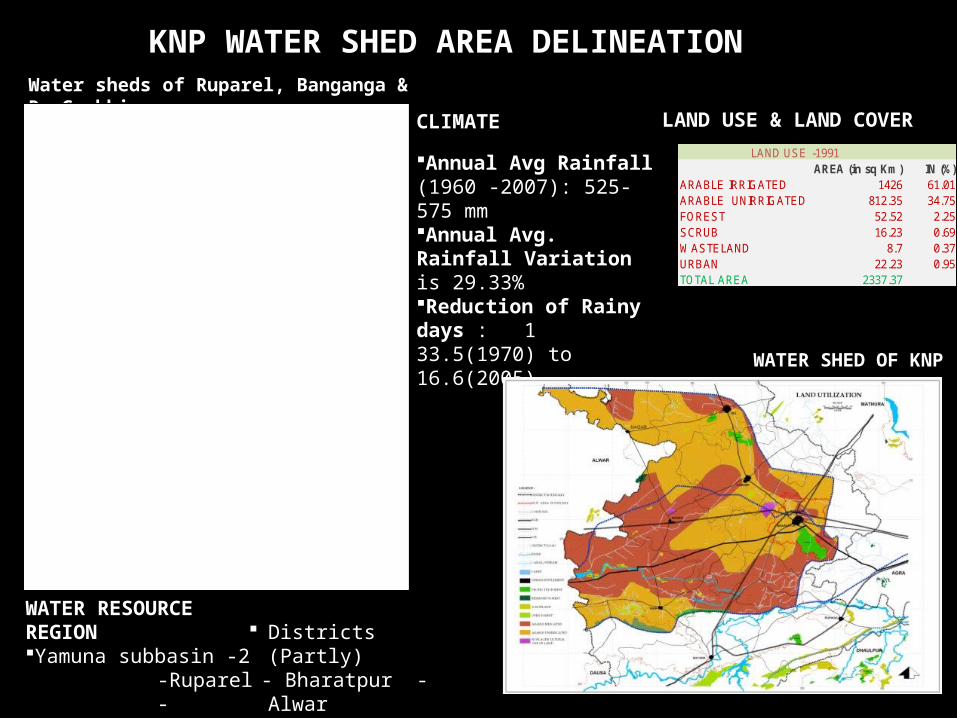
KNP WATER SHED AREA DELINEATION
WATER SHED OF KNP
Water sheds of Ruparel, Banganga & R. Gambhir
WATER RESOURCE REGIONYamuna subbasin -2 -Ruparel - Banganga - Gambhir
Districts (Partly) - Bharatpur - Alwar - Jaipur - Dausa - Kaurali
CLIMATE
Annual Avg Rainfall (1960 -2007): 525-575 mmAnnual Avg. Rainfall Variation is 29.33% Reduction of Rainy days : 1 33.5(1970) to 16.6(2005)
LAND USE & LAND COVERLAND USE -1991
AREA (in sq Km) IN (%)ARABLE IRRIGATED 1426 61.01ARABLE UNIRRIGATED 812.35 34.75FOREST 52.52 2.25SCRUB 16.23 0.69WASTELAND 8.7 0.37URBAN 22.23 0.95TOTAL AREA 2337.37

SURFACE WATER HYDROLOGY STATUS
Drying of Rivers due to harvesting structures upstream accross Bangana in Jaipur and Ruparail in Alwar)
Inland river system - a reason behind the reduced surface water flow. Borrowing water from R.Gambhir watershed for irrigation and KNP. Over-exploitation of ground water for irrigation and other uses.
River Ruparel BanGangaLength 12.34km 52.07kmCatchment Area
898.20 sq.km 1438.97 sq.km
Bunds 34 81Capacity of bunds 19.12mcm 78.16mcmArea irrigated
174.64 sq.km 263.07 sq.km

GROUND WATER EXTRACTION POTENTIAL
PARAMETERS : Quantitative Analysis: Depth to Water Table, Yeild, Development stage of Ground Water Qualitative Analysis : Fluoride content, Salinity, Nitrate content
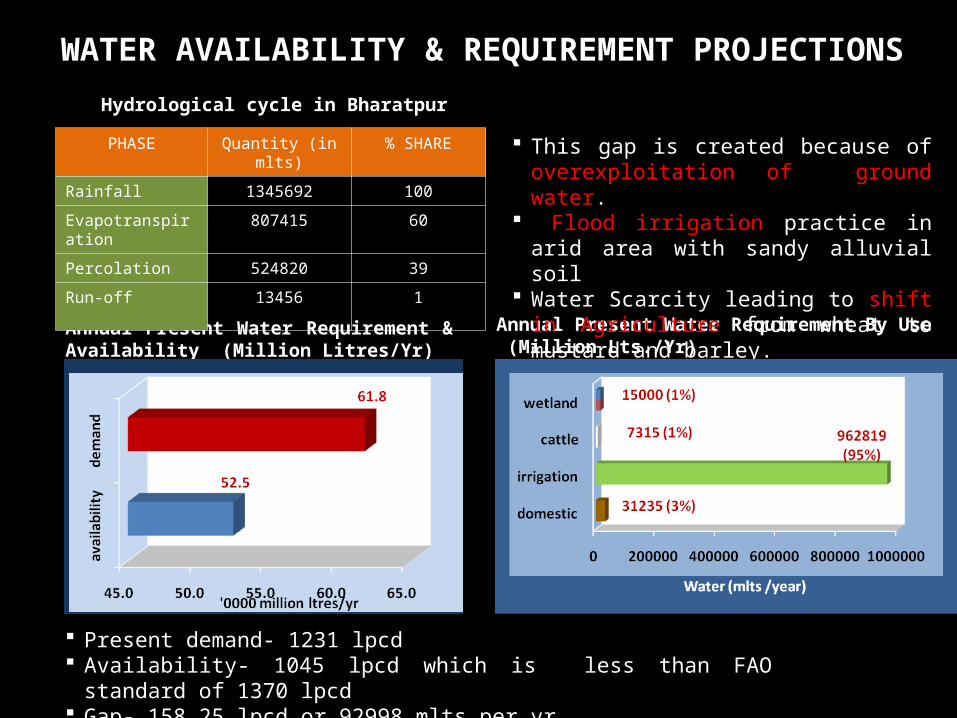
Hydrological cycle in Bharatpur
WATER AVAILABILITY & REQUIREMENT PROJECTIONS
Annual Present Water Requirement By Use (Million Lts./Yr)
Annual Present Water Requirement & Availability (Million Litres/Yr)
Present demand- 1231 lpcd Availability- 1045 lpcd which is less than FAO standard of 1370 lpcd Gap- 158.25 lpcd or 92998 mlts per yr
PHASE Quantity (in mlts) % SHARE
Rainfall 1345692 100
Evapotranspiration 807415 60
Percolation 524820 39
Run-off 13456 1
This gap is created because of overexploitation of ground water.
Flood irrigation practice in arid area with sandy alluvial soil
Water Scarcity leading to shift in Agriculture from wheat to mustard and barley.

URBAN AREA LEVEL ANALYSISURBAN AREA LEVEL ANALYSIS
Land UseLand Use InfrastructureInfrastructure Environmental StatusEnvironmental Status

LAND USE Population Municipal Area: 2.05 lacs (2001 Census). Bharatpur urban area spreads over 29 sq kms, with Fort as the core & walled city
around it. Newer developments spread from Walled City along the NH-6. Increase in Slum areas and decreasing percentage of Open spaces. Degrading status of water bodies & open areas due to Urbanization pressure:
Encroachment & Reclamation of water bodies, stress on Urban Infrastructure.
Land Use, 2001
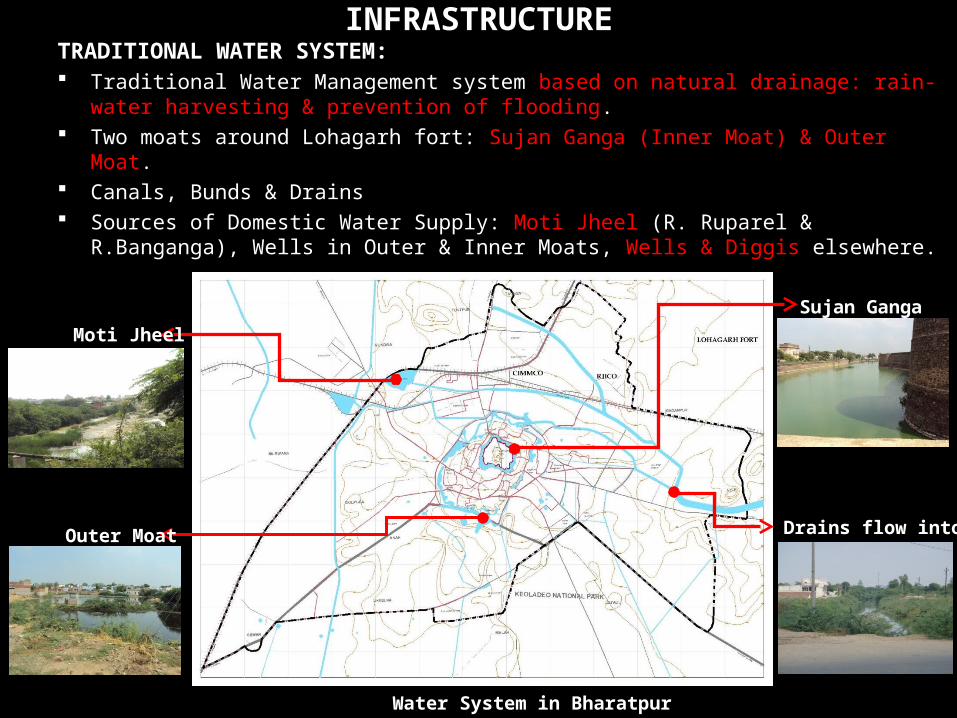
INFRASTRUCTURETRADITIONAL WATER SYSTEM: Traditional Water Management system based on natural drainage: rain-water harvesting &
prevention of flooding. Two moats around Lohagarh fort: Sujan Ganga (Inner Moat) & Outer Moat. Canals, Bunds & Drains Sources of Domestic Water Supply: Moti Jheel (R. Ruparel & R.Banganga), Wells in Outer &
Inner Moats, Wells & Diggis elsewhere.
Water System in Bharatpur
Drains flow into CFCD
Sujan GangaMoti Jheel
Outer Moat
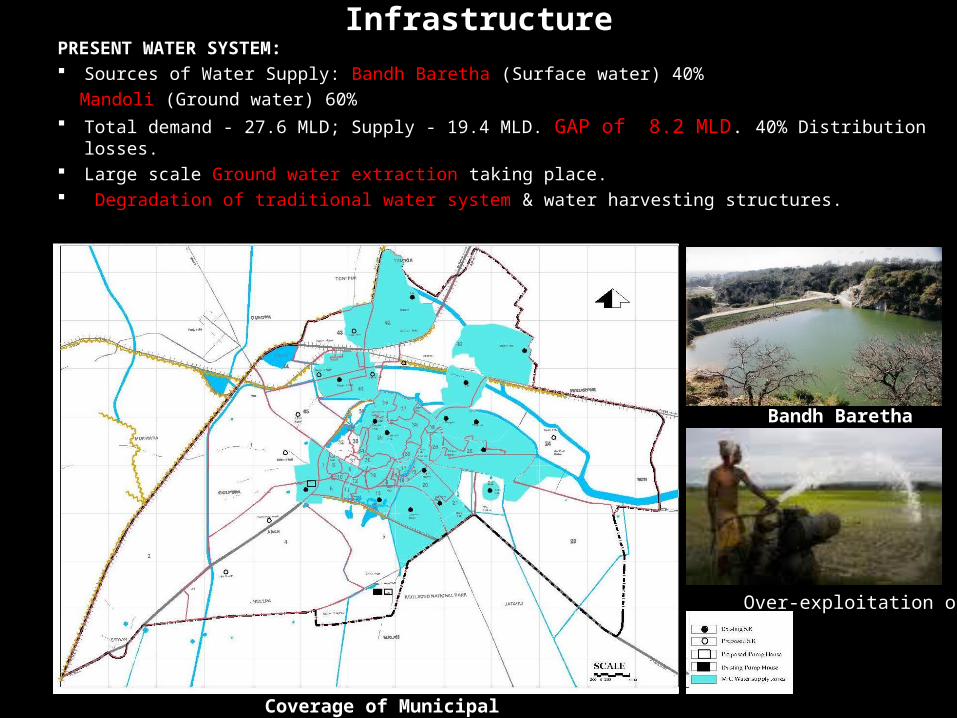
InfrastructurePRESENT WATER SYSTEM: Sources of Water Supply: Bandh Baretha (Surface water) 40%
Mandoli (Ground water) 60% Total demand - 27.6 MLD; Supply - 19.4 MLD. GAP of 8.2 MLD. 40% Distribution losses. Large scale Ground water extraction taking place. Degradation of traditional water system & water harvesting structures.
Coverage of Municipal Water Supply
Bandh Baretha
Over-exploitation of GW
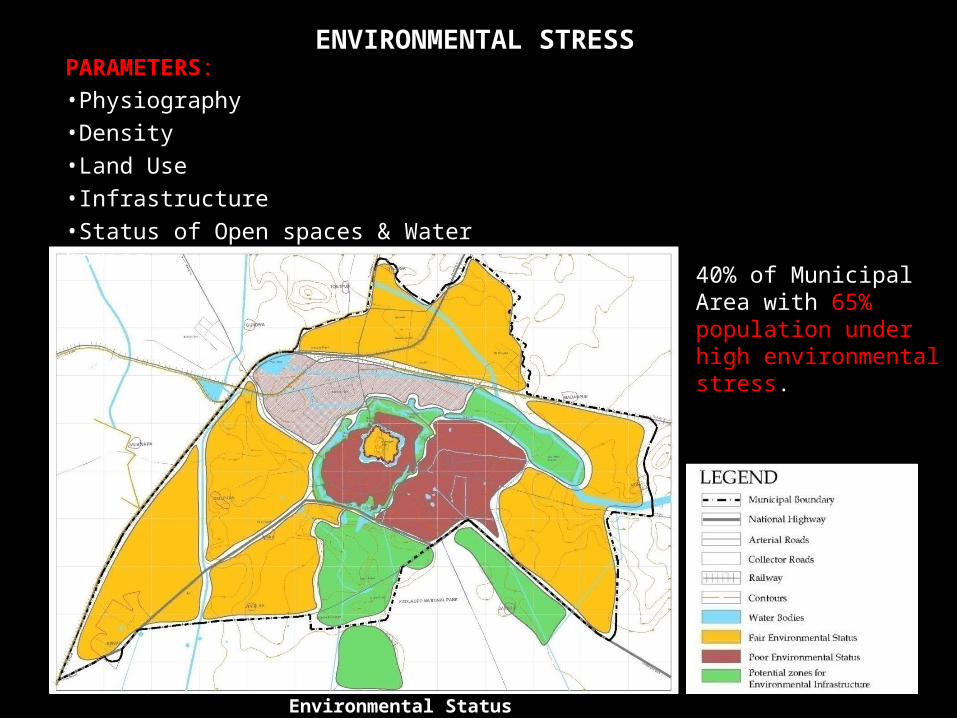
ENVIRONMENTAL STRESS
40% of Municipal Area with 65% population under high environmental stress.
Environmental Status
PARAMETERS:•Physiography•Density•Land Use•Infrastructure •Status of Open spaces & Water bodies

CONCLUSION
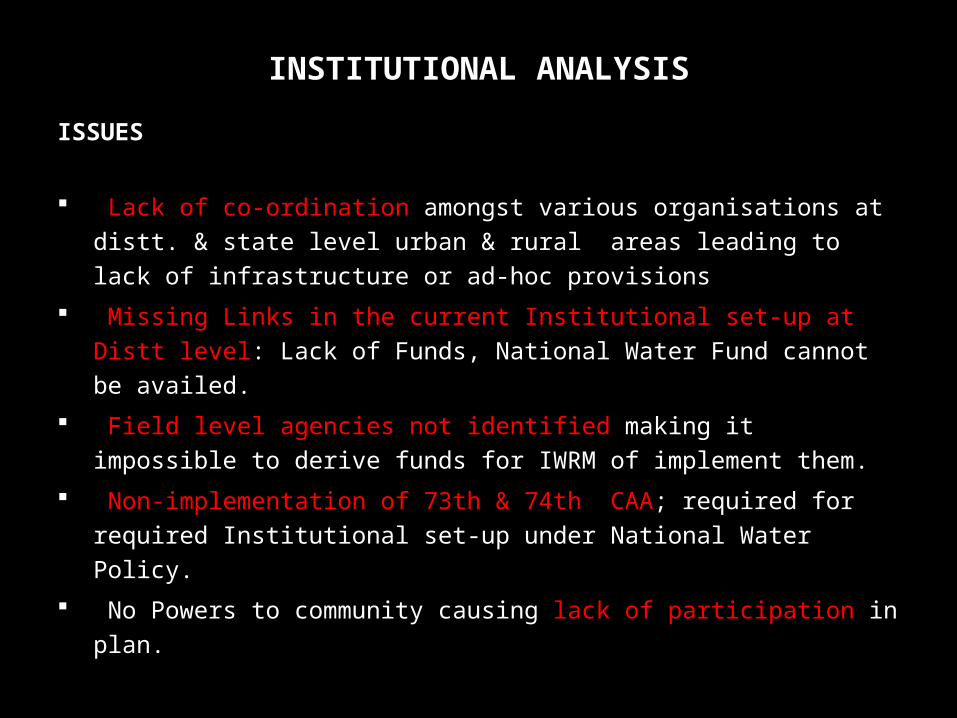
INSTITUTIONAL ANALYSIS
ISSUES
Lack of co-ordination amongst various organisations at distt. & state level urban & rural areas leading to lack of infrastructure or ad-hoc provisions
Missing Links in the current Institutional set-up at Distt level: Lack of Funds, National Water Fund cannot be availed.
Field level agencies not identified making it impossible to derive funds for IWRM of implement them.
Non-implementation of 73th & 74th CAA; required for required Institutional set-up under National Water Policy.
No Powers to community causing lack of participation in plan.

PLANNING APPROACH
PROPOSALS
REGIONAL
Water Budgeting for:
Domestic water demand
Irrigation water demand
URBAN
Land Management
Provision of Sustainable Infrastructure
WETLAND
• Water Management
• Vegetation Management
37777.5
16132.8
16014.4
14078.5
53791.9
30211.4
0
10000
20000
30000
40000
50000
60000
R ural Urban T otal
P rojec tetd P res ent
0200000400000600000800000
10000001200000
Present Projected
617691
1143336
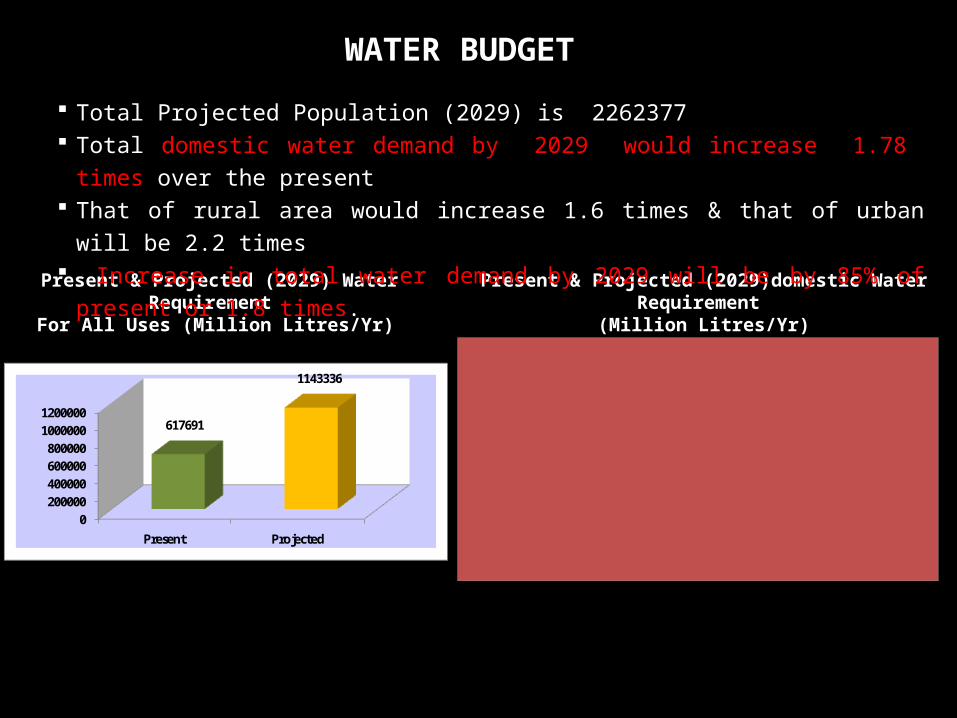
Present & Projected (2029)domestic Water Requirement (Million Litres/Yr)
Present & Projected (2029) Water Requirement For All Uses (Million Litres/Yr)
Total Projected Population (2029) is 2262377 Total domestic water demand by 2029 would increase 1.78 times over the present That of rural area would increase 1.6 times & that of urban will be 2.2 times Increase in total water demand by 2029 will be by 85% of present or 1.8 times.
WATER BUDGET

UseExisting Standard
Requirement Losses Total ReqdProposed Standard
Remarks
Residential (lpcd) 135Existing (lpcd) 60 9 69 70 lpcd Without SewerageNew (lpcd) 81 12.15 93 95 lpcd With Sewerage
PSP
Offices (lpcd) 45 37.5 5.625 4310780 lt per ha per day Density 250 pph
Institutional (lpcd)
Hospital (lpcd) 450 220 33 253 250 lpcdPer Bed for >100 beds
Boardings (lpcd) 135 30 4.5 35 35 lpcd Per PupilHostel (lpcd) 135 80 12 92 90 lpcd Per Resident
CommercialRetail, Wholesale & Entertainment (lpcd)
45 20 3 23 5750 lt per ha per day
Density 250 pph
Hotels (lpcd) 180 135 13.5 149 150 lpcd Per BedRestaurant (lpcd) 70 70 70 70 70 lpcd Per seat
Mixed (lpcd) 152 85.05 12.7575 98 95 lpcd5% additional to Residential
IndustryKnowledge based Industry (lpcd)
45 37.5 5.625 43 10780 lt per ha per day
Considering as PSP/Offices,Density 250 pph
Medium & Small Scale (lt per ha per day) 8500 1275 9775
9775 lt per ha per day
Low water consuming SSI
For existing standards, guidelines of UDPFI & PHED, Rajasthan have been considered. For minimum required quantities, Design Manual for Water Supply & Treatment, India 1991 and
Construction Manual for Large & Medium Projects, MoEF 2007 have been referred. Wastage and Distribution losses upto a maximum of 15% have been accounted. Waste Water generation is assumed to be 80% of the consumed water as a thumb rule.
DERIVED STANDARDS FOR WATER DEMAND
2029Population Water Demand Population Water Demand Waste Water Generation
2,05,235 21.49 mld. 2,90,000 30.55 mld. 24.44 mld.
2001 2029Water Demand Calculation
PROJECTED WATER DEMAND IN URBAN AREA
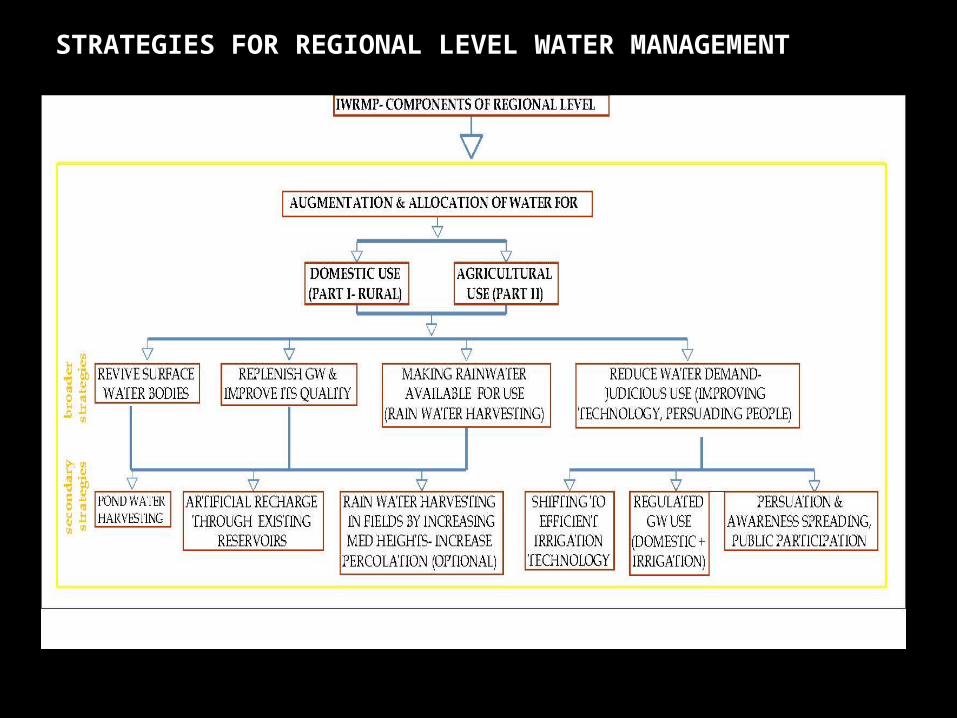
STRATEGIES FOR REGIONAL LEVEL WATER MANAGEMENT

STRATEGIES FOR REGIONAL LEVEL WATER MANAGEMENT
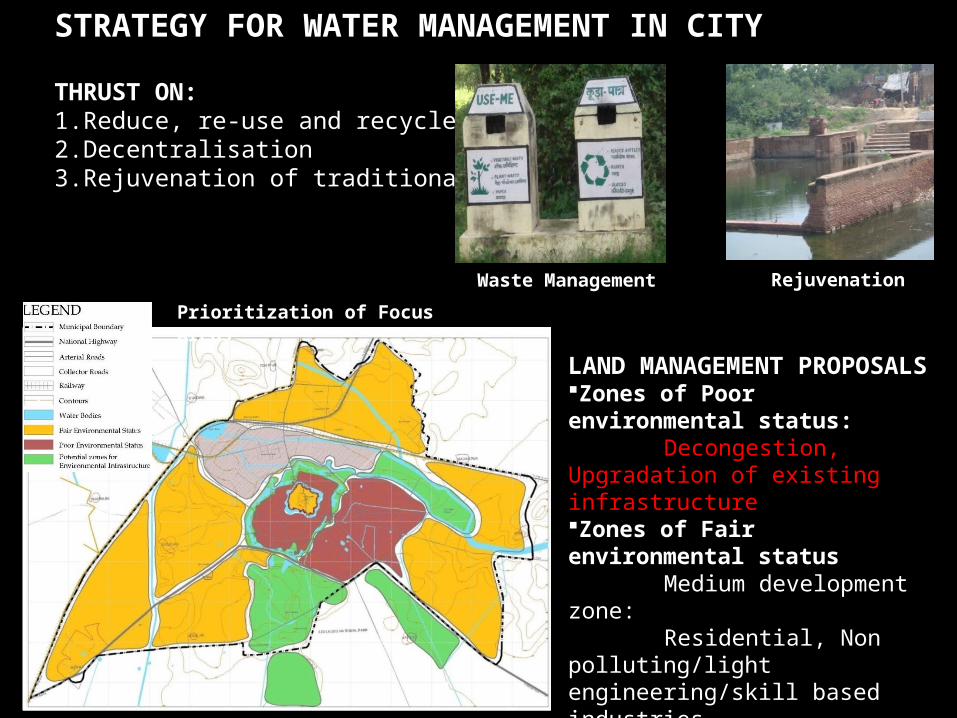
STRATEGY FOR WATER MANAGEMENT IN CITY
THRUST ON:1.Reduce, re-use and recycle2.Decentralisation3.Rejuvenation of traditional Systems
LAND MANAGEMENT PROPOSALSZones of Poor environmental status:
Decongestion, Upgradation of existing infrastructureZones of Fair environmental status
Medium development zone:Residential, Non
polluting/light engineering/skill based industriesPotential Zone
No built & Low development zone:
Institutions, Ecological sites, Eco-hotels
Prioritization of Focus Areas
Waste Management Rejuvenation

INFRASTRUCTURE PROPOSAL
WATER SUPPLYManagement of Piped supply network & new sources.Revival of potable water sources in/around Moats.
WASTE WATER MANAGEMENT Decentralized System: 3 stagesCombination of Free Floating (Outer Moat), Horizontal Flow Constructed Wetland System & Maturation Pond : 80% efficiencyUse of Vegetation & FishesSupply of treated waste water(Category D) to KNP.
SOLID WASTE MANAGEMENTSanitary Landfill site (10 ha)Considerations: Natural Slope, Wind Direction, Ground Water Table, Distance from Surface Water bodies, Residential areas, Transport Routes
DRAINAGE Supply to KNP in Wet spell & Discharge to CFCD in Dry spell. Decentralised system for Rain Water Harvesting at Plot level & Community level.Considerations:
Natural Slope, Existing Drainage Channels
Constructed Wetland
Recharge shaft

PROPOSED WATER SUPPLY SYSTEM FOR KNP
From Ajan Bundh (400-500mcft) in times of good monsoon. Low water consuming crops & checkdams in the surrounding region will help raise the
ground water table & sustain the base flow Treated Wastewater from urban area would be additional source
5329 mlts of treated wastewater can be provided to park even during drought periods Maintenance of wildlife habitat even during times of acute water shortage.
Period Volume of Water (mld) Volume of wastewater in ML
Volume of water from Ajan Bundh in
ML July-October 14.6 1796 12,204
November-March 14.6 2205 11,796
April- June 14.6 1328 0
Estimation of Water Supply to KNP

VEGETATION MANAGEMENT
Management of invasive species: Removal of unwanted species through manual, mechanical & biological methods and re-introducing buffalo-grazing
Less water consuming plant species should be grown. Some of these are: Pennisetum polystachyon (L.) Schult-(thin Napier grass)- drought resistant and suitable for
semi-arid areas in India Leucaena leucocephala- High photosynthesis and low transpiration
Controlling growth of eucalyptus around KNP as it is high water-consuming tree and replace them with other hardy species like neem.
Grow plant species that prevent evapo-transpiration like:
Nymphaea Lotus
Water Lily
Aquatic Plant Species Present in
KNP or District
Comments
Numphaea Lotus YES Retard loss by 5-18%Water Lilly, YES Floating leaved plants reduce ET
when plant leave coverage is high Salvinia, Azolla,
Nymphaea, Nelumbo, Memna, Walffia, Spirodela
NO Floating leaved plants reduce ET when plant leave coverage is high
Duckweed
(Lemna Mina & Spirodela Polyrheiza
YES Transpires b/w 0.85 -0.9*.
*Plants with transpiration of < 1 reduce water loss.

PROPOSED USE ZONING IN KNP
EXISTING ZONES:At present the entire national park has been
divided into three zones: 1. core/ bird watching zone,2. administrative cum tourist facility zone and3. eco-restoration zone.
PROPOSED ZONES: It is essential to create distinct zones within
the park area depending on ecological, logistic and recreational usage.
Depending on the season and propriety, certain areas in the park are designated as follows:
1. Core zone2. Buffer zone3. Controlled use area4. Intensive use area5. Multiple use area
Proposed Spatial Zoning
PROPOSED IMPLEMENTATION FRAMEWORK FOR IWRM
PROPOSAL ( I) Integration of PHED, RUIDP & WRD at directorate of watershed & soil Solutions to agreement between ALWAR, JAIPUR & BHARATPUR Identification of distt. & local level nodal agencies for Plan formulation & implementation.
PROPOSED IMPLEMENTATION FRAMEWORK FOR IWRMPROPOSAL ( II ) Implementation of 73th &74th CAA can help to bridge missing link institutional set up &inter departmental co-ordination Establishment of State Finance Commission of DPC under CAA for integration & funding of DPRs.

THANK YOU
Related Documents


![State Environmental Planning Policy (Mining, …...State Environmental Planning Policy (Mining, Petroleum Production and Extractive Industries) 2007 [NSW] under the Environmental Planning](https://static.cupdf.com/doc/110x72/5e78b5cecdb5fe27f3605137/state-environmental-planning-policy-mining-state-environmental-planning-policy.jpg)


