Welcome message from author
This document is posted to help you gain knowledge. Please leave a comment to let me know what you think about it! Share it to your friends and learn new things together.
Transcript
2.1 Rare earth elements 1
Landolt-Börnstein
New Series III/32D
2 Magnetic properties of rare earth elements,
alloys and compounds
2.1 Rare earth elements
2.1.1 Introduction
Since our previous review work in Landoldt-Börnstein, Group III, Crystal and Solid State Physics,
Vol. 19d1, p. 1 (1991) [91D], a numerous amount of experimental and theoretical work on the magnetic
properties of rare earth elements, alloys and compounds have been reported. Although the investigation of
the magnetic structures of the rare earth has been an active area of research for nearly 30 years, the field
has recently attracted new interest, due largely to the development of high-resolution X-ray and neutron
magnetic diffraction techniques. Erbium, for example, has the most complex phase diagram of any of the
heavy rare earths (Fig. 335 in [91D]). The gradual way in which the picture of its magnetic structure has
been refined in successive studies (Fig. 255) is typical of the steady progress that has been made in our
understanding of all of the rare earth metals (see also as an example, Fig. 146 for Dy, Fig. 209 for Ho or
Fig. 256 for Er and Ref. [94J] where new updated neutron diffraction studies of the magnetic phase
diagrams of some heavy rare earth elements, are displayed). In spite of the new data in this chapter, for a
main survey of this type of results the reader is referred to [91D]. Compared with [91D], the present
survey includes the comprehensive review of high temperature magnetic susceptibility of the light
lanthanides (see Figs. 1, 3 for Ce, Fig. 26 for Sm or Fig. 35 for Eu and Gd). However, most of the recent
investigations are dealing with the magnetic properties of rare earth elements in their artificial form like
ultrathin films or multilayer superstructures [93J]. Many papers are also dedicated to the surface magnetic
behaviour mostly of Gd, Dy, Tb and Er deposited on the surface of nonmagnetic metals (Fig. 95 for Gd,
Fig. 144 for Tb, Fig. 174 for Dy, Figs. 284 and 291 for Er) [91W, 91B2]. It is well known that the
magnetic order can be modified at the surface of a ferromagnetic material (see Fig. 71). The loss of the
transitional symmetry perpendicular to the surface plane and the reduced atomic coordination can result
in magnetic interactions which differ from those in the bulk. It is to be expected that the magnetic
ordering will be weakened at the surface by the reduced atomic coordination.
Contrary to these expectations the enhanced surface ordering temperatures and the surface
magnetic reconstruction (SMR) (i. e., a different orientation of the spins at the surface than in the
bulk) (see Fig. 72) are among the most intriguing phenomena found in surface magnetism [93T1]. As
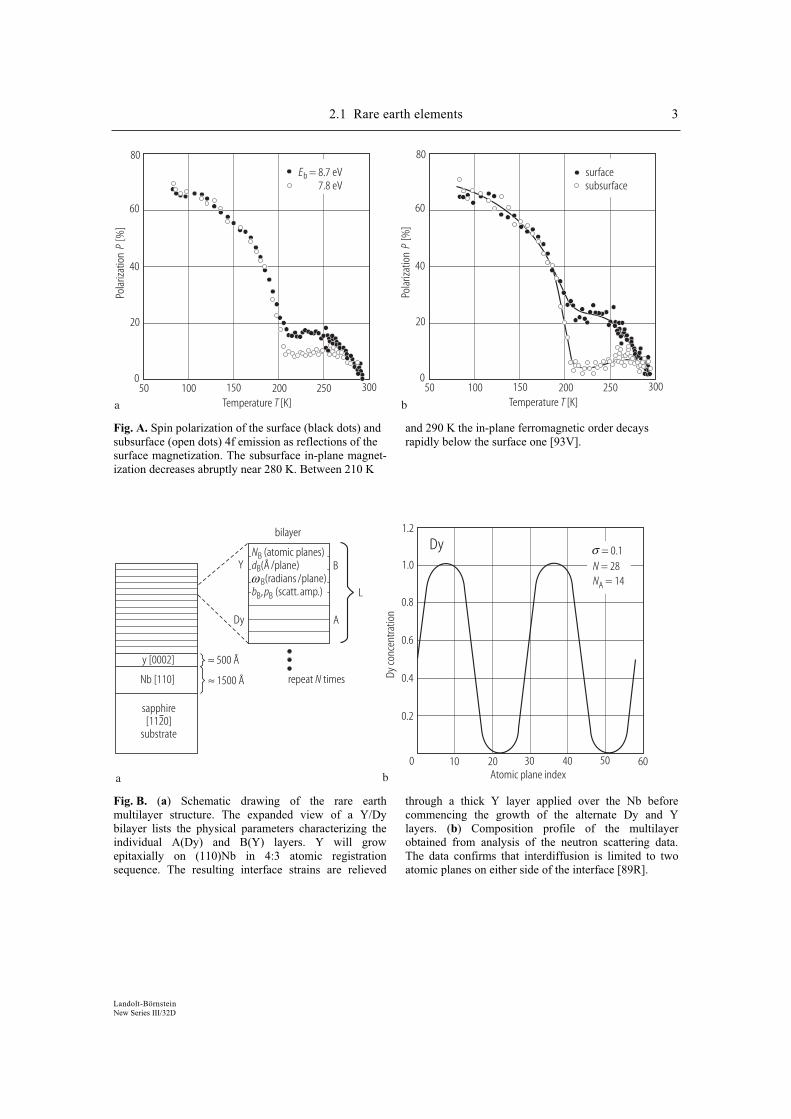
an example, in Fig. A the results obtained from the spin-resolved photoemission experiment
performed on ultrathin Gd films grown on W(110) are shown [93V]. The results indicate that the in-
plane ordering temperature of the surface is by 80 K higher than that of the inner layers. These data
show also a complex and unexpected temperature dependence of the magnetization. At high
temperatures the polarization of 4f states at the surface differs from that of the underlaying layers.
Extensive studies have failed to demonstrate the existence of such phenomenon in 3d transition
metals. Evidence for an enhanced surface ordering temperature TS over the bulk Curie temperature TB
was found by Rau et al. [86R] on polycrystalline Gd surfaces as is shown in Fig. 47. A similar
observation has been reported for epitaxial Tb films (Fig. 142 and Ref. [89R]. In a nearest–neighbor
Ising model with bulk coupling constant J, there exists a critical value of the surface coupling
2 2.1 Rare earth elements
Landolt-Börnstein
New Series III/32D
constant Js, above which the surface orders at temperature (TS) higher than the bulk Curie temperature
(TB). In this case the surface critical behaviour at TS is known as a "surface transition". For TB < T <TS the surface behaves as a two-dimensional system, with the magnetic order decaying almost
exponentially within the bulk (see Figs. 52 and 70). There also exist a few experimental cases for
which TS < TB. Farle et al. [87F] reported that the Curie temperature depends on the film thickness; TC
of a Gd monolayer on W(110) is 20 K below TC for bulk sample.
It is worthwhile to point out that, despite of these findings, the mechanism responsible for the
enhancement of the surface Curie temperature in these systems is still not at all understood in terms of
fundamental atomic properties.
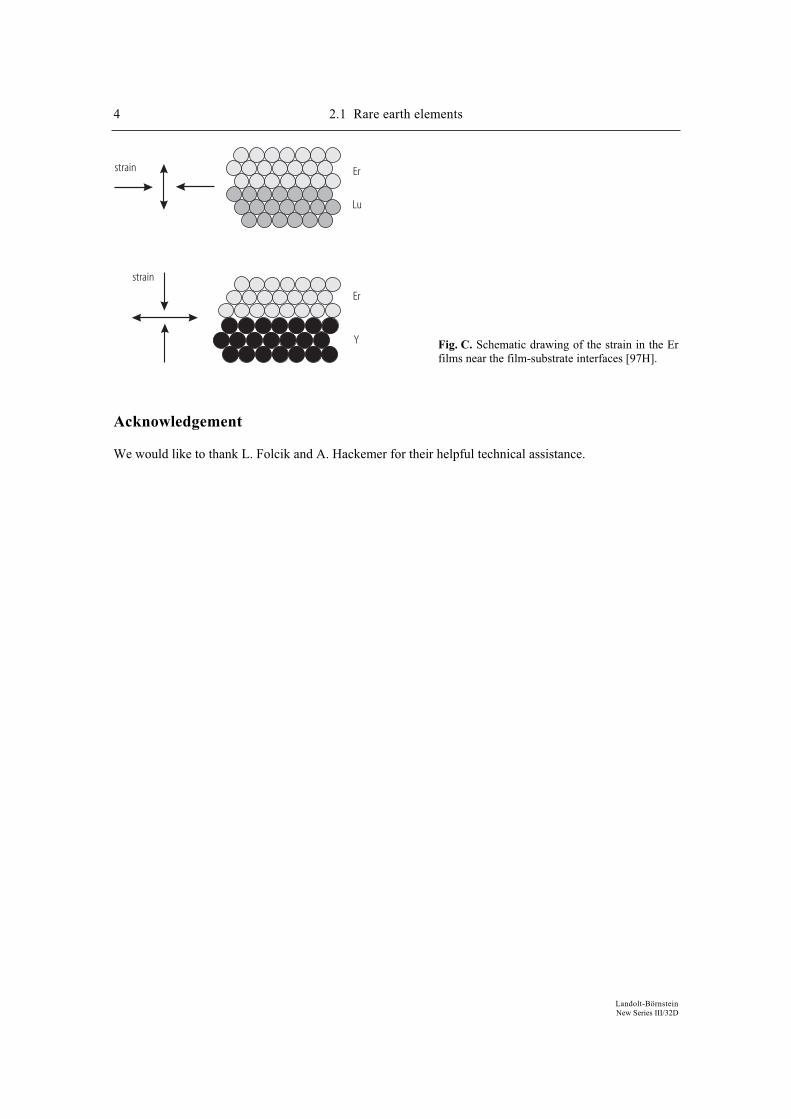
The synthesis of artificially layered materials has attracted much attention in the last decade. The
discovery of techniques to produce multilayers of rare earth elements that alternate with the non-magnetic
hexagonal structure elements Y or Lu (see Fig. B) has opened up broad new opportunities to study the
magnetic coupling in rare earth systems. Y and Lu have similar physical and electronic properties to the
magnetic heavy rare earth and, because of the relatively small mismatch between the basal plane lattice
parameters (e.g. 1.6 % for Dy and Y), good epitaxial growth is achieved. Artificial single crystal
superlattices of Gd–Y, Dy–Y, Er–Y, and Ho–Y, have been produced and extensively studied (Figs. 80,
168, 283 or 238). These and similar systems offer a near ideal opportunity to investigate the magnetic
exchange couplings and interaction strengths in a system consisting of magnetically concentrated layers
(e.g. Dy) interleaved, in a controlled fashion, with magnetically "dead" layers (e.g. Y, Lu). It should be
noted that such a system is unique and can never be simulated by bulk dilute alloys because of the
attendant reduction in the average exchange interaction with the decreased density of magnetic ions, and
the probability of some nearest neighbours even in very dilute samples.
Magnetic long-range coupling in layered metallic structures has become a key issue in thin-film
magnetism since the observation of oscillatory exchange coupling across non-ferromagnetic spacer layers
[86S, 86G]. Although this phenomenon was first discovered in rare earth superlattices most studies today
deal with transition metal systems because of their technological relevance to magnetic storage devices.
The present theoretical understanding of transition metal multilayers has been developed on the basic of
detailed observations revealing, e.g. short-period oscillations not extend beyond several atomic planes
[91U] as well as 90o coupling [91R].
In metallic RE systems, due to the localised nature of the 4f electrons, the exchange coupling is well
described by the Heisenberg Hamiltonian H = – JSiSj , where J denotes the effective coupling strength
between the localised 4f-spin moments Si and Sj. The exchange coupling in rare earth metals is indirect,
relatively long range, mediated through the 6s and 5d conduction electrons it is oscillatory and usually
described in a Ruderman-Kittel-Kasuya-Yosida picture. Hence, magnetic superlattices containing
magnetic rare earth elements, e.g. Gd or Dy, alternating with a nonmagnetic analogue such as Y, Lu, W,
would seem to be promising systems for investigating the modulation effects derived from a long-range
interlayer exchange coupling. The Y, Lu or other nonmagnetic metal block (Zr, Mo) does not simply act
as an inert spacer between the blocks of magnetic material. Instead, it is found that there is a phase shift,
proportional to the length of the Y, Lu or W block, introduced between neighbouring magnetically active
(Gd, Dy or Tb) blocks.
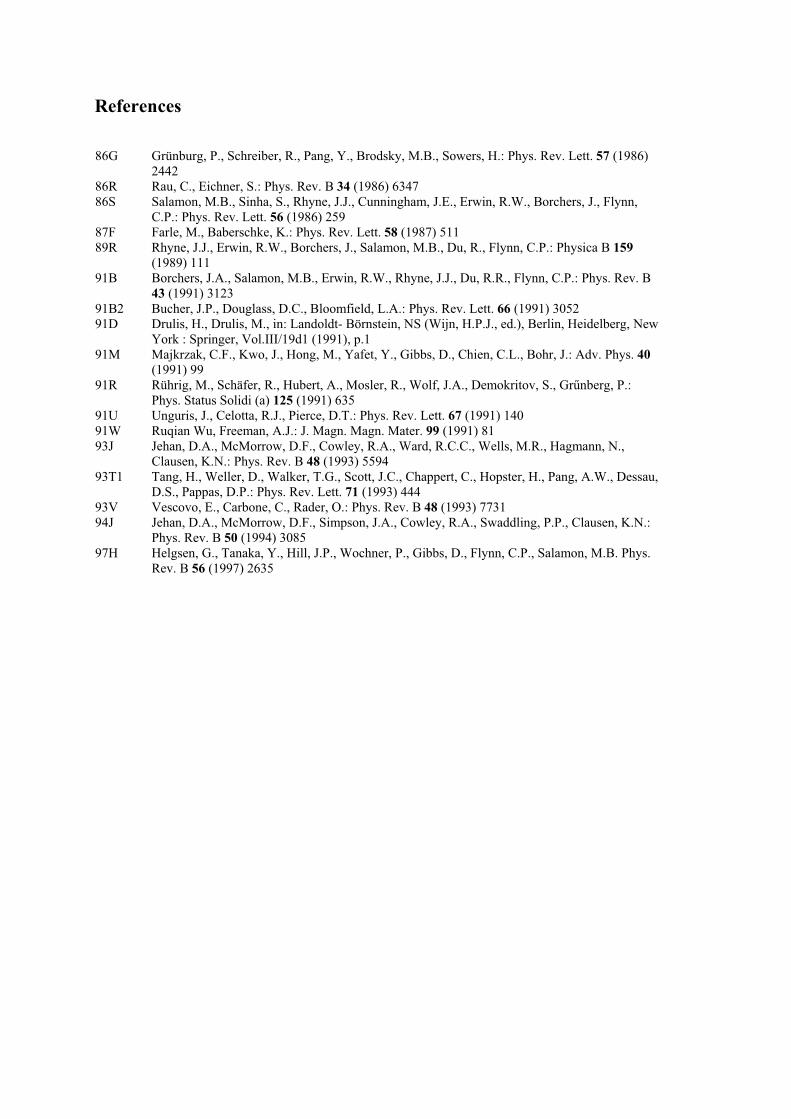
Neutron and X-ray studies of the rare earth films and miltilayers have revealed a rich complex
magnetic phases which could not have been predicted from the behaviour of the pure bulk magnetic
systems [91M]. This is caused due to the lattice strain and clamping originating at layer interfaces as is
shown in Fig. C. This epitaxial strains and clamping imposed at the film-substrate interfaces alters the
detailed temperature dependence of the magnetic structures most notably by the introduction of
multiphase coexistence. Moreover, while the crystal symmetries of the film remain unchanged from the
bulk, the lattice and magnetic correlation lengths are reduced, consistent with a high degree of disorder.
This disorder may play a significant role in the resulting magnetic order. Indeed, in the low temperature
Er/Y superstructure the magnetic correlation lengths are comparable to the unit-cell size of magnetic
structures and two new magnetic wave vectors falling between 5/21 and 1/4 were observed (see Fig. 284
and Ref. [97H]). It has been found that the driving energy for the ferromagnetic transition in Er
mulitilayers varies linearly with strain [91B], implying that strain effects are more important than even
the artificial modulation of multilayers. The complexity of these interfaces and their dependence on
growth conditions, continue to challenge systematic studies.
2.1 Rare earth elements 3
Landolt-Börnstein
New Series III/32D
Temperature [K]T Temperature [K]T
Pola
rizat
ion
[%]
P
Pola
rizat
ion
[%]
P
80 80
60 60
40 40
20 20
0 050 50100 100150 150200 200250 250300 300
Eb = 8.7 eV7.8 eV
surfacesubsurface
a b
Fig. A. Spin polarization of the surface (black dots) and
subsurface (open dots) 4f emission as reflections of the
surface magnetization. The subsurface in-plane magnet-
ization decreases abruptly near 280 K. Between 210 K
and 290 K the in-plane ferromagnetic order decays
rapidly below the surface one [93V].
Dy co
ncen
tratio
n
Atomic plane index
1.2
1.0
0.8
0.6
0.4
0.2
0 10 20 30 40 50 60
σ = 0.1N = 28NA = 14
Dybilayer
B
A
L
Y
Dy
repeat timesN
y [0002]
Nb [110]
sapphire[1120]
substrate
≈ 500 Å
≈ 1500 Å
NB (atomic planes)dB(Å /plane)
B(radians /plane)ωb pB B, (scatt. amp.)
a b
Fig. B. (a) Schematic drawing of the rare earth
multilayer structure. The expanded view of a Y/Dy
bilayer lists the physical parameters characterizing the
individual A(Dy) and B(Y) layers. Y will grow
epitaxially on (110)Nb in 4:3 atomic registration
sequence. The resulting interface strains are relieved
through a thick Y layer applied over the Nb before
commencing the growth of the alternate Dy and Y
layers. (b) Composition profile of the multilayer
obtained from analysis of the neutron scattering data.
The data confirms that interdiffusion is limited to two
atomic planes on either side of the interface [89R].
4 2.1 Rare earth elements
Landolt-Börnstein
New Series III/32D
strain
strain
Er
Lu
Er
Y
Acknowledgement
We would like to thank L. Folcik and A. Hackemer for their helpful technical assistance.
Fig. C. Schematic drawing of the strain in the Er
films near the film-substrate interfaces [97H].
References
86G Grünburg, P., Schreiber, R., Pang, Y., Brodsky, M.B., Sowers, H.: Phys. Rev. Lett. 57 (1986)
2442
86R Rau, C., Eichner, S.: Phys. Rev. B 34 (1986) 6347
86S Salamon, M.B., Sinha, S., Rhyne, J.J., Cunningham, J.E., Erwin, R.W., Borchers, J., Flynn,
C.P.: Phys. Rev. Lett. 56 (1986) 259
87F Farle, M., Baberschke, K.: Phys. Rev. Lett. 58 (1987) 511
89R Rhyne, J.J., Erwin, R.W., Borchers, J., Salamon, M.B., Du, R., Flynn, C.P.: Physica B 159
(1989) 111
91B Borchers, J.A., Salamon, M.B., Erwin, R.W., Rhyne, J.J., Du, R.R., Flynn, C.P.: Phys. Rev. B
43 (1991) 3123
91B2 Bucher, J.P., Douglass, D.C., Bloomfield, L.A.: Phys. Rev. Lett. 66 (1991) 3052
91D Drulis, H., Drulis, M., in: Landoldt- Börnstein, NS (Wijn, H.P.J., ed.), Berlin, Heidelberg, New
York : Springer, Vol.III/19d1 (1991), p.1
91M Majkrzak, C.F., Kwo, J., Hong, M., Yafet, Y., Gibbs, D., Chien, C.L., Bohr, J.: Adv. Phys. 40
(1991) 99
91R Rührig, M., Schäfer, R., Hubert, A., Mosler, R., Wolf, J.A., Demokritov, S., Gr nberg, P.:
Phys. Status Solidi (a) 125 (1991) 635
91U Unguris, J., Celotta, R.J., Pierce, D.T.: Phys. Rev. Lett. 67 (1991) 140
91W Ruqian Wu, Freeman, A.J.: J. Magn. Magn. Mater. 99 (1991) 81
93J Jehan, D.A., McMorrow, D.F., Cowley, R.A., Ward, R.C.C., Wells, M.R., Hagmann, N.,
Clausen, K.N.: Phys. Rev. B 48 (1993) 5594
93T1 Tang, H., Weller, D., Walker, T.G., Scott, J.C., Chappert, C., Hopster, H., Pang, A.W., Dessau,
D.S., Pappas, D.P.: Phys. Rev. Lett. 71 (1993) 444
93V Vescovo, E., Carbone, C., Rader, O.: Phys. Rev. B 48 (1993) 7731
94J Jehan, D.A., McMorrow, D.F., Simpson, J.A., Cowley, R.A., Swaddling, P.P., Clausen, K.N.:
Phys. Rev. B 50 (1994) 3085
97H Helgsen, G., Tanaka, Y., Hill, J.P., Wochner, P., Gibbs, D., Flynn, C.P., Salamon, M.B. Phys.
Rev. B 56 (1997) 2635
2
.1 R
are e
arth
ele
men
ts 1
2.1.2 Survey
Survey of magnetic, electrical, spectroscopic, thermal and mechanical properties of rare earth metals.
Structure Spin
ordering [K]
TC
[K]
TN
[K]
ps
[µB]
peff
[µB/R]
Remarks Ref.
Cerium (Ce) LBIII/19d1, pages 48-54
Ce
fcc bcc
−50 2.58
(750K)
3.21
(1850K)
high temperature susceptibility m(T), Fig. 3 87K1
dhcp
poly
2.4 (H) at 4.2, 20, 30 K, Fig. 6
molecular field, CEF, exchange interaction
87L
Ce
Ce 600
magnetic susceptibility vs. T, Fig. 2
no-crystal field effects 04B = 0, 0
6B = 0, conduction electron susceptibility
χP = 0.75⋅10−6
cm3g
–1
χ(T) and crystal electric field (CEF) parameters, Fig. 1
χP = 0.75⋅10−6
cm3g
–1
04B = 3.64 K, 0
6B = 0.06 K
CEF level scheme: 7 = 0
8 = 230 meV, 8 = 490 meV
6 = 545 meV, 7 = 355 meV
88O
Ce
-bulk
(d=100Å)
or amorphous
(d=5Å)
0.2(100Å)
1(15Å)
(H) at 2 K, Fig. 4
thin multilayers, Ce/Ta
dCe = 5 Å, 15 Å, 100 Å
(T) at 5 T || sample plane, Fig. 5
96A
2
2.1
Rare e
arth
ele
men
ts
Structure Spin
ordering [K]
TC
[K]
TN
[K]
ps
[µB]
peff
[µB/R]
Remarks Ref.
Praseodymium (Pr) LBIII/19d1, pages 55-72
hcp bcc 0 3.62
(750K)
4.47
(1850K)
high temperature susceptibility, Fig. 3 87K1
dhcp
poly
2.4 (H) at 4.2 K, 20 K, 30 K
molecular field, CEF, Fig. 6
exchange interaction
87L
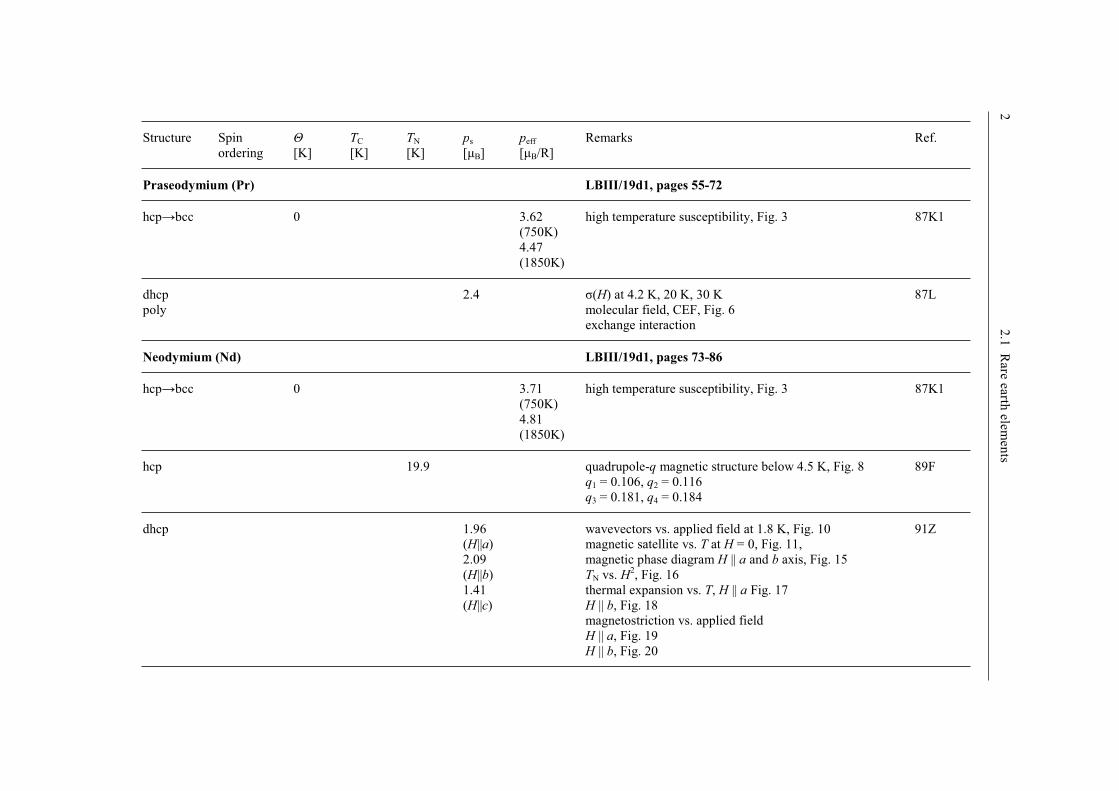
Neodymium (Nd) LBIII/19d1, pages 73-86
hcp bcc 0 3.71
(750K)
4.81
(1850K)
high temperature susceptibility, Fig. 3 87K1
hcp 19.9 quadrupole-q magnetic structure below 4.5 K, Fig. 8
q1 = 0.106, q2 = 0.116
q3 = 0.181, q4 = 0.184
89F
dhcp 1.96
(H||a)
2.09
(H||b)
1.41
(H||c)
wavevectors vs. applied field at 1.8 K, Fig. 10
magnetic satellite vs. T at H = 0, Fig. 11,
magnetic phase diagram H || a and b axis, Fig. 15
TN vs. H2, Fig. 16
thermal expansion vs. T, H || a Fig. 17
H || b, Fig. 18
magnetostriction vs. applied field
H || a, Fig. 19
H || b, Fig. 20
91Z
2
.1 R
are e
arth
ele
men
ts 3
Structure Spin
ordering [K]
TC
[K]
TN
[K]
ps
[µB]
peff
[µB/R]
Remarks Ref.
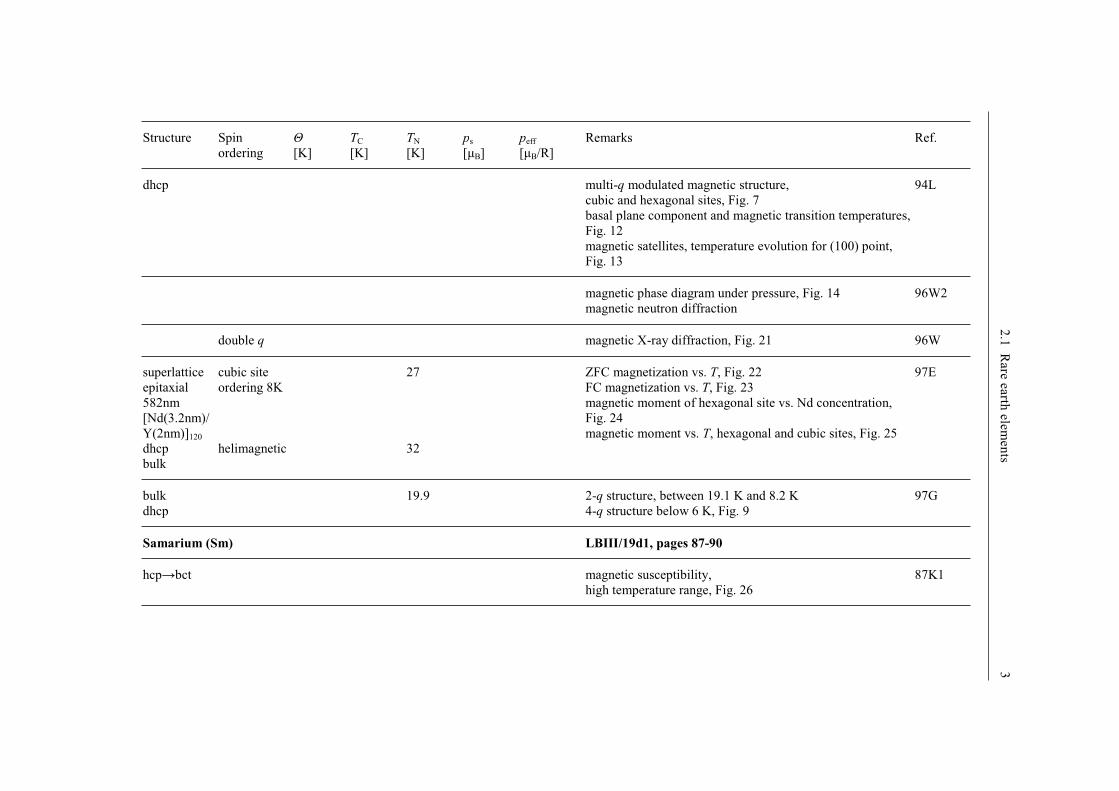
dhcp multi-q modulated magnetic structure,
cubic and hexagonal sites, Fig. 7
basal plane component and magnetic transition temperatures,
Fig. 12
magnetic satellites, temperature evolution for (100) point,
Fig. 13
94L
magnetic phase diagram under pressure, Fig. 14
magnetic neutron diffraction
96W2
double q magnetic X-ray diffraction, Fig. 21 96W
superlattice
epitaxial
582nm
[Nd(3.2nm)/
Y(2nm)]120
dhcp
bulk
cubic site
ordering 8K
helimagnetic
27
32
ZFC magnetization vs. T, Fig. 22
FC magnetization vs. T, Fig. 23
magnetic moment of hexagonal site vs. Nd concentration,
Fig. 24
magnetic moment vs. T, hexagonal and cubic sites, Fig. 25
97E
bulk
dhcp
19.9 2-q structure, between 19.1 K and 8.2 K
4-q structure below 6 K, Fig. 9
97G
Samarium (Sm) LBIII/19d1, pages 87-90
hcp bct magnetic susceptibility,
high temperature range, Fig. 26
87K1

4
2.1
Rare e
arth
ele
men
ts
Structure Spin
ordering [K]
TC
[K]
TN
[K]
ps
[µB]
peff
[µB/R]
Remarks Ref.
dhcp
s.c.
poly
spin-
reorientation
transition
specific heat, temperature dependence 2 K…32 K, Fig. 34
anomalies at: 9.6 K, 13.7 K, 20.4 K
excess entropy:
(4.0 ± 0.5) J mol–1
K–1
for 9 K…10 K
(1.14 ± 0.1) J mol–1
K–1
for 13.7 K peak
(0.114 ± 0.02) J mol–1
K–1
for 20.4 K peak
89S
dhcp neutron scattering
intermultiplet transition in Sm3, Fig. 29
form factor in Sm3+
, Fig. 30, Fig. 31, Fig. 33
spin-orbit transition in Sm metal, Fig. 32 6H5/2
6H7/2 135 meV
6F1/2 760 meV
6F3/2 780 meV
6F5/2 850 meV
6F7/2 930 meV
93N
bct fcc 4…5.5 magnetic moment, ultra-high-pressure Fig. 27
energy calculation of the Bain path (energy vs. c/a ratio),
Fig. 28
93S1
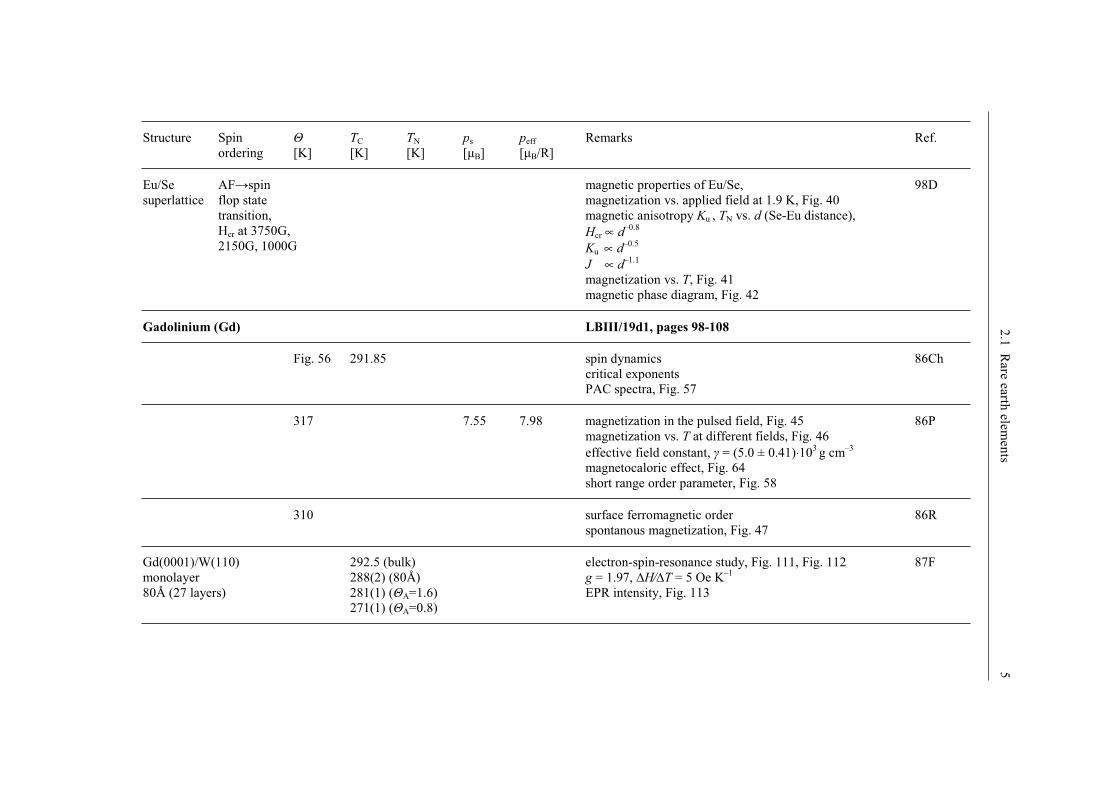
Europium (Eu) LBIII/19d1, pages 91-97
Eu/Se
superlattice
AF spin flop state
transition,
Hcr at 3750G, 2150G,
1000G
Mössbauer spectra vs. applied pressure at 44 K, Fig. 36
isomer shift, Fig. 37
hyperfine field, Fig. 38, Fig. 39
valence change of 0.5 electron intermediate-valence state
87F1
hcp-bcc
transition
high temperature susceptibility, 750 K…1850 K, Fig. 35 87K1
2
.1 R
are e
arth
ele
men
ts 5
Structure Spin
ordering [K]
TC
[K]
TN
[K]
ps
[µB]
peff
[µB/R]
Remarks Ref.
Eu/Se
superlattice
AF spin
flop state
transition,
Hcr at 3750G,
2150G, 1000G
magnetic properties of Eu/Se,
magnetization vs. applied field at 1.9 K, Fig. 40
magnetic anisotropy Ku , TN vs. d (Se-Eu distance),
Hcr ∝ d–0.8
Ku ∝ d–0.5
J ∝ d–1.1
magnetization vs. T, Fig. 41
magnetic phase diagram, Fig. 42
98D
Gadolinium (Gd) LBIII/19d1, pages 98-108
Fig. 56 291.85 spin dynamics
critical exponents
PAC spectra, Fig. 57
86Ch
317 7.55 7.98 magnetization in the pulsed field, Fig. 45
magnetization vs. T at different fields, Fig. 46
effective field constant, = (5.0 ± 0.41)⋅103g cm
–3
magnetocaloric effect, Fig. 64
short range order parameter, Fig. 58
86P
310 surface ferromagnetic order
spontanous magnetization, Fig. 47
86R
Gd(0001)/W(110)
monolayer
80Å (27 layers)
292.5 (bulk)
288(2) (80Å)
281(1) ( A=1.6)
271(1) ( A=0.8)
electron-spin-resonance study, Fig. 111, Fig. 112
g = 1.97, H⁄ T = 5 Oe K–1
EPR intensity, Fig. 113
87F

6
2.1
Rare e
arth
ele
men
ts
Structure Spin
ordering [K]
TC
[K]
TN
[K]
ps
[µB]
peff
[µB/R]
Remarks Ref.
heat capacity, 0 < T < 16 K, Fig. 62
Cp(T) = (4.48 T + 1.37 T1.5
+ 0.404 T3) mJK
–1mol
–1
= (4.48 ± 0.07) mJK–2
mol–1
, D = (169 ± 1) K
87H
[GdNGd/YN ]M
superlattice
NGd=10
NY=6-24
M=76;225
magnetic properties
magnetization vs. magnetic field, T = 12 K, Fig. 80
magnetization - temperature dependence, 0 < T < 300 K,
Fig. 81
remanence and saturation field oscillatory dependence,
Fig. 83
oscillatory period: 7 atomic layers
overall oscillation range: 20 atomic layers
87K
thin films
over glass
TC vs. annealing temperature, Fig. 69
273 K < TC < 293 K
88N
Gd(001)/W(110)
monolayer
80Å (≈27 layers)
EPR magnetic resonance near TC
field vs. T, Fig. 114
anisotropy coefficient N⊥ = 0.692(1) for monolayer
89F
s.c. 317(39) magnetic susceptibility, Fig. 49
ganis = 2.52⋅10–4
, giso = 5.28⋅10–3
89G
hcp
s.c.
muon spin rotation, 0 < T < 300 K, Fig. 61 90H
Gd(0001)/W(110) ac susceptibility, Fig. 97
Hopkinsen effect, TH = (289 ± 1) K
90S

2
.1 R
are e
arth
ele
men
ts 7
Structure Spin
ordering [K]
TC
[K]
TN
[K]
ps
[µB]
peff
[µB/R]
Remarks Ref.
Gd(0001)/W(110)
films, d=30Å
photoemission, Fig. 106, surface state 223d5 rx −91L
Gd 7.0 Compton profile, Fig. 55
spin polarization
(0.53 ± 0.08) µB /at
91S
hcp
Gd(0001)
surface
antiferromagnetic coupling surface layer against FM bulk,
energy Gd(0001) slab vs. distance to adjacent underlayer,
Fig. 70
dFM= 5.55 au; dAFM= 5.77 au
91W
Gd(0001)/Gd
hcp
AF/FM magnetic configuration for a 6-layer Gd(0001) slab, Fig. 71
localized 2d z state
91W1
Gd(0001)/W(110)
films, d=20Å
surface-state binding energy, Fig. 108 92D
Gd(0001)/W(110) surface magnetism, Fig. 101
photoemission spectra, Fig. 103
92M
Gd/Nb films
dGd=11-103Å
magnetooptic Kerr effect
2 K < T < 295 K, µ0H < 0.3 T
remanent magnetization, Fig. 84
in-plane magnetization Mr, coercive field Hc , Fig. 85
domain temperature vs. film thickness
TC /TC( ) ∝ d–
, 1.6
93P
8
2.1
Rare e
arth
ele
men
ts
Structure Spin
ordering [K]
TC
[K]
TN
[K]
ps
[µB]
peff
[µB/R]
Remarks Ref.
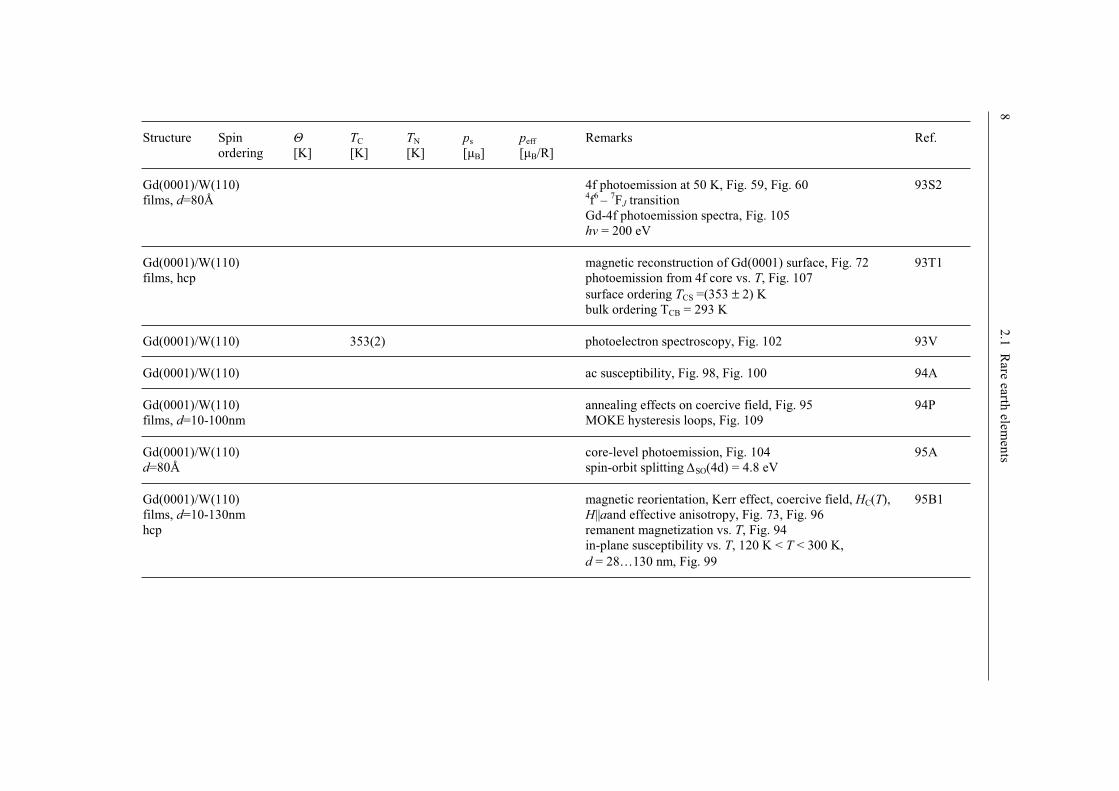
Gd(0001)/W(110)
films, d=80Å
4f photoemission at 50 K, Fig. 59, Fig. 60 4f6–
7FJ transition
Gd-4f photoemission spectra, Fig. 105
h = 200 eV
93S2
Gd(0001)/W(110)
films, hcp
magnetic reconstruction of Gd(0001) surface, Fig. 72
photoemission from 4f core vs. T, Fig. 107
surface ordering TCS =(353 ± 2) K
bulk ordering TCB = 293 K
93T1
Gd(0001)/W(110) 353(2) photoelectron spectroscopy, Fig. 102 93V
Gd(0001)/W(110) ac susceptibility, Fig. 98, Fig. 100 94A
Gd(0001)/W(110)
films, d=10-100nm
annealing effects on coercive field, Fig. 95
MOKE hysteresis loops, Fig. 109
94P
Gd(0001)/W(110)
d=80Å
core-level photoemission, Fig. 104
spin-orbit splitting SO(4d) = 4.8 eV
95A
Gd(0001)/W(110)
films, d=10-130nm
hcp
magnetic reorientation, Kerr effect, coercive field, HC(T),
H||aand effective anisotropy, Fig. 73, Fig. 96
remanent magnetization vs. T, Fig. 94
in-plane susceptibility vs. T, 120 K < T < 300 K,
d = 28…130 nm, Fig. 99
95B1
2
.1 R
are e
arth
ele
men
ts 9
Structure Spin
ordering [K]
TC
[K]
TN
[K]
ps
[µB]
peff
[µB/R]
Remarks Ref.
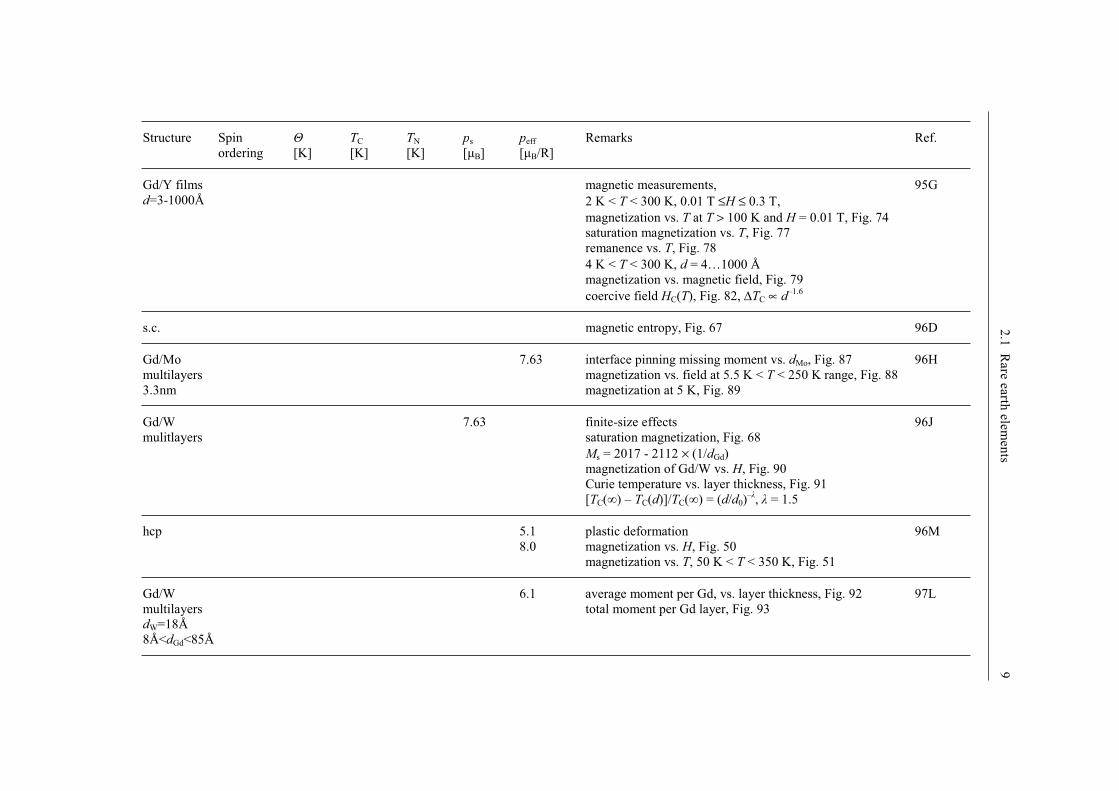
Gd/Y films
d=3-1000Å
magnetic measurements,
2 K < T < 300 K, 0.01 T ≤H ≤ 0.3 T,
magnetization vs. T at T > 100 K and H = 0.01 T, Fig. 74
saturation magnetization vs. T, Fig. 77
remanence vs. T, Fig. 78
4 K < T < 300 K, d = 4…1000 Å
magnetization vs. magnetic field, Fig. 79
coercive field HC(T), Fig. 82, TC ∝ d–1.6
95G
s.c. magnetic entropy, Fig. 67 96D
Gd/Mo
multilayers
3.3nm
7.63 interface pinning missing moment vs. dMo, Fig. 87
magnetization vs. field at 5.5 K < T < 250 K range, Fig. 88
magnetization at 5 K, Fig. 89
96H
Gd/W
mulitlayers
7.63 finite-size effects
saturation magnetization, Fig. 68
Ms = 2017 - 2112 × (1/dGd)
magnetization of Gd/W vs. H, Fig. 90
Curie temperature vs. layer thickness, Fig. 91
[TC( ) – TC(d)]/TC( ) = (d/d0)–
, = 1.5
96J
hcp 5.1
8.0
plastic deformation
magnetization vs. H, Fig. 50
magnetization vs. T, 50 K < T < 350 K, Fig. 51
96M
Gd/W
multilayers
dW=18Å
8Å<dGd<85Å
6.1 average moment per Gd, vs. layer thickness, Fig. 92
total moment per Gd layer, Fig. 93
97L

10
2
.1 R
are e
arth
ele
men
ts
Structure Spin
ordering [K]
TC
[K]
TN
[K]
ps
[µB]
peff
[µB/R]
Remarks Ref.
film, d=100Å 490 EPR spectra, Fig. 115
signal intensity, Fig. 116
linewidth, Fig. 117
g value vs. T, Fig. 118
exchange FM interaction inside layer J = 0.07⋅10–3
eV
97T
s.c. 7.63 magnetization vs. H and T, H || [0001], Fig. 43
H || [1010], Fig. 44
ac magnetic susceptibility
H || [0001] and [1010], Fig. 52, Fig. 53, Fig. 54, Fig. 64
98D
291 heat capacity in magnetic field, Fig. 63
magnetocaloric effect, s.c., Fig. 65
magnetic entropy vs. T, Fig. 66
TC ≈ 6 K/T
98D
ultrathin
films
155 spontaneous magnetization, Fig. 48
suppression TC vs. thickness d, Fig. 75
TC ∝ d–1
magnetic hysteresis loop, Fig. 76
98G
Terbium (Tb) LBIII/19d1, pages 109-128
TCb=
220K
TNb=
228K
top most surface layer
electron spin polarization vs. T, Fig. 142
surface Curie temperature TCs = 248 K
88R
(100) platelet neutron diffraction topography, Fig. 120
helimagnetic-ferromagnetic phase coexistence
89B
2
.1 R
are e
arth
ele
men
ts 1
1
Structure Spin
ordering [K]
TC
[K]
TN
[K]
ps
[µB]
peff
[µB/R]
Remarks Ref.
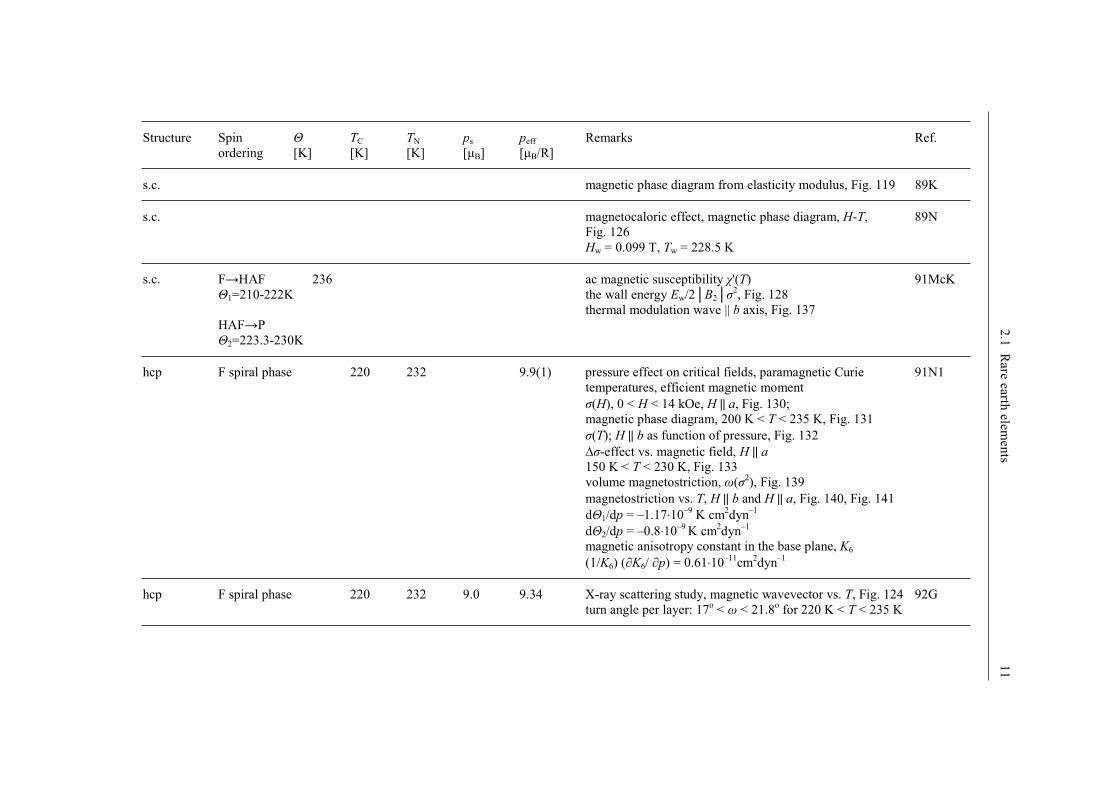
s.c. magnetic phase diagram from elasticity modulus, Fig. 119 89K
s.c. magnetocaloric effect, magnetic phase diagram, H-T,
Fig. 126
Hw = 0.099 T, Tw = 228.5 K
89N
s.c. F HAF 236
1=210-222K
HAF P
2=223.3-230K
ac magnetic susceptibility '(T)
the wall energy Ew/2 B22, Fig. 128
thermal modulation wave || b axis, Fig. 137
91McK
hcp F spiral phase 220 232 9.9(1) pressure effect on critical fields, paramagnetic Curie
temperatures, efficient magnetic moment
(H), 0 < H < 14 kOe, H || a, Fig. 130;
magnetic phase diagram, 200 K < T < 235 K, Fig. 131
(T); || b as function of pressure, Fig. 132
-effect vs. magnetic field, H || a
150 K < T < 230 K, Fig. 133
volume magnetostriction, (2), Fig. 139
magnetostriction vs. T, H || b and H || a, Fig. 140, Fig. 141
d 1/dp = –1.17⋅10–9
K cm2dyn
–1
d 2/dp = –0.8⋅10–9
K cm2dyn
–1
magnetic anisotropy constant in the base plane, K6
(1/K6) ( K6/ p) = 0.61⋅10–11
cm2dyn
–1
91N1
hcp F spiral phase 220 232 9.0 9.34 X-ray scattering study, magnetic wavevector vs. T, Fig. 124
turn angle per layer: 17o < < 21.8
o for 220 K < T < 235 K
92G
12
2
.1 R
are e
arth
ele
men
ts
Structure Spin
ordering [K]
TC
[K]
TN
[K]
ps
[µB]
peff
[µB/R]
Remarks Ref.
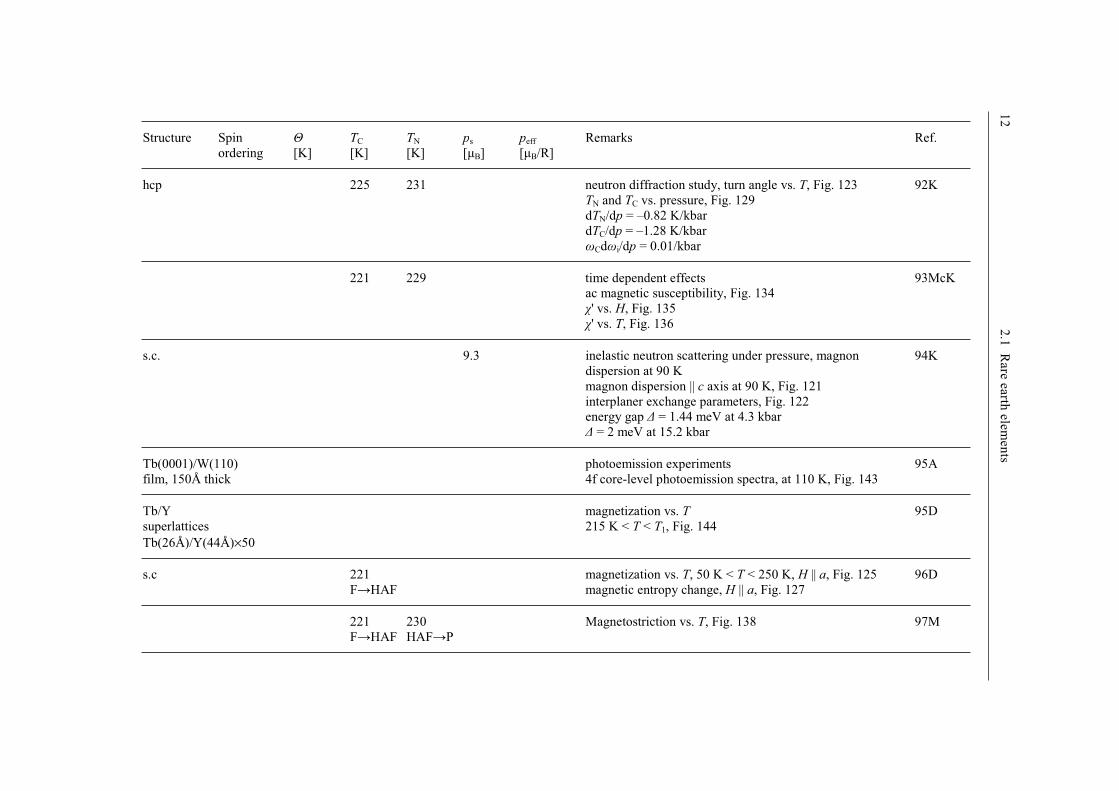
hcp 225 231 neutron diffraction study, turn angle vs. T, Fig. 123
TN and TC vs. pressure, Fig. 129
dTN/dp = –0.82 K/kbar
dTC/dp = –1.28 K/kbar
Cd i/dp = 0.01/kbar
92K
221 229 time dependent effects
ac magnetic susceptibility, Fig. 134
' vs. H, Fig. 135
' vs. T, Fig. 136
93McK
s.c. 9.3 inelastic neutron scattering under pressure, magnon
dispersion at 90 K
magnon dispersion || c axis at 90 K, Fig. 121
interplaner exchange parameters, Fig. 122
energy gap = 1.44 meV at 4.3 kbar
= 2 meV at 15.2 kbar
94K
Tb(0001)/W(110)
film, 150Å thick
photoemission experiments
4f core-level photoemission spectra, at 110 K, Fig. 143
95A
Tb/Y
superlattices
Tb(26Å)/Y(44Å)×50
magnetization vs. T
215 K < T < T1, Fig. 144
95D
s.c 221
F HAF
magnetization vs. T, 50 K < T < 250 K, H || a, Fig. 125
magnetic entropy change, H || a, Fig. 127
96D
221
F HAF
230
HAF P
Magnetostriction vs. T, Fig. 138 97M
2
.1 R
are e
arth
ele
men
ts 1
3
Structure Spin
ordering [K]
TC
[K]
TN
[K]
ps
[µB]
peff
[µB/R]
Remarks Ref.
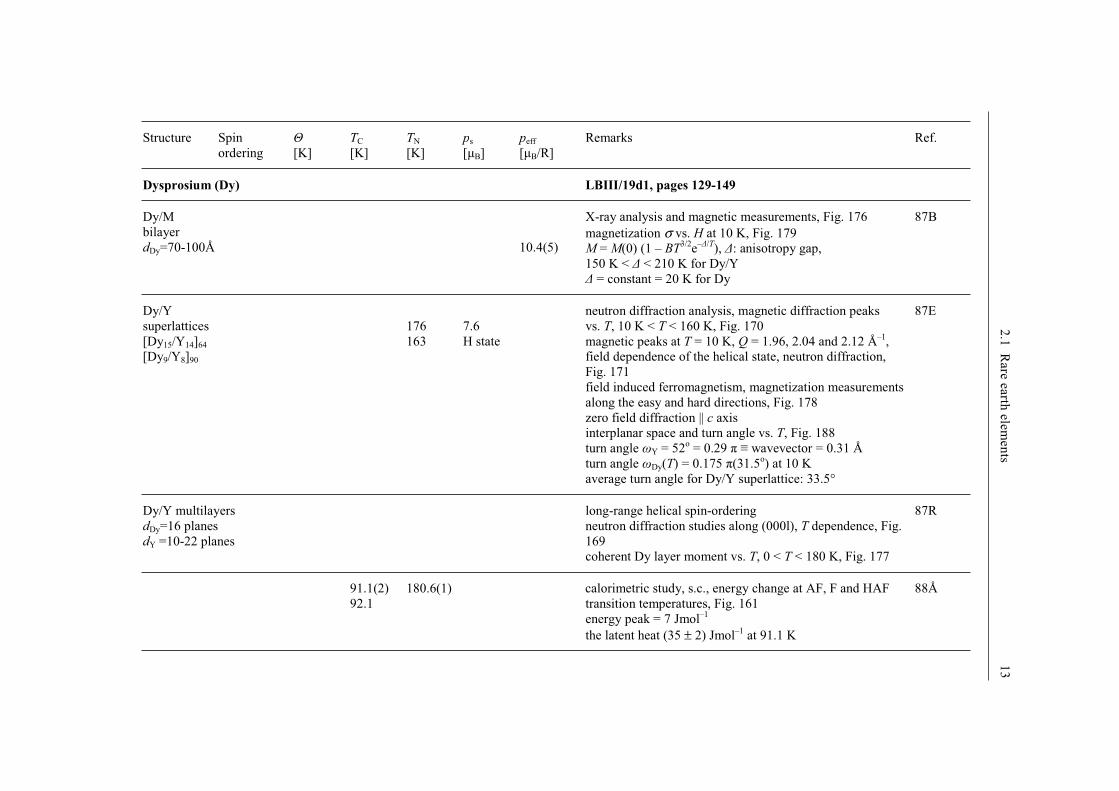
Dysprosium (Dy) LBIII/19d1, pages 129-149
Dy/M
bilayer
dDy=70-100Å
10.4(5)
X-ray analysis and magnetic measurements, Fig. 176
magnetization σ vs. H at 10 K, Fig. 179
M = M(0) (1 – BT3/2
e– /T
), : anisotropy gap,
150 K < < 210 K for Dy/Y
= constant = 20 K for Dy
87B
Dy/Y
superlattices
[Dy15/Y14]64
[Dy9/Y8]90
176
163
7.6
H state
neutron diffraction analysis, magnetic diffraction peaks
vs. T, 10 K < T < 160 K, Fig. 170
magnetic peaks at T = 10 K, Q = 1.96, 2.04 and 2.12 Å–1
,
field dependence of the helical state, neutron diffraction,
Fig. 171
field induced ferromagnetism, magnetization measurements
along the easy and hard directions, Fig. 178
zero field diffraction || c axis
interplanar space and turn angle vs. T, Fig. 188
turn angle Y = 52o = 0.29 wavevector = 0.31 Å
turn angle Dy(T) = 0.175 (31.5o) at 10 K
average turn angle for Dy/Y superlattice: 33.5°
87E
Dy/Y multilayers
dDy=16 planes
dY =10-22 planes
long-range helical spin-ordering
neutron diffraction studies along (000l), T dependence, Fig.
169
coherent Dy layer moment vs. T, 0 < T < 180 K, Fig. 177
87R
91.1(2)
92.1
180.6(1) calorimetric study, s.c., energy change at AF, F and HAF
transition temperatures, Fig. 161
energy peak = 7 Jmol–1
the latent heat (35 ± 2) Jmol–1
at 91.1 K
88Å
14
2
.1 R
are e
arth
ele
men
ts
Structure Spin
ordering [K]
TC
[K]
TN
[K]
ps
[µB]
peff
[µB/R]
Remarks Ref.
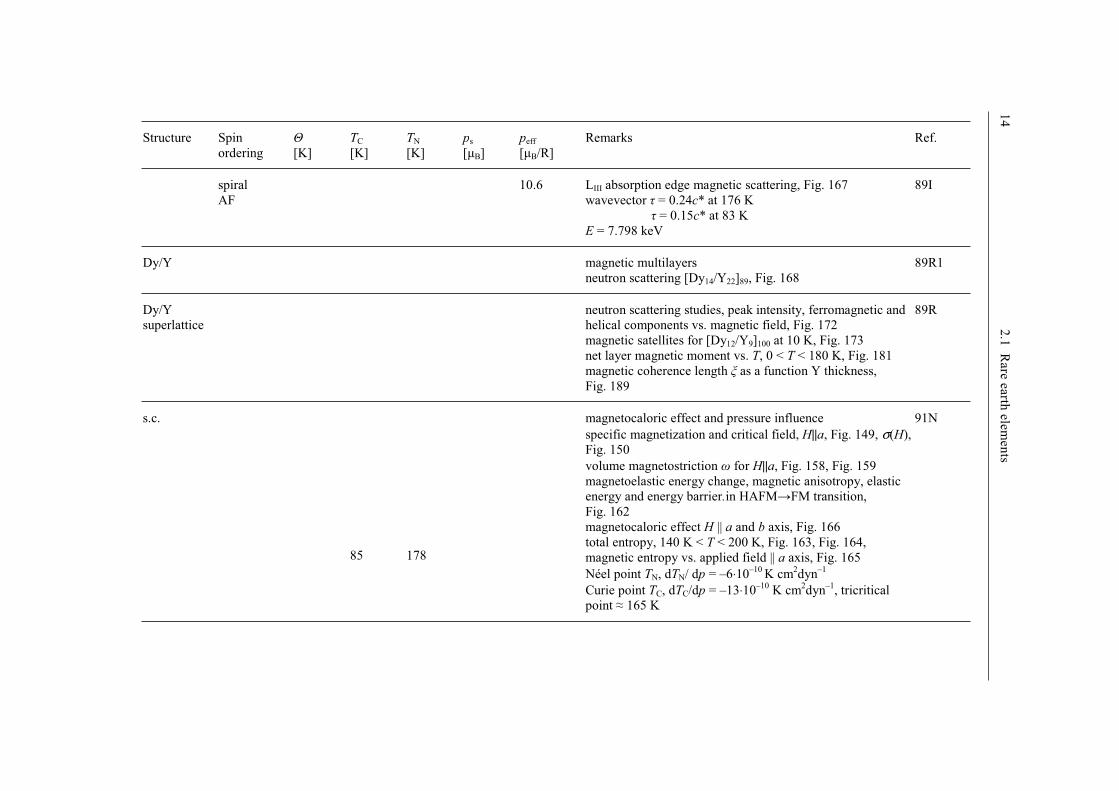
spiral
AF
10.6 LIII absorption edge magnetic scattering, Fig. 167
wavevector = 0.24c* at 176 K
= 0.15c* at 83 K
E = 7.798 keV
89I
Dy/Y magnetic multilayers
neutron scattering [Dy14/Y22]89, Fig. 168
89R1
Dy/Y
superlattice
neutron scattering studies, peak intensity, ferromagnetic and
helical components vs. magnetic field, Fig. 172
magnetic satellites for [Dy12/Y9]100 at 10 K, Fig. 173
net layer magnetic moment vs. T, 0 < T < 180 K, Fig. 181
magnetic coherence length as a function Y thickness,
Fig. 189
89R
s.c.
85 178
magnetocaloric effect and pressure influence
specific magnetization and critical field, H||a, Fig. 149, σ(H),
Fig. 150
volume magnetostriction for H||a, Fig. 158, Fig. 159
magnetoelastic energy change, magnetic anisotropy, elastic
energy and energy barrier.in HAFM FM transition,
Fig. 162
magnetocaloric effect H || a and b axis, Fig. 166
total entropy, 140 K < T < 200 K, Fig. 163, Fig. 164,
magnetic entropy vs. applied field || a axis, Fig. 165
Néel point TN, dTN/ dp = –6⋅10–10
K cm2dyn
–1
Curie point TC, dTC/dp = –13⋅10–10
K cm2dyn
–1, tricritical
point 165 K
91N
2
.1 R
are e
arth
ele
men
ts 1
5
Structure Spin
ordering [K]
TC
[K]
TN
[K]
ps
[µB]
peff
[µB/R]
Remarks Ref.
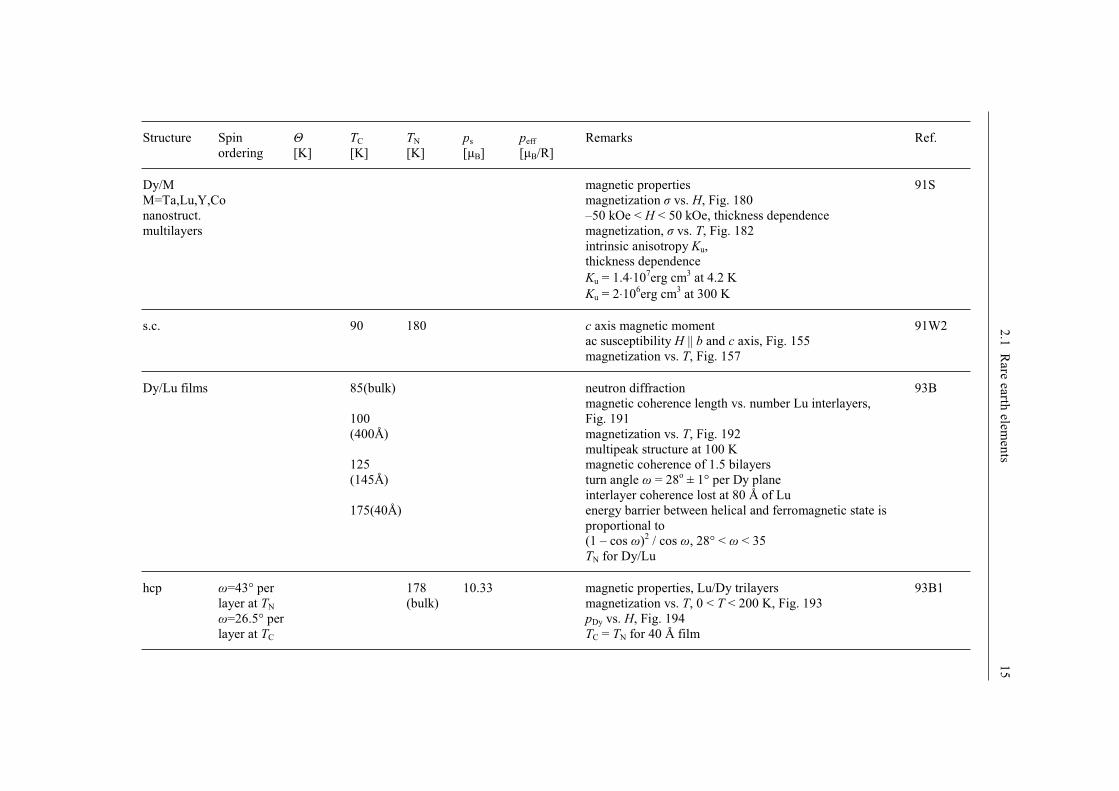
Dy/M
M=Ta,Lu,Y,Co
nanostruct.
multilayers
magnetic properties
magnetization vs. H, Fig. 180
–50 kOe < H < 50 kOe, thickness dependence
magnetization, vs. T, Fig. 182
intrinsic anisotropy Ku,
thickness dependence
Ku = 1.4⋅107erg cm
3 at 4.2 K
Ku = 2⋅106erg cm
3 at 300 K
91S
s.c. 90 180 c axis magnetic moment
ac susceptibility H || b and c axis, Fig. 155
magnetization vs. T, Fig. 157
91W2
Dy/Lu films 85(bulk)
100
(400Å)
125
(145Å)
175(40Å)
neutron diffraction
magnetic coherence length vs. number Lu interlayers,
Fig. 191
magnetization vs. T, Fig. 192
multipeak structure at 100 K
magnetic coherence of 1.5 bilayers
turn angle = 28o ± 1° per Dy plane
interlayer coherence lost at 80 Å of Lu
energy barrier between helical and ferromagnetic state is
proportional to
(1 – cos )2 / cos , 28° < < 35
TN for Dy/Lu
93B
hcp =43° per
layer at TN
=26.5° per
layer at TC
178
(bulk)
10.33 magnetic properties, Lu/Dy trilayers
magnetization vs. T, 0 < T < 200 K, Fig. 193
pDy vs. H, Fig. 194
TC = TN for 40 Å film
93B1
16
2
.1 R
are e
arth
ele
men
ts
Structure Spin
ordering [K]
TC
[K]
TN
[K]
ps
[µB]
peff
[µB/R]
Remarks Ref.
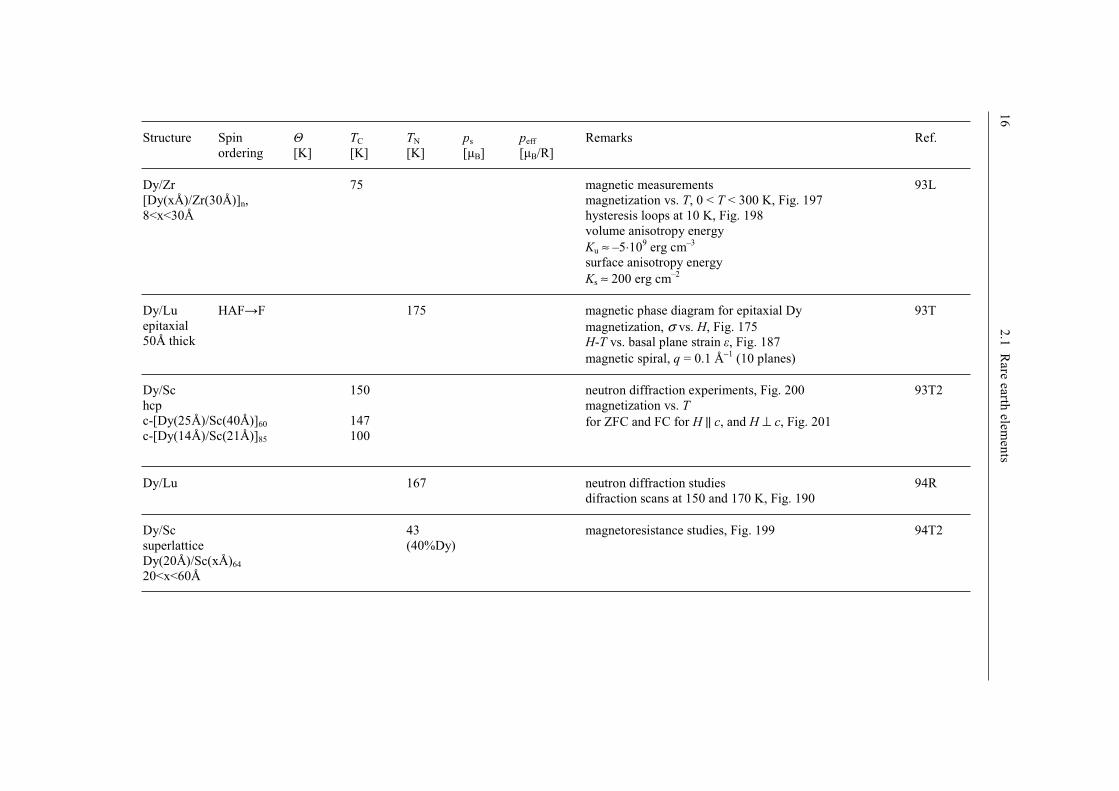
Dy/Zr
[Dy(xÅ)/Zr(30Å)]n,
8<x<30Å
75 magnetic measurements
magnetization vs. T, 0 < T < 300 K, Fig. 197
hysteresis loops at 10 K, Fig. 198
volume anisotropy energy
Ku ≈ –5⋅109 erg cm
–3
surface anisotropy energy
Ks ≈ 200 erg cm–2
93L
Dy/Lu
epitaxial
50Å thick
HAF F 175 magnetic phase diagram for epitaxial Dy
magnetization, σ vs. H, Fig. 175
H-T vs. basal plane strain , Fig. 187
magnetic spiral, q = 0.1 Å−1
(10 planes)
93T
Dy/Sc
hcp
c-[Dy(25Å)/Sc(40Å)]60
c-[Dy(14Å)/Sc(21Å)]85
150
147
100
neutron diffraction experiments, Fig. 200
magnetization vs. T
for ZFC and FC for H || c, and H ⊥ c, Fig. 201
93T2
Dy/Lu 167 neutron diffraction studies
difraction scans at 150 and 170 K, Fig. 190
94R
Dy/Sc
superlattice
Dy(20Å)/Sc(xÅ)64
20<x<60Å
43
(40%Dy)
magnetoresistance studies, Fig. 199 94T2

2
.1 R
are e
arth
ele
men
ts 1
7
Structure Spin
ordering [K]
TC
[K]
TN
[K]
ps
[µB]
peff
[µB/R]
Remarks Ref.
Dy/Cu(111) films
Dy(20Å)/Cu(100Å)×30
Dy(40Å)/Cu(100)×20
magnetic relaxation measurements
magnetization vs. T and vs. H, Fig. 195,
anisotropy studies ZFC and FC
blocking temperatures:
TB = 2.5 K for Dy(20Å)
TB = 25 K for Dy(40Å)
94T3
Dy(0001)/W(110)
film, 150Å thick
photoemission experiments
4f core-level photoemission spectra, at 55 K, Fig. 174
95A
s.c. helical para
magnetic
phase
transition
neutron diffraction, ultrasonic studies,
intensity of (0,0,2– ) reflection vs. T, Fig. 148
ultrasonic velocity, v33 and attenuation coefficient, 33,
Fig. 160
95dP
Dy/Zr
multilayers
[Dy(xÅ)/Zr(30Å)]n
6<x<30Å
magnetization results, Fig. 196
0 < T < 300 K
95L
magnetization process, X-ray diffraction study, diffraction
pattern at 0, 3 kOe and 8 kOe and 95 K, Fig 147
FM phase volume fraction, Fig. 156
95S
magnetization vs. T, s.c. ,
H || a, Fig. 151
96D
fan 85 179 ac calorimetry,
specific heat measurements
phase diagram, 0 < H || a < 17 kOe, Fig. 145
96I
18
2
.1 R
are e
arth
ele
men
ts
Structure Spin
ordering [K]
TC
[K]
TN
[K]
ps
[µB]
peff
[µB/R]
Remarks Ref.
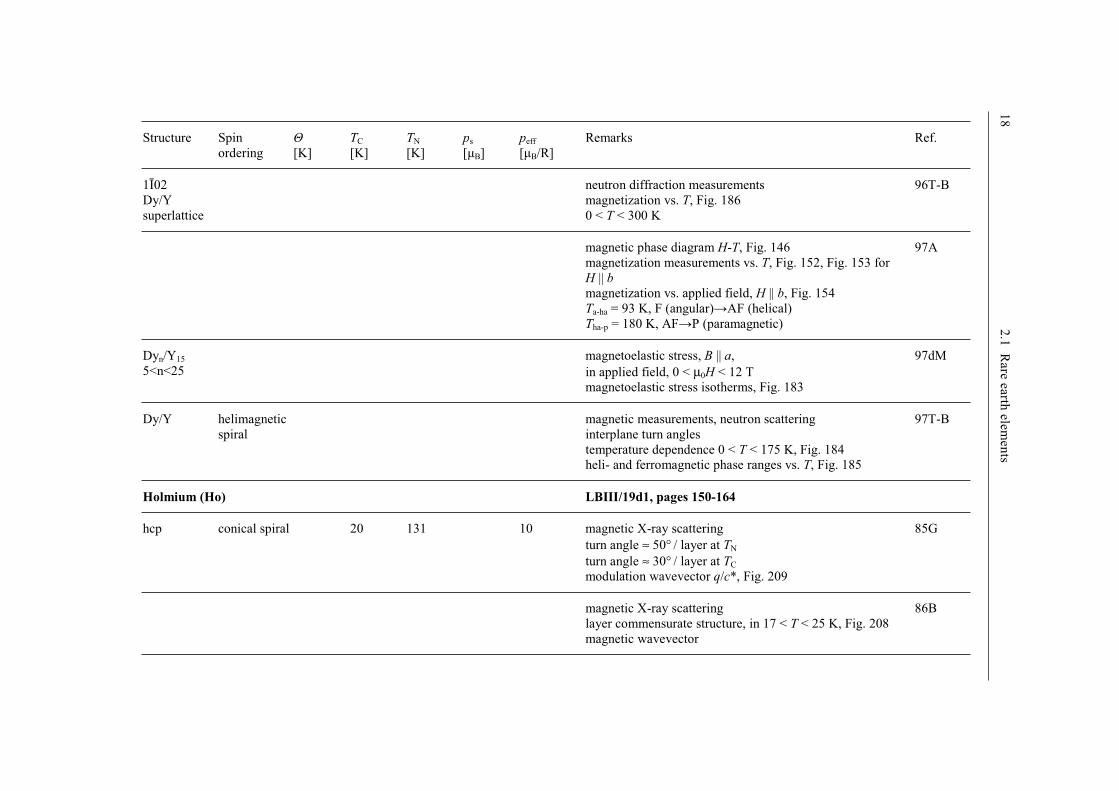
1 02
Dy/Y
superlattice
neutron diffraction measurements
magnetization vs. T, Fig. 186
0 < T < 300 K
96T-B
magnetic phase diagram H-T, Fig. 146
magnetization measurements vs. T, Fig. 152, Fig. 153 for
H || b
magnetization vs. applied field, H || b, Fig. 154
Ta-ha = 93 K, F (angular) AF (helical)
Tha-p = 180 K, AF P (paramagnetic)
97A
Dyn/Y15
5<n<25
magnetoelastic stress, B || a,
in applied field, 0 < µ0H < 12 T
magnetoelastic stress isotherms, Fig. 183
97dM
Dy/Y helimagnetic
spiral
magnetic measurements, neutron scattering
interplane turn angles
temperature dependence 0 < T < 175 K, Fig. 184
heli- and ferromagnetic phase ranges vs. T, Fig. 185
97T-B
Holmium (Ho) LBIII/19d1, pages 150-164
hcp conical spiral 20 131 10 magnetic X-ray scattering
turn angle ≈ 50° / layer at TN
turn angle ≈ 30° / layer at TC
modulation wavevector q/c*, Fig. 209
85G
magnetic X-ray scattering
layer commensurate structure, in 17 < T < 25 K, Fig. 208
magnetic wavevector
86B
2
.1 R
are e
arth
ele
men
ts 1
9
Structure Spin
ordering [K]
TC
[K]
TN
[K]
ps
[µB]
peff
[µB/R]
Remarks Ref.
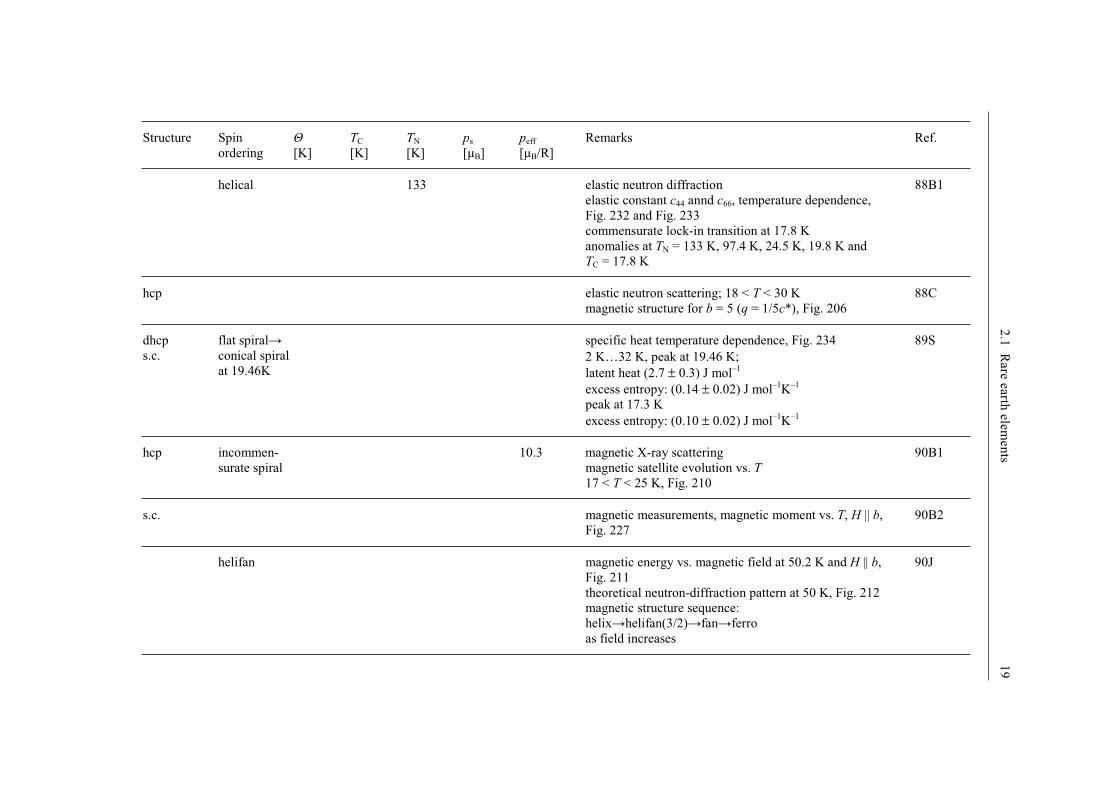
helical 133 elastic neutron diffraction
elastic constant c44 annd c66, temperature dependence,
Fig. 232 and Fig. 233
commensurate lock-in transition at 17.8 K
anomalies at TN = 133 K, 97.4 K, 24.5 K, 19.8 K and
TC = 17.8 K
88B1
hcp elastic neutron scattering; 18 < T < 30 K
magnetic structure for b = 5 (q = 1/5c*), Fig. 206
88C
dhcp
s.c.
flat spiral
conical spiral
at 19.46K
specific heat temperature dependence, Fig. 234
2 K…32 K, peak at 19.46 K;
latent heat (2.7 ± 0.3) J mol–1
excess entropy: (0.14 ± 0.02) J mol–1
K–1
peak at 17.3 K
excess entropy: (0.10 ± 0.02) J mol–1
K–1
89S
hcp incommen-
surate spiral
10.3 magnetic X-ray scattering
magnetic satellite evolution vs. T
17 < T < 25 K, Fig. 210
90B1
s.c. magnetic measurements, magnetic moment vs. T, H || b,
Fig. 227
90B2
helifan magnetic energy vs. magnetic field at 50.2 K and H || b,
Fig. 211
theoretical neutron-diffraction pattern at 50 K, Fig. 212
magnetic structure sequence:
helix helifan(3/2) fan ferro
as field increases
90J
20
2
.1 R
are e
arth
ele
men
ts
Structure Spin
ordering [K]
TC
[K]
TN
[K]
ps
[µB]
peff
[µB/R]
Remarks Ref.
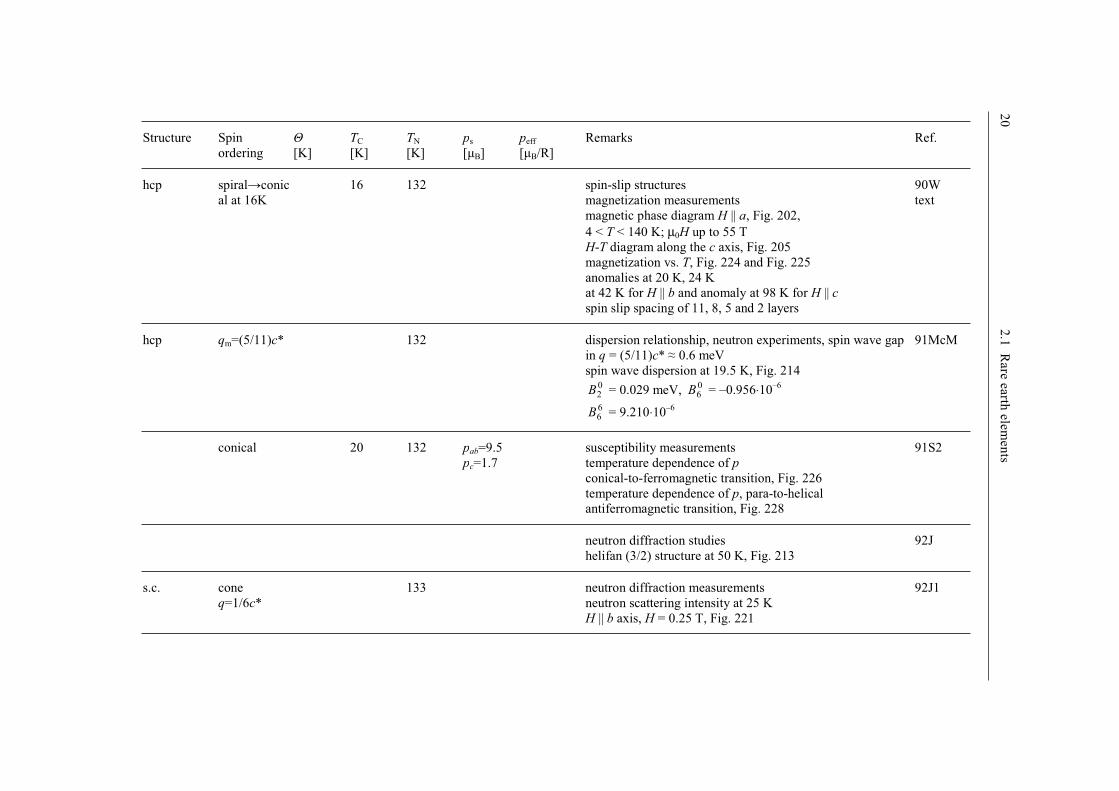
hcp spiral conic
al at 16K
16 132 spin-slip structures
magnetization measurements
magnetic phase diagram H || a, Fig. 202,
4 < T < 140 K; µ0H up to 55 T
H-T diagram along the c axis, Fig. 205
magnetization vs. T, Fig. 224 and Fig. 225
anomalies at 20 K, 24 K
at 42 K for H || b and anomaly at 98 K for H || c
spin slip spacing of 11, 8, 5 and 2 layers
90W
text
hcp qm=(5/11)c* 132 dispersion relationship, neutron experiments, spin wave gap
in q = (5/11)c* 0.6 meV
spin wave dispersion at 19.5 K, Fig. 214 02B = 0.029 meV, 0
6B = –0.956⋅10–6
66B = 9.210⋅10
–6
91McM
conical 20 132 pab=9.5
pc=1.7
susceptibility measurements
temperature dependence of p
conical-to-ferromagnetic transition, Fig. 226
temperature dependence of p, para-to-helical
antiferromagnetic transition, Fig. 228
91S2
neutron diffraction studies
helifan (3/2) structure at 50 K, Fig. 213
92J
s.c. cone
q=1/6c*
133 neutron diffraction measurements
neutron scattering intensity at 25 K
H || b axis, H = 0.25 T, Fig. 221
92J1
2
.1 R
are e
arth
ele
men
ts 2
1
Structure Spin
ordering [K]
TC
[K]
TN
[K]
ps
[µB]
peff
[µB/R]
Remarks Ref.
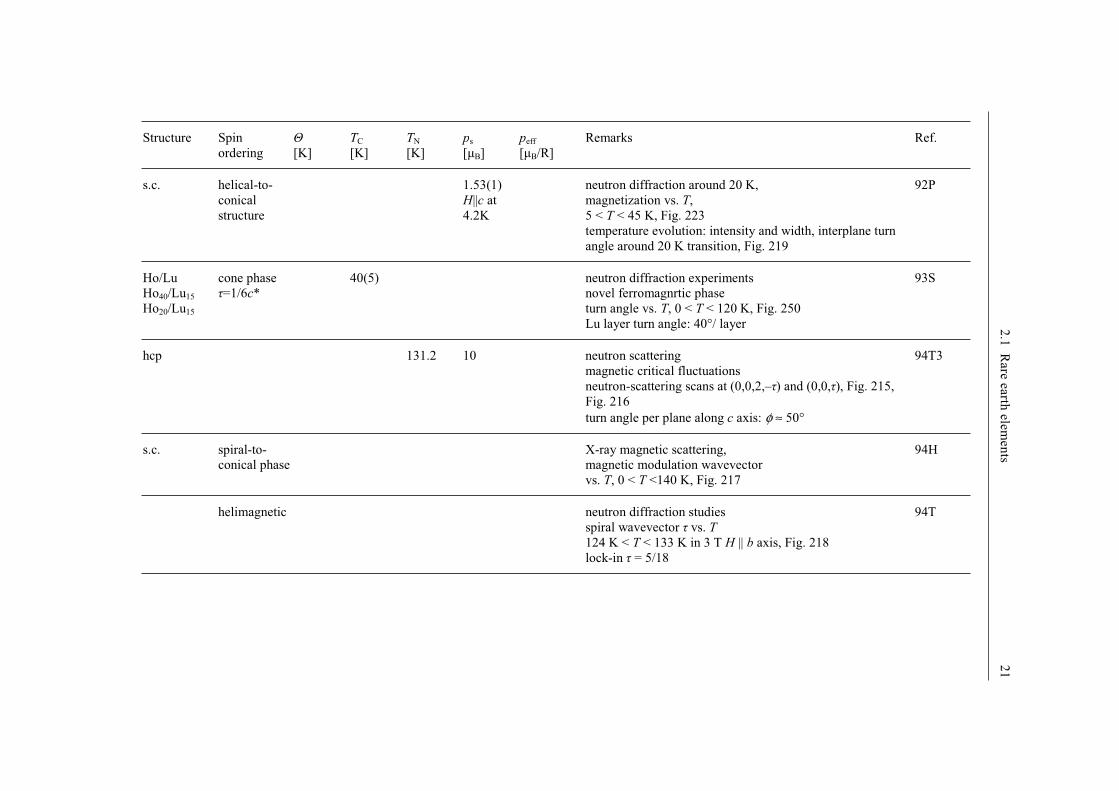
s.c. helical-to-
conical
structure
1.53(1)
H||c at
4.2K
neutron diffraction around 20 K,
magnetization vs. T,
5 < T < 45 K, Fig. 223
temperature evolution: intensity and width, interplane turn
angle around 20 K transition, Fig. 219
92P
Ho/Lu
Ho40/Lu15
Ho20/Lu15
cone phase
=1/6c*
40(5) neutron diffraction experiments
novel ferromagnrtic phase
turn angle vs. T, 0 < T < 120 K, Fig. 250
Lu layer turn angle: 40°/ layer
93S
hcp 131.2 10 neutron scattering
magnetic critical fluctuations
neutron-scattering scans at (0,0,2,– ) and (0,0, ), Fig. 215,
Fig. 216
turn angle per plane along c axis: φ ≈ 50°
94T3
s.c. spiral-to-
conical phase
X-ray magnetic scattering,
magnetic modulation wavevector
vs. T, 0 < T <140 K, Fig. 217
94H
helimagnetic neutron diffraction studies
spiral wavevector vs. T
124 K < T < 133 K in 3 T H || b axis, Fig. 218
lock-in = 5/18
94T
22
2
.1 R
are e
arth
ele
men
ts
Structure Spin
ordering [K]
TC
[K]
TN
[K]
ps
[µB]
peff
[µB/R]
Remarks Ref.
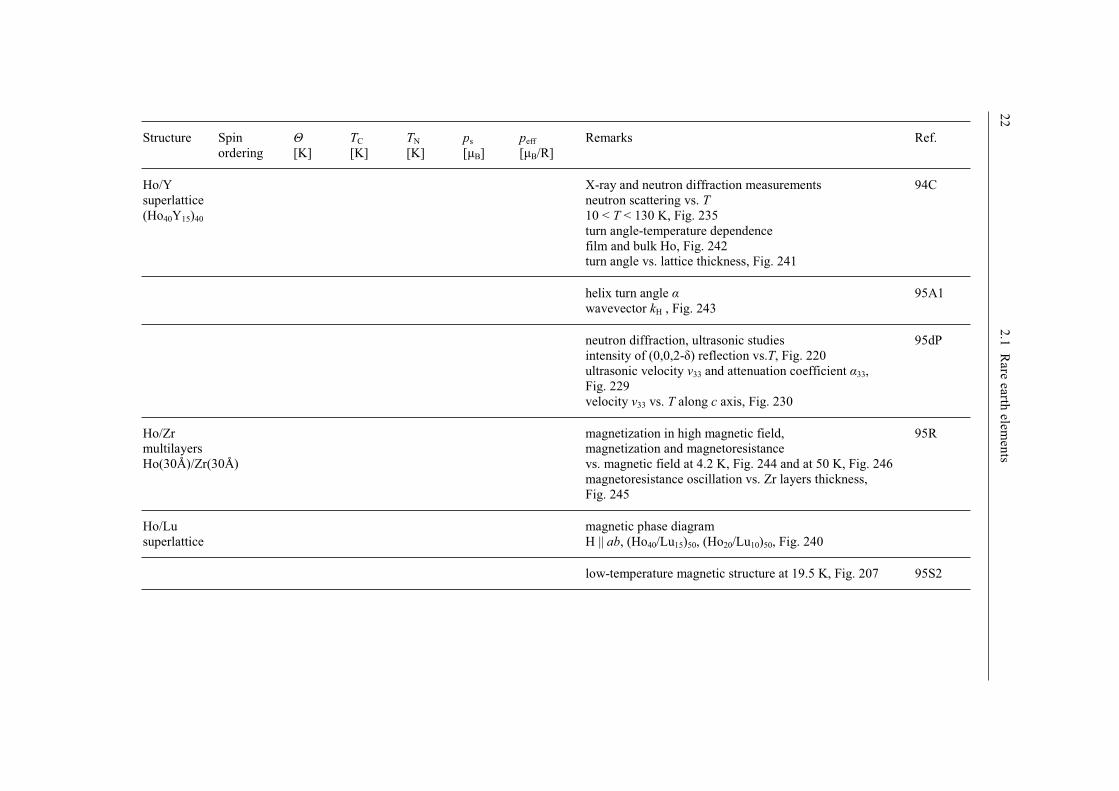
Ho/Y
superlattice
(Ho40Y15)40
X-ray and neutron diffraction measurements
neutron scattering vs. T
10 < T < 130 K, Fig. 235
turn angle-temperature dependence
film and bulk Ho, Fig. 242
turn angle vs. lattice thickness, Fig. 241
94C
helix turn angle
wavevector kH , Fig. 243
95A1
neutron diffraction, ultrasonic studies
intensity of (0,0,2- ) reflection vs.T, Fig. 220
ultrasonic velocity v33 and attenuation coefficient 33,
Fig. 229
velocity v33 vs. T along c axis, Fig. 230
95dP
Ho/Zr
multilayers
Ho(30Å)/Zr(30Å)
magnetization in high magnetic field,
magnetization and magnetoresistance
vs. magnetic field at 4.2 K, Fig. 244 and at 50 K, Fig. 246
magnetoresistance oscillation vs. Zr layers thickness,
Fig. 245
95R
Ho/Lu
superlattice
magnetic phase diagram
H || ab, (Ho40/Lu15)50, (Ho20/Lu10)50, Fig. 240
low-temperature magnetic structure at 19.5 K, Fig. 207 95S2
2
.1 R
are e
arth
ele
men
ts 2
3
Structure Spin
ordering [K]
TC
[K]
TN
[K]
ps
[µB]
peff
[µB/R]
Remarks Ref.
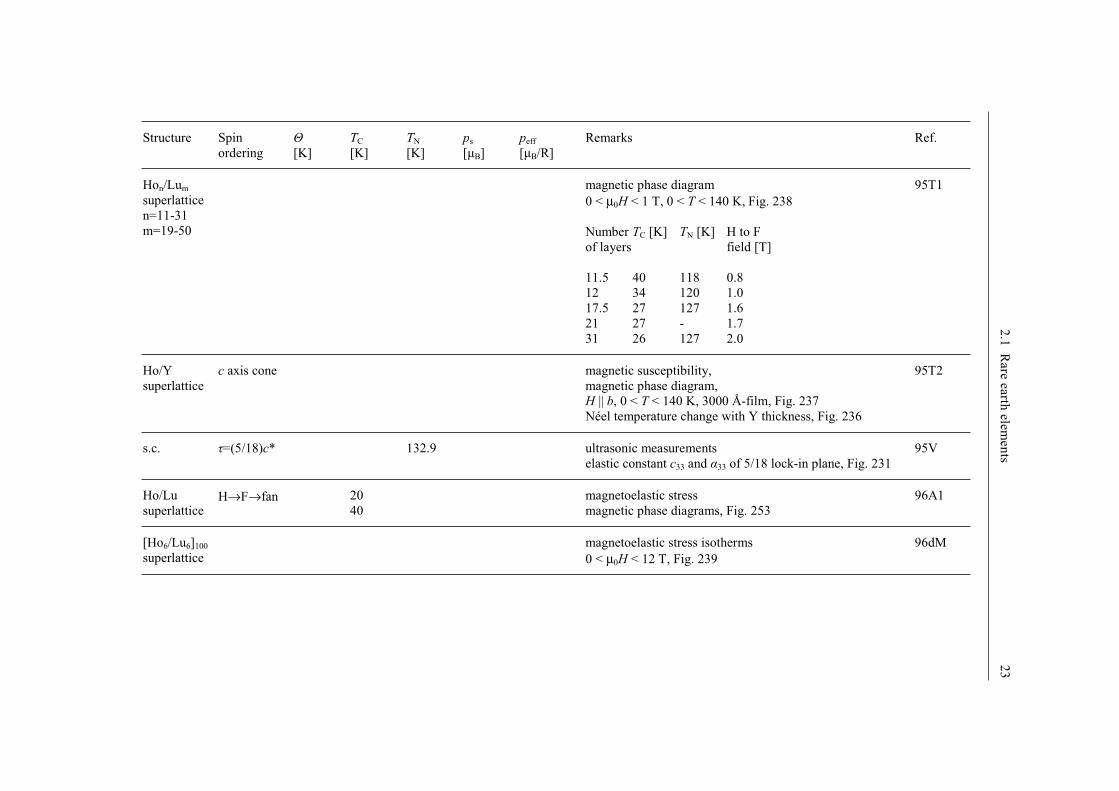
Hon/Lum
superlattice
n=11-31
m=19-50
magnetic phase diagram
0 < µ0H < 1 T, 0 < T < 140 K, Fig. 238
Number TC [K] TN [K] H to F
of layers field [T]
11.5 40 118 0.8
12 34 120 1.0
17.5 27 127 1.6
21 27 - 1.7
31 26 127 2.0
95T1
Ho/Y
superlattice
c axis cone magnetic susceptibility,
magnetic phase diagram,
H || b, 0 < T < 140 K, 3000 Å-film, Fig. 237
Néel temperature change with Y thickness, Fig. 236
95T2
s.c. =(5/18)c* 132.9 ultrasonic measurements
elastic constant c33 and 33 of 5/18 lock-in plane, Fig. 231
95V
Ho/Lu
superlattice H→F→fan 20
40
magnetoelastic stress
magnetic phase diagrams, Fig. 253
96A1
[Ho6/Lu6]100
superlattice
magnetoelastic stress isotherms
0 < µ0H < 12 T, Fig. 239
96dM
24
2
.1 R
are e
arth
ele
men
ts
Structure Spin
ordering [K]
TC
[K]
TN
[K]
ps
[µB]
peff
[µB/R]
Remarks Ref.
Ho/Sc
superlattice
(Hon/Scm.)
n=20-30
m=10-40
50(5)
127(2)
132(5)
125(3)
neutron diffraction technique
Ho30/Sc20; 4/23c*
Ho20/Sc20; 1/6c*
Ho20/Sc40; 2/11c*
neutron scattering at 4 K, Fig. 251
turn angle vs. T, Fig. 252
97B-J
magnetoresistance
H-T phase diagram, H || b
2 K < T < 140 K; H up to 5.5 T, Fig. 203
97G1
helicon critical lattice versus magnetic field
magnetic field dependence of c-lattice parameter,
0 < µ0H < 6 T, Fig. 222
97O
Ho/Lu
superlattice
(Hon/Lu15)× 50
n=8-85 planes
c/2 superation
magnetoelastic stress
temperature dependence, at 12 T, Fig. 247
magnetoelastic stress vs. Ho number planes at 10 K and 12 T,
Fig. 248
stress isotherms vs. applied field, H || b easy axis, Fig. 249
98dM
Erbium (Er) LBIII/19d1, pages 165-174
Monocrystal
10<d<70nm
magnetic susceptibility, Fig. 272 87C
[Er23/Y19]100 ||=33 TN =77
TN⊥=25
9.9 magnetometer measurements
magnetization vs. T, H || c
H = 5 kOe, Fig. 289
88B
2
.1 R
are e
arth
ele
men
ts 2
5
Structure Spin
ordering [K]
TC
[K]
TN
[K]
ps
[µB]
peff
[µB/R]
Remarks Ref.
19.2 85 scanning microcalorimetry,
ferromagnetic first order transition, Fig. 276, Fig. 277
the latent heat, HL = (18.5 ± 1) J mol–1
three endothermic peaks within 21 K < T < 26 K
at 25.3 K: HL = (1.2 ± 0.3) J mol–1
at 21.6 K: HL = (0.5 ± 0.3) J mol–1
two peaks in 50 K < T < 55 K range
53.4 K: HL = (1.3 ± 0.3) J mol–1
)
50.8 K: HL = (0.7 ± 0.3) J mol–1
)
89Å
Er/Y
superlattice
[Er32/Y21]
78(1) neutron diffraction studies
magnetic peaks, Fig. 282
magnetoelastic energy 1.4 K/atom
89R
Er/Y
multilayers
84 8.5 turn angles and magnetic moment vs. T, Fig. 283
0 < T < 80 K
TN = 78 K for [Er32/Y21]
TN = 78.5 K for [Er23/Y19]
TN = 72.5(10) K for [Er13/Y26]
89R1
hcp 18 81 magnetic X-ray scattering
magnetic satellite intensity vs. T in 0 < T < 60 K, Fig. 260
90B1
Er/Y
superlattice
dEr=375-14.500Å
dY=175-2200Å
TN||=45
TN⊥=28
structural and magnetic properties
schematic drawing of Er/Y super lattice, Fig. 281
field dependence of magnetization for 9500 Å films, Fig. 279
critical field vs. film thickness at 10 K and 20 K, Fig. 278
magnetization vs. magnetic field 0 < H < 40 kOe, Fig. 287
critical field vs. T, Fig. 286
saturation moment at 10 K, 208 G cm3g
–1 for [Er23.5 / Y19]100
91B
26
2
.1 R
are e
arth
ele
men
ts
Structure Spin
ordering [K]
TC
[K]
TN
[K]
ps
[µB]
peff
[µB/R]
Remarks Ref.
Er/Lu
d=400-9500Å
21 magnetization vs. T, H || c; 0 < T < 100 K, Fig. 291
modulated spin state vs. T, Fig. 261
91B1
s.c. 8.2 spin-slip transition
magnetization vs. magnetic field, 0 < H < 30 kOe, Fig. 266
tricritical point at T = 68 K
spin-slip structure; = 5/21, 5/24, 5/27
91G
s.c. 84 magnetoelastic effects
c33 temperature dependence, 0 < T < 90 K, Fig. 292
sharp points at TN , TN = 52 K and TC = 18 K
c11 and 11 between 15 K < T < 60 K
lock-in structure, b = 7 evidence, Fig. 293
92E
hcp Cone lock-in
q=(1/4)c*
CAM
7.0 || c,
4.5 in
base
plane
magnetic structure
neutron scattering along c axis
wavevector vs. T, Fig. 262
lock-in cone structures vs. T, Fig. 264
magnetic moments in intermediate phase q = (1/4)c*
pxy = 4.3 µB; pz = 7.3 µB
92L
LSW
FS
helical
20 85 magnetic phase transition
magnetization vs. T, Fig. 265
transitions:
paramagnetic antiferromagnetic helical ferromagnetic
spiral(FS)
Q2 = 85 K, QB = 52 K, Q1 = 20 K
p|| = 7.8 µB, p⊥ = 4.4 µB at 6 K
wavevector = 5/21 at T < 18 K
92S
2
.1 R
are e
arth
ele
men
ts 2
7
Structure Spin
ordering [K]
TC
[K]
TN
[K]
ps
[µB]
peff
[µB/R]
Remarks Ref.
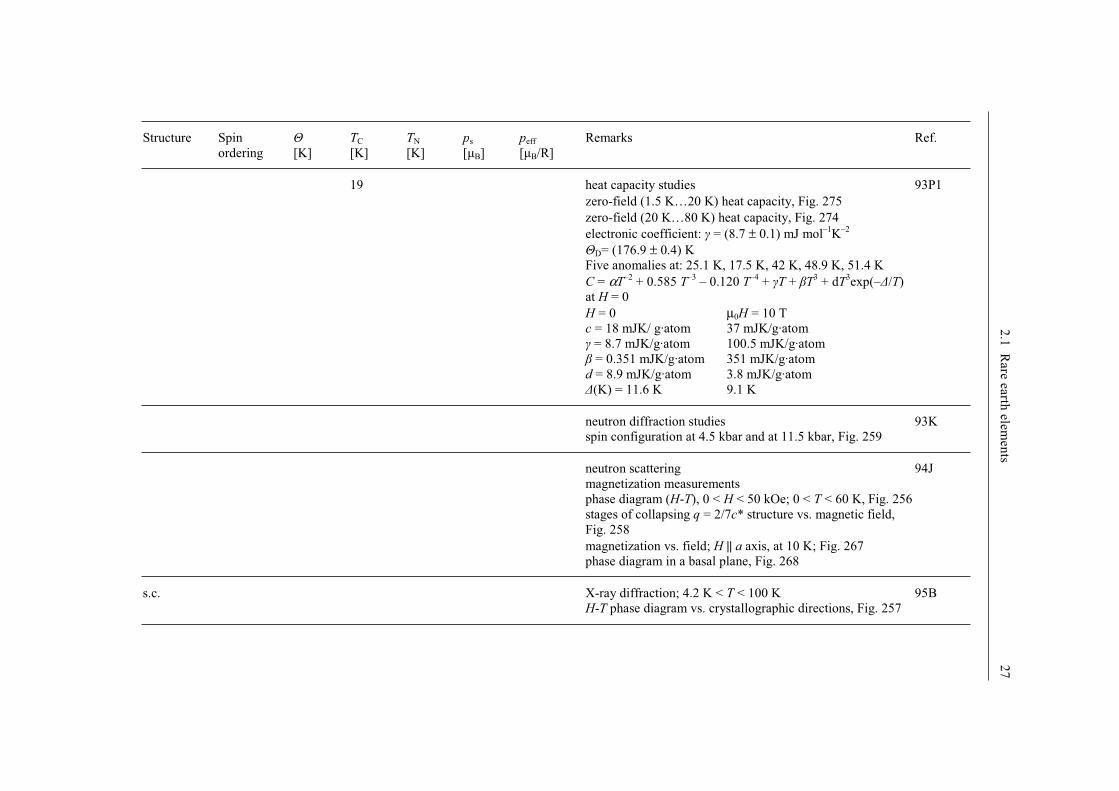
19 heat capacity studies
zero-field (1.5 K…20 K) heat capacity, Fig. 275
zero-field (20 K…80 K) heat capacity, Fig. 274
electronic coefficient: = (8.7 ± 0.1) mJ mol–1
K–2
D= (176.9 ± 0.4) K
Five anomalies at: 25.1 K, 17.5 K, 42 K, 48.9 K, 51.4 K
C = αT–2
+ 0.585 T–3
– 0.120 T–4
+ T + T3 + dT
3exp(– /T)
at H = 0
H = 0 µ0H = 10 T
c = 18 mJK/ g·atom 37 mJK/g·atom
= 8.7 mJK/g·atom 100.5 mJK/g·atom
= 0.351 mJK/g·atom 351 mJK/g·atom
d = 8.9 mJK/g·atom 3.8 mJK/g·atom
(K) = 11.6 K 9.1 K
93P1
neutron diffraction studies
spin configuration at 4.5 kbar and at 11.5 kbar, Fig. 259
93K
neutron scattering
magnetization measurements
phase diagram (H-T), 0 < H < 50 kOe; 0 < T < 60 K, Fig. 256
stages of collapsing q = 2/7c* structure vs. magnetic field,
Fig. 258
magnetization vs. field; H || a axis, at 10 K; Fig. 267
phase diagram in a basal plane, Fig. 268
94J
s.c. X-ray diffraction; 4.2 K < T < 100 K
H-T phase diagram vs. crystallographic directions, Fig. 257
95B

28
2
.1 R
are e
arth
ele
men
ts
Structure Spin
ordering [K]
TC
[K]
TN
[K]
ps
[µB]
peff
[µB/R]
Remarks Ref.
s.c. 82(1) high pressure neutron diffraction at 11.5 kbar and 14 kbar
modulation wavevector Q = q(2 /c) vs. T, Fig. 263
magnetic moment distribution at 4.5 K at rn in the n'th basal
plane
px(rn) / µB = 4.41cos(rn · Q + /2)
py(rn) / µB = 0
pz(rn) / µB = 10.16cos(rn · Q + 0)+
3.33cos(rn· Q+ ) + 2.67cos(rn·5Q+0) + 1.83cos(rn · 7Q+ )
95K
X-ray diffraction study
first order magnetic transition, Fig. 273
95T
s.c. 18 TN||=89
TN⊥=53
magnetic transition identification
magnetization, ac susceptibility,
electrical resistance, thermal expansion studies
ac susceptibility vs. T, 0 < T < 100 K, Fig. 270, Fig. 269
TN|| = 52.5 K, TN⊥ = 87.9 K
spin-slip transition at: 26.6 K, 28.5 K, 29.7 K, 35.8 K, 43.0 K
and 51.0 K,
magnetization vs. T, H || c and b axis, Fig. 271
spin-slip transition at: 26.8 K, 29.1 K, 34.4 K, 41.7 K, 51.3 K
TC = 19.5 K, TN|| = 87.4 K
95W
2
.1 R
are e
arth
ele
men
ts 2
9
Structure Spin
ordering [K]
TC
[K]
TN
[K]
ps
[µB]
peff
[µB/R]
Remarks Ref.
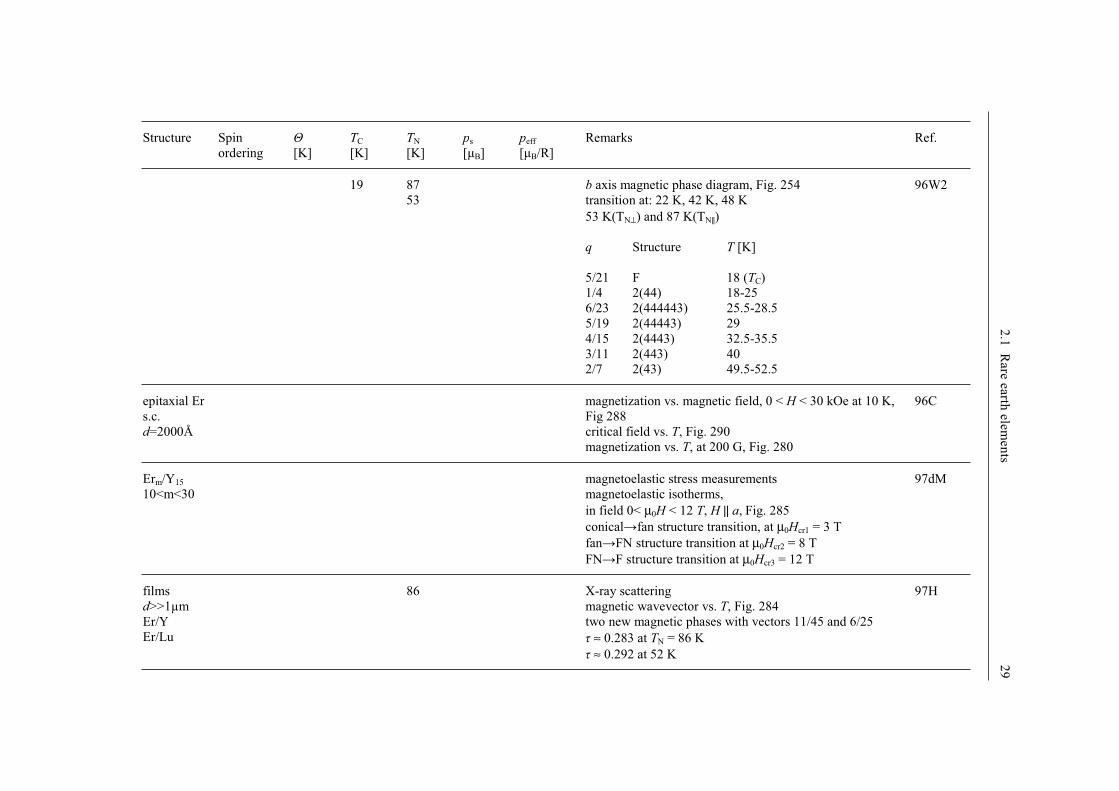
19 87
53
b axis magnetic phase diagram, Fig. 254
transition at: 22 K, 42 K, 48 K
53 K(TN⊥) and 87 K(TN||)
q Structure T [K]
5/21 F 18 (TC)
1/4 2(44) 18-25
6/23 2(444443) 25.5-28.5
5/19 2(44443) 29
4/15 2(4443) 32.5-35.5
3/11 2(443) 40
2/7 2(43) 49.5-52.5
96W2
epitaxial Er
s.c.
d=2000Å
magnetization vs. magnetic field, 0 < H < 30 kOe at 10 K,
Fig 288
critical field vs. T, Fig. 290
magnetization vs. T, at 200 G, Fig. 280
96C
Erm/Y15
10<m<30
magnetoelastic stress measurements
magnetoelastic isotherms,
in field 0< µ0H < 12 T, H || a, Fig. 285
conical fan structure transition, at µ0Hcr1 = 3 T
fan FN structure transition at µ0Hcr2 = 8 T
FN F structure transition at µ0Hcr3 = 12 T
97dM
films
d>>1µm
Er/Y
Er/Lu
86 X-ray scattering
magnetic wavevector vs. T, Fig. 284
two new magnetic phases with vectors 11/45 and 6/25
≈ 0.283 at TN = 86 K
≈ 0.292 at 52 K
97H
30
2
.1 R
are e
arth
ele
men
ts
Structure Spin
ordering [K]
TC
[K]
TN
[K]
ps
[µB]
peff
[µB/R]
Remarks Ref.
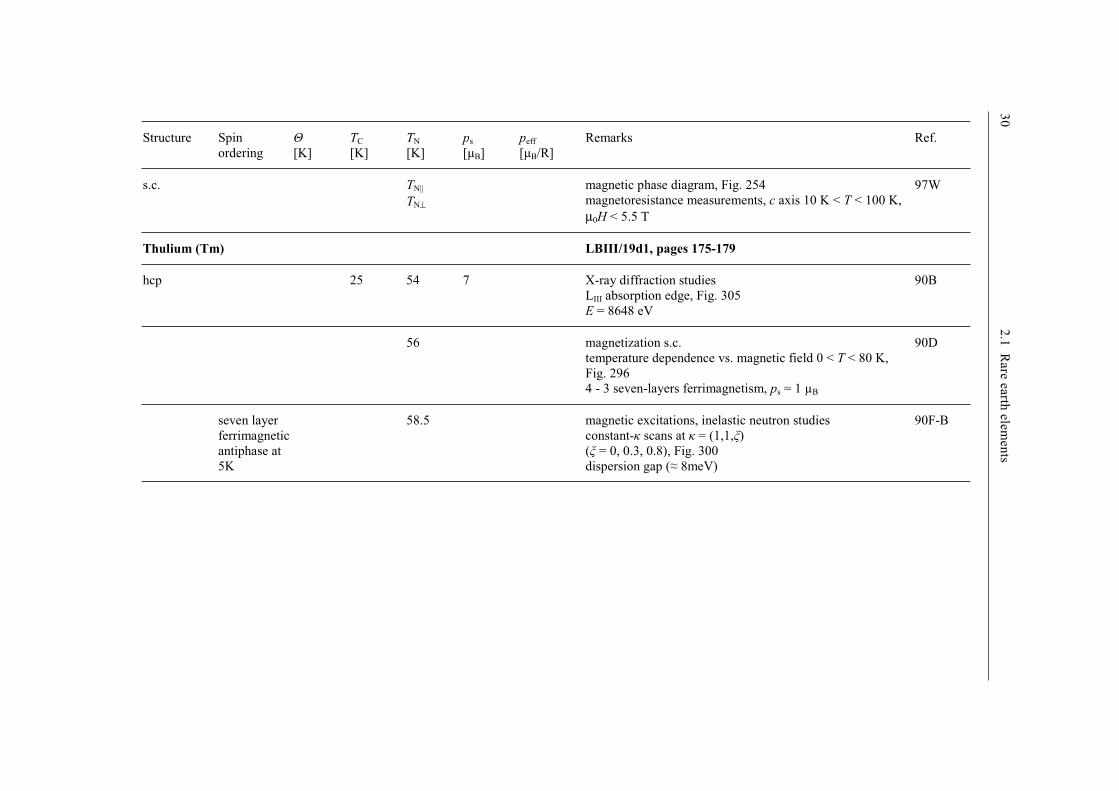
s.c. TN||
TN⊥
magnetic phase diagram, Fig. 254
magnetoresistance measurements, c axis 10 K < T < 100 K,
µ0H < 5.5 T
97W
Thulium (Tm) LBIII/19d1, pages 175-179
hcp 25 54 7 X-ray diffraction studies
LIII absorption edge, Fig. 305
E = 8648 eV
90B
56 magnetization s.c.
temperature dependence vs. magnetic field 0 < T < 80 K,
Fig. 296
4 - 3 seven-layers ferrimagnetism, ps = 1 µB
90D
seven layer
ferrimagnetic
antiphase at
5K
58.5 magnetic excitations, inelastic neutron studies
constant- scans at = (1,1, )
( = 0, 0.3, 0.8), Fig. 300
dispersion gap ( 8meV)
90F-B
2
.1 R
are e
arth
ele
men
ts 3
1
Structure Spin
ordering [K]
TC
[K]
TN
[K]
ps
[µB]
peff
[µB/R]
Remarks Ref.
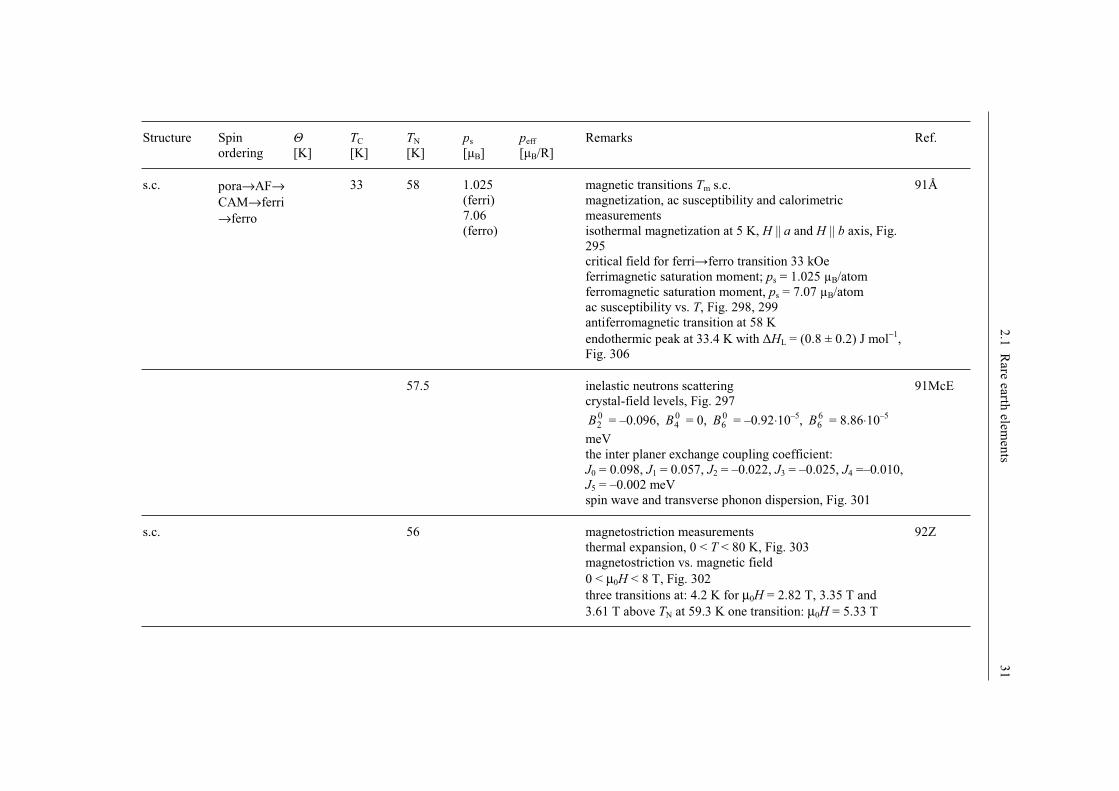
s.c. pora→AF→CAM→ferri
→ferro
33 58 1.025
(ferri)
7.06
(ferro)
magnetic transitions Tm s.c.
magnetization, ac susceptibility and calorimetric
measurements
isothermal magnetization at 5 K, H || a and H || b axis, Fig.
295
critical field for ferri ferro transition 33 kOe
ferrimagnetic saturation moment; ps = 1.025 µB/atom
ferromagnetic saturation moment, ps = 7.07 µB/atom
ac susceptibility vs. T, Fig. 298, 299
antiferromagnetic transition at 58 K
endothermic peak at 33.4 K with HL = (0.8 ± 0.2) J mol−1
,
Fig. 306
91Å
57.5 inelastic neutrons scattering
crystal-field levels, Fig. 297 02B = –0.096, 0
4B = 0, 06B = –0.92⋅10
–5, 6
6B = 8.86⋅10–5
meV
the inter planer exchange coupling coefficient:
J0 = 0.098, J1 = 0.057, J2 = –0.022, J3 = –0.025, J4 =–0.010,
J5 = –0.002 meV
spin wave and transverse phonon dispersion, Fig. 301
91McE
s.c. 56 magnetostriction measurements
thermal expansion, 0 < T < 80 K, Fig. 303
magnetostriction vs. magnetic field
0 < µ0H < 8 T, Fig. 302
three transitions at: 4.2 K for µ0H = 2.82 T, 3.35 T and
3.61 T above TN at 59.3 K one transition: µ0H = 5.33 T
92Z
32
2
.1 R
are e
arth
ele
men
ts
Structure Spin
ordering [K]
TC
[K]
TN
[K]
ps
[µB]
peff
[µB/R]
Remarks Ref.
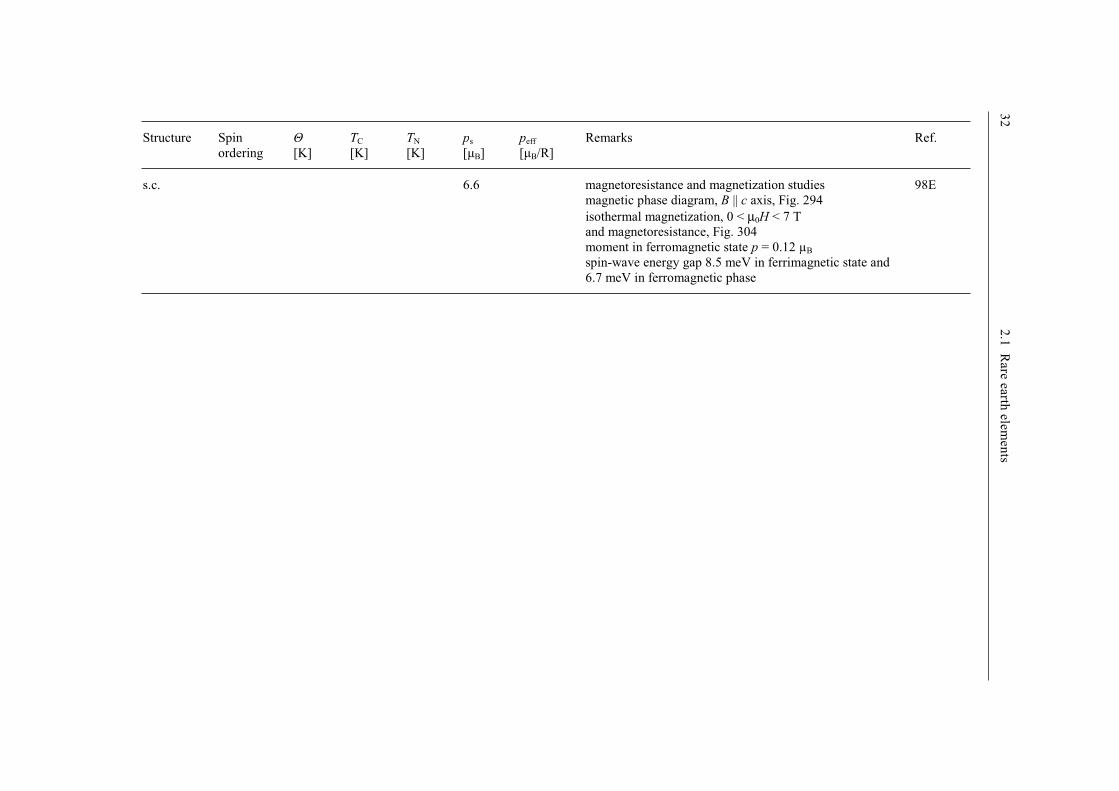
s.c. 6.6 magnetoresistance and magnetization studies
magnetic phase diagram, B || c axis, Fig. 294
isothermal magnetization, 0 < µ0H < 7 T
and magnetoresistance, Fig. 304
moment in ferromagnetic state p = 0.12 µB
spin-wave energy gap 8.5 meV in ferrimagnetic state and
6.7 meV in ferromagnetic phase
98E
2.1 Rare earth elements 1
Landolt-Börnstein
New Series III/32D
References
74W Wells, P., Lanchester, P.C., Jones, D.W., Jordan, R.G.: J. Phys. F 4 (1974) 1729
85G Gibbs, D., Moncton, D.E., D’Amico, K.L., Bohr, J., Grier, B.H.: Phys. Rev. Lett. 55 (1985)
234
85T Tsang,T-W., Gschneidner jr., K.A., Schmidt, F.A., Thome, D.K.: Phys. Rev. B 31 (1985) 235
86B Bohr, J., Gibbs, D., Moncton, D.E., D’Amico, K.L.: Physica A 140 (1986) 349
86Ch Chowdhury, A.R., Collins, G.S., Hohenemser, C.: Phys. Rev. B 33 (1986) 5070
86G Grünburg, P., Schreiber, R., Pang, Y., Brodsky, M.B., Sowers, H.: Phys. Rev. Lett. 57 (1986)
2442
86P Ponomarev, B.K.: J. Magn. Magn. Mater. 61 (1986) 129
86R Rau, C., Eichner, S.: Phys. Rev. B 34 (1986) 6347
86S Salamon, M.B., Sinha, S., Rhyne, J.J., Cunningham, J.E., Erwin, R.W., Borchers, J., Flynn,
C.P.: Phys. Rev. Lett. 56 (1986) 259
87B Borchers, J., Sinha, S., Salamon, M.B., Du, R., Flynn, C.P., Rhyne, J.J., Erwin, R.W.: J. Appl.
Phys. 61 (1987) 4049
87C Cowen, R.A., Stolzman, B., Averback, R.S., Hahn, H.: J. Appl. Phys. 61 (1987) 3317
87E Erwin, R.W., Rhyne, J.J., Salamon, M.B., Borchers, J., Sinha, S., Du, R., Cunningham, J. E.,
Flynn, C.P.: Phys. Rev. B 35 (1987) 6808
87F Farle, M., Baberschke, K.: Phys. Rev. Lett. 58 (1987) 511
87F1 Farrell, J.N., Taylor, R.D.: Phys. Rev. Lett. 58 (1987) 2478
87H Hill, R.W., Collocott, S.J., Gschneidner jr., K.A., Schmidt, F.A.: J. Phys. F 17 (1987) 1867
87K Kwo, J., Hong, F.J., DiSalvo, F.J., Waszczak, J.V., Majkrzak, C.F.: Phys. Rev. B 35 (1987)
7295
87K1 Konovalov, S.V., Singer, V.V., Radovskij, I.Z., Geld, P.V.: Solid State Phys. 29 (1987) 1768
87L Leyarovski, E., Marachkov, J., Gilewski, A., Mydlarz, T.: Phys. Rev. B 35 (1987) 8674
87R Rhyne, J.J., Erwin, R.W., Borchers, J., Sinha, S., Salamon, M.B., Du, R., Flynn, C.P.: J. Appl.
Phys. 61 (1987) 4043
88Å Åström, H.U., Benediktsson, G.: J. Phys. F 18 (1988) 2113
88B Borchers, J.A., Salamon, M.B., Du, R., Flynn, C.P., Rhyne, J.J., Erwin, R.W.: J. Appl. Phys.
63 (1988) 3458
88B1 Bates, S., Patterson, C., McIntyre, G.J., Palmer, S.B., Mayer, A., Cowley, R.A., Melville, R.: J.
Phys. C 21 (1988) 4125
88C Cowley, R.A., Bates, S.: J. Phys. C 21 (1988) 4113
88N Nakamura, O., Baba, K., Ishii, H., Takeda, T.: J. Appl. Phys. 64 (1988) 3614
88O Orlov, V.G., Kurchatov, I.V.: Solid State Commun. 67 (1988) 689
88R Rau, C., Jin, C., Robert, M.: J. Appl. Phys. 63 (1988) 3667
89Å Âström, H.U., Benediktsson, G.: J. Phys. Condens. Matter 1 (1989) 4381
89B Baruchel, J., Sandonis, J. Pearce, A.: Physica B 156-157 (1989) 765
89F Forgan, E.M., Gibbons, E.P., McEwen, K.A., Fort, D.: Phys. Rev. Lett. 62 (1989) 470
89F1 Farle, M., Berghaus, A., Baberschke, K.: Phys. Rev. B 39 (1989) 4838
89G Geldart, D.J., Hargraves, P., Fujiki, N.M., Dunlap, R.A.: Phys. Rev. Lett. 62 (1989) 2728
89I Isaacs, E.D., McWhan, D.B., Siddons, D.P., Hastings, J.B., Gibbs, D.: Phys. Rev. B 40 (1989)
9336
89K Kataev, G.I., Sattarov, M.R.,Tishin, A.M.: Phys. Status Solidi (a) 114 (1989) K79
89N Nikitin, S.A., Tishin, A.M., Bykhover, S.E.: Phys. Status Solidi (a) 114 (1989) K99
89R Rhyne, J.J., Erwin, R.W., Borchers, J., Salamon, M.B., Du, R., Flynn, C.P.: Physica B 159
(1989) 111
89R1 Rhyne, J.J., Erwin, R.W., Borchers, J., Salamon, M.B., Du, R., Flynn, C.P.: Phys. Scr. T 29
(1989) 31
89S Stewart, A.M., Collocott, S.J.: J. Phys.: Condens. Matter 1 (1989) 677
90B Bohr, J. Gibbs, D., Huang, K.: Phys. Rev. B 42 (1990) 4322
90B1 Bohr, J.: J. Magn. Magn. Mater. 83 (1990) 530
2 2.1 Rare earth elements
Landolt-Börnstein
New Series III/32D
90B2 Burhanov, G.S., Volkozub, A.V., Snigirev, O.V., Tishin, A.M., Chistykov, O.D.: Solid State
Phys. 32 (1990) 2483
90D Daou, J.N., Burger, J.P., Vajda, P., Chouteau, G., Tur, R.: J. Phys.: Condens. Matter 2 (1990)
7897
90F-B Fernandez-Baca, J.A., Niclow, R.M., Rhyne, J.J.: J. Appl. Phys. 67 (1990) 5283
90H Hartmann, O., Wäppling, R., Karlsson, E., Kalvius, G.M., Asch, L., Litterst, F.J., Aggarwal,
K., Münch, K.H., Gygax, F.N., Schenck, A.: Hyperfine Interactions 64 (1990) 369
90J Jensen, J., Mackintosh, A. R.: Phys. Rev. Lett. 64 (1990) 2699
90S Salas, F.H., Mirabal-Garcia, M.: Phys. Rev. B 41 (1990) 10859
90W Willis, F., Ali, N., Steinitz, M.O., Mojtaba Kahrizi, Tindall, D.A.: J. Appl. Phys. 67 (1990)
5277
91Å Åström, H.U., Noguest, J., Nicolaides, G.K., Rao, K.V., Benediktsson, G.: J. Phys.: Condens.
Matter 3 (1991) 7395
91B Borchers, J.A., Salamon, M.B., Erwin, R.W., Rhyne, J.J., Du, R.R., Flynn, C.P.: Phys. Rev. B
43 (1991) 3123
91B1 Beach, R.S., Borchers, J.A., Erwin, R.W., Rhyne, J.J., Matheny, A., Flynn, C.P., Salamon,
M.B.: J. Appl. Phys. 69 (1991) 4335
91B2 Bucher, J.P., Douglass, D.C., Bloomfield, L.A.: Phys. Rev. Lett. 66 (1991) 3052
91D Drulis, H., Drulis, M., in: Landoldt- Börnstein, NS (Wijn, H.P.J., ed.), Berlin, Heidelberg, New
York : Springer, Vol.III/19d1 (1991), p.1
91G Godovikov, S.K., Nikitin, S.A., Tishin, A.M.: Phys. Lett. A 158 (1991) 265
91M Majkrzak, C.F., Kwo, J., Hong, M., Yafet, Y., Gibbs, D., Chien, C.L., Bohr, J.: Adv. Phys. 40
(1991) 99
91L Dongqi Li, Hutchings, C.W., Dowben, P.A., Hwang, C., Rong-Tzong Wu, Onellion, M.,
Andrews, A.B., Erskine, J.L.: J. Magn. Magn. Mater. 99 (1991) 85
91McE McEwen, K.A., Steigenberger, U., Jensen, J.: Phys. Rev. B 43 (1991) 3298
91McK McKenna, T.J., Campbell, S.J., Chaplin, D.H., Wilson, G.V.H.: J. Phys.: Condens. Matter 3
(1991) 1855
91McM McMorrow, D.F., Patterson, C., Godfrin, H., Jehan, D.A.: Europhys. Lett. 15 (1991) 541
91N Nikitin, S.A., Tishin, A.M., Leontiev, P.I.: J. Magn. Magn. Mater. 92 (1991) 405
91N1 Nikitin, S.A., Tishin, A.M., Bezdushnyi, R.V., Spichkin, Yu.I., Red’ko, S.V.: J. Magn. Magn.
Mater. 92 (1991) 397
91R Rührig, M., Schäfer, R., Hubert, A., Mosler, R., Wolf, J.A., Demokritov, S., Gr nberg, P.:
Phys. Status Solidi (a) 125 (1991) 635
91S Nobuhiko Sakai, Yoshikazu Tanaka, Fumitake Itoh, Hiroshi Sakurai, Hiroshi Kawata, Toshiaki
Iwazumi: J. Phys. Soc. Jpn. 60 (1991) 1201
91S1 Shan, Z.S., Jacobsen, B., Liou, S.H., Sellmyer, D.J.: J. Appl. Phys. 69 (1991) 5289
91S2 Snigirev, O.V., Tishin, A.M., Volkozub, A.V.: J. Magn. Magn. Mater. 94 (1991) 342
91U Unguris, J., Celotta, R.J., Pierce, D.T.: Phys. Rev. Lett. 67 (1991) 140
91W Ruqian Wu, Freeman, A.J.: J. Magn. Magn. Mater. 99 (1991) 81
91W1 Ruqian Wu, Chun Li, Freeman, A.J., Fu, C.L.: Phys. Rev. B 44 (1991) 9400
91W2 Willis, F., Ali, N.: J. Appl. Phys. 69 (1991) 5694
91Z Zochowski, S.W., McEwen, K.A., Fawcett, E.: J. Phys.: Condens. Matter 3 (1991) 8079
92D Dongqi Li, Jiandi Zhang, Dowben, P.A., Onellion, M.: Phys. Rev. B 45 (1992) 7272
92E Eccleston, R.S., Palmer, S.B.: J. Phys.: Condens. Matter 4 (1992) 10037
92G Gehring, P.M., Rebelsky, L., Gibbs, D., Shirane, G.: Phys. Rev. B 45 (1992) 243
92J Jensen, J., Mackintosh, A.R.: J. Magn. Magn. Mater. 104-107 (1992) 1481
92J1 Jehan, D.A., McMorrow, D.F., Cowley, R.A., McIntyre, G.J.: Europhys. Lett. 17 (1992) 553
92K Kawano, S., Achiwa, N., Onodera, A., Nakai, Y.: Physica B 180-181 (1992) 46
92L Lin, H., Collins, M.F., Holden, T.M., Wei, W.: Phys. Rev. B 45 (1992) 12873
92M Mulhollan, G.A., Garrison, K., Erskine, J.L.: Phys. Rev. Lett. 69 (1992) 3240
92P Pearce, A., Baruchel, J., Kulda, J.: Phys. Status Solidi (b) 172 (1992) 443
92S Snigirev, O.V., Tishin, A.M., Volkozub, A.V.: J. Magn. Magn. Mater. 111 (1992) 149
92Z Zochowski, S.W., McEwen, K.A.: J. Magn. Magn. Mater. 104-107 (1992) 1515
2.1 Rare earth elements 3
Landolt-Börnstein
New Series III/32D
93B Beach, R.S., Borchers, J.A., Matheny, A., Erwin, R.W., Salamon, M.B., Everitt, B., Pettit, K.,
Rhyne, J.J., Flynn, C.P.: Phys. Rev. Lett. 70 (1993) 3502
93B1 Beach, R.S., Matheny, A., Salamon, M.B., Flynn, C.P., Borchers, J.A., Erwin, R.W., Rhyne,
J.J.: J. Appl. Phys. 73 (1993) 6901
93J Jehan, D.A., McMorrow, D.F., Cowley, R.A., Ward, R.C.C., Wells, M.R., Hagmann, N.,
Clausen, K.N.: Phys. Rev. B 48 (1993) 5594
93K Kawano, S., Lebech, B., Achiwa, N.: J. Phys.: Condens. Matter 5 (1993) 1535
93L Luche, M.C., Baudry, A., Boyer, P.: J. Magn. Magn. Mater. 121 (1993) 148
93McK McKenna, T.J., Campbell, S.J., Chaplin, D.H., Wilson, G.V.H.: J. Magn. Magn. Mater. 124
(1993) 105
93N Needham, L.M., Williams, W.G., Taylor, A.D.: J. Phys.: Condens. Matter 5 (1993) 2591
93P Paschen, U., Sürgers, C., v. Löhneysen, H.: Z. Phys. B 90 (1993) 289
93P1 Pecharsky, V.K., Gschneidner jr., K.A., Fort, D.: Phys. Rev. B 47 (1993) 5063
93S Swaddling, P.P., McMorrow, D.F., Simpson, J.A., Wells, M.R., Ward, R.C.C., Clausen, K.N.:
J. Phys.:Condens. Matter 5 (1993) L481
93S1 Söderlind, P., Eriksson, O., Wills, J.M., Johansson, B.: Phys. Rev. B 48 (1993) 9212
93S2 Starke, K., Navas, E., Baumgarten, L., Kaindl, G.: Phys. Rev. B 48 (1993) 1329
93T Tsui, F., Flynn, C.P.: Phys. Rev. Lett. 71 (1993) 1462
93T1 Tang, H., Weller, D., Walker, T.G., Scott, J.C., Chappert, C., Hopster, H., Pang, A.W., Dessau,
D.S., Pappas, D.P.: Phys. Rev. Lett. 71 (1993) 444
93T2 Tsui, F., Flynn, C.P., Beach, R.S., Borchers, J.A., Erwin, R.W., Rhyne, J.J.: J. Appl. Phys. 73
(1993) 6904
93V Vescovo, E., Carbone, C., Rader, O.: Phys. Rev. B 48 (1993) 7731
94A Aspelmeier, A., Gerhardter, F., Baberschke, K.: J. Magn. Magn. Mater. 132 (1994) 22
94C Cowley, R.A., McMorrow, D.F., Simpson, A., Jehan, D., Swaddling, P., Ward, R.C.C., Wells,
M.R.: J. Appl. Phys. 76 (1994) 6274
94F Farle, M., Lewis, W.A.: J. Appl. Phys. 75 (1994) 5604
94H Helgesen, G., Hill, J.P., Thurston, T.R., Gibbs, D., Kwo, J., Hong, M.: Phys. Rev. B 50 (1994)
2990
94J Jehan, D.A., McMorrow, D.F., Simpson, J.A., Cowley, R.A., Swaddling, P.P., Clausen, K.N.:
Phys. Rev. B 50 (1994) 3085
94K Kawano, S., Fernandez-Baca, J.A., Nicklow, R.M.: J. Appl. Phys. 75 (1994) 6060
94L Lebech, B., Wolny, J., Moon, R.M.: J. Phys. Condens. Matter 6 (1994) 5201
94P Pang, A.W., Berger, A., Hopster, H.: Phys. Rev. B 50 (1994) 6457
94R Rhyne, J.J., Salamon, M.B., Flynn, C.P., Erwin, R.W., Borchers, J.A.: J. Magn. Magn. Mater.
129 (1994) 39
94T Tindall, D.A., Adams, C.P., Steinitz, M.O., Holden, T.M.: J. Appl. Phys. 75 (1994) 6318
94T1 Tsui, F., Uher, C., Flynn, C.P.: Phys. Rev. Lett. 72 (1994) 3084
94T2 Tejada, J., Zhang, X.X., Ferrater, C.: Z. Phys. B 94 (1994) 245
94T3 Thurston, T.R., Helgesen, G., Hill, J.P., Gibbs, D., Gaulin, B.D., Simpson, P.J.: Phys. Rev. B
49 (1994) 15730
95A Arenholz, E., Navas, E., Starke, K., Baumgarten, L., Kaindl, G.: Phys. Rev. B 51 (1995) 8211
95A1 Andrianov, A.V.: J. Magn. Magn. Mater. 140-144 (1995) 749
95B Bulatov, A.S., Dolzhenko, V.F., Korniets, A.V.: J. Magn. Magn. Mater. 147 (1995) 403
95B1 Berger, A., Pang, A.W., Hopster, H.: Phys. Rev. B 52 (1995) 1078
95D Dufour, C., Dumesnil, K., Vergnat, M., Mangin, Ph., Marchal, G., Hennion, M.: J. Magn.
Magn. Mater. 140-144 (1995) 771
95dP Du Plessis, P. de V., Venter, A.M., Brits, G.H.F.: J. Phys.: Condens.Matter 7 (1995) 9863
95G Gajdzik, M., Paschen, U., Sürgers, C., v. Löhneysen, H.: Z. Phys. B 98 (1995) 541
95K Kawano, S., Sørensen, S. Aa., Lebech, B., Achiwa, N.: J. Magn. Magn. Mater. 140-144 (1995)
763
95L Luche, M.C., Baudry, A., Boyer, P., Rouvière, J.L., Fermon, C., Miramond, C.: J. Magn.
Magn. Mater. 150 (1995) 175
4 2.1 Rare earth elements
Landolt-Börnstein
New Series III/32D
95R Raquet, B., Sdaq, A., Broto, J.M., Rakoto, H., Ousset, J.C., Askenazy, S., Baudry, A., Boyer,
P., Luche, M.C., Khmou, A.: Physica B 211 (1995) 335
95S Shinoda, Y., Tajima, K.: J. Phys. Soc. Jpn. 64 (1995) 1334
95S1 Swaddling, P.P., McMorrow, D.F., Cowley, R.A., Simpson, J.A., Wells, M.R., Ward, R.C.C.,
Clausen, K.N., Collins, M.F., Buyers, W.J.L.: J. Magn. Magn. Mater. 140-144 (1995) 783
95S2 Simpson, J.A., McMorrow, D.F., Cowley, R.A., Jehan, D.A.: J. Magn. Magn. Mater. 140-144
(1995) 751
95T Tajima, K., Shinoda, Y., Tadakuma, M.: J. Magn. Magn. Mater. 140-144 (1995) 765
95T1 Tomka, G.J., de Groot, P.A.J., Rainford, B.D., Wells, M.R., Ward, R.C.C., Arnaudas, J.I.: J.
Magn. Magn. Mater. 140-144 (1995) 785
95T2 Tomka, G.J., de Groot, P.A.J., Rainford, B.D., Wells, M.R., Ward, R.C.C., del Moral, A.: J.
Magn. Magn. Mater. 140-144 (1995) 777
95V Venter, A.M., du Plessis, P. de V.: J. Magn. Magn. Mater. 140-144 (1995) 757
95W Watson, B., Ali, N.: J. Phys.: Condens. Matter 7 (1995) 4713
96A Aoki, Y., Sato, H., Komaba, Y., Kobayashi, Y., Sugawara, H., Yokoyama, T., Hanyu, T.:
Phys. Rev. B 54 (1996) 12172
96A1 Arnaudas, J.I., del Moral, A., Ciria, M., Tomka, G.J., de la Fuente, C., de Groot, P.A.J., Ward,
R.C.C., Wells, M.R.: J. Magn. Magn. Mater. 156 (1996) 421
96C Conover, M.J., Kaldowsky, A., Flynn, C.P.: Phys. Rev. B 53 (1996) R2938
96D Dan’kov, S.Y., Spichkin, Yu.I., Tishin, A.M.: J. Magn. Magn. Mater. 152 (1996) 208
96dM del Moral, A., Arnaudas, J.I., Ciria, M., Wells, M.R., Ward, R.C.C.: J. Magn. Magn. Mater.
157-158 (1996) 539
96H Harkins, J.V., Donovan, P.: J. Magn. Magn. Mater. 156 (1996) 224
96I Izawa, T., Tajima, K., Yamamoto, Y., Fujii, M., Fujimaru, O., Shinoda, Y.: J. Phys. Soc. Jpn.
65 (1996) 2640
96J Jiang, J.S., Chien, C.L.: J. Appl. Phys. 79 (1996) 5615
96M Mulyukov, Kh.Ya., Korznikova, G.F., Nikitin, S.A.: J. Magn. Magn. Mater. 153 (1996) 241
96T-B Theis-Bröhl, K., Ritley, K.A., Flynn, C.P., Hamacher, K., Kaiser, H., Rhyne, J.J.: J. Appl.
Phys. 79 (1996) 4779
96W Watson, D., Forgan, E.M., Nuttall, W.J., Stirling, W.G., Fort, D.: Phys. Rev. B 53 (1996) 726
96W1 Watson, B., Ali, N.: J. Phys.: Condens. Matter 8 (1996) 1797
96W2 Watson, D., Forgan, E.M., Nuttall, W.J., Sokol, P.E., Shaikh, S.J., Zochowski, S.W., Fort, D.:
J. Phys.: Condens. Matter 8 (1996) 5049
97A Alkhafaji, M.T., Ali, N.: J. Alloys Compounds 250 (1997) 659
97B-J Bryn-Jacobsen, C., Cowley, R.A., McMorrow, D.F., Goff, J.P., Ward, R.C.C., Wells, M.R.:
Physica B 234-236 (1997) 495
97dM del Moral, A., Ciria, M., Arnaudas, J.I., Ward, R.C.C., Wells, M.R.: J. Appl. Phys. 81 (1997)
5311
97E Everitt, B.A., Salamon, M.B., Borchers, J.A., Erwin, R.W., Rhyne, J.J., Park, B.J., O’Donovan,
K.V., McMorrow, D.F., Flynn, C.P.: Phys. Rev. B 56 (1997) 5452
97G Goff, J.P., Bryn-Jacobsen, C., McMorrow, D.F., Ward, R.C.C., Wells, M.R.: Phys. Rev. B 55
(1997) 12537
97G1 Gebhardt, J.R., Baer, R.A., Ali, N.: J. Alloys Compounds 250 (1997) 655
97H Helgsen, G., Tanaka, Y., Hill, J.P., Wochner, P., Gibbs, D., Flynn, C.P., Salamon, M.B. Phys.
Rev. B 56 (1997) 2635
97L Li, Yi, Polaczyk, C., Kapoor, J., Riegel, D.: J. Magn. Magn. Mater. 165 (1997) 165
97M Mulyukov, K.Ya, Korznikova, G.F., Sharipov, I.Z.: Phys. Status Solidi (a) 161 (1997) 493
97O Ohsumi, H., Tajima, K., Wakabayashi, N., Shinoda, Y., Kamishima, K., Goto, T.: J. Phys. Soc.
Jpn. 66 (1997) 1896
97T Tishin, A.M., Koksharov, Yu.A., Bohr, J., Khomutov, G.B.: Phys. Rev. B 55 (1997) 11064
97T-B Theis-Bröhl, K., Ritley, K.A., Flynn, C.P., Van Nostrand, J.E., Cahill, D.G., Hamacher, K.,
Kaiser, H., Rhyne, J.J.: J. Magn. Magn. Mater. 166 (1997) 27
97W Watson, B., Ali, N.: J. Alloys Compounds 250 (1997) 662

2.1 Rare earth elements 5
Landolt-Börnstein
New Series III/32D
98D Dan’kov, S.Yu., Tishin, A.M., Pecharsky, V.K., Gschneidner jr., K.A.: Phys. Rev. B 57 (1998)
3478
98dM de Moral, A., Ciria, M., Arnaudas, J.I., Wells, M.R., Ward, R.C.C., de la Fuente, C.: J. Phys.:
Condens. Matter 10 (1998) L139
98E Ellerby, M., McEwen, K.A., Jensen, J.: Phys. Rev. B 57 (1998) 8416
98G Gajdzik, M., Trappmann, T., Sürgers, C., v. Löhneysen, H.: Phys. Rev. B 57 (1998) 3525
98O Ono, T., Ishii, T., Tanuma, S., Yoshida, I.: Solid State Commun. 105 (1998) 93
2.1 Rare earth elements 1
2.1.3 Figures
2.1.3.1 Cerium
Temperature [K]T
Susc
eptib
ility
[10
cmg
]g
63
1−
−χ
0 50 100 150
8
7
6
5
4
3
2
αCe
1
3
4
5
2
meV545490
355230
0
Γ6
Γ81
Γ71
Γ8
Γ7
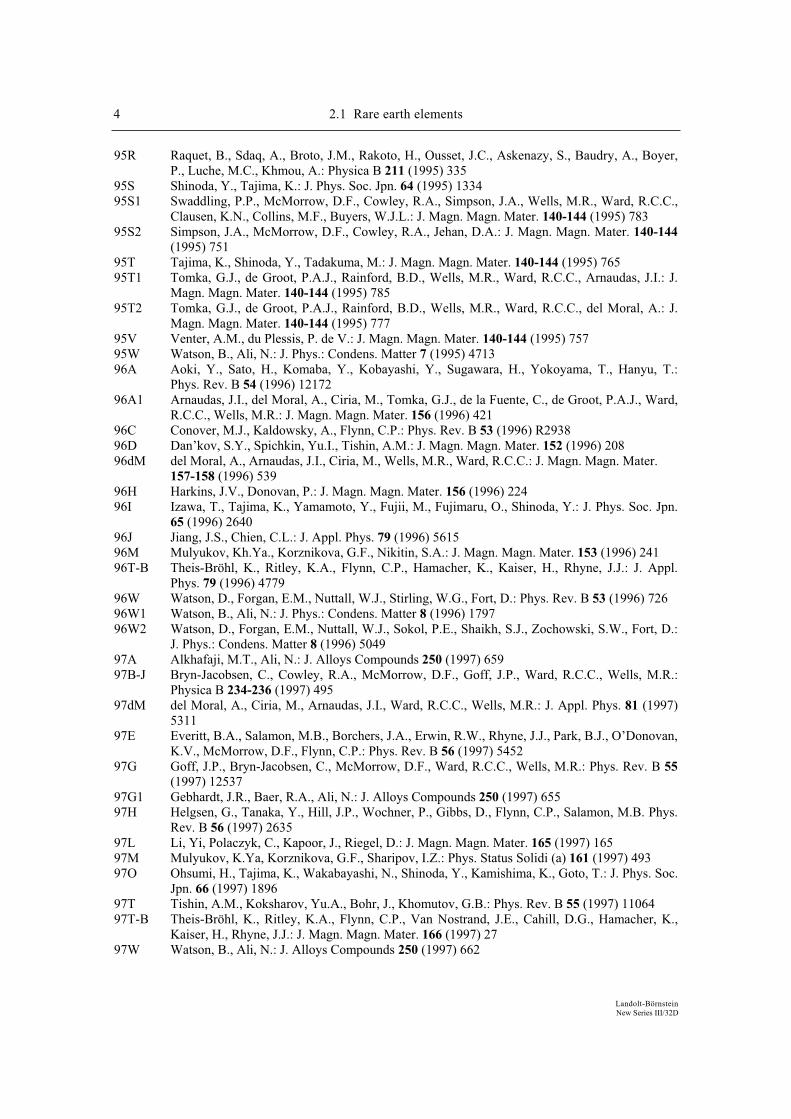
Fig. 1. Magnetic susceptibility of αCe. The dashedcurves 1 and 2 are experimental data. The solid curves were calculated at ζ = 900 K, = 600 K and χP = 0.75·10–6 cm3 g–1. The CEF parameters varied as
follows: (3): L40B = 4.53 K, L
60B = 0; (4): L40B = 3.64 K,
L60B = 0.06 K; (5): L
40B = 3.1 K, L60B = 0.11 K. The
inset shows the level scheme corresponding to the CEF parameters for curve (4). ζ: spin-orbit coupling parameter, χP: Pauli contribution [88O].
Temperature [K]T
T [K]
Inv.
susc
eptib
ility
[10
mol
cm]
m2
3−χ
−1
Inv.
susc
eptib
ility
[10
mol
cm]
m2
3−χ
−1
0
2
4
6
8
10
12
14
16
4
5
6
7
8
3
500 750 1000 1250 1500 1750 2000
Ce
Nd
Pr(+0.5)
99
97
95
931020
Tm
Ce
[10
mχ−5
cmm
ol]
31−
b
b
c
[10
mχ−5
cmm
ol]
31−
[10
mχ−5
cmm
ol]
31−
a T [K]
Tm Tm
c
184
180
176
197
193
189
185
1120 1220
Nd
Pr
181
980
Fig. 3. Temperature dependence of the susceptibility forCe, Pr and Nd for the high temperatures. The anomalies connected with the structure phase transitions and with the melting point (Tm) are visible. The solid lines arealso experimental data [87K1].
Temperature [K]T
Inv.
susc
eptib
ility
[10
g cm
]g
43−
χ−1
15
13
11
9
7
5300 400 500 600 700 800 900
1
2
γCe
Fig. 2. Inverse magnetic susceptibility of Ce. The solid curves were calculated for the following values of param-
eters: (1): ζ = 900 K, L40B = 0, L
60B = 0, Θ = 85 K, χP =
0.75 10–6 cm3 g–1; (2): ζ = 875 K, L40B = 0, L
60B = 0, =
50 K, χP = 1 10–6 cm3 g–1. ζ: spin-orbit coupling param-eter, χP: Pauli contribution [88O].
2 2.1 Rare earth elements
Magnetic field [T]µ0 H
Mag
netic
mom
ent
[]
p CeBµ
1.0
0.8
0.6
0.4
0.2
0 1 2 3 4 5 6
Ce
5Å
100Å
dCe = 15Å
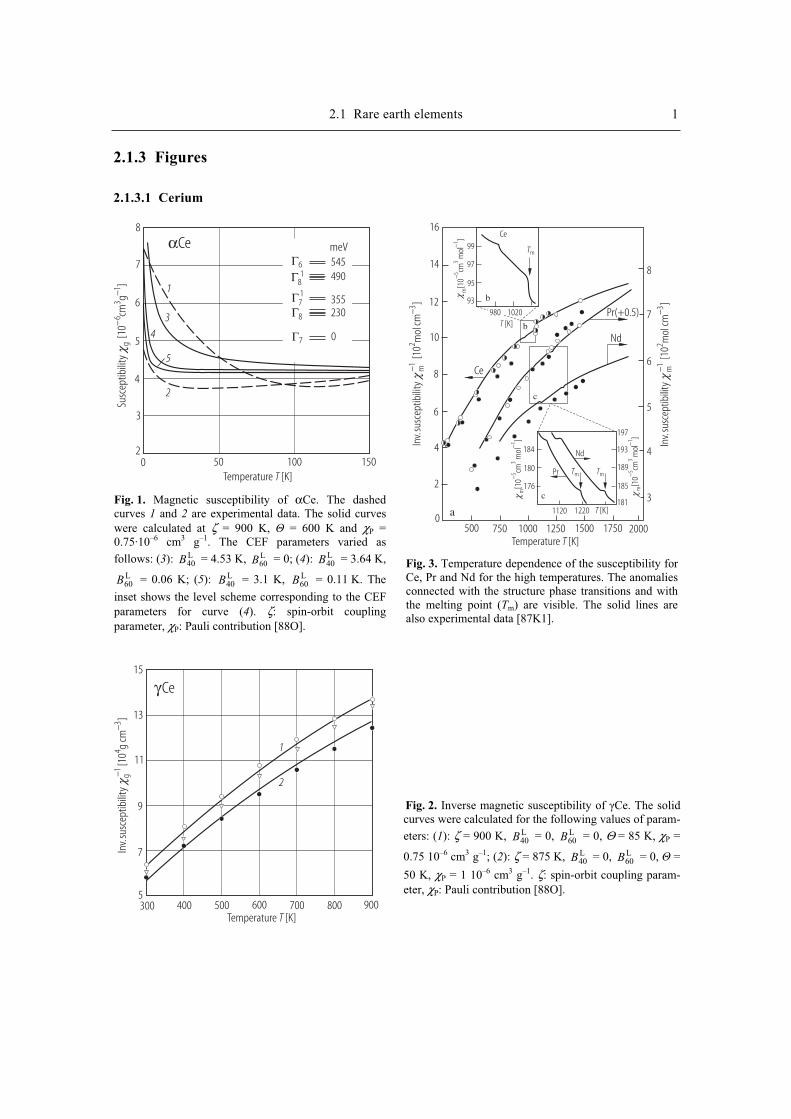
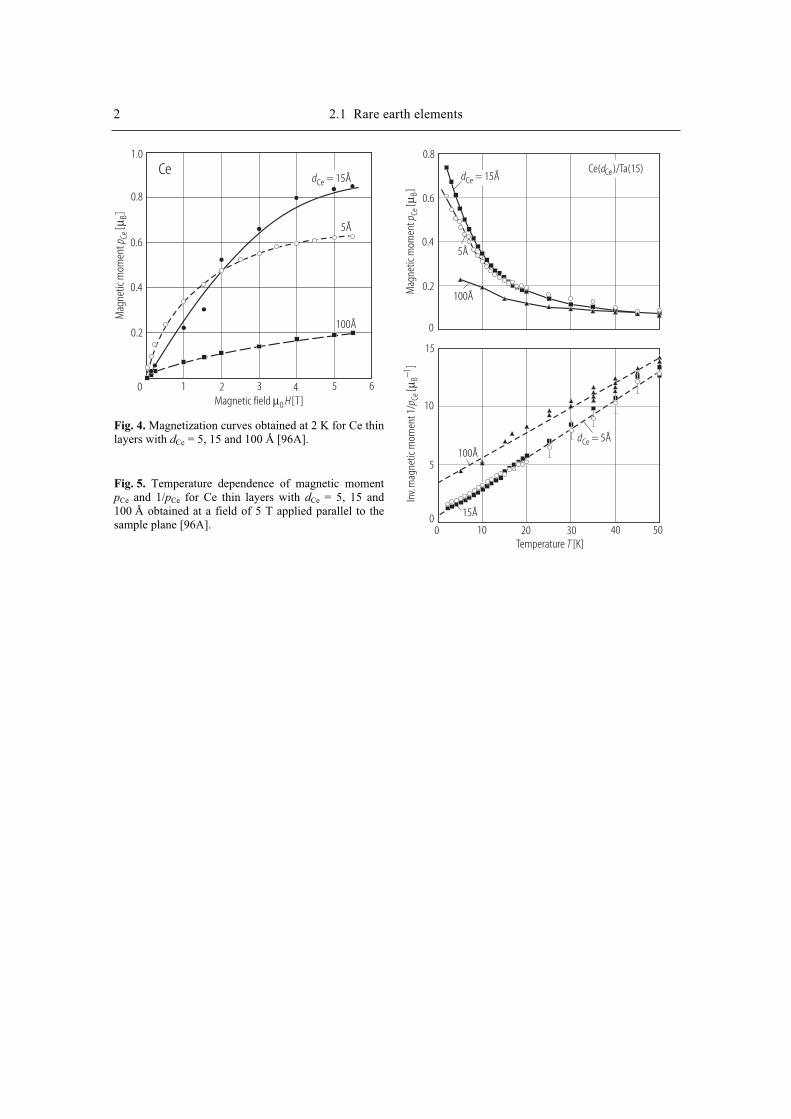
Fig. 4. Magnetization curves obtained at 2 K for Ce thin layers with dCe = 5, 15 and 100 Å [96A].
Fig. 5. Temperature dependence of magnetic moment pCe and 1/pCe for Ce thin layers with dCe = 5, 15 and100 Å obtained at a field of 5 T applied parallel to the sample plane [96A].
Temperature [K]T
Mag
netic
mom
ent
[]
p CeBµ
Inv.
mag
netic
mom
ent 1
/[
]p Ce
B1
µ−
0.8
0.6
0.4
0.2
0
15
10
5
010 20 30 40 500
5Å
100Å
15Å
100ÅdCe = 5Å
dCe = 15ÅCe( )/Ta(15)dCe

References
87K1 Konovalov, S.V., Singer, V.V., Radovskij, I.Z., Geld, P.V.: Solid State Phys. 29 (1987) 1768
88O Orlov, V.G., Kurchatov, I.V.: Solid State Commun. 67 (1988) 689
96A Aoki, Y., Sato, H., Komaba, Y., Kobayashi, Y., Sugawara, H., Yokoyama, T., Hanyu, T.:
Phys. Rev. B 54 (1996) 12172
2.1 Rare earth elements 1
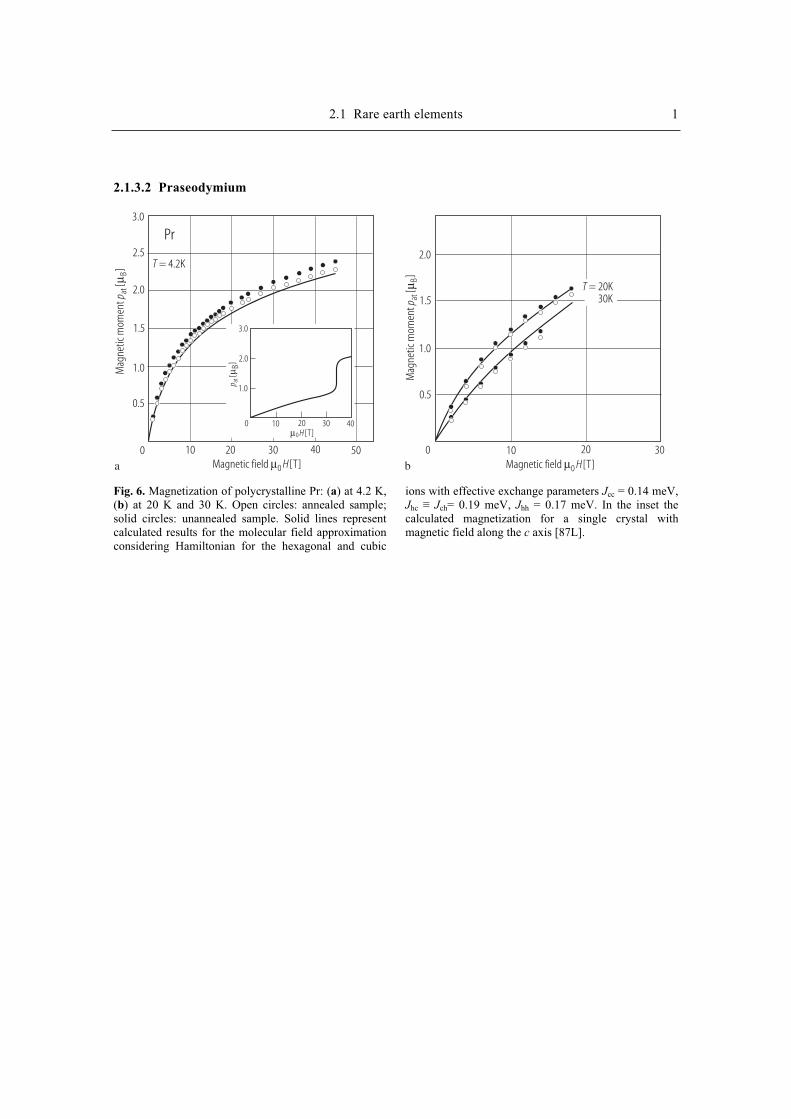
2.1.3.2 Praseodymium
Magnetic field [T]µ0 H Magnetic field [T]µ0 H
Mag
netic
mom
ent
[]
p atBµ
[B]
p atµM
agne
tic m
omen
t[
]p at
Bµ
3.0
2.5
2.0
1.5
1.0
0.5
0 10 20 30 40 50
Pr
T = 4.2K
a
2.0
1.5
1.0
0.5
0 10 20 30
T = 20K30K
b
3.0
2.0
1.0
0 10 20 30 40[T]µ0 H
Fig. 6. Magnetization of polycrystalline Pr: (a) at 4.2 K,
(b) at 20 K and 30 K. Open circles: annealed sample;
solid circles: unannealed sample. Solid lines represent
calculated results for the molecular field approximation
considering Hamiltonian for the hexagonal and cubic
ions with effective exchange parameters Jcc = 0.14 meV,
Jhc Jch= 0.19 meV, Jhh = 0.17 meV. In the inset the
calculated magnetization for a single crystal with
magnetic field along the c axis [87L].

References
87L Leyarovski, E., Marachkov, J., Gilewski, A., Mydlarz, T.: Phys. Rev. B 35 (1987) 8674
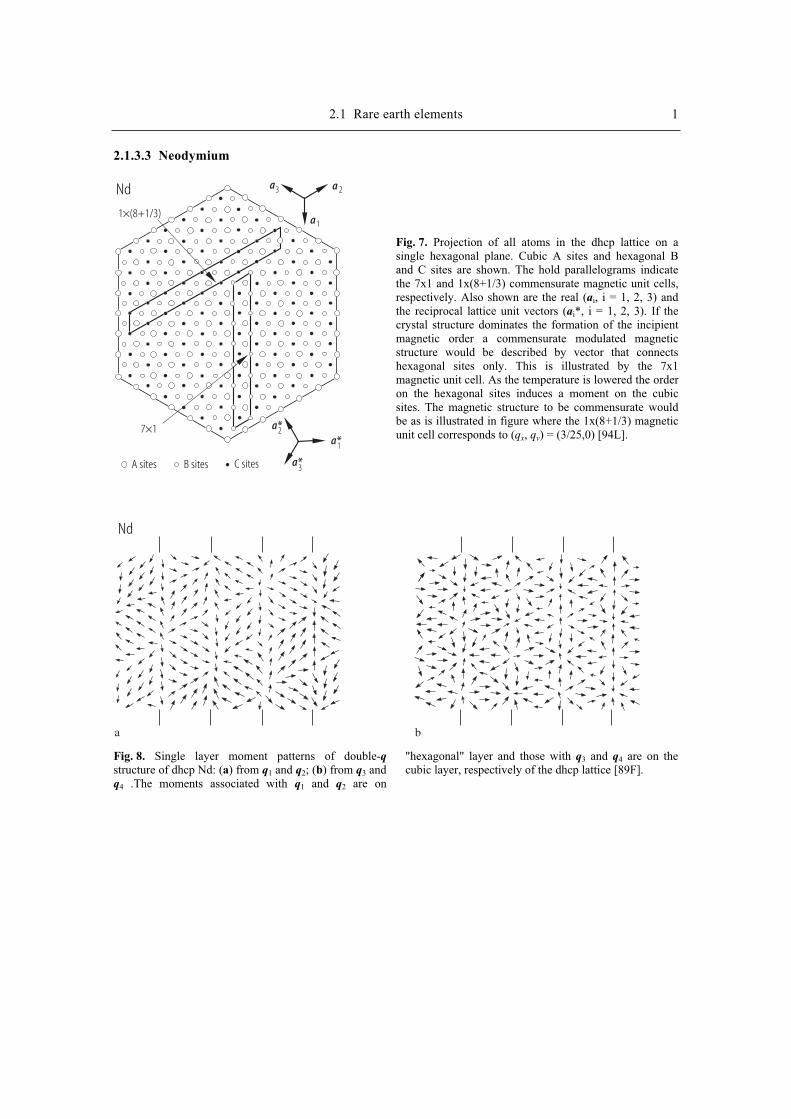
2.1 Rare earth elements 1
2.1.3.3 Neodymium
1 (8+1/3)×
7 1×
A sites B sites C sites
a a
a
a*
a*
a*
3 2
1
2
3
1
Nd
Nd
a b
Fig. 8. Single layer moment patterns of double-q
structure of dhcp Nd: (a) from q1 and q2; (b) from q3 and
q4 .The moments associated with q1 and q2 are on
"hexagonal" layer and those with q3 and q4 are on the
cubic layer, respectively of the dhcp lattice [89F].
Fig. 7. Projection of all atoms in the dhcp lattice on a
single hexagonal plane. Cubic A sites and hexagonal B
and C sites are shown. The hold parallelograms indicate
the 7x1 and 1x(8+1/3) commensurate magnetic unit cells,
respectively. Also shown are the real (ai, i = 1, 2, 3) and
the reciprocal lattice unit vectors (ai*, i = 1, 2, 3). If the
crystal structure dominates the formation of the incipient
magnetic order a commensurate modulated magnetic
structure would be described by vector that connects
hexagonal sites only. This is illustrated by the 7x1
magnetic unit cell. As the temperature is lowered the order
on the hexagonal sites induces a moment on the cubic
sites. The magnetic structure to be commensurate would
be as is illustrated in figure where the 1x(8+1/3) magnetic
unit cell corresponds to (qx, qy) = (3/25,0) [94L].
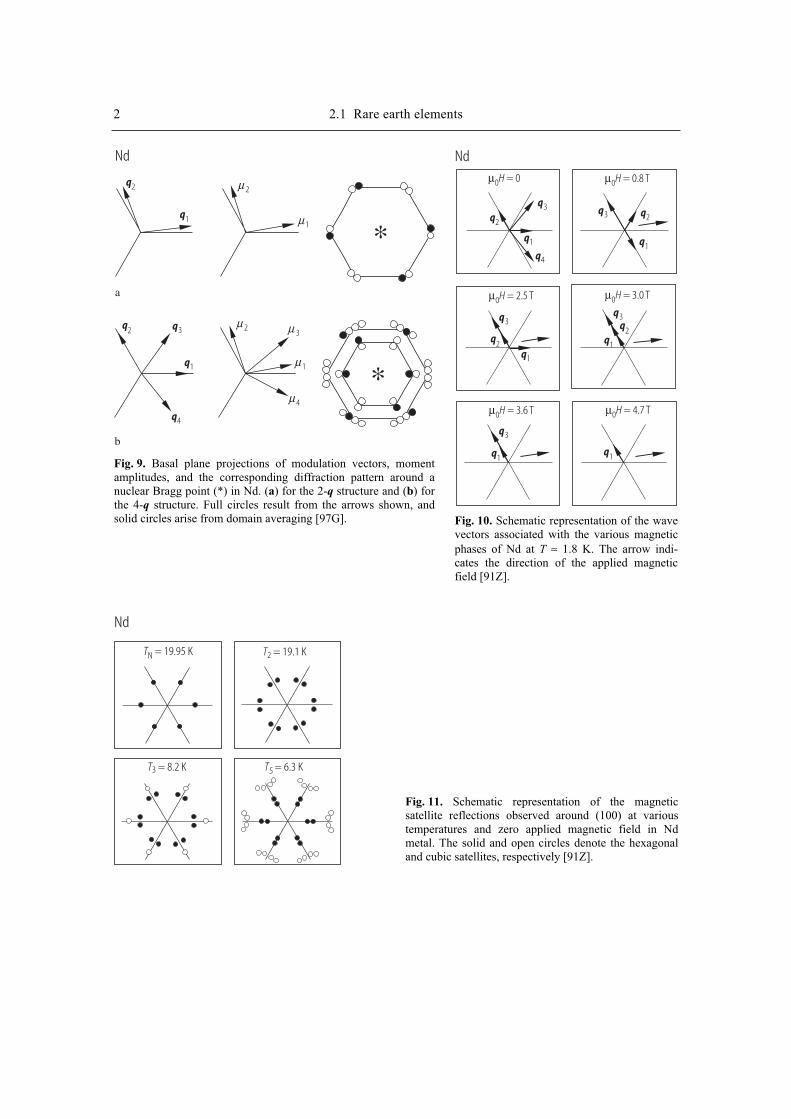
2 2.1 Rare earth elements
∗
∗
Nd
q2
q1
q2 q3
q1
q4
µ
µ
µ1
µ1
µ 2
µ 2
3
4
a
b
Fig. 9. Basal plane projections of modulation vectors, moment
amplitudes, and the corresponding diffraction pattern around a
nuclear Bragg point (*) in Nd. (a) for the 2-q structure and (b) for
the 4-q structure. Full circles result from the arrows shown, and
solid circles arise from domain averaging [97G].
q2q2
q1
q1
q1
q1
q2q2
q3
q3
q3
q3
q3
q1
q1
q4
Ndµ0H = 0 µ0H = 0.8 T
µ0H = 2.5 T
µ0H = 3.6 T µ0H = 4.7 T
µ0H = 3.0 T
Fig. 10. Schematic representation of the wave
vectors associated with the various magnetic
phases of Nd at T ≈ 1.8 K. The arrow indi-
cates the direction of the applied magnetic
field [91Z].
Nd
TN = 19.95 K T2 = 19.1 K
T5 = 6.3 KT3 = 8.2 K
Fig. 11. Schematic representation of the magnetic
satellite reflections observed around (100) at various
temperatures and zero applied magnetic field in Nd
metal. The solid and open circles denote the hexagonal
and cubic satellites, respectively [91Z].
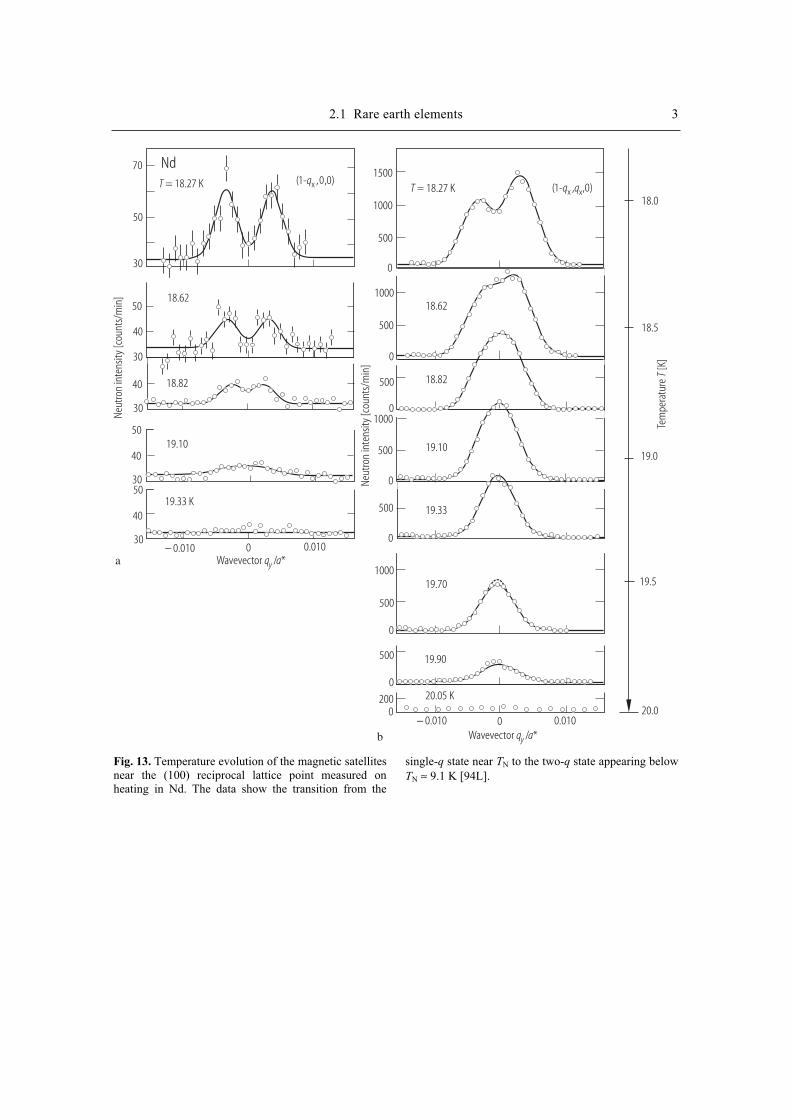
2.1 Rare earth elements 3
Wavevector / *q ay
Wavevector / *q ay
Neut
ron
inte
nsity
[cou
nts/
min
]
Neut
ron
inte
nsity
[cou
nts/
min
]
Nd70
50
30
T = 18.27 K T = 18.27 K
18.6218.62
1-1-
,,
,0),0)
q0
xx
x((
50
30
30
30
40
40
40
50
50
40
18.82 18.82
19.10 19.10
19.33 K19.33
− 0.010
− 0.010
0
0
0.010
0.010
a
b
1500
1000
1000
1000
500
500
500
500
500
500
500
0
0
0
0
0
0
0
0200
19.70
19.90
20.05 K
18.0
18.5
19.0
19.5
20.0
Tem
pera
ture
[K]
T
30
1000
Fig. 13. Temperature evolution of the magnetic satellites
near the (100) reciprocal lattice point measured on
heating in Nd. The data show the transition from the
single-q state near TN to the two-q state appearing below
TN ≈ 9.1 K [94L].
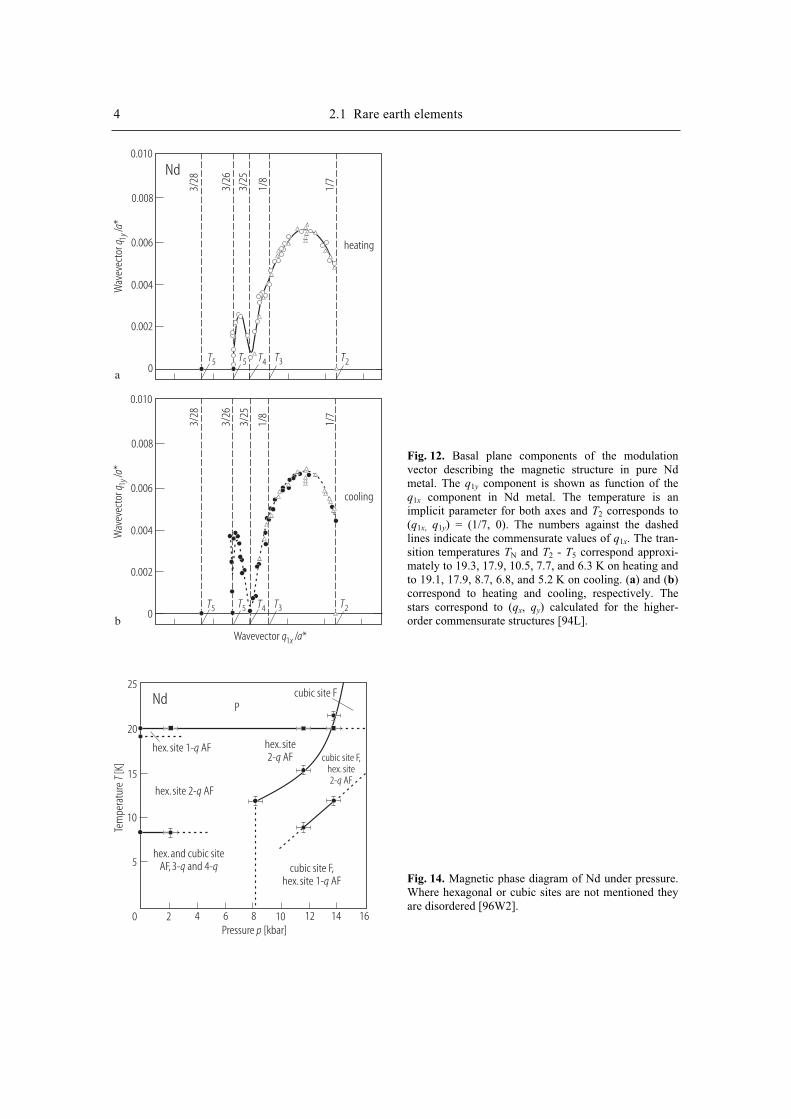
4 2.1 Rare earth elements W
avev
ecto
r/
*q
a1y
Wav
evec
tor
/*
qa
1y
Wavevector / *q a1x
0.010
0.010
0.008
0.008
0.006
0.006
0.004
0.004
0.002
0.002
0
0
T5
T5
T5
T5
T4
T4
T3
T3
T2
T2
heating
cooling
Nd
a
b
3/28
3/28
3/26
3/26
3/25
3/25
1/8
1/8
1/7
1/7
Tem
pera
ture
[K]
T
Pressure [kbar]p
25
20
15
10
5
0 2 4 6 8 10 12 14 16
Pcubic site FNd
hex. site 1- AFq
hex. site 2- AFq
hex. and cubic siteAF, 3- and 4-q q
hex. site2- AFq cubic site F,
hex. site2- AFq
cubic site F,hex. site 1- AFq
Fig. 12. Basal plane components of the modulation
vector describing the magnetic structure in pure Nd
metal. The q1y component is shown as function of the
q1x component in Nd metal. The temperature is an
implicit parameter for both axes and T2 corresponds to
(q1x, q1y) = (1/7, 0). The numbers against the dashed
lines indicate the commensurate values of q1x. The tran-
sition temperatures TN and T2 - T5 correspond approxi-
mately to 19.3, 17.9, 10.5, 7.7, and 6.3 K on heating and
to 19.1, 17.9, 8.7, 6.8, and 5.2 K on cooling. (a) and (b)
correspond to heating and cooling, respectively. The
stars correspond to (qx, qy) calculated for the higher-
order commensurate structures [94L].
Fig. 14. Magnetic phase diagram of Nd under pressure.
Where hexagonal or cubic sites are not mentioned they
are disordered [96W2].
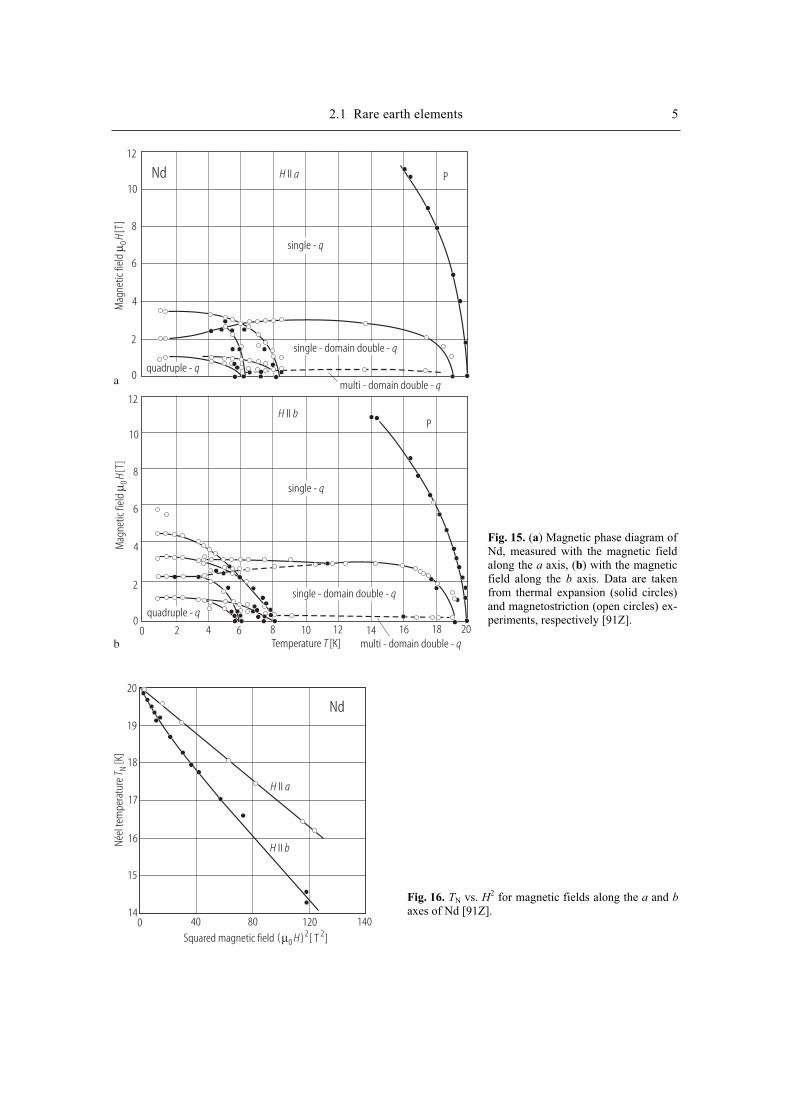
2.1 Rare earth elements 5
Temperature [K]T
Mag
netic
fiel
d[T
]µ 0
HM
agne
tic fi
eld
[T]
µ 0H
12
12
10
10
8
8
6
6
4
4
2
2
0
02 4 6 8 10 12 14 16 18 200
Nd H aII
H bII
P
P
multi - domain double - q
multi - domain double - q
single - q
single - q
quadruple - q
quadruple - q
single - domain double - q
single - domain double - q
a
b
Squared magnetic field ( ) [ T ]µ02 2H
Néel
tem
pera
ture
[K]
T N
0 40 80 120 140
20
19
18
17
16
15
14
Nd
H aII
H bII
Fig. 15. (a) Magnetic phase diagram of
Nd, measured with the magnetic field
along the a axis, (b) with the magnetic
field along the b axis. Data are taken
from thermal expansion (solid circles)
and magnetostriction (open circles) ex-
periments, respectively [91Z].
Fig. 16. TN vs. H2 for magnetic fields along the a and b
axes of Nd [91Z].
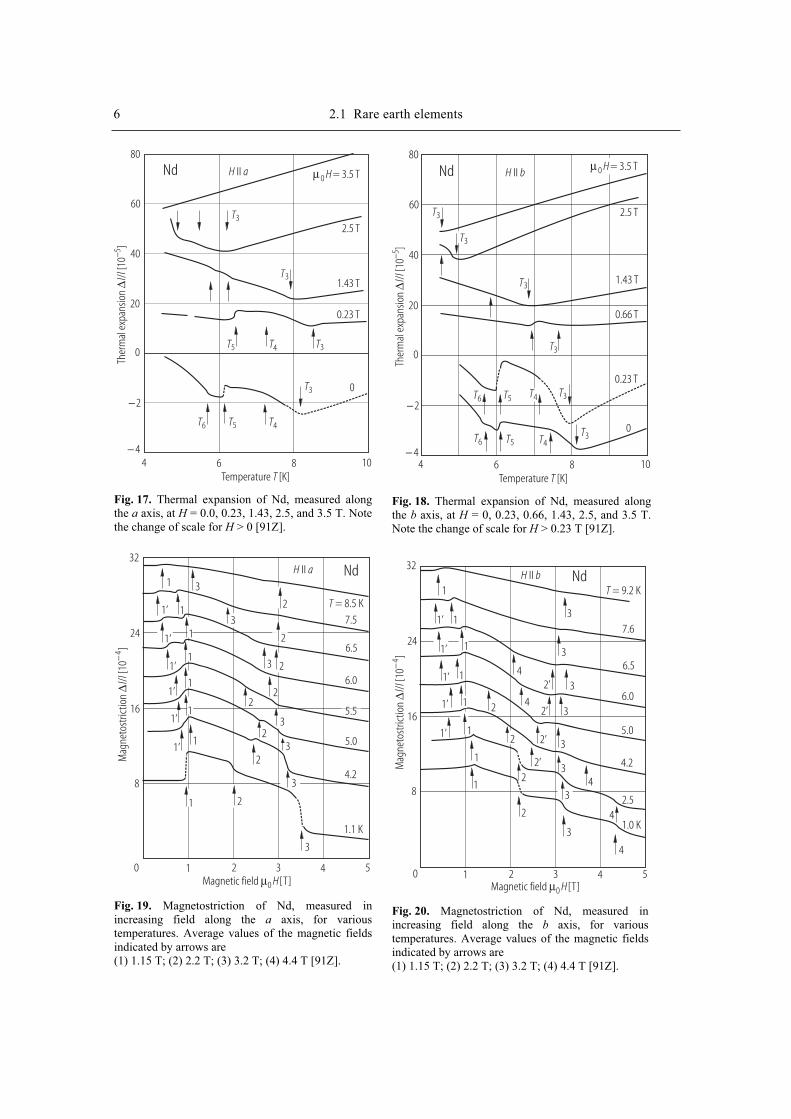
6 2.1 Rare earth elements
Temperature [K]T
Ther
mal
exp
ansio
n/
[10
]∆
l l−5
80
60
40
20
0
−2
− 44 6 8 10
Nd H aII µ0 H = 3.5 T
2.5 T
1.43 T
0.23 T
0
T3
T3
T5 T4 T3
T3
T6 T5 T4
Fig. 17. Thermal expansion of Nd, measured along
the a axis, at H = 0.0, 0.23, 1.43, 2.5, and 3.5 T. Note
the change of scale for H > 0 [91Z].
Temperature [K]T
Ther
mal
exp
ansio
n/
[10
]∆
l l−5
80
60
40
20
0
−2
− 44 6 8 10
Nd H bII
2.5 T
1.43 T
0.23 T
0
T3
T3
T5T6 T3
T3
T3T6 T5 T4
T3
0.66 T
µ0 H = 3.5 T
T4
Fig. 18. Thermal expansion of Nd, measured along
the b axis, at H = 0, 0.23, 0.66, 1.43, 2.5, and 3.5 T.
Note the change of scale for H > 0.23 T [91Z].
NdH aII
Magnetic field [T]µ0 H
Mag
neto
stric
tion
/[1
0]
∆l l
−4
32
24
16
8
0 1 2 3 4 5
1 3
21’
1’
1’
1’
1’
1’
1
1
1 2
3
2
2
22
3
3
3 2
T = 8.5 K
7.5
6.5
6.0
5.0
4.2
1.1 K
1
1
1
3
3
5.5
21
Fig. 19. Magnetostriction of Nd, measured in
increasing field along the a axis, for various
temperatures. Average values of the magnetic fields
indicated by arrows are
(1) 1.15 T; (2) 2.2 T; (3) 3.2 T; (4) 4.4 T [91Z].
NdH bII
Magnetic field [T]µ0 H
Mag
neto
stric
tion
/[1
0]
∆l l
−4
32
24
16
8
0 1 2 3 4 5
1
3
2’
1’
1’
1’
1’ 1
1
1
1
2
3
2
2
2’
3
3
3
3
2’
T = 9.2 K
7.6
6.5
6.0
5.0
4.2
1.0 K
1
3
2’4
4
4
4
4
2.5
1
2
3
1’
1
Fig. 20. Magnetostriction of Nd, measured in
increasing field along the b axis, for various
temperatures. Average values of the magnetic fields
indicated by arrows are
(1) 1.15 T; (2) 2.2 T; (3) 3.2 T; (4) 4.4 T [91Z].

2.1 Rare earth elements 7 In
tens
ity (r
elat
ive)
Photon energy [keV]E
102
10
1
10−1
10−2
6.19 6.20 6.21 6.22 6.23
Nd
Fig. 21. High resolution magnetic X-ray diffraction
of antiferromagnetic ordering in the neodymium
metal, near the LII and LIII absorption edges. The
vertical line indicates the positions of the absorption
edges in zero magnetic field [96W].
Temperature [K]TM
agne
tic m
omen
t[
]p Nd
Bµ
0.04
0.03
0.02
0.01
0 10 20 30 40 50
Nd H = 500 Oe
200 Oe100 Oe
Fig. 22. Zero-field cooled magnetization of the 582 nm
Nd film with the field along the (100) easy axis. The
anomaly near 27 K is associated with the Néel point,
which is significantly higher than in bulk Nd; the peak
near 8 K arises from cubic-site ordering [97E].
Temperature [K]T
Mag
netic
mom
ent
[]
p NdBµ
0.24
0.20
0.16
0.12
0.08
0.04
0
− 0.040 10 20 30 40 50 60 70 80
FC
ZFC
Nd
TN = 32 K
H = 500 Oe200 Oe100 Oe
Fig. 23. Field-cooled and zero-field cooled data on a
[Nd (3.2 nm)/Y (2 nm)]120 superlattice. The Néel tem-
perature extrapolated to a zero-field has 32 K, much
above the bulk value of 19.9 K [97E].
Mag
netic
mom
ent
[]
p Nd,h
exBµ
Nd concentration
2.5
2.0
1.5
1.0
0.5
00.4 0.5 0.6 0.7 0.8 0.9
Nd/Y helical orderbulk-like order
Fig. 25. Magnetic moment per hexagonal site
associated with helimagnetic order and the moment per
atom associated with bulk-like order of hexagonal sites
vs. the Nd concentration in the Nd/Y superlattices. The
Nd atoms are in the dhcp structure in all samples [97E].
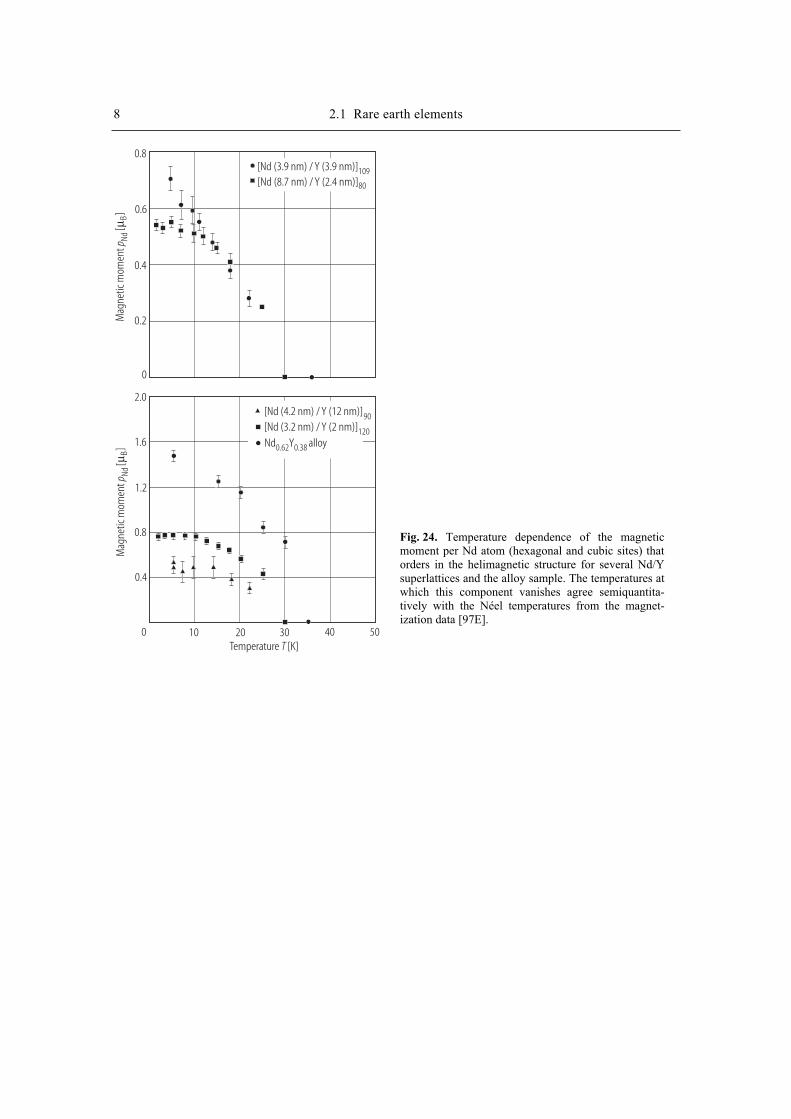
8 2.1 Rare earth elements
Temperature [K]T
Mag
netic
mom
ent
[]
p NdBµ
Mag
netic
mom
ent
[]
p NdBµ
0.8
0.6
0.4
0.2
0
2.0
1.6
1.2
0.8
0.4
0 10 20 30 40 50
[Nd (3.9 nm) / Y (3.9 nm)]109[Nd (8.7 nm) / Y (2.4 nm)]80
[Nd (4.2 nm) / Y (12 nm)]90[Nd (3.2 nm) / Y (2 nm)]120Nd Y alloy0.62 0.38
Fig. 24. Temperature dependence of the magnetic
moment per Nd atom (hexagonal and cubic sites) that
orders in the helimagnetic structure for several Nd/Y
superlattices and the alloy sample. The temperatures at
which this component vanishes agree semiquantita-
tively with the Néel temperatures from the magnet-
ization data [97E].

References
89F Forgan, E.M., Gibbons, E.P., McEwen, K.A., Fort, D.: Phys. Rev. Lett. 62 (1989) 470
91Z Zochowski, S.W., McEwen, K.A., Fawcett, E.: J. Phys.: Condens. Matter 3 (1991) 8079
94L Lebech, B., Wolny, J., Moon, R.M.: J. Phys. Condens. Matter 6 (1994) 5201
96W Watson, D., Forgan, E.M., Nuttall, W.J., Stirling, W.G., Fort, D.: Phys. Rev. B 53 (1996) 726
96W2 Watson, D., Forgan, E.M., Nuttall, W.J., Sokol, P.E., Shaikh, S.J., Zochowski, S.W., Fort, D.:
J. Phys.: Condens. Matter 8 (1996) 5049
97E Everitt, B.A., Salamon, M.B., Borchers, J.A., Erwin, R.W., Rhyne, J.J., Park, B.J., O’Donovan,
K.V., McMorrow, D.F., Flynn, C.P.: Phys. Rev. B 56 (1997) 5452
97G Goff, J.P., Bryn-Jacobsen, C., McMorrow, D.F., Ward, R.C.C., Wells, M.R.: Phys. Rev. B 55
(1997) 12537
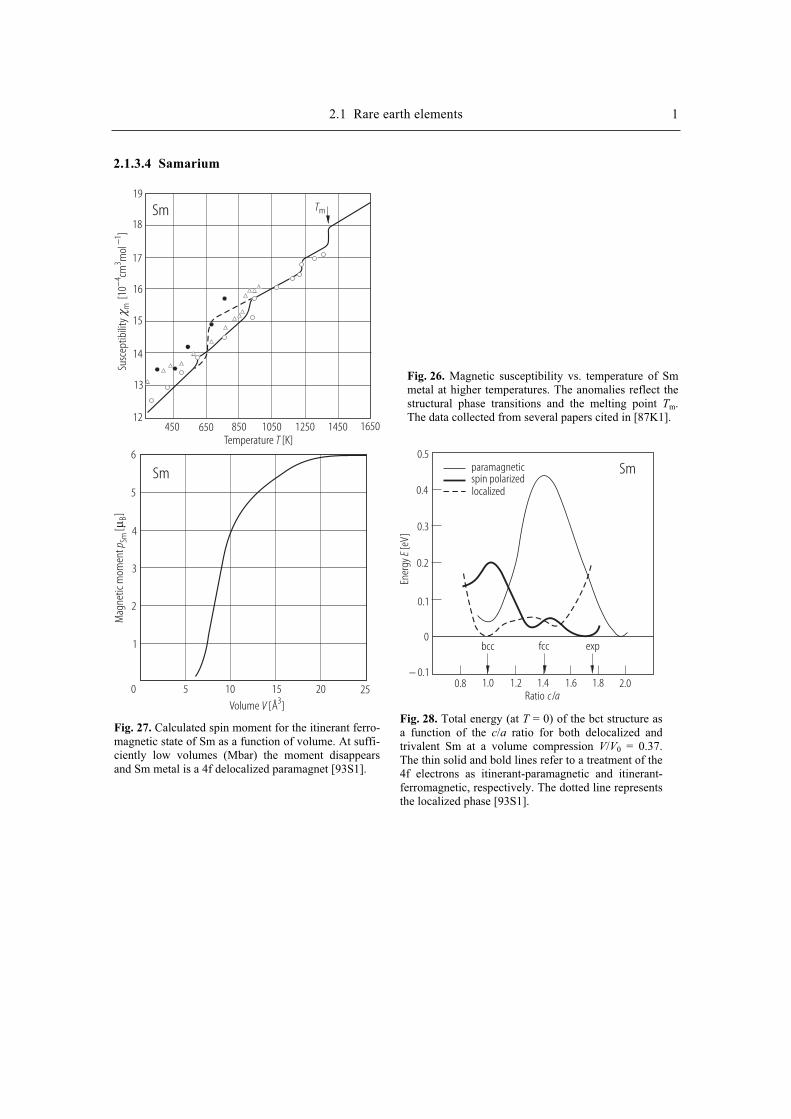
2.1 Rare earth elements 1
2.1.3.4 Samarium
Temperature [K]T
Susc
eptib
ility
[10
cmm
ol]
m4
31
−−
χ
19
18
17
16
15
14
13
12450 650 850 1050 1250 1450 1650
Sm Tm
Mag
netic
mom
ent
[]
p SmBµ
Volume [Å ]V 3
6
5
4
3
2
1
0 5 10 15 20 25
Sm
Fig. 27. Calculated spin moment for the itinerant ferro-
magnetic state of Sm as a function of volume. At suffi-
ciently low volumes (Mbar) the moment disappears
and Sm metal is a 4f delocalized paramagnet [93S1].
Ener
gy[e
V]E
Ratio /c a
0.5
0.4
0.3
0.2
0.1
0
0.8 1.0 1.2 1.4 1.6 1.8 2.0− 0.1
paramagneticspin polarizedlocalized
Sm
bcc fcc exp
Fig. 28. Total energy (at T = 0) of the bct structure as
a function of the c/a ratio for both delocalized and
trivalent Sm at a volume compression V/V0 = 0.37.
The thin solid and bold lines refer to a treatment of the
4f electrons as itinerant-paramagnetic and itinerant-
ferromagnetic, respectively. The dotted line represents
the localized phase [93S1].
Fig. 26. Magnetic susceptibility vs. temperature of Sm
metal at higher temperatures. The anomalies reflect the
structural phase transitions and the melting point Tm.
The data collected from several papers cited in [87K1].
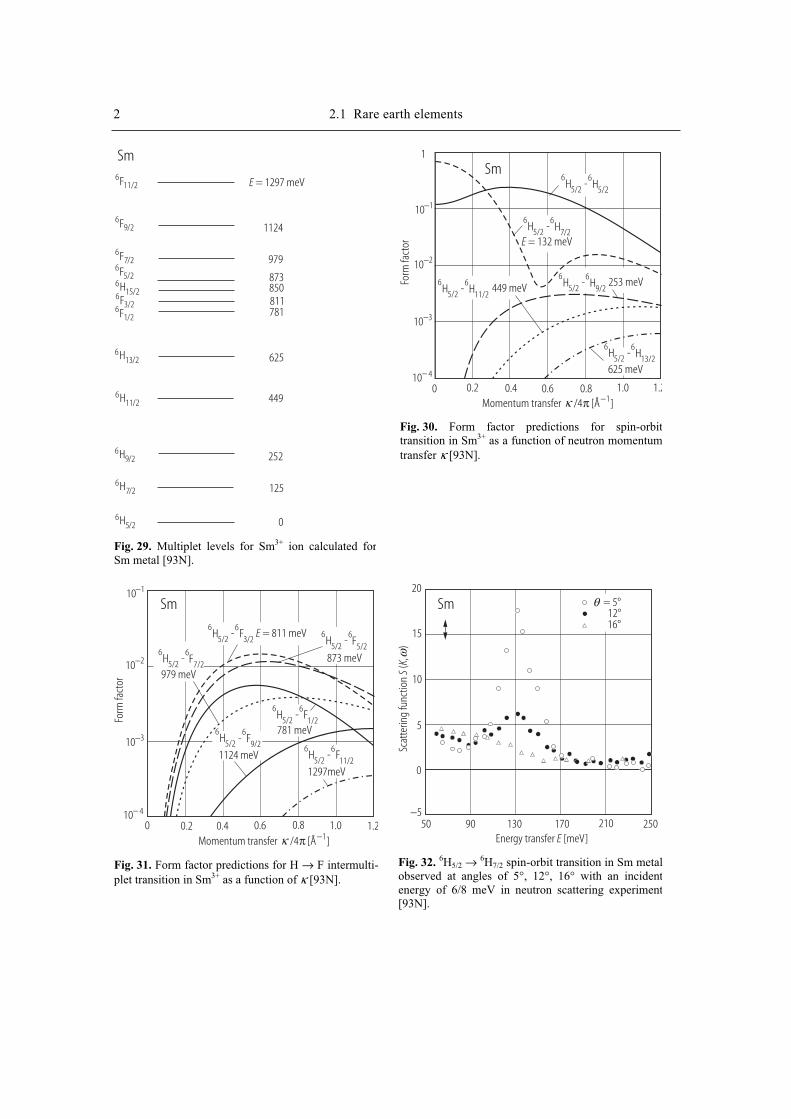
2 2.1 Rare earth elements
Sm6
11/2F
69/2F
63/2F
61/2F
67/2F
65/2F
615/2H
613/2H
611/2H
69/2H
67/2H
65/2H
E = 1297 meV
1124
979
873850811781
625
449
252
125
0
Fig. 29. Multiplet levels for Sm3+ ion calculated for
Sm metal [93N].
Sm
Momentum transfer /4 [Å ]π −1κFo
rm fa
ctor
1
10−1
10−2
10−3
10− 4
0 0.2 0.4 0.6 0.8 1.0 1.2
65/2H -
65/2H
65/2H -
67/2H
E = 132 meV
65/2H -
69/2H 253 meV6
5/2H -6
11/2H 449 meV
65/2H -
613/2H
625 meV
Fig. 30. Form factor predictions for spin-orbit
transition in Sm3+ as a function of neutron momentum
transfer κ [93N].
Sm
Momentum transfer /4 [Å ]π −1κ
Form
fact
or
10−1
10−2
10−3
10− 4
0 0.2 0.4 0.6 0.8 1.0 1.2
65/2H -
65/2F
65/2H -
67/2F
65/2H -
63/2
F E = 811 meV
65/2H -
611/2
F
873 meV
781 meV
65/2H -
61/2
F
979 meV
65/2H -
69/2F
1124 meV
1297meV
Fig. 31. Form factor predictions for H → F intermulti-
plet transition in Sm3+ as a function of κ [93N].
Energy transfer [meV]E
Sm
Scat
terin
g fu
nctio
n(
,)
SK
ω
20
15
10
5
0
−550 90 130 170 210 250
θ = 5°12°16°
Fig. 32. 6H5/2 → 6H7/2 spin-orbit transition in Sm metal
observed at angles of 5°, 12°, 16° with an incident
energy of 6/8 meV in neutron scattering experiment
[93N].

2.1 Rare earth elements 3
*
**
*
Sm
Inte
nsity
(rel
ativ
e)
Wavevector [Å ]Q −1
2500
2000
1500
1000
500
0
− 5000 5 10 15 20 25
Ei = 618 meV729.9 meV
theoretical predictions
Fig. 33. Plot of the experimental and theoretical form
factor for the 6H5/2 → 6H7/2 transition in Sm metal.
None of the other (see Fig. 30) spin-orbit transition
were observed [93N].
Temperature [K]THe
atca
paci
ty[J
mol
K]
C p−
−1
1
Sm20
16
12
8
4
0 8 16 24 32
Fig. 34. Specific heat Cp, of the two samarium samples
(SmIV-99.89 at%; SmV-99.98 at% purity) in the tem-
perature range: 0…32 K. The effect of increasing
impurity contents reduce the amplitudes of the
transition [89S].

References
87K1 Konovalov, S.V., Singer, V.V., Radovskij, I.Z., Geld, P.V.: Solid State Phys. 29 (1987) 1768
89S Stewart, A.M., Collocott, S.J.: J. Phys.: Condens. Matter 1 (1989) 677
93N Needham, L.M., Williams, W.G., Taylor, A.D.: J. Phys.: Condens. Matter 5 (1993) 2591
93S1 Söderlind, P., Eriksson, O., Wills, J.M., Johansson, B.: Phys. Rev. B 48 (1993) 9212
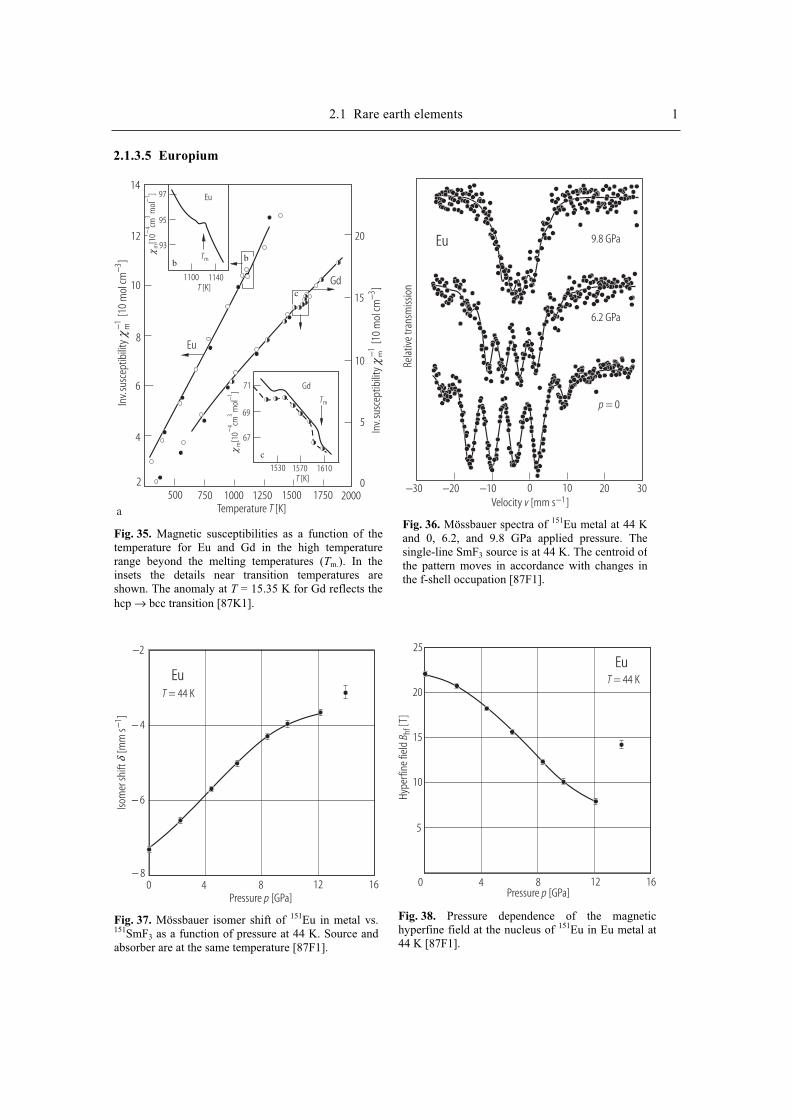
2.1 Rare earth elements 1
2.1.3.5 Europium
Temperature [K]T
T [K]
Inv.
susc
eptib
ility
[10
mol
cm]
m3−
χ−1
Inv.
susc
eptib
ility
[10
mol
cm]
m3−
χ−1
500 750 1000 1250 1500 1750 2000
Tmb b
c
[10
m4−
χcm
mol
]3
1−
[10
m4−
χcm
mol
]3
1−
a
T [K]
Tm
c
71
69
67
1530 1570 1610
Gd
Eu97
95
93
1100 1140
14
12
10
8
6
4
2
20
15
10
5
0
Gd
Eu
Fig. 35. Magnetic susceptibilities as a function of the
temperature for Eu and Gd in the high temperature
range beyond the melting temperatures (Tm.). In the
insets the details near transition temperatures are
shown. The anomaly at T = 15.35 K for Gd reflects the
hcp → bcc transition [87K1].
Velocity [mm s ]v −1
Eu 9.8 GPa
6.2 GPa
p = 0
−30 −20 −10 0 10 20 30
Rela
tive
trans
miss
ion
Fig. 36. Mössbauer spectra of 151Eu metal at 44 K
and 0, 6.2, and 9.8 GPa applied pressure. The
single-line SmF3 source is at 44 K. The centroid of
the pattern moves in accordance with changes in
the f-shell occupation [87F1].
Pressure [GPa]p
Isom
er sh
ift
[mm
s]
−1δ
Eu
−2
− 4
− 6
− 80 4 8 12 16
T = 44 K
Fig. 37. Mössbauer isomer shift of 151Eu in metal vs. 151SmF3 as a function of pressure at 44 K. Source and
absorber are at the same temperature [87F1].
Pressure [GPa]p
Eu
0 4 8 12 16
T = 44 K
Hype
rfine
fiel
d[T
]B hf
25
20
15
10
5
Fig. 38. Pressure dependence of the magnetic
hyperfine field at the nucleus of 151Eu in Eu metal at
44 K [87F1].
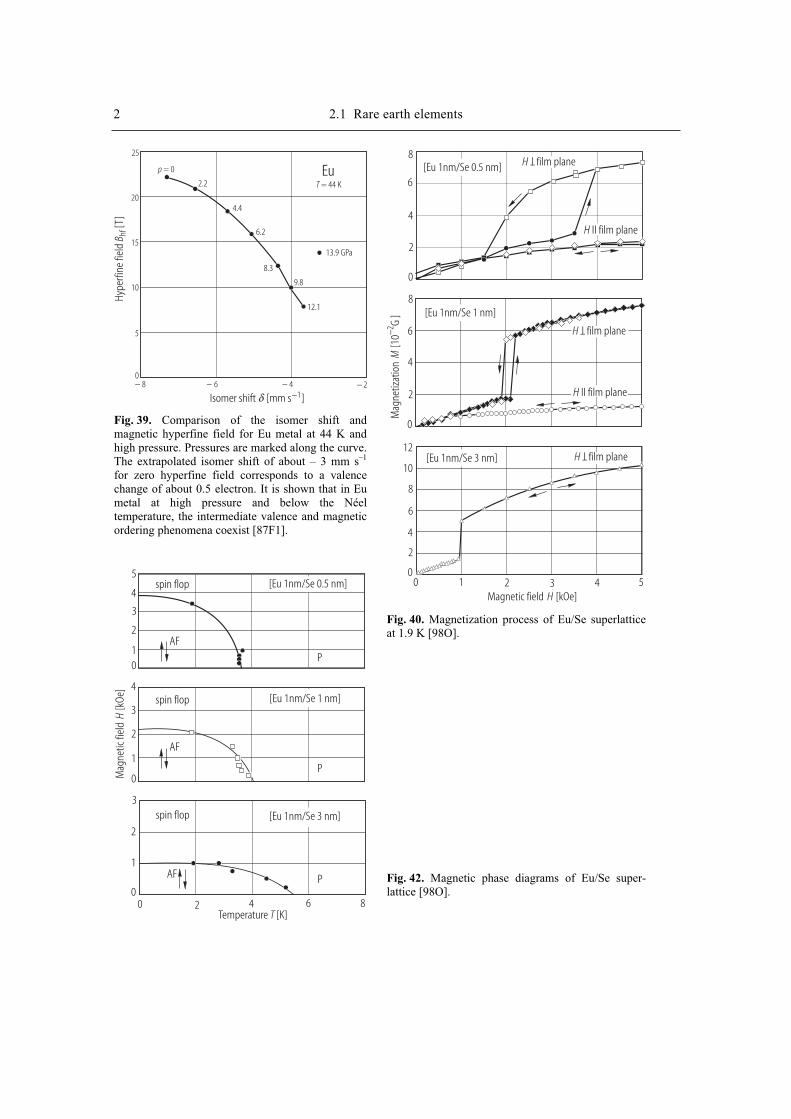
2 2.1 Rare earth elements
Eu
0
T = 44 K
Hype
rfine
fiel
d[T
]B hf
25
20
15
10
5
Isomer shift [mm s ]−1δ− 8 − 6 − 4 − 2
p = 0
2.2
4.4
6.2
8.3
9.8
12.1
13.9 GPa
Fig. 39. Comparison of the isomer shift and
magnetic hyperfine field for Eu metal at 44 K and
high pressure. Pressures are marked along the curve.
The extrapolated isomer shift of about – 3 mm s–1
for zero hyperfine field corresponds to a valence
change of about 0.5 electron. It is shown that in Eu
metal at high pressure and below the Néel
temperature, the intermediate valence and magnetic
ordering phenomena coexist [87F1].
Temperature [K]T
Mag
netic
fiel
d[k
Oe]
H
0 2 4 6 8
2
2
2
1
1
1
0
0
0
3
3
3
4
4
5
AF
AF
AF
P
P
P
spin flop
spin flop
spin flop
[Eu 1nm/Se 0.5 nm]
[Eu 1nm/Se 1 nm]
[Eu 1nm/Se 3 nm]
Mag
netiz
atio
n[1
0G
]M
−2
Magnetic field [kOe]H0 1 2 3 4 5
8
6
4
2
0
8
6
4
2
0
12
10
8
6
4
2
0
[Eu 1nm/Se 0.5 nm]
[Eu 1nm/Se 1 nm]
[Eu 1nm/Se 3 nm]
H film plane
T
H film plane
T
H film plane
T
H II film plane
H II film plane
Fig. 40. Magnetization process of Eu/Se superlattice
at 1.9 K [98O].
Fig. 42. Magnetic phase diagrams of Eu/Se super-
lattice [98O].
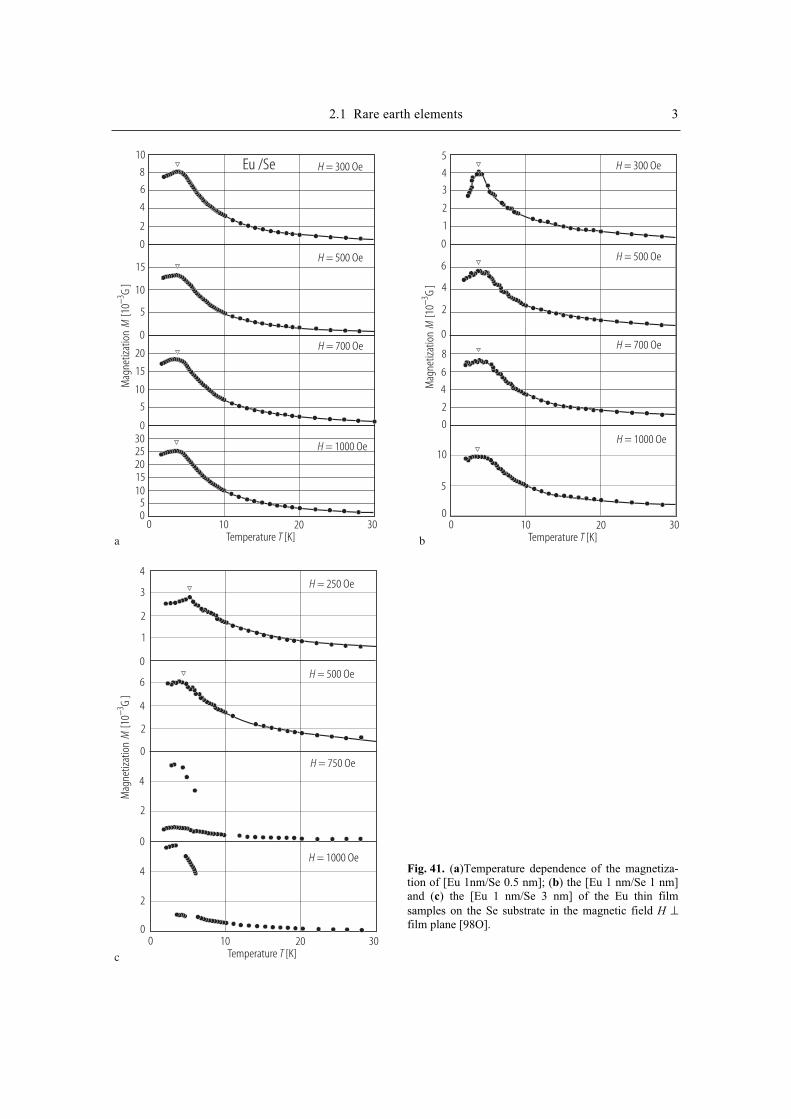
2.1 Rare earth elements 3 M
agne
tizat
ion
[10
G ]
M−3
Mag
netiz
atio
n[1
0G
]M
−3
Mag
netiz
atio
n[1
0G
]M
−3
Temperature [K]T
Temperature [K]T
Temperature [K]T
Eu /Se10
8
6
4
2
0
15
10
5
0
20
15
10
5
03025201510
50
0
0
010
10
1020
20
2030
30
30
H = 300 Oe
H = 250 Oe
H = 300 Oe
H = 500 Oe
H = 500 Oe
H = 500 Oe
H = 700 Oe
H = 750 Oe
H = 700 Oe
H = 1000 Oe
H = 1000 Oe
H = 1000 Oe
5
4
3
2
1
0
6
4
2
0
8
6
4
2
0
10
5
0
4
3
2
1
0
6
4
2
0
4
2
0
4
2
0
a b
c
Fig. 41. (a)Temperature dependence of the magnetiza-
tion of [Eu 1nm/Se 0.5 nm]; (b) the [Eu 1 nm/Se 1 nm]
and (c) the [Eu 1 nm/Se 3 nm] of the Eu thin film
samples on the Se substrate in the magnetic field H ⊥film plane [98O].

References
87F1 Farrell, J.N., Taylor, R.D.: Phys. Rev. Lett. 58 (1987) 2478
87K1 Konovalov, S.V., Singer, V.V., Radovskij, I.Z., Geld, P.V.: Solid State Phys. 29 (1987) 1768
98O Ono, T., Ishii, T., Tanuma, S., Yoshida, I.: Solid State Commun. 105 (1998) 93
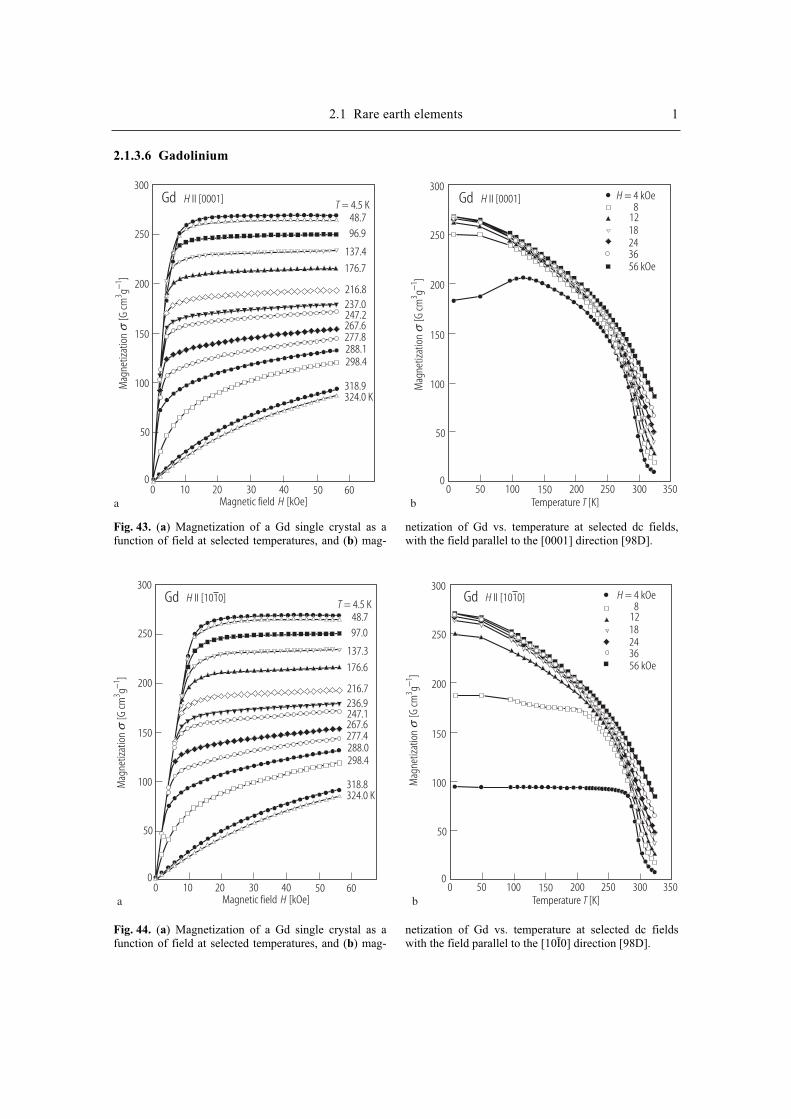
2.1 Rare earth elements 1
2.1.3.6 Gadolinium
Mag
netiz
atio
n
[G cm
g]
31−
σ
Mag
netiz
atio
n
[G cm
g]
31−
σ
Temperature [K]TMagnetic field [kOe]H
Gd H II [0001] H II [0001]Gd300 300
250 250
200 200
150 150
100 100
50 50
0 00 10 20 30 40 50 60
T = 4.5 K48.796.9
137.4
176.7
216.8237.0247.2267.6277.8288.1298.4
318.9324.0 K
0 50 100 150 200 250 300 350
H = 4 kOe8
1218243656 kOe
a b
Fig. 43. (a) Magnetization of a Gd single crystal as a function of field at selected temperatures, and (b) mag-
netization of Gd vs. temperature at selected dc fields, with the field parallel to the [0001] direction [98D].
Mag
netiz
atio
n
[G cm
g]
31−
σ
Mag
netiz
atio
n
[G cm
g]
31−
σ
Temperature [K]TMagnetic field [kOe]H
300 300
250 250
200 200
150 150
100 100
50 50
0 00 10 20 30 40 50 60
T = 4.5 K48.797.0
137.3
176.6
216.7236.9247.1267.6277.4288.0298.4
318.8324.0 K
0 50 100 150 200 250 300 350
H = 4 kOe8
1218243656 kOe
a b
Gd GdII [1010]H II [1010]H
Fig. 44. (a) Magnetization of a Gd single crystal as a function of field at selected temperatures, and (b) mag-
netization of Gd vs. temperature at selected dc fields with the field parallel to the [10 0] direction [98D].
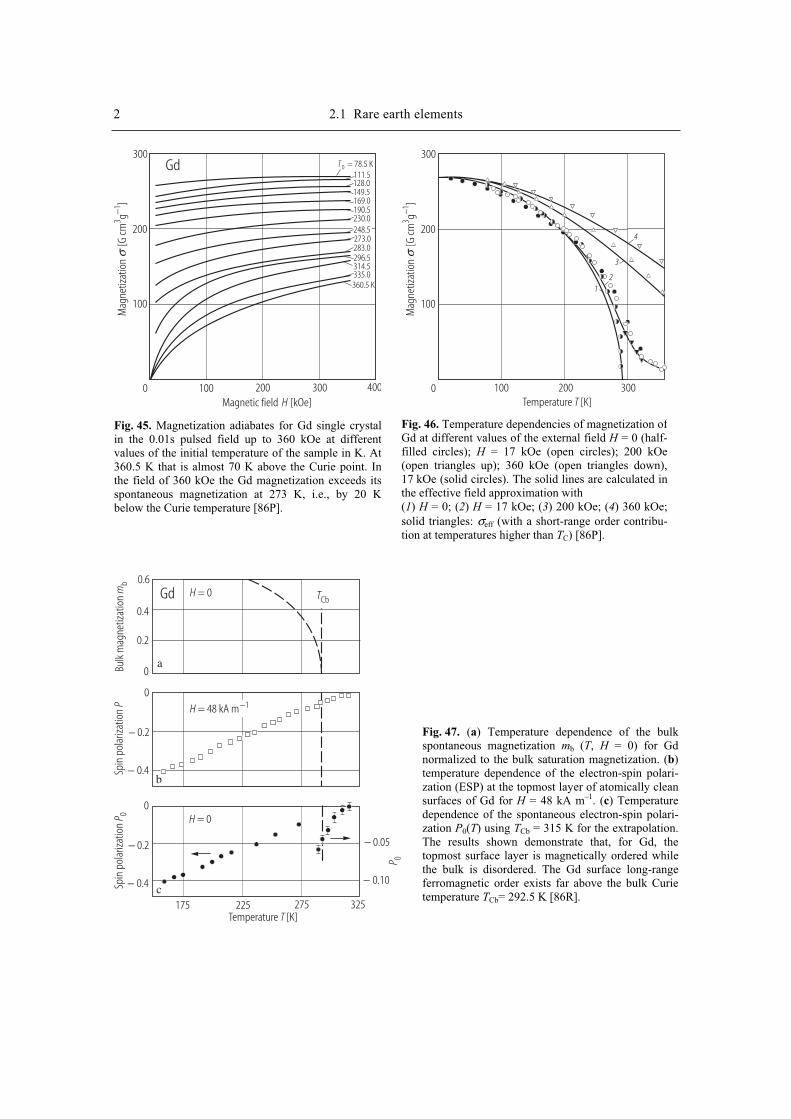
2 2.1 Rare earth elements M
agne
tizat
ion
[G
cmg
]3
1−σ
Magnetic field [kOe]H
300
200
100
T0 = 78.5 K111.5128.0149.5169.0190.5230.0
273.0283.0296.5314.5335.0360.5 K
Gd
0 100 200 300 400
248.5
Fig. 45. Magnetization adiabates for Gd single crystalin the 0.01s pulsed field up to 360 kOe at differentvalues of the initial temperature of the sample in K. At360.5 K that is almost 70 K above the Curie point. Inthe field of 360 kOe the Gd magnetization exceeds itsspontaneous magnetization at 273 K, i.e., by 20 Kbelow the Curie temperature [86P].
Mag
netiz
atio
n
[G cm
g]
31−
σ
300
200
100
0 100 200 300Temperature [K]T
12
3
4
Fig. 46. Temperature dependencies of magnetization ofGd at different values of the external field H = 0 (half-filled circles); H = 17 kOe (open circles); 200 kOe (open triangles up); 360 kOe (open triangles down), 17 kOe (solid circles). The solid lines are calculated in the effective field approximation with (1) H = 0; (2) H = 17 kOe; (3) 200 kOe; (4) 360 kOe; solid triangles: σeff (with a short-range order contribu-tion at temperatures higher than TC) [86P].
Temperature [K]T
Spin
pol
ariza
tion
P 0
P 0
Spin
pol
ariza
tion
PBu
lk m
agne
tizat
ion
mb
Gd
H = 0
H = 0
H = 48 kA m−1
TCb
0.6
0.4
0.2
0
0
0
− 0.2
− 0.2 − 0.05
− 0.4
− 0.4 − 0.10
175 225 275 325
a
b
c
Fig. 47. (a) Temperature dependence of the bulk spontaneous magnetization mb (T, H = 0) for Gd normalized to the bulk saturation magnetization. (b)temperature dependence of the electron-spin polari-zation (ESP) at the topmost layer of atomically clean surfaces of Gd for H = 48 kA m–1. (c) Temperature dependence of the spontaneous electron-spin polari-zation P0(T) using TCb = 315 K for the extrapolation. The results shown demonstrate that, for Gd, the topmost surface layer is magnetically ordered while the bulk is disordered. The Gd surface long-range ferromagnetic order exists far above the bulk Curie temperature TCb= 292.5 K [86R].
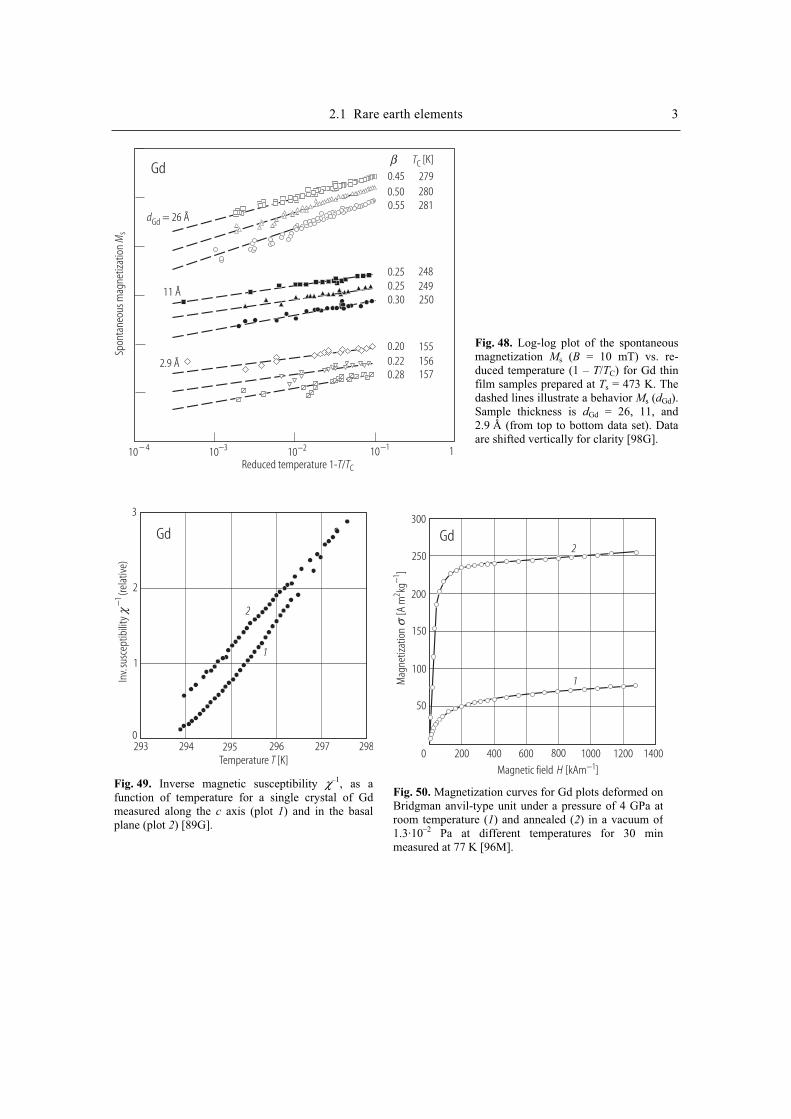
2.1 Rare earth elements 3
Reduced temperature 1- /T TC
Spon
tane
ous m
agne
tizat
ion
Ms
Gd
10 − 4 10−3 10−2 10−1 1
dGd = 26 Å
11 Å
2.9 Å
β TC [K]
0.450.500.55
0.250.250.30
0.200.220.28
279280281
248249250
155156157
Temperature [K]T
Inv.
susc
eptib
ility
χ−1
(rela
tive)
Gd
3
2
1
0293 294 295 296 297 298
2
1
Fig. 49. Inverse magnetic susceptibility χ–1, as a function of temperature for a single crystal of Gd measured along the c axis (plot 1) and in the basal plane (plot 2) [89G].
Gd2
1
Magnetic field [kAm ]H −1
Mag
netiz
atio
n
[A m
kg]
21−
σ
300
250
200
150
100
50
0 200 400 600 800 1000 1200 1400
Fig. 50. Magnetization curves for Gd plots deformed on Bridgman anvil-type unit under a pressure of 4 GPa atroom temperature (1) and annealed (2) in a vacuum of1.3·10–2 Pa at different temperatures for 30 min measured at 77 K [96M].
Fig. 48. Log-log plot of the spontaneous magnetization Ms (B = 10 mT) vs. re-duced temperature (1 – T/TC) for Gd thin film samples prepared at Ts = 473 K. The dashed lines illustrate a behavior Ms (dGd).Sample thickness is dGd = 26, 11, and 2.9 Å (from top to bottom data set). Data are shifted vertically for clarity [98G].
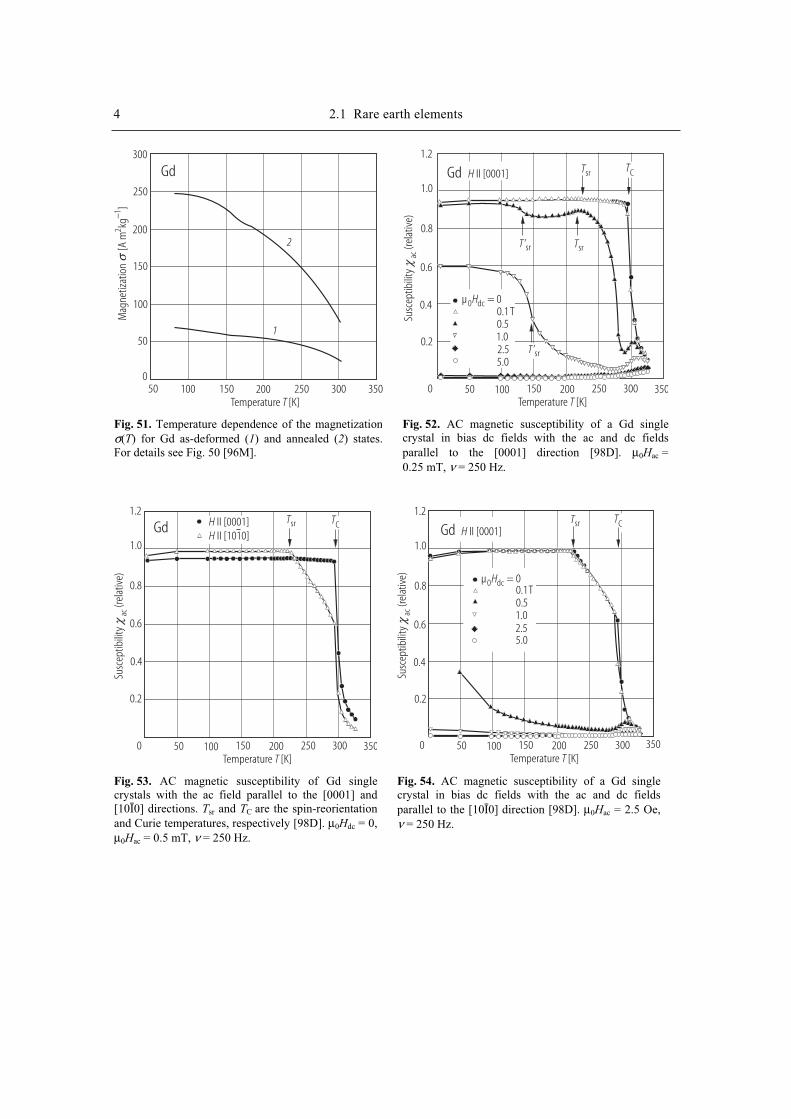
4 2.1 Rare earth elements
Gd
2
1
Mag
netiz
atio
n
[A m
kg]
21−
σ
300
250
200
150
100
50
0
Temperature [K]T50 100 150 200 250 300 350
Fig. 51. Temperature dependence of the magnetizationσ(T) for Gd as-deformed (1) and annealed (2) states. For details see Fig. 50 [96M].
Temperature [K]TSu
scep
tibili
ty(re
lativ
e)ac
χ
Gd II [0001]H
1.2
1.0
0.8
0.6
0.4
0.2
0 50 100 150 200 250 300 350
Tsr
T’sr Tsr
T’sr
TC
µ = 00 dcH0.1 T0.51.02.55.0
Fig. 52. AC magnetic susceptibility of a Gd single crystal in bias dc fields with the ac and dc fields parallel to the [0001] direction [98D]. µ0Hac = 0.25 mT, ν = 250 Hz.
Temperature [K]T
Susc
eptib
ility
(rela
tive)
acχ
Gd1.2
1.0
0.8
0.6
0.4
0.2
0 50 100 150 200 250 300 350
Tsr TCII [1010]HII [0001]H
Fig. 53. AC magnetic susceptibility of Gd single crystals with the ac field parallel to the [0001] and [10 0] directions. Tsr and TC are the spin-reorientation and Curie temperatures, respectively [98D]. µ0Hdc = 0, µ0Hac = 0.5 mT, ν = 250 Hz.
Temperature [K]T
Susc
eptib
ility
(rela
tive)
acχ
Gd II [0001]H
1.2
1.0
0.8
0.6
0.4
0.2
0 50 100 150 200 250 300 350
Tsr TC
µ = 00 dcH0.1T0.51.02.55.0
Fig. 54. AC magnetic susceptibility of a Gd single crystal in bias dc fields with the ac and dc fields parallel to the [10 0] direction [98D]. µ0Hac = 2.5 Oe, ν = 250 Hz.
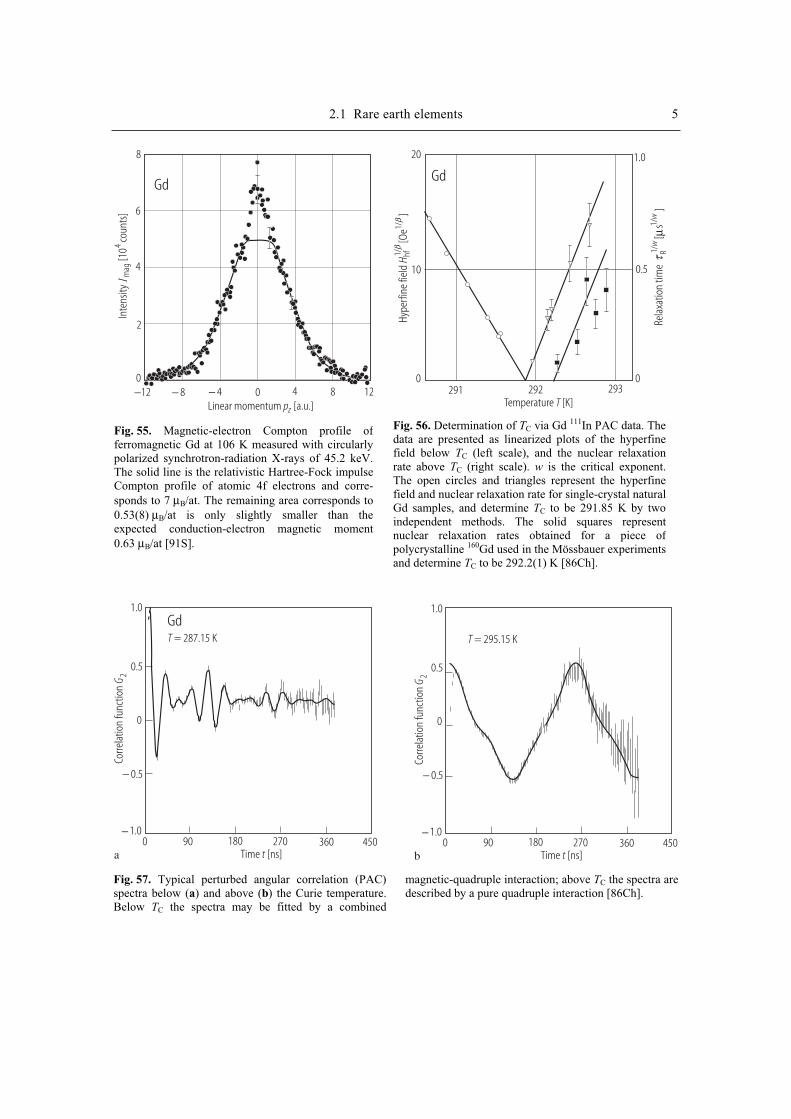
2.1 Rare earth elements 5
8
6
4
2
0−12 − 8 − 4 0 4 8 12
IIn
tens
itym
ag[1
0co
unts
]4
Linear momentum [a.u.]pz
Gd
Fig. 55. Magnetic-electron Compton profile offerromagnetic Gd at 106 K measured with circularly polarized synchrotron-radiation X-rays of 45.2 keV. The solid line is the relativistic Hartree-Fock impulse Compton profile of atomic 4f electrons and corre-sponds to 7 µB/at. The remaining area corresponds to 0.53(8) µB/at is only slightly smaller than the expected conduction-electron magnetic moment 0.63 µB/at [91S].
Temperature [K]T
Rela
xatio
n tim
e[
s]
R1/1/
ww
µτ
Hype
rfine
fiel
d[O
e]
H hf1/
1/β
β
Gd
20
10
0
1.0
0.5
0291 292 293
Fig. 56. Determination of TC via Gd 111In PAC data. The data are presented as linearized plots of the hyperfine field below TC (left scale), and the nuclear relaxation rate above TC (right scale). w is the critical exponent. The open circles and triangles represent the hyperfine field and nuclear relaxation rate for single-crystal natural Gd samples, and determine TC to be 291.85 K by two independent methods. The solid squares representnuclear relaxation rates obtained for a piece ofpolycrystalline 160Gd used in the Mössbauer experiments and determine TC to be 292.2(1) K [86Ch].
Corre
latio
n fu
nctio
nG 2
Corre
latio
n fu
nctio
nG 2
Time [ns]t Time [ns]t
GdT = 287.15 K T = 295.15 K
1.0 1.0
0.5 0.5
0 0
− 0.5 − 0.5
− 1.0 − 1.00 090 90180 180270 270360 360450 450
a b
Fig. 57. Typical perturbed angular correlation (PAC) spectra below (a) and above (b) the Curie temperature. Below TC the spectra may be fitted by a combined
magnetic-quadruple interaction; above TC the spectra are described by a pure quadruple interaction [86Ch].
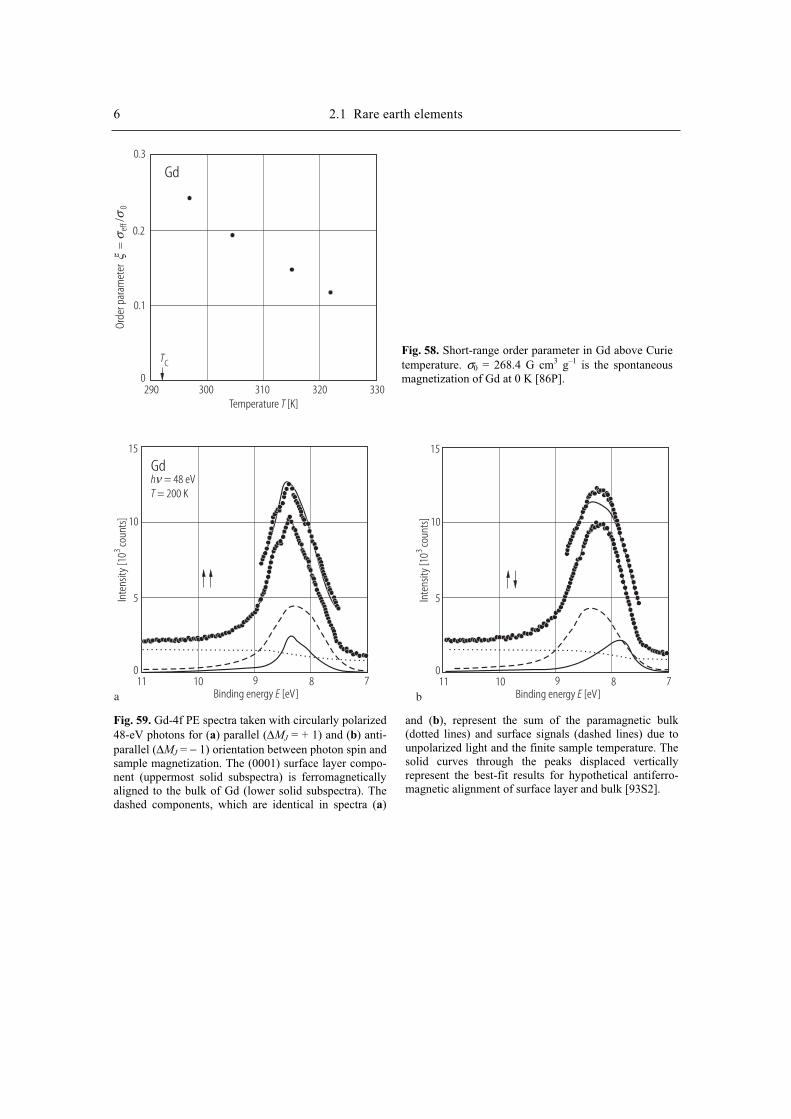
6 2.1 Rare earth elements
Temperature [K]T
Orde
r par
amet
er
=/
eff
0σ
σξ
Gd0.3
0.2
0.1
0
TC
300 310 320290 330
Inte
nsity
[10
coun
ts]
3
Inte
nsity
[10
coun
ts]
3
Binding energy [eV]E Binding energy [eV]E
Gd15 15
10 10
5 5
0 011 1110 109 98 87 7
h = 48 eVT = 200 Kν
a b
Fig. 59. Gd-4f PE spectra taken with circularly polarized 48-eV photons for (a) parallel (∆MJ = + 1) and (b) anti-parallel (∆MJ = − 1) orientation between photon spin and sample magnetization. The (0001) surface layer compo-nent (uppermost solid subspectra) is ferromagnetically aligned to the bulk of Gd (lower solid subspectra). The dashed components, which are identical in spectra (a)
and (b), represent the sum of the paramagnetic bulk (dotted lines) and surface signals (dashed lines) due to unpolarized light and the finite sample temperature. The solid curves through the peaks displaced vertically represent the best-fit results for hypothetical antiferro-magnetic alignment of surface layer and bulk [93S2].
Fig. 58. Short-range order parameter in Gd above Curie temperature. σ0 = 268.4 G cm3 g–1 is the spontaneous magnetization of Gd at 0 K [86P].
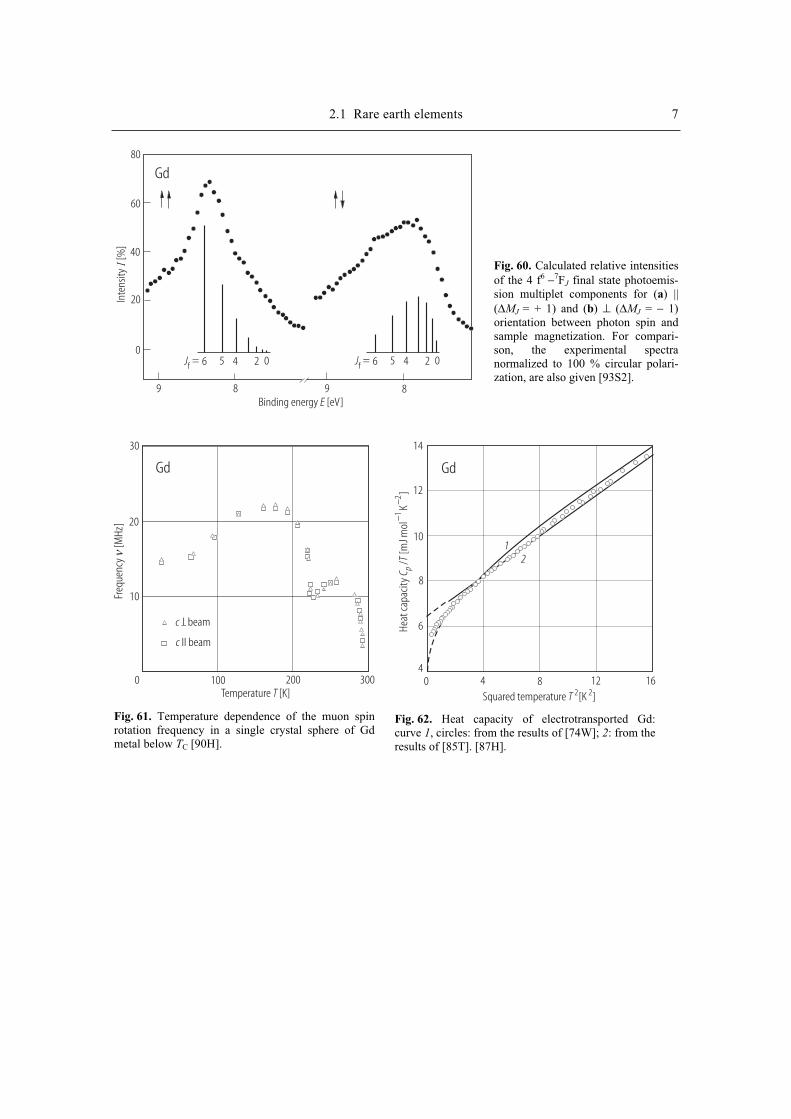
2.1 Rare earth elements 7 I
Inte
nsity
[%
]
Binding energy [eV]E
Gd80
60
40
20
0
9 8 9 8
Jf Jf= =6 65 54 42 20 0
Gd
Temperature [K]T
Freq
uenc
y
[MHz
]ν
30
20
10
0 100 200 300
c beam
T
c II beam
Fig. 61. Temperature dependence of the muon spinrotation frequency in a single crystal sphere of Gdmetal below TC [90H].
Heat
capa
city
/[m
Jmol
K]
CT
p−
−1
2
Squared temperature [K ]T 2 2
Gd
12
14
12
10
8
6
40 4 8 12 16
Fig. 62. Heat capacity of electrotransported Gd: curve 1, circles: from the results of [74W]; 2: from the results of [85T]. [87H].
Fig. 60. Calculated relative intensities of the 4 f6 −7FJ final state photoemis-sion multiplet components for (a) || (∆MJ = + 1) and (b) ⊥ (∆MJ = − 1) orientation between photon spin and sample magnetization. For compari-son, the experimental spectra normalized to 100 % circular polari-zation, are also given [93S2].
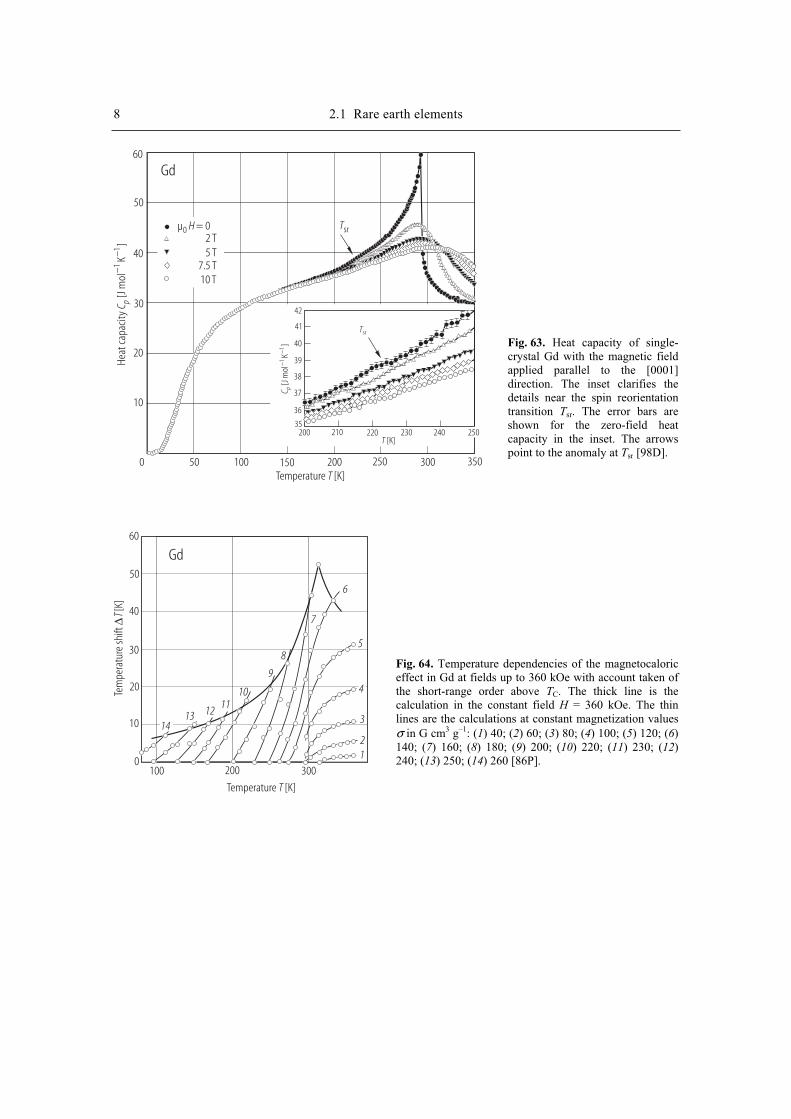
8 2.1 Rare earth elements
Temperature [K]T
Heat
capa
city
[Jm
olK
]C p
−−
11
[Jm
olK
]C p
−−
11
Gd60
50
40
30
20
10
0 50 100 150 200 250 300 350
Tsrµ = 00 H2 T5 T
7.5 T10 T
Tsr
42
41
40
39
38
37
36
35200 210 220 230 240
T [K]250
Temperature [K]T
Tem
pera
ture
shift
[K]
∆T
Gd60
50
40
30
20
10
0100 200 300
12
3
5
6
7
8
9
1011
121314
4
Fig. 63. Heat capacity of single-crystal Gd with the magnetic field applied parallel to the [0001] direction. The inset clarifies the details near the spin reorientation transition Tsr. The error bars are shown for the zero-field heat capacity in the inset. The arrows point to the anomaly at Tsr [98D].
Fig. 64. Temperature dependencies of the magnetocaloric effect in Gd at fields up to 360 kOe with account taken of the short-range order above TC. The thick line is the calculation in the constant field H = 360 kOe. The thin lines are the calculations at constant magnetization values σ in G cm3 g–1: (1) 40; (2) 60; (3) 80; (4) 100; (5) 120; (6)140; (7) 160; (8) 180; (9) 200; (10) 220; (11) 230; (12)240; (13) 250; (14) 260 [86P].
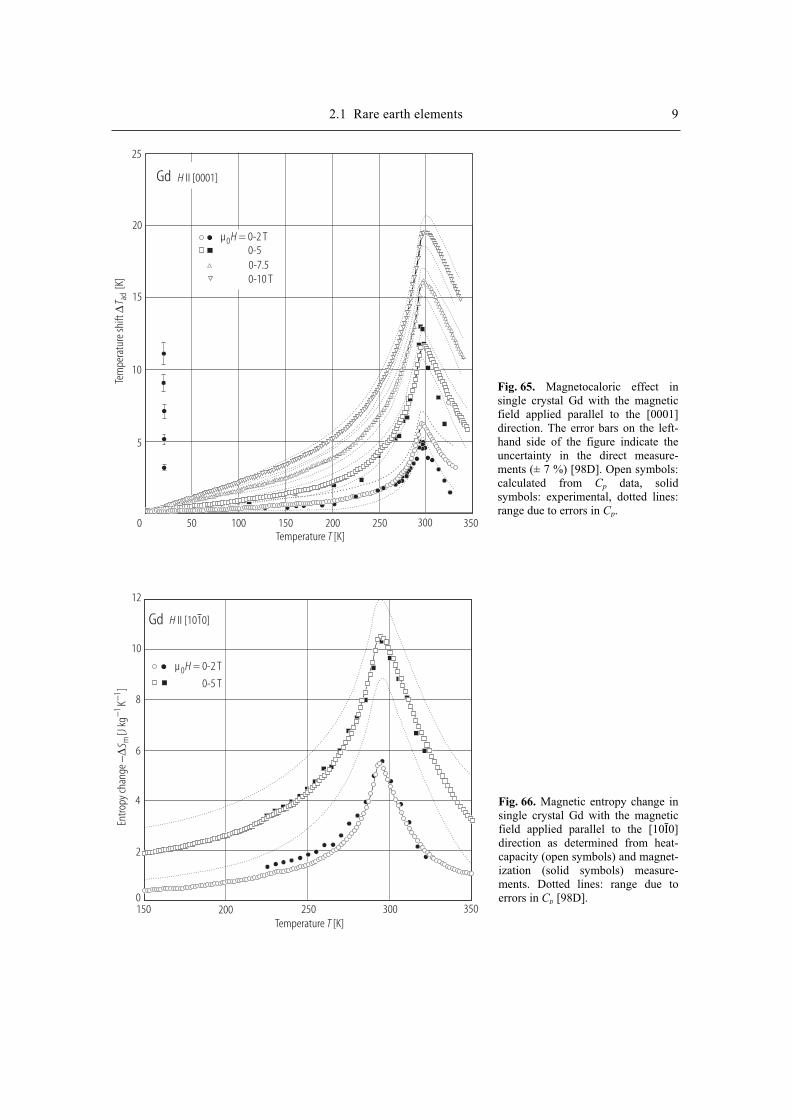
2.1 Rare earth elements 9
Temperature [K]T
Gd II [0001]H
50 100 150 200 250 300 350
µ = 0-2 T0H0-50-7.50-10 T
Tem
pera
ture
shift
[K]
∆T ad
20
15
10
5
25
0
Temperature [K]T
Gd
150 200 250 300 350
µ = 0-2 T0H
0-5 T
4
2
0
6
8
10
12
H II [1010]
Entro
py ch
ange
[J kg
K]
−∆S m
11
−−
Fig. 65. Magnetocaloric effect in single crystal Gd with the magnetic field applied parallel to the [0001] direction. The error bars on the left-hand side of the figure indicate the uncertainty in the direct measure-ments (± 7 %) [98D]. Open symbols: calculated from Cp data, solid symbols: experimental, dotted lines: range due to errors in Cp.
Fig. 66. Magnetic entropy change in single crystal Gd with the magnetic field applied parallel to the [10 0]direction as determined from heat-capacity (open symbols) and magnet-ization (solid symbols) measure-ments. Dotted lines: range due to errors in Cp [98D].
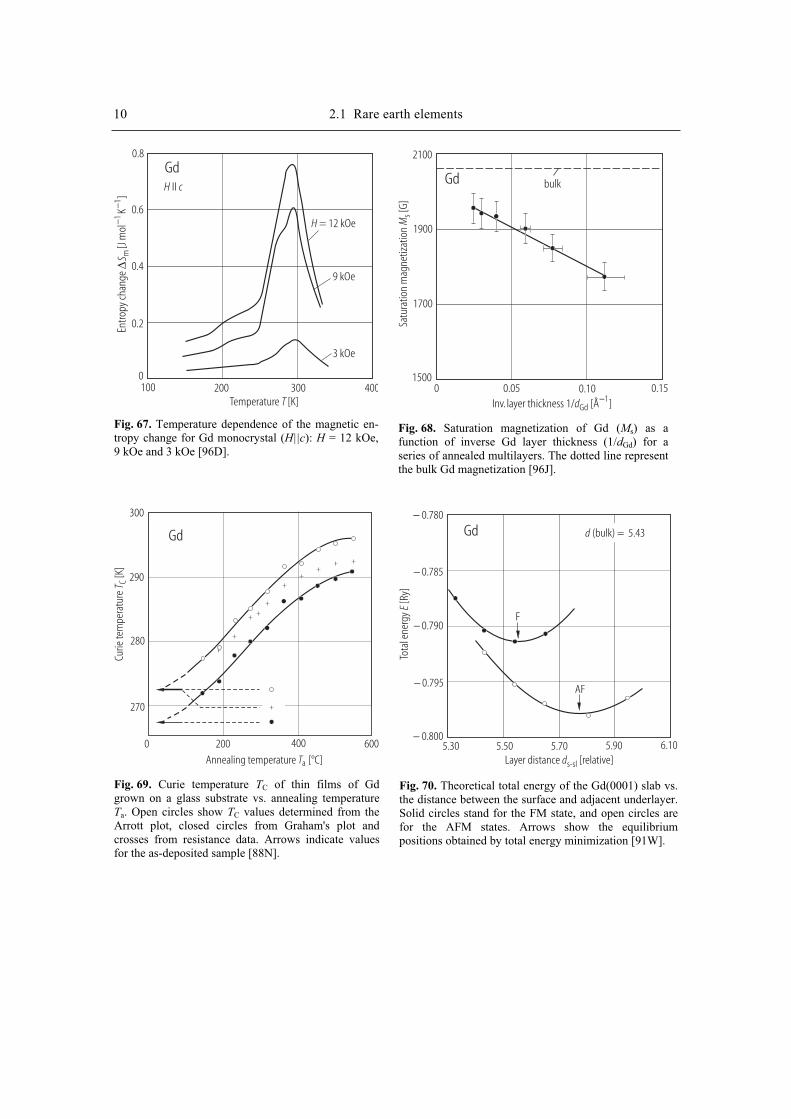
10 2.1 Rare earth elements
Temperature [K]T
Entro
py ch
ange
[J m
olK
]∆
S m1
1−
−
GdH cII
0.8
0.6
0.4
0.2
0100 200 300 400
H = 12 kOe
9 kOe
3 kOe
Fig. 67. Temperature dependence of the magnetic en-tropy change for Gd monocrystal (H||c): H = 12 kOe, 9 kOe and 3 kOe [96D].
Satu
ratio
n m
agne
tizat
ion
[G]
Ms
Inv. layer thickness 1/ [Å ]dGd1−
Gd
2100
1900
1700
15000 0.05 0.10 0.15
bulk
Fig. 68. Saturation magnetization of Gd (Ms) as a function of inverse Gd layer thickness (1/dGd) for a series of annealed multilayers. The dotted line representthe bulk Gd magnetization [96J].
Annealing temperature [°C]Ta
Curie
tem
pera
ture
[K]
T C
Gd
300
290
280
270
0 200 400 600
Fig. 69. Curie temperature TC of thin films of Gdgrown on a glass substrate vs. annealing temperatureTa. Open circles show TC values determined from the Arrott plot, closed circles from Graham's plot andcrosses from resistance data. Arrows indicate valuesfor the as-deposited sample [88N].
Tota
l ene
rgy
[Ry]
E
Layer distance [relative]ds-sl
Gd− 0.780
− 0.785
− 0.790
− 0.795
− 0.8005.30 5.50 5.70 5.90 6.10
d (bulk) = 5.43
F
AF
Fig. 70. Theoretical total energy of the Gd(0001) slab vs. the distance between the surface and adjacent underlayer. Solid circles stand for the FM state, and open circles are for the AFM states. Arrows show the equilibriumpositions obtained by total energy minimization [91W].
2.1 Rare earth elements 11
GdF AF
S
S - 1
S - 1
C
C
S
Fig. 71. Schematic ferromagnetic and antiferro-magnetic configurations for a six-layer Gd(0001) slab [91W1].
Gd
dII d T
a
b
Fig. 72. Possible domain configurations for both in-plane and perpendicular surface magnetism ofGd(001) films. Panel (a) shows a magnetic state with canted spins on the surface, and panel (b)shows a combination of perpendicular and in-plane domains [93T1].
Temperature [K]T
Mag
netic
susc
eptib
ility
χ
Gd
in - plane
out - of - plane
200 250 300
Fig. 73. Comparison between the temperature dependence in-plane and out-of-plane suscept-ibility for a 130 nm thick Gd film [95B1].
12 2.1 Rare earth elements
Temperature [K]T
Temperature [K]T
Mag
netiz
atio
nM
Mag
netiz
atio
nM
Gd/Y
dGd = 1000 Å
dGd = 50 Å
dGd = 35 Å
dGd = 5 Å
250 275 300
100 150 200
µ = 0.01 T0H
Fig. 74. Magnetization M for Gd/Y films measured in a small field of µ0H = 0.01 T as a function oftemperature. The Curie temperature is determinedby extrapolating the M(0.01 T) vs. temperaturecurve to M = 0 [95G].
Fig. 76. Hysteresis loops, i.e. magnetization M vs. applied magnetic field µ0H, obtained by themagneto-optical Kerr effect (MOKE) measure-ments on Gd films (Ts = 473 K) with dGd = 1.5, 2.3, and 2.9 Å at T = 5 K…7 K [98G].
Mag
netiz
atio
nM
Tem
pera
ture
supp
ress
ion
[K]
∆T C
Film thickness [Å]dGd
6 10⋅ 2
102
10
11 10 102
Gd/Y
110 130 150 170T [K]
dGd = 2.9 Å
∝d −1
∝d −1.6
2 24 46 68 8
4
8
8
6
6
4
4
2
2
Fig. 75. Suppression ∆TC of the Curie temperature as a function of Gd/Y film thickness dGd. Solidcircles: experimental data (Ts = 473 K); dashedline: generalized mean-field theory for Heisenberg ferromagnets. Solid lines illustrate dGd
–1.6 and dGd–1
dependence. The inset shows the determination ofTC by extrapolating the magnetization M(T)measured in a small external field µ0H = 10 mT to M(TC) = 0 for dGd = 2.9 Å (dashed line). For this sample the extrapolation is nearly identical to a power-law fit with = 0.23 [98G].
Mag
netiz
atio
nM
Magnetic field [mT]µ0 H
Gd
0 20 40 60− 60 − 40 −20
dGd = 1.5 Å
dGd = 2.3 Å
dGd = 2.9 Å
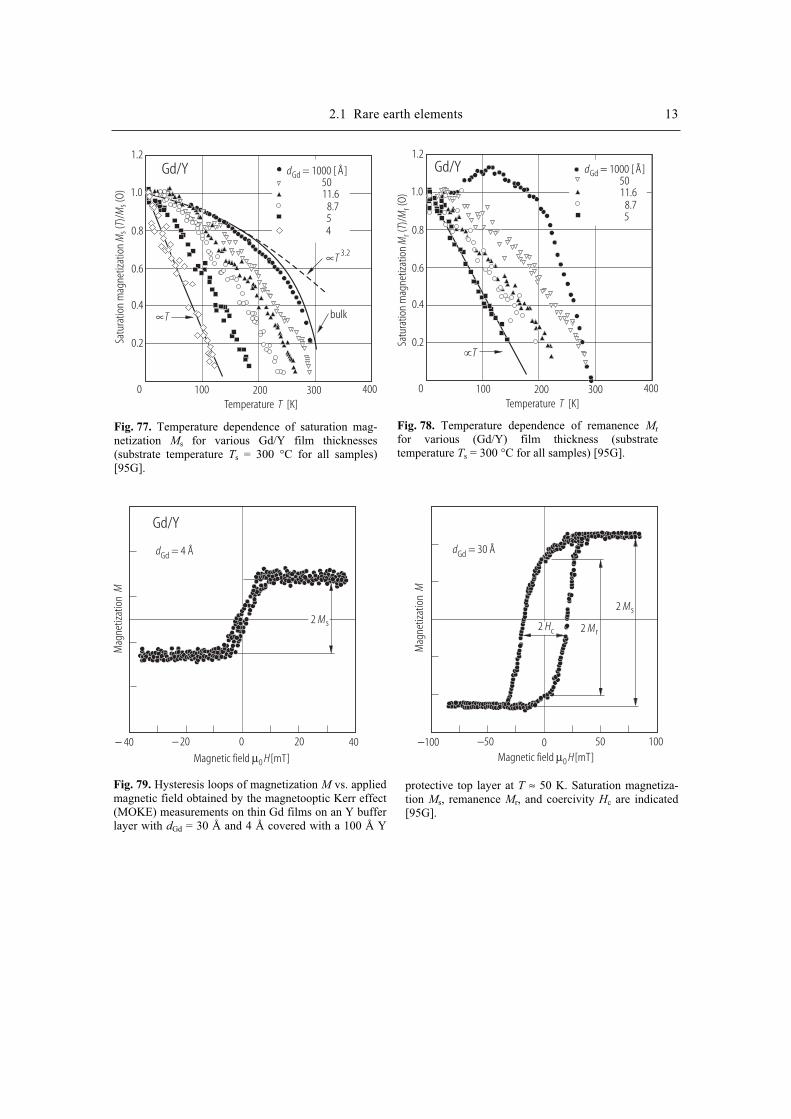
2.1 Rare earth elements 13
Gd/Y
Temperature [K]T
∝T
∝T 3.2
bulk
1.0
1.2
0.8
0.6
0.4
0.2
0 100 200 300 400
Satu
ratio
n m
agne
tizat
ion
()/
(O)
MT
Ms
s
dGd = 1000 [ Å]5011.6
8.754
Fig. 77. Temperature dependence of saturation mag-netization Ms for various Gd/Y film thicknesses (substrate temperature Ts = 300 °C for all samples) [95G].
Gd/Y
Temperature [K]T
T
1.0
1.2
0.8
0.6
0.4
0.2
0 100 200 300 400Sa
tura
tion
mag
netiz
atio
n(
)/(O
)M
TM
rr
dGd = 1000 [ Å]5011.6
8.75
Fig. 78. Temperature dependence of remanence Mr
for various (Gd/Y) film thickness (substrate temperature Ts = 300 °C for all samples) [95G].
Magnetic field [mT]µ0 H Magnetic field [mT]µ0 H
Mag
netiz
atio
nM
Mag
netiz
atio
nM
Gd/Y
− 40 − 20 0 20 40
dGd = 4 Å dGd = 30 Å
2 Ms
2 Ms
2 Mr2 Hc
−100 −50 0 50 100
Fig. 79. Hysteresis loops of magnetization M vs. applied magnetic field obtained by the magnetooptic Kerr effect (MOKE) measurements on thin Gd films on an Y buffer layer with dGd = 30 Å and 4 Å covered with a 100 Å Y
protective top layer at T ≈ 50 K. Saturation magnetiza-tion Ms, remanence Mr, and coercivity Hc are indicated [95G].

14 2.1 Rare earth elements M
agne
tizat
ion
[G
cmg
]3
1−σ
Mag
netiz
atio
n
[G cm
g]
31−
σTemperature [K]T Temperature [K]T
[Gd /Y ]10 10 225
300 300
200 200
100 100
0 00 0100 100200 200300 300
1 1
2
2
3
3
4
4
1 1
2 2
3 3
4 4
H = 10.6 kOe H = 12.8 kOe2.61.40.2
N = 4, N = 10Gd Y432
a b
Fig. 81. (a) Temperature dependence of the magnetic moment ot the (10Gd/10Y)225 superlattice in a series of applied fields. (b) The temperature dependence of the
magnetic moment of the (4/2), (4/3), (4/4), and (4/10) superlattices in an applied field of 12.8 kOe [87K].
Mag
netiz
atio
n
[G cm
g]
31−
σ
Magnetic field [kOe]H
300
200
100
0 4 8 12 16
T = 12 K
σ
σ
(0)
r
[Gd /Y ]10 24 76
[Gd /Y ]10 10 225
Fig. 80. The in-plane magnetization curves at 12 K for the synthetic superlattices consisting (10Gd/24Y)76 and(10Gd/10Y)225 [87K].
Temperature [K]T
Coer
cive
field
µ[m
T]0
cH
Gd/Y40
30
20
10
0 100 200 300
dGd = 70Å
Ts = 100°C
300 °C
500 °C
Fig. 82. Coercive field Hc(T) for Gd/Y films preparedwith different substrate temperatures Ts and a constantfilm thickness dGd = 70 Å [95G].

2.1 Rare earth elements 15 M
agne
tizat
ion
/ (
0)rσ
σ
Number of layers NY
Layer thickness [Å]dY
Mag
netic
fiel
d[k
Oe]
H sJ
rGd
-Y(
) [m
eV]
0 10 20 305 15 25
0
0.10
0
− 0.10
− 0.20
5
10
0
0.5
1.0
0 20 40 60 80
NGd = 4 NGd = 10 ±1
a
b
c
Fig. 83. The oscillatory dependence of (a) remanent magnetization σr/σ(0) and (b) saturation field Hs, on NY (number of Yttrium atomic layers) in two series ofsuperlattices (Gd - Y) with NGd = 4, and NGd = 10 ± 1.The dashed lines are guide to the eyes. (c) The calculated functional dependence of JGd-Y on NY
[87K].
Temperature [K]T
Rem
anen
t mag
netiz
atio
n(re
lativ
e)M
r
Gd/Nb1.25
1.00
1.00
1.00
0.75
0.75
0.75
0.50
0.50
0.50
0.25
0.25
0.25
0
0
00 100 200 300
dGd = 24Å
dGd = 50Å
dGd = 1000Å
18
45
500
15
35
300
29
200
24
150100
,
Fig. 84. Temperature dependence of the in-planeremanent magnetization Mr of Gd/Nb films with thickness between 15 and 1000 Å. The curves are normalized to the same value at T = 0 K [93P].
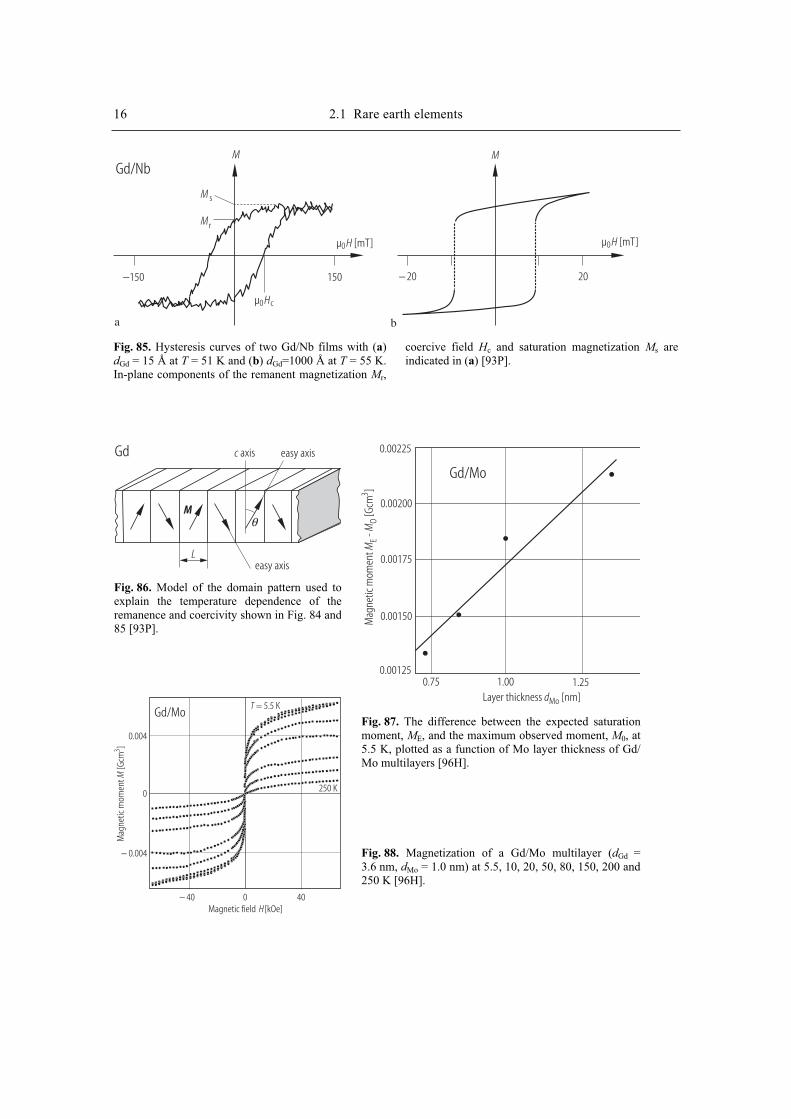
16 2.1 Rare earth elements
Gd/Nb
−150 150 −20 20
M M
M s
Mr
µ0 cH
µ [mT]0Hµ [mT]0H
a b
Fig. 85. Hysteresis curves of two Gd/Nb films with (a)dGd = 15 Å at T = 51 K and (b) dGd=1000 Å at T = 55 K. In-plane components of the remanent magnetization Mr,
coercive field Hc and saturation magnetization Ms are indicated in (a) [93P].
Gd
M
Leasy axis
easy axis
θ
c axis
Fig. 86. Model of the domain pattern used toexplain the temperature dependence of theremanence and coercivity shown in Fig. 84 and85 [93P].
Magnetic field [kOe]H
Mag
netic
mom
ent
[Gcm
]M
3
T = 5.5 K
250 K
− 40 0 40
0.004
0
− 0.004
Gd/Mo
Mag
netic
mom
ent
-[G
cm]
MM
EO
3
Layer thickness [nm]dMo
Gd/Mo
0.00200
0.00175
0.00150
0.75 1.00 1.250.00125
0.00225
Fig. 87. The difference between the expected saturation moment, ME, and the maximum observed moment, M0, at 5.5 K, plotted as a function of Mo layer thickness of Gd/ Mo multilayers [96H].
Fig. 88. Magnetization of a Gd/Mo multilayer (dGd =3.6 nm, dMo = 1.0 nm) at 5.5, 10, 20, 50, 80, 150, 200 and 250 K [96H].
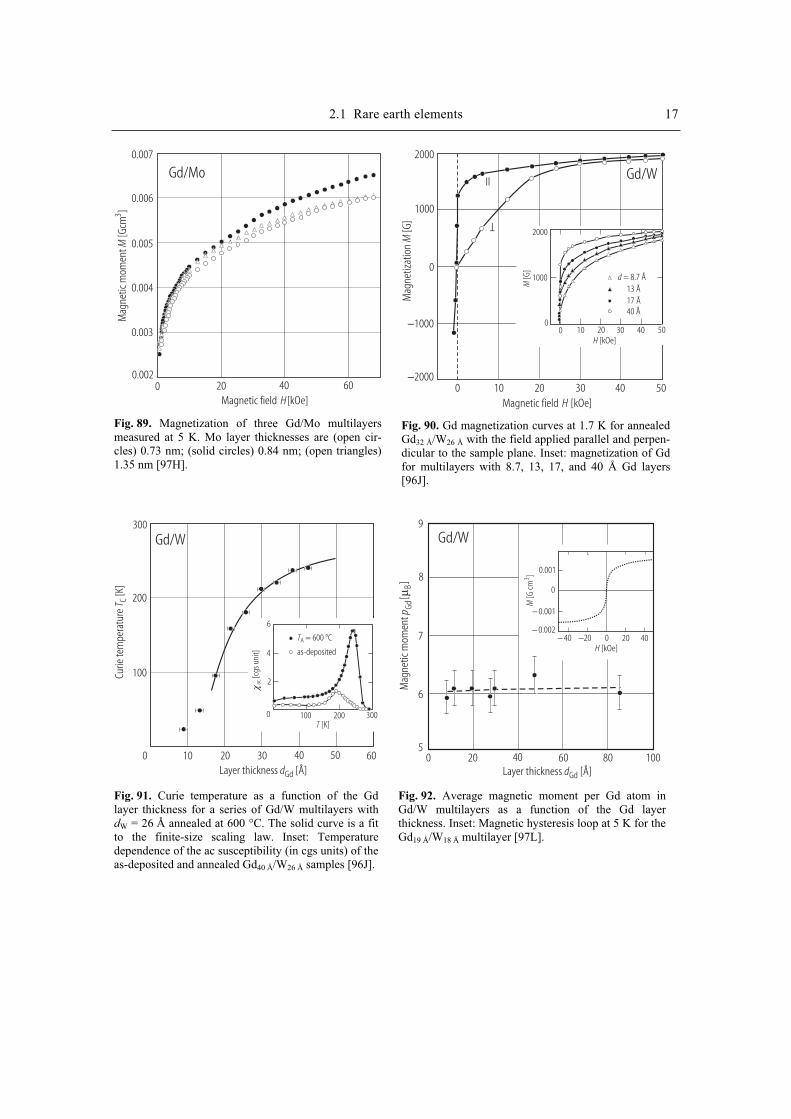
2.1 Rare earth elements 17
Magnetic field [kOe]H
Mag
netic
mom
ent
[Gcm
]M
3
Gd/Mo0.007
0.006
0.005
0.004
0.003
0.0020 20 40 60
Fig. 89. Magnetization of three Gd/Mo multilayersmeasured at 5 K. Mo layer thicknesses are ( pen cir-cles) 0.73 nm; (solid circles) 0.84 nm; (open triangles)1.35 nm [97H].
Magnetic field [kOe]HM
agne
tizat
ion
[G]
M
[G]
M
Gd/W2000
1000
0
−1000
−20000 20 4010 30 50
II
T
2000
1000
00 10 20 30 40 50
H [kOe]
d = 8.7 Å13 Å1740 Å
Å
Fig. 90. Gd magnetization curves at 1.7 K for annealedGd32 Å/W26 Å with the field applied parallel and perpen-dicular to the sample plane. Inset: magnetization of Gd for multilayers with 8.7, 13, 17, and 40 Å Gd layers [96J].
Curie
tem
pera
ture
[K]
T C
Layer thickness [Å]dGd
Gd/W300
200
100
0 10 20 30 40 50 60
6
4
2
0 100 200 300T [K]
ac[c
gs u
nit]
χ
TA = 600 °C
as-deposited
Fig. 91. Curie temperature as a function of the Gd layer thickness for a series of Gd/W multilayers with dW = 26 Å annealed at 600 °C. The solid curve is a fit to the finite-size scaling law. Inset: Temperature dependence of the ac susceptibility (in cgs units) of the as-deposited and annealed Gd40 Å/W26 Å samples [96J].
Layer thickness [Å]dGd
Gd/W
Mag
netic
mom
ent
[]
p GdBµ
5
6
7
8
9
0 20 40 60 80 100
0.001
0
− 0.001
− 0.002− 40 −20 0 20 40
H [kOe]
M[G
cm]3
Fig. 92. Average magnetic moment per Gd atom in Gd/W multilayers as a function of the Gd layerthickness. Inset: Magnetic hysteresis loop at 5 K for the Gd19 Å/W18 Å multilayer [97L].
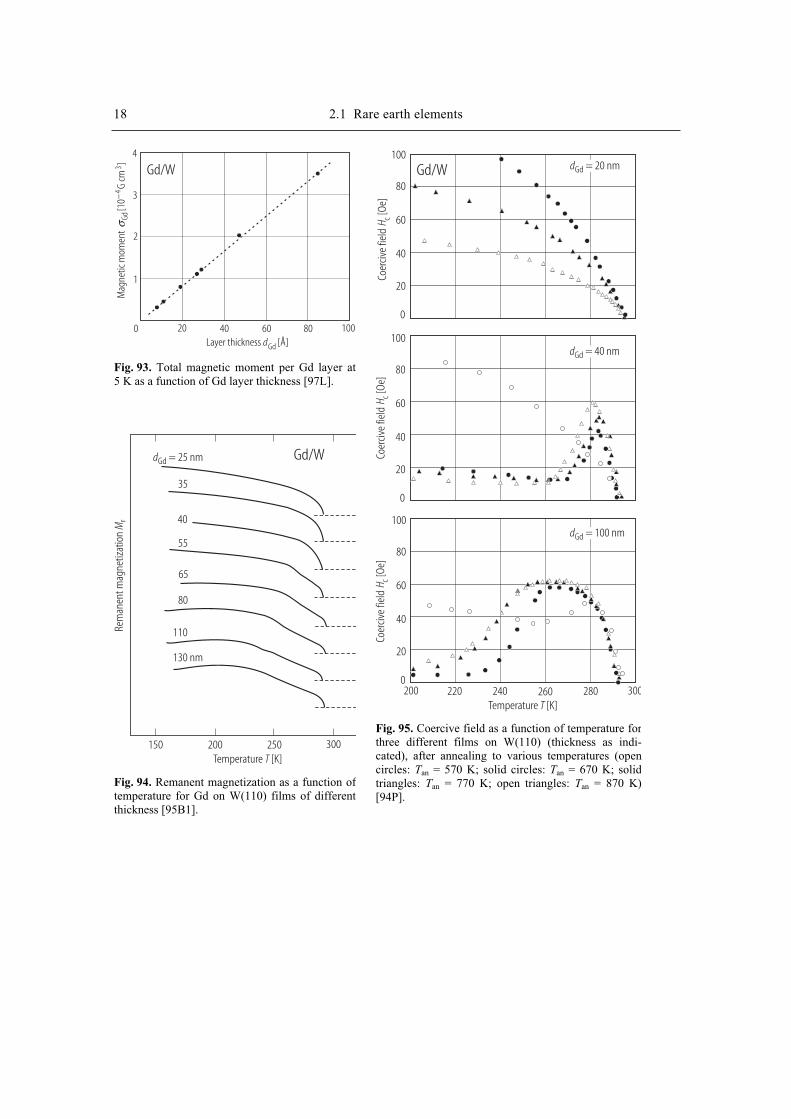
18 2.1 Rare earth elements
Layer thickness [Å]dGd
Gd/W
0 20 40 60 80 100
4
3
2
1
Mag
netic
mom
ent
[10
G cm
]Gd
43
−σ
Fig. 93. Total magnetic moment per Gd layer at 5 K as a function of Gd layer thickness [97L].
Temperature [K]T
Rem
anen
t mag
netiz
atio
nM
r
Gd/W
150 200 250 300
dGd = 25 nm
35
40
55
65
80
110
130 nm
Fig. 94. Remanent magnetization as a function oftemperature for Gd on W(110) films of different thickness [95B1].
Temperature [K]T
Coer
cive
field
[Oe]
H cCo
erciv
e fie
ld[O
e]H c
Gd/W dGd = 20 nm
dGd = 40 nm
dGd = 100 nm
100
100
100
80
80
80
60
60
60
40
40
40
20
20
20
0
0
0200 220 240 260 280 300
Coer
cive
field
[Oe]
H c
Fig. 95. Coercive field as a function of temperature forthree different films on W(110) (thickness as indi-cated), after annealing to various temperatures (open circles: Tan = 570 K; solid circles: Tan = 670 K; solidtriangles: Tan = 770 K; open triangles: Tan = 870 K) [94P].
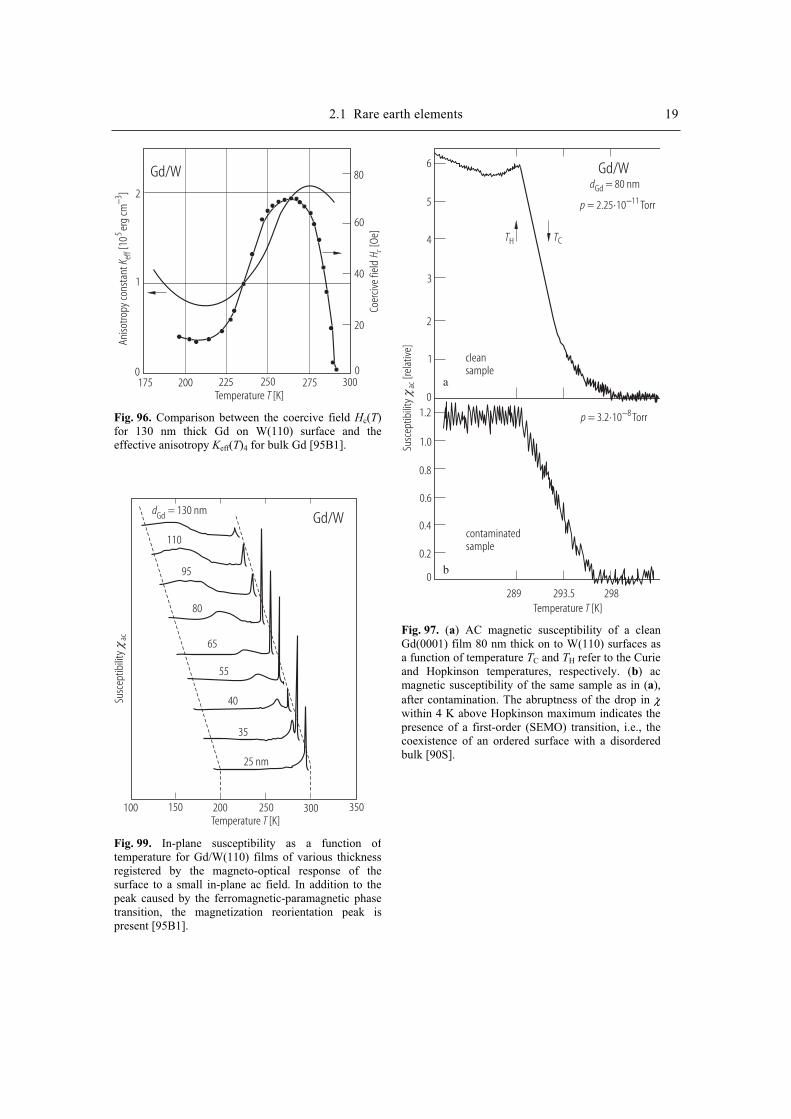
2.1 Rare earth elements 19
Temperature [K]T
Coer
cive
field
[Oe]
H c
Gd/W
Aniso
tropy
cons
tant
[10
erg
cm]
K eff
53−
2
1
0175 200 225 250 275 300
80
60
40
20
0
Fig. 96. Comparison between the coercive field Hc(T)for 130 nm thick Gd on W(110) surface and theeffective anisotropy Keff(T)4 for bulk Gd [95B1].
Temperature [K]T
Susc
eptib
ility
acχ
Gd/WdGd = 130 nm
110
95
80
65
55
40
35
25 nm
100 150 200 250 300 350
Fig. 99. In-plane susceptibility as a function oftemperature for Gd/W(110) films of various thicknessregistered by the magneto-optical response of thesurface to a small in-plane ac field. In addition to thepeak caused by the ferromagnetic-paramagnetic phasetransition, the magnetization reorientation peak ispresent [95B1].
Temperature [K]T
Susc
eptib
ility
[rela
tive]
acχ
Gd/W
289 293.5 298
01.2
1.0
0.8
0.6
0.4
0.2
0
p = 3.2 10 Torr⋅ −8
p = 2.25 10 Torr⋅ −11
contaminatedsample
TH TC
cleansample
6
5
4
3
2
1
dGd = 80 nm
a
b
Fig. 97. (a) AC magnetic susceptibility of a clean Gd(0001) film 80 nm thick on to W(110) surfaces as a function of temperature TC and TH refer to the Curie and Hopkinson temperatures, respectively. (b) ac magnetic susceptibility of the same sample as in (a),after contamination. The abruptness of the drop in χwithin 4 K above Hopkinson maximum indicates the presence of a first-order (SEMO) transition, i.e., the coexistence of an ordered surface with a disorderedbulk [90S].
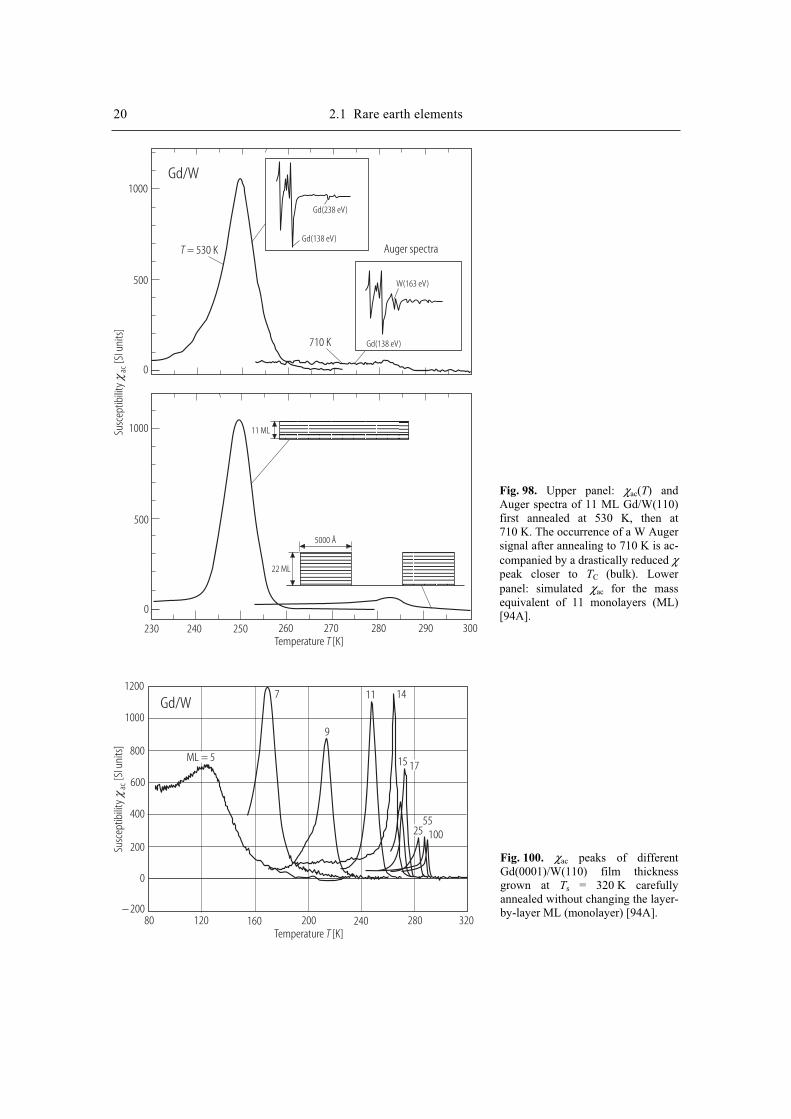
20 2.1 Rare earth elements
Temperature [K]T
Susc
eptib
ility
[SI u
nits
]acχ
Gd/W1000
1000
500
500
0
0
T = 530 K
710 K
Auger spectra
Gd(238 eV)
Gd(138 eV)
Gd(138 eV)
W(163 eV)
11 ML
22 ML
5000 Å
230 240 250 260 270 280 290 300
Temperature [K]T
Susc
eptib
ility
[SI u
nits
]acχ
Gd/W1200
1000
800
600
400
200
0
− 20080 120 160 200 240 280 320
7
9
11 14
15
55100
ML = 517
25
Fig. 98. Upper panel: χac(T) and Auger spectra of 11 ML Gd/W(110) first annealed at 530 K, then at 710 K. The occurrence of a W Auger signal after annealing to 710 K is ac-companied by a drastically reduced χpeak closer to TC (bulk). Lower panel: simulated χac for the mass equivalent of 11 monolayers (ML) [94A].
Fig. 100. χac peaks of different Gd(0001)/W(110) film thickness grown at Ts = 320 K carefully annealed without changing the layer-by-layer ML (monolayer) [94A].
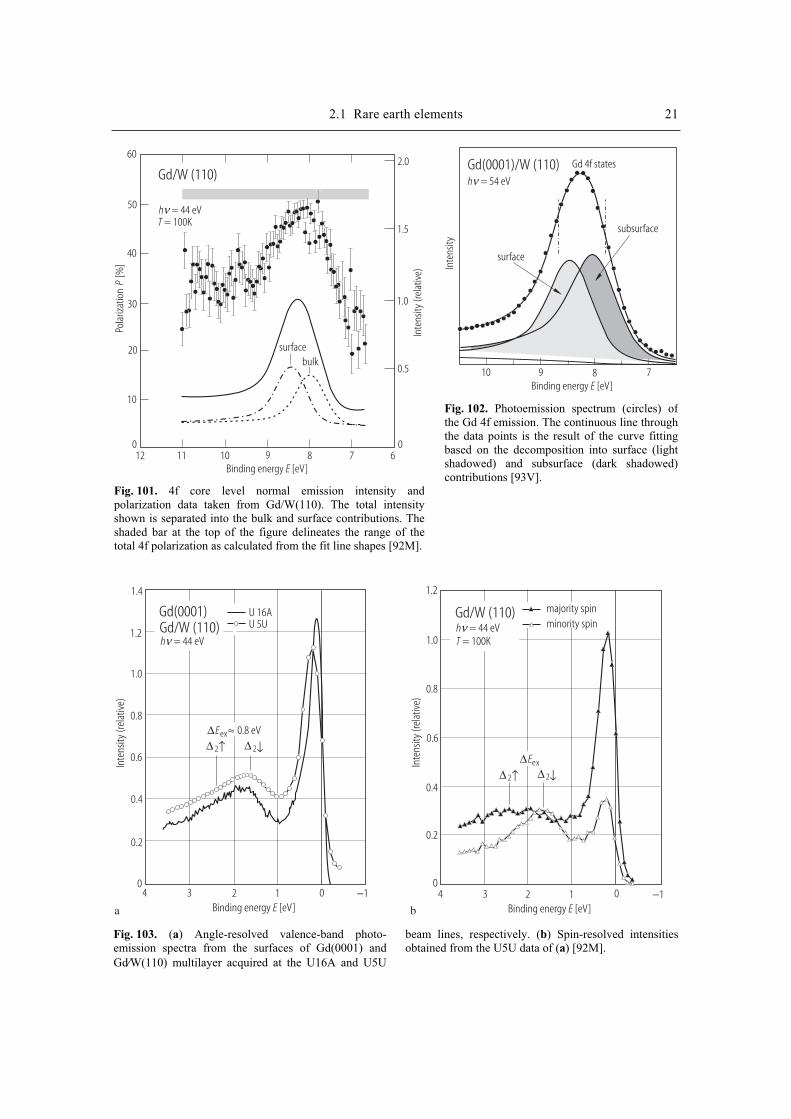
2.1 Rare earth elements 21 Po
lariz
atio
n[%
]P
Inte
nsity
(rel
ativ
e)
Binding energy [eV]E
Gd/W (110)
h = 44 eVνT = 100K
60
50
40
30
20
10
0
2.0
1.5
1.0
0.5
012 11 10 9 8 7 6
surfacebulk
Fig. 101. 4f core level normal emission intensity andpolarization data taken from Gd/W(110). The total intensityshown is separated into the bulk and surface contributions. Theshaded bar at the top of the figure delineates the range of thetotal 4f polarization as calculated from the fit line shapes [92M].
Inte
nsity
Binding energy [eV]E
Gd(0001)/W (110)h = 54 eVν
surface
subsurface
Gd 4f states
10 9 8 7
Fig. 102. Photoemission spectrum (circles) ofthe Gd 4f emission. The continuous line throughthe data points is the result of the curve fitting based on the decomposition into surface (lightshadowed) and subsurface (dark shadowed) contributions [93V].
Binding energy [eV]E Binding energy [eV]E
Inte
nsity
(rel
ativ
e)
Inte
nsity
(rel
ativ
e)
Gd(0001)
h = 44 eVνGd/W (110)
U 16AU 5U
1.4
1.2
1.2
1.0
1.0
0.8
0.8
0.6
0.6
0.40.4
0.20.2
0 04 43 32 21 10 0−1 −1
∆ 2↑
∆ 2↑
∆ 2↓
∆ 2↓
∆ ≈Eex 0.8 eV
h = 44 eVνGd/W (110)
T = 100K
majority spinminority spin
∆Eex
a b
Fig. 103. (a) Angle-resolved valence-band photo-emission spectra from the surfaces of Gd(0001) and Gd⁄W(110) multilayer acquired at the U16A and U5U
beam lines, respectively. (b) Spin-resolved intensities obtained from the U5U data of (a) [92M].
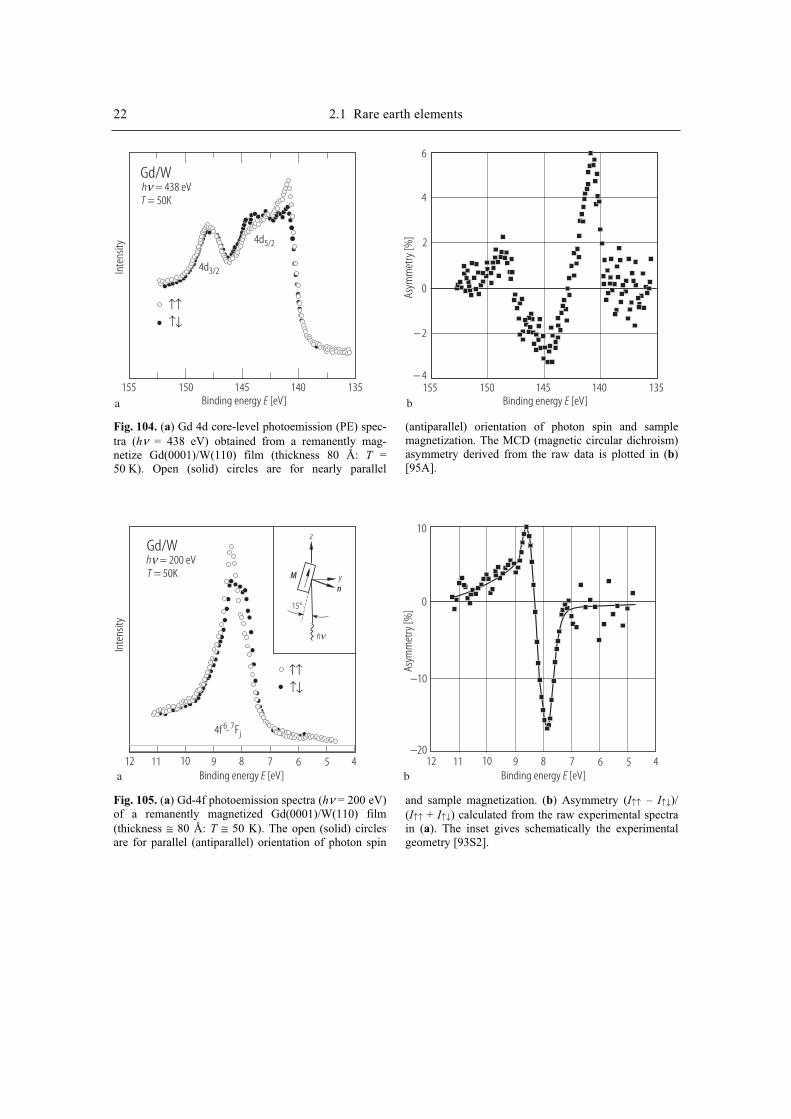
22 2.1 Rare earth elements
Binding energy [eV]E Binding energy [eV]E
Inte
nsity
h = 438 eVνGd/W
↑↑↓
↓
T = 50K
150 150145 145140 140135 135155 155
4d3/2
4d5/2
6
4
2
0
− 2
− 4
a bAs
ymm
etry
[%]
Fig. 104. (a) Gd 4d core-level photoemission (PE) spec-tra (hν = 438 eV) obtained from a remanently mag-netize Gd(0001)/W(110) film (thickness 80 Å: T = 50 K). Open (solid) circles are for nearly parallel
(antiparallel) orientation of photon spin and sample magnetization. The MCD (magnetic circular dichroism) asymmetry derived from the raw data is plotted in (b)[95A].
Binding energy [eV]E Binding energy [eV]E
Inte
nsity
Gd/W
↑↑↓
↓
T = 50K
a b
Asym
met
ry [%
]
h = 200 eVν
12 1211 1110 109 98 87 76 65 54 4
10
0
−10
−20
4f - F6 7j
M
z
yn
15°
hν
Fig. 105. (a) Gd-4f photoemission spectra (hν = 200 eV) of a remanently magnetized Gd(0001)/W(110) film (thickness ≅ 80 Å: T ≅ 50 K). The open (solid) circles are for parallel (antiparallel) orientation of photon spin
and sample magnetization. (b) Asymmetry (I↑↑ – I↑↓)/ (I↑↑ + I↑↓) calculated from the raw experimental spectra in (a). The inset gives schematically the experimental geometry [93S2].
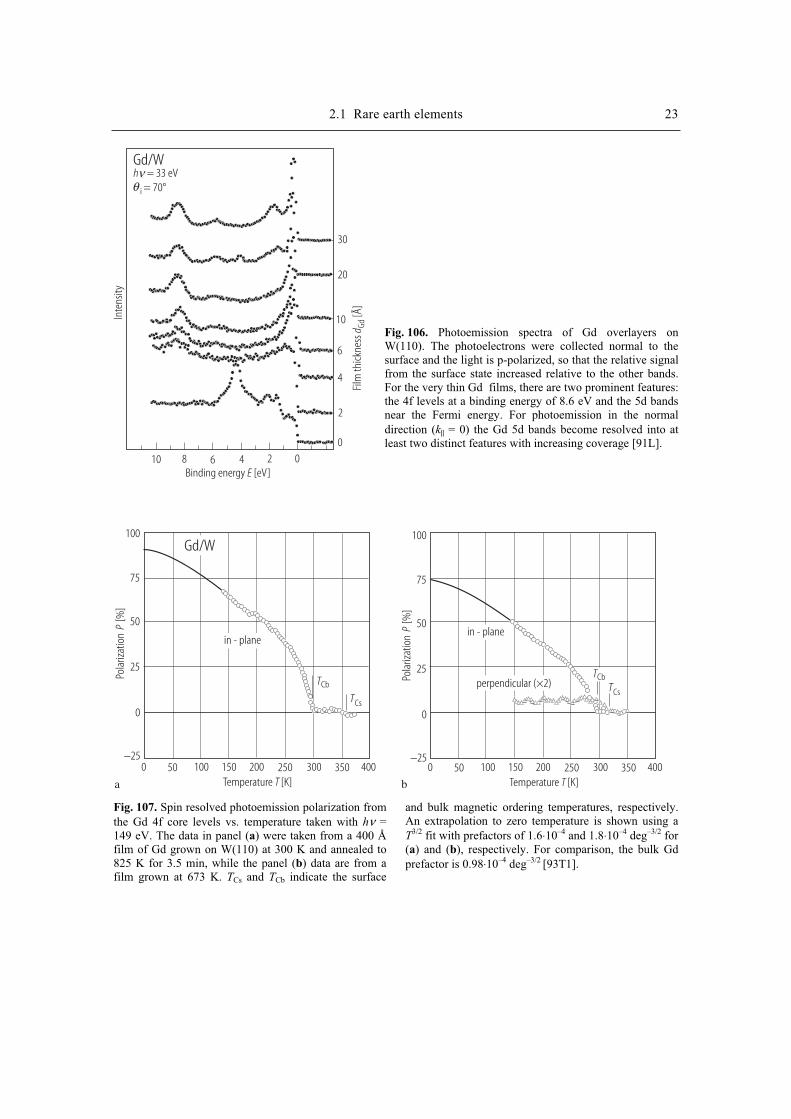
2.1 Rare earth elements 23 In
tens
ity
Binding energy [eV]E
Film
thick
ness
[Å]
d Gd
Gd/Wh = 33 eVν
i = 70°θ
10 8 6 4 2 0
30
20
10
6
4
2
0
Temperature [K]T Temperature [K]T
Pola
rizat
ion
[%]
P
Pola
rizat
ion
[%]
P
100 100
75 75
50 50
25 25
−25 −25
0 0
Gd/W
0 050 50100 100150 150200 200250 250300 300350 350400 400
TCb
TCs
TCs
in - planein - plane
a b
perpendicular (×2)TCb
Fig. 107. Spin resolved photoemission polarization from the Gd 4f core levels vs. temperature taken with hν = 149 eV. The data in panel (a) were taken from a 400 Å film of Gd grown on W(110) at 300 K and annealed to 825 K for 3.5 min, while the panel (b) data are from a film grown at 673 K. TCs and TCb indicate the surface
and bulk magnetic ordering temperatures, respectively. An extrapolation to zero temperature is shown using a T
3/2 fit with prefactors of 1.6⋅10–4 and 1.8⋅10–4 deg–3/2 for (a) and (b), respectively. For comparison, the bulk Gd prefactor is 0.98⋅10–4 deg–3/2 [93T1].
Fig. 106. Photoemission spectra of Gd overlayers on W(110). The photoelectrons were collected normal to the surface and the light is p-polarized, so that the relative signal from the surface state increased relative to the other bands. For the very thin Gd films, there are two prominent features: the 4f levels at a binding energy of 8.6 eV and the 5d bands near the Fermi energy. For photoemission in the normal direction (k|| = 0) the Gd 5d bands become resolved into at least two distinct features with increasing coverage [91L].
24 2.1 Rare earth elements
Wavevector [Å ]kII1−
Bind
ing
ener
gy[e
V]E
Gd/W
MΓ0
1.0
2.00 0.2 0.4 0.6 0.8 1.0
Fig. 108. The experimental band structure from Γ toΜ of the surface Brillouin zone from spectra taken at a photon energy of 33 eV at various emission angles. The results are shown for the two temperatures of295 K (solid circles) and 235 K (open circles). The results are for a 20-Å film of Gd on W(110) [92D].
Gd/W
Magnetic field [Oe]H
Kerr
signa
l
−150 −100 −50 0 50 100 150
T = 202 K
228
243
260
287 K
Fig. 109. Temperature-dependent hysteresis loops measured on a 100-nm Gd film on W(110) afterannealing to 770 K. The hysteresis loops exhibit anonvanishing slope outside the magnetization reversal region around Hc. This effect indicates that the easy axis of magnetization for Gd(0001) films is not in the surface plane [94 P].
Kerr
signa
l [m
rad]
Temperature [K]T
0.10
0.08
0.06
0.04
0.02
0
− 0.02270 275 280 285 290 295265
1
2 3
80 Å Gd/W (110)
Fig. 110. Remanent magnetization of 80 Å Gd(0001) on W(110) for different annealing steps: (1) as-deposited 310 K, (2) 620 K, (3) 820 K. The as-deposited films have a reduced Curie temperature TC = 273 K, which gradually shifts up to the bulk TC of Gd upon annealing [94F].
2.1 Rare earth elements 25
Magnetic field [kOe]H
15
10
5
0 10 20 30 40
1.5
1.0
0.5
0
Evaporation time [min]t
Auge
r am
plitu
de (r
elat
ive)
Auge
r am
plitu
de ra
tio
1.6 2.0
1.0
A = 0.8Θ
A = 0.8Θ
Gd(138/140eV)/W(163/165eV)
Gd(138/140 eV)
2 3 4
T = 340 K
bulk
80 Å
ESR
signa
la b
Fig. 111. The Auger amplitude of Gd and the Auger amplitude ratio Gd/W as functions of evaporation time. An adsorbate coverage of ΘA = 1 corresponds to a hcp Gd (0001) close-packed monolayer on W(110). The sub-strate temperature during evaporation wasTs = 450 °C.
(b) ESR absorption spectra for a 18-µm (bulk), 80-Å, and ΘA = 0.8 Gd adsorbate layer, far in the paramagnetic regime. The microwave frequency is 9.30 GHz and H0
lies in the surface plane [87F].
Temperature [K]T
T [K]
Gd/W
Reso
nanc
e lin
ewid
th[O
e]∆
H
∆H
[Oe]
×20
×40
140
120
100
80
60
40
20
0260 300 340 380
1000
800
600
400
200
0
bulk
5 Oe/K
TCb
TCb
Inte
nsity
(rel
ativ
e)ES
R
Inte
nsity
(rel
ativ
e)
140
120
100
80
60
40
20
0240 260 280 300 320 340 360
600
500
400
300
200
100
Fig. 112. ESR intensity and line-width as functions of temperature for 80 Å (solid circles), ΘA = 1.6 (open squares), and ΘA = 0.8 (open triangles) of Gd/W (110). The gain factors for ΘA = 0.8 and ΘA = 1.6 are 40 and 20 with respect to the 80 Å data. For comparison the corresponding data of a bulk foil (solid circles) are shown in the inset. TCb = 292.5 K. The inflection points of the ESR intensity curves are a strong evidence for a ferromagnetic ordering of the monolayer. ΘA is an adsorbate coverage parameter [87F].
26 2.1 Rare earth elements
Reduced temperature t
Gd/W1
10−1
10−2
10−3
8
8
8
6
6
6
4
4
4
2
2
2
4 10⋅ −2 10−2 10−1 16 8 2 4 6 8 2 4 6 8
Inte
nsity
(rel
ativ
e)ES
R
ΘA = 1.6
ΘA = 0.8dGd = 80 Åγ = 1.25
γ = 1.25bulk
γ = 1.74
γ = 1.9
Fig. 113. Log-log plot of the ESR intensity [αχ(0)]of Gd on W(110) for T > TC. Straight lines are best fits by a power law χ(0) α t
–γ, where t = (T – TC)/TC
with γ ≈ 1.8 for a monolayer and γ ≅ 1.25 for an 80 Å film. This agrees well with the theoretical γ of 2D (γ = 1.8) and 3D (γ = 1.25) Ising system, respec-tively. ΘA is the adsorbate coverage [87F].
Temperature [K]T
Gd/W
Reso
nanc
e fie
ld[k
Oe]
H II
3.5
3.0
2.5
2.0
1.5
1.0
0220 240 260 280 300 320 340 360
0.8 ML1.6 ML2.8 MLdGd = 80 Å
z
c axisy
Mx
Hhf
HII
π/2
φeq
Fig. 114. Magnetic resonance fields at 9 GHz for epitaxial layers Gd (0001)/W(110) as a function of temperature forvarious thicknesses of magnetic monolayer (ML). The dc magnetic field H|| is applied in the film plane (inset). Inuniaxial symmetry the orientation of M is given by φeq. Forall layer thicknesses a shift to lower magnetic fields withdecreasing temperature is observed. This shift to lowerresonance fields indicates that the effective magnetizationMeff inverses in the plane when the temperature is loweredthrough TC.The magnetization lies completely in the filmplane (φeq = 0) opposite to the behaviour of bulk Gd [89F1].
Magnetic field [kOe]H
Inte
nsity
Gd film T = 697 K
475 K
338 K
2 3 4 5 6
Fig. 115. EPR spectra of Gd-containing Langmuir-Blodgett (LB) film during heating. The plane of the film is perpendicular to the external magnetic field [97T].
Temperature [K]T
Inte
nsity
(rel
ativ
e)
Gd film50
40
30
20
10
0300 400 500 600 700
Fig. 116. Temperature dependencies of the EPRsignal intensity in Gd-containing LB film during heating. Solid line is guide for the eye [97T].
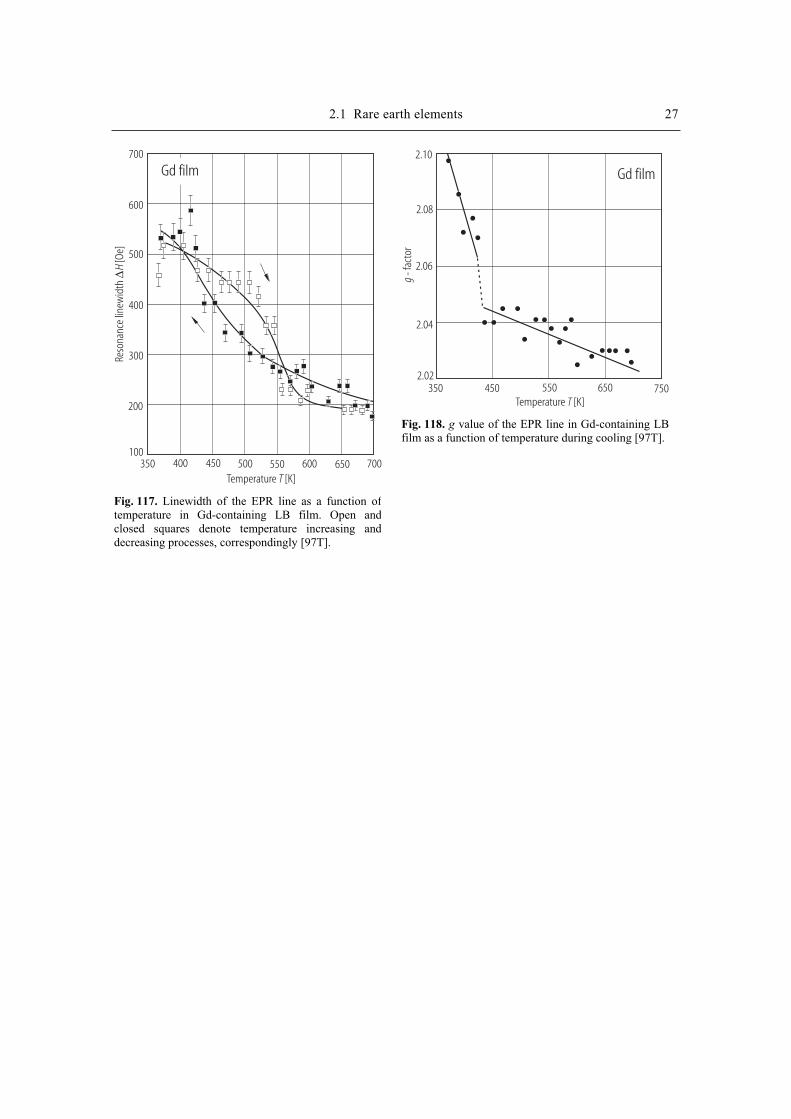
2.1 Rare earth elements 27
Temperature [K]T350 400 500 600 700
Reso
nanc
e lin
ewid
th[O
e]∆
H
450 550 650
Gd film700
600
500
400
300
200
100
Fig. 117. Linewidth of the EPR line as a function oftemperature in Gd-containing LB film. Open andclosed squares denote temperature increasing anddecreasing processes, correspondingly [97T].
Temperature [K]T
Gd film2.10
2.08
2.06
2.04
2.02350 450 550 650 750
g- f
acto
r
Fig. 118. g value of the EPR line in Gd-containing LB film as a function of temperature during cooling [97T].
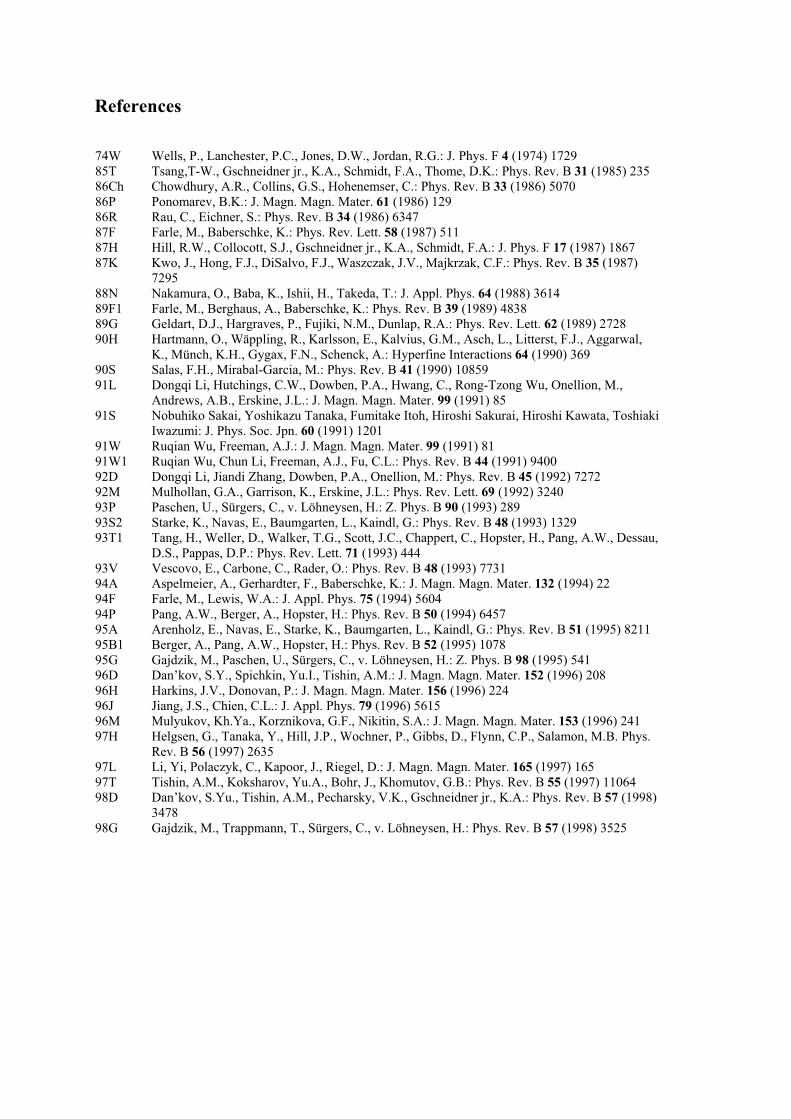
References
74W Wells, P., Lanchester, P.C., Jones, D.W., Jordan, R.G.: J. Phys. F 4 (1974) 1729
85T Tsang,T-W., Gschneidner jr., K.A., Schmidt, F.A., Thome, D.K.: Phys. Rev. B 31 (1985) 235
86Ch Chowdhury, A.R., Collins, G.S., Hohenemser, C.: Phys. Rev. B 33 (1986) 5070
86P Ponomarev, B.K.: J. Magn. Magn. Mater. 61 (1986) 129
86R Rau, C., Eichner, S.: Phys. Rev. B 34 (1986) 6347
87F Farle, M., Baberschke, K.: Phys. Rev. Lett. 58 (1987) 511
87H Hill, R.W., Collocott, S.J., Gschneidner jr., K.A., Schmidt, F.A.: J. Phys. F 17 (1987) 1867
87K Kwo, J., Hong, F.J., DiSalvo, F.J., Waszczak, J.V., Majkrzak, C.F.: Phys. Rev. B 35 (1987)
7295
88N Nakamura, O., Baba, K., Ishii, H., Takeda, T.: J. Appl. Phys. 64 (1988) 3614
89F1 Farle, M., Berghaus, A., Baberschke, K.: Phys. Rev. B 39 (1989) 4838
89G Geldart, D.J., Hargraves, P., Fujiki, N.M., Dunlap, R.A.: Phys. Rev. Lett. 62 (1989) 2728
90H Hartmann, O., Wäppling, R., Karlsson, E., Kalvius, G.M., Asch, L., Litterst, F.J., Aggarwal,
K., Münch, K.H., Gygax, F.N., Schenck, A.: Hyperfine Interactions 64 (1990) 369
90S Salas, F.H., Mirabal-Garcia, M.: Phys. Rev. B 41 (1990) 10859
91L Dongqi Li, Hutchings, C.W., Dowben, P.A., Hwang, C., Rong-Tzong Wu, Onellion, M.,
Andrews, A.B., Erskine, J.L.: J. Magn. Magn. Mater. 99 (1991) 85
91S Nobuhiko Sakai, Yoshikazu Tanaka, Fumitake Itoh, Hiroshi Sakurai, Hiroshi Kawata, Toshiaki
Iwazumi: J. Phys. Soc. Jpn. 60 (1991) 1201
91W Ruqian Wu, Freeman, A.J.: J. Magn. Magn. Mater. 99 (1991) 81
91W1 Ruqian Wu, Chun Li, Freeman, A.J., Fu, C.L.: Phys. Rev. B 44 (1991) 9400
92D Dongqi Li, Jiandi Zhang, Dowben, P.A., Onellion, M.: Phys. Rev. B 45 (1992) 7272
92M Mulhollan, G.A., Garrison, K., Erskine, J.L.: Phys. Rev. Lett. 69 (1992) 3240
93P Paschen, U., Sürgers, C., v. Löhneysen, H.: Z. Phys. B 90 (1993) 289
93S2 Starke, K., Navas, E., Baumgarten, L., Kaindl, G.: Phys. Rev. B 48 (1993) 1329
93T1 Tang, H., Weller, D., Walker, T.G., Scott, J.C., Chappert, C., Hopster, H., Pang, A.W., Dessau,
D.S., Pappas, D.P.: Phys. Rev. Lett. 71 (1993) 444
93V Vescovo, E., Carbone, C., Rader, O.: Phys. Rev. B 48 (1993) 7731
94A Aspelmeier, A., Gerhardter, F., Baberschke, K.: J. Magn. Magn. Mater. 132 (1994) 22
94F Farle, M., Lewis, W.A.: J. Appl. Phys. 75 (1994) 5604
94P Pang, A.W., Berger, A., Hopster, H.: Phys. Rev. B 50 (1994) 6457
95A Arenholz, E., Navas, E., Starke, K., Baumgarten, L., Kaindl, G.: Phys. Rev. B 51 (1995) 8211
95B1 Berger, A., Pang, A.W., Hopster, H.: Phys. Rev. B 52 (1995) 1078
95G Gajdzik, M., Paschen, U., Sürgers, C., v. Löhneysen, H.: Z. Phys. B 98 (1995) 541
96D Dan’kov, S.Y., Spichkin, Yu.I., Tishin, A.M.: J. Magn. Magn. Mater. 152 (1996) 208
96H Harkins, J.V., Donovan, P.: J. Magn. Magn. Mater. 156 (1996) 224
96J Jiang, J.S., Chien, C.L.: J. Appl. Phys. 79 (1996) 5615
96M Mulyukov, Kh.Ya., Korznikova, G.F., Nikitin, S.A.: J. Magn. Magn. Mater. 153 (1996) 241
97H Helgsen, G., Tanaka, Y., Hill, J.P., Wochner, P., Gibbs, D., Flynn, C.P., Salamon, M.B. Phys.
Rev. B 56 (1997) 2635
97L Li, Yi, Polaczyk, C., Kapoor, J., Riegel, D.: J. Magn. Magn. Mater. 165 (1997) 165
97T Tishin, A.M., Koksharov, Yu.A., Bohr, J., Khomutov, G.B.: Phys. Rev. B 55 (1997) 11064
98D Dan’kov, S.Yu., Tishin, A.M., Pecharsky, V.K., Gschneidner jr., K.A.: Phys. Rev. B 57 (1998)
3478
98G Gajdzik, M., Trappmann, T., Sürgers, C., v. Löhneysen, H.: Phys. Rev. B 57 (1998) 3525
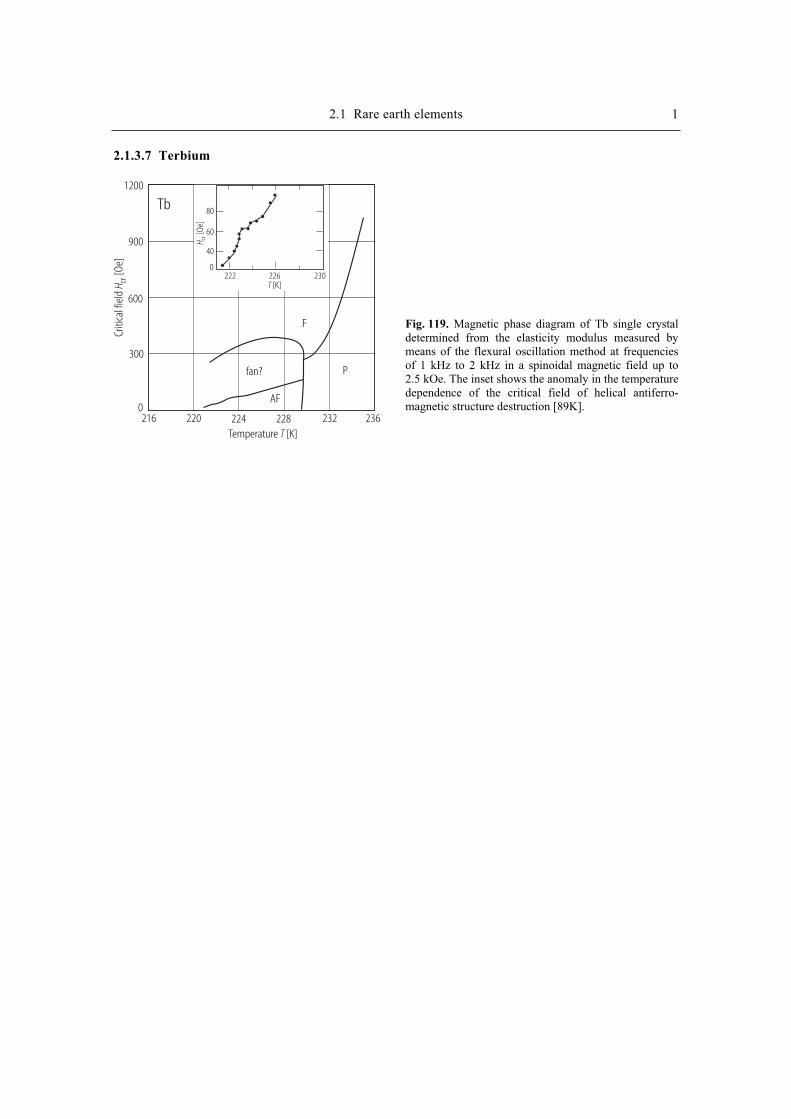
2.1 Rare earth elements 1
2.1.3.7 Terbium
Temperature [K]T
T [K]
Criti
cal f
ield
[Oe]
H cr
[Oe]
H cr
1200
900
600
300
0216 220 224 228 232 236
Tb
F
Pfan?
AF
80
60
40
0222 226 230
Fig. 119. Magnetic phase diagram of Tb single crystal determined from the elasticity modulus measured by means of the flexural oscillation method at frequencies of 1 kHz to 2 kHz in a spinoidal magnetic field up to 2.5 kOe. The inset shows the anomaly in the temperature dependence of the critical field of helical antiferro-magnetic structure destruction [89K].
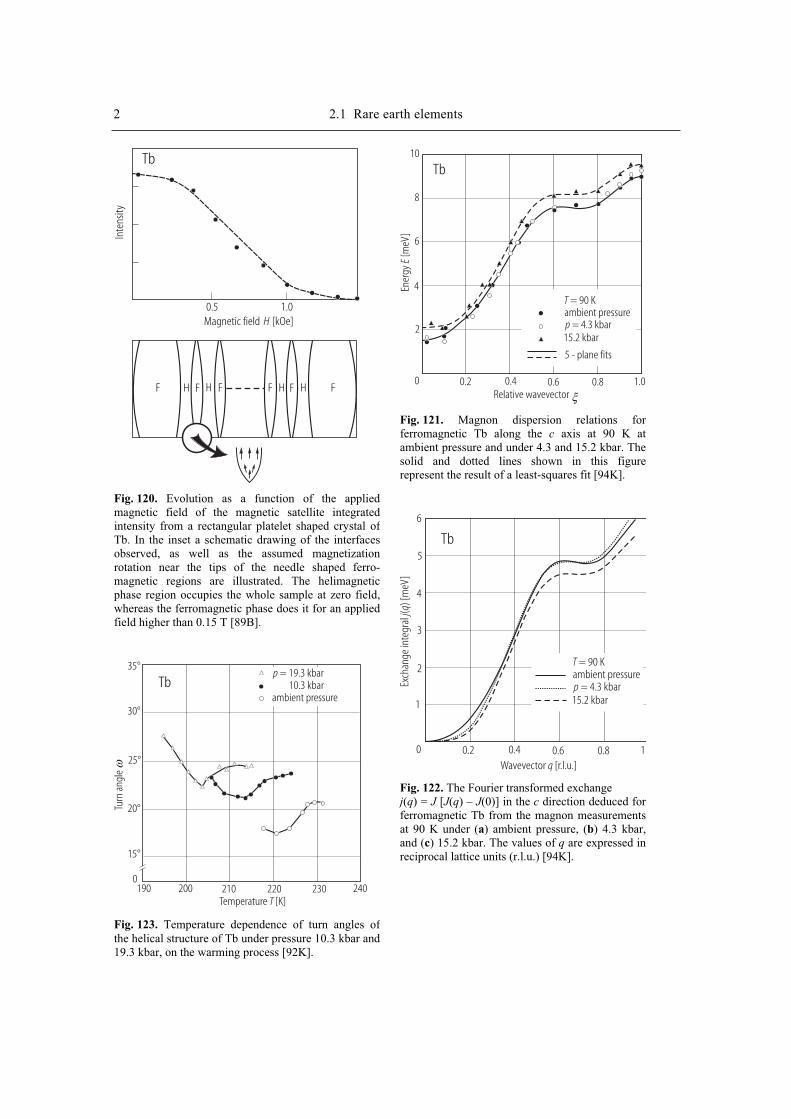
2 2.1 Rare earth elements
Magnetic field [kOe]H
Inte
nsity
Tb
0.5 1.0
F H F H F F H F H F
Fig. 120. Evolution as a function of the appliedmagnetic field of the magnetic satellite integratedintensity from a rectangular platelet shaped crystal ofTb. In the inset a schematic drawing of the interfacesobserved, as well as the assumed magnetizationrotation near the tips of the needle shaped ferro-magnetic regions are illustrated. The helimagneticphase region occupies the whole sample at zero field,whereas the ferromagnetic phase does it for an appliedfield higher than 0.15 T [89B].
Temperature [K]T
Turn
ang
leω
Tb35°
30°
25°
20°
15°
0200 210 220 230 240190
p = 19.3 kbar10.3 kbar
ambient pressure
Fig. 123. Temperature dependence of turn angles ofthe helical structure of Tb under pressure 10.3 kbar and19.3 kbar, on the warming process [92K].
Ener
gy[m
eV]
E
Tb
Relative wavevector ξ
10
8
6
4
2
0 0.2 0.4 0.6 0.8 1.0
T = 90 Kambient pressurep = 4.3 kbar15.2 kbar
5 - plane fits
Fig. 121. Magnon dispersion relations for ferromagnetic Tb along the c axis at 90 K at ambient pressure and under 4.3 and 15.2 kbar. The solid and dotted lines shown in this figure represent the result of a least-squares fit [94K].
Tb
0 0.2 0.4 0.6 0.8 1.
T = 90 Kambient pressurep = 4.3 kbar15.2 kbar
6
5
4
3
2
1
Wavevector [r.l.u.]q
Exch
ange
inte
gral
() [
meV
]j q
Fig. 122. The Fourier transformed exchange j(q) = J [J(q) – J(0)] in the c direction deduced for ferromagnetic Tb from the magnon measurements at 90 K under (a) ambient pressure, (b) 4.3 kbar, and (c) 15.2 kbar. The values of q are expressed in reciprocal lattice units (r.l.u.) [94K].
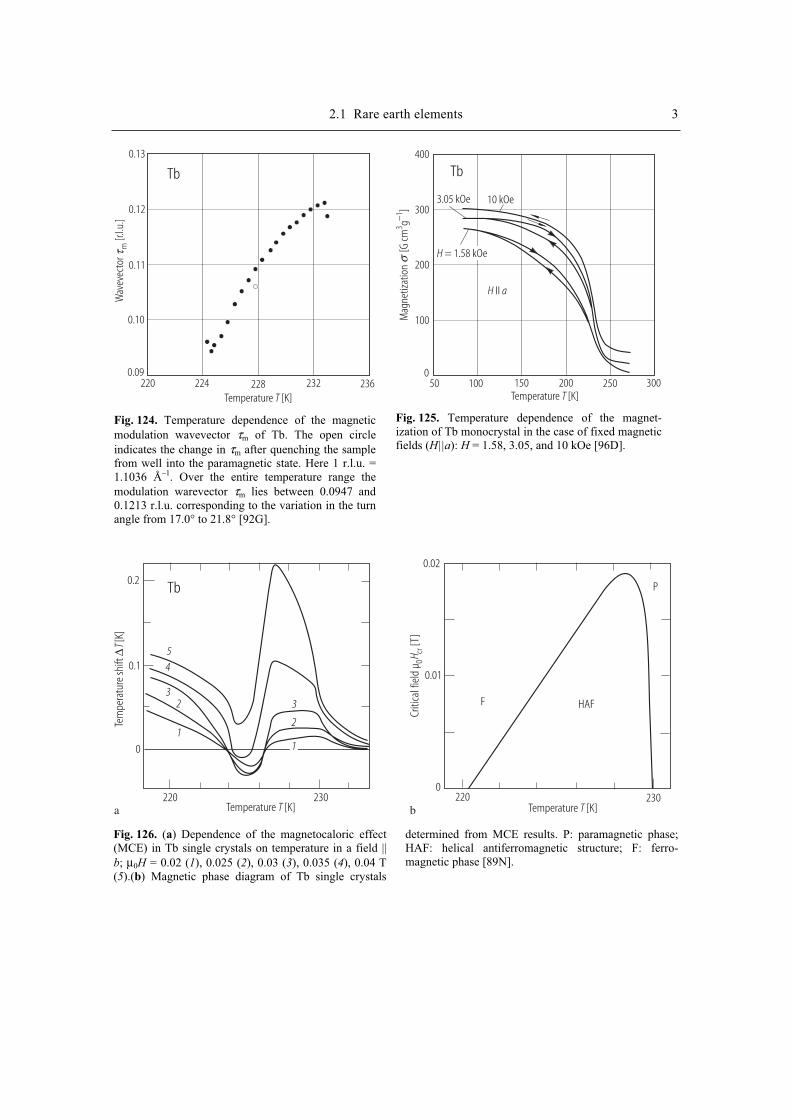
2.1 Rare earth elements 3
Temperature [K]T
Tb
Wav
evec
tor
[r.l.u
.]mτ
0.13
0.12
0.11
0.10
0.09220 224 228 232 236
Fig. 124. Temperature dependence of the magneticmodulation wavevector τm of Tb. The open circleindicates the change in τm after quenching the sample from well into the paramagnetic state. Here 1 r.l.u. =1.1036 Å–1. Over the entire temperature range themodulation warevector τm lies between 0.0947 and0.1213 r.l.u. corresponding to the variation in the turnangle from 17.0° to 21.8° [92G].
Temperature [K]T
Tb
Mag
netiz
atio
n
[G cm
g]
31−
σ
400
300
200
100
050 100 150 200 250 300
10 kOe3.05 kOe
H aII
H = 1.58 kOe
Fig. 125. Temperature dependence of the magnet-ization of Tb monocrystal in the case of fixed magnetic fields (H||a): H = 1.58, 3.05, and 10 kOe [96D].
Temperature [K]T Temperature [K]T
Tem
pera
ture
shift
[K]
∆T
Tb
field
µ[T
]0
crHCr
itica
l
0.2
0.1
0
220 230a
54
32
1
3
2
1
0.02
0.01
0220 230
P
HAFF
b
Fig. 126. (a) Dependence of the magnetocaloric effect (MCE) in Tb single crystals on temperature in a field || b; µ0H = 0.02 (1), 0.025 (2), 0.03 (3), 0.035 (4), 0.04 T (5).(b) Magnetic phase diagram of Tb single crystals
determined from MCE results. P: paramagnetic phase; HAF: helical antiferromagnetic structure; F: ferro-magnetic phase [89N].
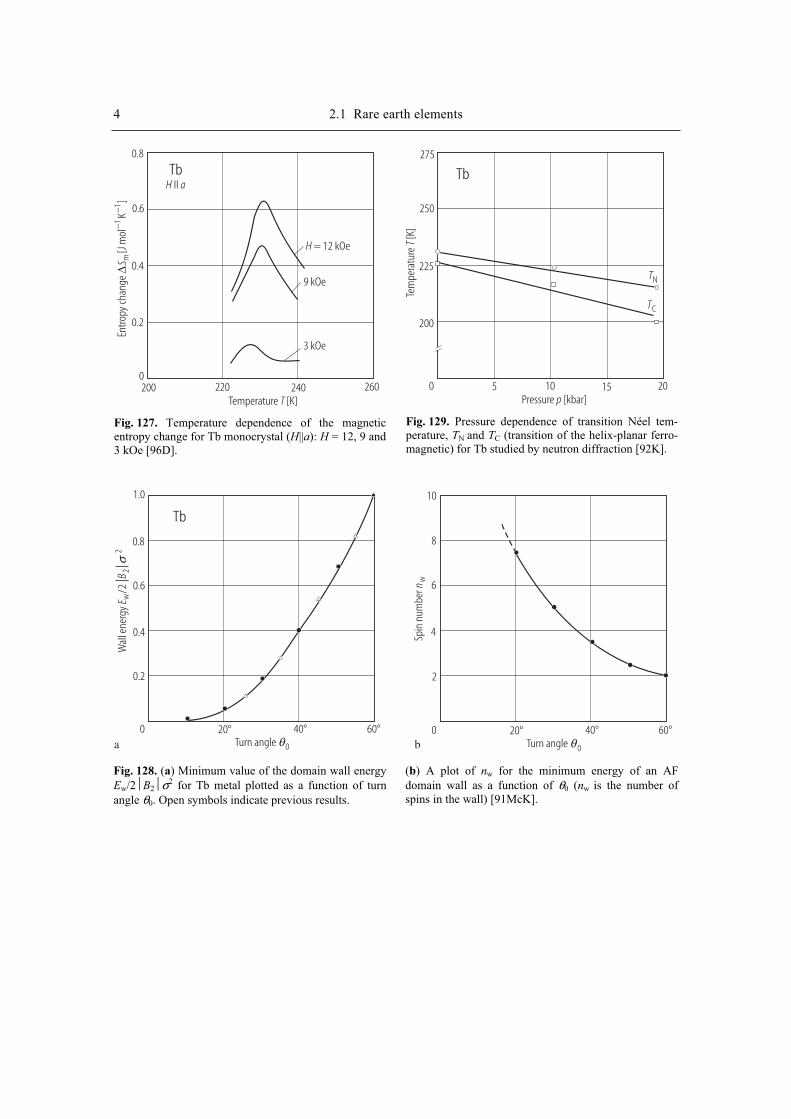
4 2.1 Rare earth elements
Temperature [K]T
Entro
py ch
ange
[J m
olK
]∆
S m1
1−
−
Tb0.8
0.6
0.4
0.2
0200 220 240 260
H = 12 kOe
9 kOe
3 kOe
H aII
Fig. 127. Temperature dependence of the magnetic entropy change for Tb monocrystal (H||a): H = 12, 9 and3 kOe [96D].
Tem
pera
ture
[K]
TPressure [kbar]p
Tb
TN
TC
275
250
225
200
0 105 15 20
Fig. 129. Pressure dependence of transition Néel tem-perature, TN and TC (transition of the helix-planar ferro-magnetic) for Tb studied by neutron diffraction [92K].
Tb
Wal
l ene
rgy
/2E
Bw
2σ
2
1.0
0.8
0.6
0.4
0.2
0 020° 20°40° 40°60° 60°a
Spin
num
ber n
w
10
8
6
4
2
bTurn angle θ0 Turn angle θ 0
Fig. 128. (a) Minimum value of the domain wall energy Ew/2B2σ2 for Tb metal plotted as a function of turn angle θ0. Open symbols indicate previous results.
(b) A plot of nw for the minimum energy of an AF domain wall as a function of θ0 (nw is the number of spins in the wall) [91McK].
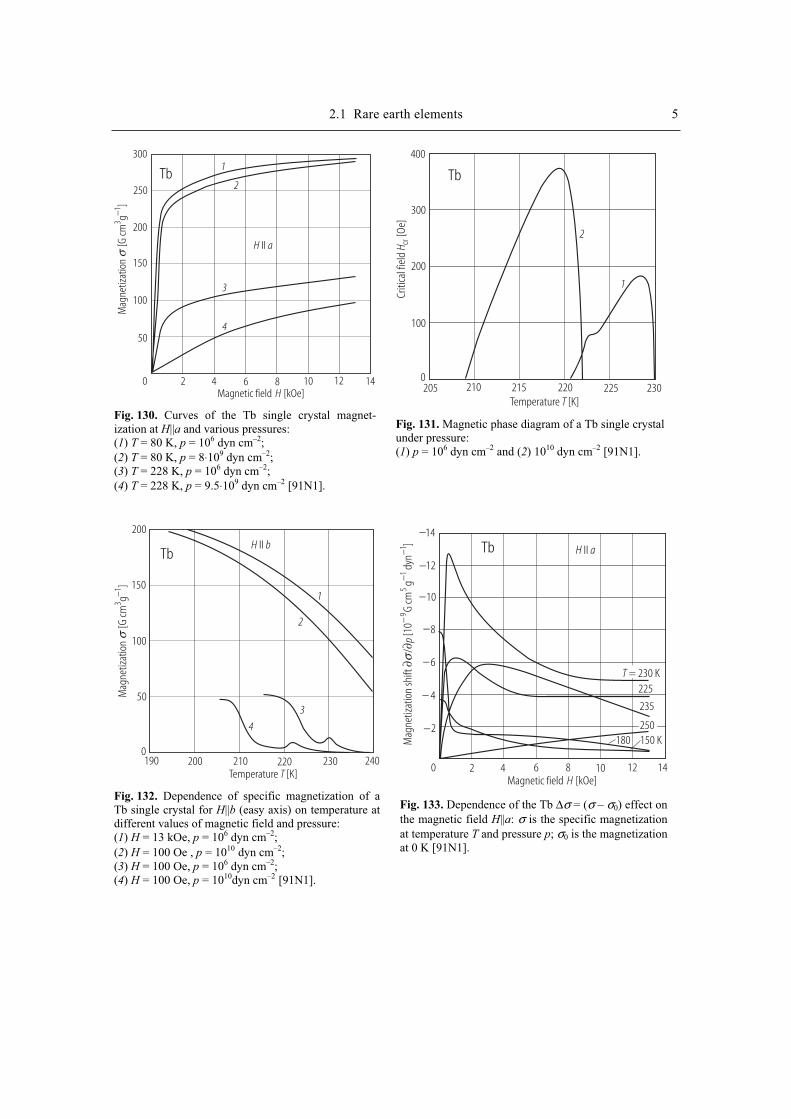
2.1 Rare earth elements 5 M
agne
tizat
ion
[G
cmg
]3
1−σ
Magnetic field [kOe]H
Tb
H aII
300
250
200
150
100
50
0 2 4 6 8 10 12 14
1
2
3
4
Fig. 130. Curves of the Tb single crystal magnet-ization at H||a and various pressures: (1) T = 80 K, p = 106 dyn cm–2;(2) T = 80 K, p = 8⋅109 dyn cm–2;(3) T = 228 K, p = 106 dyn cm–2;(4) T = 228 K, p = 9.5⋅109 dyn cm–2 [91N1].
Temperature [K]T
Tb
Criti
cal f
ield
[Oe]
H cr
400
300
200
100
0205 210 215 220 225 230
2
1
Fig. 131. Magnetic phase diagram of a Tb single crystal under pressure: (1) p = 106 dyn cm–2 and (2) 1010 dyn cm–2 [91N1].
Mag
netiz
atio
n
[G cm
g]
31−
σ
TbH bII
1
2
3
4
Temperature [K]T
200
150
100
50
0200 210 220 230 240190
Fig. 132. Dependence of specific magnetization of aTb single crystal for H||b (easy axis) on temperature at different values of magnetic field and pressure: (1) H = 13 kOe, p = 106 dyn cm–2;(2) H = 100 Oe , p = 1010 dyn cm–2;(3) H = 100 Oe, p = 106 dyn cm–2;(4) H = 100 Oe, p = 1010dyn cm–2 [91N1].
Magnetic field [kOe]H
Tb
Mag
netiz
atio
n sh
ift/
[10
G cm
gdy
n]
∂∂ p
−−
−9
51
1σ
H aII
14
12
10
8
6
4
2
0
−
−
−
−
−
−
−
2 4 6 8 10 12 14
225
235
150 K180
T = 230 K
250
Fig. 133. Dependence of the Tb ∆σ = (σ – σ0) effect on the magnetic field H||a: σ is the specific magnetization at temperature T and pressure p; σ0 is the magnetization at 0 K [91N1].
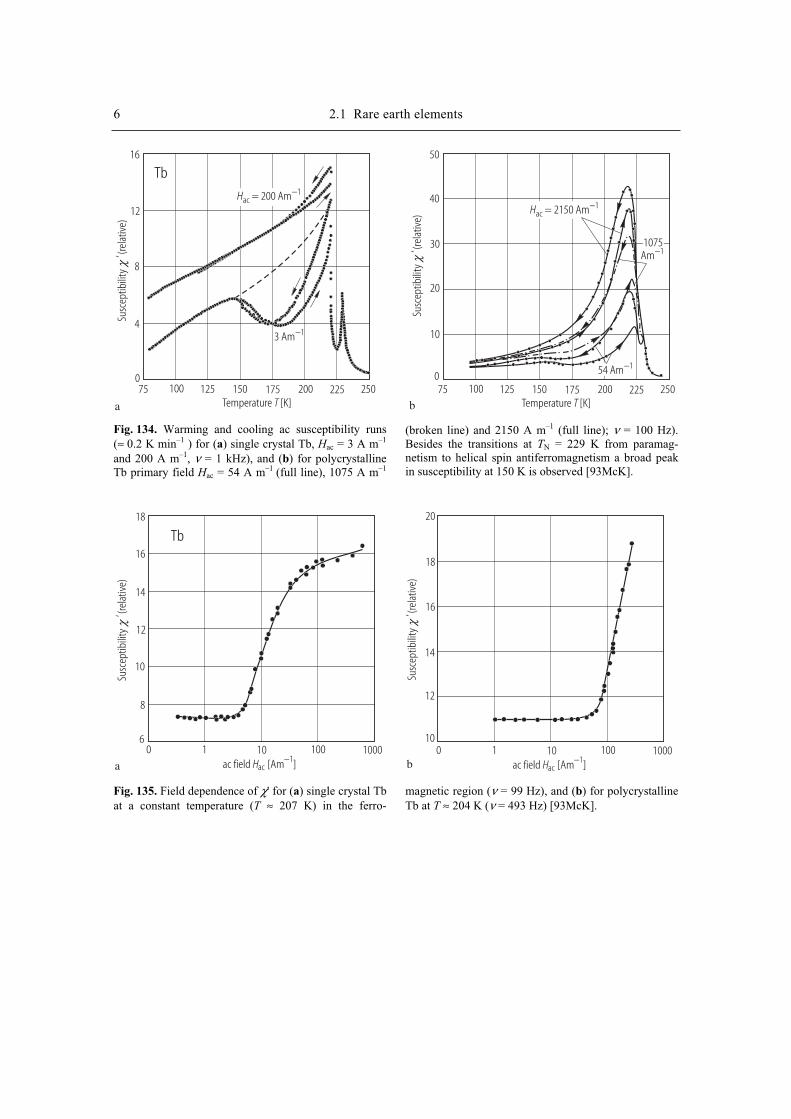
6 2.1 Rare earth elements
Temperature [K]T Temperature [K]T
Tb
Susc
eptib
ility
(
rela
tive)
χ‘
Susc
eptib
ility
(
rela
tive)
χ‘
16
12
8
4
075 75100 100125 125150 150175 175200 200225 225250 250
3 Am−1
Hac1= 200 Am−
50
40
30
20
10
0
Hac1= 2150 Am−
54 Am−1
1075Am−1
a b
Fig. 134. Warming and cooling ac susceptibility runs (≈ 0.2 K min–1 ) for (a) single crystal Tb, Hac = 3 A m–1
and 200 A m–1, ν = 1 kHz), and (b) for polycrystalline Tb primary field Hac = 54 A m–1 (full line), 1075 A m–1
(broken line) and 2150 A m–1 (full line); ν = 100 Hz). Besides the transitions at TN = 229 K from paramag-netism to helical spin antiferromagnetism a broad peak in susceptibility at 150 K is observed [93McK].
Tb
Susc
eptib
ility
(
rela
tive)
χ‘
Susc
eptib
ility
(
rela
tive)
χ‘
a b
18 20
1618
1416
12
1410
128
1061 110 10100 1000 01000 1000
ac field [Am ]Hac1−
ac field [Am ]Hac1−
Fig. 135. Field dependence of χ' for (a) single crystal Tb at a constant temperature (T ≈ 207 K) in the ferro-
magnetic region (ν = 99 Hz), and (b) for polycrystalline Tb at T ≈ 204 K (ν = 493 Hz) [93McK].
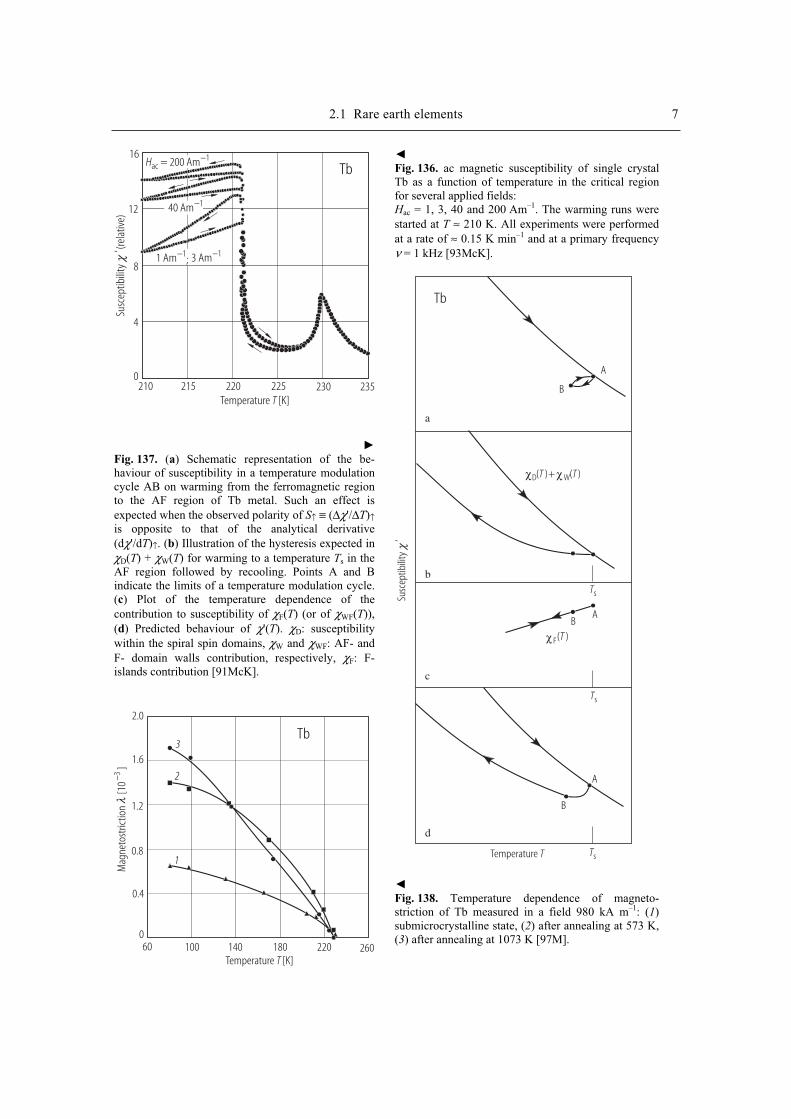
2.1 Rare earth elements 7
Temperature [K]T
Susc
eptib
ility
(
rela
tive)
χ‘
16
12
8
4
0220 230225 235215210
TbHac1= 200 Am−
40 Am−1
3 Am−11 Am−1;
Fig. 137. (a) Schematic representation of the be-haviour of susceptibility in a temperature modulationcycle AB on warming from the ferromagnetic regionto the AF region of Tb metal. Such an effect isexpected when the observed polarity of S↑ ≡ (∆χ'/∆T)↑is opposite to that of the analytical derivative(dχ'/dT)↑. (b) Illustration of the hysteresis expected inχD(T) + χW(T) for warming to a temperature Ts in the AF region followed by recooling. Points A and Bindicate the limits of a temperature modulation cycle.(c) Plot of the temperature dependence of thecontribution to susceptibility of χF(T) (or of χWF(T)),(d) Predicted behaviour of χ'(T). χD: susceptibilitywithin the spiral spin domains, χW and χWF: AF- andF- domain walls contribution, respectively, χF: F-islands contribution [91McK].
Temperature [K]T
Tb
Mag
neto
stric
tion
[10
]−3
λ
2.0
1.6
1.2
0.8
0.4
060 100 140 180 220 260
3
2
1
Fig. 136. ac magnetic susceptibility of single crystal Tb as a function of temperature in the critical region for several applied fields: Hac = 1, 3, 40 and 200 Am–1. The warming runs were started at T ≈ 210 K. All experiments were performed at a rate of ≈ 0.15 K min–1 and at a primary frequency ν = 1 kHz [93McK].
Temperature T
Tb
Susc
eptib
ility
χ‘
A
A
A
B
B
B
χ χD W( )+ ( )T T
χF( )T
Ts
Ts
Ts
a
b
c
d
Fig. 138. Temperature dependence of magneto-striction of Tb measured in a field 980 kA m–1: (1)submicrocrystalline state, (2) after annealing at 573 K, (3) after annealing at 1073 K [97M].
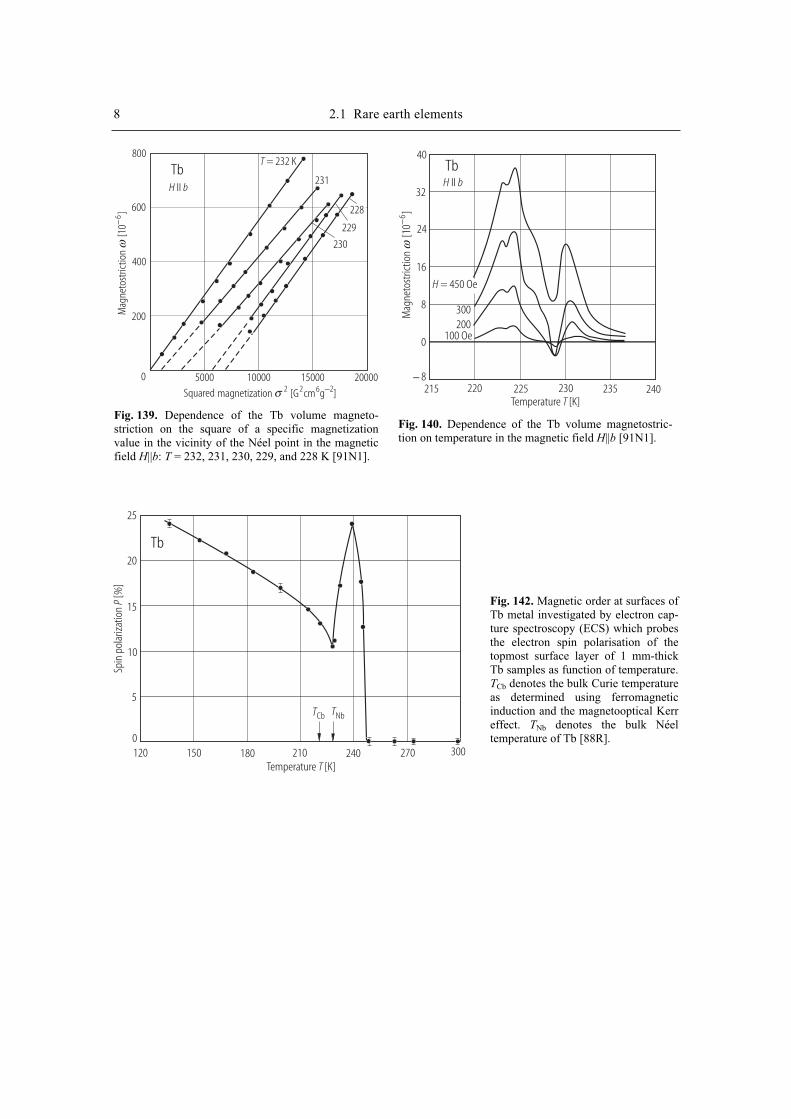
8 2.1 Rare earth elements
magnetization [G cm g ]2 2 6 2−σSquared
Tb
Mag
neto
stric
tion
[10
]−6
ω
800
600
400
200
0 5000 10000 15000 20000
T = 232 K
231
229
230
228
H bII
Fig. 139. Dependence of the Tb volume magneto-striction on the square of a specific magnetization value in the vicinity of the Néel point in the magnetic field H||b: T = 232, 231, 230, 229, and 228 K [91N1].
Tb
Mag
neto
stric
tion
[10
]−6
ωTemperature [K]T
40
32
24
16
8
0
− 8215 220 225 230 235 240
H = 450 Oe
300200
100 Oe
H bII
Fig. 140. Dependence of the Tb volume magnetostric-tion on temperature in the magnetic field H||b [91N1].
Tb
Temperature [K]T
Spin
pol
ariza
tion
[]
P%
25
20
15
10
5
0
TCb TNb
120 150 180 210 240 270 300
Fig. 142. Magnetic order at surfaces of Tb metal investigated by electron cap-ture spectroscopy (ECS) which probes the electron spin polarisation of the topmost surface layer of 1 mm-thick Tb samples as function of temperature. TCb denotes the bulk Curie temperature as determined using ferromagnetic induction and the magnetooptical Kerr effect. TNb denotes the bulk Néel temperature of Tb [88R].
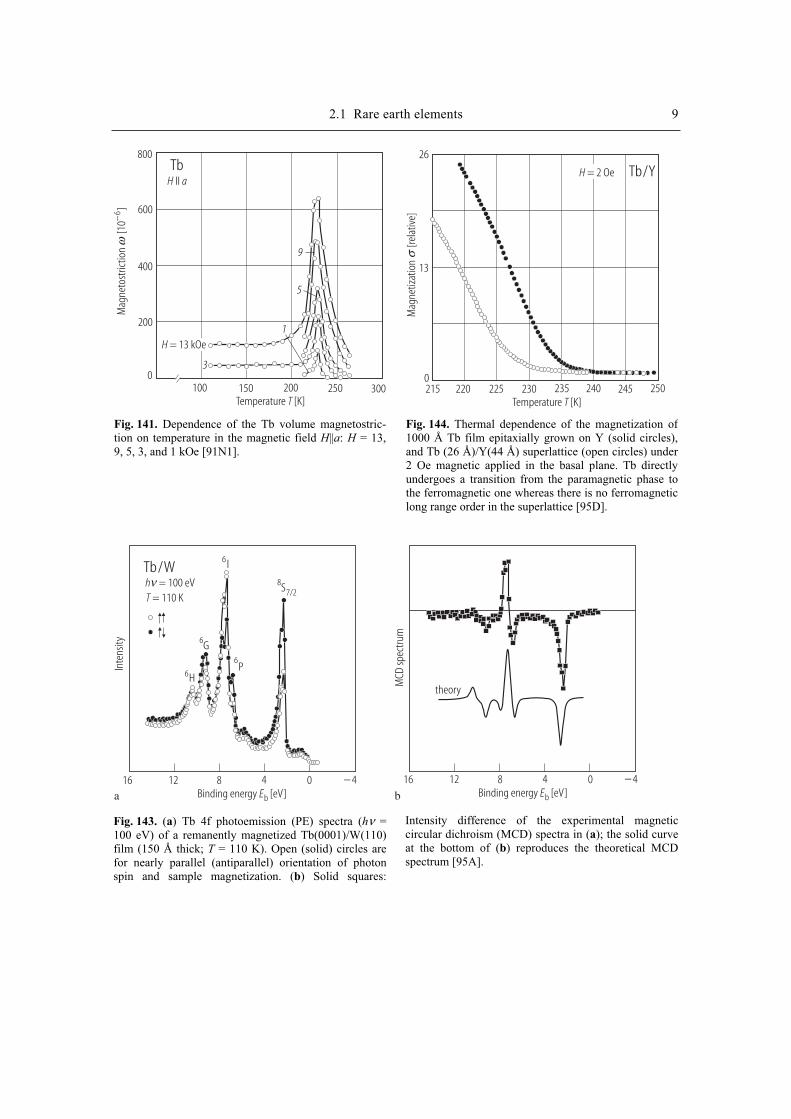
2.1 Rare earth elements 9
Tb
Mag
neto
stric
tion
[10
]−6
ω
H aII
Temperature [K]T
800
600
400
200
0100 150 200 250 300
9
5
3
1H = 13 kOe
Fig. 141. Dependence of the Tb volume magnetostric-tion on temperature in the magnetic field H||a: H = 13, 9, 5, 3, and 1 kOe [91N1].
Mag
netiz
atio
n
[rel
ativ
e]σ
Temperature [K]T
Tb/YH = 2 Oe
26
13
0215 225 235 245 250240230220
Fig. 144. Thermal dependence of the magnetization of1000 Å Tb film epitaxially grown on Y (solid circles), and Tb (26 Å)/Y(44 Å) superlattice (open circles) under2 Oe magnetic applied in the basal plane. Tb directly undergoes a transition from the paramagnetic phase to the ferromagnetic one whereas there is no ferromagnetic long range order in the superlattice [95D].
Inte
nsity
Tb/W
Binding energy [eV]Eb Binding energy [eV]Eb
h = 100 eVνT = 110 K
12 1216 168 84 40 0− 4 − 4
6H
6G
6I
6P
87/2S
a
MCD
spec
trum
theory
b
Fig. 143. (a) Tb 4f photoemission (PE) spectra (hν = 100 eV) of a remanently magnetized Tb(0001)/W(110) film (150 Å thick; T = 110 K). Open (solid) circles are for nearly parallel (antiparallel) orientation of photon spin and sample magnetization. (b) Solid squares:
Intensity difference of the experimental magnetic circular dichroism (MCD) spectra in (a); the solid curve at the bottom of (b) reproduces the theoretical MCD spectrum [95A].

References
88R Rau, C., Jin, C., Robert, M.: J. Appl. Phys. 63 (1988) 3667
89B Baruchel, J., Sandonis, J. Pearce, A.: Physica B 156-157 (1989) 765
89K Kataev, G.I., Sattarov, M.R.,Tishin, A.M.: Phys. Status Solidi (a) 114 (1989) K79
89N Nikitin, S.A., Tishin, A.M., Bykhover, S.E.: Phys. Status Solidi (a) 114 (1989) K99
91McK McKenna, T.J., Campbell, S.J., Chaplin, D.H., Wilson, G.V.H.: J. Phys.: Condens. Matter 3
(1991) 1855
91N1 Nikitin, S.A., Tishin, A.M., Bezdushnyi, R.V., Spichkin, Yu.I., Red’ko, S.V.: J. Magn. Magn.
Mater. 92 (1991) 397
92G Gehring, P.M., Rebelsky, L., Gibbs, D., Shirane, G.: Phys. Rev. B 45 (1992) 243
92K Kawano, S., Achiwa, N., Onodera, A., Nakai, Y.: Physica B 180-181 (1992) 46
93McK McKenna, T.J., Campbell, S.J., Chaplin, D.H., Wilson, G.V.H.: J. Magn. Magn. Mater. 124
(1993) 105
94K Kawano, S., Fernandez-Baca, J.A., Nicklow, R.M.: J. Appl. Phys. 75 (1994) 6060
95A Arenholz, E., Navas, E., Starke, K., Baumgarten, L., Kaindl, G.: Phys. Rev. B 51 (1995) 8211
95D Dufour, C., Dumesnil, K., Vergnat, M., Mangin, Ph., Marchal, G., Hennion, M.: J. Magn.
Magn. Mater. 140-144 (1995) 771
96D Dan’kov, S.Y., Spichkin, Yu.I., Tishin, A.M.: J. Magn. Magn. Mater. 152 (1996) 208
97M Mulyukov, K.Ya, Korznikova, G.F., Sharipov, I.Z.: Phys. Status Solidi (a) 161 (1997) 493
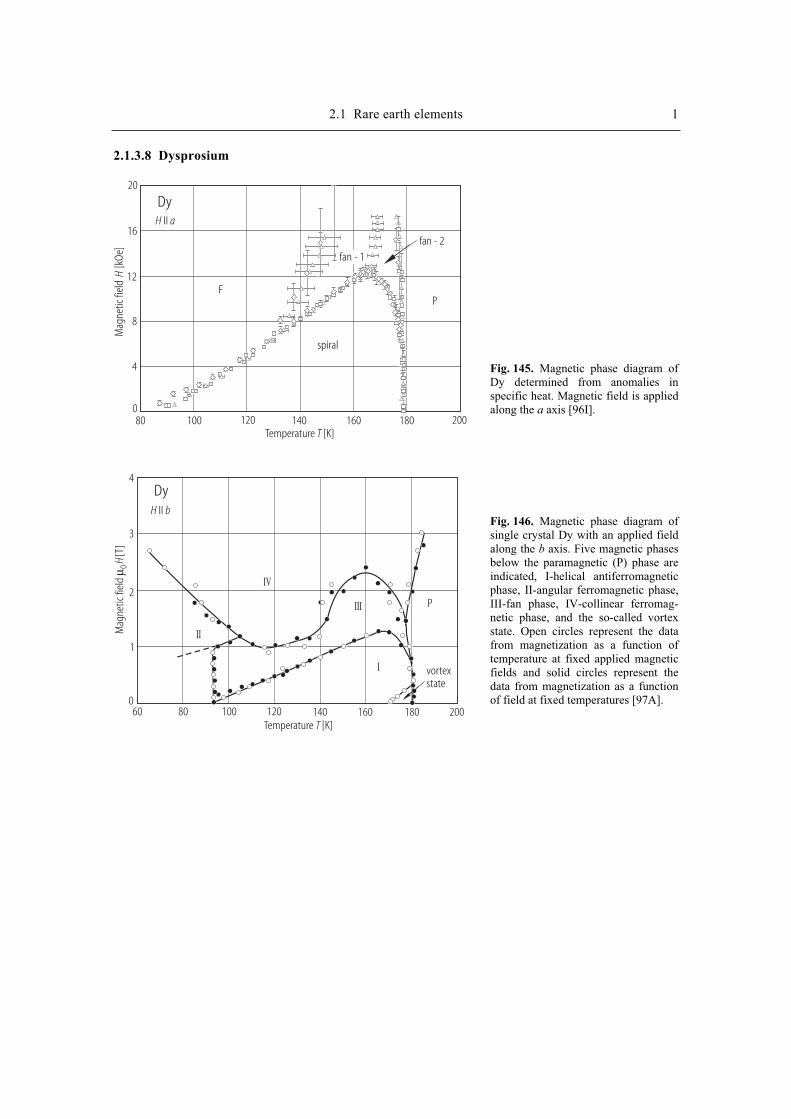
2.1 Rare earth elements 1
2.1.3.8 Dysprosium
Temperature [K]T
Mag
netic
fiel
d[k
Oe]
H
DyH aII
20
16
12
8
4
080 100 120 140 160 180 200
FP
spiral
fan - 2fan - 1
Temperature [K]T
Mag
netic
fiel
d[T
]µ 0
H
DyH bII
I
II
III
IV
P
vortexstate
60 80 100 120 140 160 180 200
4
3
2
1
0
Fig. 145. Magnetic phase diagram of Dy determined from anomalies in specific heat. Magnetic field is applied along the a axis [96I].
Fig. 146. Magnetic phase diagram of single crystal Dy with an applied field along the b axis. Five magnetic phases below the paramagnetic (P) phase are indicated, I-helical antiferromagnetic phase, II-angular ferromagnetic phase, III-fan phase, IV-collinear ferromag-netic phase, and the so-called vortex state. Open circles represent the data from magnetization as a function of temperature at fixed applied magnetic fields and solid circles represent the data from magnetization as a function of field at fixed temperatures [97A].
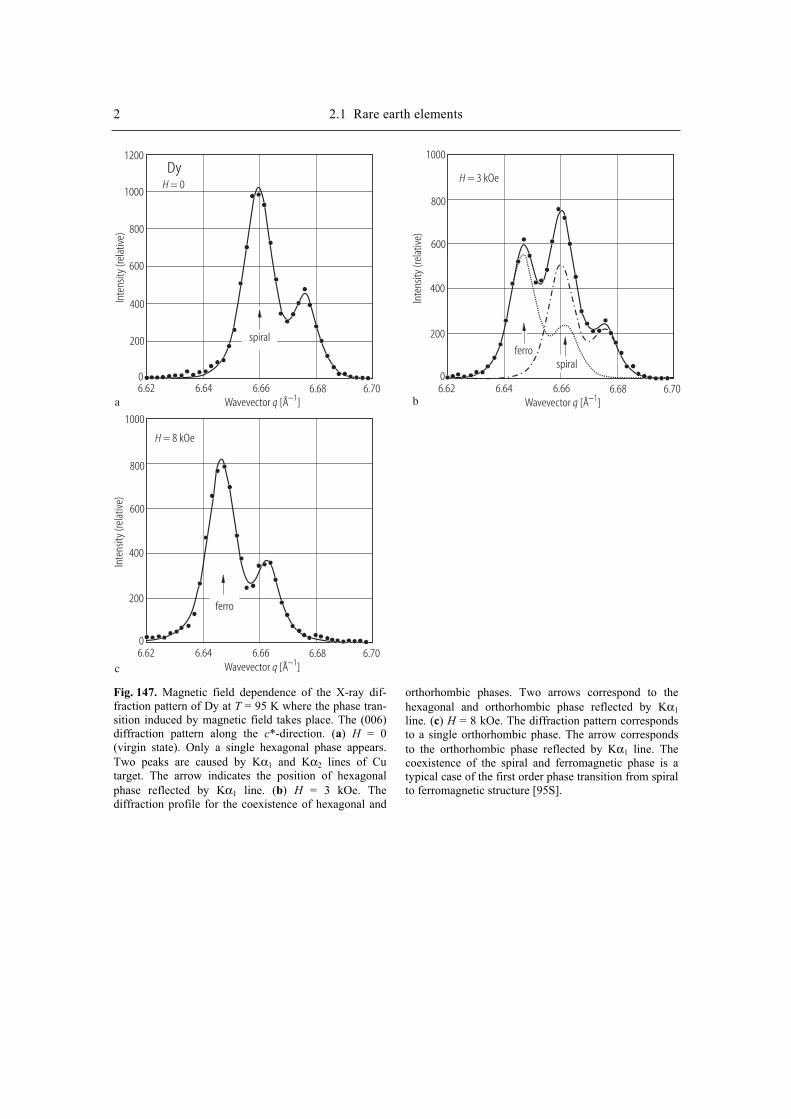
2 2.1 Rare earth elements In
tens
ity (r
elat
ive)
Inte
nsity
(rel
ativ
e)
Inte
nsity
(rel
ativ
e)Wavevector [Å ]q −1
Wavevector [Å ]q −1
DyH = 0
H = 3 kOe
H = 8 kOe
1200
1000
1000
1000
800
800
800
600
600
600
400
400
400
200
200
200
0
0
06.62
6.62
6.64
6.64
6.66
6.66
6.68
6.68
6.70
6.70
spiral
Wavevector [Å ]q −16.62 6.64 6.66 6.68 6.70
ferro
ferro
spiral
a b
c
Fig. 147. Magnetic field dependence of the X-ray dif-fraction pattern of Dy at T = 95 K where the phase tran-sition induced by magnetic field takes place. The (006) diffraction pattern along the c*-direction. (a) H = 0 (virgin state). Only a single hexagonal phase appears. Two peaks are caused by Kα1 and Kα2 lines of Cu target. The arrow indicates the position of hexagonal phase reflected by Kα1 line. (b) H = 3 kOe. The diffraction profile for the coexistence of hexagonal and
orthorhombic phases. Two arrows correspond to the hexagonal and orthorhombic phase reflected by Kα1
line. (c) H = 8 kOe. The diffraction pattern corresponds to a single orthorhombic phase. The arrow corresponds to the orthorhombic phase reflected by Kα1 line. The coexistence of the spiral and ferromagnetic phase is a typical case of the first order phase transition from spiral to ferromagnetic structure [95S].
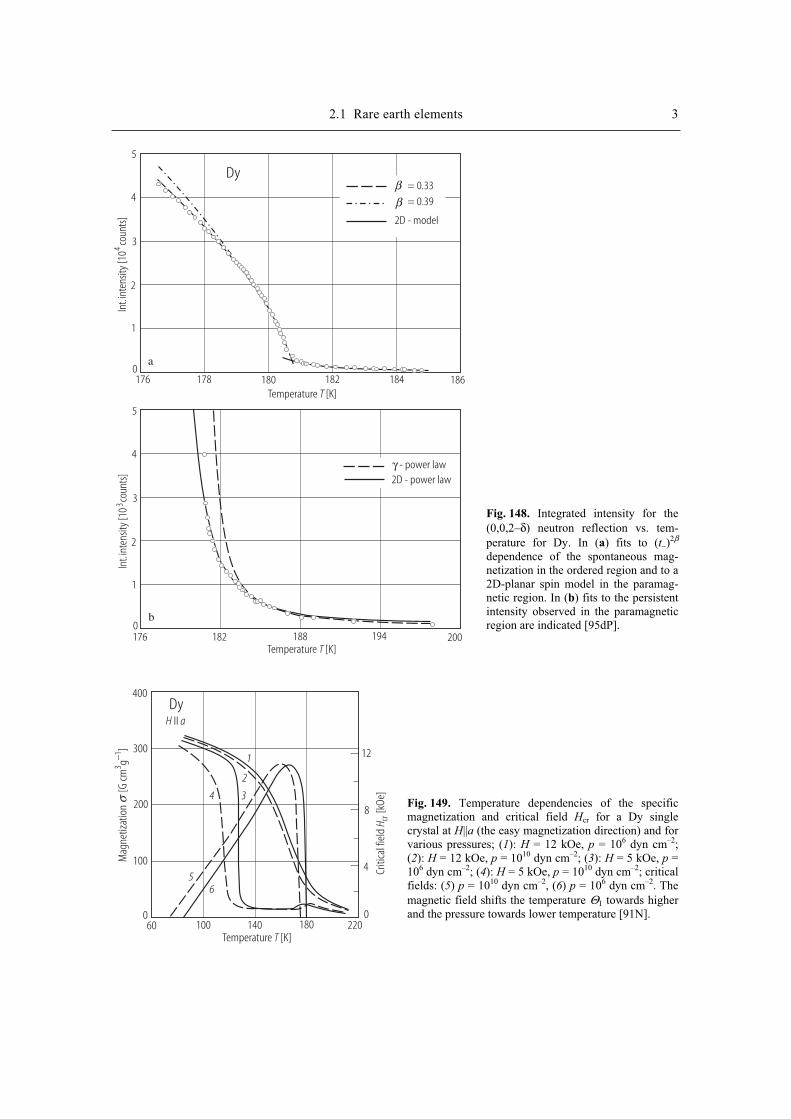
2.1 Rare earth elements 3
Temperature [K]T
Temperature [K]T
Dy5
5
4
4
3
3
2
2
1
1
0
0
176
176
178
182
180
188
182 184
194
186
200
ββ
= 0.33
= 0.39
2D - model
Int.i
nten
sity [
10co
unts
]4
Int. i
nten
sity [
10co
unts
]3
a
b
γ - power law2D - power law
Mag
netiz
atio
n
[G cm
g]
31−
σ
Temperature [K]T
Dy
Criti
cal f
ield
[kOe
]H cr
H aII
400
300
200
100
0
12
8
4
0100 140 180 22060
1
2
34
56
Fig. 148. Integrated intensity for the (0,0,2–δ) neutron reflection vs. tem-perature for Dy. In (a) fits to (t−)2β
dependence of the spontaneous mag-netization in the ordered region and to a 2D-planar spin model in the paramag-netic region. In (b) fits to the persistent intensity observed in the paramagnetic region are indicated [95dP].
Fig. 149. Temperature dependencies of the specific magnetization and critical field Hcr for a Dy single crystal at H||a (the easy magnetization direction) and for various pressures; (1): H = 12 kOe, p = 106 dyn cm–2;(2): H = 12 kOe, p = 1010 dyn cm–2; (3): H = 5 kOe, p = 106 dyn cm–2; (4): H = 5 kOe, p = 1010 dyn cm–2; critical fields: (5) p = 1010 dyn cm–2, (6) p = 106 dyn cm–2. The magnetic field shifts the temperature Θ1 towards higher and the pressure towards lower temperature [91N].
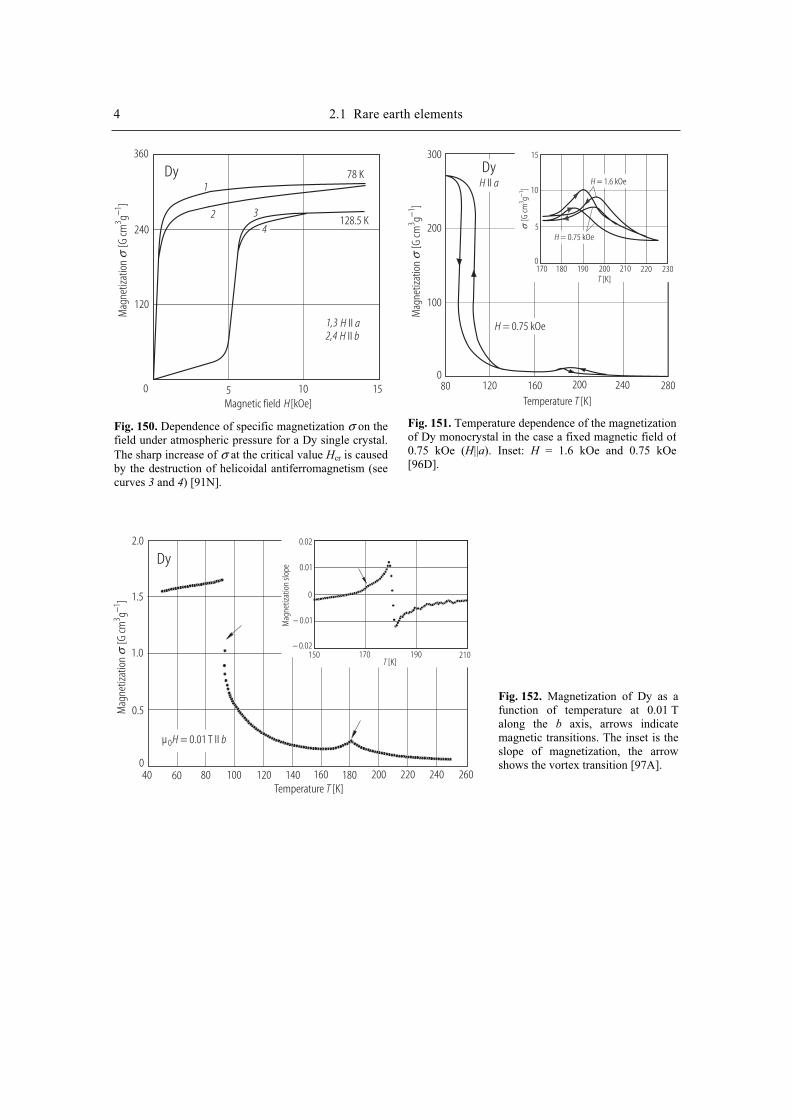
4 2.1 Rare earth elements M
agne
tizat
ion
[G
cmg
]3
1−σ
Magnetic field [kOe]H
Dy360
240
120
0 5 10 15
78 K
128.5 K
1
2 3
H aIIH bII
1,32,4
4
Fig. 150. Dependence of specific magnetization σ on the field under atmospheric pressure for a Dy single crystal.The sharp increase of σ at the critical value Hcr is caused by the destruction of helicoidal antiferromagnetism (seecurves 3 and 4) [91N].
Mag
netiz
atio
n
[G cm
g]
31−
σ
[G cm
g]
31−
σ
Temperature [K]T
[K]T
300
200
100
080 120 160 200 240 280
H = 0.75 kOe
15
10
5
0180 200 220190170 210 230
H aIIDy
H = 1.6 kOe
H = 0.75 kOe
Fig. 151. Temperature dependence of the magnetizationof Dy monocrystal in the case a fixed magnetic field of0.75 kOe (H||a). Inset: H = 1.6 kOe and 0.75 kOe [96D].
Mag
netiz
atio
n
[G cm
g]
31−
σ
Temperature [K]T
[K]T
Dy2.0
1.5
1.0
0.5
040 60 80 100 120 140 160 180 200 220 240 260
µ = 0.01 T II0H b
0.02
0.01
0
− 0.01
− 0.02150 170 190 210
Mag
netiz
atio
n slo
pe
Fig. 152. Magnetization of Dy as a function of temperature at 0.01 T along the b axis, arrows indicate magnetic transitions. The inset is the slope of magnetization, the arrow shows the vortex transition [97A].

2.1 Rare earth elements 5 M
agne
tizat
ion
σ
Temperature [K]T
Dy
40 60 80 100 120 140 160 180 200 220 240 260
µ = 0.3 T0H
2.1 T
1.5 T
0.9 T
H bII
Mag
netiz
atio
n
[G cm
g]
31−
σ
Magnetic field [kOe]H
Dy180
150
120
90
60
30
0 10 20 30 40 50
T = 100 K120140
165 K
Fig. 153. Magnetization of Dy as a function of temperatures at µ0H = 0.3, 0.9, 1.5, and 2.1 T along the b axis, arrows indicate magnetic transitions 97A].
Fig. 154. Magnetization of Dy as a function of field along the b axis at T = 100, 120, 140, and 165 K, arrows indicate magnetic transitions [97A].
6 2.1 Rare earth elements
Temperature [K]T Temperature [K]T
Susc
eptib
ility
[rela
tive]
acχ
Susc
eptib
ility
[rela
tive]
acχ
DyH bII
H cII
1.0 1.0
0 0
0.2 0.2
0.4 0.4
0.6 0.6
0.8 0.8
0 0200 20040 4080 80120 120160 160
a b
160 165 170 170160
Fig. 155. Alternate-current susceptibility (χac arbitrary units) of single-crystal Dy along the b (a) and c axis (b).TC, TN and the anomalies near 6.5 and 167 K are shown by arrows. The insets show the anomalies near 167 K.
The anomaly is most likely due to the so-called "vortex state" of Dy what means that the long-range order associated with the antiferromagnetic state has not fully developed [91W2].
Temperature [K]T Temperature [K]T
DyH bII
H cII
a b
Mag
netiz
atio
n
[G cm
g]
31−
σ
Mag
netiz
atio
n
[10
G cm
g]
−−
43
1σ
0.12
0.10
0.08
0.06
0.042 23 34 45 5
10.0
9.8
9.6
9.4
Fig. 157. Magnetization as a function of temperature along the b (a) and c axis (b) of single crystal Dy in an applied field (0.002 T). The anomalies in the magnet-
ization at T = 4.3 K and ac susceptibility at T = 6.5 K are due to a lifting of a component of the magnetic moment of Dy onto the c axis [91W2].
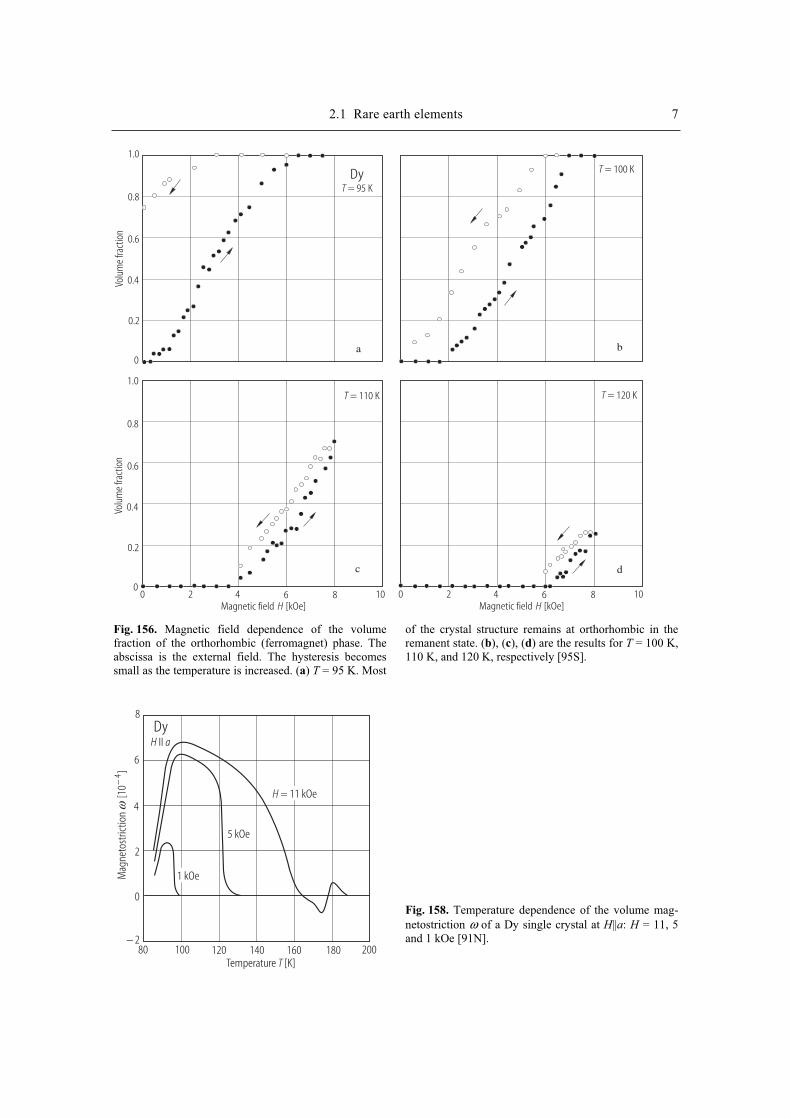
2.1 Rare earth elements 7
DyT = 95 K
T = 100 K
T = 110 K T = 120 K
Volu
me
fract
ion
1.0
0.8
0.6
0.4
0.2
0
Volu
me
fract
ion
1.0
0.8
0.6
0.4
0.2
0
Magnetic field [kOe]H0 2 4 6 8 10
Magnetic field [kOe]H0 2 4 6 8 10
a b
c d
Fig. 156. Magnetic field dependence of the volume fraction of the orthorhombic (ferromagnet) phase. The abscissa is the external field. The hysteresis becomes small as the temperature is increased. (a) T = 95 K. Most
of the crystal structure remains at orthorhombic in the remanent state. (b), (c), (d) are the results for T = 100 K, 110 K, and 120 K, respectively [95S].
Temperature [K]T
Dy
Mag
neto
stric
tion
[10
]−
4ω
H aII
8
6
4
2
0
− 280 100 120 140 160 180 200
H = 11 kOe
5 kOe
1 kOe
Fig. 158. Temperature dependence of the volume mag-netostriction ω of a Dy single crystal at H||a: H = 11, 5 and 1 kOe [91N].

8 2.1 Rare earth elements
Dy
Mag
neto
stric
tion
[10
]−
4ω
Magnetic field [kOe]H
7
6
5
4
3
2
1
0
− 10 2 4 6 8 10 12
H aIIT = 100 K
110120130
140
145150
155
160
170 K
Velo
city
[m s
]v 33
1−
Dy
Peak
inte
nsity
[10
coun
ts]
3At
tenu
atio
n[1
0dB
m]
332
1−α
Temperature [K]T
TN
TN
TN
6
4
2
0
2925
2910
2895
2880
20
15
10
5
0179 180 181 182 183
Fig. 159. Dependencies of volume magnetostriction ω on the magnetic field for a Dy single crystal at H||a [91N].
Fig. 160. Helical-paramagnetic phase tran-sition in Dy. Simultaneously measured ultrasonic velocity v33 and attenuation α33,and peak scattered neutron intensity vs. temperature for single-crystal Dy. The longitudinal ultrasonic wave was propa-gated along the c axis and neutrons probed the (0, 0.2 – δ) satellite. Open symbols indicate measurements taken during the cooling and closed symbols refer to the subsequent heating run [95dP].
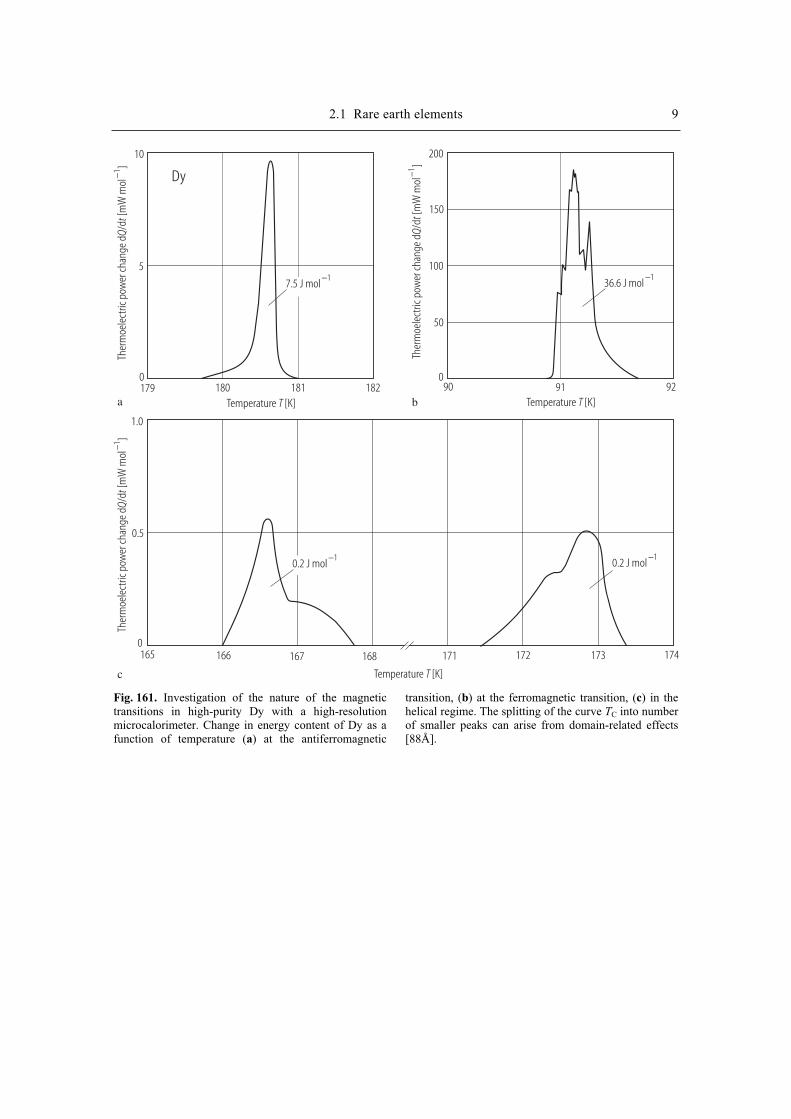
2.1 Rare earth elements 9
Temperature [K]T
Temperature [K]T
Temperature [K]T
Dy
Ther
moe
lect
ric p
ower
chan
ge d
/d[m
W m
ol]
Qt
−1Th
erm
oele
ctric
pow
er ch
ange
d/d
[mW
mol
]Q
t−1
Ther
moe
lect
ric p
ower
chan
ge d
/d[m
W m
ol]
Qt
−1
10
5
0179 180 181 182
7.5 J mol−1
0.2 J mol−1
36.6 J mol−1
200
150
100
50
090 91 92
1.0
0.5
0165 166 167 168 171 172 173 174
a b
c
0.2 J mol−1
Fig. 161. Investigation of the nature of the magnetic transitions in high-purity Dy with a high-resolution microcalorimeter. Change in energy content of Dy as a function of temperature (a) at the antiferromagnetic
transition, (b) at the ferromagnetic transition, (c) in the helical regime. The splitting of the curve TC into number of smaller peaks can arise from domain-related effects [88Å].
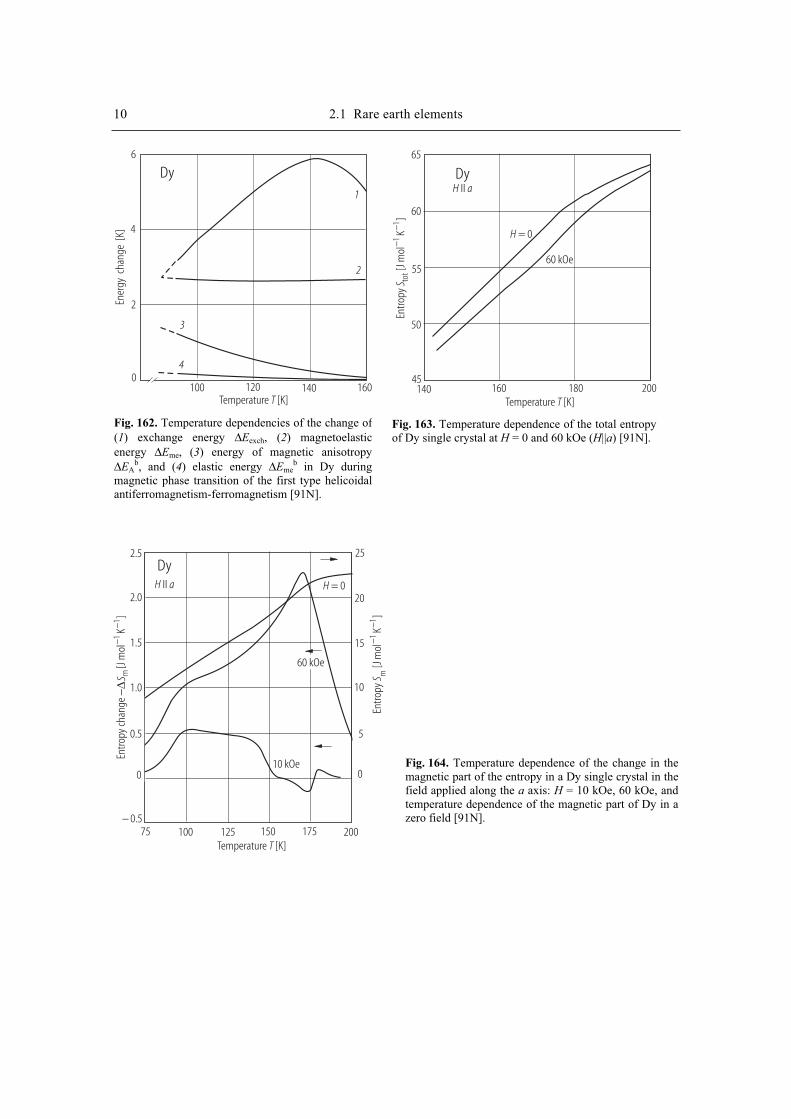
10 2.1 Rare earth elements
Temperature [K]T
Ener
gy c
hang
e [K
]
Dy6
4
2
0100 120 140 160
1
2
3
4
Fig. 162. Temperature dependencies of the change of(1) exchange energy ∆Eexch, (2) magnetoelastic energy ∆Eme, (3) energy of magnetic anisotropy ∆EA
b, and (4) elastic energy ∆Emeb in Dy during
magnetic phase transition of the first type helicoidal antiferromagnetism-ferromagnetism [91N].
Temperature [K]TEn
tropy
[J m
olK
]S to
t1
1−
−
65
60
55
50
45140 160 180 200
DyH aII
H = 0
60 kOe
Fig. 163. Temperature dependence of the total entropy of Dy single crystal at H = 0 and 60 kOe (H||a) [91N].
Temperature [K]T
Entro
py[J
mol
K]
S m1
1−
−
DyH aII
Entro
py ch
ange
[J m
olK
]−∆
S m1
1−
−
2.5
2.0
1.5
1.0
0.5
− 0.5
0
100 125 150 175 20075
20
15
10
5
0
25
H = 0
10 kOe
60 kOe
Fig. 164. Temperature dependence of the change in the magnetic part of the entropy in a Dy single crystal in the field applied along the a axis: H = 10 kOe, 60 kOe, and temperature dependence of the magnetic part of Dy in a zero field [91N].
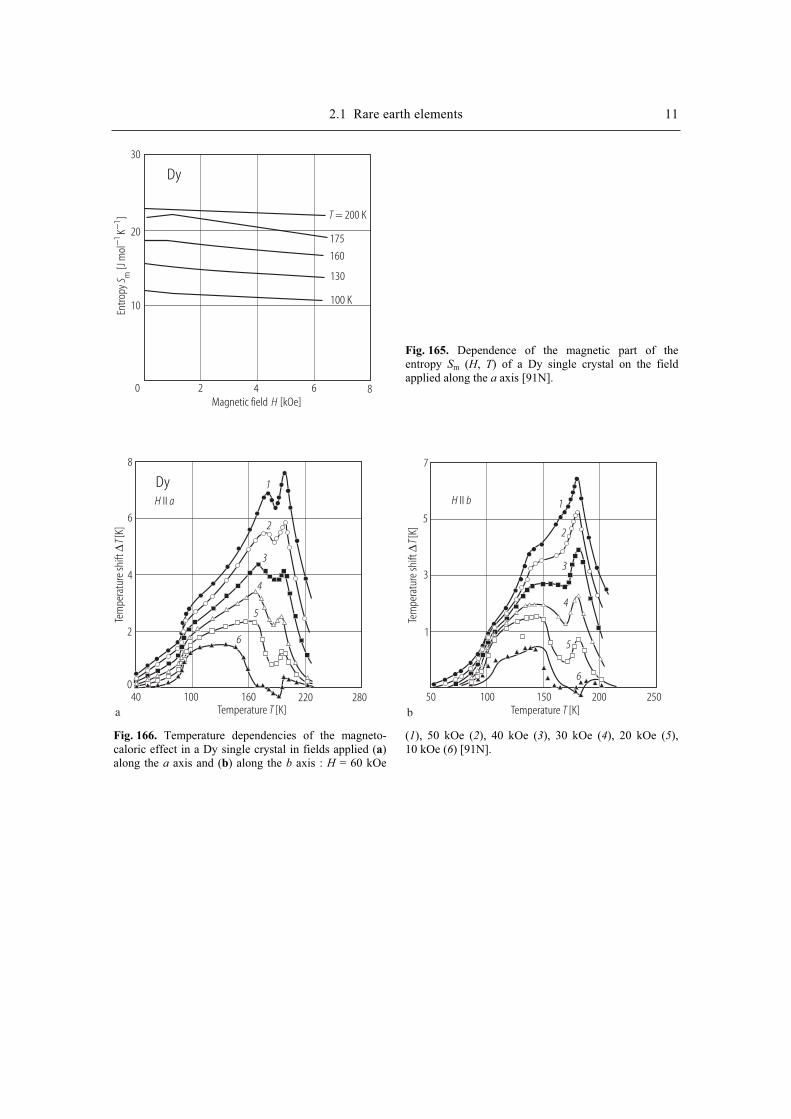
2.1 Rare earth elements 11
Magnetic field [kOe]H
Entro
py[J
mol
K]
S m1
1−
−
Dy30
20
10
0 2 4 6 8
T = 200 K
175
160
130
100 K
Temperature [K]T Temperature [K]T
Tem
pera
ture
shift
[K]
∆T
Tem
pera
ture
shift
[K]
∆T
DyH aII H bII
8
6
4
2
040 100 160 220 280
1
1
22
33
4
45
56
6
a
7
5
3
1
10050 150 200 250b
Fig. 166. Temperature dependencies of the magneto-caloric effect in a Dy single crystal in fields applied (a)along the a axis and (b) along the b axis : H = 60 kOe
(1), 50 kOe (2), 40 kOe (3), 30 kOe (4), 20 kOe (5), 10 kOe (6) [91N].
Fig. 165. Dependence of the magnetic part of the entropy Sm (H, T) of a Dy single crystal on the field applied along the a axis [91N].
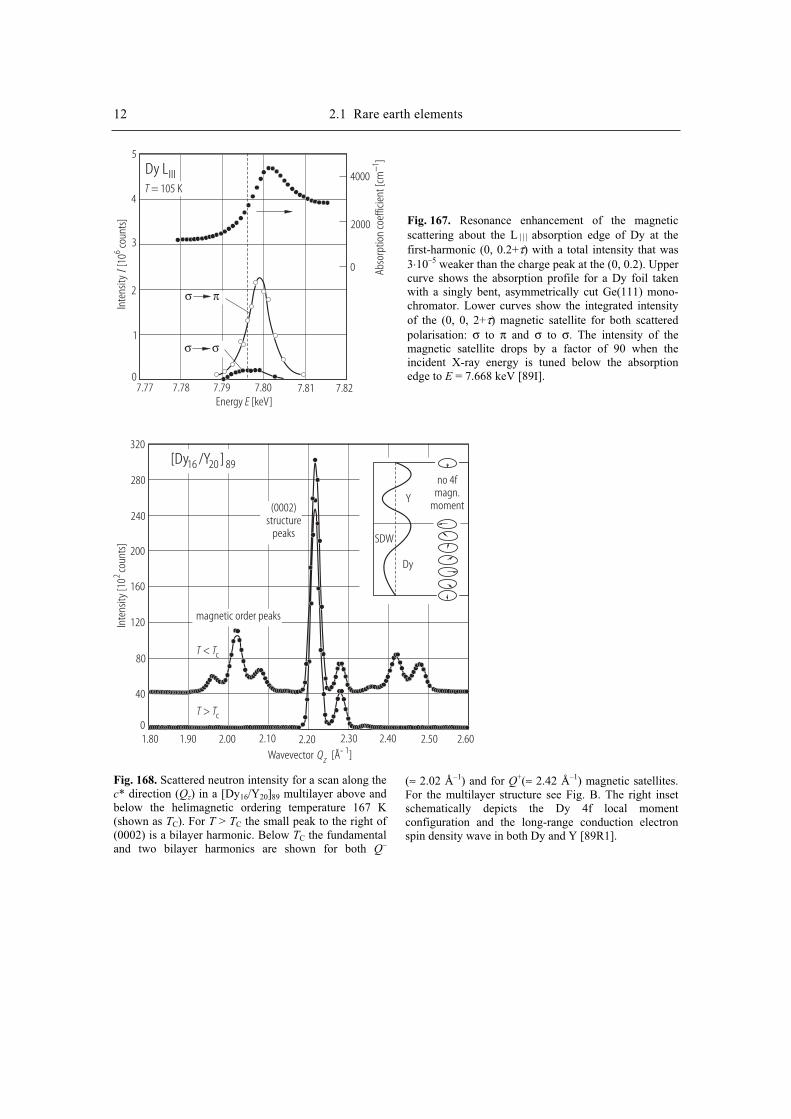
12 2.1 Rare earth elements
Energy [keV]E
IIn
tens
ity[1
0co
unts
]6
Dy LIIIT = 105 K
5
4
3
2
1
07.77 7.78 7.79 7.80 7.81 7.82
4000
2000
0 Abso
rptio
n co
effic
ient
[cm
]−1
σ σ
σ π
Wavevector [Å ]Qz- 1
Inte
nsity
[10
coun
ts]
2
1.80 1.90 2.00 2.10 2.20 2.30 2.40 2.50 2.60
[Dy /Y ]16 20 89
320
280
240
200
160
120
80
40
0
T T< c
T T> c
magnetic order peaks
(0002)structure
peaks
Y
Dy
SDW
no 4fmagn.
moment
Fig. 168. Scattered neutron intensity for a scan along the c* direction (Qz) in a [Dy16/Y20]89 multilayer above and below the helimagnetic ordering temperature 167 K (shown as TC). For T > TC the small peak to the right of (0002) is a bilayer harmonic. Below TC the fundamental and two bilayer harmonics are shown for both Q
–
(≈ 2.02 Å–1) and for Q+(≈ 2.42 Å–1) magnetic satellites. For the multilayer structure see Fig. B. The right inset schematically depicts the Dy 4f local moment configuration and the long-range conduction electron spin density wave in both Dy and Y [89R1].
Fig. 167. Resonance enhancement of the magnetic scattering about the L absorption edge of Dy at the first-harmonic (0, 0.2+τ) with a total intensity that was 3⋅10–5 weaker than the charge peak at the (0, 0.2). Upper curve shows the absorption profile for a Dy foil taken with a singly bent, asymmetrically cut Ge(111) mono-chromator. Lower curves show the integrated intensity of the (0, 0, 2+τ) magnetic satellite for both scattered polarisation: σ to π and σ to σ. The intensity of the magnetic satellite drops by a factor of 90 when the incident X-ray energy is tuned below the absorption edge to E = 7.668 keV [89I].
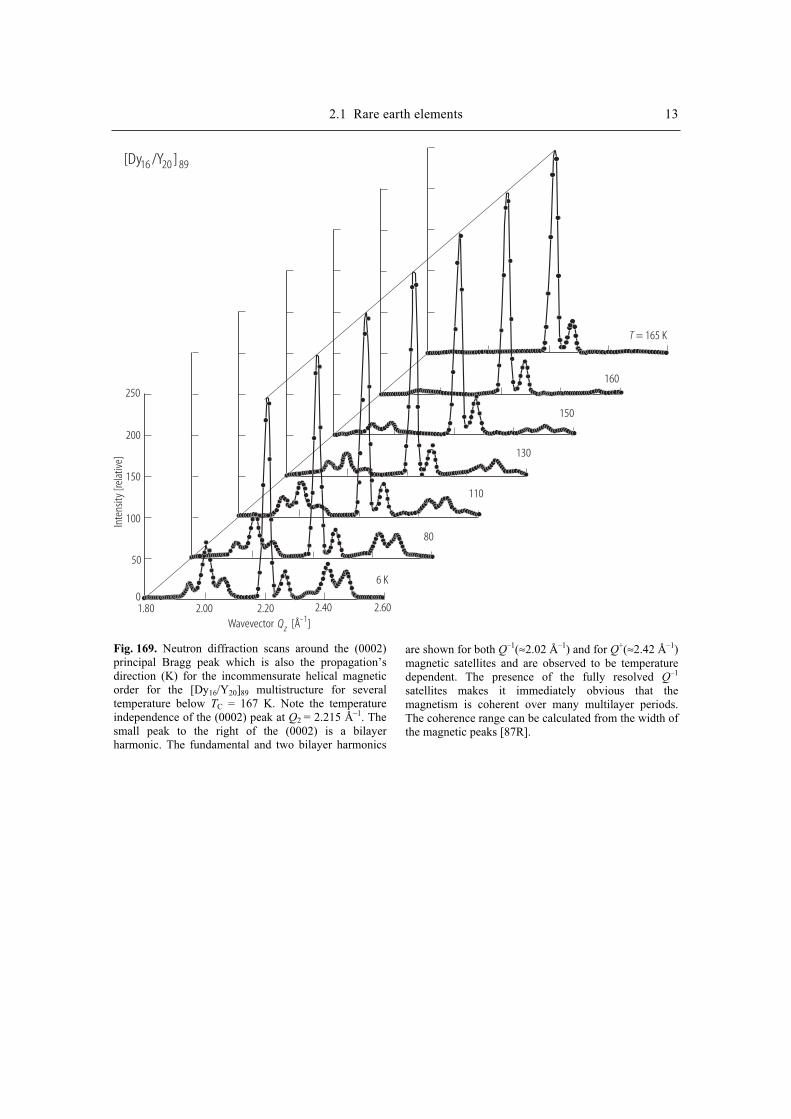
2.1 Rare earth elements 13 In
tens
ity [r
elat
ive]
[Dy /Y ]16 20 89
250
200
150
100
50
01.80 2.00 2.20 2.40 2.60
T = 165 K
160
150
130
110
80
6 K
Wavevector [Å ]Qz-1
Fig. 169. Neutron diffraction scans around the (0002) principal Bragg peak which is also the propagation’s direction (K) for the incommensurate helical magnetic order for the [Dy16/Y20]89 multistructure for several temperature below TC = 167 K. Note the temperature independence of the (0002) peak at Q2 = 2.215 Å–1. The small peak to the right of the (0002) is a bilayer harmonic. The fundamental and two bilayer harmonics
are shown for both Q–1(≈2.02 Å–1) and for Q+(≈2.42 Å–1)magnetic satellites and are observed to be temperature dependent. The presence of the fully resolved Q
–1
satellites makes it immediately obvious that the magnetism is coherent over many multilayer periods. The coherence range can be calculated from the width of the magnetic peaks [87R].
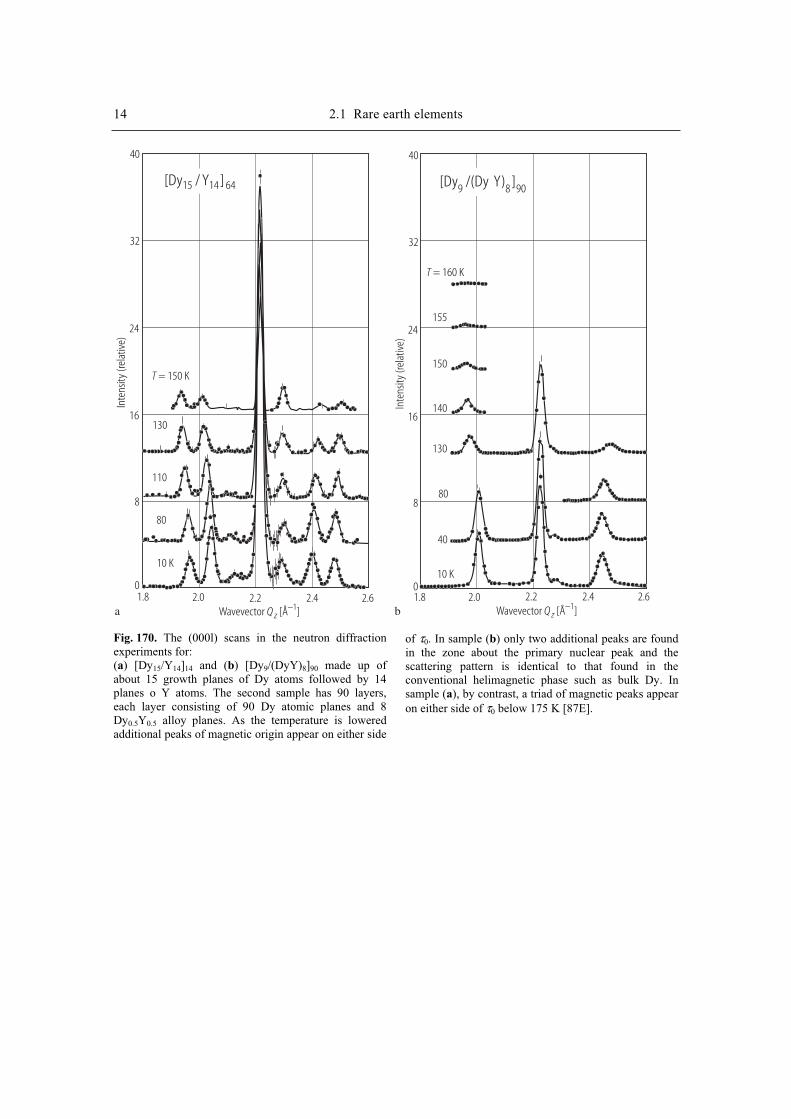
14 2.1 Rare earth elements In
tens
ity (r
elat
ive)
Inte
nsity
(rel
ativ
e)
T = 150 K
1.8 1.82.0 2.02.2 2.22.4 2.42.6 2.6Wavevector [Å ]Q −1
z Wavevector [Å ]Q −1z
T = 160 K
[Dy / Y ]15 14 64 [Dy /(Dy Y) ]9 8 90
130
110
80
10 K
40 40
32 32
24 24
16 16
8 8
0 0
155
150
140
130
80
40
10 K
a b
Fig. 170. The (000l) scans in the neutron diffraction experiments for: (a) [Dy15/Y14]14 and (b) [Dy9/(DyY)8]90 made up of about 15 growth planes of Dy atoms followed by 14 planes o Y atoms. The second sample has 90 layers, each layer consisting of 90 Dy atomic planes and 8 Dy0.5Y0.5 alloy planes. As the temperature is lowered additional peaks of magnetic origin appear on either side
of τ0. In sample (b) only two additional peaks are found in the zone about the primary nuclear peak and the scattering pattern is identical to that found in the conventional helimagnetic phase such as bulk Dy. In sample (a), by contrast, a triad of magnetic peaks appear on either side of τ0 below 175 K [87E].
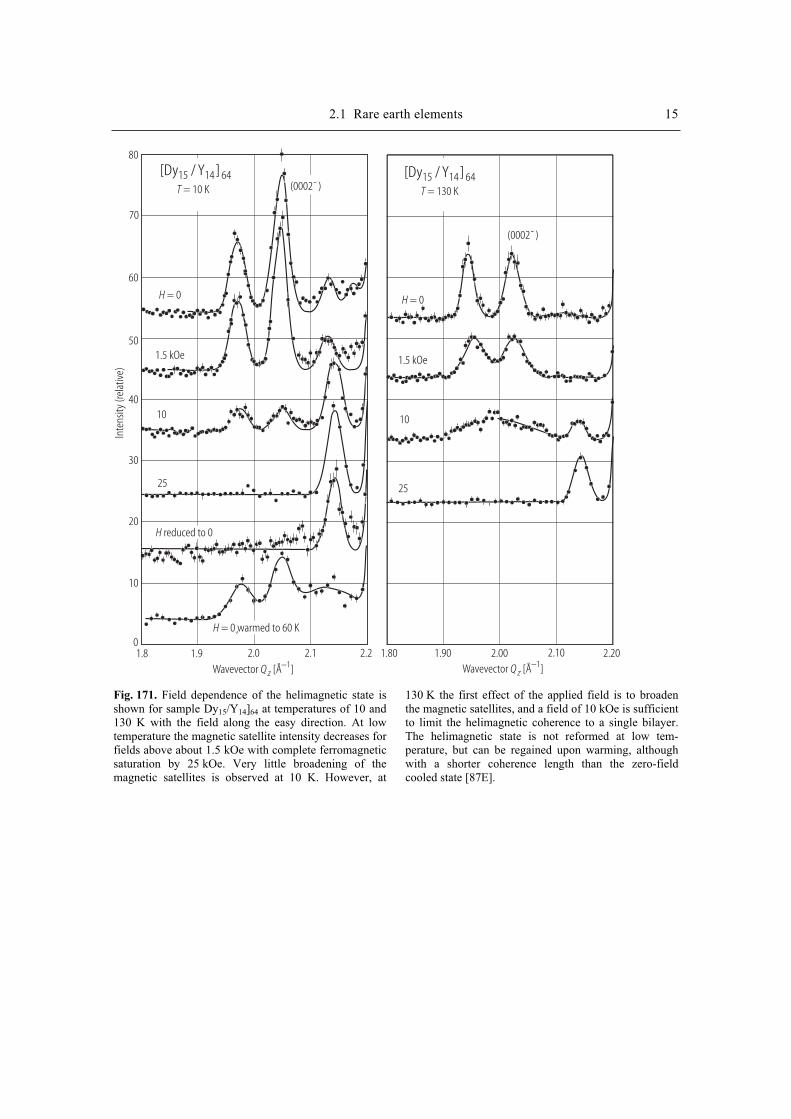
2.1 Rare earth elements 15 In
tens
ity (r
elat
ive)
[Dy / Y ]15 14 64T = 10 K
80
70
60
50
40
30
20
10
01.8 1.9 2.0 2.1 2.2
Wavevector [Å ]Q −1z Wavevector [Å ]Q −1
z
(0002- )
(0002- )
H = 0 H = 0
1.5 kOe 1.5 kOe
10 10
25 25
H reduced to 0
H = 0 warmed to 60 K
[Dy / Y ]15 14 64T = 130 K
1.80 1.90 2.00 2.10 2.20
,
Fig. 171. Field dependence of the helimagnetic state is shown for sample Dy15/Y14]64 at temperatures of 10 and 130 K with the field along the easy direction. At low temperature the magnetic satellite intensity decreases for fields above about 1.5 kOe with complete ferromagnetic saturation by 25 kOe. Very little broadening of the magnetic satellites is observed at 10 K. However, at
130 K the first effect of the applied field is to broaden the magnetic satellites, and a field of 10 kOe is sufficient to limit the helimagnetic coherence to a single bilayer. The helimagnetic state is not reformed at low tem-perature, but can be regained upon warming, although with a shorter coherence length than the zero-field cooled state [87E].

16 2.1 Rare earth elements In
tens
ity (r
elat
ive)
[Dy /Y ]16 9 100
Wavevector [Å ]QZ−1
240
180
120
60
02.10 2.20 2.30 2.40
H = 0
1 kOe
3
5
10
18 kOe
a
Inte
nsity
(rel
ativ
e)
Wavevector [Å ]QZ−1
240
180
120
60
02.10 2.20 2.30 2.40
H = 0
T = 130 K
T = 40 K
3kOe
5
10
18
25
40kOe
b
Fig. 172. (a) Nuclear peak intensity for a [Dy16/Y9]100
multilayer at 40 K as a function of applied field showing the added ferromagnetic component arising from the gradual elimination of the helical incommen-surate phase order. (b) Similar nuclear peak scans as a function of field at 130 K [89R].
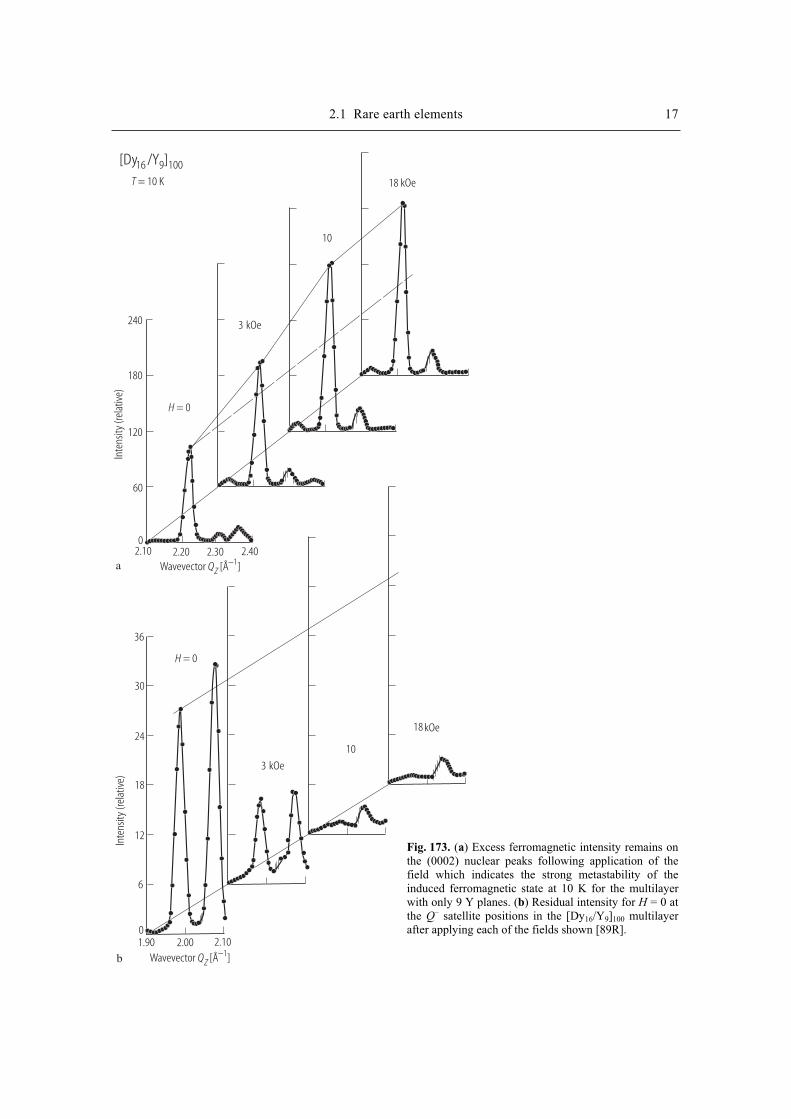
2.1 Rare earth elements 17 In
tens
ity (r
elat
ive)
[Dy /Y ]16 9 100
Wavevector [Å ]QZ−1
240
180
120
60
02.10 2.20 2.30 2.40
H = 0
kOe3
10
18 kOe
a
Inte
nsity
(rel
ativ
e)
Wavevector [Å ]QZ−1
01.90 2.00 2.10
H = 0
T = 10 K
3 kOe
10
18 kOe
b
36
30
24
18
12
6
Fig. 173. (a) Excess ferromagnetic intensity remains on the (0002) nuclear peaks following application of the field which indicates the strong metastability of the induced ferromagnetic state at 10 K for the multilayer with only 9 Y planes. (b) Residual intensity for H = 0 at the Q
– satellite positions in the [Dy16/Y9]100 multilayer after applying each of the fields shown [89R].
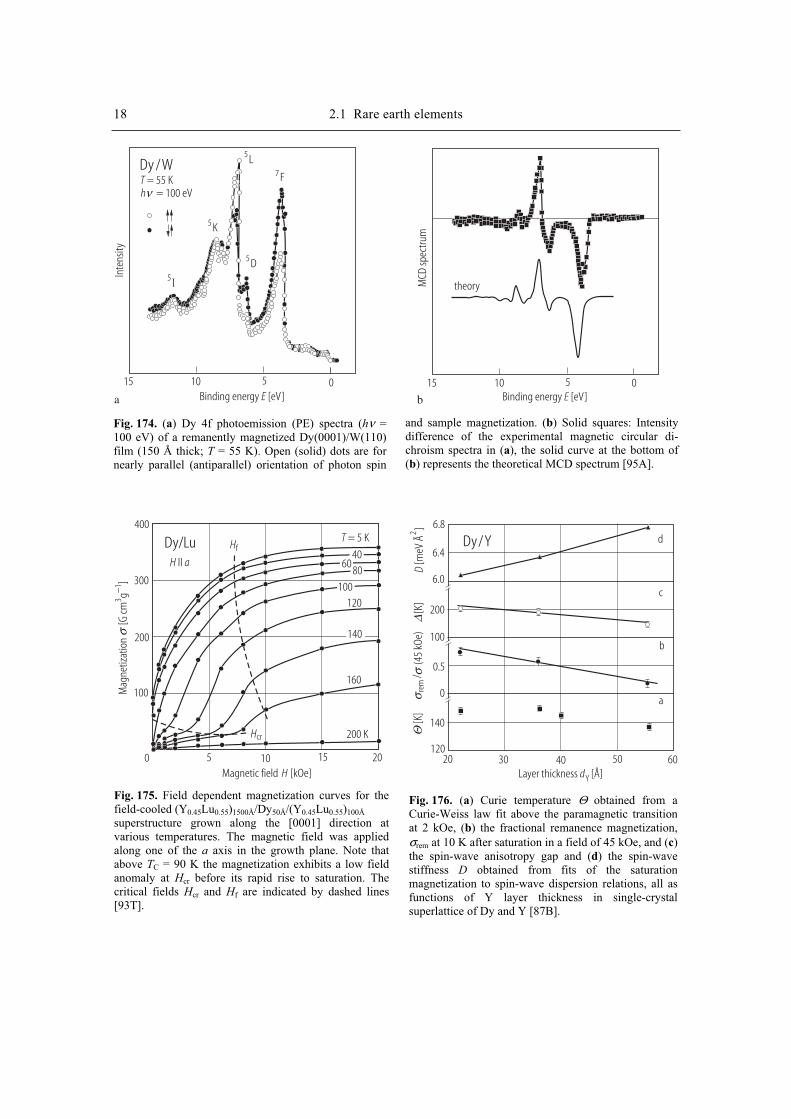
18 2.1 Rare earth elements
Binding energy [eV]E Binding energy [eV]E
Dy /WT = 55 Kh = 100 eVν
Inte
nsity
I
K
L
D
F
5
5
5
5
7
0 01010 1515
a b
MCD
spec
trum
theory
55
Fig. 174. (a) Dy 4f photoemission (PE) spectra (hν = 100 eV) of a remanently magnetized Dy(0001)/W(110) film (150 Å thick; T = 55 K). Open (solid) dots are for nearly parallel (antiparallel) orientation of photon spin
and sample magnetization. (b) Solid squares: Intensity difference of the experimental magnetic circular di-chroism spectra in (a), the solid curve at the bottom of (b) represents the theoretical MCD spectrum [95A].
Mag
netiz
atio
n
[G cm
g]
31−
σ
Magnetic field [kOe]H
Dy/LuH aII
HfT = 5 K
Hcr
400
300
200
100
0 5 10 15 20
120
160
200 K
4060
80
100
140
Fig. 175. Field dependent magnetization curves for thefield-cooled (Y0.45Lu0.55)1500Å/Dy50Å/(Y0.45Lu0.55)100Å
superstructure grown along the [0001] direction atvarious temperatures. The magnetic field was appliedalong one of the a axis in the growth plane. Note thatabove TC = 90 K the magnetization exhibits a low fieldanomaly at Hcr before its rapid rise to saturation. Thecritical fields Hcr and Hf are indicated by dashed lines [93T].
Layer thickness [Å]dY
Dy/Y
30 40 50 6020
d
c
b
a
6.8
6.4
6.0
200
100
0.5
0
140
120
Θ[K
]σ
σre
m/
(45
kOe)
∆[K
]D
[meV
Å]2
Fig. 176. (a) Curie temperature Θ obtained from a Curie-Weiss law fit above the paramagnetic transitionat 2 kOe, (b) the fractional remanence magnetization, σrem at 10 K after saturation in a field of 45 kOe, and (c)the spin-wave anisotropy gap and (d) the spin-wave stiffness D obtained from fits of the saturationmagnetization to spin-wave dispersion relations, all as functions of Y layer thickness in single-crystal superlattice of Dy and Y [87B].
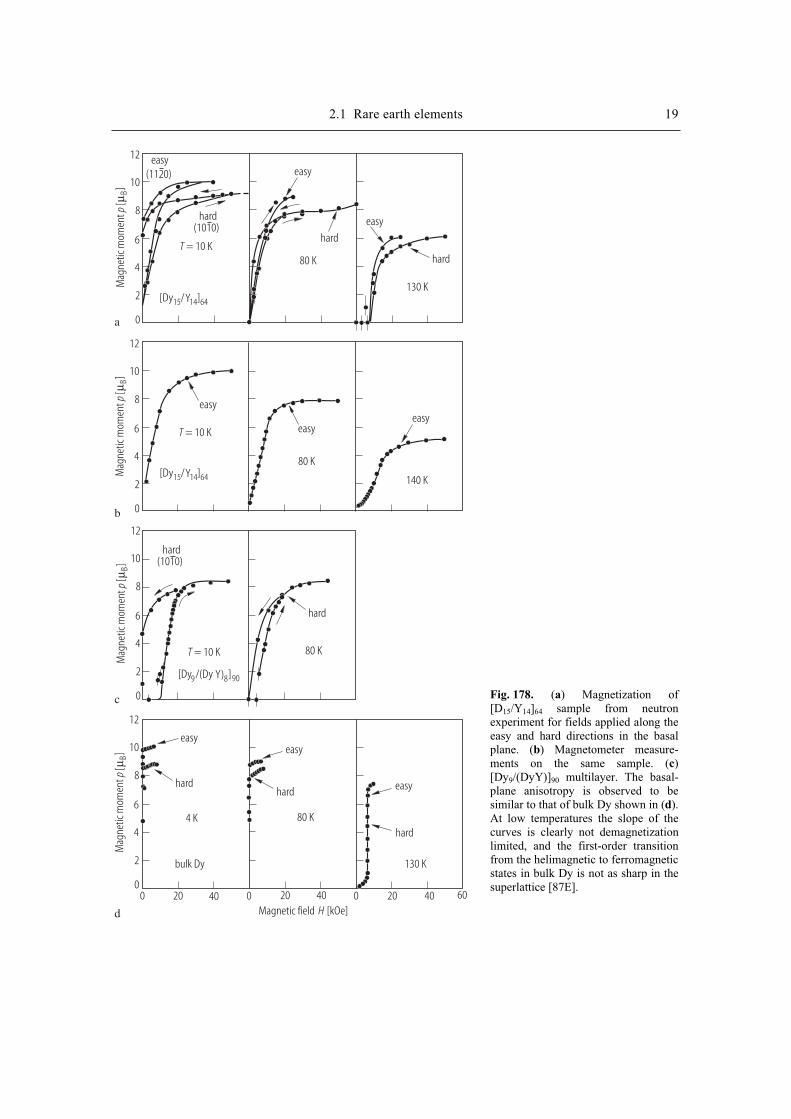
2.1 Rare earth elements 19
Magnetic field [kOe]H
Mag
netic
mom
ent
[]
pµ B
Mag
netic
mom
ent
[]
pµ B
Mag
netic
mom
ent
[]
pµ B
Mag
netic
mom
ent
[]
pµ B
12
12
12
12
10
10
10
10
8
8
8
8
6
6
6
6
4
4
4
4
2
2
2
2
0
0
0
0
0 20 40 0 20 40 0 20 40 60
easy
hard
bulk Dy
4 K 80 K
130 K
easy
hard easy
hard
d
easyeasy
easy
(1120)
hard
hard
hard
hard(1010)
hard(1010)
T = 10 K
[Dy /Y ]15 14 64
[Dy /Y ]15 14 64
[Dy /(Dy Y) ]9 8 90
80 K
80 K
80 K
130 K
140 K
a
b
easy
easyeasy
T = 10 K
T = 10 K
c Fig. 178. (a) Magnetization of [D15/Y14]64 sample from neutron experiment for fields applied along the easy and hard directions in the basal plane. (b) Magnetometer measure-ments on the same sample. (c)[Dy9/(DyY)]90 multilayer. The basal-plane anisotropy is observed to be similar to that of bulk Dy shown in (d).At low temperatures the slope of the curves is clearly not demagnetization limited, and the first-order transition from the helimagnetic to ferromagnetic states in bulk Dy is not as sharp in the superlattice [87E].
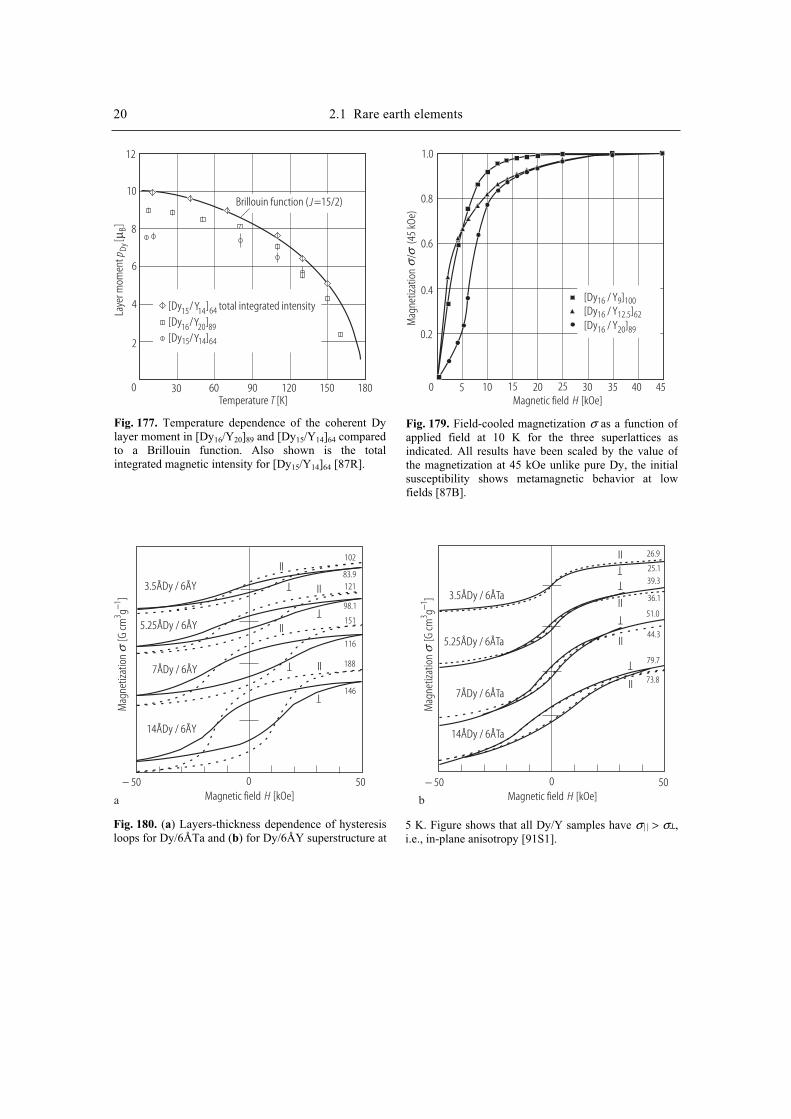
20 2.1 Rare earth elements
Temperature [K]T
Laye
r mom
ent
[]
p DyBµ
12
10
8
6
4
2
0 30 60 90 120 150 180
Brillouin function ( =15/2)J
[Dy / Y ] total integrated intensity15 14 64[Dy /Y ]16 20 89[Dy /Y ]15 14 64
Fig. 177. Temperature dependence of the coherent Dy layer moment in [Dy16/Y20]89 and [Dy15/Y14]64 compared to a Brillouin function. Also shown is the total integrated magnetic intensity for [Dy15/Y14]64 [87R].
Mag
netiz
atio
n
/ (
45 k
Oe)
σσ
Magnetic field [kOe]H0 5 10 15 20 25 30 35 40 45
[Dy / Y ]16 9 100[Dy / Y ]16 12.5 62[Dy / Y ]16 20 89
1.0
0.8
0.6
0.4
0.2
Fig. 179. Field-cooled magnetization σ as a function ofapplied field at 10 K for the three superlattices as indicated. All results have been scaled by the value ofthe magnetization at 45 kOe unlike pure Dy, the initial susceptibility shows metamagnetic behavior at low fields [87B].
Mag
netiz
atio
n
[G cm
g]
31−
σ
Mag
netiz
atio
n
[G cm
g]
31−
σ
Magnetic field [kOe]H Magnetic field [kOe]H0 050 50− 50 − 50
3.5ÅDy / 6ÅY3.5ÅDy / 6ÅTa
5.25ÅDy / 6ÅY
5.25ÅDy / 6ÅTa
7ÅDy / 6ÅY
7ÅDy / 6ÅTa
14ÅDy / 6ÅY 14ÅDy / 6ÅTa
IIII
T
T
IIII
T
T
II
II
T
T
II
II
T
T102
83.9121
98.1
151
116
188
146
26.9
25.1
39.3
36.1
51.0
44.3
79.7
73.8
a b
Fig. 180. (a) Layers-thickness dependence of hysteresis loops for Dy/6ÅTa and (b) for Dy/6ÅY superstructure at
5 K. Figure shows that all Dy/Y samples have σ > σ ,i.e., in-plane anisotropy [91S1].
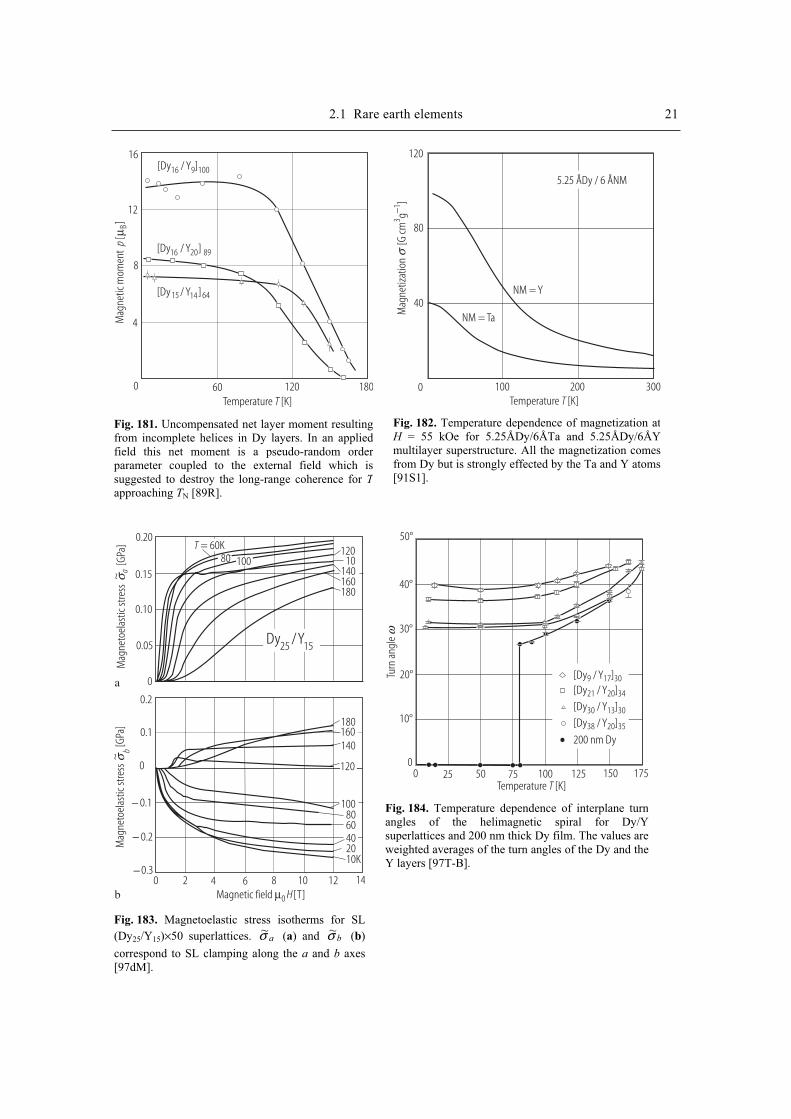
2.1 Rare earth elements 21
Temperature [K]T
Mag
netic
mom
ent
[]
pµ B
0 60 120 180
16
12
8
4
[Dy / Y ]16 9 100
[Dy / Y ]16 20 89
[Dy / Y ]15 14 64
Fig. 181. Uncompensated net layer moment resulting from incomplete helices in Dy layers. In an appliedfield this net moment is a pseudo-random orderparameter coupled to the external field which is suggested to destroy the long-range coherence for T
approaching TN [89R].
Mag
netiz
atio
n
[G cm
g]
31−
σTemperature [K]T
120
80
40
0 100 200 300
NM = Y
NM = Ta
5.25 ÅDy / 6 ÅNM
Fig. 182. Temperature dependence of magnetization atH = 55 kOe for 5.25ÅDy/6ÅTa and 5.25ÅDy/6ÅY multilayer superstructure. All the magnetization comes from Dy but is strongly effected by the Ta and Y atoms [91S1].
Magnetic field [T]µ0 H
Dy /Y25 15
0.20
0.15
0.10
0.05
0
0.1
0
− 0.1
− 0.2
− 0.3
12010
160180
180
140
8060
2010K
T = 60K80 100
140
160
100
40
120
Mag
neto
elas
tic st
ress
[GPa
]aσ~
Mag
neto
elas
tic st
ress
[GPa
]bσ~
0 2 4 6 8 10 12 14
0.2
a
b
Fig. 183. Magnetoelastic stress isotherms for SL
(Dy25/Y15)×50 superlattices. aσ~ (a) and bσ~ (b)
correspond to SL clamping along the a and b axes [97dM].
Temperature [K]T
Turn
ang
leω
50°
40°
30°
20°
10°
00 25 50 75 100 125 150 175
[Dy / Y ]9 17 30
[Dy / Y ]21 20 34
[Dy / Y ]30 13 30
[Dy / Y ]38 20 35
200 nm Dy
Fig. 184. Temperature dependence of interplane turnangles of the helimagnetic spiral for Dy/Y superlattices and 200 nm thick Dy film. The values are weighted averages of the turn angles of the Dy and the Y layers [97T-B].
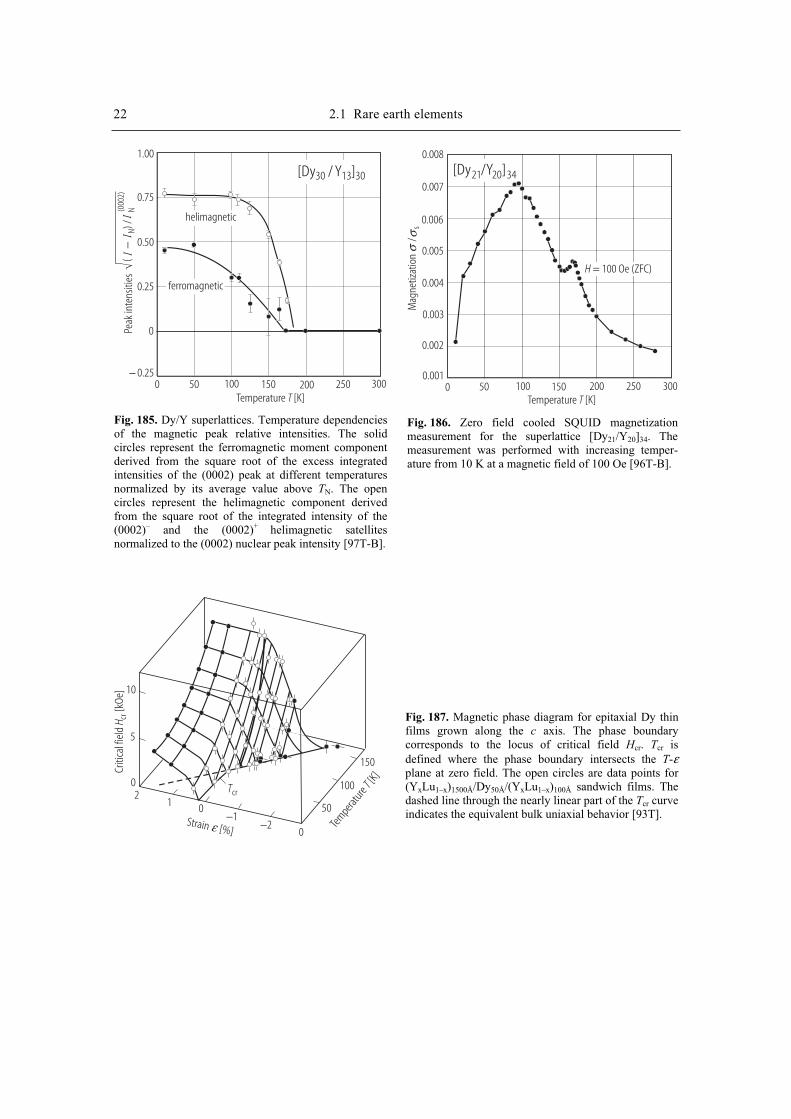
22 2.1 Rare earth elements
Temperature [K]T
1.00
0.75
0.50
0.25
0
− 0.250 50 100 150 200 250 300
helimagnetic
ferromagnetic
[Dy / Y ]30 13 30
Peak
inte
nsiti
es√
() /
−N
N(000
2)I
II
Fig. 185. Dy/Y superlattices. Temperature dependencies of the magnetic peak relative intensities. The solid circles represent the ferromagnetic moment component derived from the square root of the excess integratedintensities of the (0002) peak at different temperatures normalized by its average value above TN. The open circles represent the helimagnetic component derivedfrom the square root of the integrated intensity of the (0002)– and the (0002)+ helimagnetic satellites normalized to the (0002) nuclear peak intensity [97T-B].
Temperature [K]TM
agne
tizat
ion
/
sσ
σ
0.008
0.007
0.006
0.005
0.004
0.003
0.002
0.0010 50 100 150 200 250 300
H = 100 Oe (ZFC)
[Dy /Y ]21 20 34
Fig. 186. Zero field cooled SQUID magnetization measurement for the superlattice [Dy21/Y20]34. The measurement was performed with increasing temper-ature from 10 K at a magnetic field of 100 Oe [96T-B].
Tempera
ture[K]
T
Criti
cal f
ield
[kOe
]H cr
10
5
02
1 0−1
−20
50
100
150
Tcr
Strain [%]ε
Fig. 187. Magnetic phase diagram for epitaxial Dy thin films grown along the c axis. The phase boundary corresponds to the locus of critical field Hcr. Tcr is defined where the phase boundary intersects the T-εplane at zero field. The open circles are data points for (YxLu1–x)1500Å/Dy50Å/(YxLu1–x)100Å sandwich films. The dashed line through the nearly linear part of the Tcr curve indicates the equivalent bulk uniaxial behavior [93T].
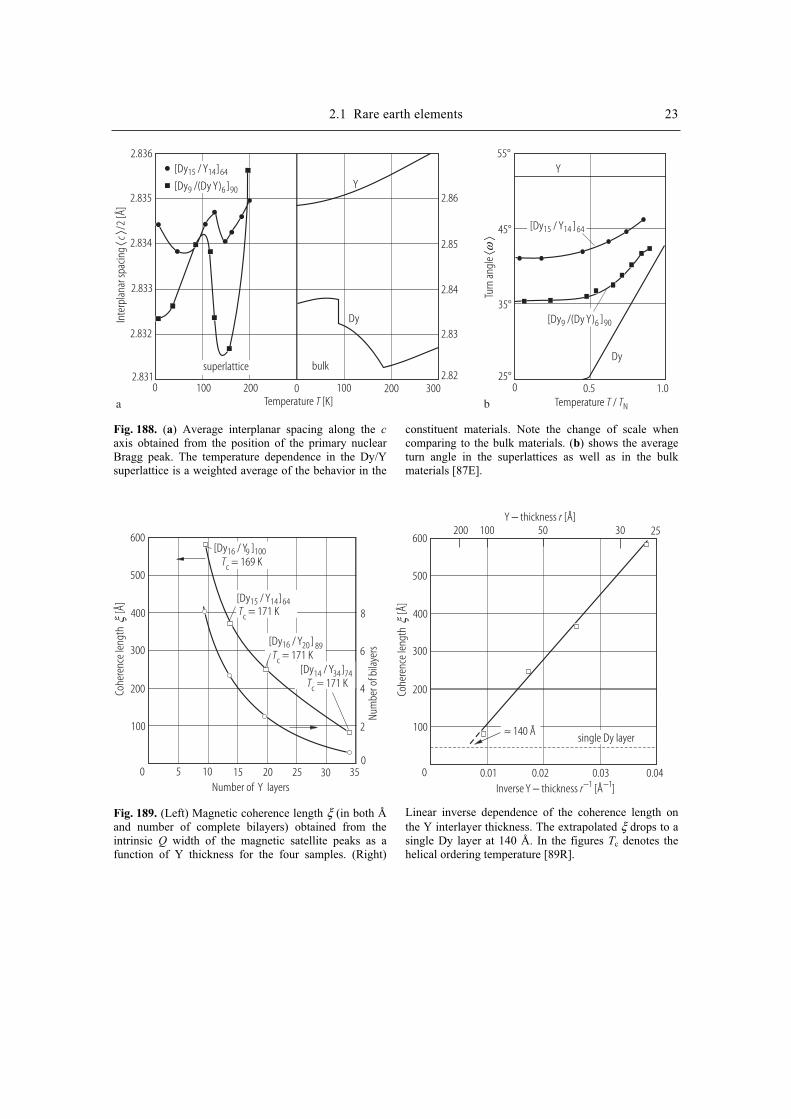
2.1 Rare earth elements 23
Temperature [K]T
Turn
ang
le⟨
⟩ω
2.836
2.835
2.834
2.833
2.832
2.8310 100 200 0 100 200 300
2.86
2.85
2.84
2.83
2.82bulk
Dy
Y[Dy / Y ]15 14 64
[Dy /(Dy Y) ]9 6 90
superlattice
Inte
rpla
nar s
pacin
g/2
[Å]
⟨⟩c
a
55°
45°
35°
25°
Y
Dy
0 0.5 1.0Temperature /T TNb
[Dy / Y ]15 14 64
[Dy /(Dy Y) ]9 6 90
Fig. 188. (a) Average interplanar spacing along the c
axis obtained from the position of the primary nuclear Bragg peak. The temperature dependence in the Dy/Y superlattice is a weighted average of the behavior in the
constituent materials. Note the change of scale when comparing to the bulk materials. (b) shows the average turn angle in the superlattices as well as in the bulk materials [87E].
600 600
500 500
400 400
300 300
200 200
100 100
0 05 10 15 20 25 30 35Number of Y layers
Cohe
renc
e le
ngth
[
Å]ξ
Cohe
renc
e le
ngth
[
Å]ξ8
6
4
2
0
Num
ber o
f bila
yers
0.01 0.02 0.03 0.04Inverse Y thickness [Å ]− r− −1 1
200 100 50 30 25Y thickness [Å]− r
single Dy layer≈ 140 Å
[Dy / Y ]15 14 64
[Dy / Y ]16 20 89
Tc = 169 K
Tc = 171 K
Tc = 171 K
Tc = 171 K
[Dy / Y ]16 9 100
[Dy / Y ]14 34 74
Fig. 189. (Left) Magnetic coherence length ξ (in both Å and number of complete bilayers) obtained from the intrinsic Q width of the magnetic satellite peaks as a function of Y thickness for the four samples. (Right)
Linear inverse dependence of the coherence length on the Y interlayer thickness. The extrapolated ξ drops to a single Dy layer at 140 Å. In the figures Tc denotes the helical ordering temperature [89R].
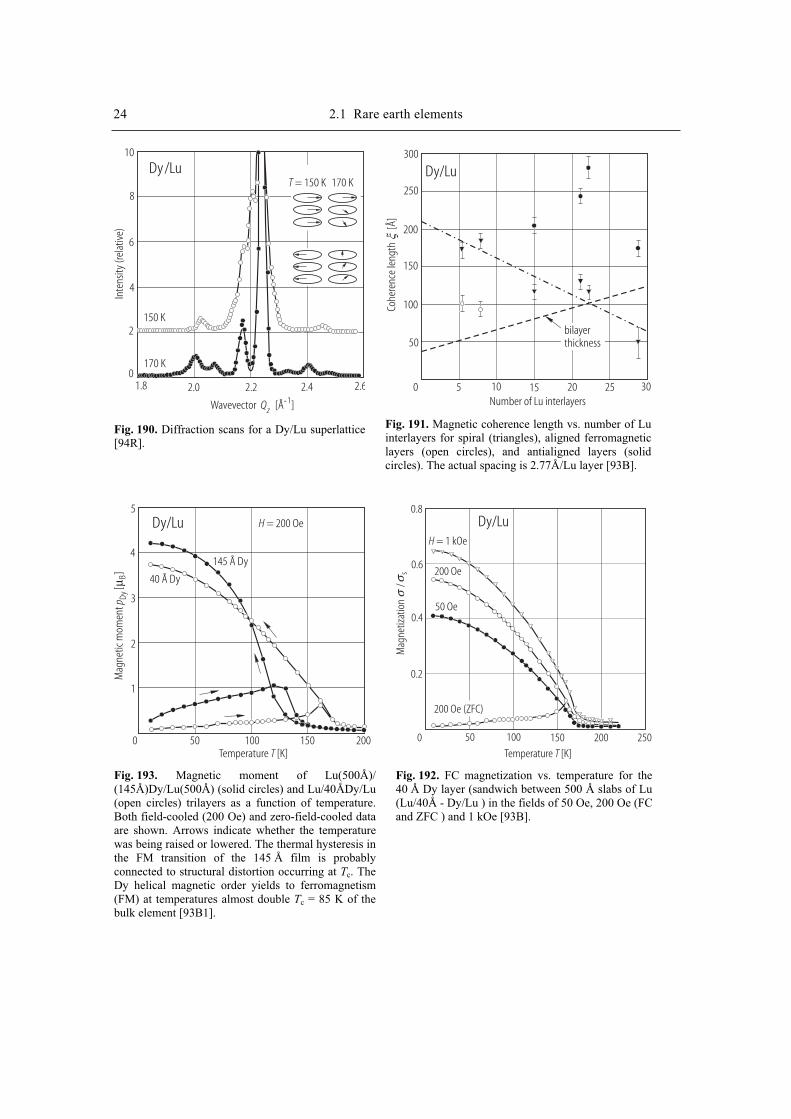
24 2.1 Rare earth elements In
tens
ity (r
elat
ive)
Wavevector [Å ]Q -1
Dy/Lu
z
1.8 2.0 2.2 2.4 2.6
T = 150 K 170 K
170 K
150 K
10
8
6
4
2
0
Fig. 190. Diffraction scans for a Dy/Lu superlattice[94R].
300
250
200
150
100
50
0 5 10 15 20 25 30Number of Lu interlayers
Cohe
renc
e le
ngth
[
Å]ξ
bilayerthickness
Dy/Lu
Fig. 191. Magnetic coherence length vs. number of Lu interlayers for spiral (triangles), aligned ferromagnetic layers (open circles), and antialigned layers (solidcircles). The actual spacing is 2.77Å/Lu layer [93B].
Temperature [K]T
Mag
netic
mom
ent
[]
p DyBµ
Dy/Lu5
4
3
2
1
0 50 100 150 200
40 Å Dy
145 Å Dy
H = 200 Oe
Fig. 193. Magnetic moment of Lu(500Å)/(145Å)Dy/Lu(500Å) (solid circles) and Lu/40ÅDy/Lu(open circles) trilayers as a function of temperature.Both field-cooled (200 Oe) and zero-field-cooled dataare shown. Arrows indicate whether the temperaturewas being raised or lowered. The thermal hysteresis inthe FM transition of the 145 Å film is probablyconnected to structural distortion occurring at Tc. The Dy helical magnetic order yields to ferromagnetism(FM) at temperatures almost double Tc = 85 K of thebulk element [93B1].
Temperature [K]T
Dy/Lu
Mag
netiz
atio
nσ
σ /s
0.8
0.6
0.4
0.2
0 50 100 150 200 250
H = 1 kOe
200 Oe
50 Oe
200 Oe (ZFC)
Fig. 192. FC magnetization vs. temperature for the 40 Å Dy layer (sandwich between 500 Å slabs of Lu (Lu/40Å - Dy/Lu ) in the fields of 50 Oe, 200 Oe (FC and ZFC ) and 1 kOe [93B].
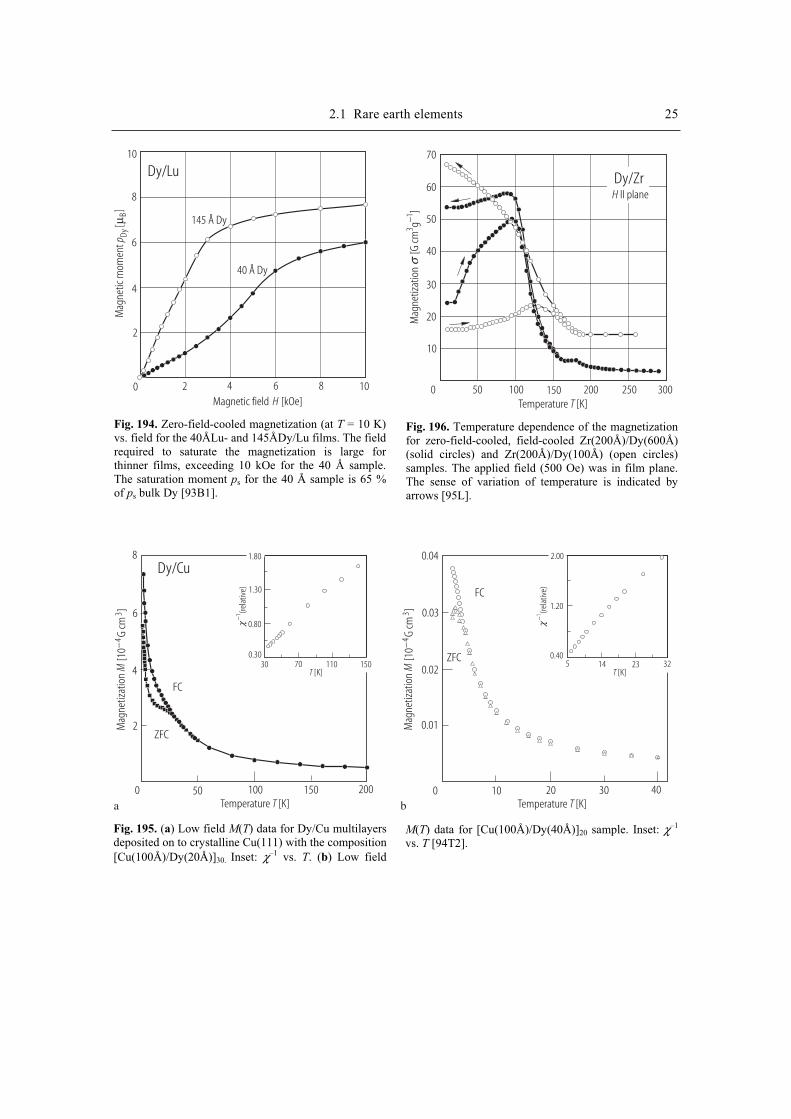
2.1 Rare earth elements 25 M
agne
tic m
omen
t[
]p Dy
Bµ
Dy/Lu
40 Å Dy
145 Å Dy
Magnetic field [kOe]H
10
8
6
4
2
0 2 4 6 8 10
Fig. 194. Zero-field-cooled magnetization (at T = 10 K) vs. field for the 40ÅLu- and 145ÅDy/Lu films. The fieldrequired to saturate the magnetization is large forthinner films, exceeding 10 kOe for the 40 Å sample. The saturation moment ps for the 40 Å sample is 65 % of ps bulk Dy [93B1].
Mag
netiz
atio
n
[G cm
g]
31−
σTemperature [K]T
70
60
50
40
30
20
10
0 50 100 150 200 250 300
Dy/ZrH II plane
Fig. 196. Temperature dependence of the magnetizationfor zero-field-cooled, field-cooled Zr(200Å)/Dy(600Å) (solid circles) and Zr(200Å)/Dy(100Å) (open circles) samples. The applied field (500 Oe) was in film plane. The sense of variation of temperature is indicated by arrows [95L].
Temperature [K]T Temperature [K]T
[K]T [K]T
χ−1
(rela
tive)
χ−1
(rela
tive)
Dy/Cu
Mag
netiz
atio
nM
[10
G cm
]−4
3
Mag
netiz
atio
nM
[10
G cm
]−4
3
8
4
6
2
0 100 20015050
1.80
1.30
0.80
0.3030 70 110 150
FC
FC
ZFC
ZFC
0.04
0.02
0 20 403010
0.03
0.01
2.00
1.20
0.405 14 23 32
a b
Fig. 195. (a) Low field M(T) data for Dy/Cu multilayers deposited on to crystalline Cu(111) with the composition [Cu(100Å)/Dy(20Å)]30. Inset: χ–1 vs. T. (b) Low field
M(T) data for [Cu(100Å)/Dy(40Å)]20 sample. Inset: χ–1
vs. T [94T2].

26 2.1 Rare earth elements M
agne
tizat
ion
[G
cmg
]3
1−σ
Mag
netiz
atio
n
[G cm
g]
31−
σTemperature [K]T Temperature [K]T
60
50
40
30
20
10
0 050 50100 100150 150200 200250 250300 300
TCbTCb
TNbTNb
H II planeZr 200 Å/Dy 600 Å
a b
140
120
100
80
60
40
20
Dy 20 Å/Zr 30 Å]40[
Fig. 197. (a) Temperature dependence of magnetization measured in the bilayer Zr(200Å)/Dy(600Å) and (b)[Dy(20Å)/Zr(30Å)]40 grown on Si(111) after previous
depositions of a 600Å-thick Zr buffer layer. Both samples were field-cooled. The magnetic field (500 Oe) was applied parallel to the layer plane [93L].
Mag
netiz
atio
n
[G cm
g]
31−
σ
H II planeDy 30 Å/Zr 30 Å]100[
Dy 15 Å/Zr 30 Å]50[
Dy 8 Å/Zr 30 Å]80[
Magnetic field [kOe]H
H II
H II
300
150
200
100
100
50
0
0
−100
−50
−200
−100
−300
−150
200150100
500
−50−100
−150−200
−50 −25 0 25 50
H plane
T
H
T
H
T
Fig. 198. Hysteresis loops measured at 10 K in multi-layers [Dy(xÅ)/Zr(30Å)]n (x = 30, 15 and 8), for applied fields parallel and perpendicular to the layer plane [93L].
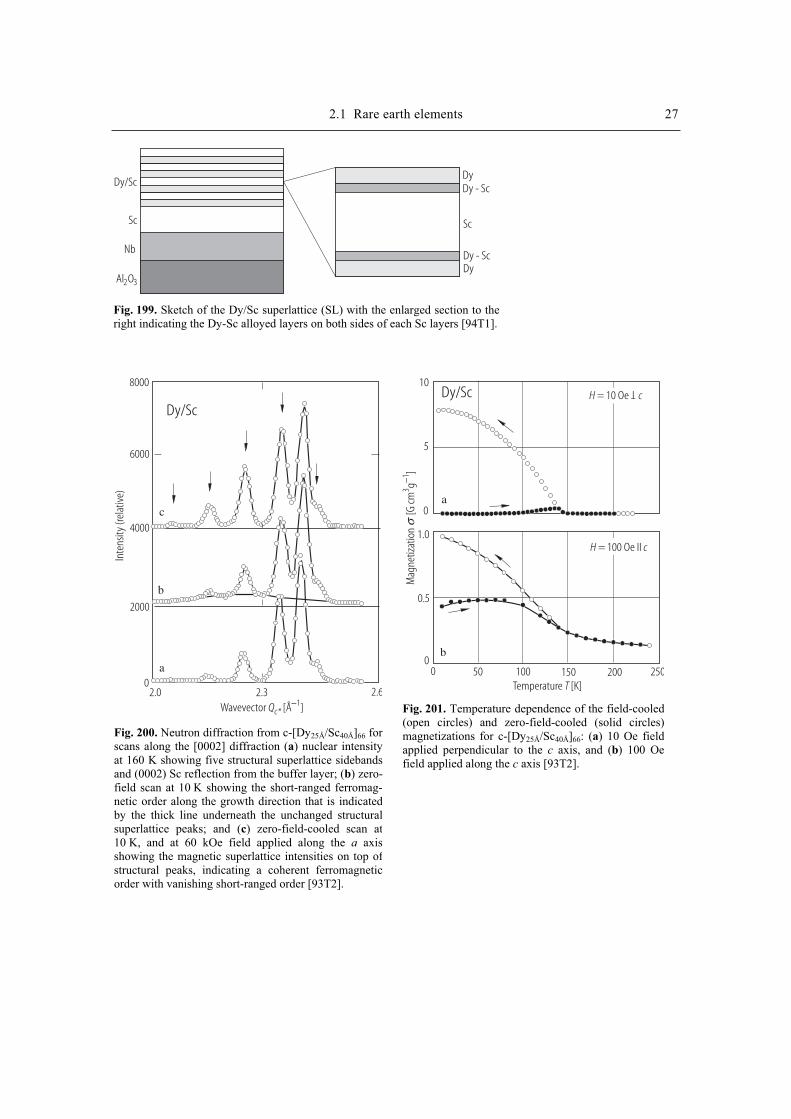
2.1 Rare earth elements 27
Dy/Sc
Sc
Nb
Al O2 3
DyDy - Sc
Sc
Dy - ScDy
Fig. 199. Sketch of the Dy/Sc superlattice (SL) with the enlarged section to the right indicating the Dy-Sc alloyed layers on both sides of each Sc layers [94T1].
Inte
nsity
(rel
ativ
e)
Wavevector [Å ]Qc*−1
Dy/Sc
a
b
c
8000
4000
0
2000
6000
2.0 2.3 2.6
Fig. 200. Neutron diffraction from c-[Dy25Å/Sc40Å]66 for scans along the [0002] diffraction (a) nuclear intensityat 160 K showing five structural superlattice sidebandsand (0002) Sc reflection from the buffer layer; (b) zero-field scan at 10 K showing the short-ranged ferromag-netic order along the growth direction that is indicatedby the thick line underneath the unchanged structuralsuperlattice peaks; and (c) zero-field-cooled scan at10 K, and at 60 kOe field applied along the a axisshowing the magnetic superlattice intensities on top ofstructural peaks, indicating a coherent ferromagneticorder with vanishing short-ranged order [93T2].
Mag
netiz
atio
n
[G cm
g]
31−
σ
Temperature [K]T
Dy/Sc H = c10 Oe
T
H = c100 Oe II
a
b
10
5
0
1.0
0.5
00 100 200 25015050
Fig. 201. Temperature dependence of the field-cooled(open circles) and zero-field-cooled (solid circles) magnetizations for c-[Dy25Å/Sc40Å]66: (a) 10 Oe fieldapplied perpendicular to the c axis, and (b) 100 Oe field applied along the c axis [93T2].
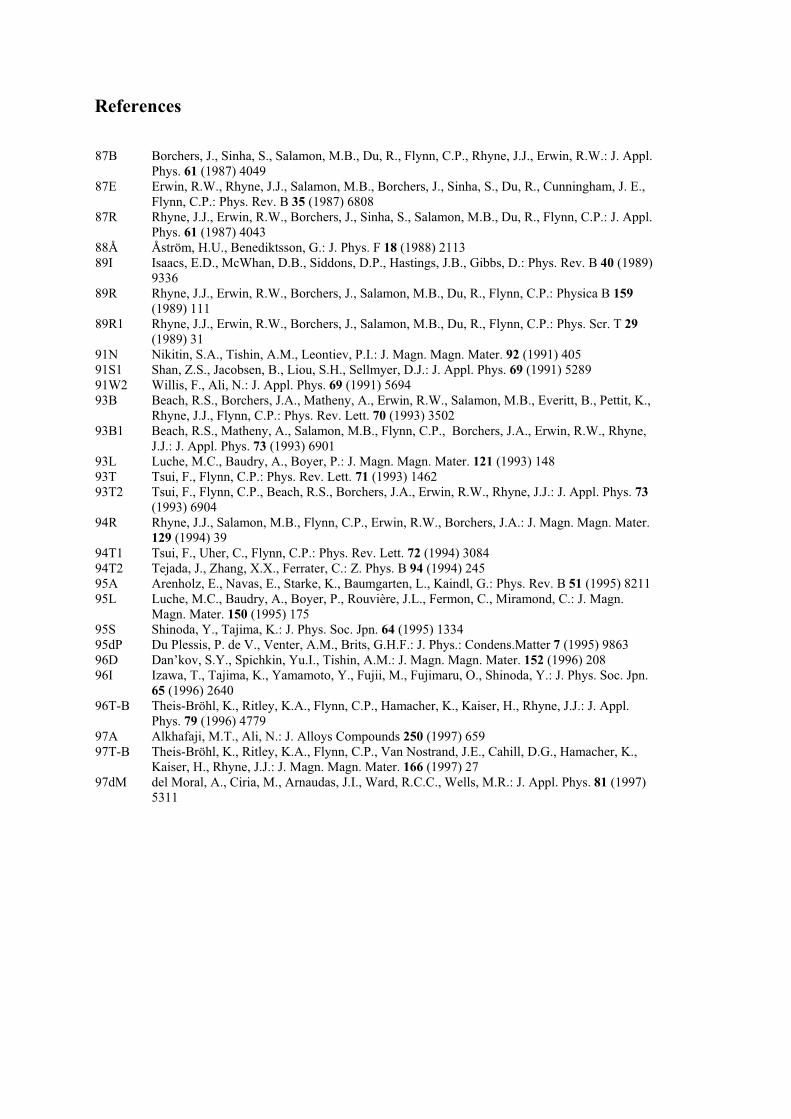
References
87B Borchers, J., Sinha, S., Salamon, M.B., Du, R., Flynn, C.P., Rhyne, J.J., Erwin, R.W.: J. Appl.
Phys. 61 (1987) 4049
87E Erwin, R.W., Rhyne, J.J., Salamon, M.B., Borchers, J., Sinha, S., Du, R., Cunningham, J. E.,
Flynn, C.P.: Phys. Rev. B 35 (1987) 6808
87R Rhyne, J.J., Erwin, R.W., Borchers, J., Sinha, S., Salamon, M.B., Du, R., Flynn, C.P.: J. Appl.
Phys. 61 (1987) 4043
88Å Åström, H.U., Benediktsson, G.: J. Phys. F 18 (1988) 2113
89I Isaacs, E.D., McWhan, D.B., Siddons, D.P., Hastings, J.B., Gibbs, D.: Phys. Rev. B 40 (1989)
9336
89R Rhyne, J.J., Erwin, R.W., Borchers, J., Salamon, M.B., Du, R., Flynn, C.P.: Physica B 159
(1989) 111
89R1 Rhyne, J.J., Erwin, R.W., Borchers, J., Salamon, M.B., Du, R., Flynn, C.P.: Phys. Scr. T 29
(1989) 31
91N Nikitin, S.A., Tishin, A.M., Leontiev, P.I.: J. Magn. Magn. Mater. 92 (1991) 405
91S1 Shan, Z.S., Jacobsen, B., Liou, S.H., Sellmyer, D.J.: J. Appl. Phys. 69 (1991) 5289
91W2 Willis, F., Ali, N.: J. Appl. Phys. 69 (1991) 5694
93B Beach, R.S., Borchers, J.A., Matheny, A., Erwin, R.W., Salamon, M.B., Everitt, B., Pettit, K.,
Rhyne, J.J., Flynn, C.P.: Phys. Rev. Lett. 70 (1993) 3502
93B1 Beach, R.S., Matheny, A., Salamon, M.B., Flynn, C.P., Borchers, J.A., Erwin, R.W., Rhyne,
J.J.: J. Appl. Phys. 73 (1993) 6901
93L Luche, M.C., Baudry, A., Boyer, P.: J. Magn. Magn. Mater. 121 (1993) 148
93T Tsui, F., Flynn, C.P.: Phys. Rev. Lett. 71 (1993) 1462
93T2 Tsui, F., Flynn, C.P., Beach, R.S., Borchers, J.A., Erwin, R.W., Rhyne, J.J.: J. Appl. Phys. 73
(1993) 6904
94R Rhyne, J.J., Salamon, M.B., Flynn, C.P., Erwin, R.W., Borchers, J.A.: J. Magn. Magn. Mater.
129 (1994) 39
94T1 Tsui, F., Uher, C., Flynn, C.P.: Phys. Rev. Lett. 72 (1994) 3084
94T2 Tejada, J., Zhang, X.X., Ferrater, C.: Z. Phys. B 94 (1994) 245
95A Arenholz, E., Navas, E., Starke, K., Baumgarten, L., Kaindl, G.: Phys. Rev. B 51 (1995) 8211
95L Luche, M.C., Baudry, A., Boyer, P., Rouvière, J.L., Fermon, C., Miramond, C.: J. Magn.
Magn. Mater. 150 (1995) 175
95S Shinoda, Y., Tajima, K.: J. Phys. Soc. Jpn. 64 (1995) 1334
95dP Du Plessis, P. de V., Venter, A.M., Brits, G.H.F.: J. Phys.: Condens.Matter 7 (1995) 9863
96D Dan’kov, S.Y., Spichkin, Yu.I., Tishin, A.M.: J. Magn. Magn. Mater. 152 (1996) 208
96I Izawa, T., Tajima, K., Yamamoto, Y., Fujii, M., Fujimaru, O., Shinoda, Y.: J. Phys. Soc. Jpn.
65 (1996) 2640
96T-B Theis-Bröhl, K., Ritley, K.A., Flynn, C.P., Hamacher, K., Kaiser, H., Rhyne, J.J.: J. Appl.
Phys. 79 (1996) 4779
97A Alkhafaji, M.T., Ali, N.: J. Alloys Compounds 250 (1997) 659
97T-B Theis-Bröhl, K., Ritley, K.A., Flynn, C.P., Van Nostrand, J.E., Cahill, D.G., Hamacher, K.,
Kaiser, H., Rhyne, J.J.: J. Magn. Magn. Mater. 166 (1997) 27
97dM del Moral, A., Ciria, M., Arnaudas, J.I., Ward, R.C.C., Wells, M.R.: J. Appl. Phys. 81 (1997)
5311
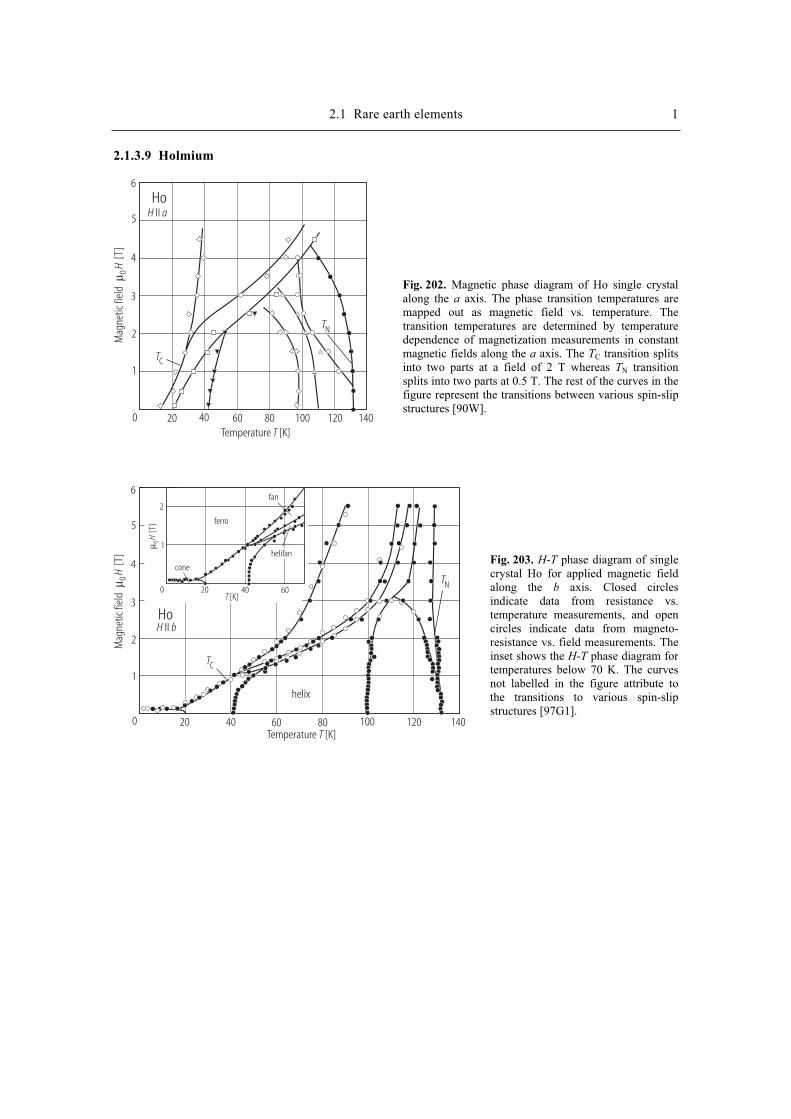
2.1 Rare earth elements 1
2.1.3.9 Holmium
Temperature [K]T
Mag
netic
fiel
d[T
]m 0
H
HoH aII
6
5
4
3
2
1
0 20 40 60 80 100 120 140
TC
TN
Temperature [K]T
[K]T
Mag
netic
fiel
d[T
]m 0
H
[T]
m 0H
HoH bII
6
5
4
3
2
1
0 20 40 60 80 100 120 140
2
1
0 20 40 60
ferro
fan
cone
helifan
TC
TN
helix
Fig. 202. Magnetic phase diagram of Ho single crystal along the a axis. The phase transition temperatures are mapped out as magnetic field vs. temperature. The transition temperatures are determined by temperature dependence of magnetization measurements in constant magnetic fields along the a axis. The TC transition splits into two parts at a field of 2 T whereas TN transition splits into two parts at 0.5 T. The rest of the curves in the figure represent the transitions between various spin-slip structures [90W].
Fig. 203. H-T phase diagram of single crystal Ho for applied magnetic field along the b axis. Closed circles indicate data from resistance vs. temperature measurements, and open circles indicate data from magneto-resistance vs. field measurements. The inset shows the H-T phase diagram for temperatures below 70 K. The curves not labelled in the figure attribute to the transitions to various spin-slip structures [97G1].

2 2.1 Rare earth elements
Temperature [K]T
Mag
netic
fiel
d[T
]µ 0
H
HoH cII
6
5
4
3
2
1
0 20 40 60 80 100 120 140
Ho
Sublattice 1
Sublattice 2b = 5 q = c*/5
planar
planar
hcp
Fig. 205. Magnetic phase diagram of Ho single crystal along the c axis. The phase transition temperatures are mapped out as field vs. temperature. The transition temperatures are determined by temperature dependence of mag-netization measurements in constant magnetic field along the c axis. There are two separate transitions observed. One occurred at a temperature just below the 20 K anomaly and the other occurred near 25 K. In addition to TC, TN
and the anomalies attributed to spin-slip structures the additional anomaly near 110 K was observed. The anomalies at 20, 42 and 98 K are attributed to various spin-slip structures [90W].
Fig. 206. A pictorial representation of Ho magnetic structure with Debye-Waller factor b = 5(q = 1/5 c*) for temperatures between 30 and 18 K just above the transition to a ferromagnetic cone phase with a wavevector of 1/6 c*. The sublattices are viewed togeth-er as they would appear in the hcp structure and separately in planar relief. The arrows denote sublattice spin orientation. One of the possible antiferromagnetic arrangements for the c axis moments is also indicated [88C].
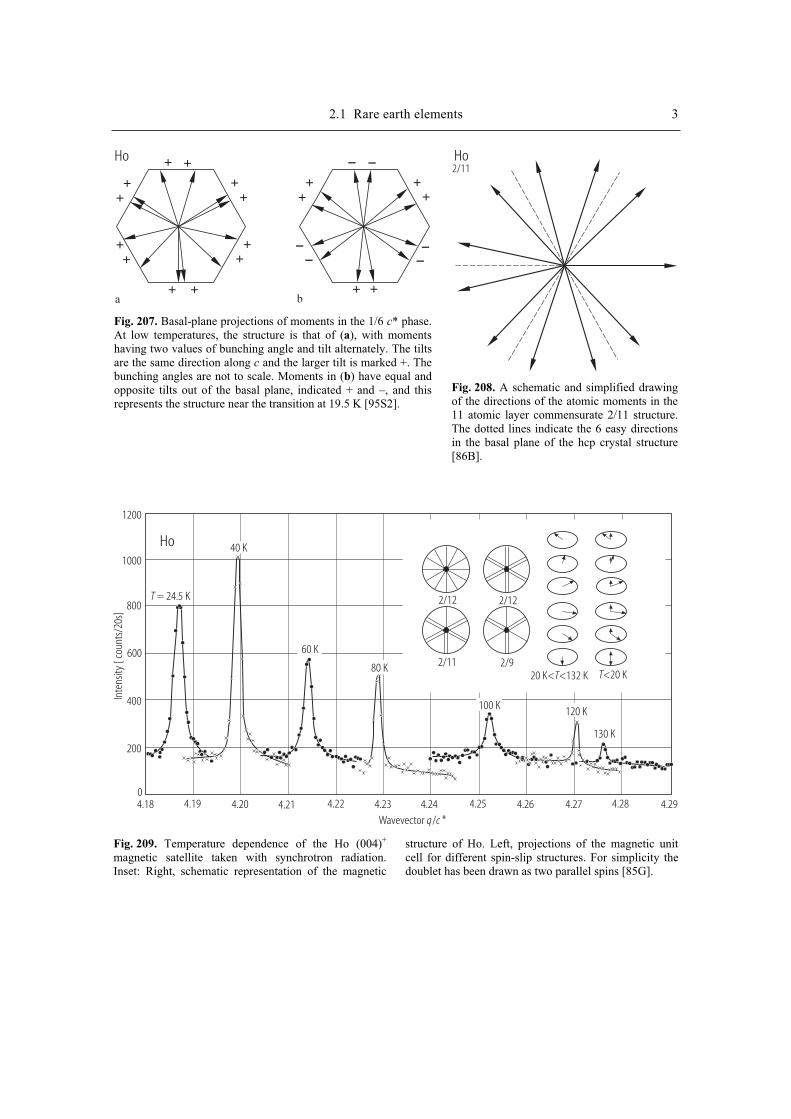
2.1 Rare earth elements 3
+ +
++
++
++
+ +
++
++
++
+ +
-- -
-
- -Ho
a b
Fig. 207. Basal-plane projections of moments in the 1/6 c* phase. At low temperatures, the structure is that of (a), with moments having two values of bunching angle and tilt alternately. The tiltsare the same direction along c and the larger tilt is marked +. Thebunching angles are not to scale. Moments in (b) have equal andopposite tilts out of the basal plane, indicated + and –, and this represents the structure near the transition at 19.5 K [95S2].
Ho2/11
Fig. 208. A schematic and simplified drawing of the directions of the atomic moments in the 11 atomic layer commensurate 2/11 structure. The dotted lines indicate the 6 easy directions in the basal plane of the hcp crystal structure [86B].
Wavevector / *q c
Inte
nsity
[ co
unts
/20s
]
Ho
4.18 4.19 4.20 4.21 4.22 4.23 4.24 4.25 4.26 4.27 4.28 4.29
1200
1000
800
600
400
200
0
T = 24.5 K
130 K
40 K
60 K
80 K
100 K 120 K
2/12 2/12
2/11 2/920 K< <132 KT T<20 K
Fig. 209. Temperature dependence of the Ho (004)+
magnetic satellite taken with synchrotron radiation. Inset: Right, schematic representation of the magnetic
structure of Ho. Left, projections of the magnetic unit cell for different spin-slip structures. For simplicity the doublet has been drawn as two parallel spins [85G].
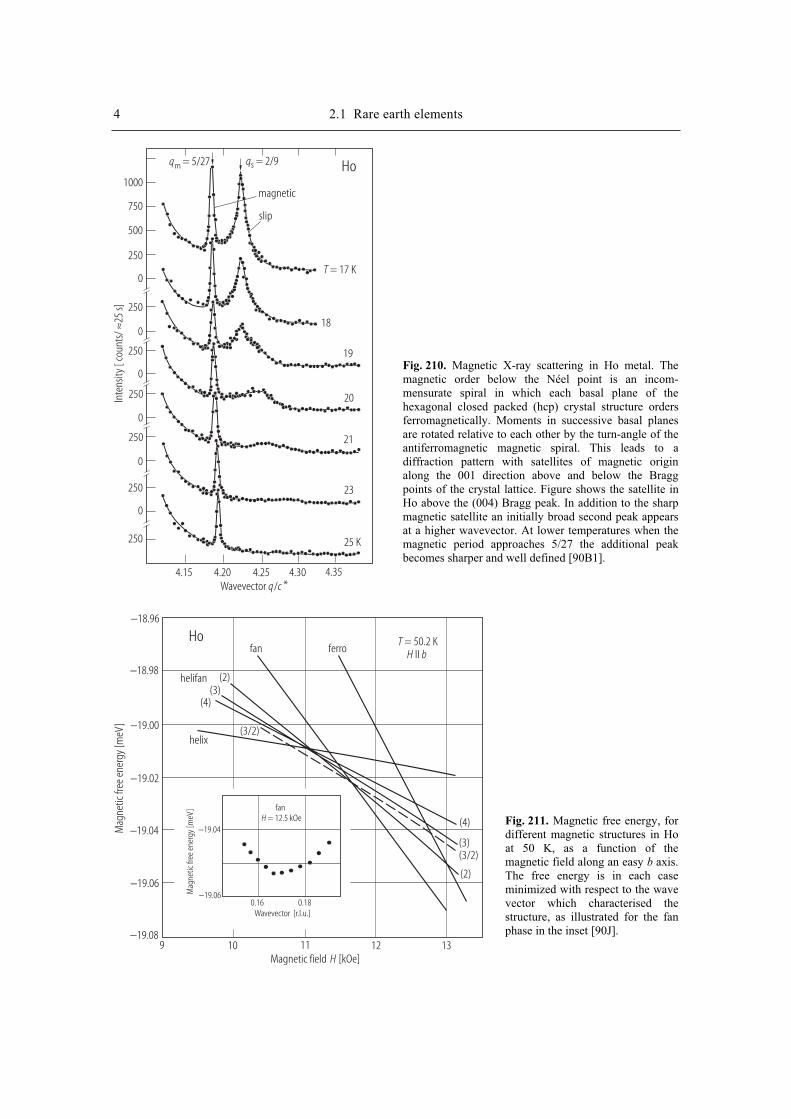
4 2.1 Rare earth elements
Wavevector / *q c
Inte
nsity
[ co
unts
/25
s]≈
Ho
4.15 4.20 4.25 4.30 4.35
250
0
250
0
0
1000
750
500
250
0
250
0
250
0
250
250
magnetic
slip
T = 17 K
qm = 5/27 qs = 2/9
18
19
20
21
23
25 K
Magnetic field [kOe]H
Wavevector [r.l.u.]
HoH bII
−18.96
−18.98
−19.00
−19.02
−19.04 −19.04
−19.06−19.06
−19.089 10 11 12 13
Mag
netic
free
ene
rgy
[meV
]
Mag
netic
free
ene
rgy
[meV
]
0.16 0.18
fan
fanH = 12.5 kOe
ferro
helifan
helix
(2)(3)
(4)
(3/2)
(4)
(3)(3/2)
(2)
T = 50.2 K
Fig. 210. Magnetic X-ray scattering in Ho metal. The magnetic order below the Néel point is an incom-mensurate spiral in which each basal plane of the hexagonal closed packed (hcp) crystal structure orders ferromagnetically. Moments in successive basal planes are rotated relative to each other by the turn-angle of the antiferromagnetic magnetic spiral. This leads to a diffraction pattern with satellites of magnetic origin along the 001 direction above and below the Bragg points of the crystal lattice. Figure shows the satellite in Ho above the (004) Bragg peak. In addition to the sharp magnetic satellite an initially broad second peak appears at a higher wavevector. At lower temperatures when the magnetic period approaches 5/27 the additional peak becomes sharper and well defined [90B1].
Fig. 211. Magnetic free energy, for different magnetic structures in Ho at 50 K, as a function of the magnetic field along an easy b axis. The free energy is in each case minimized with respect to the wave vector which characterised the structure, as illustrated for the fan phase in the inset [90J].
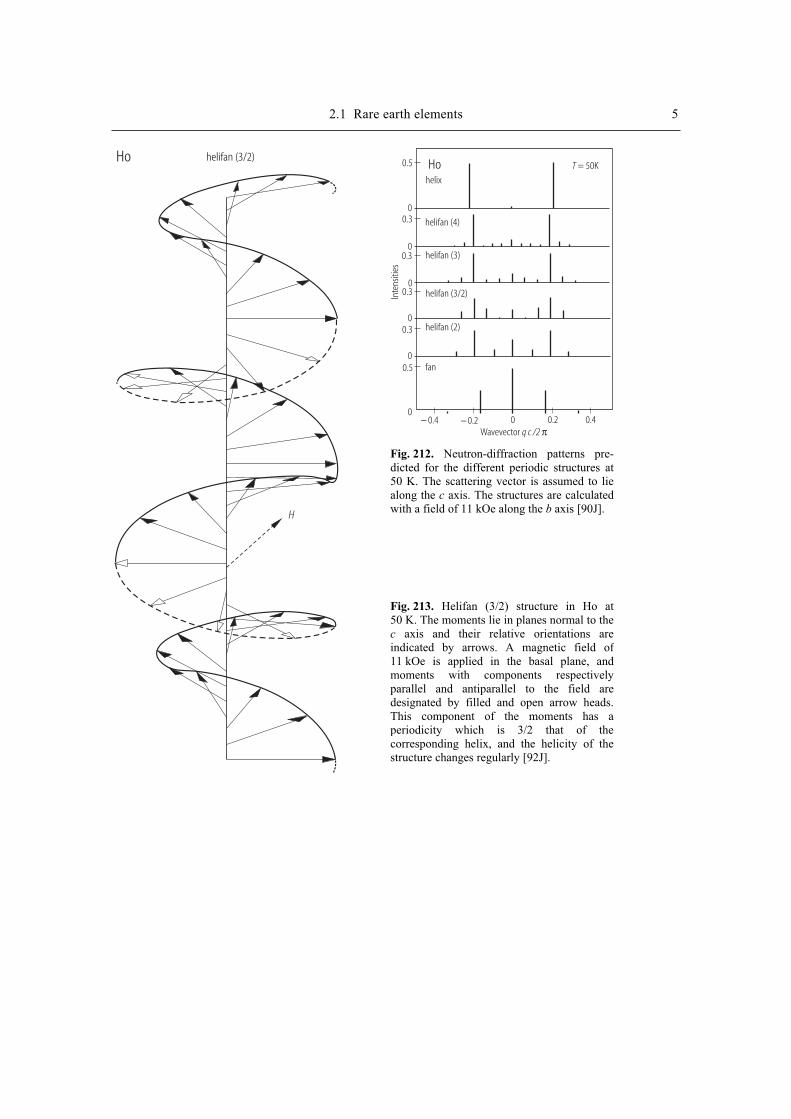
2.1 Rare earth elements 5
Ho helifan (3/2)
H
Ho
Wavevector q c /2 π
Inte
nsiti
es
− 0.4 − 0.2 0 0.2 0.4
0.5
00.3
00.3
00.3
00.3
00.5
0
helix
helifan (4)
helifan (3)
helifan (3/2)
helifan (2)
fan
T = 50K
Fig. 212. Neutron-diffraction patterns pre-dicted for the different periodic structures at 50 K. The scattering vector is assumed to lie along the c axis. The structures are calculatedwith a field of 11 kOe along the b axis [90J].
Fig. 213. Helifan (3/2) structure in Ho at 50 K. The moments lie in planes normal to the c axis and their relative orientations are indicated by arrows. A magnetic field of11 kOe is applied in the basal plane, andmoments with components respectively parallel and antiparallel to the field are designated by filled and open arrow heads. This component of the moments has a periodicity which is 3/2 that of the corresponding helix, and the helicity of the structure changes regularly [92J].
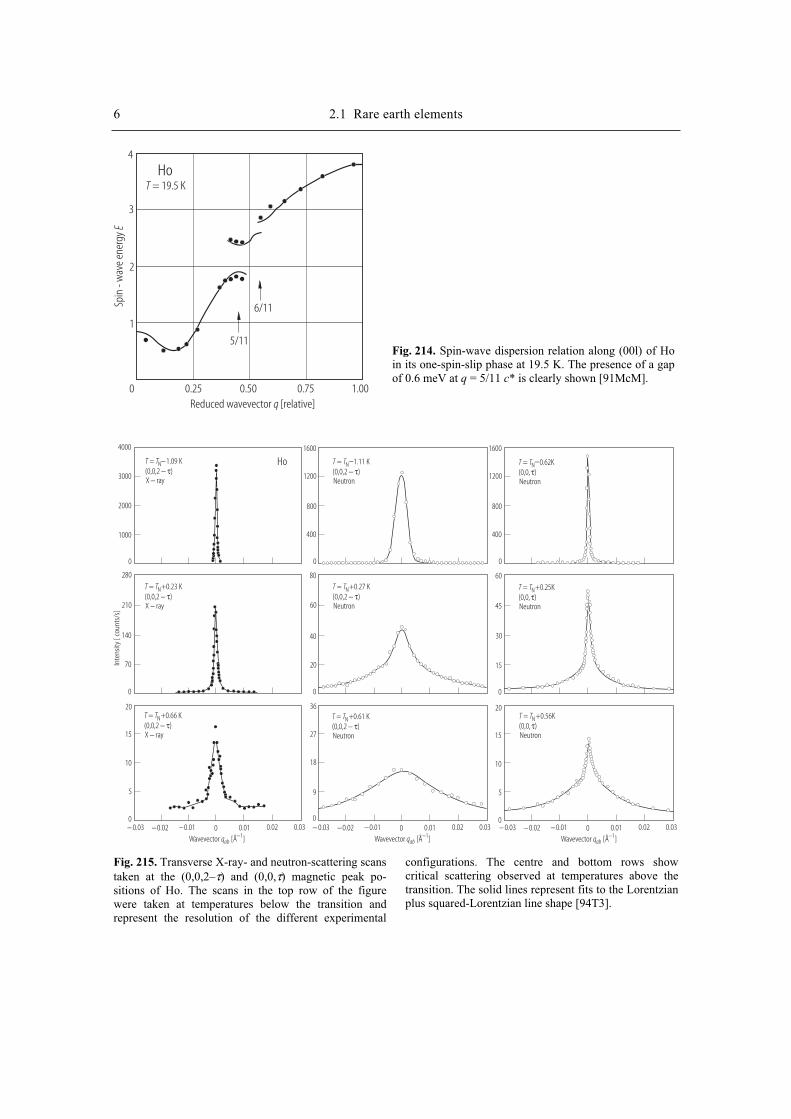
6 2.1 Rare earth elements
Reduced wavevector [relative]q
Ho
Spin
- w
ave
ener
gyE
4
3
2
1
0 0.25 0.50 0.75 1.00
T = 19.5 K
6/11
5/11
Wavevector [Å ]qab−1 Wavevector [Å ]qab
−1 Wavevector [Å ]qab−1
Inte
nsity
[ co
unts
/s]
Ho
20 20
15 15
10 10
5 5
0 0− 0.03 − 0.03 − 0.03−0.02 −0.02 −0.02−0.01 −0.01 −0.010 0 00.01 0.01 0.010.02 0.02 0.020.03 0.03 0.03
T T= +0.66 KN
T T= +0.23 KN
T T= 1.09 KN− T T= 1.11 KN−
(0,0,2 )− τ
(0,0,2 )− τ
(0,0,2 )− τ (0,0,2 )− τ
X ray−
X ray−
X ray− Neutron
280
210
140
70
0
4000
3000
2000
1000
0
1600 1600
1200 1200
800 800
400 400
0 0
80
60
40
20
0
36
27
18
9
0
60
45
30
15
0
T T= +0.27 KN
T T= +0.61 KN T T= +0.56KN
(0,0,2 )− τ
(0,0,2 )− τ (0,0, )τ
Neutron
Neutron Neutron
T T= 0.62KN−
T T= +0.25KN
(0,0, )τ
(0,0, )τ
Neutron
Neutron
Fig. 215. Transverse X-ray- and neutron-scattering scans taken at the (0,0,2–τ) and (0,0,τ) magnetic peak po-sitions of Ho. The scans in the top row of the figure were taken at temperatures below the transition and represent the resolution of the different experimental
configurations. The centre and bottom rows show critical scattering observed at temperatures above the transition. The solid lines represent fits to the Lorentzian plus squared-Lorentzian line shape [94T3].
Fig. 214. Spin-wave dispersion relation along (00l) of Ho in its one-spin-slip phase at 19.5 K. The presence of a gap of 0.6 meV at q = 5/11 c* is clearly shown [91McM].
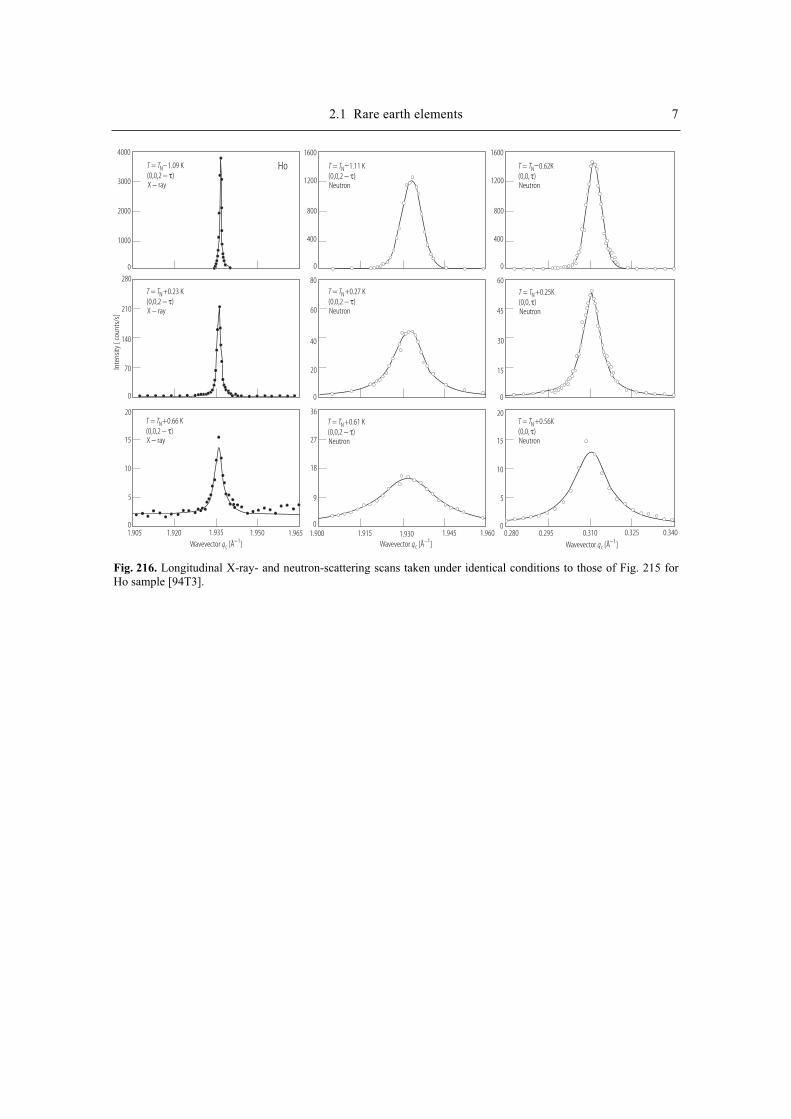
2.1 Rare earth elements 7
Wavevector [Å ]qc−1 Wavevector [Å ]qc
−1 Wavevector [Å ]qc−1
Inte
nsity
[ co
unts
/s]
Ho
20 20
15 15
10 10
5 5
0 01.900 1.915 1.930 1.945 1.960
T T= +0.66 KN
T T= +0.23 KN
T T= 1.09 KN− T T= 1.11 KN−
(0,0,2 )− τ
(0,0,2 )− τ
(0,0,2 )− τ (0,0,2 )− τ
X ray−
X ray−
X ray− Neutron
280
210
140
70
0
4000
3000
2000
1000
0
1600 1600
1200 1200
800 800
400 400
0 0
80
60
40
20
0
36
27
18
9
0
60
45
30
15
0
T T= +0.27 KN
T T= +0.61 KN T T= +0.56KN
(0,0,2 )− τ
(0,0,2 )− τ (0,0, )τ
Neutron
Neutron Neutron
T T= 0.62KN−
T T= +0.25KN
(0,0, )τ
(0,0, )τ
Neutron
Neutron
1.905 1.920 1.935 1.950 1.965 0.280 0.295 0.310 0.325 0.340
Fig. 216. Longitudinal X-ray- and neutron-scattering scans taken under identical conditions to those of Fig. 215 for Ho sample [94T3].
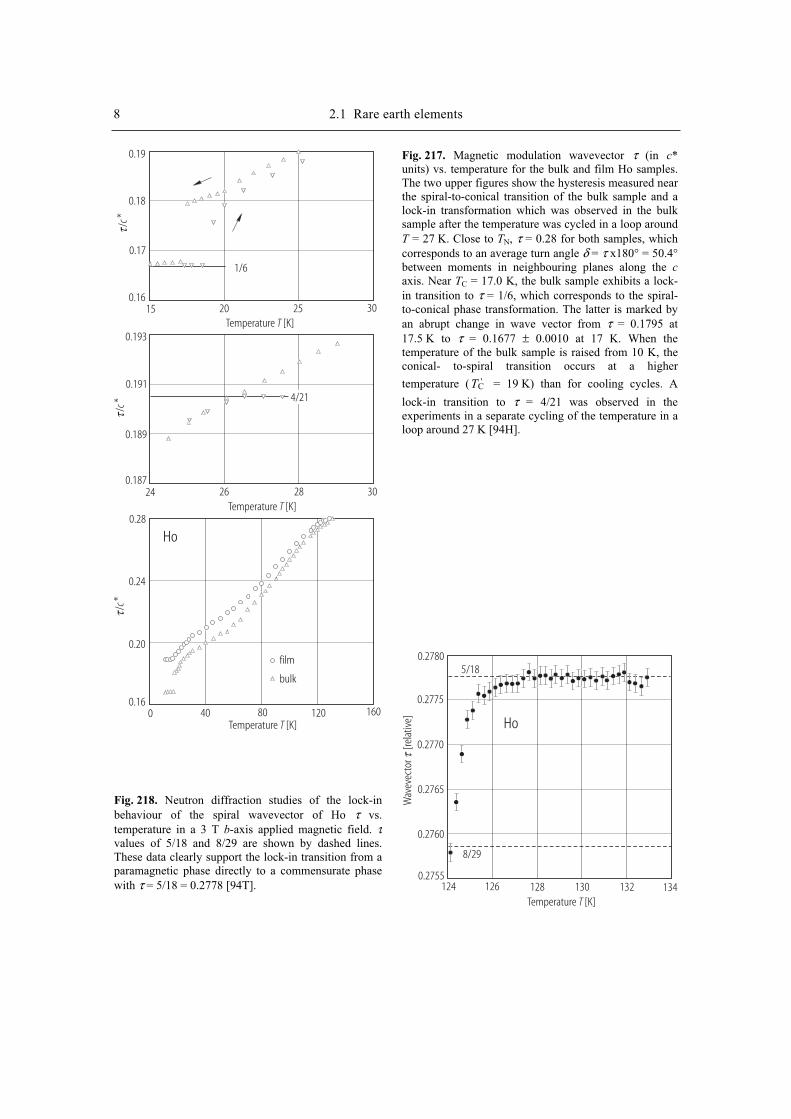
8 2.1 Rare earth elements
Temperature [K]T
Temperature [K]T
Temperature [K]T
0.19
0.18
0.17
0.1615 20 25 30
1/6
/* c
τ/
* cτ
/* c
τ
0.193
0.191
0.189
0.18724 26 28 30
4/21
0 40 80 120 160
film
bulk
0.28
0.24
0.20
0.16
Ho
Fig. 218. Neutron diffraction studies of the lock-in behaviour of the spiral wavevector of Ho τ vs.temperature in a 3 T b-axis applied magnetic field. τvalues of 5/18 and 8/29 are shown by dashed lines. These data clearly support the lock-in transition from a paramagnetic phase directly to a commensurate phase with τ = 5/18 = 0.2778 [94T].
Fig. 217. Magnetic modulation wavevector τ (in c*units) vs. temperature for the bulk and film Ho samples. The two upper figures show the hysteresis measured nearthe spiral-to-conical transition of the bulk sample and a lock-in transformation which was observed in the bulksample after the temperature was cycled in a loop aroundT = 27 K. Close to TN, τ = 0.28 for both samples, which corresponds to an average turn angle δ = τ x180° = 50.4° between moments in neighbouring planes along the c
axis. Near TC = 17.0 K, the bulk sample exhibits a lock-in transition to τ = 1/6, which corresponds to the spiral-to-conical phase transformation. The latter is marked by an abrupt change in wave vector from τ = 0.1795 at 17.5 K to τ = 0.1677 ± 0.0010 at 17 K. When the temperature of the bulk sample is raised from 10 K, the conical- to-spiral transition occurs at a higher
temperature ( 'CT = 19 K) than for cooling cycles. A
lock-in transition to τ = 4/21 was observed in the experiments in a separate cycling of the temperature in a loop around 27 K [94H].
Temperature [K]T
Ho
Wav
evec
tor
[rela
tive]
τ
0.2780
0.2775
0.2770
0.2765
0.2760
0.2755
5/18
8/29
124 126 128 130 132 134
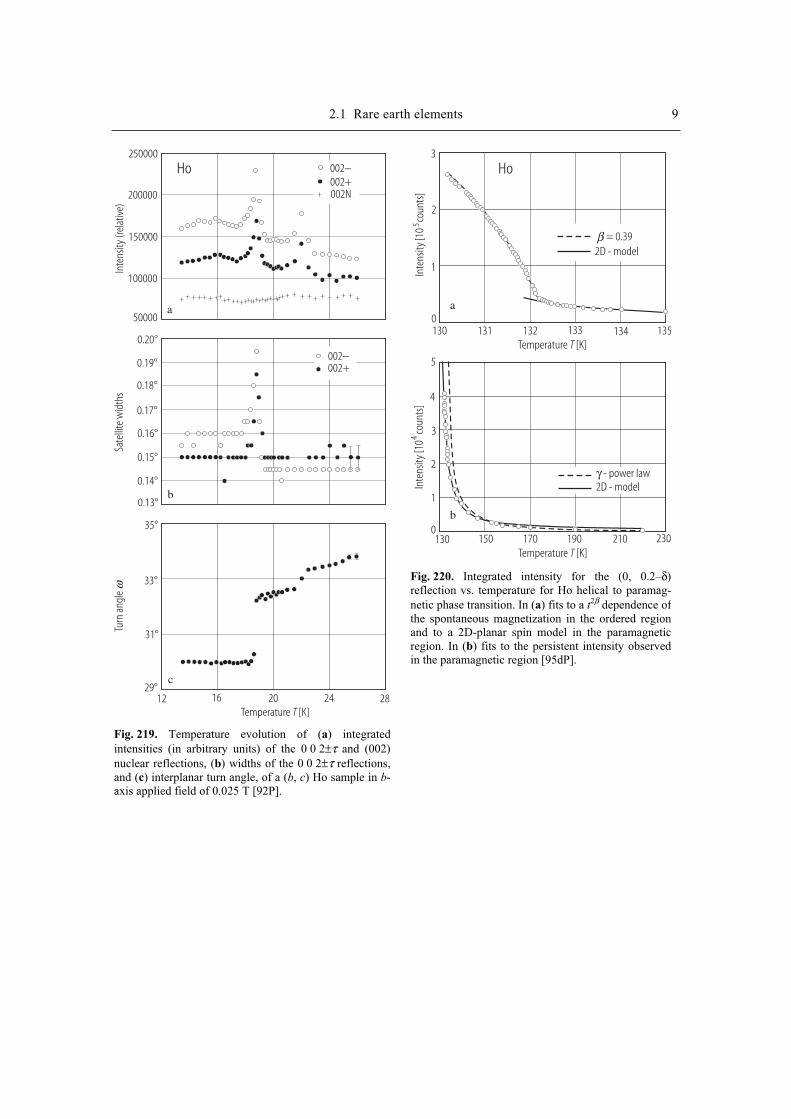
2.1 Rare earth elements 9
Temperature [K]T
Inte
nsity
(rel
ativ
e)
Ho
Turn
ang
leω
35°
33°
31°
29°12 16 20 24 28
c
Sate
llite
wid
ths
0.20°
0.19°
0.18°
0.17°
0.16°
0.15°
0.14°
0.13°
002−002+
b
250000
200000
150000
100000
50000a
002−002+002N
Fig. 219. Temperature evolution of (a) integratedintensities (in arbitrary units) of the 0 0 2±τ and (002) nuclear reflections, (b) widths of the 0 0 2±τ reflections, and (c) interplanar turn angle, of a (b, c) Ho sample in b-axis applied field of 0.025 T [92P].
Temperature [K]T
Temperature [K]T
Inte
nsity
[10
coun
ts]
4In
tens
ity[1
0co
unts
]5
Ho
5
4
3
2
1
0130 150 170 190 210 230
γ - power law2D - model
2D - modelβ = 0.39
3
2
1
0a
b
130 131 132 133 134 135
Fig. 220. Integrated intensity for the (0, 0.2–δ)reflection vs. temperature for Ho helical to paramag-netic phase transition. In (a) fits to a t2β dependence ofthe spontaneous magnetization in the ordered region and to a 2D-planar spin model in the paramagnetic region. In (b) fits to the persistent intensity observedin the paramagnetic region [95dP].
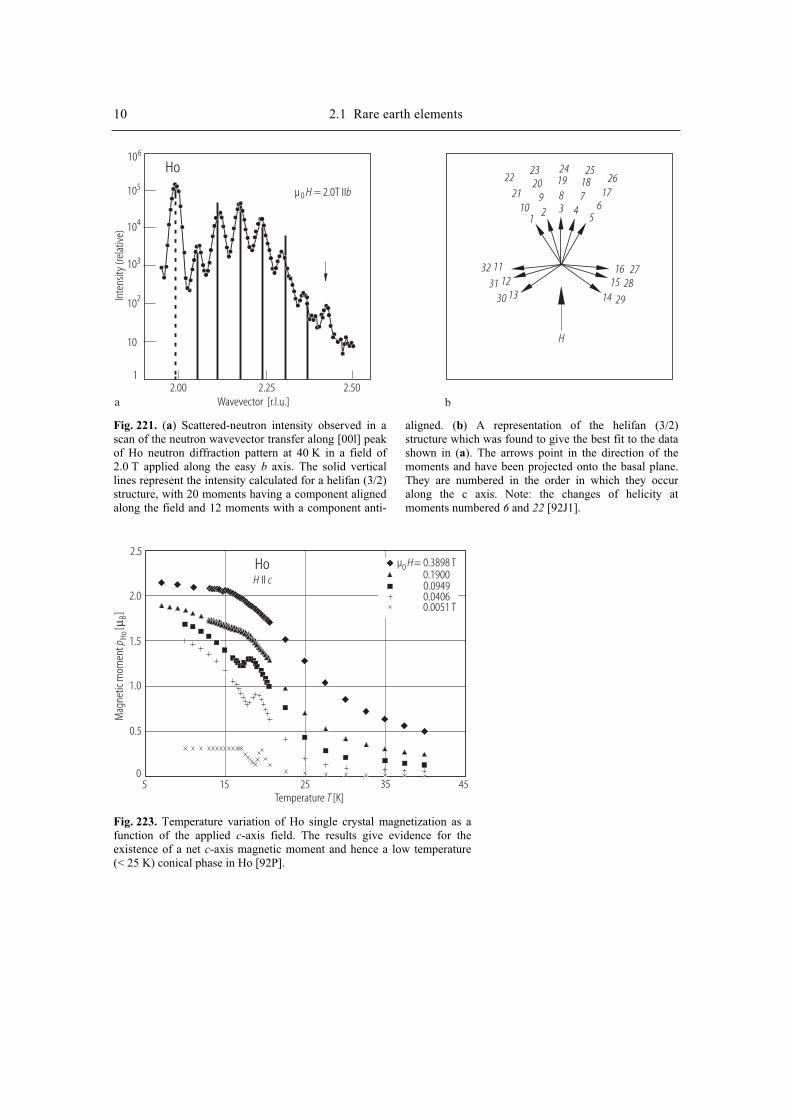
10 2.1 Rare earth elements
Wavevector [r.l.u.]
Inte
nsity
(rel
ativ
e)
Ho106
105
104
103
102
10
12.00 2.25 2.50
µ = 2.0T II0 H b
a b
12 3 4
5
H
1415
161112
13
3231
30 29
2827
109 8 7
621
20 19 1817
2223 24 25
26
Fig. 221. (a) Scattered-neutron intensity observed in a scan of the neutron wavevector transfer along [00l] peak of Ho neutron diffraction pattern at 40 K in a field of 2.0 T applied along the easy b axis. The solid vertical lines represent the intensity calculated for a helifan (3/2) structure, with 20 moments having a component aligned along the field and 12 moments with a component anti-
aligned. (b) A representation of the helifan (3/2) structure which was found to give the best fit to the data shown in (a). The arrows point in the direction of the moments and have been projected onto the basal plane. They are numbered in the order in which they occur along the c axis. Note: the changes of helicity at moments numbered 6 and 22 [92J1].
Temperature [K]T
Mag
netic
mom
ent
[]
p HoBµ
HoH cII
2.5
2.0
1.5
1.0
0.5
05 15 25 35 45
µ = 0.3898 T0 H0.19000.09490.04060.0051 T
Fig. 223. Temperature variation of Ho single crystal magnetization as a function of the applied c-axis field. The results give evidence for the existence of a net c-axis magnetic moment and hence a low temperature (< 25 K) conical phase in Ho [92P].
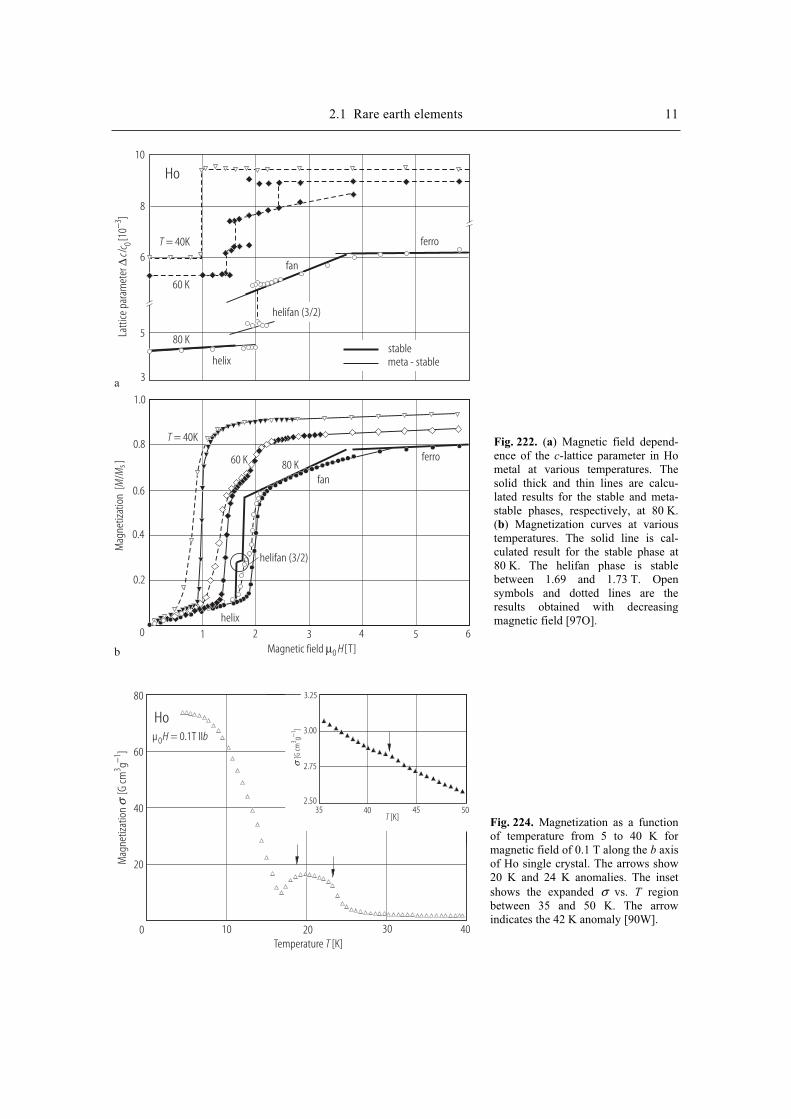
2.1 Rare earth elements 11 M
agne
tizat
ion
[/
]M
Ms
Magnetic field [T]µ0 H
Ho
Latti
ce p
aram
eter
/[1
0]
∆c
c 03−
1.0
0.8
0.6
0.4
0.2
0 1 2 3 4 5 6
T = 40K
T = 40K
60 K
60 K
80 K
80 K
helifan (3/2)
helix
helix
fan
fan
ferro
ferro
b
10
8
6
3
5
helifan (3/2)
stablemeta - stable
a
Mag
netiz
atio
n
[G cm
g]
31−
σ
[G cm
g]
31−
σ
[K]T
Temperature [K]T
Ho
0 10 20 30 40
80
60
40
20
µ = 0.1T II0H b
3.25
3.00
2.75
2.5035 40 45 50
Fig. 222. (a) Magnetic field depend-ence of the c-lattice parameter in Ho metal at various temperatures. The solid thick and thin lines are calcu-lated results for the stable and meta-stable phases, respectively, at 80 K. (b) Magnetization curves at various temperatures. The solid line is cal-culated result for the stable phase at 80 K. The helifan phase is stable between 1.69 and 1.73 T. Open symbols and dotted lines are the results obtained with decreasing magnetic field [97O].
Fig. 224. Magnetization as a function of temperature from 5 to 40 K for magnetic field of 0.1 T along the b axis of Ho single crystal. The arrows show 20 K and 24 K anomalies. The inset shows the expanded σ vs. T region between 35 and 50 K. The arrow indicates the 42 K anomaly [90W].

12 2.1 Rare earth elements M
agne
tizat
ion
[G
cmg
]3
1−σ
Mag
netiz
atio
n
[G cm
g]
31−
σ
/dT
σ
Temperature [K]T Temperature [K]T
[K]T
Ho
µ = 0.1T II0H b
1.875
1.825
1.775
1.72590 95 100 105
90 95 100 105
2.1
2.0
1.9
1.8
1.7
TN
100 110 120 130 140a b
d
Fig. 225. (a) Magnetization as function of temperature from 90 K to 105 K for a magnetic field of 0.1 T along the b axis . The inset of (a) shows dσ/dT vs. T. The arrows indicate the 98 K anomaly. (b) Magnetization σ
as function of temperature between 100 K and 140 K for a magnetic field of 0.1 T along the b axis. The peak is in the Néel temperature [90W].
Temperature [K]T
HoH bII
30
20
10
0
Bulk
mag
netic
mom
ent [
10Am
]−7
2
6
4
2
0
3
2
1
0
0.6
0.4
0.2
00 10 20 30 40
H = 940 Am−1
223
104
29 Am−1
Fig. 226. Temperature dependencies of the magnetic moment of a Ho single crystal on sample heating in magnetic field. H = 29, 104, 223, and 940 A m–1, with H||b [91S2].
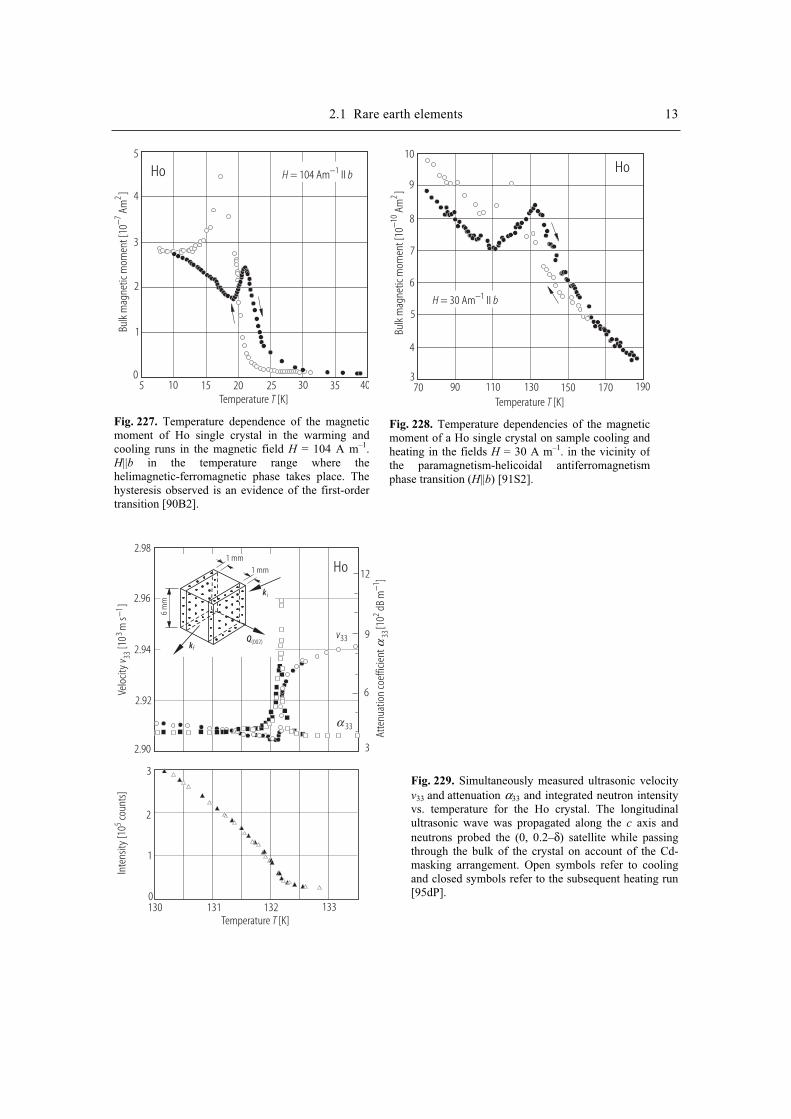
2.1 Rare earth elements 13
Temperature [K]T
Ho
Bulk
mag
netic
mom
ent [
10Am
]−7
2
5
4
3
2
1
05 10 15 20 25 30 35 40
H b= 104 Am II−1
Fig. 227. Temperature dependence of the magnetic moment of Ho single crystal in the warming and cooling runs in the magnetic field H = 104 A m–1.H||b in the temperature range where the helimagnetic-ferromagnetic phase takes place. The hysteresis observed is an evidence of the first-order transition [90B2].
Temperature [K]T
Ho
Bulk
mag
netic
mom
ent [
10Am
]−1
02
10
370 90 110 130 150 170 190
H b= 30 Am II−1
9
8
7
6
5
4
Fig. 228. Temperature dependencies of the magnetic moment of a Ho single crystal on sample cooling andheating in the fields H = 30 A m–1. in the vicinity ofthe paramagnetism-helicoidal antiferromagnetismphase transition (H||b) [91S2].
Temperature [K]T
Velo
city
[10
m s
]v 33
31−
Inte
nsity
[10
coun
ts]
5
Atte
nuat
ion
coef
ficie
nt[1
0dB
m]
332
1−α
Ho
3
2
1
0130 131 132 133
2.98
2.96
2.94
2.92
2.90
12
9
6
3
v33
α 33
1 mm1 mm
6 m
m
kf
k i
Q(002)
Fig. 229. Simultaneously measured ultrasonic velocity v33 and attenuation α33 and integrated neutron intensity vs. temperature for the Ho crystal. The longitudinal ultrasonic wave was propagated along the c axis and neutrons probed the (0, 0.2–δ) satellite while passing through the bulk of the crystal on account of the Cd-masking arrangement. Open symbols refer to cooling and closed symbols refer to the subsequent heating run [95dP].
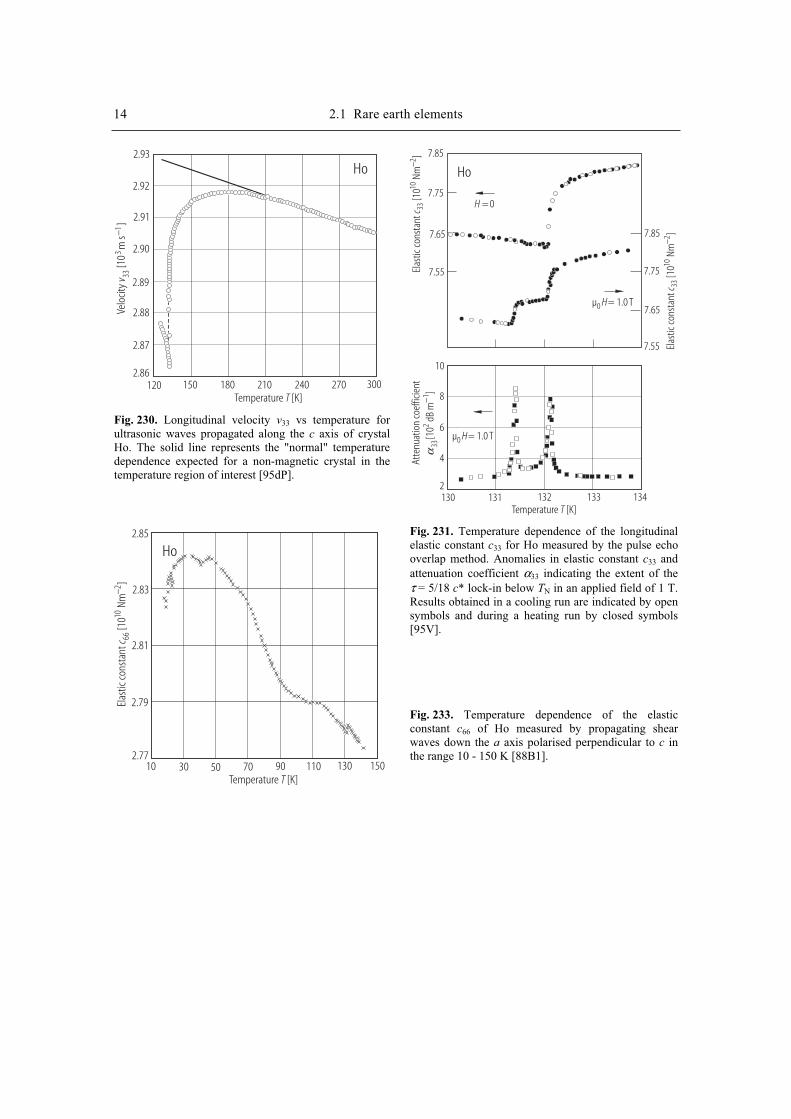
14 2.1 Rare earth elements
Temperature [K]T
Ho2.93
2.92
2.91
2.90
2.89
2.88
2.87
2.86120 150 180 210 240 270 300
Velo
city
[10
m s
]v 33
31−
Fig. 230. Longitudinal velocity v33 vs temperature forultrasonic waves propagated along the c axis of crystalHo. The solid line represents the "normal" temperaturedependence expected for a non-magnetic crystal in thetemperature region of interest [95dP].
Temperature [K]T
Ho
Elas
tic co
nsta
nt[1
0Nm
]c 66
102−
2.85
2.83
2.81
2.79
2.7710 30 50 70 90 110 130 150
Temperature [K]T
Ho
Atte
nuat
ion
coef
ficie
nt[1
0dB
m]
332
1−α
10
8
6
4
2130 131 132 133 134
µ = 1.0 T0 H
µ = 1.0 T0 H
7.85
7.85
7.75
7.75
7.65
7.65
7.55
7.55
H = 0
Elas
tic co
nsta
nt[1
0Nm
]c 33
102−
Elas
tic co
nsta
nt[1
0Nm
]c 33
102−
Fig. 231. Temperature dependence of the longitudinal elastic constant c33 for Ho measured by the pulse echo overlap method. Anomalies in elastic constant c33 andattenuation coefficient α33 indicating the extent of the τ = 5/18 c* lock-in below TN in an applied field of 1 T. Results obtained in a cooling run are indicated by open symbols and during a heating run by closed symbols [95V].
Fig. 233. Temperature dependence of the elastic constant c66 of Ho measured by propagating shearwaves down the a axis polarised perpendicular to c inthe range 10 - 150 K [88B1].
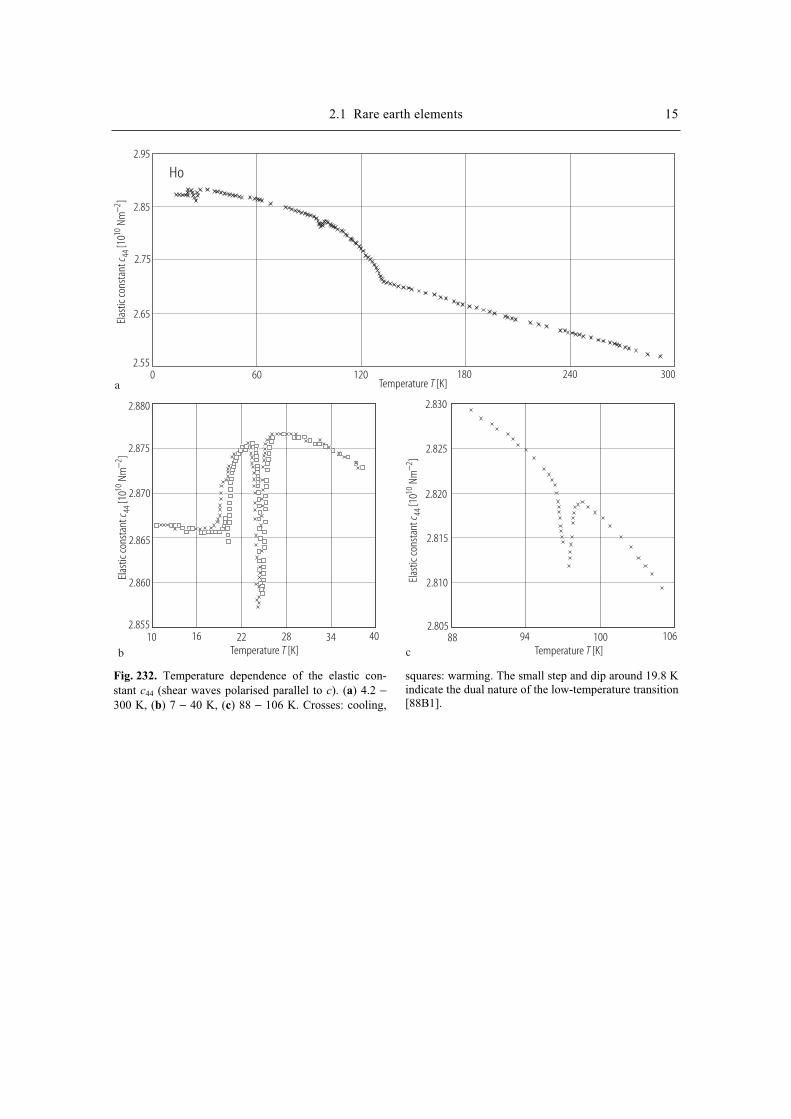
2.1 Rare earth elements 15
Temperature [K]T
Temperature [K]T
Temperature [K]T
Ho
Elas
tic co
nsta
nt[1
0Nm
]c 44
102−
Elas
tic co
nsta
nt[1
0Nm
]c 44
102−
Elas
tic co
nsta
nt[1
0Nm
]c 44
102−
2.880
2.870
2.860
10 16 22 28 34 402.855
2.865
2.875
b
2.830
2.825
2.810
2.820
2.815
2.80588 94 100 106
c
2.95
2.85
2.75
2.65
2.5560 120 180 240 3000
a
Fig. 232. Temperature dependence of the elastic con-stant c44 (shear waves polarised parallel to c). (a) 4.2 −300 K, (b) 7 − 40 K, (c) 88 − 106 K. Crosses: cooling,
squares: warming. The small step and dip around 19.8 K indicate the dual nature of the low-temperature transition [88B1].
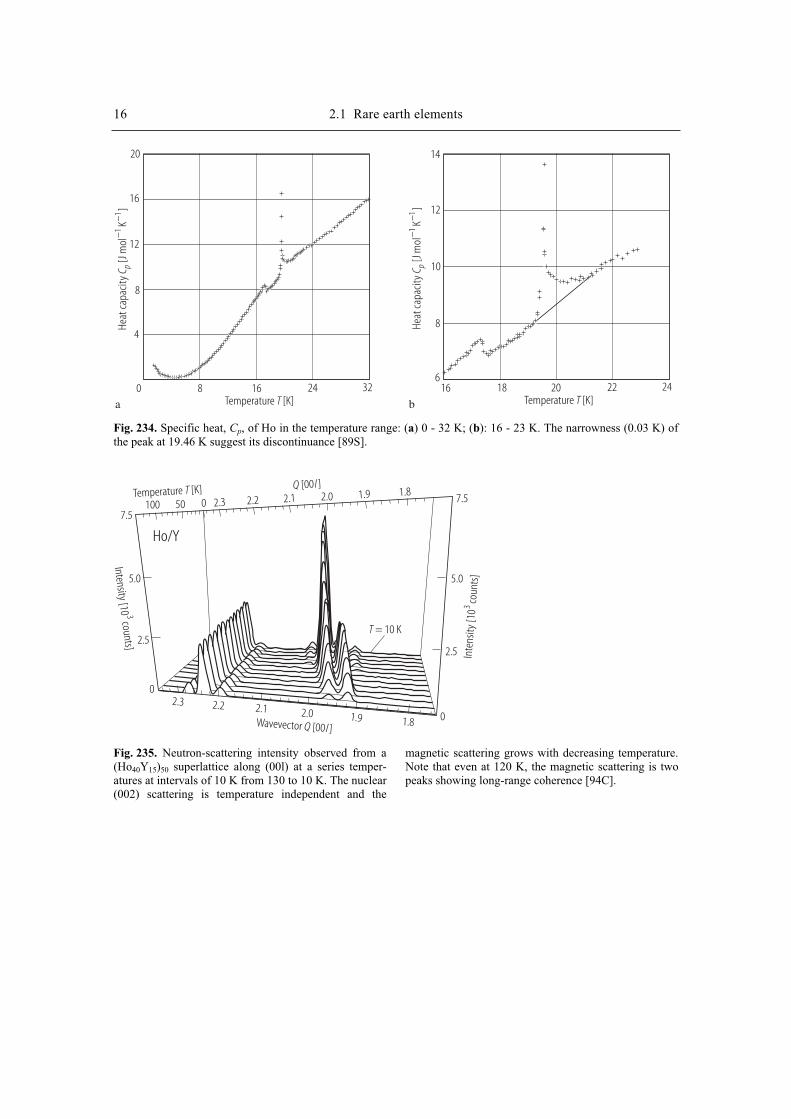
16 2.1 Rare earth elements
Temperature [K]T Temperature [K]T
Heat
capa
city
[Jm
olK
]C p
−−
11
Heat
capa
city
[Jm
olK
]C p
−−
11
20
16
12
12
8
84
0 168 1816 2024 2232 246
10
14
a b
Fig. 234. Specific heat, Cp, of Ho in the temperature range: (a) 0 - 32 K; (b): 16 - 23 K. The narrowness (0.03 K) of the peak at 19.46 K suggest its discontinuance [89S].
Temperature [K]T
Wavevector [00 ]Q l
[00 ]Q l
Intensity [10counts]
3
Inte
nsity
[10
coun
ts]
3
Ho/Y
7.5
5.0
2.5
0
100 50 0
2.3 2.2 2.1 2.0 1.9 1.8
7.5
5.0
2.5
0
2.3 2.2 2.1 2.0 1.9 1.8
T = 10 K
Fig. 235. Neutron-scattering intensity observed from a (Ho40Y15)50 superlattice along (00l) at a series temper-atures at intervals of 10 K from 130 to 10 K. The nuclear (002) scattering is temperature independent and the
magnetic scattering grows with decreasing temperature. Note that even at 120 K, the magnetic scattering is two peaks showing long-range coherence [94C].
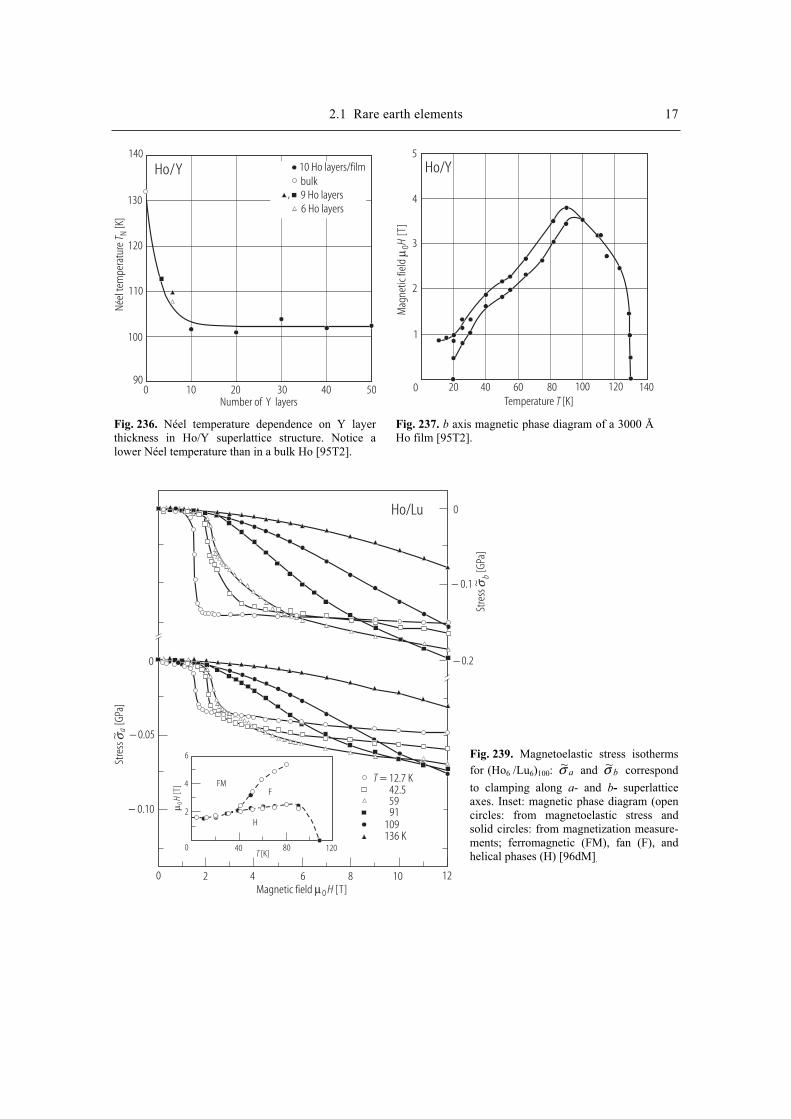
2.1 Rare earth elements 17 Né
el te
mpe
ratu
re[K
]T N
Number of Y layers
Ho/Y140
130
120
110
100
900 10 20 30 40 50
10 Ho layers/filmbulk9 Ho layers6 Ho layers
,
Fig. 236. Néel temperature dependence on Y layerthickness in Ho/Y superlattice structure. Notice alower Néel temperature than in a bulk Ho [95T2].
Temperature [K]TM
agne
tic fi
eld
[T]
µ 0H
Ho/Y5
4
3
2
1
0 20 40 60 80 100 120 140
Fig. 237. b axis magnetic phase diagram of a 3000 Å Ho film [95T2].
[K]T
Magnetic field [T]µ0 H
[T]
µ 0H
Ho/Lu
0
− 0.05
− 0.10
0 2 4 6 8 10 12
0
− 0.1
− 0.2
Stre
ss[G
Pa]
aσ~
Stre
ss[G
Pa]
bσ~
6
4
2
0 40 80 120
FMF
H
T = 12.7 K42.55991
109136 K
Fig. 239. Magnetoelastic stress isotherms
for (Ho6 /Lu6)100: aσ~ and bσ~ correspond
to clamping along a- and b- superlattice axes. Inset: magnetic phase diagram (open circles: from magnetoelastic stress and solid circles: from magnetization measure-ments; ferromagnetic (FM), fan (F), and helical phases (H) [96dM].
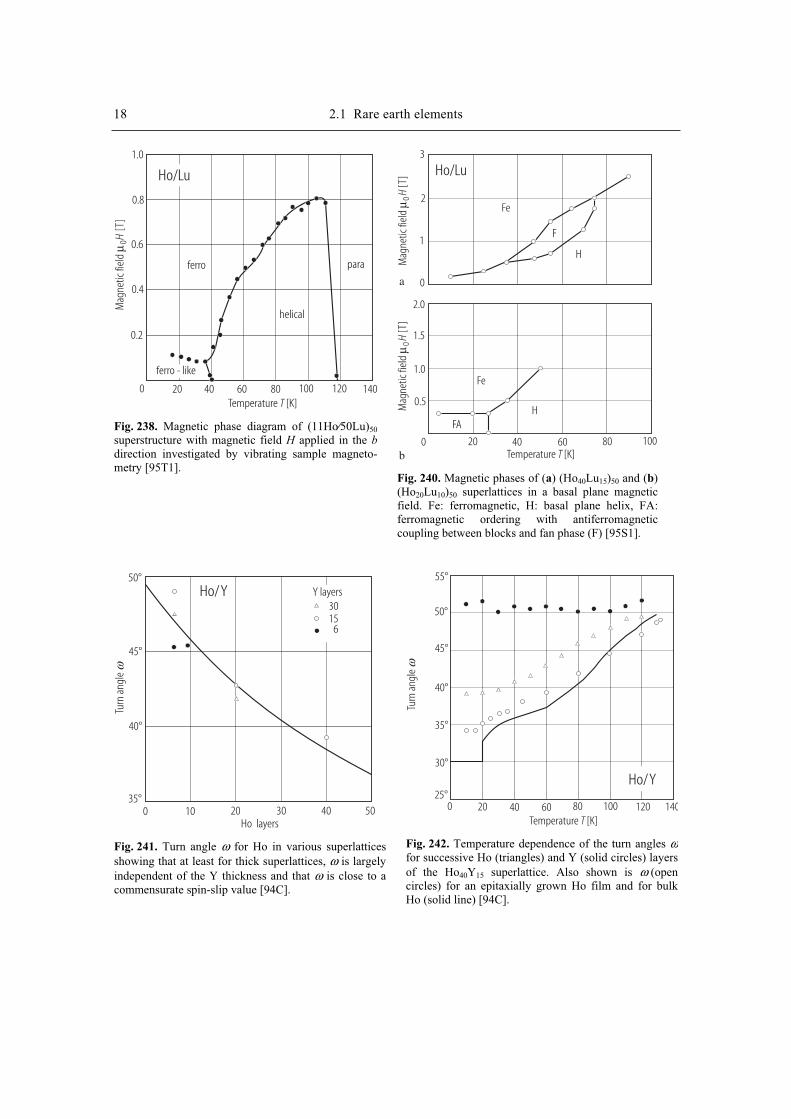
18 2.1 Rare earth elements
Temperature [K]T
Mag
netic
fiel
d[T
]µ 0
H
1.0
0.8
0.6
0.4
0.2
0 20 40 60 80 100 120 140
Ho/Lu
ferro
helical
para
ferro - like
Fig. 238. Magnetic phase diagram of (11Ho⁄50Lu)50
superstructure with magnetic field H applied in the bdirection investigated by vibrating sample magneto-metry [95T1].
Mag
netic
fiel
d[T
]µ 0
HM
agne
tic fi
eld
[T]
µ 0H
Ho/Lu
Temperature [K]T
3
2
1
0
2.0
1.5
1.0
0.5
0 20 40 60 80 100
Fe
HFA
Fe
F
H
a
b
Fig. 240. Magnetic phases of (a) (Ho40Lu15)50 and (b)(Ho20Lu10)50 superlattices in a basal plane magnetic field. Fe: ferromagnetic, H: basal plane helix, FA: ferromagnetic ordering with antiferromagnetic coupling between blocks and fan phase (F) [95S1].
Turn
ang
leω
Ho/Y
Ho layers
50°
45°
40°
35°0 10 20 30 40 50
3015
6
Y layers
Fig. 241. Turn angle ω for Ho in various superlattices showing that at least for thick superlattices, ω is largely independent of the Y thickness and that ω is close to a commensurate spin-slip value [94C].
Turn
ang
leω
Temperature [K]T
Ho/Y
55°
50°
45°
40°
35°
30°
25°0 20 40 60 80 100 120 140
Fig. 242. Temperature dependence of the turn angles ωfor successive Ho (triangles) and Y (solid circles) layers of the Ho40Y15 superlattice. Also shown is ω (opencircles) for an epitaxially grown Ho film and for bulkHo (solid line) [94C].
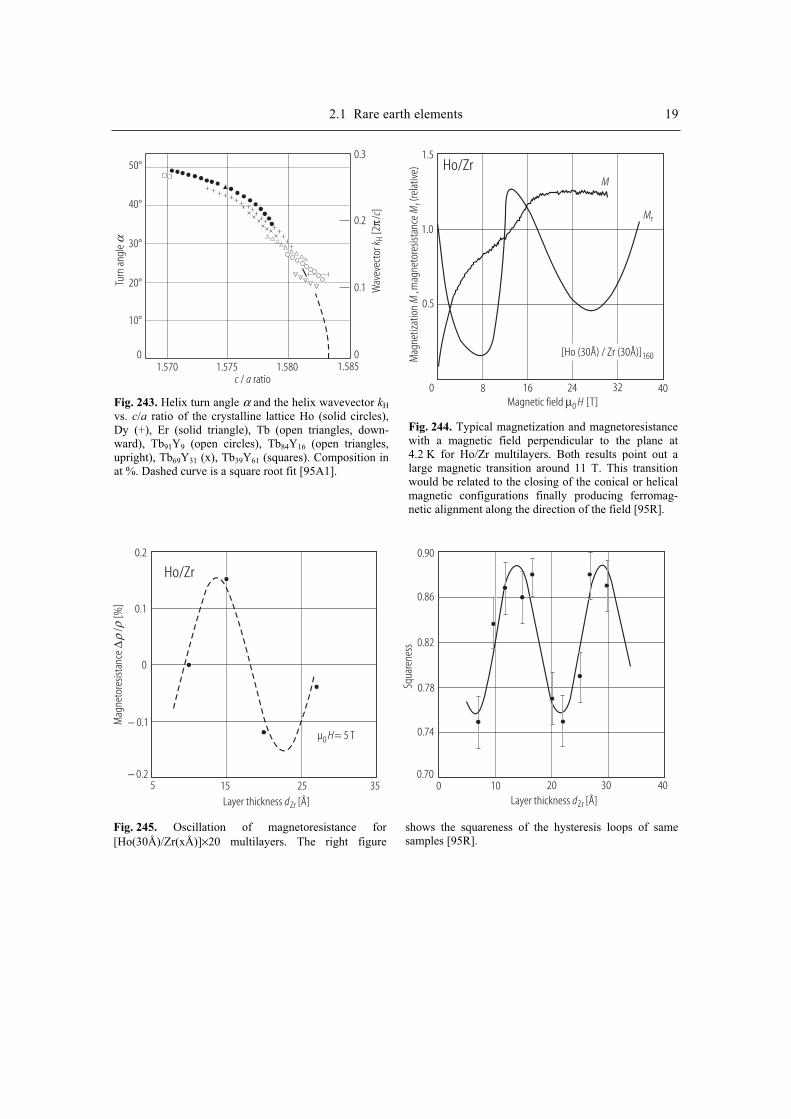
2.1 Rare earth elements 19 Tu
rn a
ngle
α
c a/ ratio
50°
40°
30°
20°
10°
01.570 1.575 1.580 1.585
0.3
0.2
0.1
0
Wav
evec
tor
[2/
]k
cH
π
Fig. 243. Helix turn angle α and the helix wavevector kH
vs. c/a ratio of the crystalline lattice Ho (solid circles), Dy (+), Er (solid triangle), Tb (open triangles, down-ward), Tb91Y9 (open circles), Tb84Y16 (open triangles,upright), Tb69Y31 (x), Tb39Y61 (squares). Composition inat %. Dashed curve is a square root fit [95A1].
Magnetic field [T]µ0 H
Ho/Zr
Mag
netiz
atio
n,m
agne
tore
sista
nce
(rela
tive)
MM
r
M
Mr
1.5
1.0
0.5
0 8 16 24 32 40
[Ho (30Å) / Zr (30Å)]160
Fig. 244. Typical magnetization and magnetoresistance with a magnetic field perpendicular to the plane at 4.2 K for Ho/Zr multilayers. Both results point out a large magnetic transition around 11 T. This transition would be related to the closing of the conical or helical magnetic configurations finally producing ferromag-netic alignment along the direction of the field [95R].
Layer thickness [Å]dZr Layer thickness [Å]dZr
Ho/Zr0.2
0.1
0
− 0.1
− 0.25 15 25 35
µ = 5 T0 H
Mag
neto
resis
tanc
e/
[%]
∆ρ
ρ
0.90
0.86
0.82
0.78
0.74
0.700 10 20 30 40
Squa
rene
ss
Fig. 245. Oscillation of magnetoresistance for [Ho(30Å)/Zr(xÅ)]×20 multilayers. The right figure
shows the squareness of the hysteresis loops of same samples [95R].
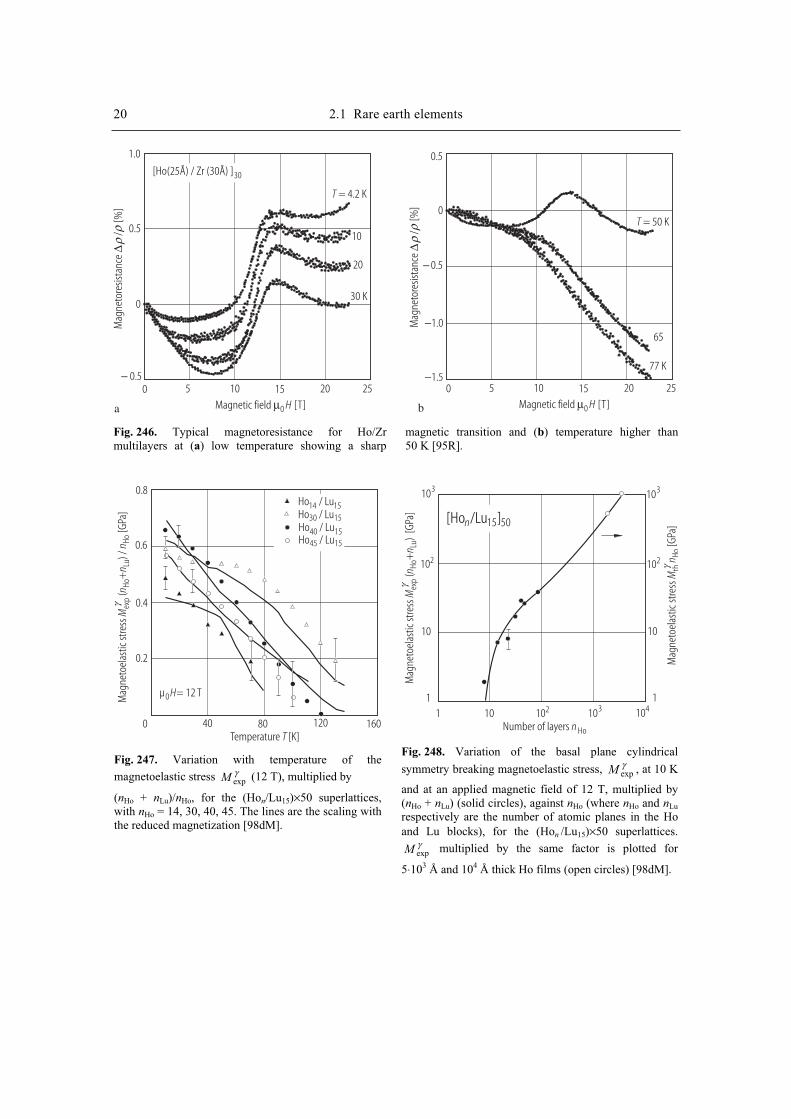
20 2.1 Rare earth elements M
agne
tore
sista
nce
/[%
]∆
ρρ
Mag
neto
resis
tanc
e/
[%]
∆ρ
ρMagnetic field [T]µ0 H Magnetic field [T]µ0 H
1.0
0.5
0
− 0.50 05 510 1015 1520 2025 25
T = 4.2 K
T = 50 K10
20
30 K
[Ho(25Å) / Zr (30Å) ]30
a b
0.5
0
− 0.5
−1.0
−1.5
65
77 K
Fig. 246. Typical magnetoresistance for Ho/Zr multilayers at (a) low temperature showing a sharp
magnetic transition and (b) temperature higher than 50 K [95R].
Temperature [K]T
0.8
0.6
0.4
0.2
0 40 80 120 160
µ = 12 T0H
Ho / Lu14 15Ho / Lu30 15Ho / Lu40 15Ho / Lu45 15
Mag
neto
elas
tic st
ress
(+
) /[G
Pa]
Mn
nn
exp
HoLu
Hoγ
Fig. 247. Variation with temperature of the
magnetoelastic stress γexpM (12 T), multiplied by
(nHo + nLu)/nHo, for the (Hon/Lu15)×50 superlattices,with nHo = 14, 30, 40, 45. The lines are the scaling withthe reduced magnetization [98dM].
Mag
neto
elas
tic st
ress
(+
) [G
Pa]
Mn
nex
pHo
Luγ
Mag
neto
elas
tic st
ress
[GPa
]M
nth
Hoγ
Number of layers n Ho
[Ho /Lu ]n 15 50
103
103
103
102
102
102
10
10
10
11
1104
Fig. 248. Variation of the basal plane cylindrical
symmetry breaking magnetoelastic stress, γexpM , at 10 K
and at an applied magnetic field of 12 T, multiplied by (nHo + nLu) (solid circles), against nHo (where nHo and nLu
respectively are the number of atomic planes in the Ho and Lu blocks), for the (Hon /Lu15)×50 superlattices.
γexpM multiplied by the same factor is plotted for
5⋅103 Å and 104 Å thick Ho films (open circles) [98dM].
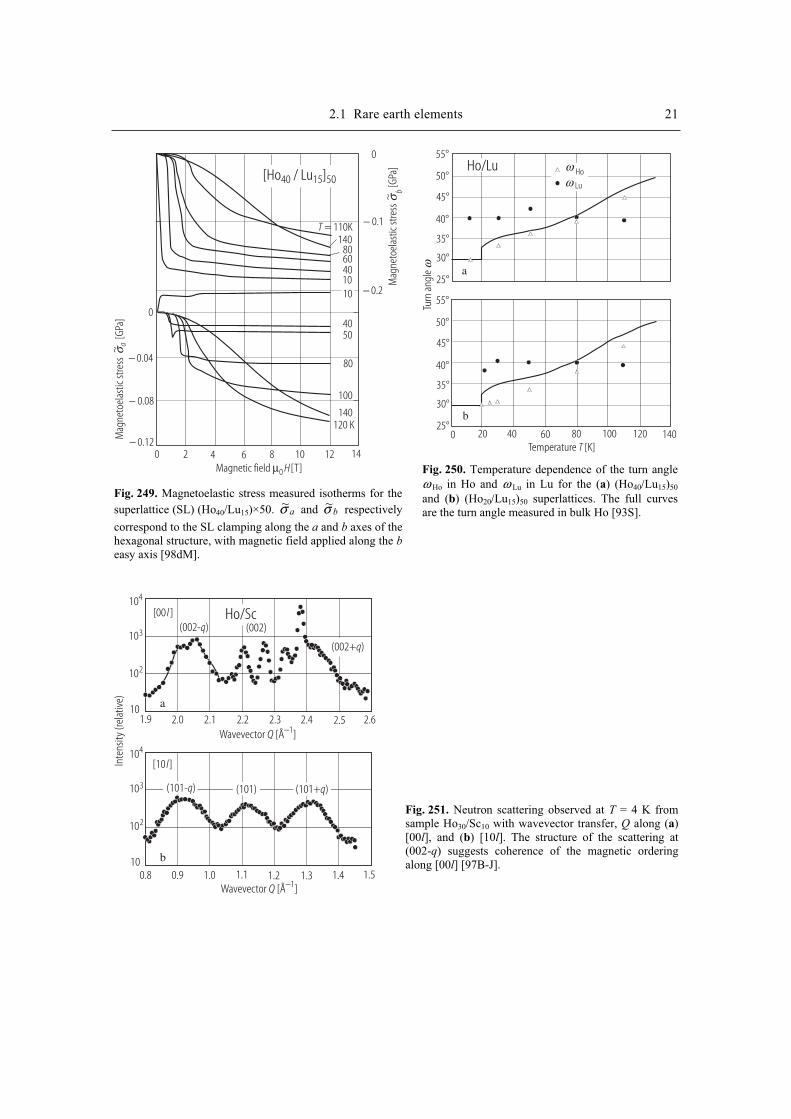
2.1 Rare earth elements 21
Magnetic field [T]µ0 H
T = 110K
Mag
neto
elas
tic st
ress
[GPa
]aσ~
Mag
neto
elas
tic st
ress
[GPa
]bσ~
0 2 4 6 8 10 12 14
0
− 0.04
− 0.08
− 0.12
0
− 0.1
− 0.2
[Ho / Lu ]40 15 50
14080604010
4050
80
100
140120 K
10
Fig. 249. Magnetoelastic stress measured isotherms for the
superlattice (SL) (Ho40/Lu15)×50. aσ~ and bσ~ respectively
correspond to the SL clamping along the a and b axes of the hexagonal structure, with magnetic field applied along the beasy axis [98dM].
Temperature [K]T
Turn
ang
leω
ωω
Ho
Lu
Ho/Lu55°
55°
50°
50°
45°
45°
40°
40°
35°
35°
30°
30°
25°
25°0 20 40 60 80 100 120 140
a
b
Fig. 250. Temperature dependence of the turn angle ω Ho in Ho and ω Lu in Lu for the (a) (Ho40/Lu15)50
and (b) (Ho20/Lu15)50 superlattices. The full curves are the turn angle measured in bulk Ho [93S].
Inte
nsity
(rel
ativ
e)
Wavevector [Å ]Q −1
Wavevector [Å ]Q −1
Ho/Sc[00 ]l
[10 ]l
(002- )q (002)
(002+ )q
(101- )q (101) (101+ )q
104
104
103
103
102
102
10
10
1.9 2.0 2.1 2.2 2.3 2.4 2.5 2.6
0.8 0.9 1.0 1.1 1.2 1.3 1.4 1.5
a
b
Fig. 251. Neutron scattering observed at T = 4 K from sample Ho30/Sc10 with wavevector transfer, Q along (a)[00l], and (b) [10l]. The structure of the scattering at (002-q) suggests coherence of the magnetic ordering along [00l] [97B-J].
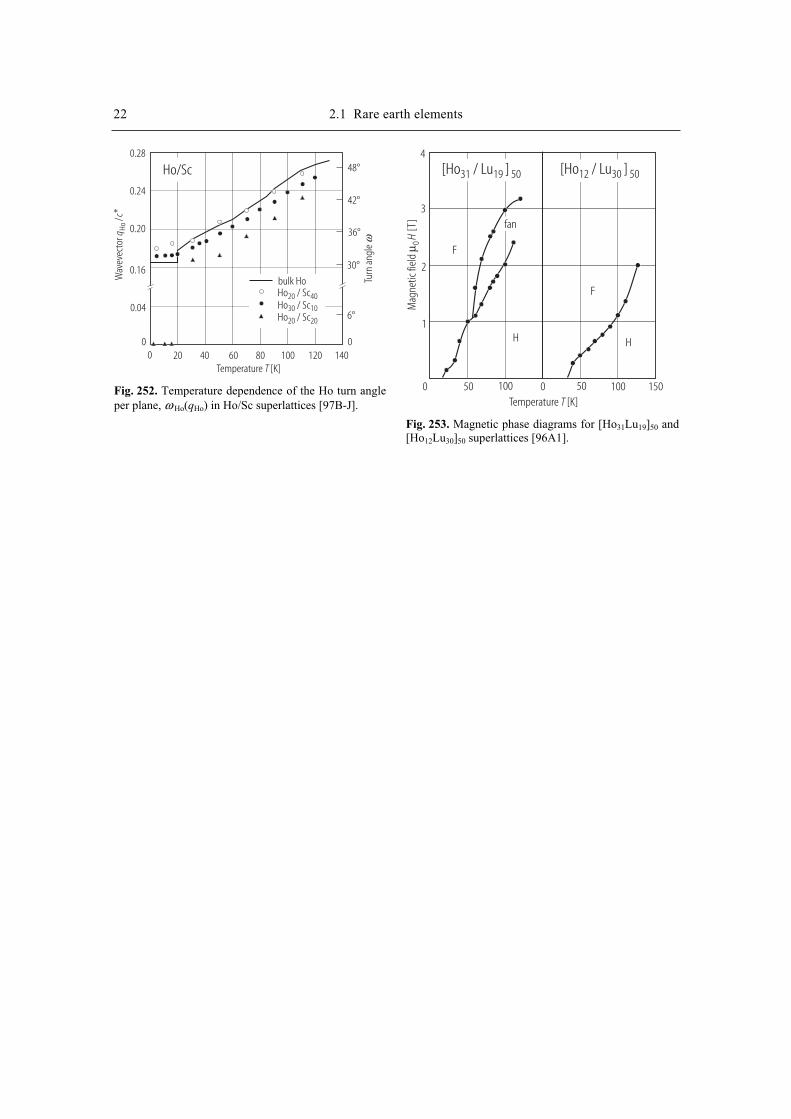
22 2.1 Rare earth elements
Temperature [K]T
Wav
evec
tor
/*
qc
Ho
Turn
ang
leω
Ho/Sc
bulk HoHo / Sc20 40Ho / Sc30 10Ho / Sc20 20
0.28
0.24
0.20
0.16
0.04
00 20 40 60 80 100 120 140
48°
42°
36°
30°
6°
0
Fig. 252. Temperature dependence of the Ho turn angle per plane, ω Ho(qHo) in Ho/Sc superlattices [97B-J]. Temperature [K]T
Mag
netic
fiel
d[T
]µ 0
H
4
3
2
1
0 50 100 0 50 100 150
F
H
F
H
fan
[Ho / Lu ]31 19 50 [Ho / Lu ]12 30 50
Fig. 253. Magnetic phase diagrams for [Ho31Lu19]50 and[Ho12Lu30]50 superlattices [96A1].
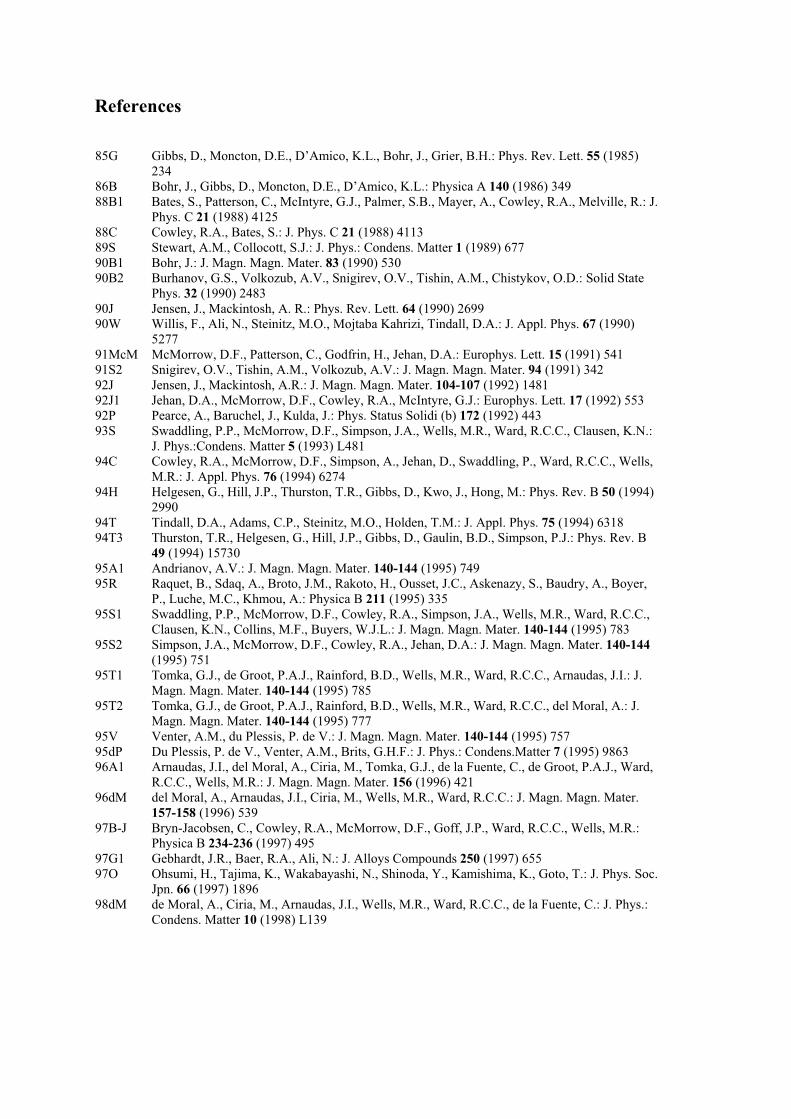
References
85G Gibbs, D., Moncton, D.E., D’Amico, K.L., Bohr, J., Grier, B.H.: Phys. Rev. Lett. 55 (1985)
234
86B Bohr, J., Gibbs, D., Moncton, D.E., D’Amico, K.L.: Physica A 140 (1986) 349
88B1 Bates, S., Patterson, C., McIntyre, G.J., Palmer, S.B., Mayer, A., Cowley, R.A., Melville, R.: J.
Phys. C 21 (1988) 4125
88C Cowley, R.A., Bates, S.: J. Phys. C 21 (1988) 4113
89S Stewart, A.M., Collocott, S.J.: J. Phys.: Condens. Matter 1 (1989) 677
90B1 Bohr, J.: J. Magn. Magn. Mater. 83 (1990) 530
90B2 Burhanov, G.S., Volkozub, A.V., Snigirev, O.V., Tishin, A.M., Chistykov, O.D.: Solid State
Phys. 32 (1990) 2483
90J Jensen, J., Mackintosh, A. R.: Phys. Rev. Lett. 64 (1990) 2699
90W Willis, F., Ali, N., Steinitz, M.O., Mojtaba Kahrizi, Tindall, D.A.: J. Appl. Phys. 67 (1990)
5277
91McM McMorrow, D.F., Patterson, C., Godfrin, H., Jehan, D.A.: Europhys. Lett. 15 (1991) 541
91S2 Snigirev, O.V., Tishin, A.M., Volkozub, A.V.: J. Magn. Magn. Mater. 94 (1991) 342
92J Jensen, J., Mackintosh, A.R.: J. Magn. Magn. Mater. 104-107 (1992) 1481
92J1 Jehan, D.A., McMorrow, D.F., Cowley, R.A., McIntyre, G.J.: Europhys. Lett. 17 (1992) 553
92P Pearce, A., Baruchel, J., Kulda, J.: Phys. Status Solidi (b) 172 (1992) 443
93S Swaddling, P.P., McMorrow, D.F., Simpson, J.A., Wells, M.R., Ward, R.C.C., Clausen, K.N.:
J. Phys.:Condens. Matter 5 (1993) L481
94C Cowley, R.A., McMorrow, D.F., Simpson, A., Jehan, D., Swaddling, P., Ward, R.C.C., Wells,
M.R.: J. Appl. Phys. 76 (1994) 6274
94H Helgesen, G., Hill, J.P., Thurston, T.R., Gibbs, D., Kwo, J., Hong, M.: Phys. Rev. B 50 (1994)
2990
94T Tindall, D.A., Adams, C.P., Steinitz, M.O., Holden, T.M.: J. Appl. Phys. 75 (1994) 6318
94T3 Thurston, T.R., Helgesen, G., Hill, J.P., Gibbs, D., Gaulin, B.D., Simpson, P.J.: Phys. Rev. B
49 (1994) 15730
95A1 Andrianov, A.V.: J. Magn. Magn. Mater. 140-144 (1995) 749
95R Raquet, B., Sdaq, A., Broto, J.M., Rakoto, H., Ousset, J.C., Askenazy, S., Baudry, A., Boyer,
P., Luche, M.C., Khmou, A.: Physica B 211 (1995) 335
95S1 Swaddling, P.P., McMorrow, D.F., Cowley, R.A., Simpson, J.A., Wells, M.R., Ward, R.C.C.,
Clausen, K.N., Collins, M.F., Buyers, W.J.L.: J. Magn. Magn. Mater. 140-144 (1995) 783
95S2 Simpson, J.A., McMorrow, D.F., Cowley, R.A., Jehan, D.A.: J. Magn. Magn. Mater. 140-144
(1995) 751
95T1 Tomka, G.J., de Groot, P.A.J., Rainford, B.D., Wells, M.R., Ward, R.C.C., Arnaudas, J.I.: J.
Magn. Magn. Mater. 140-144 (1995) 785
95T2 Tomka, G.J., de Groot, P.A.J., Rainford, B.D., Wells, M.R., Ward, R.C.C., del Moral, A.: J.
Magn. Magn. Mater. 140-144 (1995) 777
95V Venter, A.M., du Plessis, P. de V.: J. Magn. Magn. Mater. 140-144 (1995) 757
95dP Du Plessis, P. de V., Venter, A.M., Brits, G.H.F.: J. Phys.: Condens.Matter 7 (1995) 9863
96A1 Arnaudas, J.I., del Moral, A., Ciria, M., Tomka, G.J., de la Fuente, C., de Groot, P.A.J., Ward,
R.C.C., Wells, M.R.: J. Magn. Magn. Mater. 156 (1996) 421
96dM del Moral, A., Arnaudas, J.I., Ciria, M., Wells, M.R., Ward, R.C.C.: J. Magn. Magn. Mater.
157-158 (1996) 539
97B-J Bryn-Jacobsen, C., Cowley, R.A., McMorrow, D.F., Goff, J.P., Ward, R.C.C., Wells, M.R.:
Physica B 234-236 (1997) 495
97G1 Gebhardt, J.R., Baer, R.A., Ali, N.: J. Alloys Compounds 250 (1997) 655
97O Ohsumi, H., Tajima, K., Wakabayashi, N., Shinoda, Y., Kamishima, K., Goto, T.: J. Phys. Soc.
Jpn. 66 (1997) 1896
98dM de Moral, A., Ciria, M., Arnaudas, J.I., Wells, M.R., Ward, R.C.C., de la Fuente, C.: J. Phys.:
Condens. Matter 10 (1998) L139
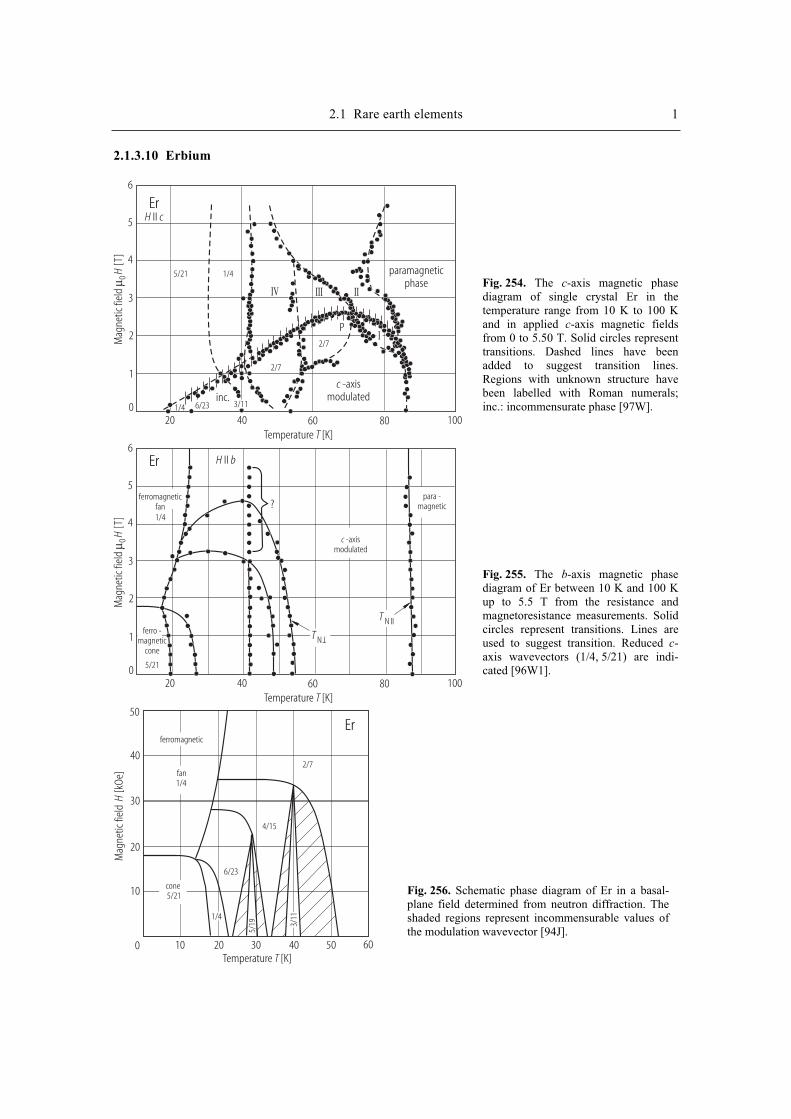
2.1 Rare earth elements 1
2.1.3.10 Erbium
Temperature [K]T
Mag
netic
fiel
d[T
]µ 0
H
6
5
4
3
2
1
020 40 60 80 100
ErH cII
5/21 1/4
2/7
2/7
inc.6/231/4 3/11
P
c -axismodulated
paramagneticphase
IIIIIIV
I
Temperature [K]T
Mag
netic
fiel
d[T
]µ 0
H
6
5
4
3
2
1
020 40 60 80 100
Er H bII
5/21
1/4
para -magnetic
c -axismodulated
ferromagneticfan
ferro -magnetic
cone
T N
T
T N II
?
Temperature [K]T
Mag
netic
fiel
d[k
Oe]
H
Erferromagnetic
fan1/4
cone5/21
6/23
4/15
2/7
5/19
1/4
3/11
50
40
30
20
10
0 10 20 30 40 50 60
Fig. 256. Schematic phase diagram of Er in a basal-plane field determined from neutron diffraction. The shaded regions represent incommensurable values of the modulation wavevector [94J].
Fig. 254. The c-axis magnetic phase diagram of single crystal Er in the temperature range from 10 K to 100 K and in applied c-axis magnetic fields from 0 to 5.50 T. Solid circles represent transitions. Dashed lines have been added to suggest transition lines. Regions with unknown structure have been labelled with Roman numerals; inc.: incommensurate phase [97W].
Fig. 255. The b-axis magnetic phase diagram of Er between 10 K and 100 K up to 5.5 T from the resistance and magnetoresistance measurements. Solid circles represent transitions. Lines are used to suggest transition. Reduced c-axis wavevectors (1/4, 5/21) are indi-cated [96W1].
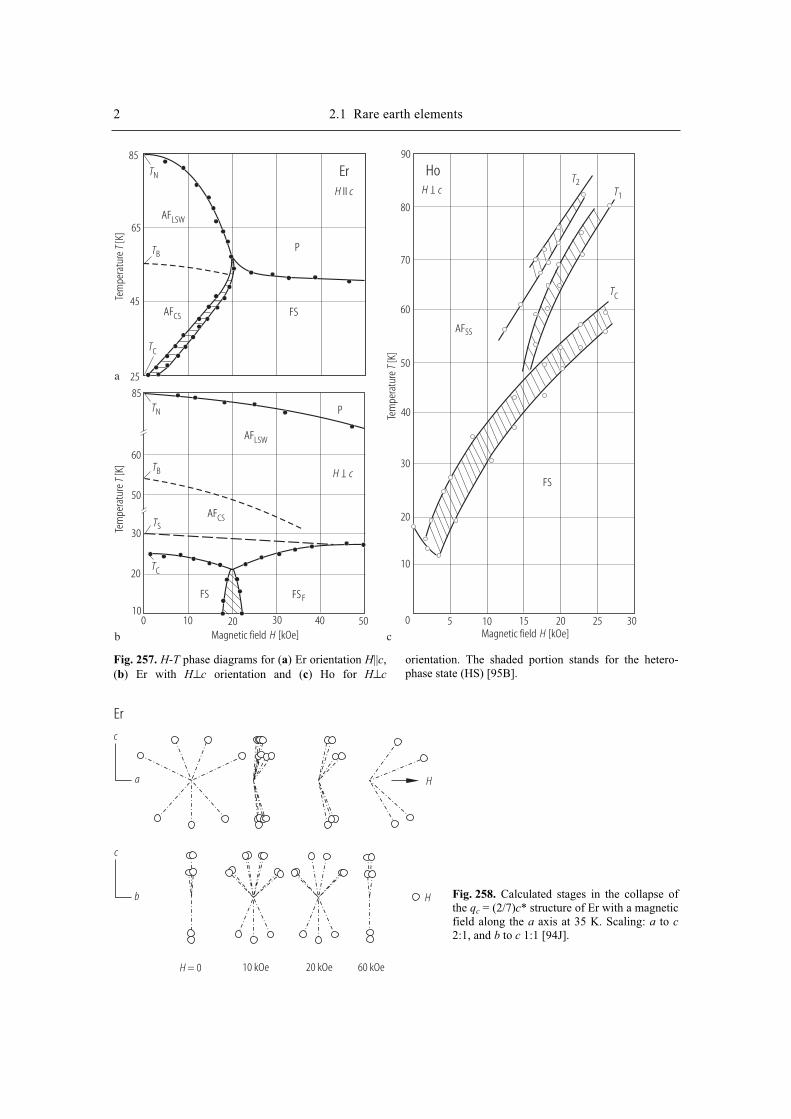
2 2.1 Rare earth elements Te
mpe
ratu
re[K
]T
Tem
pera
ture
[K]
T
Tem
pera
ture
[K]
T
Magnetic field [kOe]H Magnetic field [kOe]H
H cII
H c
H c
Er85
65
45
25
TB
TB
TN
TN
AFLSW
AFLSW
P
P
FS
FS
FS FS
AFCS
AFCS
TC
TC
TC
85
60
50
30
20
100 10 20 30 40 50
F
TS
T
T
b
a
AFSS
T2T1
90
80
70
60
50
40
30
20
10
0 5 10 15 20 25 30c
Ho
Fig. 257. H-T phase diagrams for (a) Er orientation H||c,(b) Er with H⊥c orientation and (c) Ho for H⊥c
orientation. The shaded portion stands for the hetero-phase state (HS) [95B].
c
a
c
b
H
H
Er
H = 0 10 kOe 20 kOe 60 kOe
Fig. 258. Calculated stages in the collapse of the qc = (2/7)c* structure of Er with a magnetic field along the a axis at 35 K. Scaling: a to c2:1, and b to c 1:1 [94J].
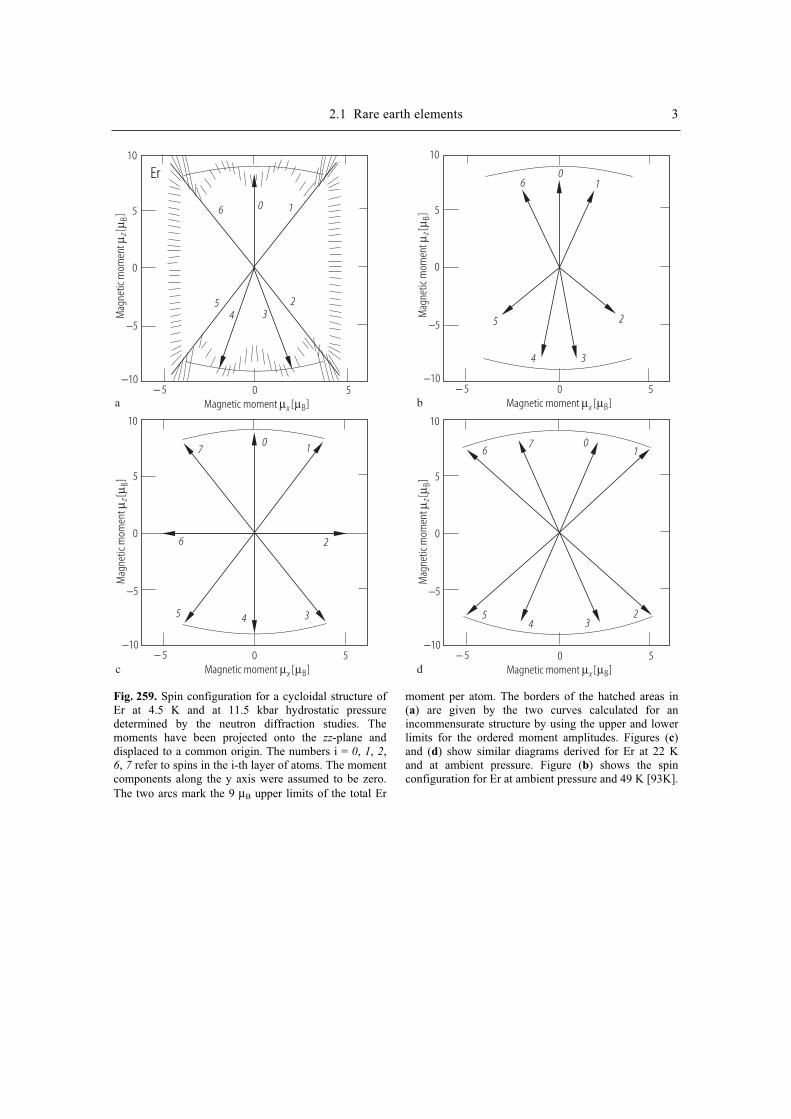
2.1 Rare earth elements 3
Er
Mag
netic
mom
ent
[]
µµ
zB
Magnetic moment [ ]µ µx B
− 5 0 5
10
5
0
−5
−10
Mag
netic
mom
ent
[]
µµ
zB
Magnetic moment [ ]µ µx B
− 5 0 5
10
5
0
−5
−10
Mag
netic
mom
ent
[]
µµ
zB
Magnetic moment [ ]µ µx B
− 5 0 5
10
5
0
−5
−10
Mag
netic
mom
ent
[]
µµ
zB
Magnetic moment [ ]µ µx B
− 5 0 5
10
5
0
−5
−10
a b
c d
6 0 1
54 3
2
016
5
4 3
2
67 0
1
54 3
2
70 1
6 2
5 4 3
Fig. 259. Spin configuration for a cycloidal structure of Er at 4.5 K and at 11.5 kbar hydrostatic pressure determined by the neutron diffraction studies. The moments have been projected onto the zz-plane and displaced to a common origin. The numbers i = 0, 1, 2,6, 7 refer to spins in the i-th layer of atoms. The moment components along the y axis were assumed to be zero. The two arcs mark the 9 µB upper limits of the total Er
moment per atom. The borders of the hatched areas in (a) are given by the two curves calculated for an incommensurate structure by using the upper and lower limits for the ordered moment amplitudes. Figures (c)and (d) show similar diagrams derived for Er at 22 K and at ambient pressure. Figure (b) shows the spin configuration for Er at ambient pressure and 49 K [93K].
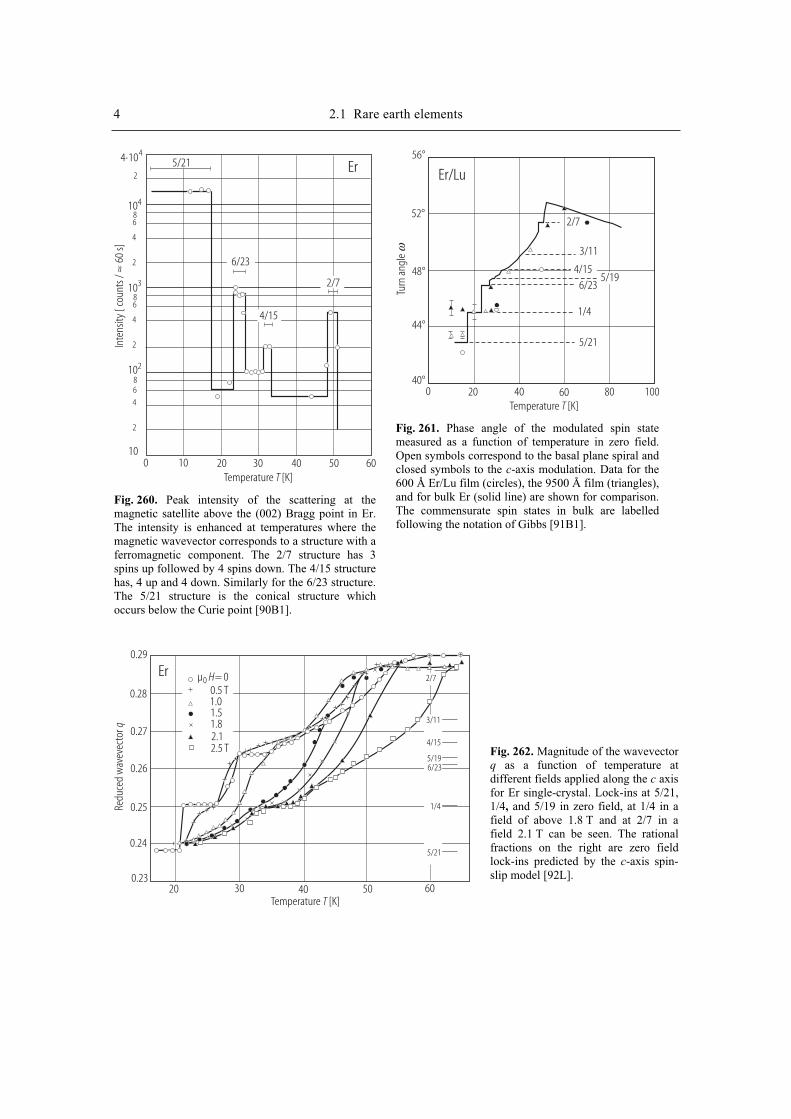
4 2.1 Rare earth elements
Temperature [K]T
Inte
nsity
[ co
unts
/60
s]≈
Er
0 10 20 30 40 50 60
5/21
6/23
4/15
2/7
104
103
102
10
4 10⋅ 4
2
86
4
2
86
4
2
86
4
2
Fig. 260. Peak intensity of the scattering at themagnetic satellite above the (002) Bragg point in Er.The intensity is enhanced at temperatures where themagnetic wavevector corresponds to a structure with aferromagnetic component. The 2/7 structure has 3spins up followed by 4 spins down. The 4/15 structurehas, 4 up and 4 down. Similarly for the 6/23 structure. The 5/21 structure is the conical structure whichoccurs below the Curie point [90B1].
Temperature [K]TTu
rn a
ngle
ω
Er/Lu56°
52°
48°
44°
40°0 20 40 60 80 100
2/7
3/11
6/23
1/4
5/21
5/194/15
Fig. 261. Phase angle of the modulated spin state measured as a function of temperature in zero field. Open symbols correspond to the basal plane spiral and closed symbols to the c-axis modulation. Data for the 600 Å Er/Lu film (circles), the 9500 Å film (triangles), and for bulk Er (solid line) are shown for comparison. The commensurate spin states in bulk are labelledfollowing the notation of Gibbs [91B1].
Temperature [K]T
Redu
ced
wav
evec
torq
Er0.29
0.28
0.27
0.26
0.25
0.24
0.2320 30 40 50 60
2/7
3/11
4/15
5/196/23
1/4
5/21
µ = 00 H0.5 T1.01.51.82.12.5 T Fig. 262. Magnitude of the wavevector
q as a function of temperature at different fields applied along the c axis for Er single-crystal. Lock-ins at 5/21, 1/4, and 5/19 in zero field, at 1/4 in a field of above 1.8 T and at 2/7 in a field 2.1 T can be seen. The rational fractions on the right are zero field lock-ins predicted by the c-axis spin-slip model [92L].
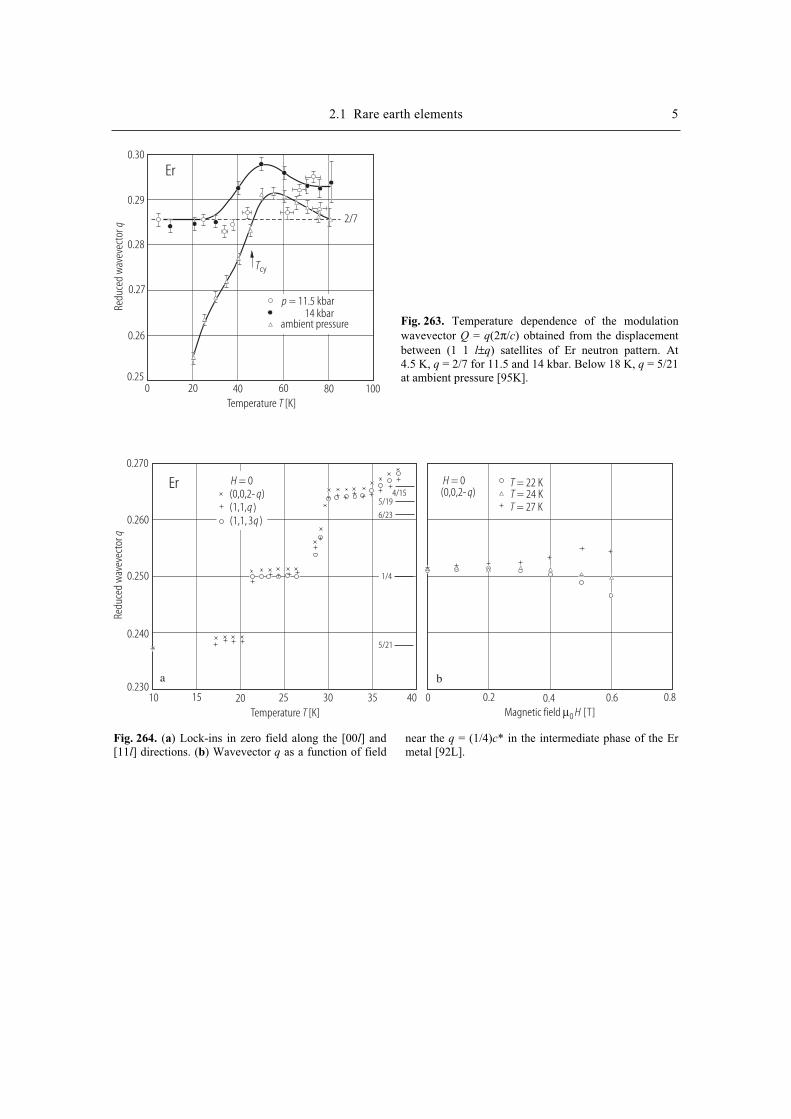
2.1 Rare earth elements 5
Temperature [K]T
Redu
ced
wav
evec
torq
Er0.30
0.29
0.28
0.27
0.26
0.250 20 40 60 80 100
2/7
Tcy
p = 11.5 kbar14 kbar
ambient pressure
Temperature [K]T
Redu
ced
wav
evec
torq
Er0.270
0.260
0.250
0.240
0.23010 15 20 25 30 35 40 0 0.2 0.4 0.6 0.8
Magnetic field [T]µ0 H
H = 0H = 0(0,0,2- )q(1,1, )q(1,1, 3 )q
4/155/19
6/23
5/21
1/4
(0,0,2- )qT = 22 KT = 24 KT = 27 K
a b
Fig. 264. (a) Lock-ins in zero field along the [00l] and [11l] directions. (b) Wavevector q as a function of field
near the q = (1/4)c* in the intermediate phase of the Er metal [92L].
Fig. 263. Temperature dependence of the modulation wavevector Q = q(2π/c) obtained from the displacement between (1 1 l±q) satellites of Er neutron pattern. At 4.5 K, q = 2/7 for 11.5 and 14 kbar. Below 18 K, q = 5/21 at ambient pressure [95K].
6 2.1 Rare earth elements M
agne
tizat
ion
[G
cmg
]3
1−σ
Mag
netiz
atio
n
[G cm
g]
31−
σMag
netiz
atio
n
[G cm
g]
31−
σ
Mag
netiz
atio
n
[G cm
g]
31−
σ
Temperature [K]T Temperature [K]T
Temperature [K]T Temperature [K]T
ErH aIIH cII
H = 12 kOeH = 12 kOe
H = 2 kOe
H = 2 kOe
H = 2 kOe
H = 2 kOe
300
200
100
0 0100 100200 200300 300
20
10
0 100 200 300
10
5
2
1
40 100 160
a b
Fig. 265. (a) Temperature dependencies σ(T) of Er in the field H||c in cooling the sample at 12 kOe and 2 kOe. Hysteresis of σ(T) near the temperature 82 K is shown in the inset on an enlarged scale. (b) Temperature dependencies σ(T) of Er in the field H||a in cooling the sample at 12 kOe and 2 kOe. Hysteresis of σ(T) near
82 K is shown in the inset on an enlarged scale. Both in the case H||c and H||a the magnetization hysteresis in the vicinity of 82 K does exist. In the field H||c no maximum of magnetization is observed at 52 K where the LSW – CS transition occurs [92S].
Mag
netiz
atio
n
[G cm
g]
31−
σ
Mag
netiz
atio
n
[G cm
g]
31−
σ
ErH cII
a bMagnetic field [kOe]H Magnetic field [kOe]H
280
200
280
200
T = 4.2 K
8.5 K
ααα
α
αα
αα
1
1
2
2
3
3
4
4
0 10 20 30 40
300
250
200
150
100
50
0 10 20 30 40
T = 21 K29 3350
4558 K
Fig. 266. Measured field dependencies of the magnetization of Er single crystal in the field applied along the axis of easy magnetization, the c axis. In the
region of weak fields four bends are observed (αi )[91G]. (a) T = 4.2 and 8.5 K, (b) 21 K < T < 58 K.
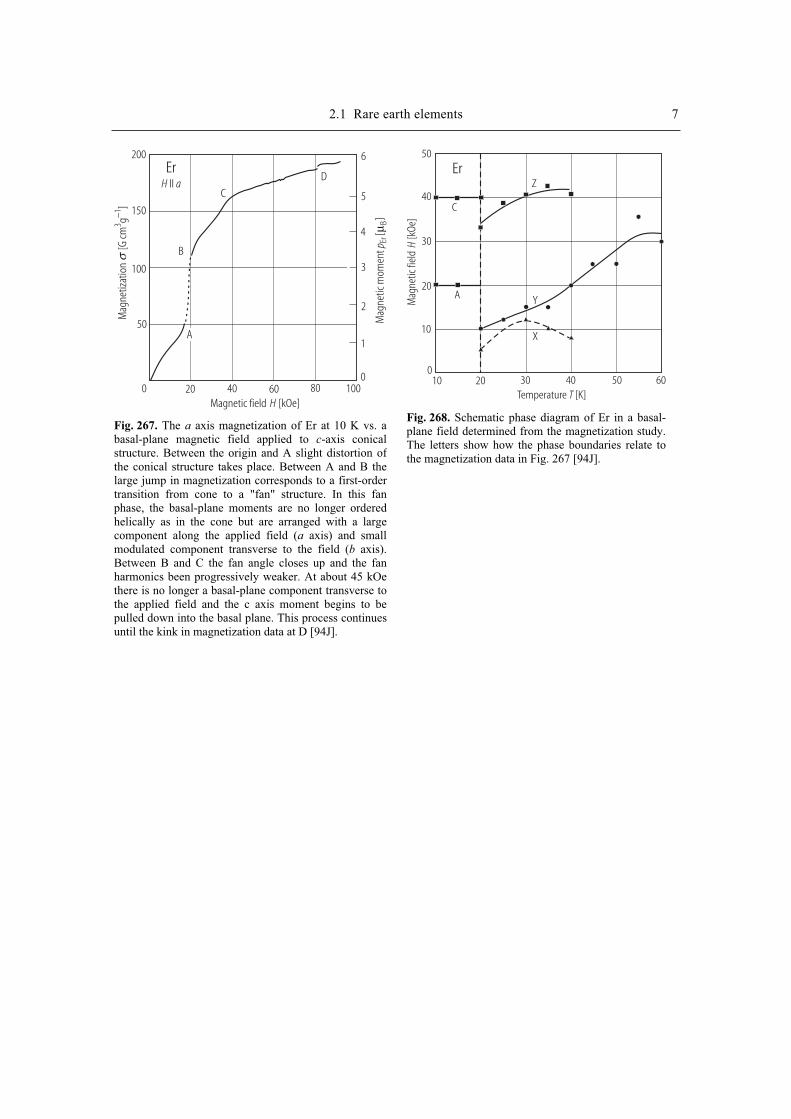
2.1 Rare earth elements 7 M
agne
tizat
ion
[G
cmg
]3
1−σ
H aII
Magnetic field [kOe]H
Mag
netic
mom
ent
[]
p ErBµ
Er200
150
100
50
0 20 40 60 80 100
6
5
4
3
2
1
0
D
C
B
A
Fig. 267. The a axis magnetization of Er at 10 K vs. abasal-plane magnetic field applied to c-axis conicalstructure. Between the origin and A slight distortion ofthe conical structure takes place. Between A and B thelarge jump in magnetization corresponds to a first-ordertransition from cone to a "fan" structure. In this fanphase, the basal-plane moments are no longer orderedhelically as in the cone but are arranged with a largecomponent along the applied field (a axis) and smallmodulated component transverse to the field (b axis). Between B and C the fan angle closes up and the fanharmonics been progressively weaker. At about 45 kOethere is no longer a basal-plane component transverse to the applied field and the c axis moment begins to bepulled down into the basal plane. This process continues until the kink in magnetization data at D [94J].
Mag
netic
fiel
d[k
Oe]
H
Er
Temperature [K]T
50
40
30
20
10
010 20 30 40 50 60
Z
C
A Y
X
Fig. 268. Schematic phase diagram of Er in a basal-plane field determined from the magnetization study. The letters show how the phase boundaries relate to the magnetization data in Fig. 267 [94J].
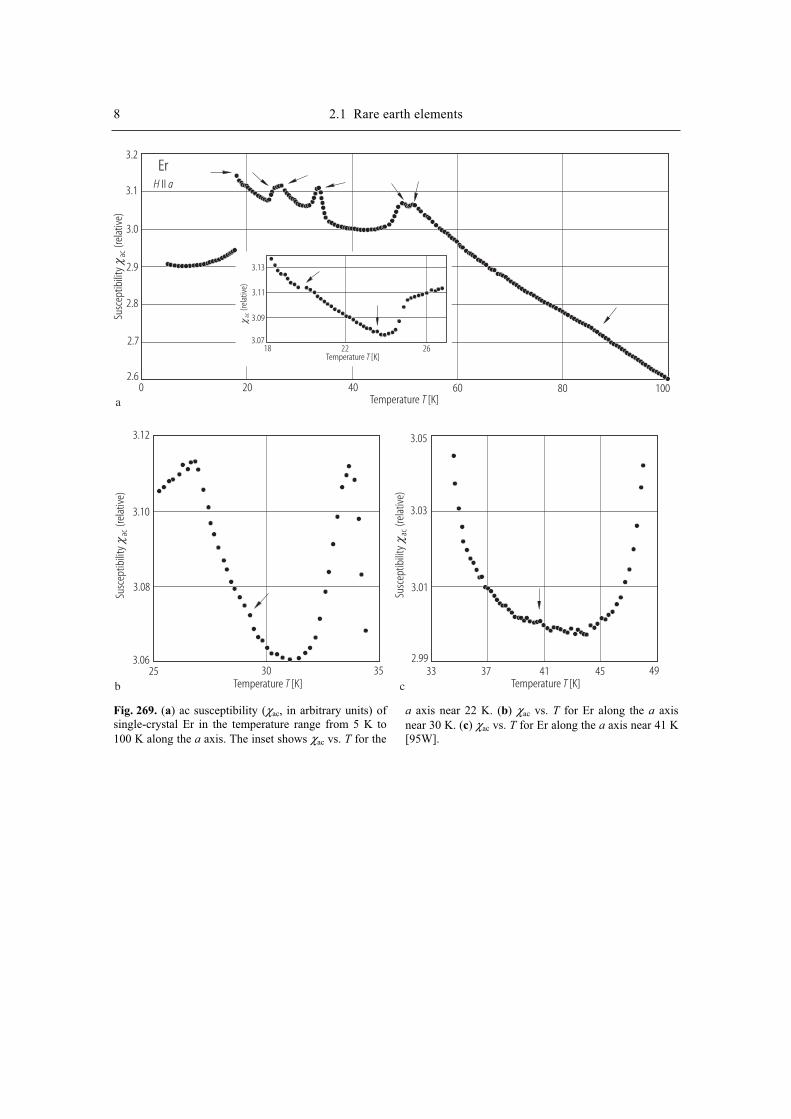
8 2.1 Rare earth elements
Temperature [K]T
Temperature [K]T
Susc
eptib
ility
(rela
tive)
acχ
(rela
tive)
acχ
Temperature [K]T Temperature [K]T
3.2
3.1
3.0
2.9
2.8
2.7
2.60 20 40 60 80 100
ErH aII
3.13
3.11
3.09
3.0718 22 26
a
Susc
eptib
ility
(rela
tive)
acχ
Susc
eptib
ility
(rela
tive)
acχ
3.12
3.10
3.08
3.0625 30 35 37 41 45 4933
3.05
3.03
3.01
2.99
b c
Fig. 269. (a) ac susceptibility (χac, in arbitrary units) of single-crystal Er in the temperature range from 5 K to 100 K along the a axis. The inset shows χac vs. T for the
a axis near 22 K. (b) χac vs. T for Er along the a axis near 30 K. (c) χac vs. T for Er along the a axis near 41 K [95W].
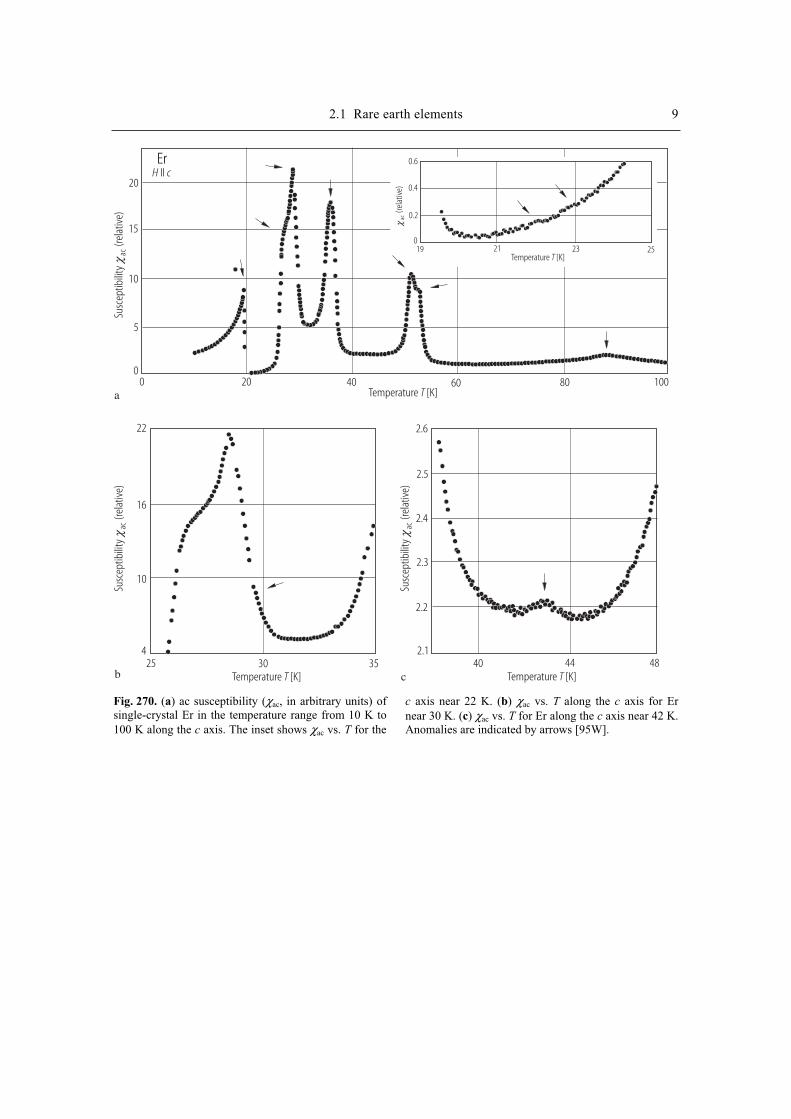
2.1 Rare earth elements 9
Temperature [K]T
Temperature [K]T
Temperature [K]T Temperature [K]T
20
15
10
5
00 20 40 60 80 100
ErH cII
a
22
16
10
425 30 35 40 44 48
2.6
2.4
2.2
2.1
b c
(rela
tive)
acχ
Susc
eptib
ility
(rela
tive)
acχ
19 21 23 25
0.6
Susc
eptib
ility
(rela
tive)
acχ
Susc
eptib
ility
(rela
tive)
acχ
0.4
0.2
0
2.5
2.3
Fig. 270. (a) ac susceptibility (χac, in arbitrary units) of single-crystal Er in the temperature range from 10 K to 100 K along the c axis. The inset shows χac vs. T for the
c axis near 22 K. (b) χac vs. T along the c axis for Er near 30 K. (c) χac vs. T for Er along the c axis near 42 K. Anomalies are indicated by arrows [95W].
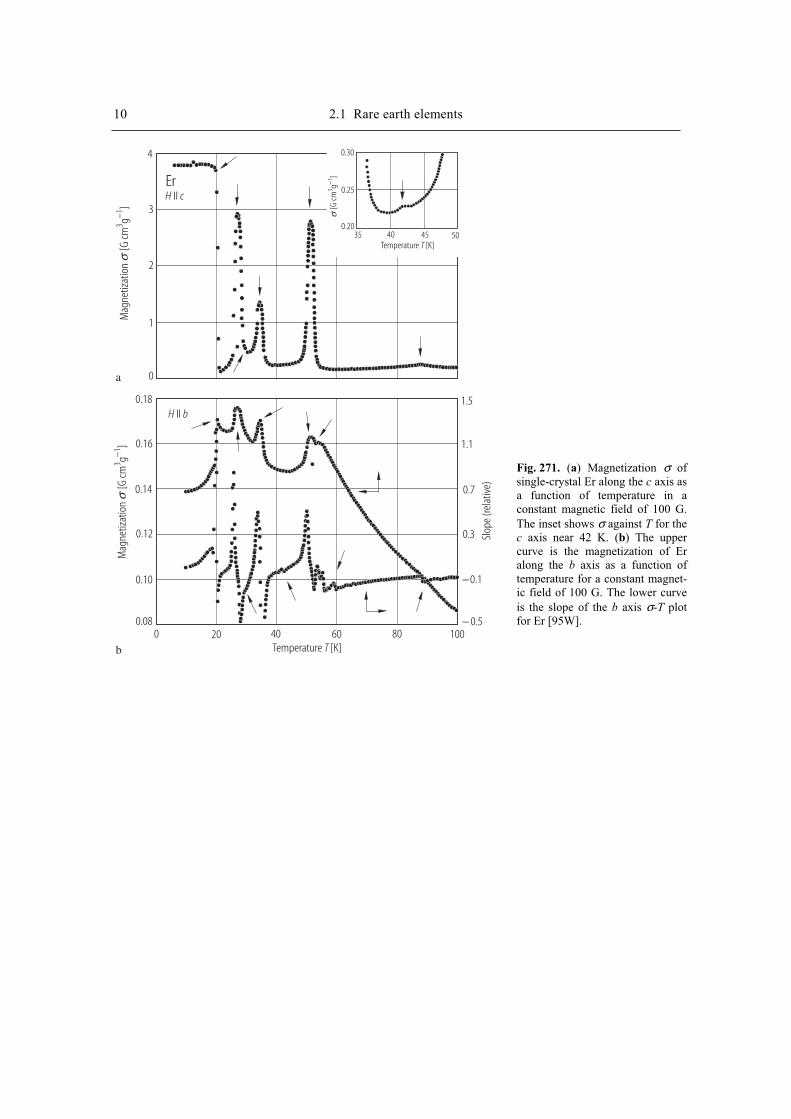
10 2.1 Rare earth elements M
agne
tizat
ion
[G
cmg
]3
1−σ
Mag
netiz
atio
n
[G cm
g]
31−
σ
[G cm
g]
31−
σ
Temperature [K]T
Temperature [K]T
ErH cII
H bII
4
3
2
1
0
0.30
0.25
0.2035 40 45 50
0.18
0.16
0.14
0.12
0.10
0.080 20 40 60 80 100
1.5
1.1
0.7
0.3
−0.1
− 0.5
Slop
e (re
lativ
e)
a
b
Fig. 271. (a) Magnetization σ of single-crystal Er along the c axis as a function of temperature in a constant magnetic field of 100 G. The inset shows σ against T for the c axis near 42 K. (b) The upper curve is the magnetization of Er along the b axis as a function of temperature for a constant magnet-ic field of 100 G. The lower curve is the slope of the b axis σ-T plot for Er [95W].

2.1 Rare earth elements 11
Time [s]t
Er Tc = 18.5 K
Tm = 19.6 K19.7
19.8
20.024.4 K
1.0
0.8
0.6
0.4
0.2
0
1.2
200 400 600 800
Volu
me
fract
ion
Temperature [K]T Temperature [K]T
Temperature [K]T
Er
Inv.
susc
eptib
ility
χ−1
Inv.
susc
eptib
ility
χ−1
Inv.
susc
eptib
ility
χ−1
0.20 0.20
0.20
0.16 0.16
0.16
0.12 0.12
0.12
0.08 0.08
0.08
0.04 0.04
0.04
0 0
0
0 0
0
20 20
20
40 40
40
60 60
60
80 80
80
100 100
100
120 120
120
Tc
Tc
Tb
Tb
Tn
a b
c
Tn
Fig. 272. (a) Reciprocal of the susceptibility of a poly-crystalline Er metal. All known three phase transitions are visible. (b) Reciprocal susceptibility of pure Er particles slowly evaporated and condensed in the inert gas. The two high-temperature phase transitions are absent but superparamagnetic or spin-glass-like be-haviour appears. (c) Reciprocal susceptibility of a rapidly evaporated sample. Note the shift in the high-temperature phase transitions and the supermagnetic behaviour below TC [87C].
Fig. 273. Time evolution for the volume fraction of cycloidal magnetic phase in Er as an evidence of the first-order phase transitions from cycloidal to one ferromagnetic studied by X-ray diffraction. Temperature of the sample is heated from 13 K to Tm just above TC
[95T].
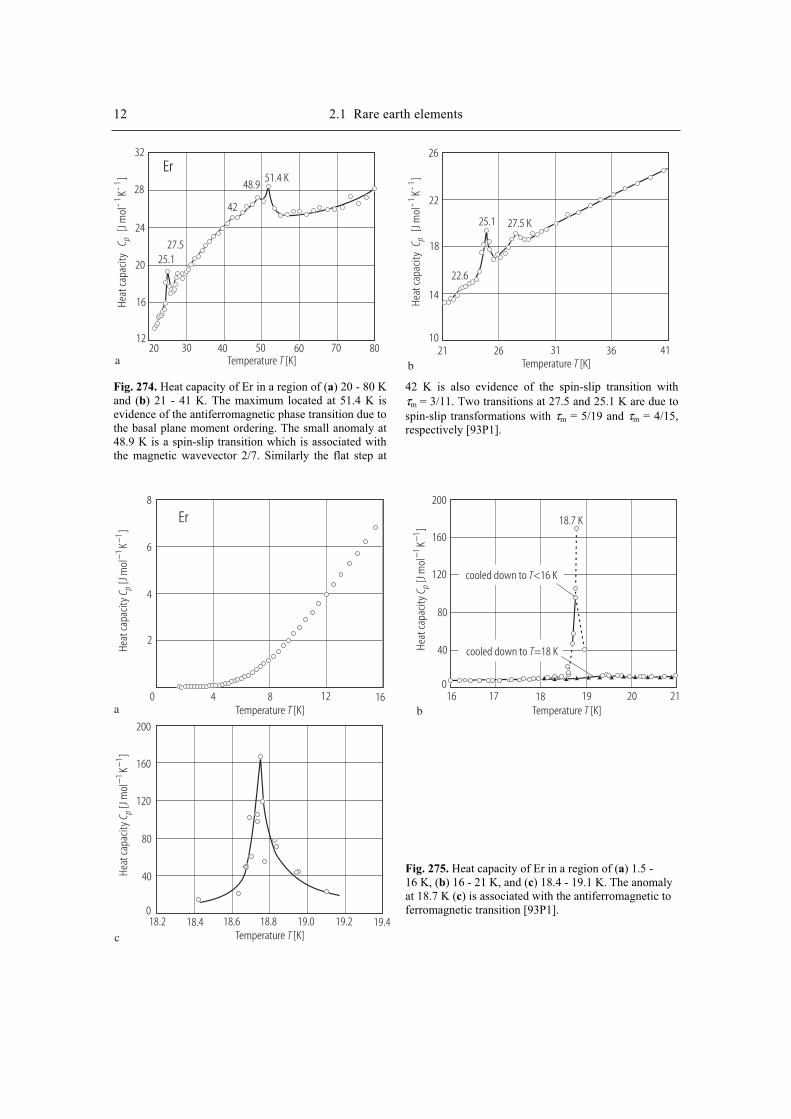
12 2.1 Rare earth elements
Temperature [K]TTemperature [K]T
Heat
capa
city
[Jm
olK
]C p
--
11
Heat
capa
city
[Jm
olK
]C p
--
11
Er32
28
24
20
16
1220 30 40 50 60 70 80
51.4 K48.9
42
27.525.1
a
26
22
18
14
1021 26 31 36 41
27.5 K25.1
22.6
b
Fig. 274. Heat capacity of Er in a region of (a) 20 - 80 K and (b) 21 - 41 K. The maximum located at 51.4 K is evidence of the antiferromagnetic phase transition due to the basal plane moment ordering. The small anomaly at 48.9 K is a spin-slip transition which is associated with the magnetic wavevector 2/7. Similarly the flat step at
42 K is also evidence of the spin-slip transition with τm = 3/11. Two transitions at 27.5 and 25.1 K are due to spin-slip transformations with τm = 5/19 and τm = 4/15, respectively [93P1].
Temperature [K]T
Temperature [K]T Temperature [K]T
Heat
capa
city
[Jm
olK
]C p
−−
11
Heat
capa
city
[Jm
olK
]C p
−−
11
Heat
capa
city
[Jm
olK
]C p
−−
11
Er
a b
8
6
4
2
0 4 8 12 16
200
200
160
160
120
120
80
80
40
40
0
0
16 17 18 19 20 21
c18.2 18.4 18.6 18.8 19.0 19.2 19.4
18.7 K
cooled down to 18 KT=
cooled down to <16 KT
Fig. 275. Heat capacity of Er in a region of (a) 1.5 - 16 K, (b) 16 - 21 K, and (c) 18.4 - 19.1 K. The anomaly at 18.7 K (c) is associated with the antiferromagnetic to ferromagnetic transition [93P1].
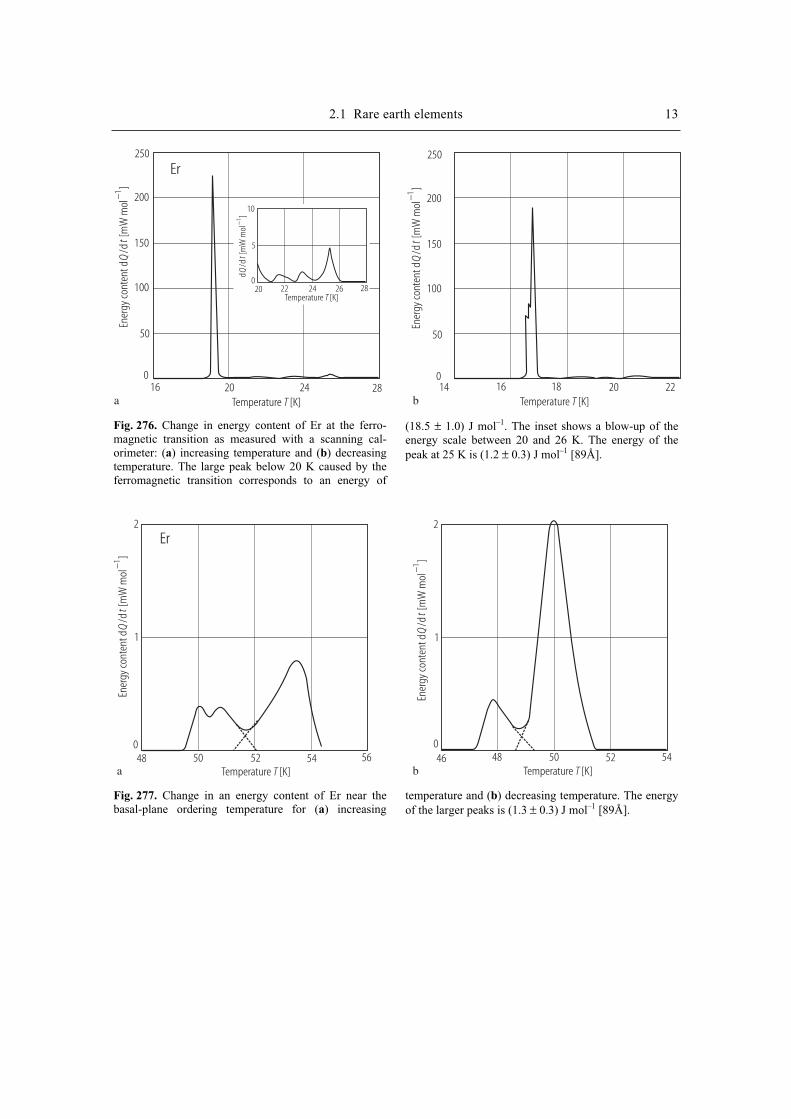
2.1 Rare earth elements 13
Temperature [K]T Temperature [K]T
Temperature [K]T
Er250 250
200 200
150 150
100 100
50 50
0 020 24 2816
Ener
gy co
nten
t d/d
[mW
mol
]Q
t−1
Ener
gy co
nten
t d/d
[mW
mol
]Q
t−1
d/d
[mW
mol
]Q
t−1
10
5
020 22 24 26 28
16 18 20 2214a b
Fig. 276. Change in energy content of Er at the ferro-magnetic transition as measured with a scanning cal-orimeter: (a) increasing temperature and (b) decreasing temperature. The large peak below 20 K caused by the ferromagnetic transition corresponds to an energy of
(18.5 ± 1.0) J mol–1. The inset shows a blow-up of the energy scale between 20 and 26 K. The energy of the peak at 25 K is (1.2 ± 0.3) J mol–1 [89Å].
Temperature [K]T Temperature [K]T
Er2
05648
Ener
gy co
nten
t d/d
[mW
mol
]Q
t−1
Ener
gy co
nten
t d/d
[mW
mol
]Q
t−1
48 50 52 5446a b
1
50 52 54
2
1
0
Fig. 277. Change in an energy content of Er near the basal-plane ordering temperature for (a) increasing
temperature and (b) decreasing temperature. The energy of the larger peaks is (1.3 ± 0.3) J mol–1 [89Å].
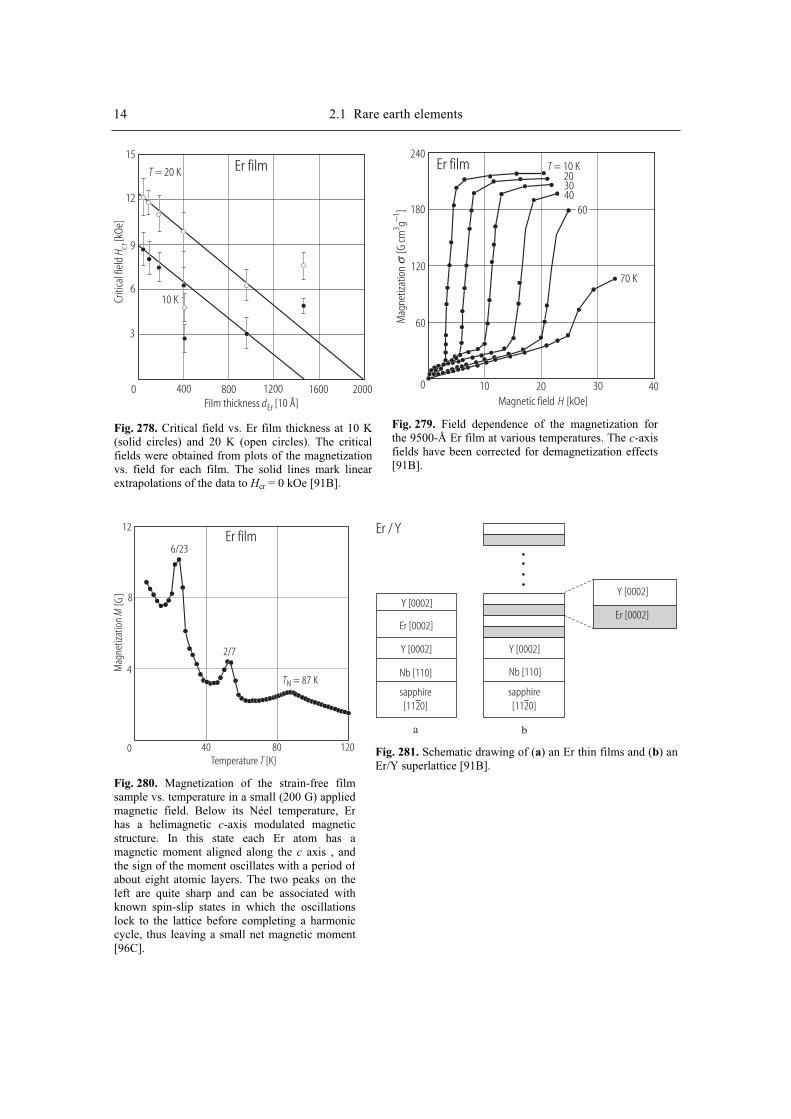
14 2.1 Rare earth elements
Film thickness [10 Å]dEr
Er film
Criti
cal f
ield
[kOe
]H c r
T = 20 K
10 K
15
12
9
6
3
0 400 800 1200 1600 2000
Fig. 278. Critical field vs. Er film thickness at 10 K (solid circles) and 20 K (open circles). The critical fields were obtained from plots of the magnetizationvs. field for each film. The solid lines mark linearextrapolations of the data to Hcr = 0 kOe [91B].
Mag
netiz
atio
n
[G cm
g]
31−
σMagnetic field [kOe]H
Er film T = 10 K203040
70 K
60
240
180
120
60
0 10 20 30 40
Fig. 279. Field dependence of the magnetization forthe 9500-Å Er film at various temperatures. The c-axisfields have been corrected for demagnetization effects [91B].
Temperature [K]T
Mag
netiz
atio
nM
[G]
Er film
TN = 87 K
6/23
2/7
12
8
4
0 40 80 120
Fig. 280. Magnetization of the strain-free filmsample vs. temperature in a small (200 G) appliedmagnetic field. Below its Néel temperature, Erhas a helimagnetic c-axis modulated magneticstructure. In this state each Er atom has amagnetic moment aligned along the c axis , andthe sign of the moment oscillates with a period ofabout eight atomic layers. The two peaks on theleft are quite sharp and can be associated withknown spin-slip states in which the oscillationslock to the lattice before completing a harmoniccycle, thus leaving a small net magnetic moment[96C].
Er / Y
Y [0002]
Er [0002]Er [0002]
Y [0002]
Nb [110]
sapphire[1120]
sapphire[1120]
Y [0002]
Y [0002]
Nb [110]
a b
Fig. 281. Schematic drawing of (a) an Er thin films and (b) an Er/Y superlattice [91B].
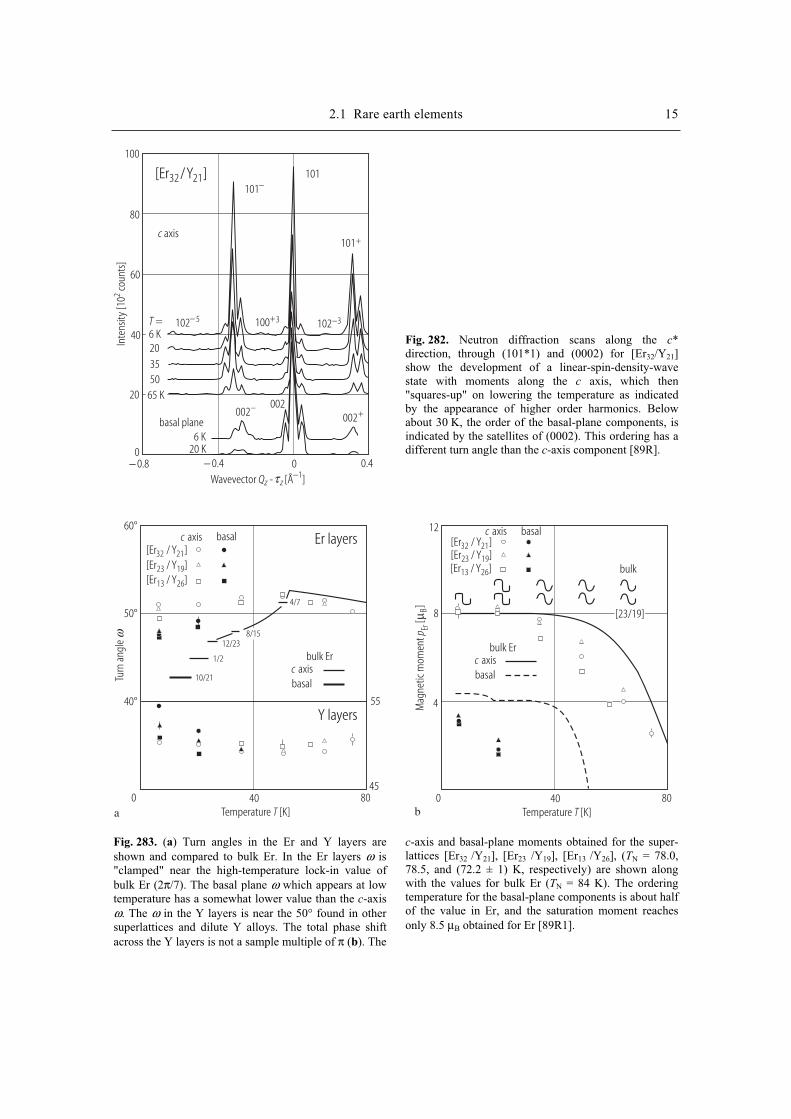
2.1 Rare earth elements 15 In
tens
ity [1
0co
unts
]2
Wavevector - [Å ]Qz z−1τ
[Er /Y ]32 21
100
80
60
40
20
0− 0.8 − 0.4 0 0.4
101101
_
101+c axis
T =6 K
65 K
20
3550
basal plane6 K
20 K
102_ 5
002_ 002
002+
100+3 102_3
Temperature [K]T Temperature [K]T
Mag
netic
mom
ent
[]
p ErBµ
Turn
ang
leω
Er layers
Y layers
c axisbasal
bulk Er c axisbasal
bulk Er
4/7
12/23
1/2
10/21
8/15
c axis basal[Er / Y ]32 21[Er / Y ]23 19[Er / Y ]13 26
c axis basal[Er / Y ]32 21[Er / Y ]23 19[Er / Y ]13 26
60°
50°
40°
0 040 4045
55
80 80
12
8
4
bulk
[23/19]
a b
Fig. 283. (a) Turn angles in the Er and Y layers are shown and compared to bulk Er. In the Er layers ω is "clamped" near the high-temperature lock-in value of bulk Er (2π/7). The basal plane ω which appears at low temperature has a somewhat lower value than the c-axis ω. The ω in the Y layers is near the 50° found in other superlattices and dilute Y alloys. The total phase shift across the Y layers is not a sample multiple of π (b). The
c-axis and basal-plane moments obtained for the super-lattices [Er32 /Y21], [Er23 /Y19], [Er13 /Y26], (TN = 78.0, 78.5, and (72.2 ± 1) K, respectively) are shown along with the values for bulk Er (TN = 84 K). The ordering temperature for the basal-plane components is about half of the value in Er, and the saturation moment reaches only 8.5 µB obtained for Er [89R1].
Fig. 282. Neutron diffraction scans along the c*direction, through (101*1) and (0002) for [Er32/Y21]show the development of a linear-spin-density-wave state with moments along the c axis, which then "squares-up" on lowering the temperature as indicated by the appearance of higher order harmonics. Below about 30 K, the order of the basal-plane components, is indicated by the satellites of (0002). This ordering has a different turn angle than the c-axis component [89R].
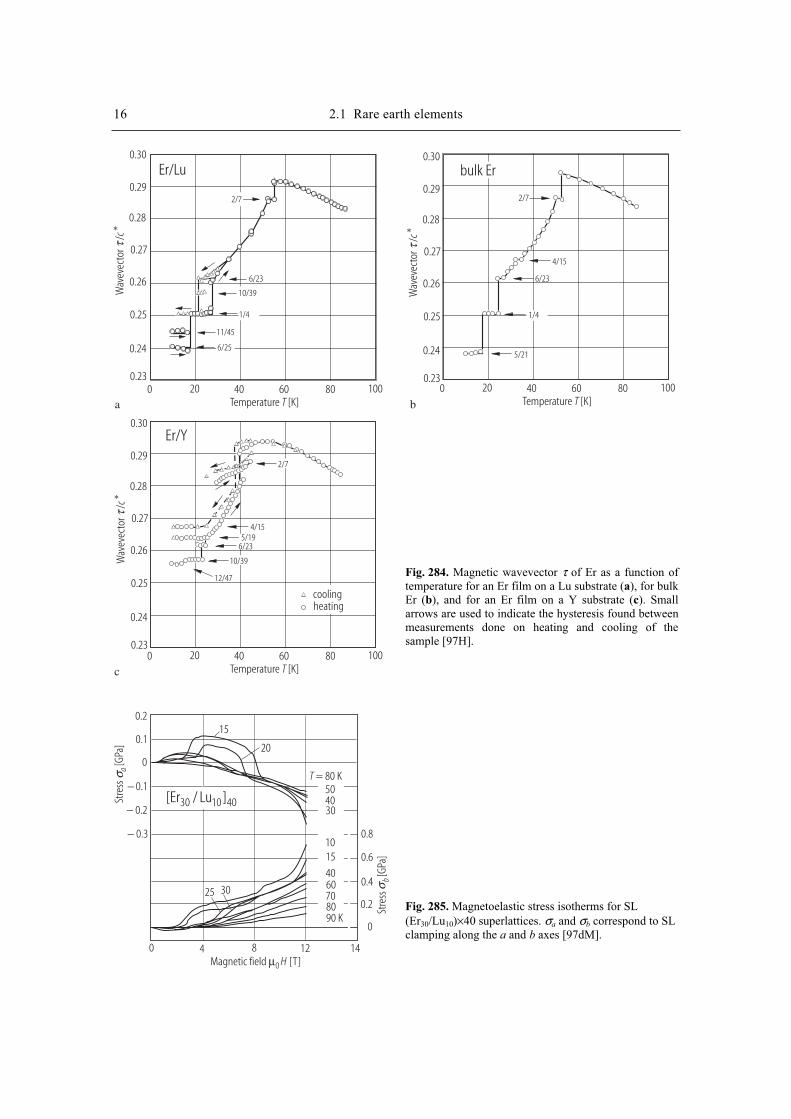
16 2.1 Rare earth elements
Magnetic field [T]µ0 H
T = 80 K
[Er / Lu ]30 10 40
0 4 8 12 14
0.8
0.6
0.4
0.2
0
0.2
0.1
0
− 0.1
− 0.2
− 0.3
Stre
ss[G
Pa]
aσ
Stre
ss[G
Pa]
bσ
90 K
504030
15
20
1015
40607080
25 30
Temperature [K]T Temperature [K]T
Temperature [K]T
Er/Lu
Er/Y
Wav
evec
tor
/* c
τ
Wav
evec
tor
/* c
τ
Wav
evec
tor
/* c
τ
0.30 0.30
0.30
0.29 0.29
0.29
0.28 0.28
0.28
0.27 0.27
0.27
0.26 0.26
0.26
0.25 0.25
0.25
0.24 0.24
0.24
0.23 0.23
0.23
0 0
0
20 20
20
40 40
40
60 60
60
80 80
80
100 100
100
6/23
5/19
6/23
11/45
12/47
4/15
2/7 2/7
10/39
1/4
6/25
4/15
5/21
1/4
bulk Er
coolingheating
2/7
10/39
6/23
a b
c
Fig. 284. Magnetic wavevector τ of Er as a function of temperature for an Er film on a Lu substrate (a), for bulk Er (b), and for an Er film on a Y substrate (c). Small arrows are used to indicate the hysteresis found between measurements done on heating and cooling of the sample [97H].
Fig. 285. Magnetoelastic stress isotherms for SL (Er30/Lu10)×40 superlattices. σa and σb correspond to SL clamping along the a and b axes [97dM].
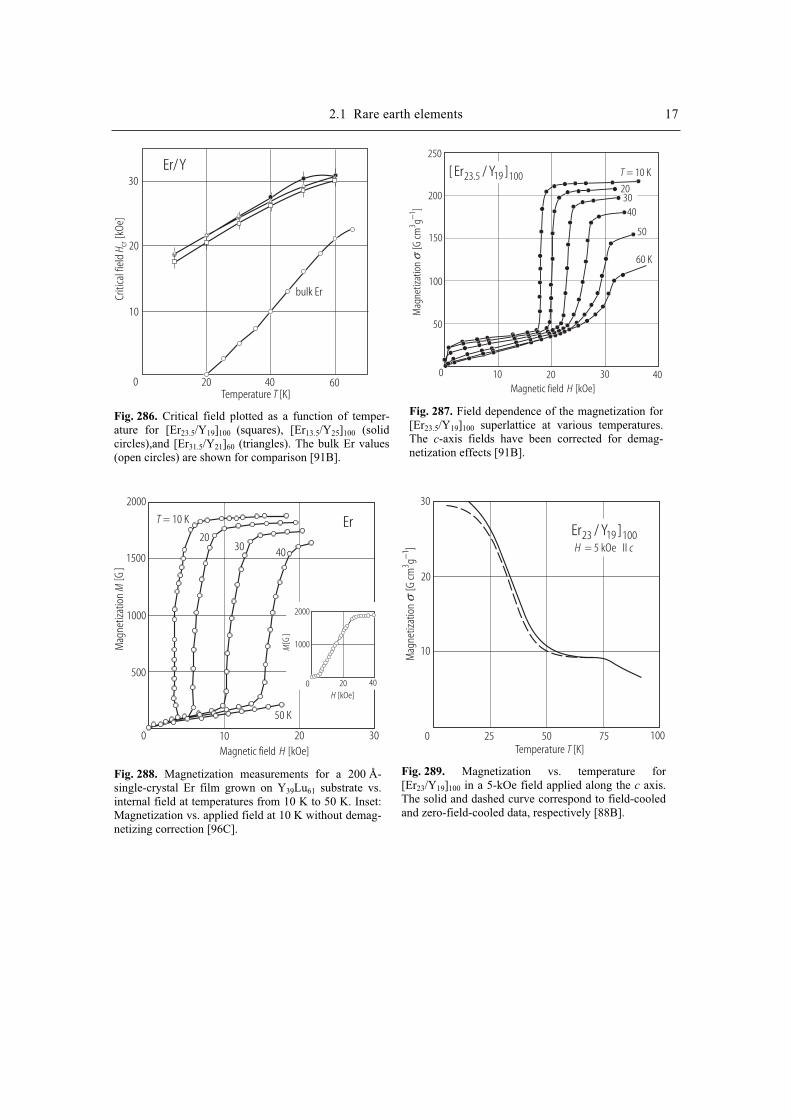
2.1 Rare earth elements 17
Temperature [K]T
Criti
cal f
ield
[kOe
]H cr
Er/Y30
20
10
0 20 40 60
bulk Er
Fig. 286. Critical field plotted as a function of temper-ature for [Er23.5/Y19]100 (squares), [Er13.5/Y25]100 (solidcircles),and [Er31.5/Y21]60 (triangles). The bulk Er values (open circles) are shown for comparison [91B].
Mag
netiz
atio
n
[G cm
g]
31−
σ
Magnetic field [kOe]H
T = 10 K
20
40
60 K
50
250
150
100
50
0 10 20 30 40
200 30
[ Er / Y ]23.5 19 100
Fig. 287. Field dependence of the magnetization for[Er23.5/Y19]100 superlattice at various temperatures. The c-axis fields have been corrected for demag-netization effects [91B].
Magnetic field [kOe]H
[kOe]H
Er
Mag
netiz
atio
nM
[G]
M[G
]
T = 10 K
2000
1500
1000
500
0 10 20 30
0 20 40
2000
1000
2030 40
50 K
Fig. 288. Magnetization measurements for a 200 Å-single-crystal Er film grown on Y39Lu61 substrate vs.internal field at temperatures from 10 K to 50 K. Inset:Magnetization vs. applied field at 10 K without demag-netizing correction [96C].
Mag
netiz
atio
n
[G cm
g]
31−
σ
Temperature [K]T0 25 50 75 100
Er / Y ]23 19 100H c= 5 kOe II
30
20
10
Fig. 289. Magnetization vs. temperature for[Er23/Y19]100 in a 5-kOe field applied along the c axis. The solid and dashed curve correspond to field-cooledand zero-field-cooled data, respectively [88B].
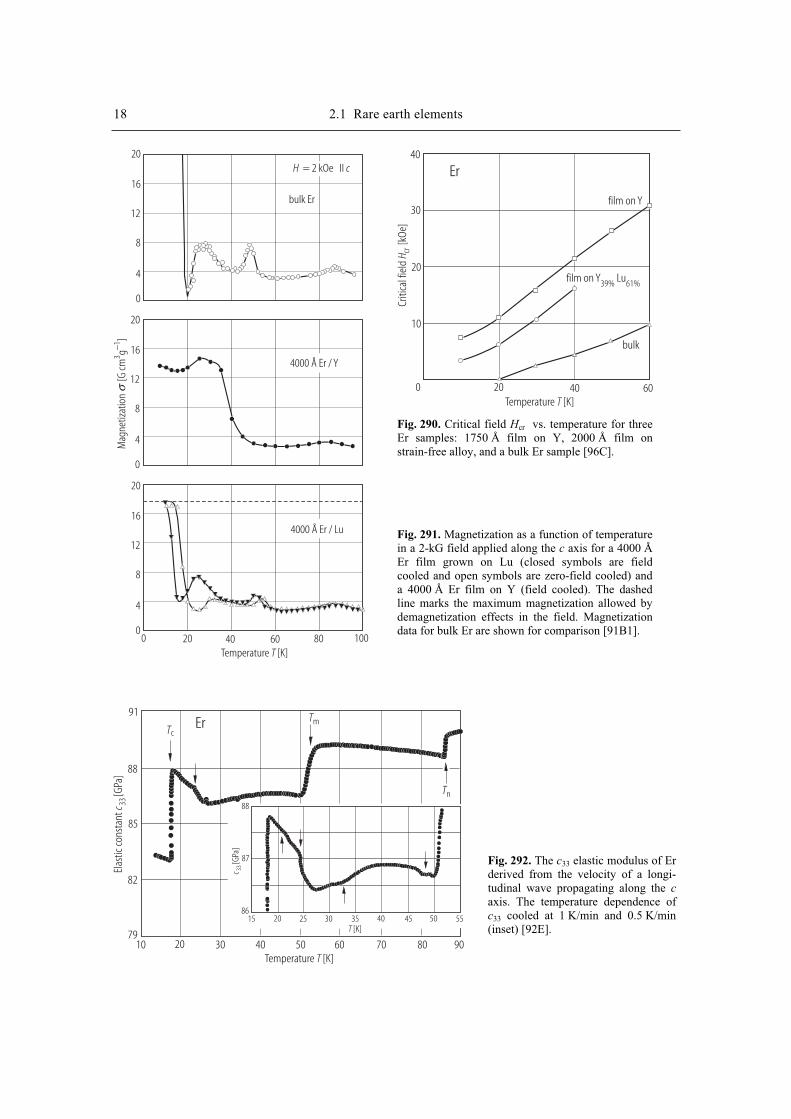
18 2.1 Rare earth elements M
agne
tizat
ion
[G
cmg
]3
1−σ
Temperature [K]T
H c= 2 kOe II
bulk Er
4000 Å Er / Y
4000 Å Er / Lu
20
16
12
8
4
0
20
16
12
8
4
0
20
16
12
8
4
00 20 40 60 80 100
Temperature [K]T
Er
Criti
cal f
ield
[kOe
]H cr
40
30
20
10
0 20 40 60
film on Y
bulk
film on Y Lu39% 61%
Fig. 290. Critical field Hcr vs. temperature for three Er samples: 1750 Å film on Y, 2000 Å film on strain-free alloy, and a bulk Er sample [96C].
Fig. 291. Magnetization as a function of temperature in a 2-kG field applied along the c axis for a 4000 Å Er film grown on Lu (closed symbols are fieldcooled and open symbols are zero-field cooled) and a 4000 Å Er film on Y (field cooled). The dashed line marks the maximum magnetization allowed by demagnetization effects in the field. Magnetization data for bulk Er are shown for comparison [91B1].
Temperature [K]T
[K]T
Er
10 20 30 40 50 60 70 80 90
91
88
85
82
79
Elas
tic co
nsta
nt[G
Pa]
c 33
[GPa
]c 33
88
87
8615 20 25 30 35 40 45 50 55
Tc
Tm
Tn
Fig. 292. The c33 elastic modulus of Er derived from the velocity of a longi-tudinal wave propagating along the c
axis. The temperature dependence of c33 cooled at 1 K/min and 0.5 K/min (inset) [92E].
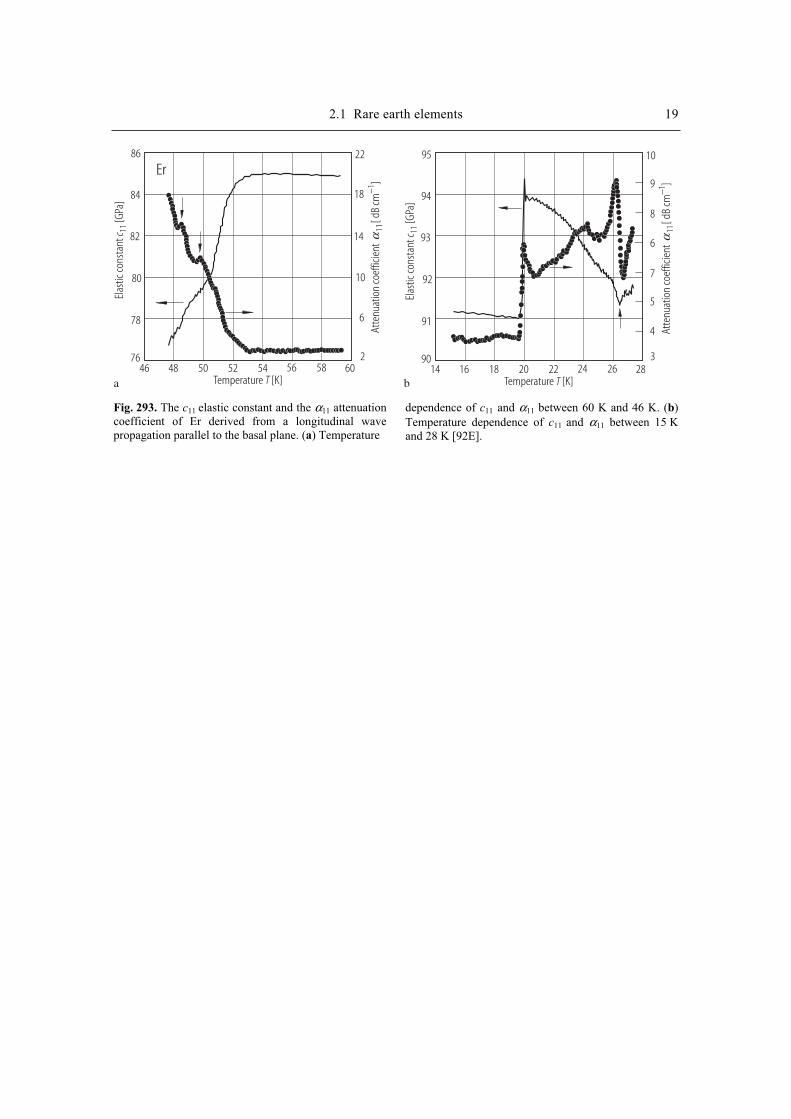
2.1 Rare earth elements 19
Temperature [K]T
Elas
tic co
nsta
nt[G
Pa]
c 11
Atte
nuat
ion
coef
ficie
nt[ d
B cm
]11
1−α
Er86
84
82
80
78
7646 48 50 52 54 56 58 60
22
18
14
10
6
2
a Temperature [K]T
Elas
tic co
nsta
nt[G
Pa]
c 11
Atte
nuat
ion
coef
ficie
nt[ d
B cm
]11
1−α
95
94
93
92
91
9014 16 18 20 22 24 26 28
10
9
8
7
6
b
5
4
3
Fig. 293. The c11 elastic constant and the α11 attenuation coefficient of Er derived from a longitudinal wave propagation parallel to the basal plane. (a) Temperature
dependence of c11 and α11 between 60 K and 46 K. (b)Temperature dependence of c11 and α11 between 15 K and 28 K [92E].
References
87C Cowen, R.A., Stolzman, B., Averback, R.S., Hahn, H.: J. Appl. Phys. 61 (1987) 3317
88B Borchers, J.A., Salamon, M.B., Du, R., Flynn, C.P., Rhyne, J.J., Erwin, R.W.: J. Appl. Phys.
63 (1988) 3458
89R Rhyne, J.J., Erwin, R.W., Borchers, J., Salamon, M.B., Du, R., Flynn, C.P.: Physica B 159
(1989) 111
89R1 Rhyne, J.J., Erwin, R.W., Borchers, J., Salamon, M.B., Du, R., Flynn, C.P.: Phys. Scr. T 29
(1989) 31
89Å Âström, H.U., Benediktsson, G.: J. Phys. Condens. Matter 1 (1989) 4381
90B1 Bohr, J.: J. Magn. Magn. Mater. 83 (1990) 530
91B Borchers, J.A., Salamon, M.B., Erwin, R.W., Rhyne, J.J., Du, R.R., Flynn, C.P.: Phys. Rev. B
43 (1991) 3123
91B1 Beach, R.S., Borchers, J.A., Erwin, R.W., Rhyne, J.J., Matheny, A., Flynn, C.P., Salamon,
M.B.: J. Appl. Phys. 69 (1991) 4335
91G Godovikov, S.K., Nikitin, S.A., Tishin, A.M.: Phys. Lett. A 158 (1991) 265
92E Eccleston, R.S., Palmer, S.B.: J. Phys.: Condens. Matter 4 (1992) 10037
92L Lin, H., Collins, M.F., Holden, T.M., Wei, W.: Phys. Rev. B 45 (1992) 12873
92S Snigirev, O.V., Tishin, A.M., Volkozub, A.V.: J. Magn. Magn. Mater. 111 (1992) 149
93K Kawano, S., Lebech, B., Achiwa, N.: J. Phys.: Condens. Matter 5 (1993) 1535
93P1 Pecharsky, V.K., Gschneidner jr., K.A., Fort, D.: Phys. Rev. B 47 (1993) 5063
94J Jehan, D.A., McMorrow, D.F., Simpson, J.A., Cowley, R.A., Swaddling, P.P., Clausen, K.N.:
Phys. Rev. B 50 (1994) 3085
95B Bulatov, A.S., Dolzhenko, V.F., Korniets, A.V.: J. Magn. Magn. Mater. 147 (1995) 403
95K Kawano, S., Sørensen, S. Aa., Lebech, B., Achiwa, N.: J. Magn. Magn. Mater. 140-144 (1995)
763
95T Tajima, K., Shinoda, Y., Tadakuma, M.: J. Magn. Magn. Mater. 140-144 (1995) 765
95W Watson, B., Ali, N.: J. Phys.: Condens. Matter 7 (1995) 4713
96C Conover, M.J., Kaldowsky, A., Flynn, C.P.: Phys. Rev. B 53 (1996) R2938
96W1 Watson, B., Ali, N.: J. Phys.: Condens. Matter 8 (1996) 1797
97H Helgsen, G., Tanaka, Y., Hill, J.P., Wochner, P., Gibbs, D., Flynn, C.P., Salamon, M.B. Phys.
Rev. B 56 (1997) 2635
97W Watson, B., Ali, N.: J. Alloys Compounds 250 (1997) 662
97dM del Moral, A., Ciria, M., Arnaudas, J.I., Ward, R.C.C., Wells, M.R.: J. Appl. Phys. 81 (1997)
5311

2.1 Rare earth elements 1
2.1.3.11 Thulium
Temperature [K]T
Mag
netic
fiel
d[T
]µ 0
H
TmH cII
CAMA
6
4
2
0 10 20 30 40 50 60 70
paramagnetic
ferrimagnetic
ferromagnetic
Mag
netiz
atio
n
[G cm
g]
31−
σ
[G cm
g]
31−
σ
Magnetic field [kOe]H
[kOe]H
TmH aII
H cIIH bII
250
250
200
200
150 150
100
100
50
50
0
00
10
10
20
20
30
30
40
40
50
50
60
60
Fig. 295. Magnetic moment of Tm at 5 K measured with a SQUID magnetometer to a maximum field of 50 kOe for different crystallographic orientations: parallel a, b
and c axis. The inset shows measurements on the same crystal at 4.2 K with a vibrating-sample magnetometer
for increasing and decreasing values of the applied field. For the field parallel to the c axis there are two distinct saturation levels: at low fields connected with ferri-magnetic state; at higher fields moments are decoupled into ferromagnetic order [91Å].
Fig. 294. Magnetic phase diagram constructed from the isothermal magnetization (squares), magnetoresistance (open circles), and resistance in a constant field (solid circles). The division of the ferromagnetic phase into two phases at nonzero field which is indicated by the dashed line, is tentative [98E].
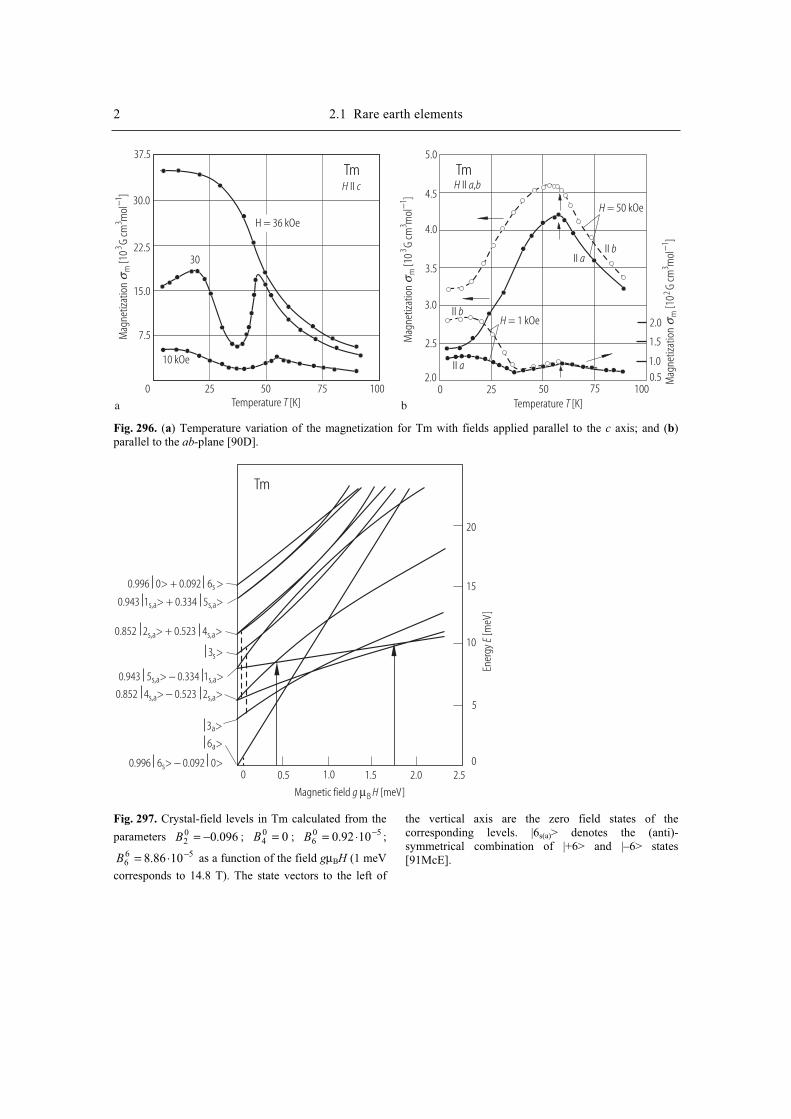
2 2.1 Rare earth elements M
agne
tizat
ion
[10
G cm
mol
]m
33
1−σ
Mag
netiz
atio
n[1
0G
cmm
ol]
m3
31−
σ
Mag
netiz
atio
n[1
0G
cmm
ol]
m2
31−
σ
Temperature [K]T Temperature [K]T
Tm TmH cII H a bII ,
37.5 5.0
30.04.5
22.5
4.0
15.0
3.5
7.5
3.0
0 025 2550 5075 75100 100
30
10 kOe
H = 36 kOe
2.5
2.0
2.0
1.5
1.00.5
H = 50 kOe
II b
II b
II a
II a
H = 1 kOe
a b
Fig. 296. (a) Temperature variation of the magnetization for Tm with fields applied parallel to the c axis; and (b)parallel to the ab-plane [90D].
Magnetic field [meV]g HµB
Ener
gy[m
eV]
ETm
0 0.5 1.0 1.5 2.0 2.5
20
15
10
5
0
0.996 0> + 0.092 6 >s
0.943 1 > + 0.334 5 >s,a s,a
0.852 2 > + 0.523 4 >s,a s,a
0.852 4 > 0.523 2 >s,a s,a−0.943 5 > 0.334 1 >s,a s,a−
3 >a
3 >s
6 >a
0.996 6 > 0.092 0>s −
Fig. 297. Crystal-field levels in Tm calculated from the
parameters 096.002 −=B ; 00
4 =B ; 506 1092.0 −⋅=B ;
566 1086.8 −⋅=B as a function of the field gµBH (1 meV
corresponds to 14.8 T). The state vectors to the left of
the vertical axis are the zero field states of the corresponding levels. |6s(a)> denotes the (anti)-symmetrical combination of |+6> and |–6> states [91McE].
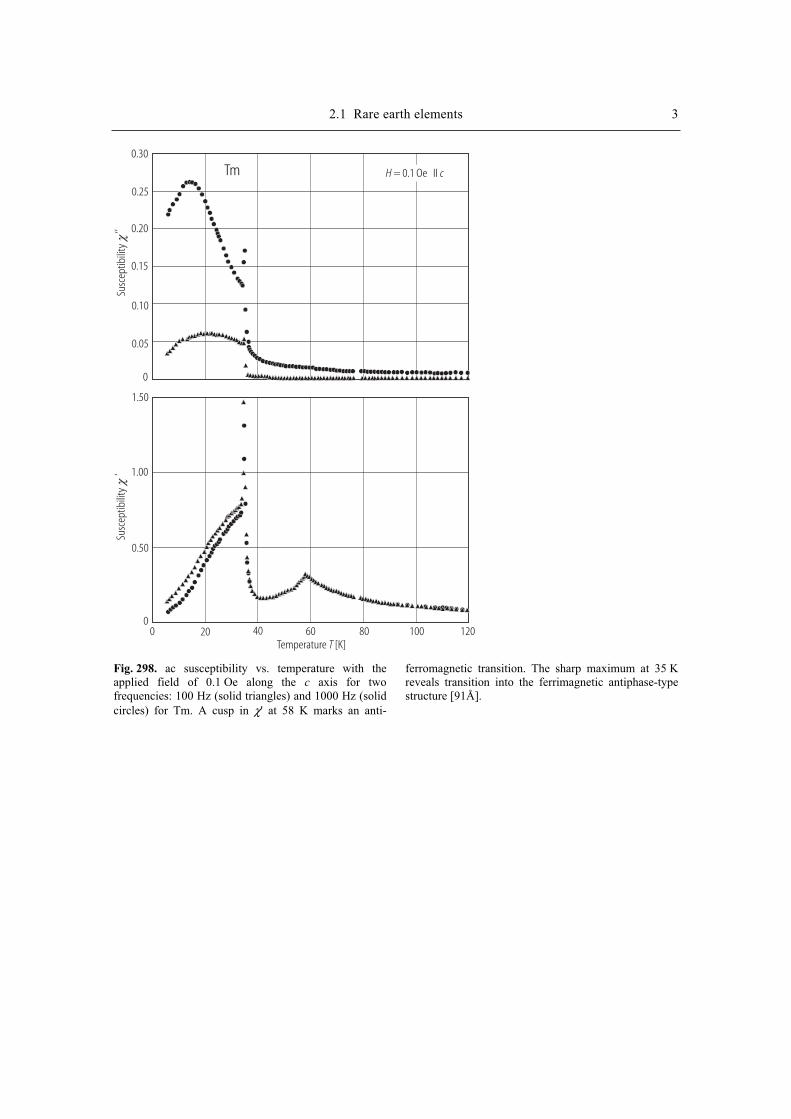
2.1 Rare earth elements 3
Temperature [K]T
Tm
Susc
eptib
ility
χ‘
Susc
eptib
ility
χ‘’
H = c0.1 Oe II
0.30
0.25
0.20
0.15
0.10
0.05
0
1.50
1.00
0.50
00 20 40 60 80 100 120
Fig. 298. ac susceptibility vs. temperature with the applied field of 0.1 Oe along the c axis for two frequencies: 100 Hz (solid triangles) and 1000 Hz (solid circles) for Tm. A cusp in χ' at 58 K marks an anti-
ferromagnetic transition. The sharp maximum at 35 K reveals transition into the ferrimagnetic antiphase-type structure [91Å].

4 2.1 Rare earth elements
Temperature [K]T
Tm
Susc
eptib
ility
χ‘
Susc
eptib
ility
χ‘’
0.010
0.008
0.006
0.004
0.002
0
0.080
00 20 40 60 80 100 120
H = b100 Oe II
0.060
0.040
0.020
Fig. 299. ac susceptibility vs. temperature and frequency with the applied field of 100 Oe, parallel to the b axis: 10 Hz (open circles) and 100 Hz (solid triangles) for Tm. The strong peak in χ' at 35 K seen along the c axis
is virtually missing for this orientation. The small anomaly at 35 K might be the sign of interaction between magnetization along c and the magnetic component in the basal plane [91Å].
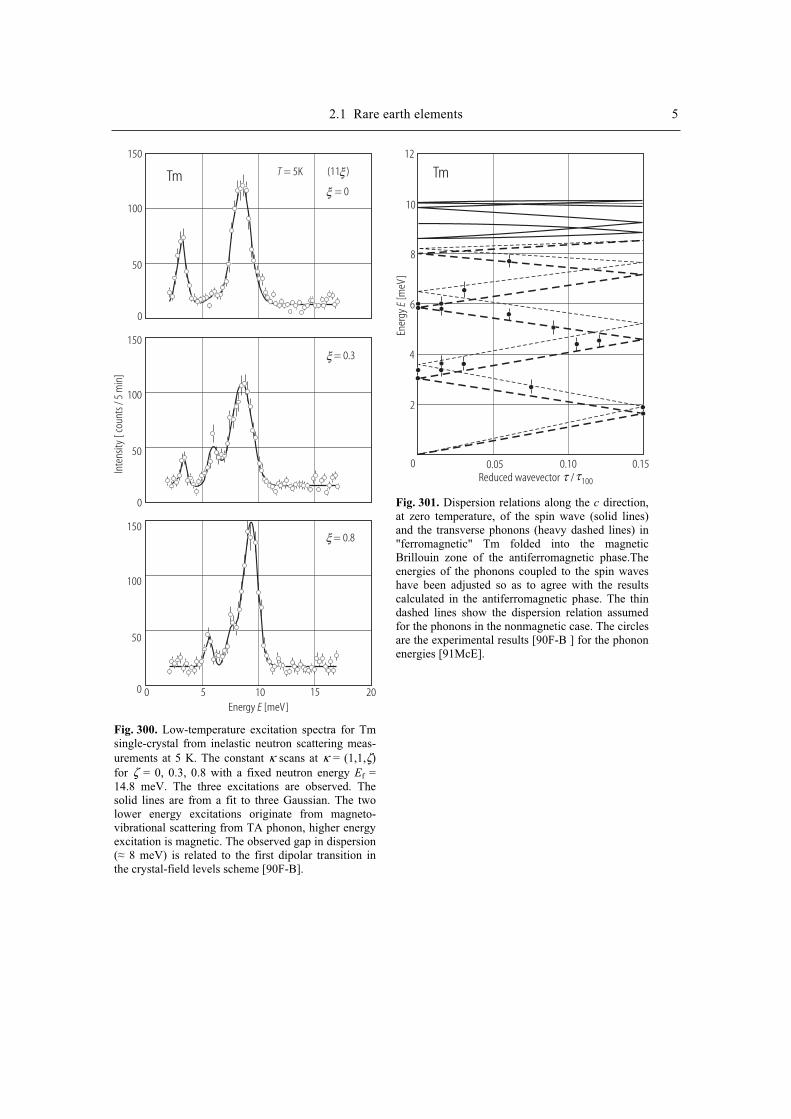
2.1 Rare earth elements 5
Energy [meV]E
Inte
nsity
[ cou
nts /
5 m
in]
Tm
0 5 10 15 20
150
150
150
100
100
100
50
50
50
0
0
0
(11 )ξ
ξ
ξ
ξ
= 0
= 0.3
= 0.8
T = 5K
Fig. 300. Low-temperature excitation spectra for Tmsingle-crystal from inelastic neutron scattering meas-urements at 5 K. The constant κ scans at κ = (1,1,ζ)for ζ = 0, 0.3, 0.8 with a fixed neutron energy Ef =14.8 meV. The three excitations are observed. Thesolid lines are from a fit to three Gaussian. The twolower energy excitations originate from magneto-vibrational scattering from TA phonon, higher energyexcitation is magnetic. The observed gap in dispersion( 8 meV) is related to the first dipolar transition inthe crystal-field levels scheme [90F-B].
Ener
gy[m
eV]
E
Tm
Reduced wavevector / 100ττ0 0.05 0.10 0.15
12
10
8
6
4
2
Fig. 301. Dispersion relations along the c direction, at zero temperature, of the spin wave (solid lines) and the transverse phonons (heavy dashed lines) in "ferromagnetic" Tm folded into the magnetic Brillouin zone of the antiferromagnetic phase.The energies of the phonons coupled to the spin waves have been adjusted so as to agree with the results calculated in the antiferromagnetic phase. The thin dashed lines show the dispersion relation assumed for the phonons in the nonmagnetic case. The circles are the experimental results [90F-B ] for the phonon energies [91McE].

6 2.1 Rare earth elements
Magnetic field [T]µ0 H
µ0 H [T]
Mag
neto
stric
tion
/[1
0]
∆l l
−3
Tm H cII T = 4.2 KT = 33.9 K
15
10
5
0 2 4 6 8
33.9
44.9
59.3
84.3 K
0
2
0 0.4 0.8
4α
H[1
0T
]−
−5
1
Fig. 302. Magnetostriction of Tm, measured in increas-ing field along the c axis, for various temperatures. The inset shows thermal expansion αH = [δ(∆l/l)/δH]T at
T = 33.9 K. The sudden increase in length in 3.0 T is characteristic. Arrows indicate anomalies [92Z].
Mag
neto
stric
tion
/[1
0]
∆l l
−3
TmH cII
αT
[10
T]
−−
51
Temperature [K]T
[K]T
µ0 H = 2.0 T
0
4.0 T
5
4
3
2
1
0 20 40 60 80
50 54 58
7.8
7.6
TN
H = 0
Fig. 303. Thermal expansion of Tm, measured as a function of temperature along the c axis at various magnetic fields µ0H = 0, 2.0 T and 4.0 T. The inset
shows the αT , where αT = [δ(∆l/l)/δT]H, near TN: at 2.0 T, TN = 52.1 K, the additional anomalies are observed at T = 31.0, 36.5 and 38.8 K [92Z].

2.1 Rare earth elements 7
Magnetic field [T]µ0 H Magnetic field [T]µ0 H
Mag
netic
mom
ent
[]
p TmBµ
Mag
netic
mom
ent
[]
p TmBµ
TmH cII
Resis
tivity
(
,)
(0,
)[µ
cm]
HT
T−
Ωρ
ρ
Resis
tivity
(
,)
(0,
)[µ
cm]
HT
T−
Ωρ
ρ
8 8
6 6
4 4
2 2
0 0
T = 5.0 K
1
0
−1
−2
− 3
− 4
T = 5.0 K
T = 5.0 KT = 35.1 K
T = 35.0 K
T = 35.0 K
longitudinal longitudinal
ρ (0, )= 4.53 µ cmT Ω
ρ ρ
ρ
(0, )= 0.96 µ cmT Ω (0, )= 10.36 µ cmT Ω
(0, )= 13.35 µ cmT Ω
0.10
0.05
0
− 0.050 01 12 23 34 45 56 67 7
transverse transverse1.0
0.5
0
− 0.5
−1.0
−1.5
0
−2
− 4
− 6
− 8
−10
a
b
c
d
e
f
Fig. 304. Isothermal magnetization and longitudinal and transverse magnetoresistance in Tm metal at 5 K and 35 K [98E].

8 2.1 Rare earth elements
Photon energy [eV]E
8620 8640 8660 8680
(Tm)L III
100
80
60
40
20
0
Fluo
resc
ence
(rel
ativ
e)
Fig. 305. Fluorescence at the centre of the Brillouinzone vs. incident photon energy through the LIII
absorption edge. The fluorescence reflects theelectric dipole transition involving 2p(3/2) 5d(5/2) [90B].
Temperature [K]T
Tm6
4
2
0
− 2
− 4
− 625 30 35 40
2.5 K
0.7 J / mol
0.8 J / mol
Ener
gy co
nten
t d/ d
[mW
mol
]Q
t−1
Fig. 306. The calorimetric measurements by continu-ously scanning the temperature. The change in energy content at the ferrimagnetic transition in Tm for increasing temperature (endothermic peak) and fordecreasing temperature (exothermic peak). The inte-gration of dQ/dt over time are shown for both peaks. The sharpness and thermal hysteresis are typical of a first-order process [91Å].

References
90B Bohr, J. Gibbs, D., Huang, K.: Phys. Rev. B 42 (1990) 4322
90D Daou, J.N., Burger, J.P., Vajda, P., Chouteau, G., Tur, R.: J. Phys.: Condens. Matter 2 (1990)
7897
90F-B Fernandez-Baca, J.A., Niclow, R.M., Rhyne, J.J.: J. Appl. Phys. 67 (1990) 5283
91McE McEwen, K.A., Steigenberger, U., Jensen, J.: Phys. Rev. B 43 (1991) 3298
91Å Åström, H.U., Noguest, J., Nicolaides, G.K., Rao, K.V., Benediktsson, G.: J. Phys.: Condens.
Matter 3 (1991) 7395
92Z Zochowski, S.W., McEwen, K.A.: J. Magn. Magn. Mater. 104-107 (1992) 1515
98E Ellerby, M., McEwen, K.A., Jensen, J.: Phys. Rev. B 57 (1998) 8416
Ref. p. 348] 2.5 Rare earth elements and 4d or 5d elements 167
Landolt-Börnstein New Series III/32D
2.5 Compounds of rare earth elements and 4d or 5d elements
2.5.1 Introduction
This section 2.5 covers relevant literature published since about the year 1905 until the year 1999. The magnetic data of the same group of compounds published earlier have been compiled by A. Chelkowski and have already been published in Landolt-Börnstein, Volume 19 "Magnetic Properties of Metals", sub-volume d2, pages 469-545. The tables and figures in this section contain magnetic data on metallic or pseudometallic compounds of the rare earth group of elements which contain besides the rare earth element at least one 4d (Mo, Ru, Rh, Pd) element and/or one 5d (Re, Os, Ir, Pt) element. The compounds are summarized in two tables in subsect. 2.5.2. Table 1 is devoted to binary and pseudobinary compounds of the rare earth elements with 4d or 5d elements. Table 2 is devoted to ternary compounds which contain besides the rare element at least one 4d or 5d element and as a third one another element of the periodic system. The compounds listed in the tables are designated by their chemical formula. The compounds are arranged in the order as their elements appear in the periodic system. Thus the rare earth elements are listed in following order
Y, La, Ce, Pr, Nd, Pm, Sm, Eu, Gd, Tb, Dy, Ho, Er, Tm, Yb, Lu,
the 4d elements in the order
Mo, Ru, Rh, Pd,
and the 5d element in the order
Re, Os, Ir, Pt.
The compounds are listed in such a way that rare-earth-rich compounds appear in the begining of each table. The tables provide information on paramagnetic Curie temperature Θ, ferromagnetic Curie tempera-ture TC, Néel temperature TN , magnetic susceptibility χ, saturation or spontaneous magnetic moment ps and effective paramagnetic moment peff . The column "Remarks" may provide further data.
168 2.5 R
are earth elements and 4d or 5d elem
ents [R
ef. p. 348
Landolt-B
örnstein
New
Series III/32D
2.5.2 Survey of compounds and properties
Table 1. Binary and pseudobinary compounds of rare earth elements with 4d and 5d elements. R: rare earth element, M: 4d or 5d element, ps refers to 4.2 K. For properties of the same compounds published earlier is refered by page number in Landolt-Börnstein NS, group III, volume 19d2, pages 469 - 545, in which also many compounds have been reviewed for which no new data would be found in the literature published in the reviewed period 1985 - 1999.
Compound page in Vol. 19d2
Θ [K]
TC [K]
TN [K]
χ ps
[µB]/R peff
[µB]/R Remarks Ref.
R3M 470
Gd3Rh 470 XPS valence band of single crystal, pure Rh and Gd: Fig. 1; ρ vs. T: Fig. 2
95T2
146 112 Fig. 3 14.7 ∆p = (peff/f.u.)/31/2
Gd3Pd 340 325 Fig. 4 13.27 ∆p = (peff/f.u.)/31/2, ρ vs. T: Fig. 5 95T2
Gd3Ir XPS valence band of single crystal, pure Ir and Gd: Fig. 6; ρ vs. T: Fig. 2
95T2
169 155 Fig. 7 14.07 ∆p = (peff/f.u.)/31/2
R7M3 471
Ce7Ru3 Fig. 8 magnetization 1.5 µB/mol at 2 K and 5 T, Cel/T vs. T: Fig. 9
95T4
Ce7Rh3 471 6.8 Fig. 10 magnetization 6 µB/mol at 2 K and 5 T Cel /T vs. T: Fig. 11
95T4
6.9 6.5 Fig. 12 Cm = 4.23 cm3K/mol, the positive value of Θ is in agreement with the onset of the spontaneous magnetization
92S1
Ce7Pd3 471 3.6 Fig. 8 magnetization 5.8 µB/mol at 2 K and 5 T, Cel /T vs. T: Fig. 9
95T4
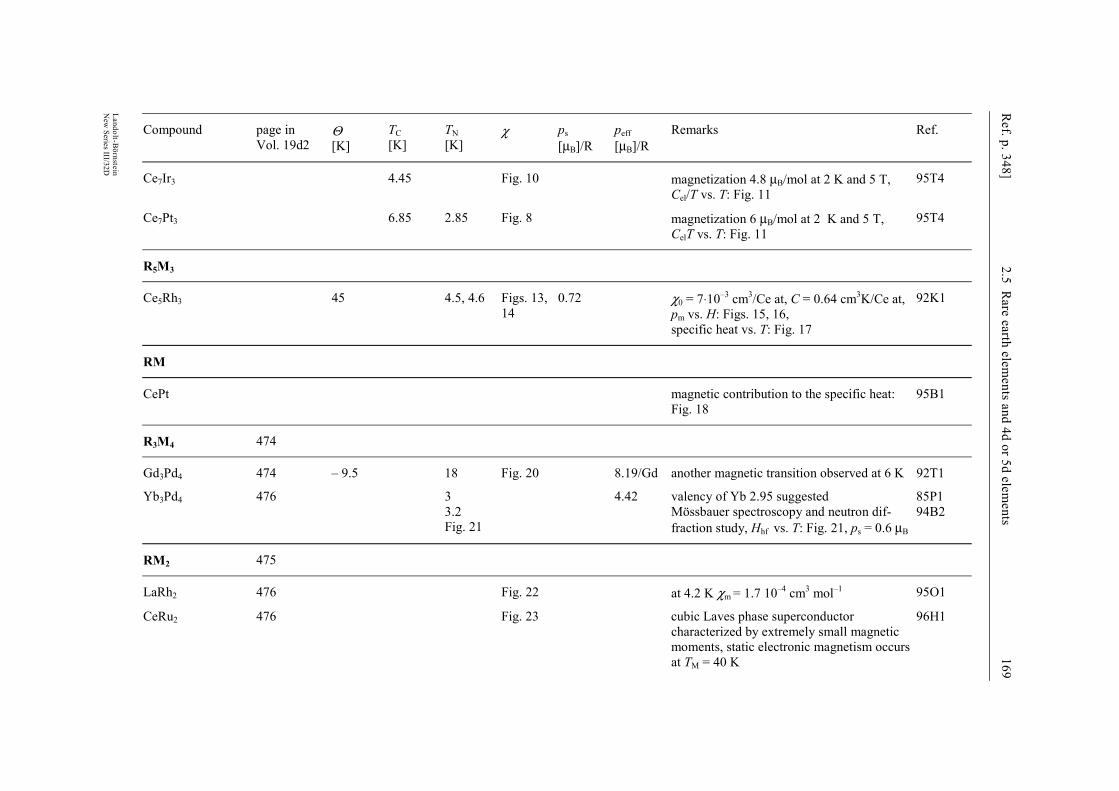
Ref. p. 348]
2.5 Rare earth elem
ents and 4d or 5d elements
169
Landolt-Börnstein
New
Series III/32D
Compound page in Vol. 19d2
Θ [K]
TC [K]
TN [K]
χ ps
[µB]/R peff
[µB]/R Remarks Ref.
Ce7Ir3 4.45 Fig. 10 magnetization 4.8 µB/mol at 2 K and 5 T, Cel/T vs. T: Fig. 11
95T4
Ce7Pt3 6.85 2.85 Fig. 8 magnetization 6 µB/mol at 2 K and 5 T, CelT vs. T: Fig. 11
95T4
R5M3
Ce5Rh3 45 4.5, 4.6 Figs. 13, 14
0.72 χ0 = 7⋅10–3 cm3/Ce at, C = 0.64 cm3K/Ce at, pm vs. H: Figs. 15, 16, specific heat vs. T: Fig. 17
92K1
RM
CePt magnetic contribution to the specific heat: Fig. 18
95B1
R3M4 474
Gd3Pd4 474 – 9.5 18 Fig. 20 8.19/Gd another magnetic transition observed at 6 K 92T1
Yb3Pd4 476 3 4.42 valency of Yb 2.95 suggested 85P1 3.2
Fig. 21 Mössbauer spectroscopy and neutron dif-
fraction study, Hhf vs. T: Fig. 21, ps = 0.6 µB 94B2
RM2 475
LaRh2 476 Fig. 22 at 4.2 K χm = 1.7 10–4 cm3 mol–1 95O1
CeRu2 476 Fig. 23 cubic Laves phase superconductor characterized by extremely small magnetic moments, static electronic magnetism occurs at TM = 40 K
96H1
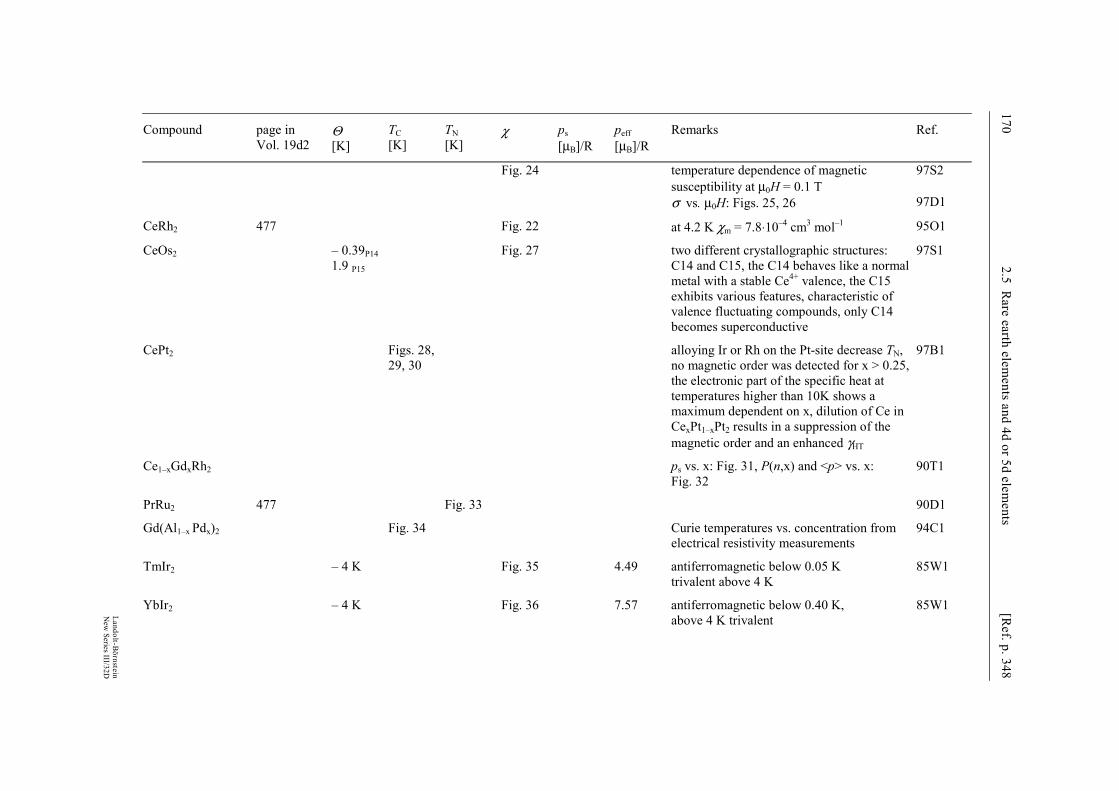
170 2.5 R
are earth elements and 4d or 5d elem
ents [R
ef. p. 348
Landolt-B
örnstein
New
Series III/32D
Compound page in Vol. 19d2
Θ [K]
TC [K]
TN [K]
χ ps
[µB]/R peff
[µB]/R Remarks Ref.
Fig. 24 temperature dependence of magnetic susceptibility at µ0H = 0.1 T
97S2
σ vs. µ0H: Figs. 25, 26 97D1
CeRh2 477 Fig. 22 at 4.2 K χm = 7.8⋅10–4 cm3 mol–1 95O1
CeOs2 – 0.39P14 1.9 P15
Fig. 27 two different crystallographic structures: C14 and C15, the C14 behaves like a normal metal with a stable Ce4+ valence, the C15 exhibits various features, characteristic of valence fluctuating compounds, only C14 becomes superconductive
97S1
CePt2 Figs. 28, 29, 30
alloying Ir or Rh on the Pt-site decrease TN, no magnetic order was detected for x > 0.25, the electronic part of the specific heat at temperatures higher than 10K shows a maximum dependent on x, dilution of Ce in CexPt1–xPt2 results in a suppression of the magnetic order and an enhanced γHT
97B1
Ce1–xGdxRh2 ps vs. x: Fig. 31, P(n,x) and <p> vs. x: Fig. 32
90T1
PrRu2 477 Fig. 33 90D1
Gd(Al1–x Pdx)2 Fig. 34 Curie temperatures vs. concentration from electrical resistivity measurements
94C1
TmIr2 – 4 K Fig. 35 4.49 antiferromagnetic below 0.05 K trivalent above 4 K
85W1
YbIr2 – 4 K Fig. 36 7.57 antiferromagnetic below 0.40 K, above 4 K trivalent
85W1
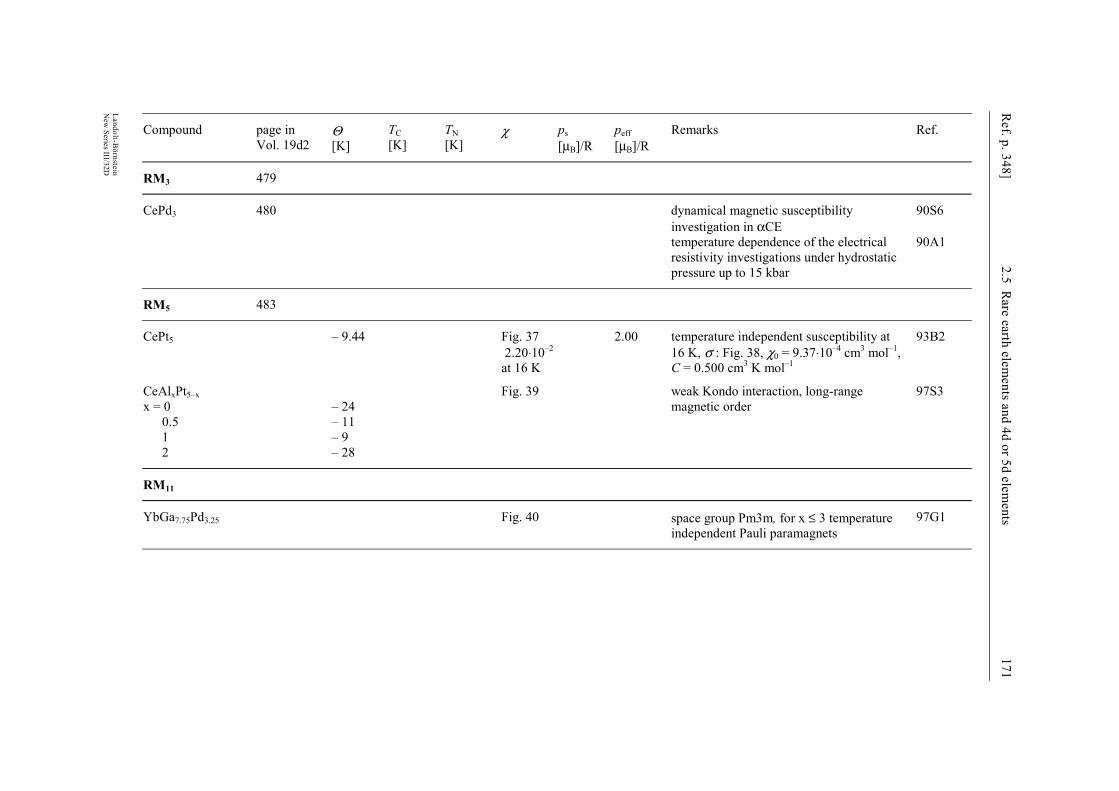
Ref. p. 348]
2.5 Rare earth elem
ents and 4d or 5d elements
171
Landolt-Börnstein
New
Series III/32D
Compound page in Vol. 19d2
Θ [K]
TC [K]
TN [K]
χ ps
[µB]/R peff
[µB]/R Remarks Ref.
RM3 479
CePd3 480 dynamical magnetic susceptibility investigation in αCE
90S6
temperature dependence of the electrical resistivity investigations under hydrostatic pressure up to 15 kbar
90A1
RM5 483
CePt5 – 9.44 Fig. 37 2.20⋅10–2 at 16 K
2.00 temperature independent susceptibility at 16 K, σ : Fig. 38, χ0 = 9.37⋅10–4 cm3 mol–1, C = 0.500 cm3 K mol–1
93B2
CeAlxPt5–x x = 0 0.5 1 2
– 24 – 11 – 9 – 28
Fig. 39 weak Kondo interaction, long-range magnetic order
97S3
RM11
YbGa7.75Pd3.25 Fig. 40 space group Pm3m, for x ≤ 3 temperature independent Pauli paramagnets
97G1
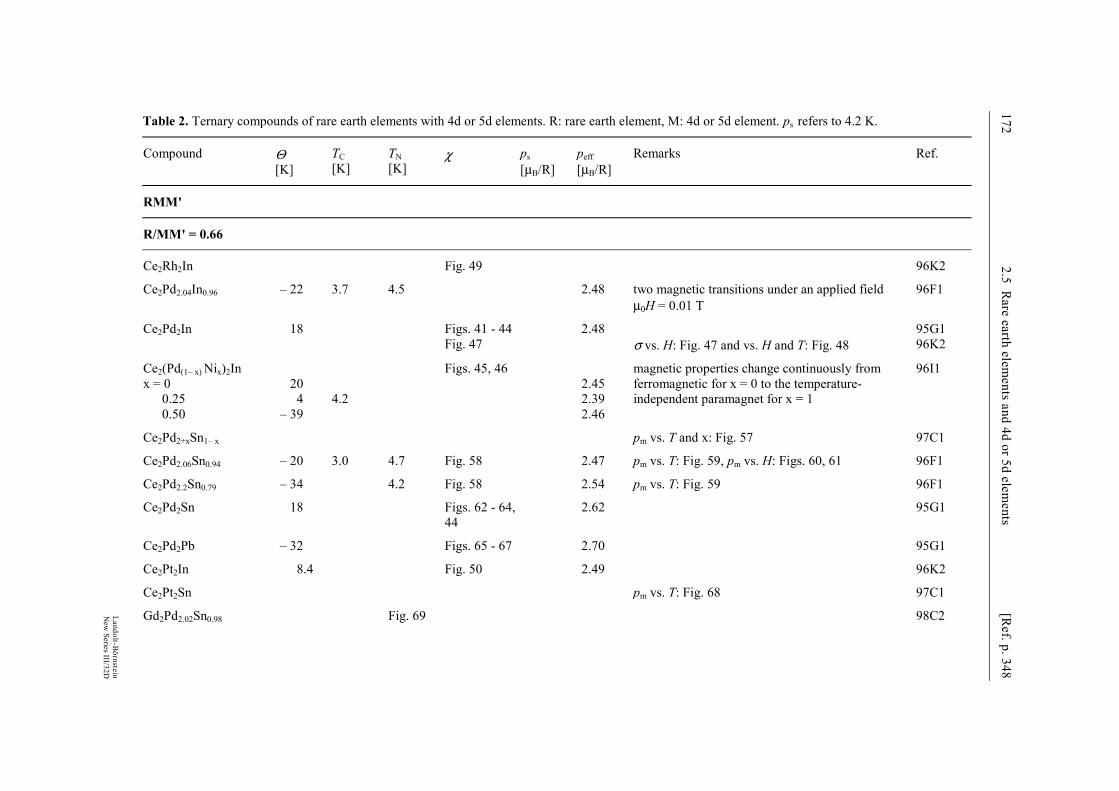
172 2.5 R
are earth elements and 4d or 5d elem
ents [R
ef. p. 348
Landolt-B
örnstein
New
Series III/32D
Table 2. Ternary compounds of rare earth elements with 4d or 5d elements. R: rare earth element, M: 4d or 5d element. ps refers to 4.2 K.
Compound Θ [K]
TC [K]
TN [K]
χ ps [µB/R]
peff [µB/R]
Remarks Ref.
RMM'
R/MM' = 0.66
Ce2Rh2In Fig. 49 96K2
Ce2Pd2.04In0.96 – 22 3.7 4.5 2.48 two magnetic transitions under an applied field µ0H = 0.01 T
96F1
Ce2Pd2In 18 Figs. 41 - 44 2.48 95G1 Fig. 47 σ vs. H: Fig. 47 and vs. H and T: Fig. 48 96K2
Ce2(Pd(1– x) Nix)2In x = 0 0.25 0.50
20
4 – 39
4.2
Figs. 45, 46 2.45 2.39 2.46
magnetic properties change continuously from ferromagnetic for x = 0 to the temperature-independent paramagnet for x = 1
96I1
Ce2Pd2+xSn1– x pm vs. T and x: Fig. 57 97C1
Ce2Pd2.06Sn0.94 – 20 3.0 4.7 Fig. 58 2.47 pm vs. T: Fig. 59, pm vs. H: Figs. 60, 61 96F1
Ce2Pd2.2Sn0.79 – 34 4.2 Fig. 58 2.54 pm vs. T: Fig. 59 96F1
Ce2Pd2Sn 18 Figs. 62 - 64, 44
2.62 95G1
Ce2Pd2Pb – 32 Figs. 65 - 67 2.70 95G1
Ce2Pt2In 8.4 Fig. 50 2.49 96K2
Ce2Pt2Sn pm vs. T: Fig. 68 97C1
Gd2Pd2.02Sn0.98 Fig. 69 98C2
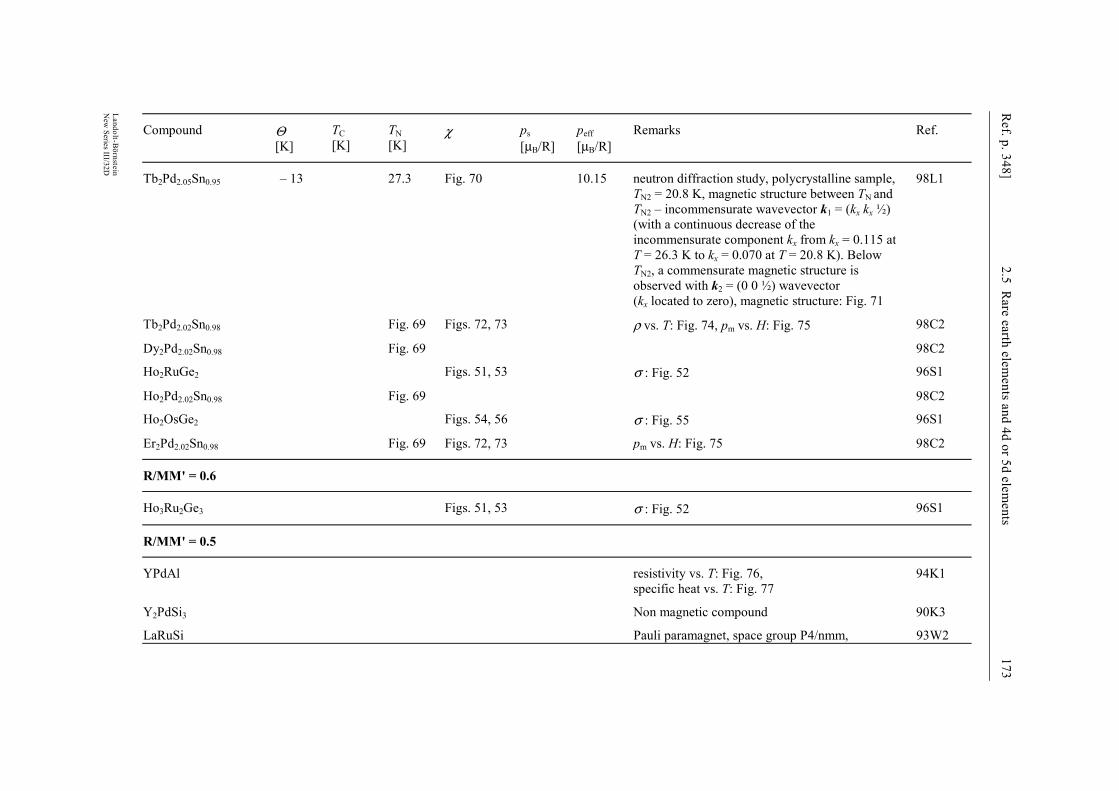
Ref. p. 348]
2.5 Rare earth elem
ents and 4d or 5d elements
173
Landolt-Börnstein
New
Series III/32D
Compound Θ [K]
TC [K]
TN [K]
χ ps [µB/R]
peff [µB/R]
Remarks Ref.
Tb2Pd2.05Sn0.95 – 13 27.3 Fig. 70 10.15 neutron diffraction study, polycrystalline sample, TN2 = 20.8 K, magnetic structure between TN and TN2 – incommensurate wavevector k1 = (kx kx ½) (with a continuous decrease of the incommensurate component kx from kx = 0.115 at T = 26.3 K to kx = 0.070 at T = 20.8 K). Below TN2, a commensurate magnetic structure is observed with k2 = (0 0 ½) wavevector (kx located to zero), magnetic structure: Fig. 71
98L1
Tb2Pd2.02Sn0.98 Fig. 69 Figs. 72, 73 ρ vs. T: Fig. 74, pm vs. H: Fig. 75 98C2
Dy2Pd2.02Sn0.98 Fig. 69 98C2
Ho2RuGe2 Figs. 51, 53 σ : Fig. 52 96S1
Ho2Pd2.02Sn0.98 Fig. 69 98C2
Ho2OsGe2 Figs. 54, 56 σ : Fig. 55 96S1
Er2Pd2.02Sn0.98 Fig. 69 Figs. 72, 73 pm vs. H: Fig. 75 98C2
R/MM' = 0.6
Ho3Ru2Ge3 Figs. 51, 53 σ : Fig. 52 96S1
R/MM' = 0.5
YPdAl resistivity vs. T: Fig. 76, specific heat vs. T: Fig. 77
94K1
Y2PdSi3 Non magnetic compound 90K3
LaRuSi Pauli paramagnet, space group P4/nmm, 93W2
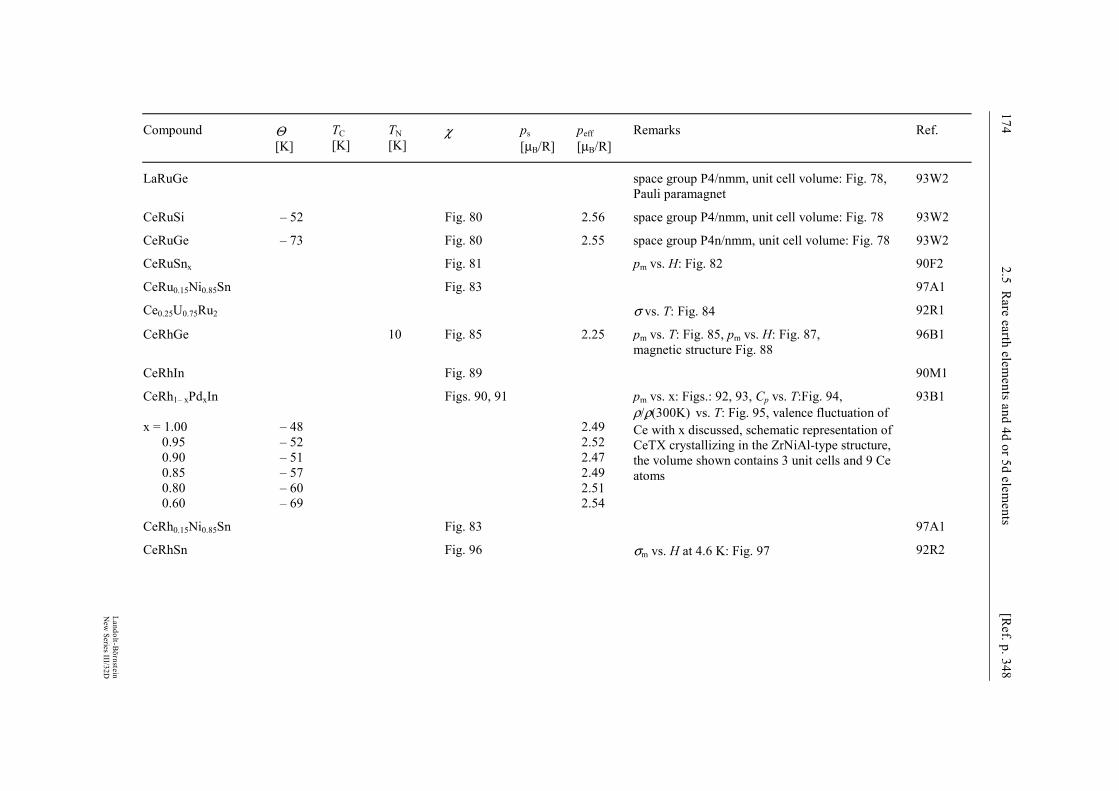
174 2.5 R
are earth elements and 4d or 5d elem
ents [R
ef. p. 348
Landolt-B
örnstein
New
Series III/32D
Compound Θ [K]
TC [K]
TN [K]
χ ps [µB/R]
peff [µB/R]
Remarks Ref.
LaRuGe space group P4/nmm, unit cell volume: Fig. 78, Pauli paramagnet
93W2
CeRuSi – 52 Fig. 80 2.56 space group P4/nmm, unit cell volume: Fig. 78 93W2
CeRuGe – 73 Fig. 80 2.55 space group P4n/nmm, unit cell volume: Fig. 78 93W2
CeRuSnx Fig. 81 pm vs. H: Fig. 82 90F2
CeRu0.15Ni0.85Sn Fig. 83 97A1
Ce0.25U0.75Ru2 σ vs. T: Fig. 84 92R1
CeRhGe 10 Fig. 85 2.25 pm vs. T: Fig. 85, pm vs. H: Fig. 87, magnetic structure Fig. 88
96B1
CeRhIn Fig. 89 90M1
CeRh1– xPdxIn x = 1.00 0.95 0.90 0.85 0.80 0.60
– 48 – 52 – 51 – 57 – 60 – 69
Figs. 90, 91
2.49 2.52 2.47 2.49 2.51 2.54
pm vs. x: Figs.: 92, 93, Cp vs. T:Fig. 94, ρ/ρ(300K) vs. T: Fig. 95, valence fluctuation of Ce with x discussed, schematic representation of CeTX crystallizing in the ZrNiAl-type structure, the volume shown contains 3 unit cells and 9 Ce atoms
93B1
CeRh0.15Ni0.85Sn Fig. 83 97A1
CeRhSn Fig. 96 σm vs. H at 4.6 K: Fig. 97 92R2
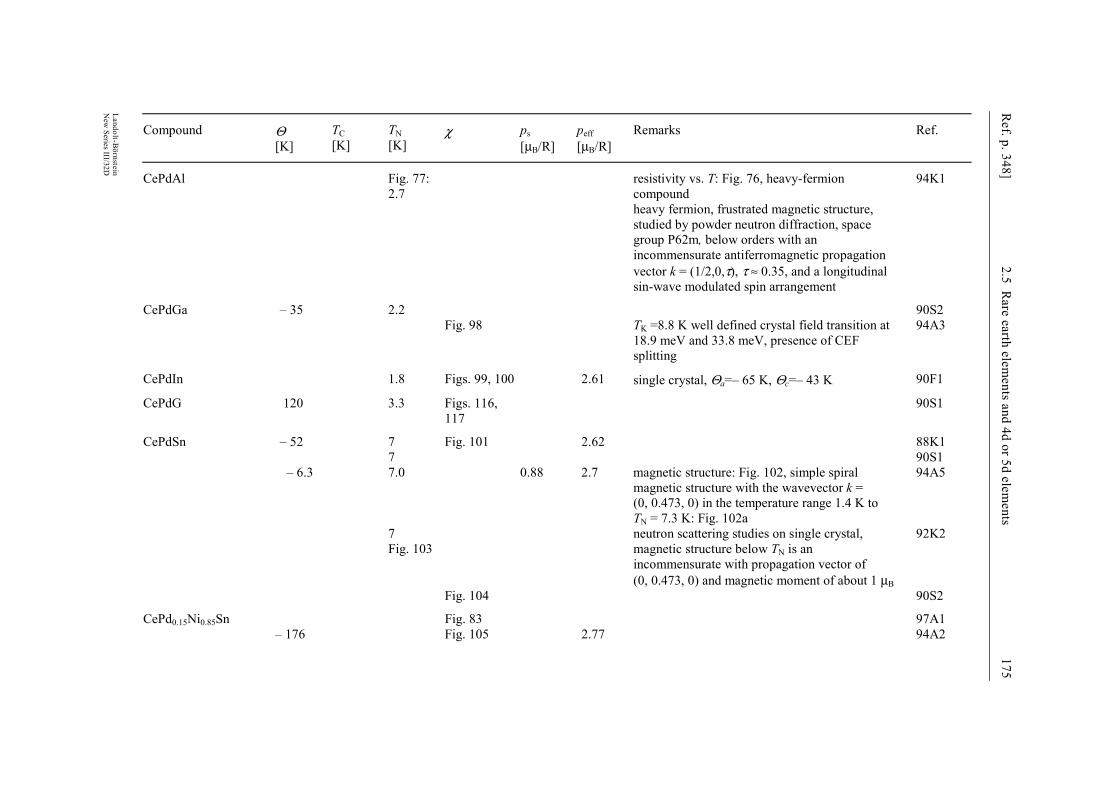
Ref. p. 348]
2.5 Rare earth elem
ents and 4d or 5d elements
175
Landolt-Börnstein
New
Series III/32D
Compound Θ [K]
TC [K]
TN [K]
χ ps [µB/R]
peff [µB/R]
Remarks Ref.
CePdAl Fig. 77: 2.7
resistivity vs. T: Fig. 76, heavy-fermion compound
94K1
heavy fermion, frustrated magnetic structure, studied by powder neutron diffraction, space group P62m, below orders with an incommensurate antiferromagnetic propagation vector k = (1/2,0,τ), τ ≈ 0.35, and a longitudinal sin-wave modulated spin arrangement
CePdGa – 35 2.2 90S2 Fig. 98 TK =8.8 K well defined crystal field transition at
18.9 meV and 33.8 meV, presence of CEF splitting
94A3
CePdIn 1.8 Figs. 99, 100 2.61 single crystal, Θa=– 65 K, Θc=– 43 K 90F1
CePdG 120 3.3 Figs. 116, 117
90S1
CePdSn – 52 7 Fig. 101 2.62 88K1 7 90S1 – 6.3 7.0 0.88 2.7 magnetic structure: Fig. 102, simple spiral
magnetic structure with the wavevector k = (0, 0.473, 0) in the temperature range 1.4 K to TN = 7.3 K: Fig. 102a
94A5
7 Fig. 103
neutron scattering studies on single crystal, magnetic structure below TN is an incommensurate with propagation vector of (0, 0.473, 0) and magnetic moment of about 1 µB
92K2
Fig. 104 90S2
CePd0.15Ni0.85Sn Fig. 83 97A1 – 176 Fig. 105 2.77 94A2
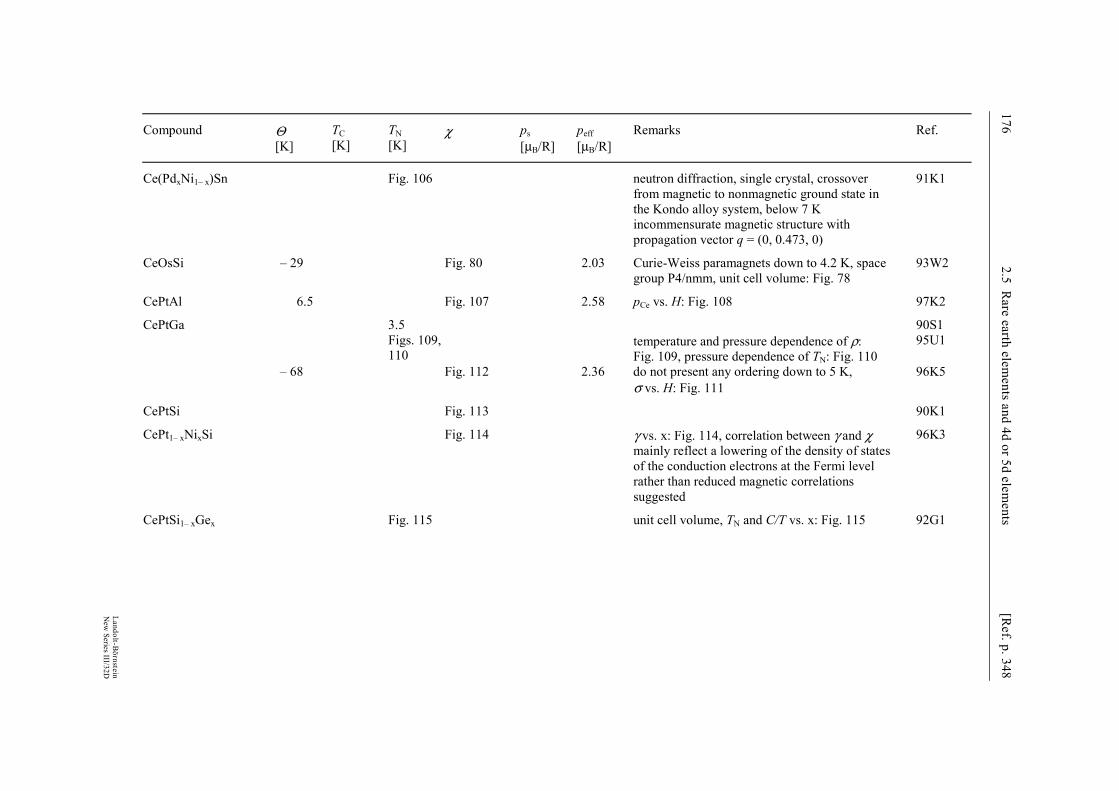
176 2.5 R
are earth elements and 4d or 5d elem
ents [R
ef. p. 348
Landolt-B
örnstein
New
Series III/32D
Compound Θ [K]
TC [K]
TN [K]
χ ps [µB/R]
peff [µB/R]
Remarks Ref.
Ce(PdxNi1– x)Sn Fig. 106 neutron diffraction, single crystal, crossover from magnetic to nonmagnetic ground state in the Kondo alloy system, below 7 K incommensurate magnetic structure with propagation vector q = (0, 0.473, 0)
91K1
CeOsSi – 29 Fig. 80 2.03 Curie-Weiss paramagnets down to 4.2 K, space group P4/nmm, unit cell volume: Fig. 78
93W2
CePtAl 6.5 Fig. 107 2.58 pCe vs. H: Fig. 108 97K2
CePtGa 3.5 90S1 Figs. 109,
110 temperature and pressure dependence of ρ:
Fig. 109, pressure dependence of TN: Fig. 110 95U1
– 68 Fig. 112 2.36 do not present any ordering down to 5 K, σ vs. H: Fig. 111
96K5
CePtSi Fig. 113 90K1
CePt1– xNixSi Fig. 114 γ vs. x: Fig. 114, correlation between γ and χ mainly reflect a lowering of the density of states of the conduction electrons at the Fermi level rather than reduced magnetic correlations suggested
96K3
CePtSi1– xGex Fig. 115 unit cell volume, TN and C/T vs. x: Fig. 115 92G1
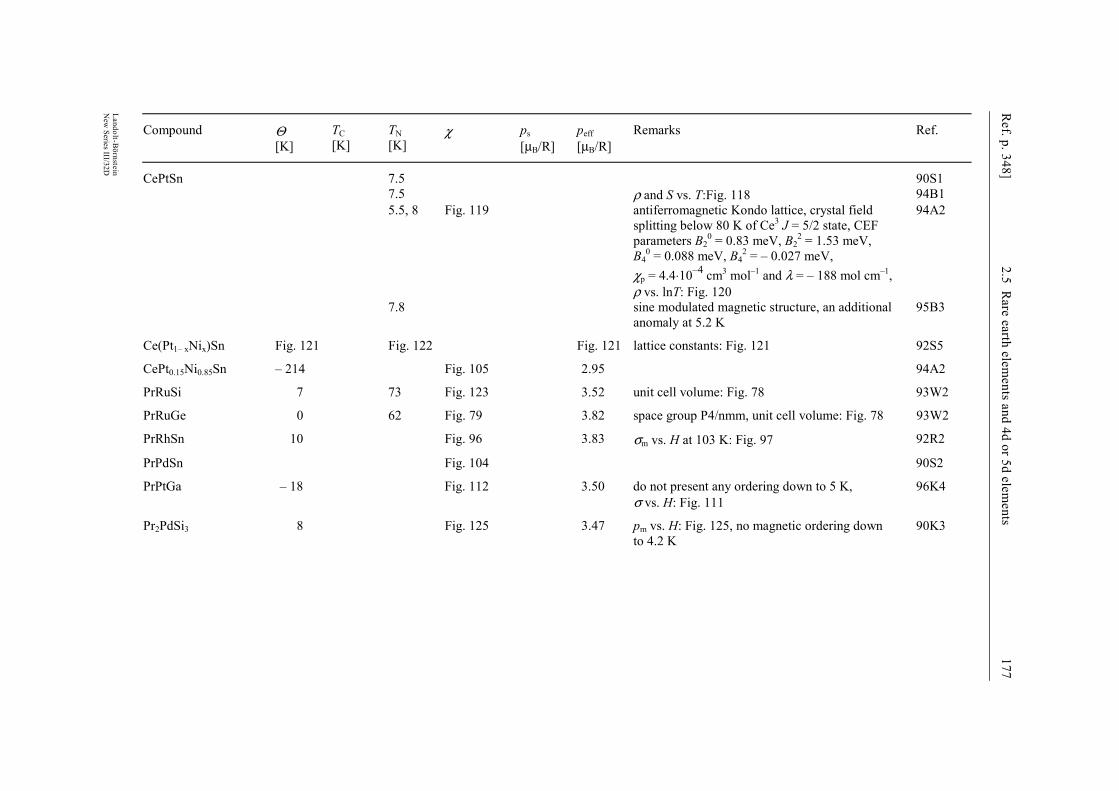
Ref. p. 348]
2.5 Rare earth elem
ents and 4d or 5d elements
177
Landolt-Börnstein
New
Series III/32D
Compound Θ [K]
TC [K]
TN [K]
χ ps [µB/R]
peff [µB/R]
Remarks Ref.
CePtSn 7.5 90S1 7.5 ρ and S vs. T:Fig. 118 94B1 5.5, 8 Fig. 119 antiferromagnetic Kondo lattice, crystal field
splitting below 80 K of Ce3 J = 5/2 state, CEF parameters B2
0 = 0.83 meV, B22 = 1.53 meV,
B40 = 0.088 meV, B4
2 = – 0.027 meV, χp = 4.4⋅10–4 cm3 mol–1 and λ = – 188 mol cm–1, ρ vs. lnT: Fig. 120
94A2
7.8 sine modulated magnetic structure, an additional anomaly at 5.2 K
95B3
Ce(Pt1– xNix)Sn Fig. 121 Fig. 122 Fig. 121 lattice constants: Fig. 121 92S5
CePt0.15Ni0.85Sn – 214 Fig. 105 2.95 94A2
PrRuSi 7 73 Fig. 123 3.52 unit cell volume: Fig. 78 93W2
PrRuGe 0 62 Fig. 79 3.82 space group P4/nmm, unit cell volume: Fig. 78 93W2
PrRhSn 10 Fig. 96 3.83 σm vs. H at 103 K: Fig. 97 92R2
PrPdSn Fig. 104 90S2
PrPtGa – 18 Fig. 112 3.50 do not present any ordering down to 5 K, σ vs. H: Fig. 111
96K4
Pr2PdSi3 8 Fig. 125 3.47 pm vs. H: Fig. 125, no magnetic ordering down to 4.2 K
90K3
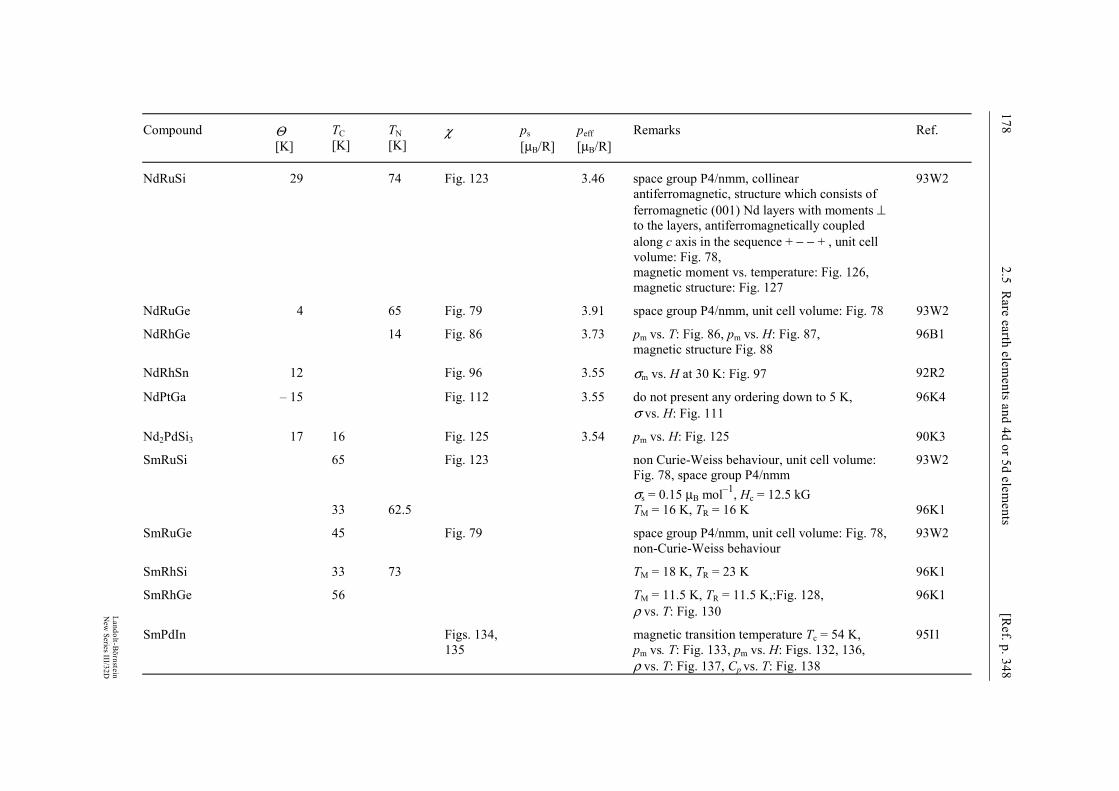
178 2.5 R
are earth elements and 4d or 5d elem
ents [R
ef. p. 348
Landolt-B
örnstein
New
Series III/32D
Compound Θ [K]
TC [K]
TN [K]
χ ps [µB/R]
peff [µB/R]
Remarks Ref.
NdRuSi 29 74 Fig. 123 3.46 space group P4/nmm, collinear antiferromagnetic, structure which consists of ferromagnetic (001) Nd layers with moments ⊥ to the layers, antiferromagnetically coupled along c axis in the sequence + − − + , unit cell volume: Fig. 78, magnetic moment vs. temperature: Fig. 126, magnetic structure: Fig. 127
93W2
NdRuGe 4 65 Fig. 79 3.91 space group P4/nmm, unit cell volume: Fig. 78 93W2
NdRhGe 14 Fig. 86 3.73 pm vs. T: Fig. 86, pm vs. H: Fig. 87, magnetic structure Fig. 88
96B1
NdRhSn 12 Fig. 96 3.55 σm vs. H at 30 K: Fig. 97 92R2
NdPtGa – 15 Fig. 112 3.55 do not present any ordering down to 5 K, σ vs. H: Fig. 111
96K4
Nd2PdSi3 17 16 Fig. 125 3.54 pm vs. H: Fig. 125 90K3
SmRuSi 65 Fig. 123 non Curie-Weiss behaviour, unit cell volume: Fig. 78, space group P4/nmm σs = 0.15 µB mol–1, Hc = 12.5 kG
93W2
33 62.5 TM = 16 K, TR = 16 K 96K1
SmRuGe 45 Fig. 79 space group P4/nmm, unit cell volume: Fig. 78, non-Curie-Weiss behaviour
93W2
SmRhSi 33 73 TM = 18 K, TR = 23 K 96K1
SmRhGe 56 TM = 11.5 K, TR = 11.5 K,:Fig. 128, ρ vs. T: Fig. 130
96K1
SmPdIn Figs. 134, 135
magnetic transition temperature Tc = 54 K, pm vs. T: Fig. 133, pm vs. H: Figs. 132, 136, ρ vs. T: Fig. 137, Cp vs. T: Fig. 138
95I1
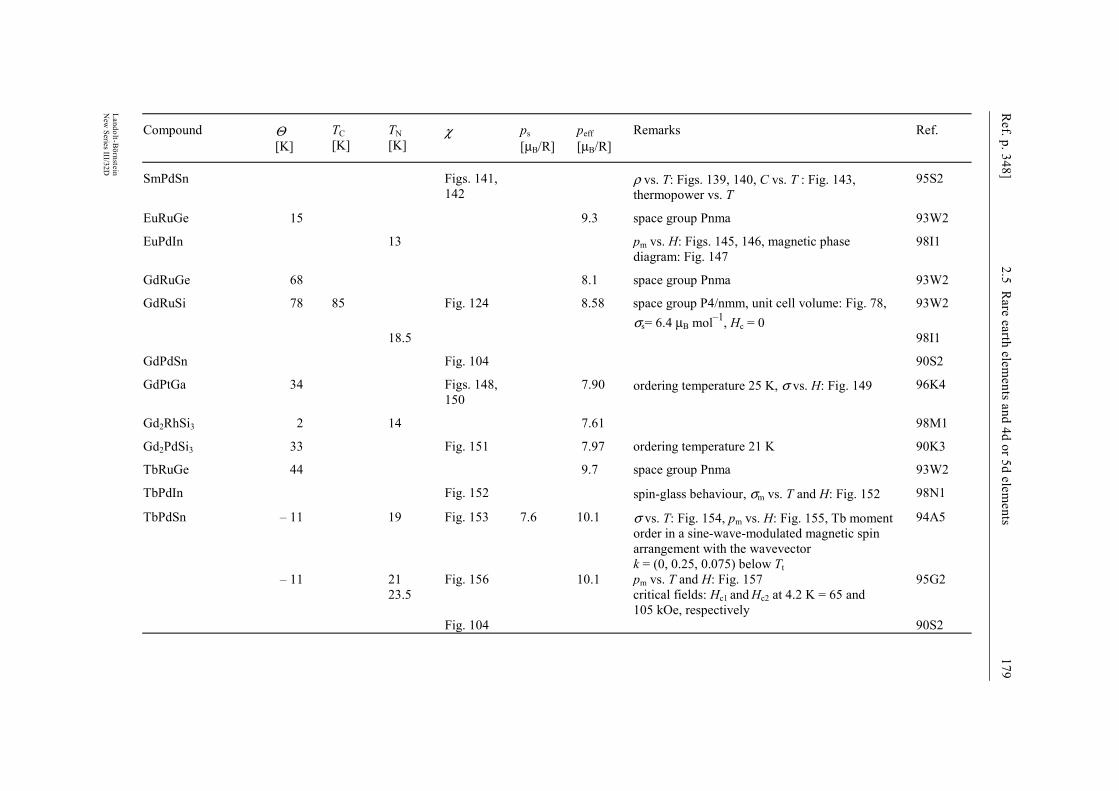
Ref. p. 348]
2.5 Rare earth elem
ents and 4d or 5d elements
179
Landolt-Börnstein
New
Series III/32D
Compound Θ [K]
TC [K]
TN [K]
χ ps [µB/R]
peff [µB/R]
Remarks Ref.
SmPdSn Figs. 141, 142
ρ vs. T: Figs. 139, 140, C vs. T : Fig. 143, thermopower vs. T
95S2
EuRuGe 15 9.3 space group Pnma 93W2
EuPdIn 13 pm vs. H: Figs. 145, 146, magnetic phase diagram: Fig. 147
98I1
GdRuGe 68 8.1 space group Pnma 93W2
GdRuSi 78 85 Fig. 124 8.58 space group P4/nmm, unit cell volume: Fig. 78, σs= 6.4 µB mol–1, Hc = 0
93W2
18.5 98I1
GdPdSn Fig. 104 90S2
GdPtGa 34 Figs. 148, 150
7.90 ordering temperature 25 K, σ vs. H: Fig. 149 96K4
Gd2RhSi3 2 14 7.61 98M1
Gd2PdSi3 33 Fig. 151 7.97 ordering temperature 21 K 90K3
TbRuGe 44 9.7 space group Pnma 93W2
TbPdIn Fig. 152 spin-glass behaviour, σm vs. T and H: Fig. 152 98N1
TbPdSn – 11 19 Fig. 153 7.6 10.1 σ vs. T: Fig. 154, pm vs. H: Fig. 155, Tb moment order in a sine-wave-modulated magnetic spin arrangement with the wavevector k = (0, 0.25, 0.075) below Tt
94A5
– 11 21 Fig. 156 10.1 pm vs. T and H: Fig. 157 95G2 23.5 critical fields: Hc1 and Hc2 at 4.2 K = 65 and
105 kOe, respectively
Fig. 104 90S2
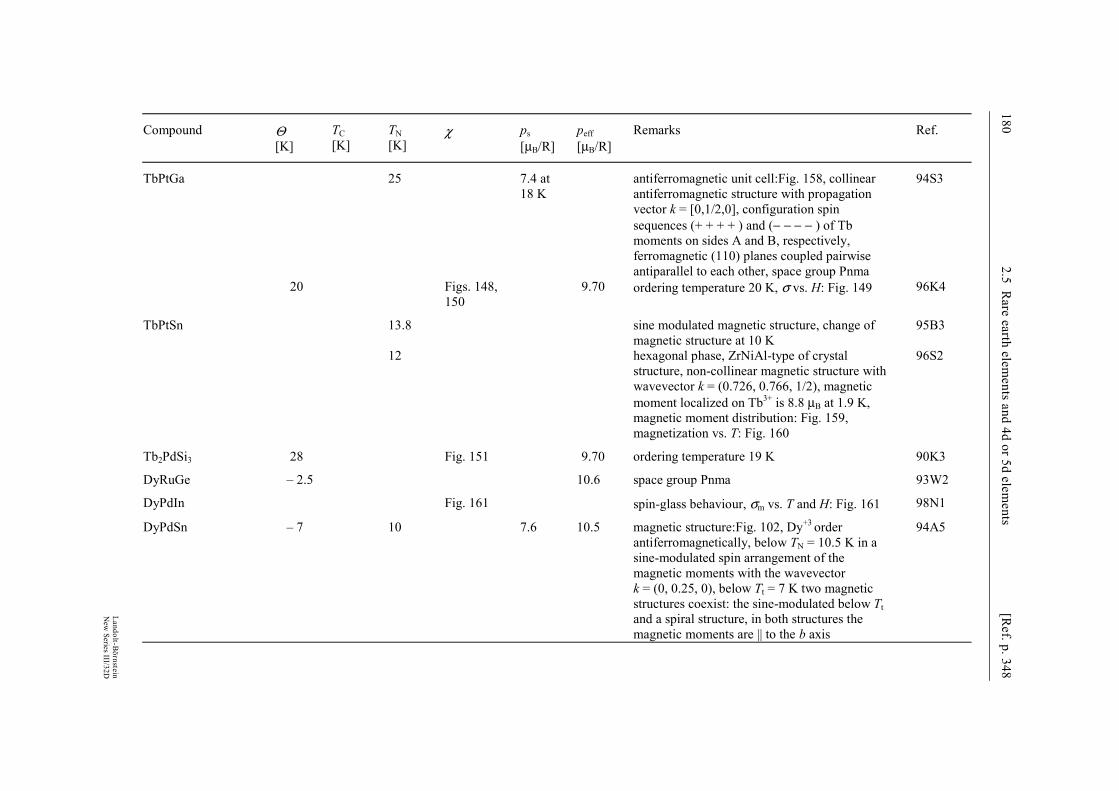
180 2.5 R
are earth elements and 4d or 5d elem
ents [R
ef. p. 348
Landolt-B
örnstein
New
Series III/32D
Compound Θ [K]
TC [K]
TN [K]
χ ps [µB/R]
peff [µB/R]
Remarks Ref.
TbPtGa 25 7.4 at 18 K
antiferromagnetic unit cell:Fig. 158, collinear antiferromagnetic structure with propagation vector k = [0,1/2,0], configuration spin sequences (+ + + + ) and (− − − − ) of Tb moments on sides A and B, respectively, ferromagnetic (110) planes coupled pairwise antiparallel to each other, space group Pnma
94S3
20 Figs. 148, 150
9.70 ordering temperature 20 K, σ vs. H: Fig. 149 96K4
TbPtSn 13.8 sine modulated magnetic structure, change of magnetic structure at 10 K
95B3
12 hexagonal phase, ZrNiAl-type of crystal structure, non-collinear magnetic structure with wavevector k = (0.726, 0.766, 1/2), magnetic moment localized on Tb3+ is 8.8 µB at 1.9 K, magnetic moment distribution: Fig. 159, magnetization vs. T: Fig. 160
96S2
Tb2PdSi3 28 Fig. 151 9.70 ordering temperature 19 K 90K3
DyRuGe – 2.5 10.6 space group Pnma 93W2
DyPdIn Fig. 161 spin-glass behaviour, σm vs. T and H: Fig. 161 98N1
DyPdSn – 7 10 7.6 10.5 magnetic structure:Fig. 102, Dy+3 order
antiferromagnetically, below TN = 10.5 K in a sine-modulated spin arrangement of the magnetic moments with the wavevector k = (0, 0.25, 0), below Tt = 7 K two magnetic structures coexist: the sine-modulated below Tt and a spiral structure, in both structures the magnetic moments are || to the b axis
94A5

Ref. p. 348]
2.5 Rare earth elem
ents and 4d or 5d elements
181
Landolt-Börnstein
New
Series III/32D
Compound Θ [K]
TC [K]
TN [K]
χ ps [µB/R]
peff [µB/R]
Remarks Ref.
DyPtGa 10 Figs. 148, 150
10.68 ordering temperature 15 K σ vs. H: Fig. 149 96K4
Dy2PdSi3 4 Fig. 151 10.43 ordering temperature 7 K 90K3
HoRuGe 14 10.9 space group Pnma 93W2 Figs. 51, 53 σ vs. H: Fig. 52 96S1
HoPdGe Figs. 162, 164
χ': Fig. 164 96S1
HoPdSn – 7.5 3.7 9.0 10.7 at low temperature a coexistence of two magnetic structures is observed, one with the wavevector k1 = (0, 0.268, 0) and a second one with k2 = (0.333,0.0635, 0,0748)
94A5
HoIrGe Figs. 54, 56 σ :Fig. 55 96S1
HoPtGa 6 Fig. 165 10.55 do not present any ordering down to 5 K 96K4
HoPtGe Figs. 162, 164
χ': Fig. 164 96S1
Ho2PdSi3 5 Fig. 166 10.58 ordering temperature 6 K 90K3
ErPdSn 5.2 9.01 9.62 square-modulated structure with wavevector k = (1/3, 1/2, 1/3)above 2.5 K changes to a single-modulated structure with k = (kx, ½, kz), at 1.5 K in a magnetic field Hc = 2 kOe a transition to a ferromagnetic field is obtained, pm vs. H and T: Figs. 167, 168
95A1
ErPtGa 5 Fig. 165 9.55 do not present any ordering down to 5 K 96K4
Er2PdSi3 6 Fig. 166 9.50 ordering temperature 8 K 90K3
TmPtGa – 5 Figs. 148, 150
7.40 ordering temperature 8 K σ vs. B:Fig. 149 96K4
182 2.5 R
are earth elements and 4d or 5d elem
ents [R
ef. p. 348
Landolt-B
örnstein
New
Series III/32D
Compound Θ [K]
TC [K]
TN [K]
χ ps [µB/R]
peff [µB/R]
Remarks Ref.
Tm2PdSi3 – 4 Fig. 166 7.30 no ordering down to 4.2 K observed 90K3
YbPdAl Fig. 169 Yb mixed valence suggested, ρ vs. T: Fig. 170 93C1
YbPtAl – 60 5.8 Fig. 172 4.5 dc magnetization vs. H and resistivity at 2.0 K: Fig. 173, resistivity vs. T: Fig. 171
95D1
Fig. 174 4.5 Yb valency close to + 3 95S4
YbPtSn 0.44 4.46 Tm = 3.5 K -antiferromagnetic ordering of trivalent Yb ions suggested: Fig. 175, temperature dependence of σm/H at 10 kOe, pm vs. H at 3 and 4.2 K
97K4
(YxCe1– x)2PdSi3 x = 0 0.2 0.5 0.8
– 16 – 37 – 45 – 75
Figs. 176, 178
pm vs. H: Fig. 177, no magnetic ordering observed down to 1.4 K, the Kondo effect is operative in all these alloys, strength of the Kondo effect increases with the compression of the lattice by the general replacement of Ce by Y
96M1
R/MM' = 0.375
Ho3Pd4Ge4 Figs. 162, 164
σ vs. H: Fig. 163 96S1
R/MM' = 0.357
Dy1.5 Sc3.5 Ir4Si10 Fig. 179 93G2
Dy1.75 Sc3.25 Ir4Si10 Fig. 180 93G2
Dy3Y2Os4Ge10 Fig. 181 96R1
Dy5Os4Ge10 Fig. 181 96R1
Ho5Os4Ge10 Figs. 54, 56 σ vs. H: Fig. 55 96S1
Ref. p. 348]
2.5 Rare earth elem
ents and 4d or 5d elements
183
Landolt-Börnstein
New
Series III/32D
Compound Θ [K]
TC [K]
TN [K]
χ ps [µB/R]
peff [µB/R]
Remarks Ref.
R/MM' = 0.333
CePd2Al – 23 3.3 Figs. 182, 183
2.5 Θ < 30 K, around ≈–10 K, pm vs. H: Fig. 184, heat capacity vs. T: Fig. 185
95D2
CePd2 (Al1– xGax)3 Fig. 186 TN vs. coupling strength: Fig. 187 97T4
Ce1– xYxPd2Ga Fig. 190 χm and ρ vs. T: Fig. 190 93D1
CePd2Ga Fig. 188 χm and ρ vs. T: Figs. 188, 190, pm vs. H: Fig. 189 93D1
Ce(PdxNi1– x)2Sn ρ vs. T: Fig. 191 88K1
CePtSi2 1.5 intermediate-valent system, magnetic ordering in the presence of heavy fermions, γ = 220 mJ K–2
92G1
Figs. 192, 193
96K5
CePtGe2 3.75 Fig. 194 2.49 below TC exhibits metamagnetic transition, low-temperature χ could be fitted by using a different CEF on each of the two CE sites, low-temperature C at zero and elevated H up to 10 T gave a fairly large γ (93 - 115 mJ/molCe K2) for ferrimagnetically ordered phase and, > 257 mJ/mol Ce K2 for the paramagnetic state, suggesting a moderately heavy fermion system
96G2
YbPdGa2 – 2 4.3 96G2
YbPtGa2 – 22 4.4 96G2
R/MM' = 0.2857
Gd2Mo3Si4 4.9 10.0 Fig. 195 8.29 σ vs. H at 5 K: Fig. 195, Hc = 8.0 kOe 95L1
184 2.5 R
are earth elements and 4d or 5d elem
ents [R
ef. p. 348
Landolt-B
örnstein
New
Series III/32D
Compound Θ [K]
TC [K]
TN [K]
χ ps [µB/R]
peff [µB/R]
Remarks Ref.
Tb2Mo3Si4 19 Fig. 201 9.6 second magnetic transition at 2.3 K, heat capacity: Fig. 202
94A4
11.0 19.0 and 2.3
Fig. 196 9.55 σ vs. H at 5 K: Fig. 196, Hc 8.0 kOe 95L1
Dy2Mo3Si4 5.2 12.0 Fig. 197 10.42 σ vs. H at 5 K: Fig. 197, Hc = 2.0 kOe 95L1
Ho2Mo3Si4 3.0 4.8 Fig. 198 10.49 σ vs. H at 5 K: Fig. 198 95L1
Er2Mo3Si4 1.2 Fig. 199 9.51 σ vs. H at 5 K: Fig. 199 95L1
Tm2Mo3Si4 1.7 Fig. 200 7.18 σ vs. H at 5 K: Fig. 200 95L1
R/MM' = 0.2727
Y3Pt2.5Ga8.5 temperature-independent paramagnetic, structure type La3Al11
94G4
Tb3Pt2.2Ga8.8 0 20 Figs. 203, 204
10.7 structure type La3Al11 94G4
Dy3Pt2.2Ga8.8 2 Figs. 203, 204
11.6 metamagnetic ordering temperature 20 K, structure type La3Al11, σ vs. H: Fig. 205
94G4
Ho3Pt2.2Ga8.8 – 5 12 Figs. 206, 208
11.4 structure type La3Al11 94G4
Er3Pt2.2Ga8.8 0 Fig. 203 10.3 ordering temperature < 5 K, structure type La3Al11
94G4
Tm3Pt.2.2Ga8.8 – 1 Fig. 206 8.5 ordering temperature < 5 K structure type La3Al11
94G4
Yb3Pt2.0Ga9.0 – 12 Fig. 207 1.1 temperature-independent magnetic susceptibility, intermediate valence behaviour suggested, structure type La3 Al11
94G4
Ref. p. 348]
2.5 Rare earth elem
ents and 4d or 5d elements
185
Landolt-Börnstein
New
Series III/32D
Compound Θ [K]
TC [K]
TN [K]
χ ps [µB/R]
peff [µB/R]
Remarks Ref.
R/MM' = 0.25
(Y0.37La0.63)x- Ce1– xRu2Si2
Figs. 209, 211
diluted Kondo system, magnetization : Fig. 210, simulations of χ(T) for random Kondo system
95M2
(YLa)1– xCexRu2Si2 Fig. 212 magnetization vs. H at 1.5 K: Fig. 212, Ce dilution progressively reduces the short- range exchange effects, resulting in continuously increasing heavy-fermion state suggested, differential susceptibility vs. H: Fig. 213, magnetic specific heat Cm vs. T: Fig. 214
95M1
YxCe1– xRu2Si2 pm vs. H: Fig. 215 88H1
LaPd2Al3 NMR: Fig. 217 94F1
La2Rh3Si5 Fig. 218 below 4 K diamagnetic 96P1
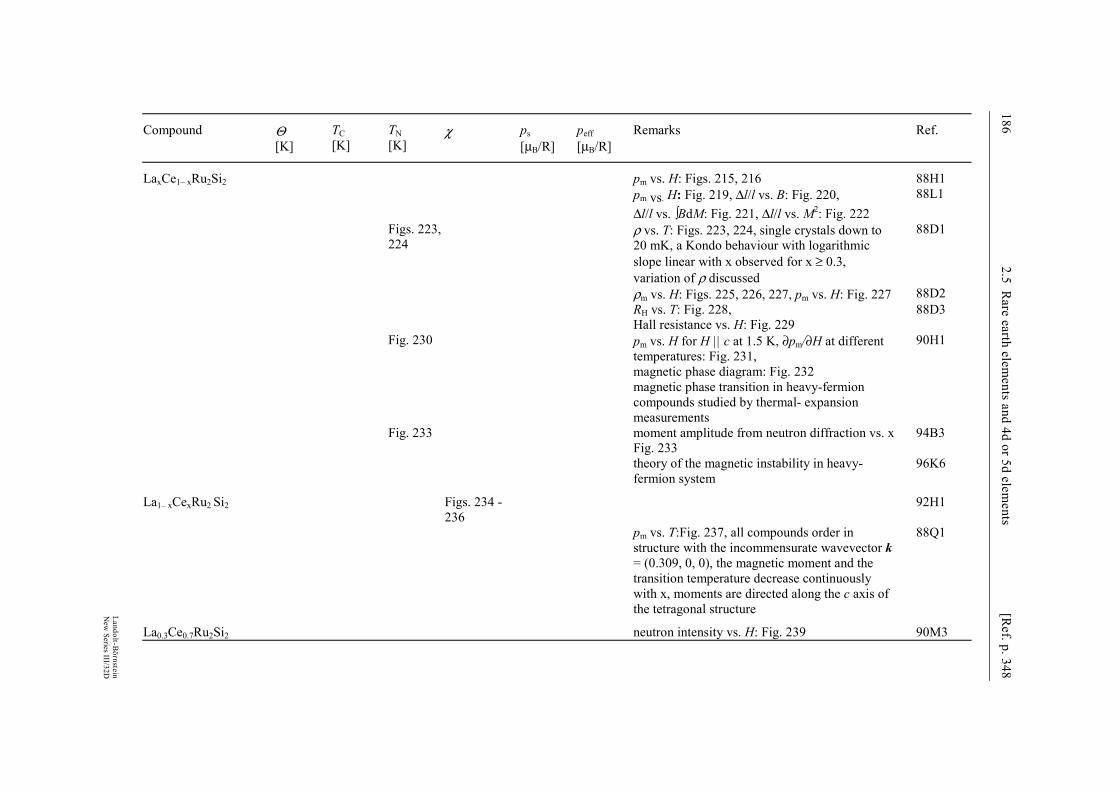
186 2.5 R
are earth elements and 4d or 5d elem
ents [R
ef. p. 348
Landolt-B
örnstein
New
Series III/32D
Compound Θ [K]
TC [K]
TN [K]
χ ps [µB/R]
peff [µB/R]
Remarks Ref.
LaxCe1– xRu2Si2 pm vs. H: Figs. 215, 216 88H1 pm vs. H: Fig. 219, ∆l/l vs. B: Fig. 220,
∆l/l vs. ∫BdM: Fig. 221, ∆l/l vs. M2: Fig. 222 88L1
Figs. 223, 224
ρ vs. T: Figs. 223, 224, single crystals down to 20 mK, a Kondo behaviour with logarithmic slope linear with x observed for x ≥ 0.3, variation of ρ discussed
88D1
ρm vs. H: Figs. 225, 226, 227, pm vs. H: Fig. 227 88D2 RH vs. T: Fig. 228,
Hall resistance vs. H: Fig. 229 88D3
Fig. 230 pm vs. H for H || c at 1.5 K, ∂pm/∂H at different temperatures: Fig. 231, magnetic phase diagram: Fig. 232
90H1
magnetic phase transition in heavy-fermion compounds studied by thermal- expansion measurements
Fig. 233 moment amplitude from neutron diffraction vs. x Fig. 233
94B3
theory of the magnetic instability in heavy-fermion system
96K6
La1– xCexRu2 Si2 Figs. 234 - 236
92H1
pm vs. T:Fig. 237, all compounds order in structure with the incommensurate wavevector k = (0.309, 0, 0), the magnetic moment and the transition temperature decrease continuously with x, moments are directed along the c axis of the tetragonal structure
88Q1
La0.3Ce0.7Ru2Si2 neutron intensity vs. H: Fig. 239 90M3

Ref. p. 348]
2.5 Rare earth elem
ents and 4d or 5d elements
187
Landolt-Börnstein
New
Series III/32D
Compound Θ [K]
TC [K]
TN [K]
χ ps [µB/R]
peff [µB/R]
Remarks Ref.
La0.2Ce0.8Ru2Si2 magnetic phase diagram: Fig. 240 90M3 Fig. 241 single crystal, pressure dependence of magnetic
Bragg peaks: Fig. 241, magnetic field dependence of magnetic intensities for neutron scattering vectors Q = (0.69, 0.69, 0) and (0.69, 1, 0) at 3.2 K: Fig. 243, magnetic correlations around Q vs. T: Fig. 242
90R1
inelastic neutron scattering study of magnetic fluctuations in the heavy-fermion system, single site and intersite fluctuations have been studied between 1.4 and 100 K
92J1
Fig. 244 moment amplitude from neutron diffraction vs. pressure: Fig. 244
94B3
La0.05Ce0.95Ru2Si2 pm vs. T2: Fig. 245 90P2
LaxCe1– xPd2Si2 Fig. 246 resistivity and specific heat vs. T show similar behaviour
90S3
La0.5 Ce0.5Pd2Si2 – 49 4 Figs. 248, 249
2.55 specific heat vs. T: Fig. 250 90S4
La0.5Ce0.5Pd2Ge2 Figs. 251, 252
pm vs. H: Fig. 253 92B1
LaxCe1– xIr2Ge2 Fig. 254 97M1
La1– x PrxRu2Si2 Fig. 255 pPr vs. T and H: Fig. 256 98M2
La2– xNdxRh3Si5 Fig. 257 96P1
La1– xUxRu2Si2 Fig. 258 Tdχm/dT vs. T: Fig. 258, pm vs. H: Fig. 259 96M2
La0.95U0.05Ru2Si2 Fig. 260 96M2

188 2.5 R
are earth elements and 4d or 5d elem
ents [R
ef. p. 348
Landolt-B
örnstein
New
Series III/32D
Compound Θ [K]
TC [K]
TN [K]
χ ps [µB/R]
peff [µB/R]
Remarks Ref.
CeRu2Si2 magneto-thermopower vs. H || c: Fig. 261, influence of the metamagnetic-like transition on magneto-thermopower
88A1
pm vs. H and p: Fig. 304, ρm vs. H: Figs. 305, 306, magnetostriction vs. H: Fig. 307
88M1
pm vs. T2: Fig. 262 90P1 Fig. 263 90B1 de Haas-van Alphen effect for magnetic field
ranges below and above metamagnetic transition field Hm
94A1
single crystal heavy-fermion compound, absence of magnetic order and superconductivity, at least down to 20 mK, ρm vs. T: Figs. 264, 265
92L1
Fig. 266 heavy-fermion paramagnet, metamagnetic transition (µ0Hc ≈ 7.8 T) for H || c: Fig. 266
95T1
single crystal, heavy-electron compound, pm and (∆χ)– 1 the reciprocal of the peak height of ∂pm/∂H: Figs. 267, 268 in low-temperature metamagnetic behaviour quite sharp at 0.1 K. TK ≈ 20 K
95S1
Figs. 269, 270
single crystal, heavy fermion, tetragonal structure, non-linear susceptibility: Fig. 269
95P1
ρ vs. H: and T: Fig. 271 97L1
Ce(RuxRh1– x)2Si2 specific heat of heavy-fermion system: Figs. 272, 273, 274
90C1
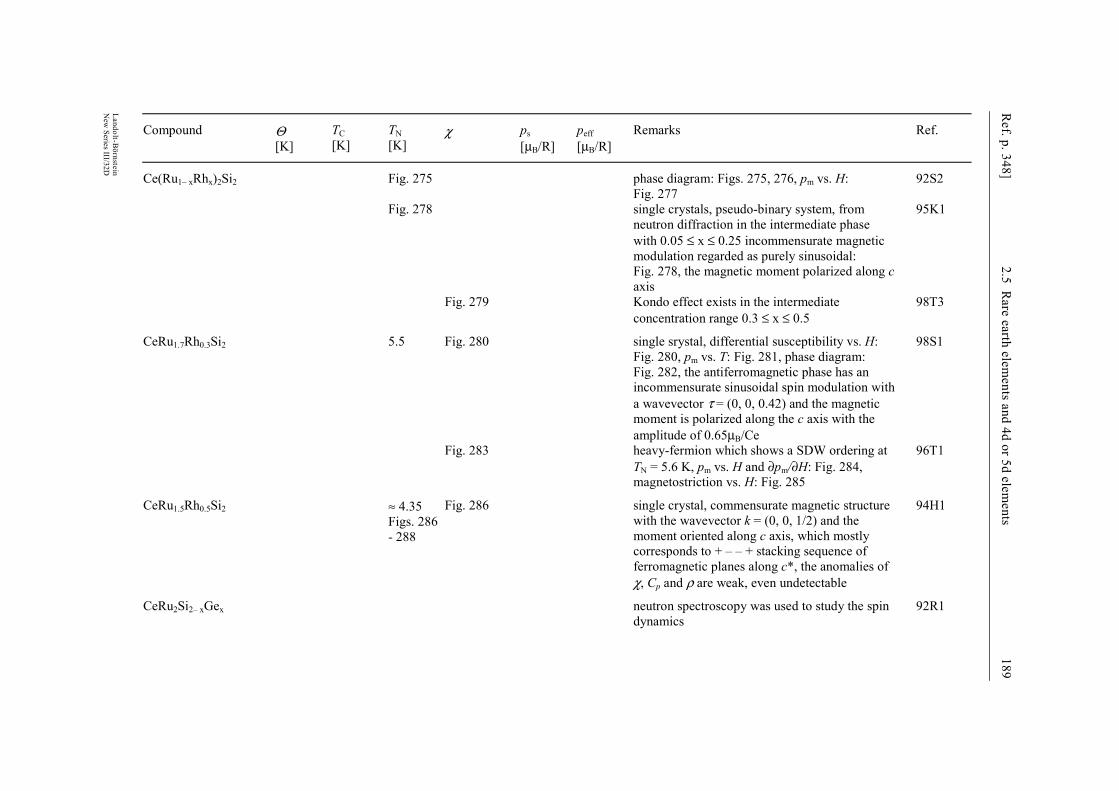
Ref. p. 348]
2.5 Rare earth elem
ents and 4d or 5d elements
189
Landolt-Börnstein
New
Series III/32D
Compound Θ [K]
TC [K]
TN [K]
χ ps [µB/R]
peff [µB/R]
Remarks Ref.
Ce(Ru1– xRhx)2Si2 Fig. 275 phase diagram: Figs. 275, 276, pm vs. H: Fig. 277
92S2
Fig. 278 single crystals, pseudo-binary system, from neutron diffraction in the intermediate phase with 0.05 ≤ x ≤ 0.25 incommensurate magnetic modulation regarded as purely sinusoidal: Fig. 278, the magnetic moment polarized along c axis
95K1
Fig. 279 Kondo effect exists in the intermediate concentration range 0.3 ≤ x ≤ 0.5
98T3
CeRu1.7Rh0.3Si2 5.5 Fig. 280 single srystal, differential susceptibility vs. H: Fig. 280, pm vs. T: Fig. 281, phase diagram: Fig. 282, the antiferromagnetic phase has an incommensurate sinusoidal spin modulation with a wavevector τ = (0, 0, 0.42) and the magnetic moment is polarized along the c axis with the amplitude of 0.65µB/Ce
98S1
Fig. 283 heavy-fermion which shows a SDW ordering at TN = 5.6 K, pm vs. H and ∂pm/∂H: Fig. 284, magnetostriction vs. H: Fig. 285
96T1
CeRu1.5Rh0.5Si2 ≈ 4.35 Figs. 286 - 288
Fig. 286 single crystal, commensurate magnetic structure with the wavevector k = (0, 0, 1/2) and the moment oriented along c axis, which mostly corresponds to + – – + stacking sequence of ferromagnetic planes along c*, the anomalies of χ, Cp and ρ are weak, even undetectable
94H1
CeRu2Si2– xGex neutron spectroscopy was used to study the spin dynamics
92R1
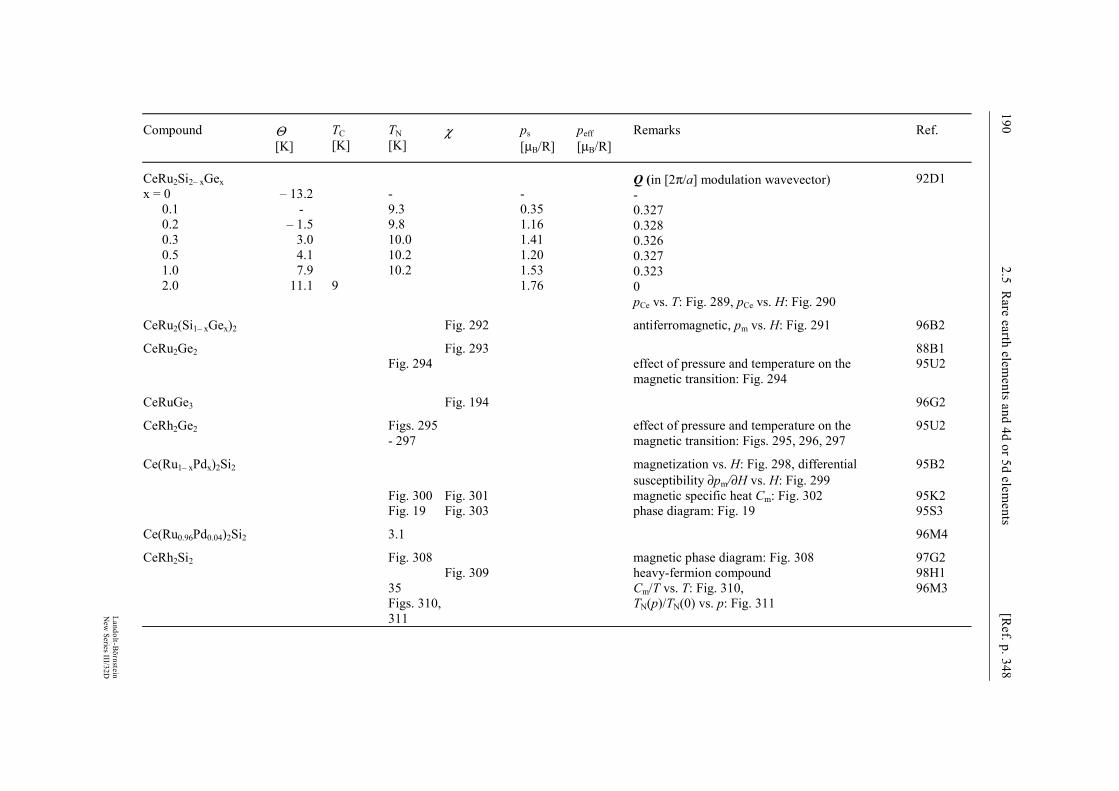
190 2.5 R
are earth elements and 4d or 5d elem
ents [R
ef. p. 348
Landolt-B
örnstein
New
Series III/32D
Compound Θ [K]
TC [K]
TN [K]
χ ps [µB/R]
peff [µB/R]
Remarks Ref.
CeRu2Si2– xGex x = 0 0.1 0.2 0.3 0.5 1.0 2.0
– 13.2
- – 1.5
3.0 4.1 7.9
11.1
9
- 9.3 9.8 10.0 10.2 10.2
- 0.35 1.16 1.41 1.20 1.53 1.76
Q (in [2π/a] modulation wavevector) - 0.327 0.328 0.326 0.327 0.323 0 pCe vs. T: Fig. 289, pCe vs. H: Fig. 290
92D1
CeRu2(Si1– xGex)2 Fig. 292 antiferromagnetic, pm vs. H: Fig. 291 96B2
CeRu2Ge2 Fig. 293 88B1 Fig. 294 effect of pressure and temperature on the
magnetic transition: Fig. 294 95U2
CeRuGe3 Fig. 194 96G2
CeRh2Ge2 Figs. 295 - 297
effect of pressure and temperature on the magnetic transition: Figs. 295, 296, 297
95U2
Ce(Ru1– xPdx)2Si2 magnetization vs. H: Fig. 298, differential susceptibility ∂pm/∂H vs. H: Fig. 299
95B2
Fig. 300 Fig. 301 magnetic specific heat Cm: Fig. 302 95K2 Fig. 19 Fig. 303 phase diagram: Fig. 19 95S3
Ce(Ru0.96Pd0.04)2Si2 3.1 96M4
CeRh2Si2 Fig. 308 magnetic phase diagram: Fig. 308 97G2 Fig. 309 heavy-fermion compound 98H1 35
Figs. 310, 311
Cm/T vs. T: Fig. 310, TN(p)/TN(0) vs. p: Fig. 311
96M3
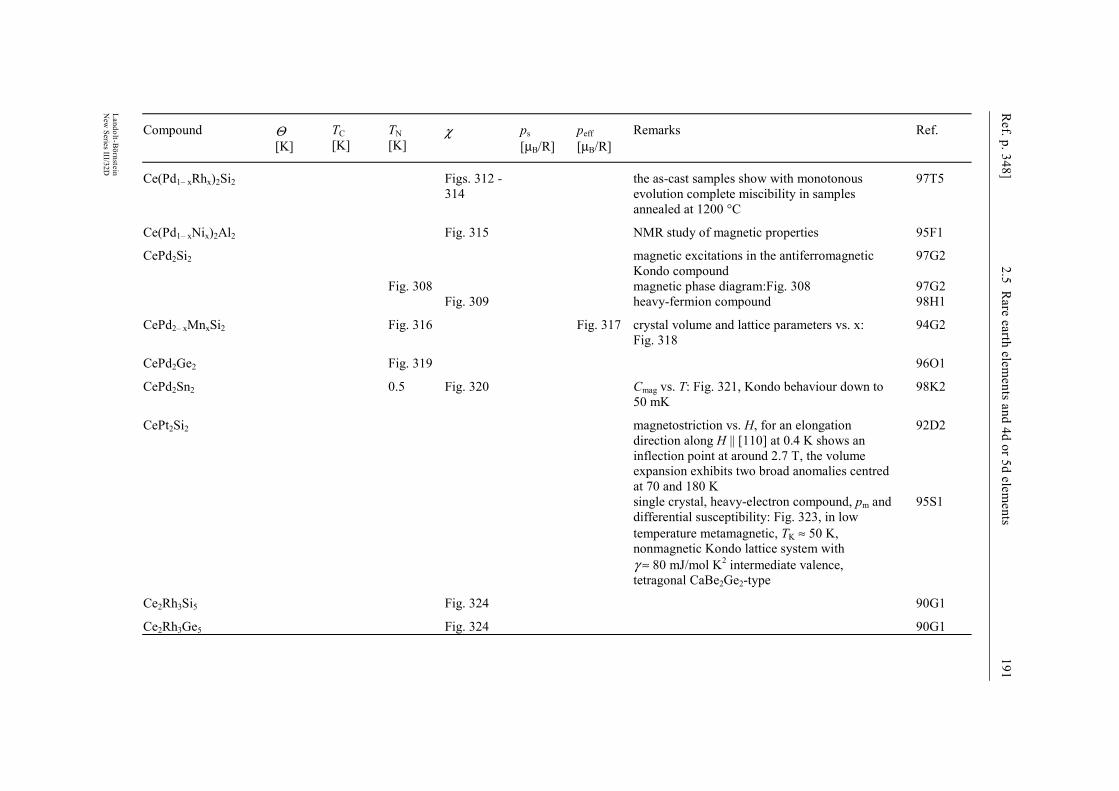
Ref. p. 348]
2.5 Rare earth elem
ents and 4d or 5d elements
191
Landolt-Börnstein
New
Series III/32D
Compound Θ [K]
TC [K]
TN [K]
χ ps [µB/R]
peff [µB/R]
Remarks Ref.
Ce(Pd1– xRhx)2Si2 Figs. 312 - 314
the as-cast samples show with monotonous evolution complete miscibility in samples annealed at 1200 °C
97T5
Ce(Pd1– xNix)2Al2 Fig. 315 NMR study of magnetic properties 95F1
CePd2Si2 magnetic excitations in the antiferromagnetic Kondo compound
97G2
Fig. 308 magnetic phase diagram:Fig. 308 97G2 Fig. 309 heavy-fermion compound 98H1
CePd2– xMnxSi2 Fig. 316 Fig. 317 crystal volume and lattice parameters vs. x: Fig. 318
94G2
CePd2Ge2 Fig. 319 96O1
CePd2Sn2 0.5 Fig. 320 Cmag vs. T: Fig. 321, Kondo behaviour down to 50 mK
98K2
CePt2Si2 magnetostriction vs. H, for an elongation direction along H || [110] at 0.4 K shows an inflection point at around 2.7 T, the volume expansion exhibits two broad anomalies centred at 70 and 180 K
92D2
single crystal, heavy-electron compound, pm and differential susceptibility: Fig. 323, in low temperature metamagnetic, TK ≈ 50 K, nonmagnetic Kondo lattice system with γ ≈ 80 mJ/mol K2 intermediate valence, tetragonal CaBe2Ge2-type
95S1
Ce2Rh3Si5 Fig. 324 90G1
Ce2Rh3Ge5 Fig. 324 90G1
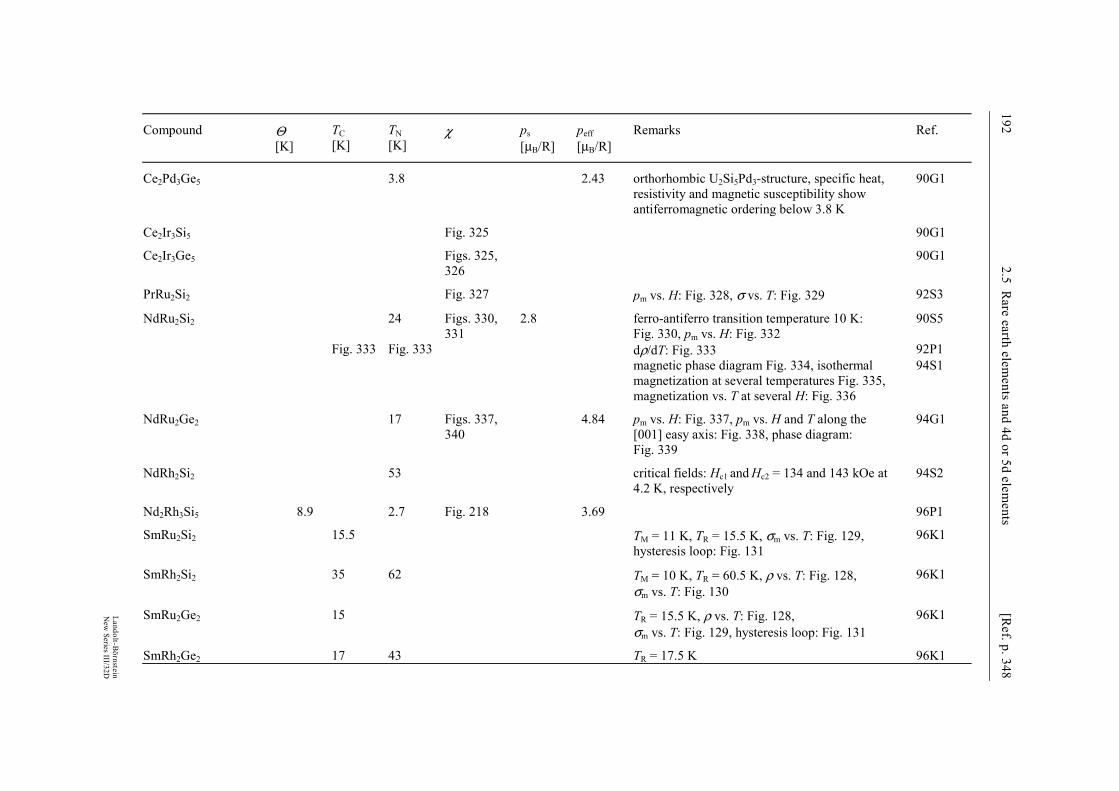
192 2.5 R
are earth elements and 4d or 5d elem
ents [R
ef. p. 348
Landolt-B
örnstein
New
Series III/32D
Compound Θ [K]
TC [K]
TN [K]
χ ps [µB/R]
peff [µB/R]
Remarks Ref.
Ce2Pd3Ge5 3.8 2.43 orthorhombic U2Si5Pd3-structure, specific heat, resistivity and magnetic susceptibility show antiferromagnetic ordering below 3.8 K
90G1
Ce2Ir3Si5 Fig. 325 90G1
Ce2Ir3Ge5 Figs. 325, 326
90G1
PrRu2Si2 Fig. 327 pm vs. H: Fig. 328, σ vs. T: Fig. 329 92S3
NdRu2Si2 24 Figs. 330, 331
2.8 ferro-antiferro transition temperature 10 K: Fig. 330, pm vs. H: Fig. 332
90S5
Fig. 333 Fig. 333 dρ/dT: Fig. 333 92P1 magnetic phase diagram Fig. 334, isothermal
magnetization at several temperatures Fig. 335, magnetization vs. T at several H: Fig. 336
94S1
NdRu2Ge2 17 Figs. 337, 340
4.84 pm vs. H: Fig. 337, pm vs. H and T along the [001] easy axis: Fig. 338, phase diagram: Fig. 339
94G1
NdRh2Si2 53 critical fields: Hc1 and Hc2 = 134 and 143 kOe at 4.2 K, respectively
94S2
Nd2Rh3Si5 8.9 2.7 Fig. 218 3.69 96P1
SmRu2Si2 15.5 TM = 11 K, TR = 15.5 K, σm vs. T: Fig. 129, hysteresis loop: Fig. 131
96K1
SmRh2Si2 35 62 TM = 10 K, TR = 60.5 K, ρ vs. T: Fig. 128, σm vs. T: Fig. 130
96K1
SmRu2Ge2 15 TR = 15.5 K, ρ vs. T: Fig. 128, σm vs. T: Fig. 129, hysteresis loop: Fig. 131
96K1
SmRh2Ge2 17 43 TR = 17.5 K 96K1
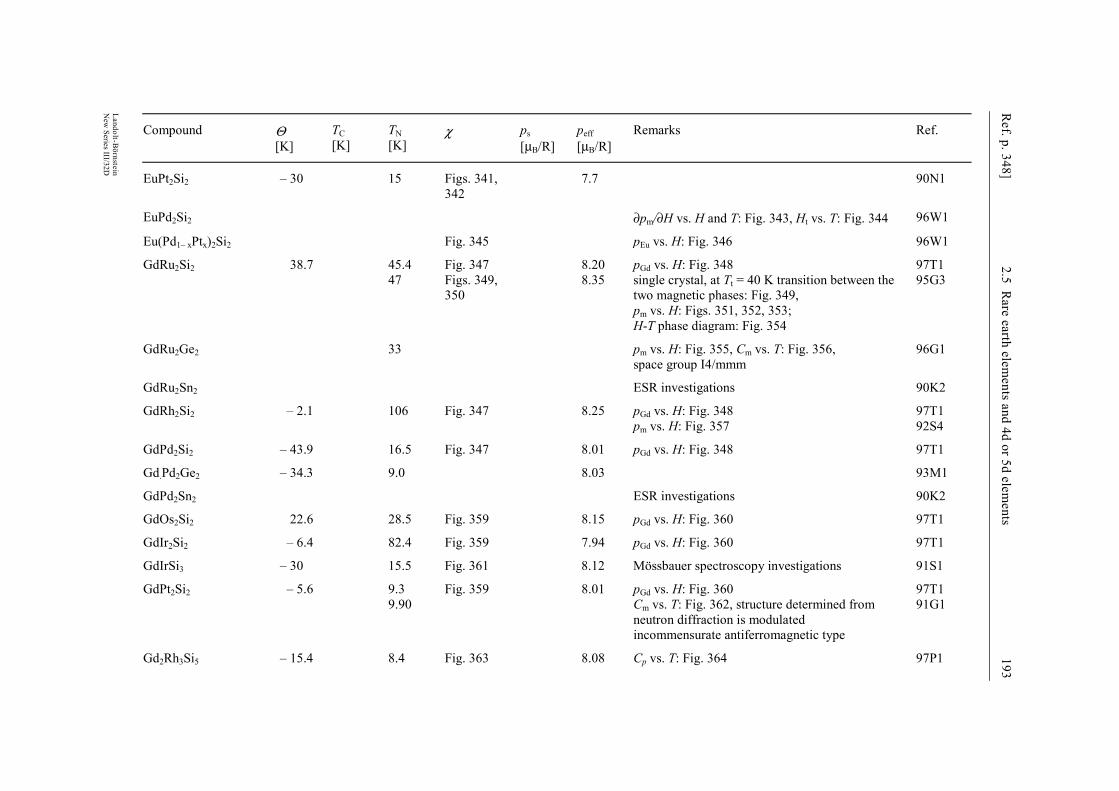
Ref. p. 348]
2.5 Rare earth elem
ents and 4d or 5d elements
193
Landolt-Börnstein
New
Series III/32D
Compound Θ [K]
TC [K]
TN [K]
χ ps [µB/R]
peff [µB/R]
Remarks Ref.
EuPt2Si2 – 30 15 Figs. 341, 342
7.7 90N1
EuPd2Si2 ∂pm/∂H vs. H and T: Fig. 343, Ht vs. T: Fig. 344 96W1
Eu(Pd1– xPtx)2Si2 Fig. 345 pEu vs. H: Fig. 346 96W1
GdRu2Si2 38.7 45.4 Fig. 347 8.20 pGd vs. H: Fig. 348 97T1 47 Figs. 349,
350 8.35 single crystal, at Tt = 40 K transition between the
two magnetic phases: Fig. 349, pm vs. H: Figs. 351, 352, 353; H-T phase diagram: Fig. 354
95G3
GdRu2Ge2 33 pm vs. H: Fig. 355, Cm vs. T: Fig. 356, space group I4/mmm
96G1
GdRu2Sn2 ESR investigations 90K2
GdRh2Si2 – 2.1 106 Fig. 347 8.25 pGd vs. H: Fig. 348 97T1 pm vs. H: Fig. 357 92S4
GdPd2Si2 – 43.9 16.5 Fig. 347 8.01 pGd vs. H: Fig. 348 97T1
Gd.Pd2Ge2 – 34.3 9.0 8.03 93M1
GdPd2Sn2 ESR investigations 90K2
GdOs2Si2 22.6 28.5 Fig. 359 8.15 pGd vs. H: Fig. 360 97T1
GdIr2Si2 – 6.4 82.4 Fig. 359 7.94 pGd vs. H: Fig. 360 97T1
GdIrSi3 – 30 15.5 Fig. 361 8.12 Mössbauer spectroscopy investigations 91S1
GdPt2Si2 – 5.6 9.3 Fig. 359 8.01 pGd vs. H: Fig. 360 97T1 9.90 Cm vs. T: Fig. 362, structure determined from
neutron diffraction is modulated incommensurate antiferromagnetic type
91G1
Gd2Rh3Si5 – 15.4 8.4 Fig. 363 8.08 Cp vs. T: Fig. 364 97P1
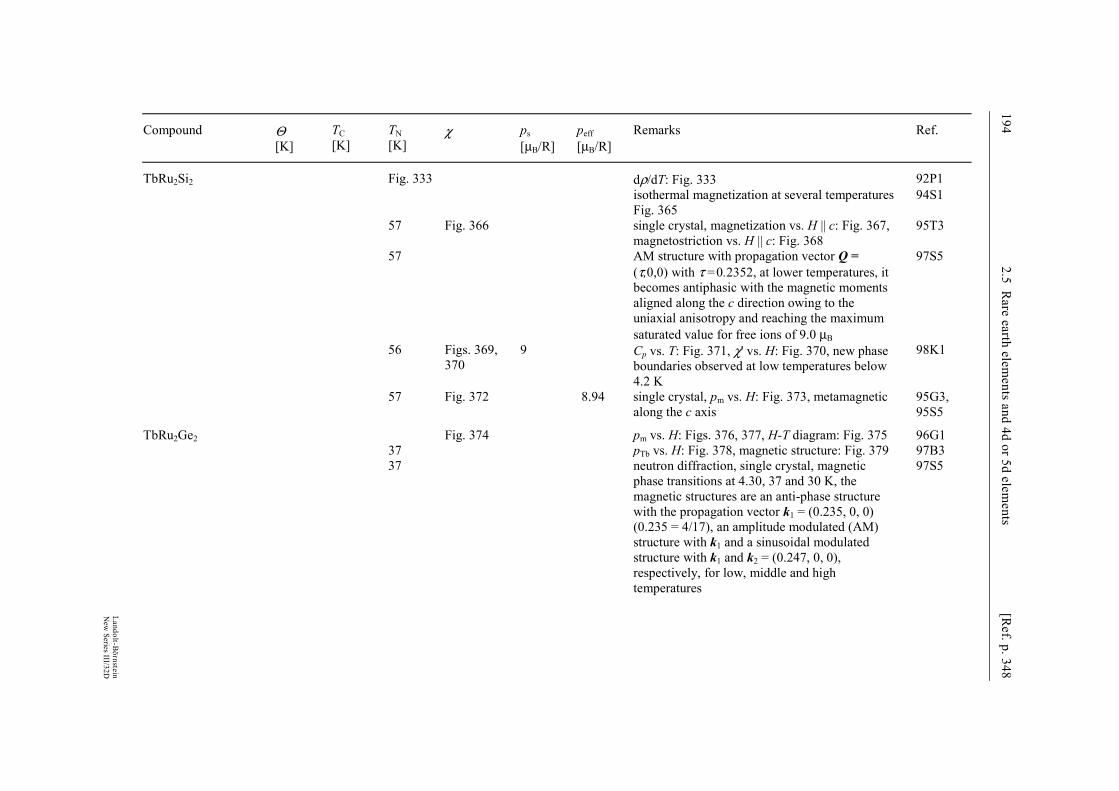
194 2.5 R
are earth elements and 4d or 5d elem
ents [R
ef. p. 348
Landolt-B
örnstein
New
Series III/32D
Compound Θ [K]
TC [K]
TN [K]
χ ps [µB/R]
peff [µB/R]
Remarks Ref.
TbRu2Si2 Fig. 333 dρ/dT: Fig. 333 92P1 isothermal magnetization at several temperatures
Fig. 365 94S1
57 Fig. 366 single crystal, magnetization vs. H || c: Fig. 367, magnetostriction vs. H || c: Fig. 368
95T3
57 AM structure with propagation vector Q = (τ,0,0) with τ =0.2352, at lower temperatures, it becomes antiphasic with the magnetic moments aligned along the c direction owing to the uniaxial anisotropy and reaching the maximum saturated value for free ions of 9.0 µB
97S5
56 Figs. 369, 370
9 Cp vs. T: Fig. 371, χ' vs. H: Fig. 370, new phase boundaries observed at low temperatures below 4.2 K
98K1
57 Fig. 372 8.94 single crystal, pm vs. H: Fig. 373, metamagnetic along the c axis
95G3, 95S5
TbRu2Ge2 Fig. 374 pm vs. H: Figs. 376, 377, H-T diagram: Fig. 375 96G1 37 pTb vs. H: Fig. 378, magnetic structure: Fig. 379 97B3 37 neutron diffraction, single crystal, magnetic
phase transitions at 4.30, 37 and 30 K, the magnetic structures are an anti-phase structure with the propagation vector k1 = (0.235, 0, 0) (0.235 = 4/17), an amplitude modulated (AM) structure with k1 and a sinusoidal modulated structure with k1 and k2 = (0.247, 0, 0), respectively, for low, middle and high temperatures
97S5

Ref. p. 348]
2.5 Rare earth elem
ents and 4d or 5d elements
195
Landolt-Börnstein
New
Series III/32D
Compound Θ [K]
TC [K]
TN [K]
χ ps [µB/R]
peff [µB/R]
Remarks Ref.
TbRh2 – xRuxSi2 pm vs. T: Fig. 380, phase diagram: Figs. 381, 382 93I1 x = 0.25 59 8.5 0.5 7.5 0.6 44.5 8.0 pm from neutron diffraction 8.2 µB 0.7 38 7.2 pm from neutron diffraction 6.0 µB 0.8 36 6.3 pm vs. H: Fig. 383 1.0 12 6.9 pm from neutron diffraction 5.9 µB 1.25 23 8.2 pm from neutron diffraction 8.75 µB 1.5 40 8.5 pm from neutron diffraction 8.65 µB 1.75 47 8.1 pm vs. H: Fig. 384, dpm/dH vs. H: Fig. 385
TbRh2Si2 pm vs. H: Fig. 358 92S4 critical field vs. T: Fig. 386, pm vs. H at different
T: Fig. 388, dpm/dH vs. H: Fig. 387 93I1
94 critical fields: Hc1 and Hc2 = 80 and 190 kOe at 4.2 K, respectively
94S2
TbRh2Ge2 Fig. 375 96G1
TbRu2– xPdxSi2 Fig. 389 Fig. 390 magnetic phase diagram: Fig. 389, pm vs. H: Fig. 391, lattice parameters: Fig. 392
96I3
TbRh2– xPdxSi2 Fig. 389 Fig. 393 pm vs. H: Fig. 394, magnetic phase diagram: Fig. 389, lattice parameters: Fig. 392
96I3
TbRhSi3 – 8 9 Fig. 395 9.4 pm vs. H: Fig. 396, magnetic structure: Fig. 397 96J2
TbPd2Si2 16 neutron diffraction magnetic structure, orders below TN: Fig. 398, sine- modulated structure with k = (0, 0.4057, 0.1671): Fig. 399, pTb
3+ = 9.0 µB at 1.5 K || to the c axis, pTb vs. T: Fig. 400
97B5
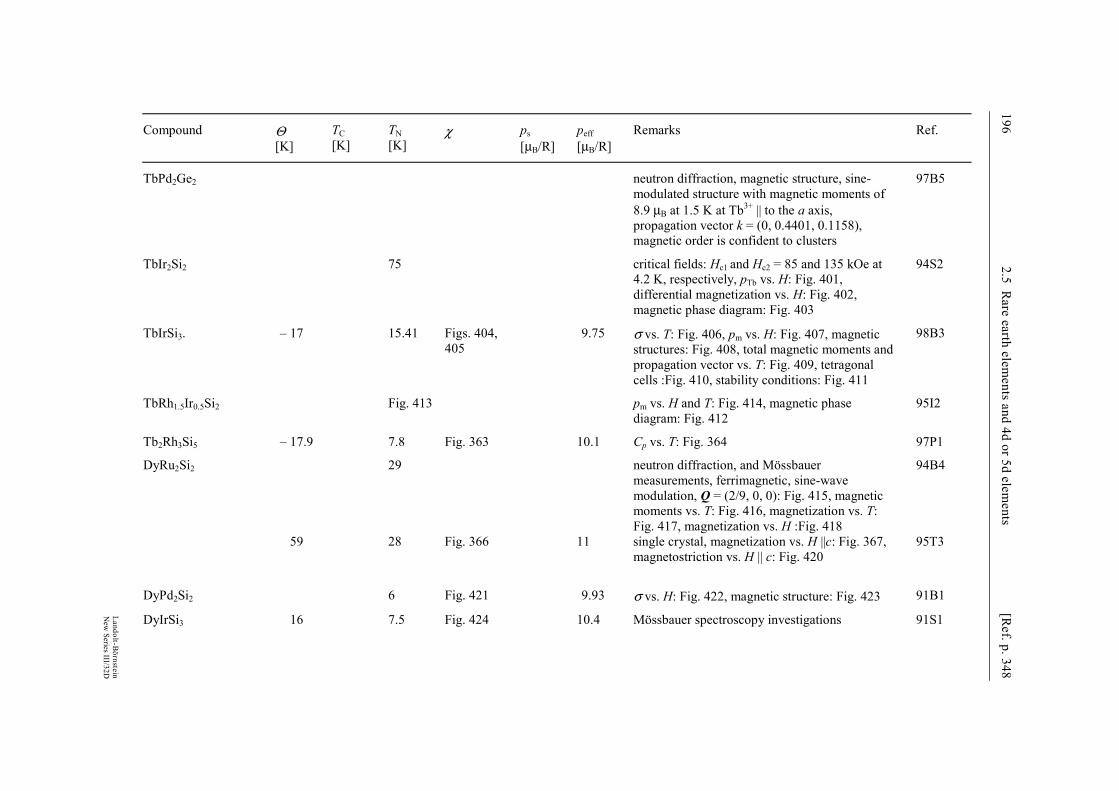
196 2.5 R
are earth elements and 4d or 5d elem
ents [R
ef. p. 348
Landolt-B
örnstein
New
Series III/32D
Compound Θ [K]
TC [K]
TN [K]
χ ps [µB/R]
peff [µB/R]
Remarks Ref.
TbPd2Ge2 neutron diffraction, magnetic structure, sine-modulated structure with magnetic moments of 8.9 µB at 1.5 K at Tb3+ || to the a axis, propagation vector k = (0, 0.4401, 0.1158), magnetic order is confident to clusters
97B5
TbIr2Si2 75 critical fields: Hc1 and Hc2 = 85 and 135 kOe at 4.2 K, respectively, pTb vs. H: Fig. 401, differential magnetization vs. H: Fig. 402, magnetic phase diagram: Fig. 403
94S2
TbIrSi3. – 17 15.41 Figs. 404, 405
9.75 σ vs. T: Fig. 406, pm vs. H: Fig. 407, magnetic structures: Fig. 408, total magnetic moments and propagation vector vs. T: Fig. 409, tetragonal cells :Fig. 410, stability conditions: Fig. 411
98B3
TbRh1.5Ir0.5Si2 Fig. 413 pm vs. H and T: Fig. 414, magnetic phase diagram: Fig. 412
95I2
Tb2Rh3Si5 – 17.9 7.8 Fig. 363 10.1 Cp vs. T: Fig. 364 97P1
DyRu2Si2 29 neutron diffraction, and Mössbauer measurements, ferrimagnetic, sine-wave modulation, Q = (2/9, 0, 0): Fig. 415, magnetic moments vs. T: Fig. 416, magnetization vs. T: Fig. 417, magnetization vs. H :Fig. 418
94B4
59 28 Fig. 366 11 single crystal, magnetization vs. H ||c: Fig. 367, magnetostriction vs. H || c: Fig. 420
95T3
DyPd2Si2 6 Fig. 421 9.93 σ vs. H: Fig. 422, magnetic structure: Fig. 423 91B1
DyIrSi3 16 7.5 Fig. 424 10.4 Mössbauer spectroscopy investigations 91S1
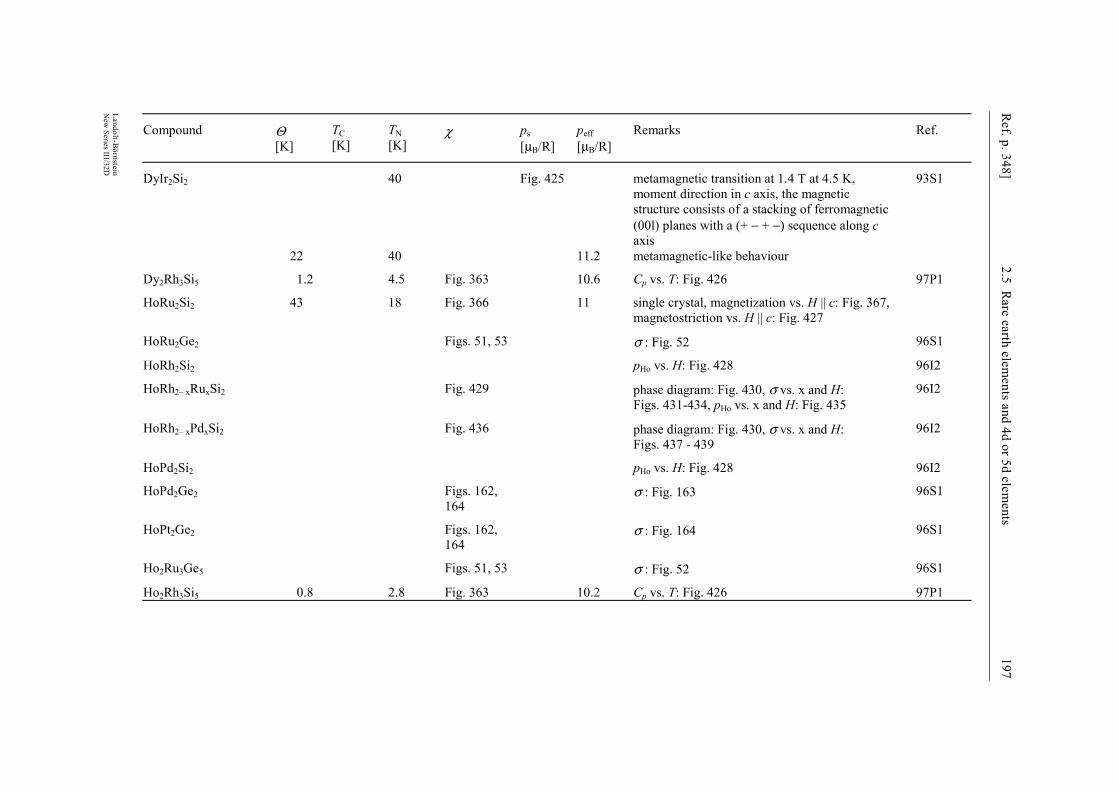
Ref. p. 348]
2.5 Rare earth elem
ents and 4d or 5d elements
197
Landolt-Börnstein
New
Series III/32D
Compound Θ [K]
TC [K]
TN [K]
χ ps [µB/R]
peff [µB/R]
Remarks Ref.
DyIr2Si2 40 Fig. 425 metamagnetic transition at 1.4 T at 4.5 K, moment direction in c axis, the magnetic structure consists of a stacking of ferromagnetic (00l) planes with a (+ − + −) sequence along c axis
93S1
22 40 11.2 metamagnetic-like behaviour
Dy2Rh3Si5 1.2 4.5 Fig. 363 10.6 Cp vs. T: Fig. 426 97P1
HoRu2Si2 43 18 Fig. 366 11 single crystal, magnetization vs. H || c: Fig. 367, magnetostriction vs. H || c: Fig. 427
HoRu2Ge2 Figs. 51, 53 σ : Fig. 52 96S1
HoRh2Si2 pHo vs. H: Fig. 428 96I2
HoRh2– xRuxSi2 Fig. 429 phase diagram: Fig. 430, σ vs. x and H: Figs. 431-434, pHo vs. x and H: Fig. 435
96I2
HoRh2– xPdxSi2 Fig. 436 phase diagram: Fig. 430, σ vs. x and H: Figs. 437 - 439
96I2
HoPd2Si2 pHo vs. H: Fig. 428 96I2
HoPd2Ge2 Figs. 162, 164
σ : Fig. 163 96S1
HoPt2Ge2 Figs. 162, 164
σ : Fig. 164 96S1
Ho2Ru3Ge5 Figs. 51, 53 σ : Fig. 52 96S1
Ho2Rh3Si5 0.8 2.8 Fig. 363 10.2 Cp vs. T: Fig. 426 97P1
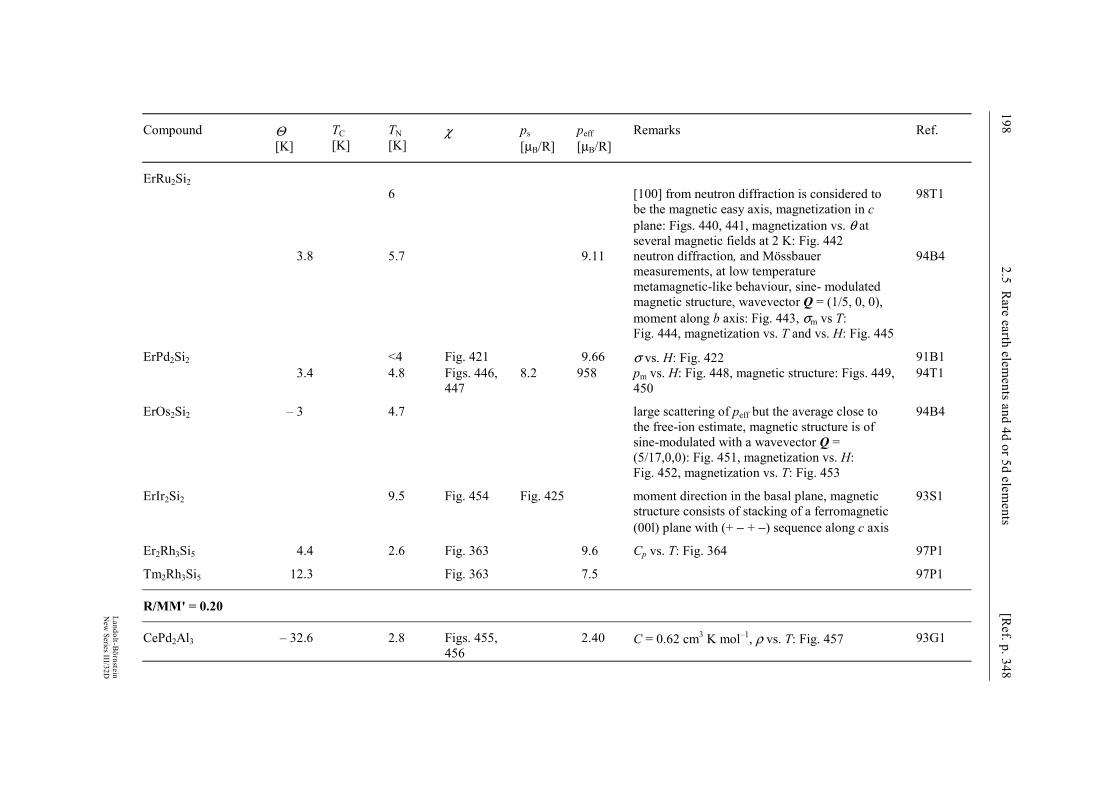
198 2.5 R
are earth elements and 4d or 5d elem
ents [R
ef. p. 348
Landolt-B
örnstein
New
Series III/32D
Compound Θ [K]
TC [K]
TN [K]
χ ps [µB/R]
peff [µB/R]
Remarks Ref.
ErRu2Si2 6 [100] from neutron diffraction is considered to
be the magnetic easy axis, magnetization in c plane: Figs. 440, 441, magnetization vs. θ at several magnetic fields at 2 K: Fig. 442
98T1
3.8 5.7 9.11 neutron diffraction, and Mössbauer measurements, at low temperature metamagnetic-like behaviour, sine- modulated magnetic structure, wavevector Q = (1/5, 0, 0), moment along b axis: Fig. 443, σm vs T: Fig. 444, magnetization vs. T and vs. H: Fig. 445
94B4
ErPd2Si2 <4 Fig. 421 9.66 σ vs. H: Fig. 422 91B1 3.4 4.8 Figs. 446,
447 8.2 958 pm vs. H: Fig. 448, magnetic structure: Figs. 449,
450 94T1
ErOs2Si2 – 3 4.7 large scattering of peff but the average close to the free-ion estimate, magnetic structure is of sine-modulated with a wavevector Q = (5/17,0,0): Fig. 451, magnetization vs. H: Fig. 452, magnetization vs. T: Fig. 453
94B4
ErIr2Si2 9.5 Fig. 454 Fig. 425 moment direction in the basal plane, magnetic structure consists of stacking of a ferromagnetic (00l) plane with (+ − + −) sequence along c axis
93S1
Er2Rh3Si5 4.4 2.6 Fig. 363 9.6 Cp vs. T: Fig. 364 97P1
Tm2Rh3Si5 12.3 Fig. 363 7.5 97P1
R/MM' = 0.20
CePd2Al3 – 32.6 2.8 Figs. 455, 456
2.40 C = 0.62 cm3 K mol–1, ρ vs. T: Fig. 457 93G1
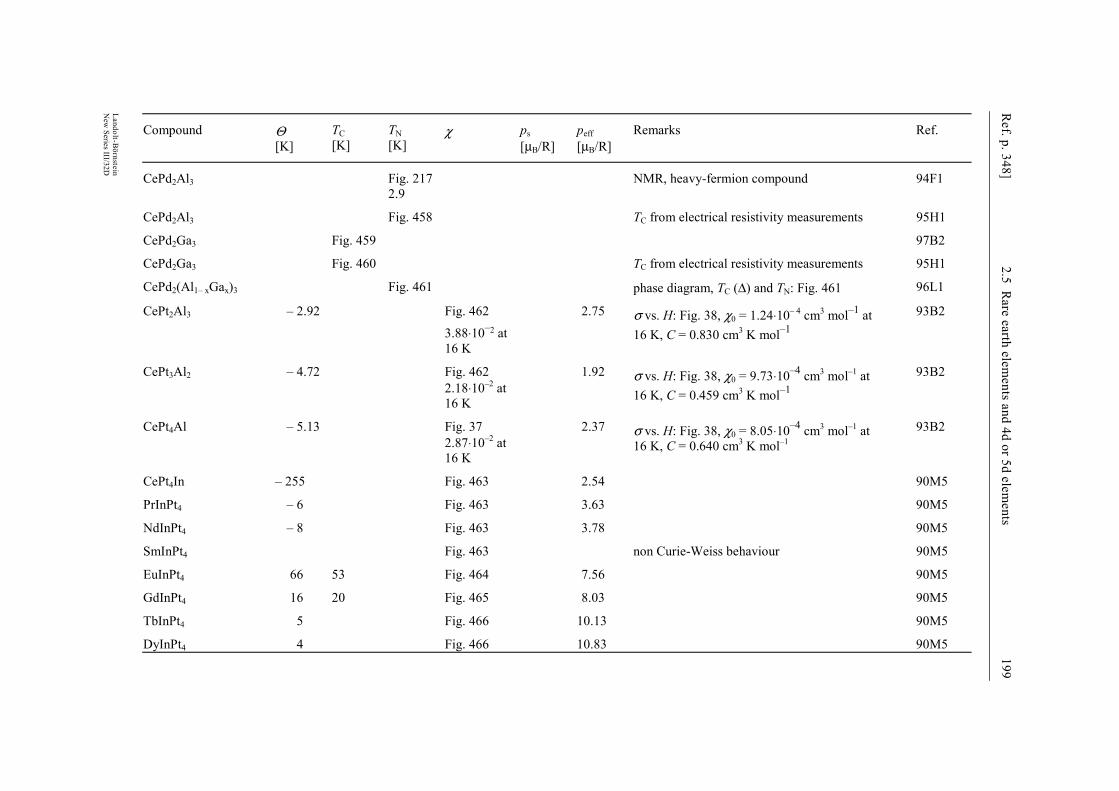
Ref. p. 348]
2.5 Rare earth elem
ents and 4d or 5d elements
199
Landolt-Börnstein
New
Series III/32D
Compound Θ [K]
TC [K]
TN [K]
χ ps [µB/R]
peff [µB/R]
Remarks Ref.
CePd2Al3 Fig. 217 2.9
NMR, heavy-fermion compound 94F1
CePd2Al3 Fig. 458 TC from electrical resistivity measurements 95H1
CePd2Ga3 Fig. 459 97B2
CePd2Ga3 Fig. 460 TC from electrical resistivity measurements 95H1
CePd2(Al1– xGax)3 Fig. 461 phase diagram, TC (∆) and TN: Fig. 461 96L1
CePt2Al3 – 2.92 Fig. 462
3.88⋅10–2 at 16 K
2.75 σ vs. H: Fig. 38, χ0 = 1.24⋅10– 4 cm3 mol–1 at 16 K, C = 0.830 cm3 K mol–1
93B2
CePt3Al2 – 4.72 Fig. 462 2.18⋅10–2 at 16 K
1.92 σ vs. H: Fig. 38, χ0 = 9.73⋅10–4 cm3 mol–1 at 16 K, C = 0.459 cm3 K mol–1
93B2
CePt4Al – 5.13 Fig. 37 2.87⋅10–2 at 16 K
2.37 σ vs. H: Fig. 38, χ0 = 8.05⋅10–4 cm3 mol–1 at 16 K, C = 0.640 cm3 K mol–1
93B2
CePt4In – 255 Fig. 463 2.54 90M5
PrInPt4 – 6 Fig. 463 3.63 90M5
NdInPt4 – 8 Fig. 463 3.78 90M5
SmInPt4 Fig. 463 non Curie-Weiss behaviour 90M5
EuInPt4 66 53 Fig. 464 7.56 90M5
GdInPt4 16 20 Fig. 465 8.03 90M5
TbInPt4 5 Fig. 466 10.13 90M5
DyInPt4 4 Fig. 466 10.83 90M5

200 2.5 R
are earth elements and 4d or 5d elem
ents [R
ef. p. 348
Landolt-B
örnstein
New
Series III/32D
Compound Θ [K]
TC [K]
TN [K]
χ ps [µB/R]
peff [µB/R]
Remarks Ref.
TmInPt4 0 Fig. 466 7.85 90M5
R/MM' = 0.1818
Sm4Si9Ir13 1.47 space group Pnmm 95V1
Gd4Si9Ir13 0.19 4.5? Figs. 467, 468
8.09 space group Pnmm 95V1
Tb4Si9Ir13 – 7.57 4.3 Figs. 469, 470
9.83 χm vs. H: Fig. 471, space group Pnmm 95V1
Dy4Si9Ir13 1.15 4.0 10.66 space group Pnmm 95V1
Ho4Si9Ir13 1.24 1.6 10.22 space group Pnmm 95V1
Er4Si9Ir13 1.40 2.2 9.64 space group Pnmm 95V1
Yb4Si9Ir13 – 6.63 0.5 4.09 space group Pnmm 95V1
R/MM' = 0.176
Ce3Ru4Ge13 Fig. 194 96G2
Ce3Pt23Ge11 0.5 2.51 σ vs. H and T: Fig. 472 98T2
Ce3Ir4Sn13 Figs. 473 - 475
2.45 heavy-fermion compound, three-step phase transitions at 0.6, 2.10 and 2.18 K, the phase between 0.6 and 2.1 K is paramagnetic-like and the phase below 0.6 is antiferromagnetic-like suggested Figs. 473, 474, magnetic phase diagram Fig. 475
94T2
Eu3Rh4Sn13 12 8.15 susceptibility above TN showed Curie Weiss behaviour, 151Eu and 119Sn Mössbauer effect over the temperature range 4.2 K to 300 K have been investigated
94T2
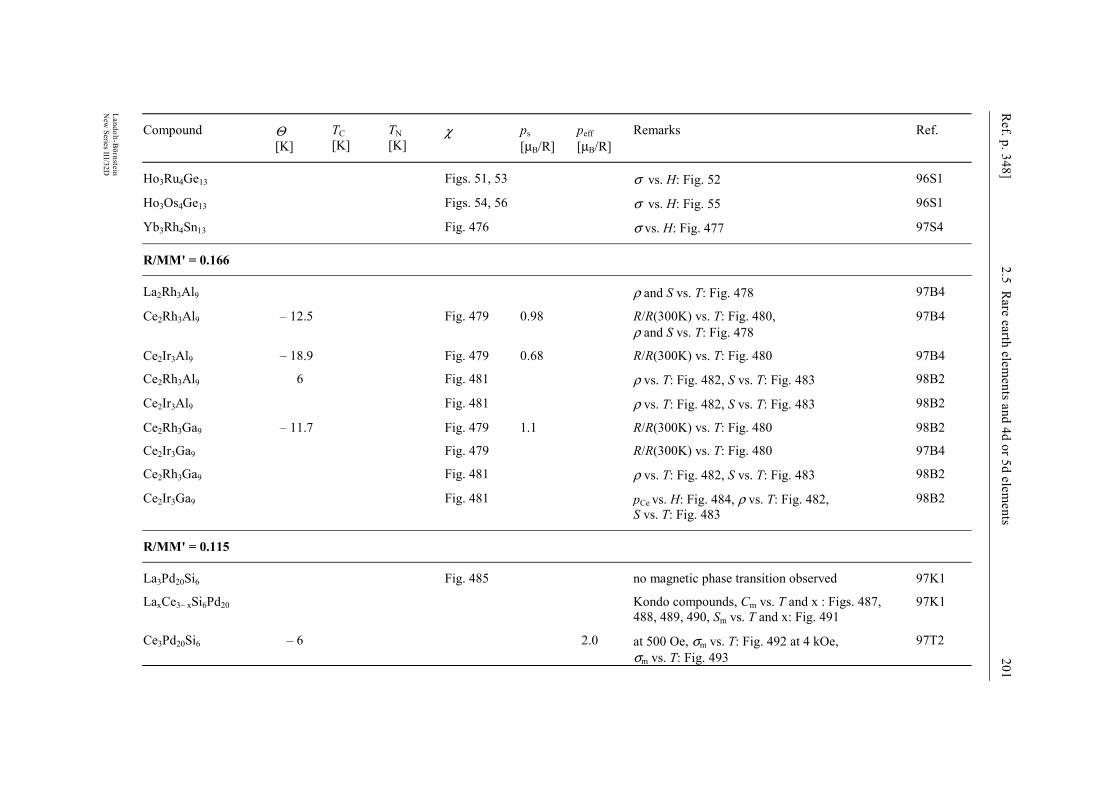
Ref. p. 348]
2.5 Rare earth elem
ents and 4d or 5d elements
201
Landolt-Börnstein
New
Series III/32D
Compound Θ [K]
TC [K]
TN [K]
χ ps [µB/R]
peff [µB/R]
Remarks Ref.
Ho3Ru4Ge13 Figs. 51, 53 σ vs. H: Fig. 52 96S1
Ho3Os4Ge13 Figs. 54, 56 σ vs. H: Fig. 55 96S1
Yb3Rh4Sn13 Fig. 476 σ vs. H: Fig. 477 97S4
R/MM' = 0.166
La2Rh3Al9 ρ and S vs. T: Fig. 478 97B4
Ce2Rh3Al9 – 12.5 Fig. 479 0.98 R/R(300K) vs. T: Fig. 480, ρ and S vs. T: Fig. 478
97B4
Ce2Ir3Al9 – 18.9 Fig. 479 0.68 R/R(300K) vs. T: Fig. 480 97B4
Ce2Rh3Al9 6 Fig. 481 ρ vs. T: Fig. 482, S vs. T: Fig. 483 98B2
Ce2Ir3Al9 Fig. 481 ρ vs. T: Fig. 482, S vs. T: Fig. 483 98B2
Ce2Rh3Ga9 – 11.7 Fig. 479 1.1 R/R(300K) vs. T: Fig. 480 98B2
Ce2Ir3Ga9 Fig. 479 R/R(300K) vs. T: Fig. 480 97B4
Ce2Rh3Ga9 Fig. 481 ρ vs. T: Fig. 482, S vs. T: Fig. 483 98B2
Ce2Ir3Ga9 Fig. 481 pCe vs. H: Fig. 484, ρ vs. T: Fig. 482, S vs. T: Fig. 483
98B2
R/MM' = 0.115
La3Pd20Si6 Fig. 485 no magnetic phase transition observed 97K1
LaxCe3– xSi6Pd20 Kondo compounds, Cm vs. T and x : Figs. 487, 488, 489, 490, Sm vs. T and x: Fig. 491
97K1
Ce3Pd20Si6 – 6 2.0 at 500 Oe, σm vs. T: Fig. 492 at 4 kOe, σm vs. T: Fig. 493
97T2
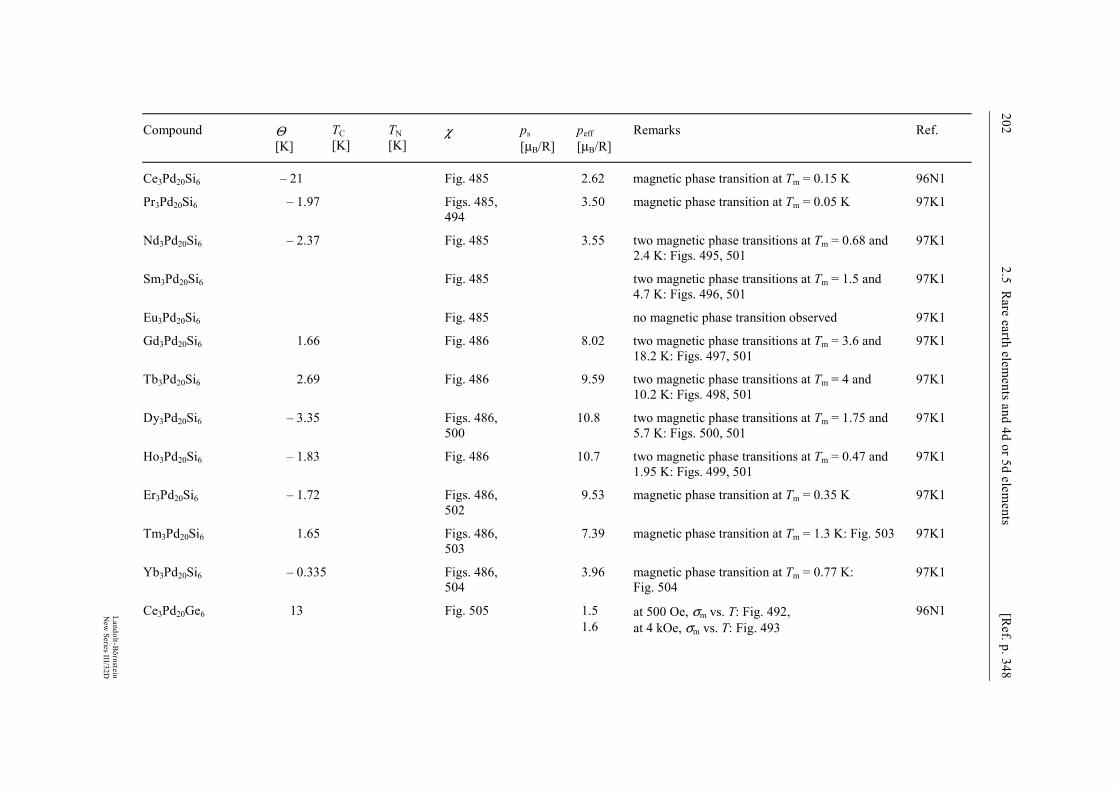
202 2.5 R
are earth elements and 4d or 5d elem
ents [R
ef. p. 348
Landolt-B
örnstein
New
Series III/32D
Compound Θ [K]
TC [K]
TN [K]
χ ps [µB/R]
peff [µB/R]
Remarks Ref.
Ce3Pd20Si6 – 21 Fig. 485 2.62 magnetic phase transition at Tm = 0.15 K 96N1
Pr3Pd20Si6 – 1.97 Figs. 485, 494
3.50 magnetic phase transition at Tm = 0.05 K 97K1
Nd3Pd20Si6 – 2.37 Fig. 485 3.55 two magnetic phase transitions at Tm = 0.68 and 2.4 K: Figs. 495, 501
97K1
Sm3Pd20Si6 Fig. 485 two magnetic phase transitions at Tm = 1.5 and 4.7 K: Figs. 496, 501
97K1
Eu3Pd20Si6 Fig. 485 no magnetic phase transition observed 97K1
Gd3Pd20Si6 1.66 Fig. 486 8.02 two magnetic phase transitions at Tm = 3.6 and 18.2 K: Figs. 497, 501
97K1
Tb3Pd20Si6 2.69 Fig. 486 9.59 two magnetic phase transitions at Tm = 4 and 10.2 K: Figs. 498, 501
97K1
Dy3Pd20Si6 – 3.35 Figs. 486, 500
10.8 two magnetic phase transitions at Tm = 1.75 and 5.7 K: Figs. 500, 501
97K1
Ho3Pd20Si6 – 1.83 Fig. 486 10.7 two magnetic phase transitions at Tm = 0.47 and 1.95 K: Figs. 499, 501
97K1
Er3Pd20Si6 – 1.72 Figs. 486, 502
9.53 magnetic phase transition at Tm = 0.35 K 97K1
Tm3Pd20Si6 1.65 Figs. 486, 503
7.39 magnetic phase transition at Tm = 1.3 K: Fig. 503 97K1
Yb3Pd20Si6 – 0.335 Figs. 486, 504
3.96 magnetic phase transition at Tm = 0.77 K: Fig. 504
97K1
Ce3Pd20Ge6 13 Fig. 505 1.5 at 500 Oe, σm vs. T: Fig. 492, 96N1 1.6 at 4 kOe, σm vs. T: Fig. 493
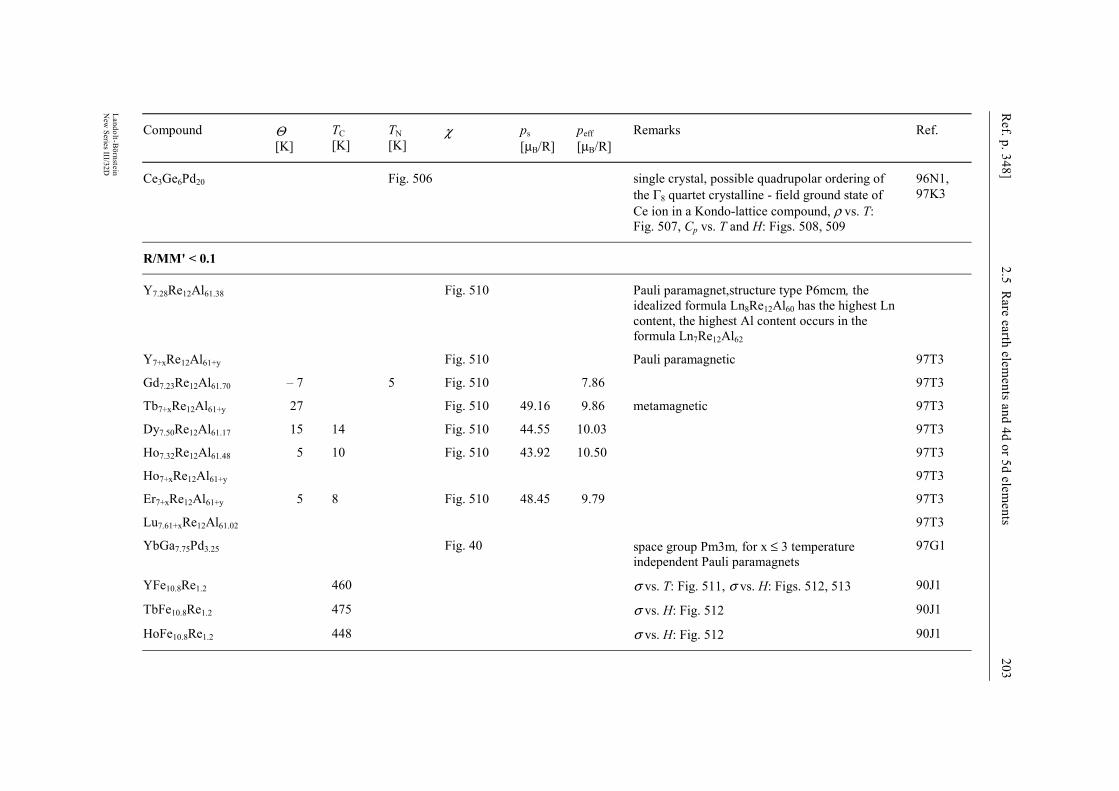
Ref. p. 348]
2.5 Rare earth elem
ents and 4d or 5d elements
203
Landolt-Börnstein
New
Series III/32D
Compound Θ [K]
TC [K]
TN [K]
χ ps [µB/R]
peff [µB/R]
Remarks Ref.
Ce3Ge6Pd20 Fig. 506 single crystal, possible quadrupolar ordering of the Γ8 quartet crystalline - field ground state of Ce ion in a Kondo-lattice compound, ρ vs. T: Fig. 507, Cp vs. T and H: Figs. 508, 509
96N1, 97K3
R/MM' < 0.1
Y7.28Re12Al61.38 Fig. 510 Pauli paramagnet,structure type P6mcm, the idealized formula Ln8Re12Al60 has the highest Ln content, the highest Al content occurs in the formula Ln7Re12Al62
Y7+xRe12Al61+y Fig. 510 Pauli paramagnetic 97T3
Gd7.23Re12Al61.70 – 7 5 Fig. 510 7.86 97T3
Tb7+xRe12Al61+y 27 Fig. 510 49.16 9.86 metamagnetic 97T3
Dy7.50Re12Al61.17 15 14 Fig. 510 44.55 10.03 97T3
Ho7.32Re12Al61.48 5 10 Fig. 510 43.92 10.50 97T3
Ho7+xRe12Al61+y 97T3
Er7+xRe12Al61+y 5 8 Fig. 510 48.45 9.79 97T3
Lu7.61+xRe12Al61.02 97T3
YbGa7.75Pd3.25 Fig. 40 space group Pm3m, for x ≤ 3 temperature independent Pauli paramagnets
97G1
YFe10.8Re1.2 460 σ vs. T: Fig. 511, σ vs. H: Figs. 512, 513 90J1
TbFe10.8Re1.2 475 σ vs. H: Fig. 512 90J1
HoFe10.8Re1.2 448 σ vs. H: Fig. 512 90J1
References
88A1 Amato, A., Jaccard, D., Sierro, J., Lapierre, F., Haen, P., Lejay, P.: J. Magn. Magn. Mater. 76-77(1988) 263
88B1 Bohm, A., Caspary, R., Habel, U., Pawlak, L., Zuber, A., Steglich, F.: J. Magn. Magn. Mater. 76-77 (1988) 150
88D1 Djerbi, R., Haen, P., Lapierre, F., Lehmann, P., Kappler, jr., P.: J. Magn. Magn. Mater. 76-77 (1988) 260
88D2 Djerbi, R., Haen, P., Lapierre, F., Mignot, J.-M.: J. Magn. Magn. Mater. 76-77 (1988) 265 88D3 Djerbi, R., Haen, P., Lapierre, F., Mignot, J.-M., Fert, A., Hamzic, A., Kappler, J.P.: J. Magn.
Magn. Mater. 76-77 (1988) 265 88H1 Haen, P., Lapierre, F., Kappler, J.P., Lejay, P., Flouquet, J., Meyer, A.: J. Magn. Magn. Mater.
76-77 (1988) 143 88K1 Kasaya, M., Tani, T., Iga, F., Kasuya, T.: J. Magn. Magn. Mater. 76-77 (1988) 278 88L1 Lacerda, A., de Visser, A., Puech, L., Lejay, P., Haen, P.: J. Magn. Magn. Mater. 76-77 (1988)
138 88M1 Mignot, J.-M., Flouquet, J., Haen, P., Lapierre, L., Puech, L., Voiron, J.: J. Magn. Magn.
Mater. 76- 77 (1988) 97 88Q1 Quezel, S., Burllet, P., Jacoud, J.L., Regnault, L.P., Rossat-Mignod, J., Vettier, C., Lejay, P.,
Flouquet, J.: J. Magn. Magn. Mater.: 76-77 (1988) 403 90B1 Bruls, G., Weber, D., Hampel, G., Wolf, B., Kouroudis, I., Luthi, B.: Physica B 163 (1990) 41 90C1 Celemczuk, R., Bonjour, E., Rossat-Mignod, J., Chavalier, B.: J. Magn. Magn. Mater. 90-91
(1990) 477 90F1 Fujii, H., Nagasawa, M., Kawanaka, H., Inoue, T., Takabatake, T.: Physica B 165-166 (1990)
435 90F2 Fukuhara. T., Sakamoto, I., Sato, H.: Physica B 165-166 (1990) 443 90G1 Godart, C., Gupta, L., C., Tomy, C., V., Patil, S., Nagarajan, R., Beaurepaire, E.: Physica B 163
(1990) 163 90H1 Haen, P., Voiron, J., Lapierre, F., Flouquet, J., Lejay, P.: Physica B 163 (1990) 519 90J1 Jurczyk, M.: J. Magn. Magn. Mater. 89 (1990) L5 90K1 Kohler, R., Strobel, B., Kammerer, C., Grauel, A., Gottwick, U., Goring, E., Hohr, A., Sparn,
G., Geibel, C., Horn, S.: J. Magn. Magn. Mater. 90-91 (1990) 428 90K2 Kaczmarska. K., Kwapulinska, E.: J. Magn. Magn. Mater. 89 (1990) L267 90K3 Kotsanidis, P., A., Yakinthos, J., K., Gamari-Seale, E.: J. Magn. Magn. Mater. 87 (1990) 199 90M1 Malik, S.K., Adroja, D.T., Pdadalia, B.D., Vijayaraghavan, R.: Physica B 163 (1990) 89 90M3 Mignot, J.-L., Jacoud, J.-L., Regnault, L.-P., Rossat-Mignod, J., Lejay, P., Boutrouille, Ph.,
Hennion, B., Petitgrand, D.: Physica B 163 (1990) 611 90M5 Malik, S.K., Vijayaraghan, R., Adroja, D.T., Padalia, B.D., Edelstein, A.S.: J. Magn. Magn.
Mater. 92 (1990) 80 90N1 Nagarajan, R., Sampathkumaran, E., Vijayaraghavan, R.: Physica B 163 (1990) 591 90P1 Paulsen, C., Lacerda, A., Tholence, J.L., Flouquet, J.: Physica B 165-166 (1990) 433 90P2 Paulsen, C., Lacerda, A., de Visser, A., Bakker, K., Puech, L., Tholence, J.L.: J. Magn. Magn.
Mater. 90-91 (1990) 408 90R1 Regnault, L.P., Jacoud, J.L., Rossat-Mignod, J., Vettier, C., Lejay, P., Flouquet, J.: J. Magn.
Magn. Mater. 90-91 (1990) 398 90S1 Sakurai, J., Yamaguchi, Y., Nishigori, S., Suzuki, T., Fujita, T.: J. Magn. Magn. Mater. 90-91
(1990) 422 90S2 Sakurai, J., Yamaguchi, Y., Mibu, K., Shinjo: J. Magn. Magn. Mater. 84 (1990) 157 90S3 Sampathkumaran, E.V., Nakazawa, Y., Ishikawa, Y., Vijayaraghavan, R.: Physica B 163
(1990) 365 90S4 Steeman, R.A., Endstra, T., Mentink, S.A.M., Friikkee, E., Menovsky, A.A., Nieuwenhuys,
G.J., Mydosh, J.A.: Physica B 163 (1990) 597 90S5 Schobinger-Papamantellos, P., de Mooij, D.B., Buschow, K.H.J.: J. Less-Common Met. 163
(1990) 319 91B1 Bazela, W., Leciejewicz, J., Szytula, A., Zygmunt, A.: J. Magn. Magn. Mater. 96 (1991) 114 91G1 Gignoux, D., Morin, M., Schmitt, D.: J. Magn. Magn. Mater. 102 (1991) 33 91K1 Kasaya, M., Tani, T., Suzuki, H., Ohoyama, K., Kohugi, M.: J. Phys. Soc. Jpn. 60 (1991) 254291S1 Sanchez, J.P., Tomala, K., Łątka, K.: J. Magn. Magn. Mater. 99 (1991) 95 92B1 Besnus, M.J., Essaihi, A., Fischer, G., Hamdaoui, N., Meyer, A.: J. Magn. Magn. Mater. 104-
107 (1992) 1387
92D1 Dakin, S., Rapson, G., Rainford, B.D.: J. Magn. Magn. Mater. 108 (1992) 117 92D2 de Visser, A., Wyder, U., Schmitt, D., Zerguine, M.: J. Magn. Magn. Mater. 108 (1992) 59 92G1 Geibel, C., Kammerer, C., Seidel, B., Bredl, C.D., Grauel, A., Steglich, F.: J. Magn. Magn.
Mater. 108 (1992) 207 92H1 Haen, P., Lapierre, F., Lejay, P., Voiron, J.: J. Magn. Magn. Mater. 116 (1992) 108 92J1 Jacobs, T.H., Buschow, K.H.J., Zhou, G.F., Liu, J.P., Li, X., de Boer, F.R.: J. Magn. Magn.
Mater. 104-107 (1992) 1275 92K2 Kotsanidis, P., Yakinthos, J.K., Semittelou, I., Roudaut, E.: J. Magn. Magn. Mater. 116 (1992)
95 92L1 Lapierre, F., Haen, P.: J. Magn. Magn. Mater. 108 (1992) 167 92P1 Pinto, R.P., Amado, M.M., Salgueiro Silva, M., Braga, M.E., Sousa, J.B., Chavalier, B.,
Etourneau, J.: J. Magn. Magn. Mater. 104-107 (1992) 1235 92R1 Roy, S.B., Coles, B.R.: J. Magn. Magn. Mater. 108 (1992) 43 92R2 Routsi, Ch.D., Yakinthos, J.K., Gamari-Seale.: J. Magn. Magn. Mater. 117 (1992) 79 92S2 Sakakibara ,T., Sekine, C., Amitsuka, H., Miyako Y.: J. Magn. Magn. Mater. 108 (1992)193 92S3 Shigeoka, T., Iwata, N., Fujii, H.: J. Magn. Magn. Mater. 104-107 (1992) 1229 92S4 Szytula, A., Radwanski, R.J., de Boer, F.R.: J. Magn. Magn. Mater. 104-107 (1992) 1237 92S5 Sakurai, J., Kawamura, R., Taniguchi, T., Nishigori, S., Ikeda, S., Goshima, H., Suzuki, T.,
Fujita, T.: J. Magn. Magn. Mater. 104-107 (1992) 1415 93B1 Bruck, E., Nakotte, H., Bakker, K., de Boer, F.R., de Chatel, P.F.: J. Alloys Comp. 200 (1993)
79 93B2 Blazina, Z., Westwood, S.M.: J. Alloys Comp. 201 (1993) 151 93C1 Cordier, G., Friedrich, T., Henseleit, R., Grauel, A., Tegel, U., Schank, Ch., Geibel, Ch.: J.
Alloys Comp. 201 (1993) 197 93D1 Das, I., Sampathkumaran, E.V., Chari, S., Gopalakrishnan, K.V.: J. Alloys Comp. 202 (1993)
L7 93G1 Ghosh, K., Ramakrishnan, S., Malik, S.K., Chandra, G.: J. Alloys Comp. 202 (1993) 211 93G2 Ghosh, K., Ramakrishnan, S., Nigan, A.K., Chandra, G.: J. Appl. Phys. 73 (1993) 6637 93I1 Ivanov. V., Vinokurowa, L., Szytula, A.: J. Alloys Comp. 201 (1993)109 93M1 Mulder, F.M., Thiel, R.C., Buschow, K.H.J.: J. Alloys Comp. 202 (1993) 29 93S1 Sanchez, J.P., Blaise, A., Ressouche. E., Malamann, B., Venturini, G., Tomala, K., Kmiec, R.:
J. Magn. Magn. Mater. 128 (1993) 295 93W2 Welter, R., Venturini G., Malaman, B.: J. Alloys Comp. 202 (1993) 165 94A1 Aoki, H., Uji, S., Terashima, T., Takashita, M., Onuki, Y.: Physica B 201(1994) 231 94A2 Adroja, D.T., Rainford, B.D.: J. Magn. Magn. Mater. 135 (1994) 333 94A3 Adroja, D.T., Rainford, B.D., Malik, S.K.: Physica B 194-196 (1994) 169 94A4 Aliev, F.G., Gorelenko, Yu.K., Pryadun, V.V., Vieira, S., Villar, R., Paredes, J.: Physica B
194-196 (1994) 171 94A5 Andre, G., Bouree, F., Bombik, A., Oles, A., Sikora, W., Kolenda, M., Szytula, A., Pacyna, A.,
Zygmunt, A.: Acta Phys. Pol. 85 (1994) 275 94B1 Bando, U., Takabatake, T., Tanaka, H., Iwasaki, H., Fujii, H., Malik, S.K.: Physica B 194-196
(1994) 1179 94B3 Burlet, P., Regnault, L.P., Rossat-Mignod, J., Vettier, C., Flouquet, J.: J. Magn. Magn. Mater.
129 (1994) 10 94B4 Blaise, A., Kmiec, R., Malaman, B., Ressouche, E., Sanchez, J., P., Tomala, K., Venturini, G.:
J. Magn. Magn. Mater. 135 (1994) 171 94F1 Fijiwara, K, Yamanashi, Y., Kumagai, K.: Physica B 199-200 (1994) 107 94G1 Garnier, A., Gignoux, D., Schmitt, D., Shigeoka, F.Y., Zhang: J. Magn. Magn. Mater. 140-144
(1994) 897 94G2 Godart, C., Flandorfer, H., Fogl, P.: Physica B 199-200 (1994) 512 94G4 Gignoux, D., Schmitt, D.: J. Magn. Magn. Mater. 129 (1994) 53 94H1 Hu, Z., Yelon, W.B.: J. Appl. Phys. 76 (1994) 6162 94K1 Kitazawa, H., Matsushita, A., Matsumoto, T., Suzuki, T.: Physica B 199-200 (1994) 28 94S1 Salgueiro da Silva, M., Sousa, J.B., Chevalier, B., Etourneau, J.: J. Appl. Phys. 76 (1994) 634494S2 Szytula, A., Ivanov, V., Vinokurova, L.: Acta Phys. Pol. 85 (1994) 94S3 Schäfer, W., Jansen, E., Will, G., Kosanidis, P.A., Yakinthos, J.K., Tietze-Jaensch.: J. Alloys
Comp. 209 (1994) 225 94T1 Tomala, K., Sanchez, J.P., Malaman, B., Venturini, G., Blaise, A., Kmiec, R.: J. Magn. Magn.
Mater. 131 (1994) 345 94T2 Takayanagi, S., Sato, H., Fakuhara, T., Wada, N.: Physica B 199-200 (1994) 49 95A1 Andre, G., Bouree, F., Guillot, M., Kolenda, M., Oles, A., Sikora, W., Szytula, A., Zygmunt,
A.: J. Magn. Magn. Mater. 140-144 (1995) 879
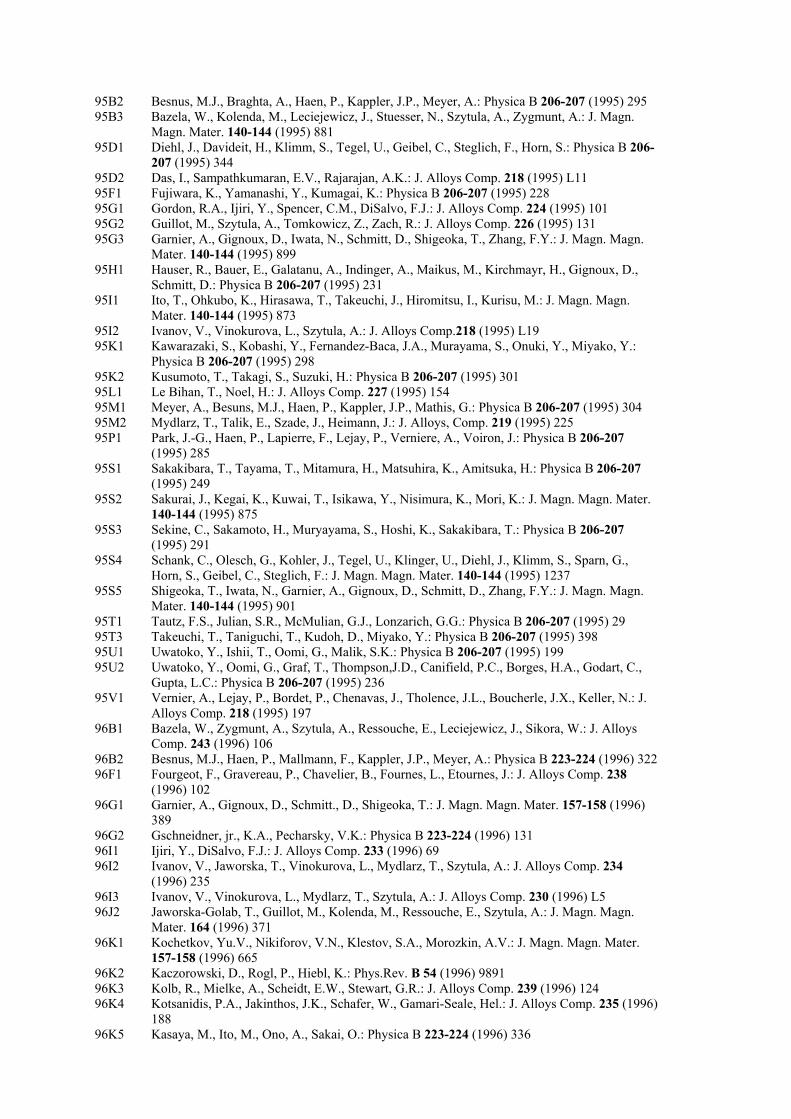
95B2 Besnus, M.J., Braghta, A., Haen, P., Kappler, J.P., Meyer, A.: Physica B 206-207 (1995) 295 95B3 Bazela, W., Kolenda, M., Leciejewicz, J., Stuesser, N., Szytula, A., Zygmunt, A.: J. Magn.
Magn. Mater. 140-144 (1995) 881 95D1 Diehl, J., Davideit, H., Klimm, S., Tegel, U., Geibel, C., Steglich, F., Horn, S.: Physica B 206-
207 (1995) 344 95D2 Das, I., Sampathkumaran, E.V., Rajarajan, A.K.: J. Alloys Comp. 218 (1995) L11 95F1 Fujiwara, K., Yamanashi, Y., Kumagai, K.: Physica B 206-207 (1995) 228 95G1 Gordon, R.A., Ijiri, Y., Spencer, C.M., DiSalvo, F.J.: J. Alloys Comp. 224 (1995) 101 95G2 Guillot, M., Szytula, A., Tomkowicz, Z., Zach, R.: J. Alloys Comp. 226 (1995) 131 95G3 Garnier, A., Gignoux, D., Iwata, N., Schmitt, D., Shigeoka, T., Zhang, F.Y.: J. Magn. Magn.
Mater. 140-144 (1995) 899 95H1 Hauser, R., Bauer, E., Galatanu, A., Indinger, A., Maikus, M., Kirchmayr, H., Gignoux, D.,
Schmitt, D.: Physica B 206-207 (1995) 231 95I1 Ito, T., Ohkubo, K., Hirasawa, T., Takeuchi, J., Hiromitsu, I., Kurisu, M.: J. Magn. Magn.
Mater. 140-144 (1995) 873 95I2 Ivanov, V., Vinokurova, L., Szytula, A.: J. Alloys Comp.218 (1995) L19 95K1 Kawarazaki, S., Kobashi, Y., Fernandez-Baca, J.A., Murayama, S., Onuki, Y., Miyako, Y.:
Physica B 206-207 (1995) 298 95K2 Kusumoto, T., Takagi, S., Suzuki, H.: Physica B 206-207 (1995) 301 95L1 Le Bihan, T., Noel, H.: J. Alloys Comp. 227 (1995) 154 95M1 Meyer, A., Besuns, M.J., Haen, P., Kappler, J.P., Mathis, G.: Physica B 206-207 (1995) 304 95M2 Mydlarz, T., Talik, E., Szade, J., Heimann, J.: J. Alloys, Comp. 219 (1995) 225 95P1 Park, J.-G., Haen, P., Lapierre, F., Lejay, P., Verniere, A., Voiron, J.: Physica B 206-207
(1995) 285 95S1 Sakakibara, T., Tayama, T., Mitamura, H., Matsuhira, K., Amitsuka, H.: Physica B 206-207
(1995) 249 95S2 Sakurai, J., Kegai, K., Kuwai, T., Isikawa, Y., Nisimura, K., Mori, K.: J. Magn. Magn. Mater.
140-144 (1995) 875 95S3 Sekine, C., Sakamoto, H., Muryayama, S., Hoshi, K., Sakakibara, T.: Physica B 206-207
(1995) 291 95S4 Schank, C., Olesch, G., Kohler, J., Tegel, U., Klinger, U., Diehl, J., Klimm, S., Sparn, G.,
Horn, S., Geibel, C., Steglich, F.: J. Magn. Magn. Mater. 140-144 (1995) 1237 95S5 Shigeoka, T., Iwata, N., Garnier, A., Gignoux, D., Schmitt, D., Zhang, F.Y.: J. Magn. Magn.
Mater. 140-144 (1995) 901 95T1 Tautz, F.S., Julian, S.R., McMulian, G.J., Lonzarich, G.G.: Physica B 206-207 (1995) 29 95T3 Takeuchi, T., Taniguchi, T., Kudoh, D., Miyako, Y.: Physica B 206-207 (1995) 398 95U1 Uwatoko, Y., Ishii, T., Oomi, G., Malik, S.K.: Physica B 206-207 (1995) 199 95U2 Uwatoko, Y., Oomi, G., Graf, T., Thompson,J.D., Canifield, P.C., Borges, H.A., Godart, C.,
Gupta, L.C.: Physica B 206-207 (1995) 236 95V1 Vernier, A., Lejay, P., Bordet, P., Chenavas, J., Tholence, J.L., Boucherle, J.X., Keller, N.: J.
Alloys Comp. 218 (1995) 197 96B1 Bazela, W., Zygmunt, A., Szytula, A., Ressouche, E., Leciejewicz, J., Sikora, W.: J. Alloys
Comp. 243 (1996) 106 96B2 Besnus, M.J., Haen, P., Mallmann, F., Kappler, J.P., Meyer, A.: Physica B 223-224 (1996) 32296F1 Fourgeot, F., Gravereau, P., Chavelier, B., Fournes, L., Etournes, J.: J. Alloys Comp. 238
(1996) 102 96G1 Garnier, A., Gignoux, D., Schmitt., D., Shigeoka, T.: J. Magn. Magn. Mater. 157-158 (1996)
389 96G2 Gschneidner, jr., K.A., Pecharsky, V.K.: Physica B 223-224 (1996) 131 96I1 Ijiri, Y., DiSalvo, F.J.: J. Alloys Comp. 233 (1996) 69 96I2 Ivanov, V., Jaworska, T., Vinokurova, L., Mydlarz, T., Szytula, A.: J. Alloys Comp. 234
(1996) 235 96I3 Ivanov, V., Vinokurova, L., Mydlarz, T., Szytula, A.: J. Alloys Comp. 230 (1996) L5 96J2 Jaworska-Golab, T., Guillot, M., Kolenda, M., Ressouche, E., Szytula, A.: J. Magn. Magn.
Mater. 164 (1996) 371 96K1 Kochetkov, Yu.V., Nikiforov, V.N., Klestov, S.A., Morozkin, A.V.: J. Magn. Magn. Mater.
157-158 (1996) 665 96K2 Kaczorowski, D., Rogl, P., Hiebl, K.: Phys.Rev. B 54 (1996) 9891 96K3 Kolb, R., Mielke, A., Scheidt, E.W., Stewart, G.R.: J. Alloys Comp. 239 (1996) 124 96K4 Kotsanidis, P.A., Jakinthos, J.K., Schafer, W., Gamari-Seale, Hel.: J. Alloys Comp. 235 (1996)
188 96K5 Kasaya, M., Ito, M., Ono, A., Sakai, O.: Physica B 223-224 (1996) 336
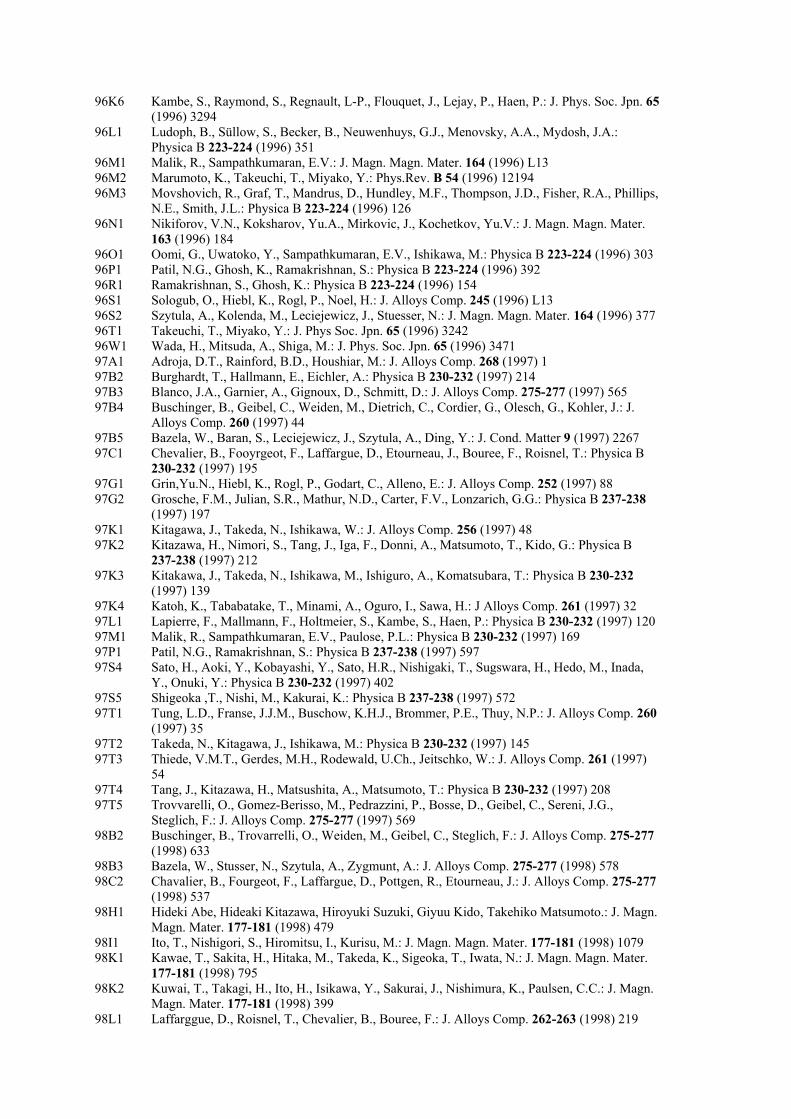
96K6 Kambe, S., Raymond, S., Regnault, L-P., Flouquet, J., Lejay, P., Haen, P.: J. Phys. Soc. Jpn. 65(1996) 3294
96L1 Ludoph, B., Süllow, S., Becker, B., Neuwenhuys, G.J., Menovsky, A.A., Mydosh, J.A.: Physica B 223-224 (1996) 351
96M1 Malik, R., Sampathkumaran, E.V.: J. Magn. Magn. Mater. 164 (1996) L13 96M2 Marumoto, K., Takeuchi, T., Miyako, Y.: Phys.Rev. B 54 (1996) 12194 96M3 Movshovich, R., Graf, T., Mandrus, D., Hundley, M.F., Thompson, J.D., Fisher, R.A., Phillips,
N.E., Smith, J.L.: Physica B 223-224 (1996) 126 96N1 Nikiforov, V.N., Koksharov, Yu.A., Mirkovic, J., Kochetkov, Yu.V.: J. Magn. Magn. Mater.
163 (1996) 184 96O1 Oomi, G., Uwatoko, Y., Sampathkumaran, E.V., Ishikawa, M.: Physica B 223-224 (1996) 303 96P1 Patil, N.G., Ghosh, K., Ramakrishnan, S.: Physica B 223-224 (1996) 392 96R1 Ramakrishnan, S., Ghosh, K.: Physica B 223-224 (1996) 154 96S1 Sologub, O., Hiebl, K., Rogl, P., Noel, H.: J. Alloys Comp. 245 (1996) L13 96S2 Szytula, A., Kolenda, M., Leciejewicz, J., Stuesser, N.: J. Magn. Magn. Mater. 164 (1996) 37796T1 Takeuchi, T., Miyako, Y.: J. Phys Soc. Jpn. 65 (1996) 3242 96W1 Wada, H., Mitsuda, A., Shiga, M.: J. Phys. Soc. Jpn. 65 (1996) 3471 97A1 Adroja, D.T., Rainford, B.D., Houshiar, M.: J. Alloys Comp. 268 (1997) 1 97B2 Burghardt, T., Hallmann, E., Eichler, A.: Physica B 230-232 (1997) 214 97B3 Blanco, J.A., Garnier, A., Gignoux, D., Schmitt, D.: J. Alloys Comp. 275-277 (1997) 565 97B4 Buschinger, B., Geibel, C., Weiden, M., Dietrich, C., Cordier, G., Olesch, G., Kohler, J.: J.
Alloys Comp. 260 (1997) 44 97B5 Bazela, W., Baran, S., Leciejewicz, J., Szytula, A., Ding, Y.: J. Cond. Matter 9 (1997) 2267 97C1 Chevalier, B., Fooyrgeot, F., Laffargue, D., Etourneau, J., Bouree, F., Roisnel, T.: Physica B
230-232 (1997) 195 97G1 Grin,Yu.N., Hiebl, K., Rogl, P., Godart, C., Alleno, E.: J. Alloys Comp. 252 (1997) 88 97G2 Grosche, F.M., Julian, S.R., Mathur, N.D., Carter, F.V., Lonzarich, G.G.: Physica B 237-238
(1997) 197 97K1 Kitagawa, J., Takeda, N., Ishikawa, W.: J. Alloys Comp. 256 (1997) 48 97K2 Kitazawa, H., Nimori, S., Tang, J., Iga, F., Donni, A., Matsumoto, T., Kido, G.: Physica B
237-238 (1997) 212 97K3 Kitakawa, J., Takeda, N., Ishikawa, M., Ishiguro, A., Komatsubara, T.: Physica B 230-232
(1997) 139 97K4 Katoh, K., Tababatake, T., Minami, A., Oguro, I., Sawa, H.: J Alloys Comp. 261 (1997) 32 97L1 Lapierre, F., Mallmann, F., Holtmeier, S., Kambe, S., Haen, P.: Physica B 230-232 (1997) 12097M1 Malik, R., Sampathkumaran, E.V., Paulose, P.L.: Physica B 230-232 (1997) 169 97P1 Patil, N.G., Ramakrishnan, S.: Physica B 237-238 (1997) 597 97S4 Sato, H., Aoki, Y., Kobayashi, Y., Sato, H.R., Nishigaki, T., Sugswara, H., Hedo, M., Inada,
Y., Onuki, Y.: Physica B 230-232 (1997) 402 97S5 Shigeoka ,T., Nishi, M., Kakurai, K.: Physica B 237-238 (1997) 572 97T1 Tung, L.D., Franse, J.J.M., Buschow, K.H.J., Brommer, P.E., Thuy, N.P.: J. Alloys Comp. 260
(1997) 35 97T2 Takeda, N., Kitagawa, J., Ishikawa, M.: Physica B 230-232 (1997) 145 97T3 Thiede, V.M.T., Gerdes, M.H., Rodewald, U.Ch., Jeitschko, W.: J. Alloys Comp. 261 (1997)
54 97T4 Tang, J., Kitazawa, H., Matsushita, A., Matsumoto, T.: Physica B 230-232 (1997) 208 97T5 Trovvarelli, O., Gomez-Berisso, M., Pedrazzini, P., Bosse, D., Geibel, C., Sereni, J.G.,
Steglich, F.: J. Alloys Comp. 275-277 (1997) 569 98B2 Buschinger, B., Trovarrelli, O., Weiden, M., Geibel, C., Steglich, F.: J. Alloys Comp. 275-277
(1998) 633 98B3 Bazela, W., Stusser, N., Szytula, A., Zygmunt, A.: J. Alloys Comp. 275-277 (1998) 578 98C2 Chavalier, B., Fourgeot, F., Laffargue, D., Pottgen, R., Etourneau, J.: J. Alloys Comp. 275-277
(1998) 537 98H1 Hideki Abe, Hideaki Kitazawa, Hiroyuki Suzuki, Giyuu Kido, Takehiko Matsumoto.: J. Magn.
Magn. Mater. 177-181 (1998) 479 98I1 Ito, T., Nishigori, S., Hiromitsu, I., Kurisu, M.: J. Magn. Magn. Mater. 177-181 (1998) 1079 98K1 Kawae, T., Sakita, H., Hitaka, M., Takeda, K., Sigeoka, T., Iwata, N.: J. Magn. Magn. Mater.
177-181 (1998) 795 98K2 Kuwai, T., Takagi, H., Ito, H., Isikawa, Y., Sakurai, J., Nishimura, K., Paulsen, C.C.: J. Magn.
Magn. Mater. 177-181 (1998) 399 98L1 Laffarggue, D., Roisnel, T., Chevalier, B., Bouree, F.: J. Alloys Comp. 262-263 (1998) 219
98M1 Mulder, F.M., Thiel, R.C., Tung, F.D., Franse, J.J.M., Buschow, K.H.J.: J. Alloys Comp. 264 (1998) 43
98M2 Marumoto, K., Takayama, F., Miyako, Y.: J. Magn. Magn. Mater. 177-181 (1998) 353 98N1 Nishigori, S., Hirooka, Y., Ito, T.: J. Magn. Magn. Mater. 177-181 (1998) 137 98S1 Sekine, C., Tayama, T., Sakakibara, T., Murayama, S., Shirotani, I., Onuki, Y.: J. Magn.
Magn. Mater. 177-181 (1998) 411 98T1 Takeuchi, T., Kohyama, J.M., Kawarazaki, S., Sato, M., Miyako, Y.: 177-181 (1998) 1081 98T2 Troc, R., Kaczorowski, D., Cichorek, T., Andraka, B., Pietri, R., Seropegin, Yu.D., Gribanov,
A.V.: J. Alloys Comp. 262-263 (1998) 211 98T3 Taniguchi, T., Tabata, Y., Tanabe, H., Miyako, Y.: J. Magn. Magn. Mater. 177-181 (1998) 419
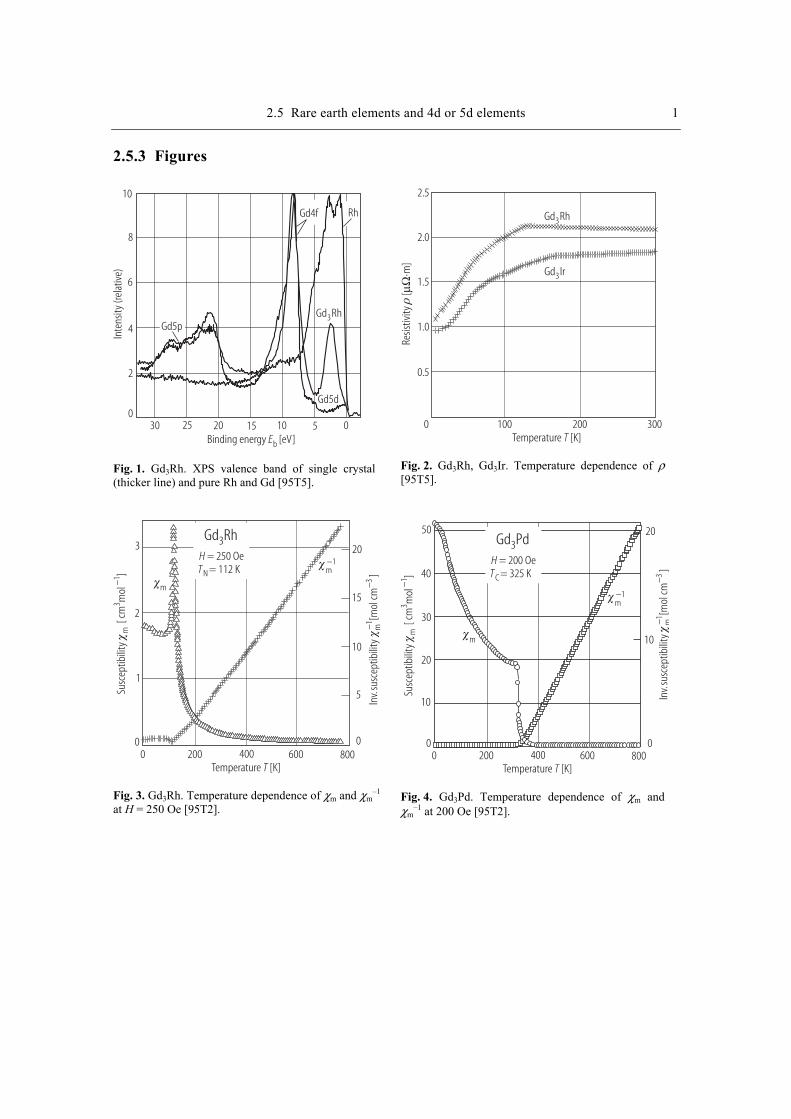
2.5 Rare earth elements and 4d or 5d elements 1
2.5.3 Figures
Inte
nsity
(rel
ativ
e)
Binding energy [eV]Eb
10
8
6
4
2
030 25 20 15 10 5 0
Gd5d
Rh
Gd Rh3
Gd4f
Gd5p
Fig. 1. Gd3Rh. XPS valence band of single crystal (thicker line) and pure Rh and Gd [95T5].
Temperature [K]T
Resis
tivity
[
m]
µΩ⋅
Gd Rh3
Gd Ir3
2.5
2.0
1.5
1.0
0.5
0 100 200 300
Fig. 2. Gd3Rh, Gd3Ir. Temperature dependence of ρ [95T5].
Temperature [K]T
Susc
eptib
ility
[ cm
mol
]m
31−
Inv.
susc
eptib
ility
[mol
cm]
m3−
−1
m−1
T = 112 KN
H = 250 Oe
m
3
2
1
00 200 400 600 800
20
15
10
5
0
Gd Rh3
Fig. 3. Gd3Rh. Temperature dependence of χm and χm
–1 at H = 250 Oe [95T2].
Temperature [K]T
Susc
eptib
ility
[ cm
mol
]m
31−
Inv.
susc
eptib
ilit y
[mol
cm]
m3−
−1
m−1
T = 325 KC
H = 200 Oe
m
0 200 400 600 800
Gd Pd350
40
30
20
10
0
20
10
0
Fig. 4. Gd3Pd. Temperature dependence of χm and χm
–1 at 200 Oe [95T2].
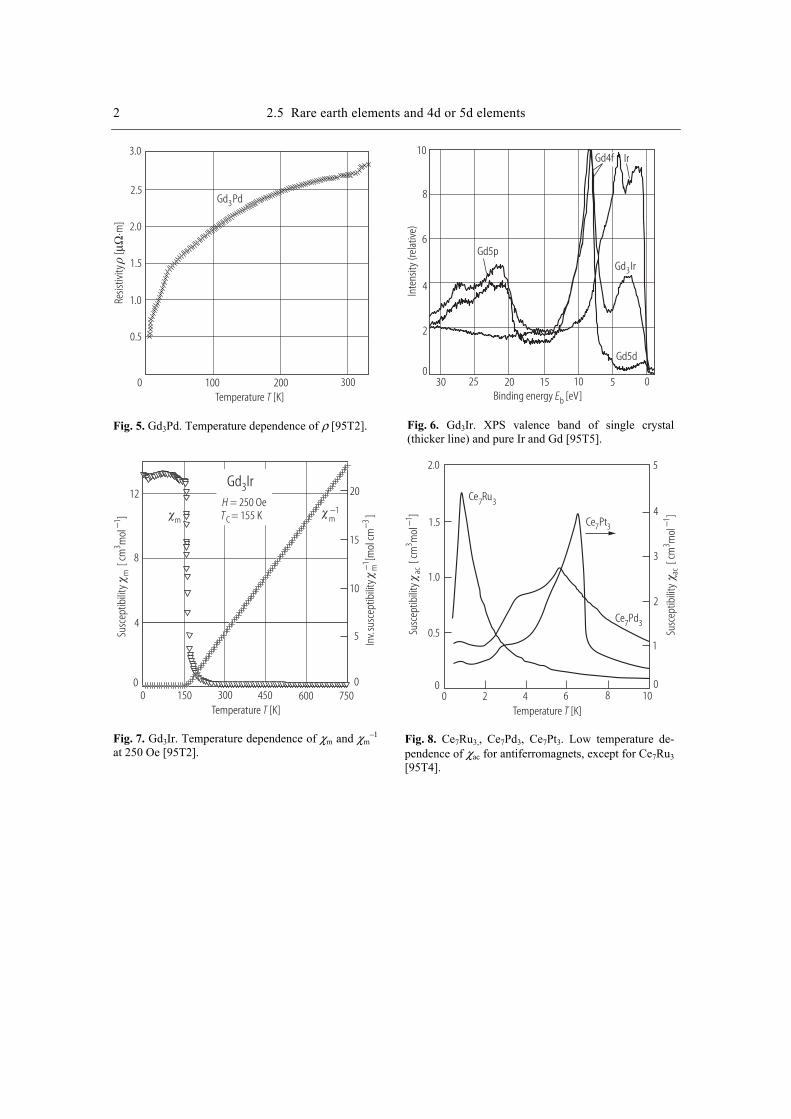
2 2.5 Rare earth elements and 4d or 5d elements
Temperature [K]T
Resis
tivity
[
m]
µΩ⋅
Gd Pd3
2.5
2.0
1.5
1.0
0.5
0 100 200 300
3.0
Fig. 5. Gd3Pd. Temperature dependence of ρ [95T2].
Inte
nsity
(rel
ativ
e)Binding energy [eV]Eb
10
8
6
4
2
030 25 20 15 10 5 0
Gd5d
Ir
Gd Ir3
Gd4f
Gd5p
Fig. 6. Gd3Ir. XPS valence band of single crystal (thicker line) and pure Ir and Gd [95T5].
Temperature [K]T
Susc
eptib
ility
[ cm
mol
]m
31−
Inv.
susc
eptib
ility
[mol
cm]
m3−
−1
m−1T = 155 KC
H = 250 Oe
m
12
8
4
00 150 300 600 750
20
15
10
5
0
Gd Ir3
450
Fig. 7. Gd3Ir. Temperature dependence of χm and χm
–1 at 250 Oe [95T2].
Temperature [K]T
Susc
eptib
ility
[ cm
mol
]ac
31−
Susc
eptib
ility
[ cm
mol
]ac
31−
2.0
1.5
1.0
0.5
00 2 4 6 8 10
5
4
3
2
1
0
Ce Ru7 3
Ce Pd7 3
Ce Pt7 3
Fig. 8. Ce7Ru3,, Ce7Pd3, Ce7Pt3. Low temperature de-pendence of χac for antiferromagnets, except for Ce7Ru3 [95T4].
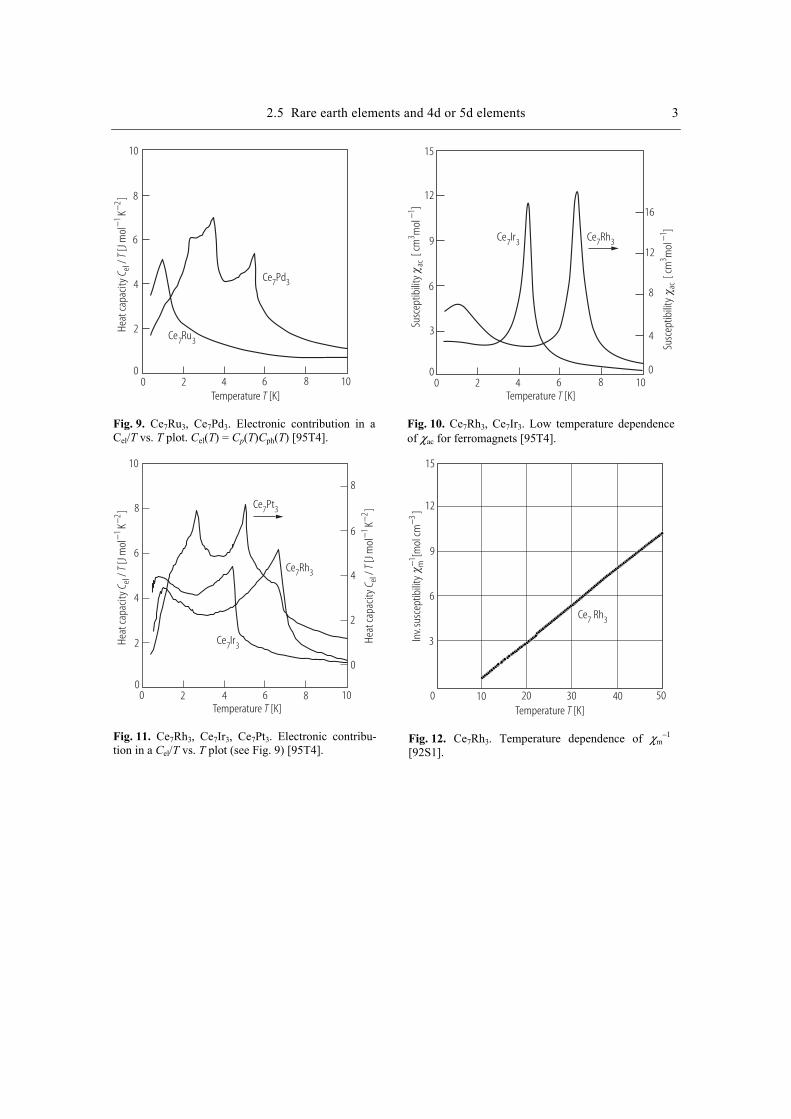
2.5 Rare earth elements and 4d or 5d elements 3
Temperature [K]T0 2 4 6 8 10
Ce Ru7 3
Ce Pd7 3
Heat
capa
city
/[J
mol
K]
CT
el1
2−
−
10
8
6
4
2
0
Fig. 9. Ce7Ru3, Ce7Pd3. Electronic contribution in a Cel/T vs. T plot. Cel(T) = Cp(T)Cph(T) [95T4].
Temperature [K]T
Susc
eptib
ility
[ cm
mol
]ac
31−
Susc
eptib
ility
[ cm
mol
]ac
31−
0 2 4 6 8 10
Ce Ir7 3 Ce Rh7 3
0
3
6
9
12
15
16
12
8
4
0
Fig. 10. Ce7Rh3, Ce7Ir3. Low temperature dependence of χac for ferromagnets [95T4].
Temperature [K]T0 2 4 6 8 10
Ce Ir7 3
Ce Rh7 3
Ce Pt7 3
10
8
6
4
2
0
8
6
4
2
0
Heat
capa
city
/[J
mol
K]
CT
el1
2−
−
Heat
capa
city
/[J
mol
K]
CT
el1
2−
−
Fig. 11. Ce7Rh3, Ce7Ir3, Ce7Pt3. Electronic contribu-tion in a Cel/T vs. T plot (see Fig. 9) [95T4].
Temperature [K]T
Inv.
susc
eptib
ility
[mol
cm]
m3−
−1
Ce Rh7 3
15
12
9
6
3
0 10 20 30 40 50
Fig. 12. Ce7Rh3. Temperature dependence of χm
–1
[92S1].
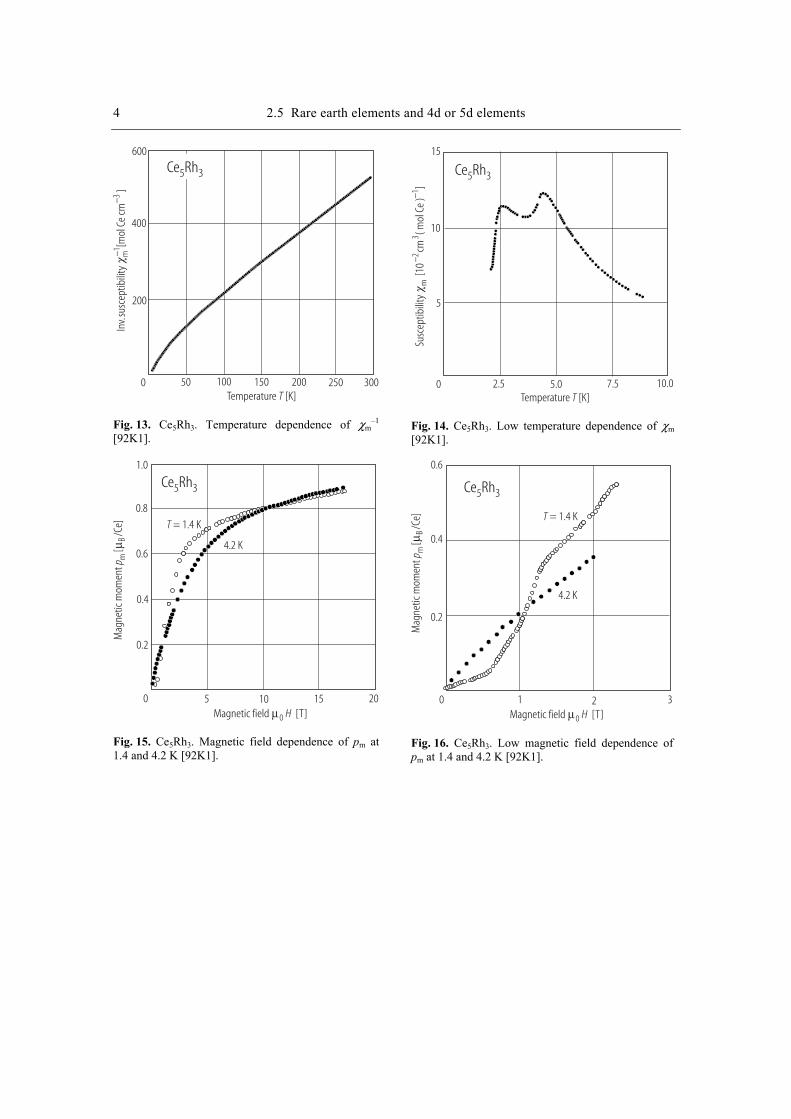
4 2.5 Rare earth elements and 4d or 5d elements
Temperature [K]T
Inv.
susc
eptib
ility
[mol
Ce
cm]
m3−
−1
600
400
200
0 50 100 150 200 250 300
Ce Rh5 3
Fig. 13. Ce5Rh3. Temperature dependence of χm
–1 [92K1].
Temperature [K]T
Susc
eptib
ility
[10
cm( m
ol C
e )
]m
23
1−
−
Ce Rh5 3
15
10
5
0 5.0 10.02.5 7.5
Fig. 14. Ce5Rh3. Low temperature dependence of χm [92K1].
Ce Rh5 3
Magnetic field [T]0 Hµ
Mag
netic
mom
ent
[/C
e]p m
Bµ
1.0
0.8
0.6
0.4
0.2
0 5 10 15 20
T = 1.4 K
4.2 K
Fig. 15. Ce5Rh3. Magnetic field dependence of pm at 1.4 and 4.2 K [92K1].
Ce Rh5 3
Magnetic field [T]0 Hµ
Mag
netic
mom
ent
[/C
e]p m
Bµ
0.6
0.4
0.2
0
T = 1.4 K
4.2 K
1 2 3
Fig. 16. Ce5Rh3. Low magnetic field dependence of pm at 1.4 and 4.2 K [92K1].
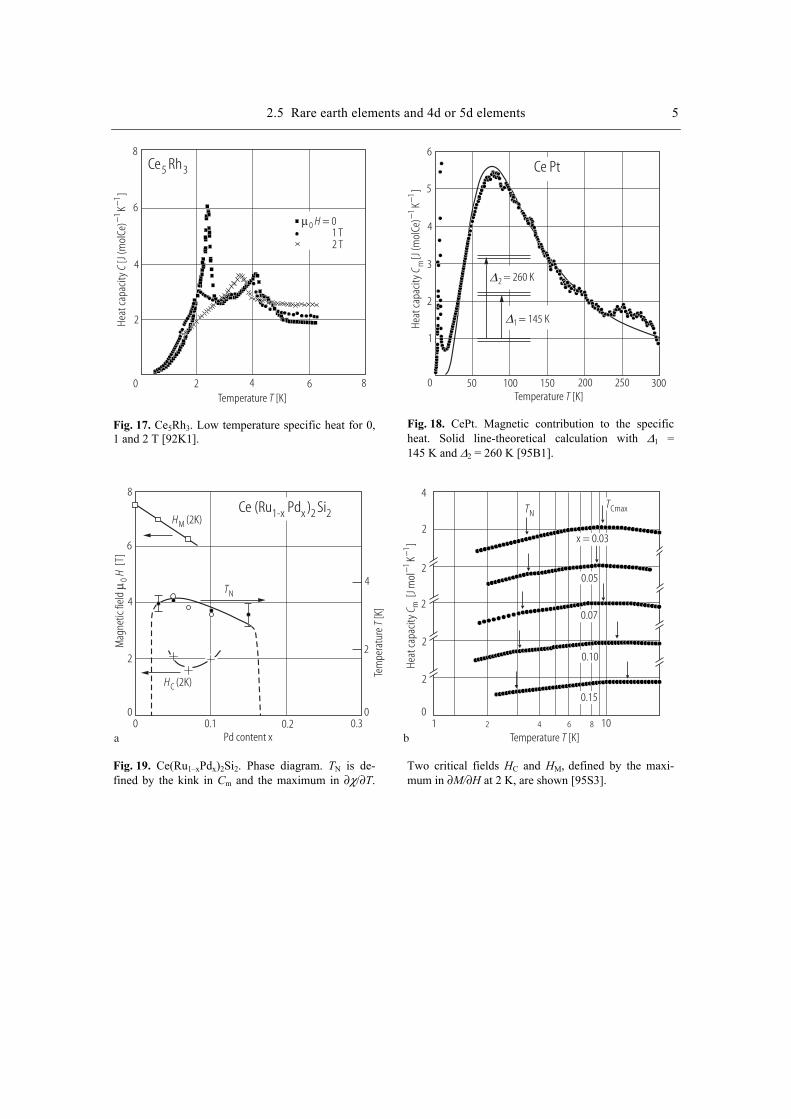
2.5 Rare earth elements and 4d or 5d elements 5
Temperature [K]T
Heat
capa
city
[J(m
olCe
)K
]C
−−
11
Ce Rh5 3
1 T2 T
6
8
4
2
0 2 4 6 8
µ0 = 0H
Fig. 17. Ce5Rh3. Low temperature specific heat for 0, 1 and 2 T [92K1].
Temperature [K]T
Heat
capa
city
[J(m
olCe
)K
]C m
11
−−
Ce Pt6
5
4
3
2
1
0 50 100 150 200 250 300
1
2 = 260 K
= 145 K
Fig. 18. CePt. Magnetic contribution to the specific heat. Solid line-theoretical calculation with ∆1 =145 K and ∆2 = 260 K [95B1].
Temperature [K]T
Tem
pera
ture
[K]
T
Mag
netic
fiel
d[T
]0
Hµ
Heat
capa
city
[Jm
olK
]C m
11
−−
Pd content x
Ce (Ru Pd ) Si1-x x 2 2HM (2K)
HC (2K)
TN
TNTCmax
8
6
4
2
00 0.1 0.2 0.3
0
2
4
4
2
2
2
2
2
01 102 4 6 8
a b
x = 0.03
0.05
0.07
0.10
0.15
Fig. 19. Ce(Ru1–xPdx)2Si2. Phase diagram. TN is de-fined by the kink in Cm and the maximum in ∂χ/∂T.
Two critical fields HC and HM, defined by the maxi-mum in ∂M/∂H at 2 K, are shown [95S3].
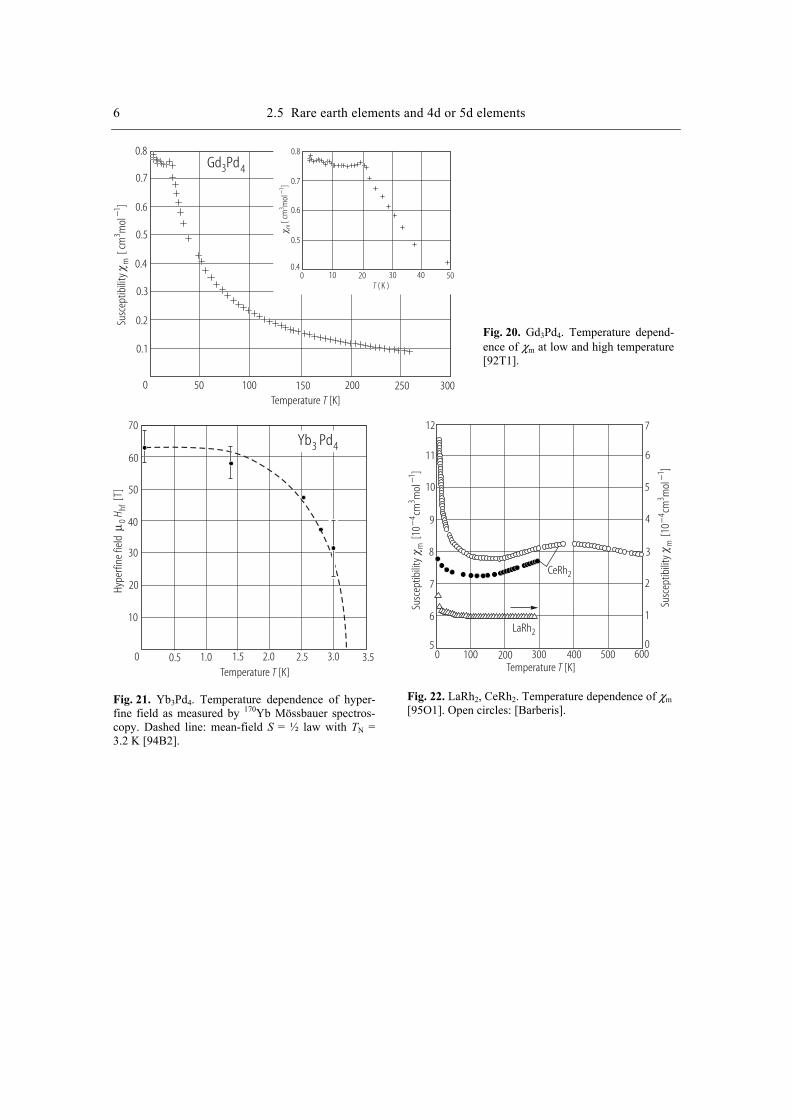
6 2.5 Rare earth elements and 4d or 5d elements
Temperature [K]T
Susc
eptib
ility
[ cm
mol
]m
31−
Gd Pd3 4
0.8
0.7
0.6
0.5
0.4
0.3
0.2
0.1
0 50 100 150 200 250 300
0.8
0.7
0.6
0.5
0.40 10 20 30 40 50
T ( K )[ c
mm
ol]
m3
1−
Fig. 20. Gd3Pd4. Temperature depend-ence of χm at low and high temperature [92T1].
70
50
40
30
20
10
60
0 0.5 1.0 1.5 2.0 2.5 3.0 3.5Temperature [K]T
Hype
rfine
fiel
d[T
]0
hfHµ
Yb Pd3 4
Fig. 21. Yb3Pd4. Temperature dependence of hyper-fine field as measured by 170Yb Mössbauer spectros-copy. Dashed line: mean-field S = ½ law with TN = 3.2 K [94B2].
Temperature [K]T
Susc
eptib
ility
[10
cmm
ol]
m4
31
−−
Susc
eptib
ility
[10
cmm
ol]
m4
31
−−
0 100 200 300 400 500 600
12
11
10
9
8
7
6
5
7
6
5
4
3
2
1
0
LaRh2
CeRh2
Fig. 22. LaRh2, CeRh2. Temperature dependence of χm [95O1]. Open circles: [Barberis].
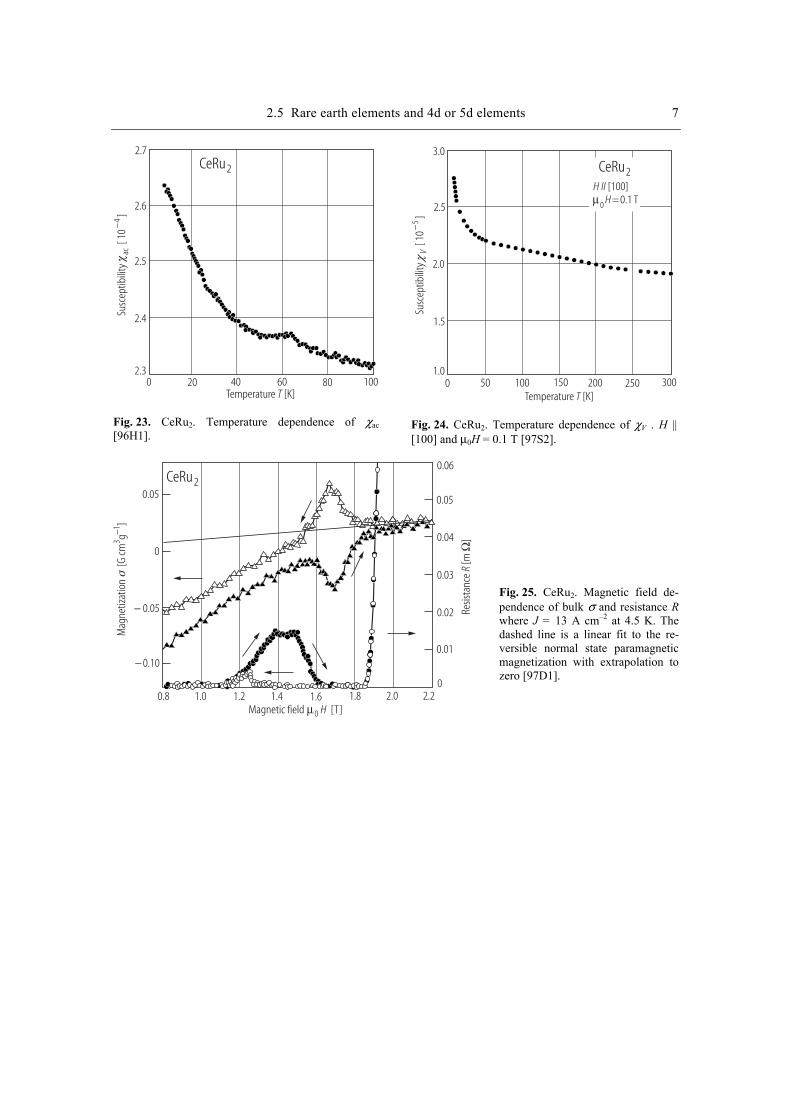
2.5 Rare earth elements and 4d or 5d elements 7
Temperature [K]T
Susc
eptib
ility
[ 10
]ac
4−
2.7
2.6
2.5
2.4
2.30 20 40 60 80 100
CeRu2
Fig. 23. CeRu2. Temperature dependence of χac [96H1].
Temperature [K]T
Susc
eptib
ility
[ 10
]V
−5
3.0
2.5
2.0
1.5
1.00 50 100 150 200 250 300
H II [100]µ0 H =0.1 T
CeRu2
Fig. 24. CeRu2. Temperature dependence of χV . H || [100] and µ0H = 0.1 T [97S2].
CeRu2
Magnetic field [T]0 Hµ
Mag
netiz
atio
n
[G cm
g]
31−
Resis
tanc
e[m
]R
Ω
0.05
0
− 0.05
− 0.10
0.06
0.05
0.04
0.03
0.02
0.01
00.8 1.0 1.2 1.4 1.6 1.8 2.0 2.2
Fig. 25. CeRu2. Magnetic field de-pendence of bulk σ and resistance R where J = 13 A cm–2 at 4.5 K. The dashed line is a linear fit to the re-versible normal state paramagnetic magnetization with extrapolation to zero [97D1].
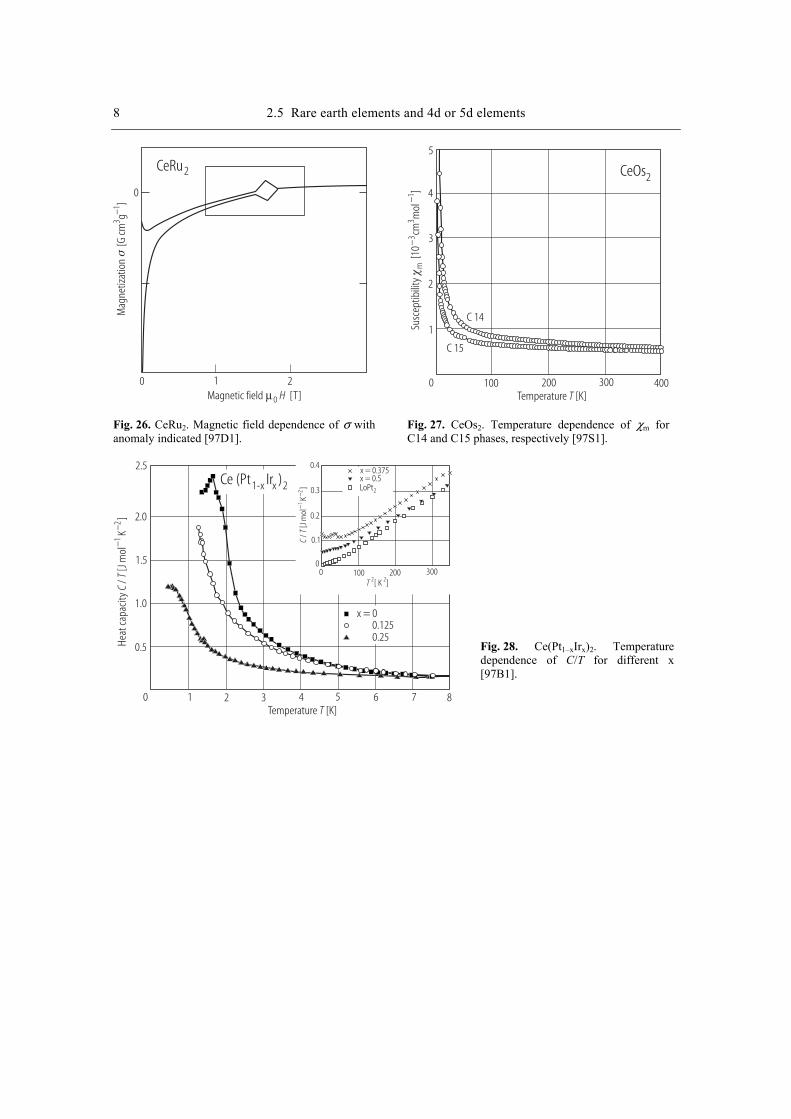
8 2.5 Rare earth elements and 4d or 5d elements
CeRu2
Magnetic field [T]0 Hµ
Mag
netiz
atio
n
[G cm
g]
31−
0
0 1 2
Fig. 26. CeRu2. Magnetic field dependence of σ with anomaly indicated [97D1].
Temperature [K]T
Susc
eptib
ility
[10
cmm
ol]
m3
31
−−
5
4
3
2
1
0 100 200 300 400
CeOs2
C 14
C 15
Fig. 27. CeOs2. Temperature dependence of χm for C14 and C15 phases, respectively [97S1].
Temperature [K]T
Heat
capa
city
/[J
mol
K]
CT
−−
12
2.5
2.0
1.5
1.0
0.5
0 1 2 3 4 5 6 7 8
x = 00.1250.25
x = 0.375x = 0.5LoPt2
0.4
0.3
0.2
0.1
00 100 200 300
T 2 2[ K ]
/[J
mol
K]
CT
−−
12
Ce (Pt Ir )1-x x 2
Fig. 28. Ce(Pt1–xIrx)2. Temperature dependence of C/T for different x [97B1].
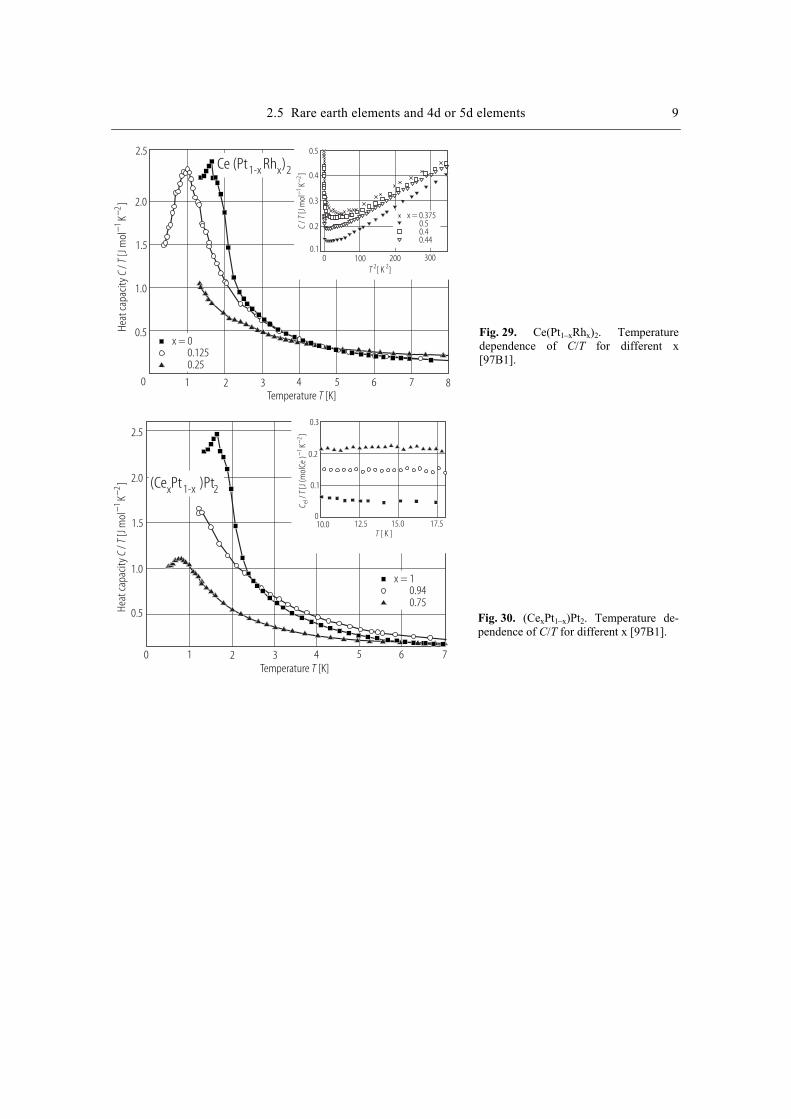
2.5 Rare earth elements and 4d or 5d elements 9
Temperature [K]T
Heat
capa
city
/[J
mol
K]
CT
−−
12
2.5
2.0
1.5
1.0
0.5
0 1 2 3 4 5 6 7 8
x = 00.1250.25
0.4
0.3
0.2
0.10 100 200 300
T 2 2[ K ]
/[J
mol
K]
CT
−−
12
Ce (Pt Rh )1-x x 2
0.5
x = 0.3750.50.40.44
Fig. 29. Ce(Pt1–xRhx)2. Temperature dependence of C/T for different x [97B1].
Temperature [K]T
Heat
capa
city
/[J
mol
K]
CT
−−
12
2.5
2.0
1.5
1.0
0.5
0 1 2 3 4 5 6 7
x = 10.940.75
0.3
0.2
0.1
010.0 12.5 15.0 17.5
T [ K ]
/[J
(mol
Ce)
K]
CT
el1
2−
−
(Ce Pt )Ptx 1-x 2
Fig. 30. (CexPt1–x)Pt2. Temperature de-pendence of C/T for different x [97B1].
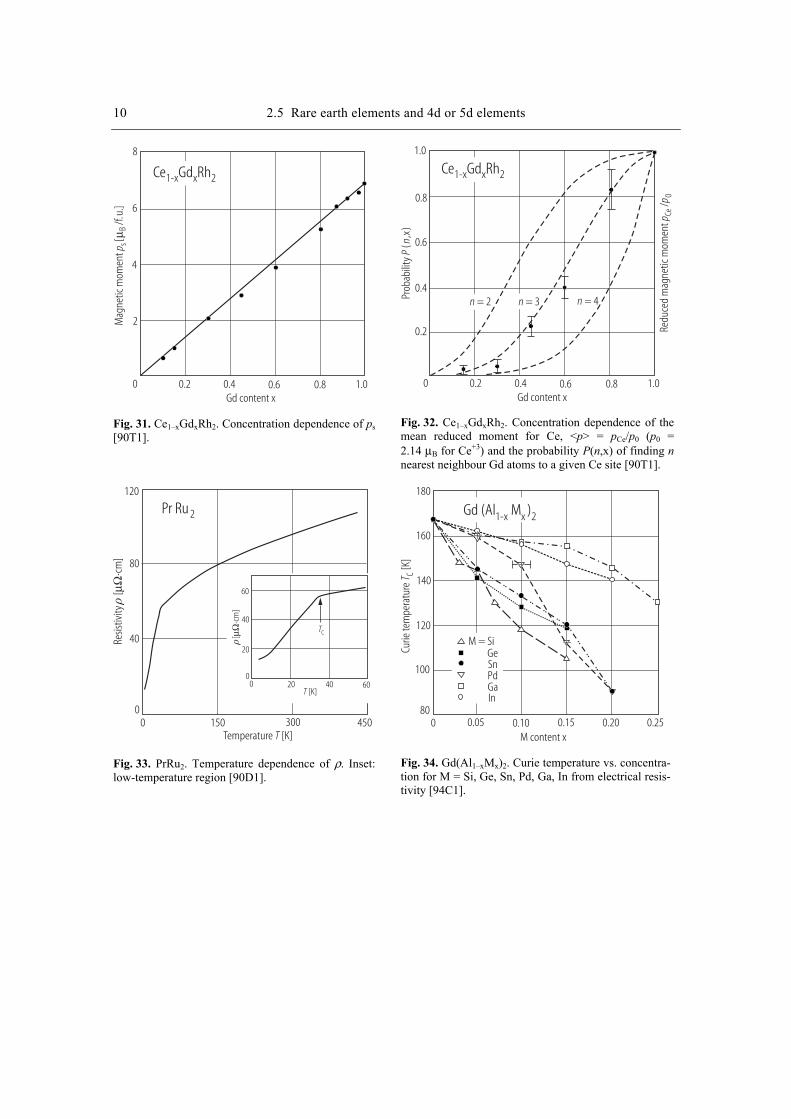
10 2.5 Rare earth elements and 4d or 5d elements
Ce Gd Rh1-x x 2
Mag
netic
mom
ent
[p s
Bµ/f.
u.]
8
6
4
2
0 0.2 0.4 0.6 0.8 1.0Gd content x
Fig. 31. Ce1–xGdxRh2. Concentration dependence of ps [90T1].
Ce Gd Rh1-x x 2
0 0.2
0.2
0.4
0.4
0.6
0.6
0.8
0.8
1.0
1.0
Gd content x
Redu
ced
mag
netic
mom
ent
/p
pCe
0
Prob
abili
ty(
,x)
Pn
n = 2 n = 3 n = 4
Fig. 32. Ce1–xGdxRh2. Concentration dependence of the mean reduced moment for Ce, <p> = pCe/p0 (p0 = 2.14 µB for Ce+3) and the probability P(n,x) of finding n nearest neighbour Gd atoms to a given Ce site [90T1].
Temperature [K]T
Resis
tivity
[
cm]
µΩ⋅
120
80
40
0 150 300 450
Pr Ru 2
60
40
20
00
0
20 40 60
TC[cm
]µΩ
⋅
[K]T
Fig. 33. PrRu2. Temperature dependence of ρ. Inset: low-temperature region [90D1].
160
120
80
100
140
180
0 0.05 0.10 0.15 0.20 0.25M content x
Curie
tem
pera
ture
[K]
T C
M = SiGeSnPdGaIn
Gd (Al M )1-x x 2
Fig. 34. Gd(Al1–xMx)2. Curie temperature vs. concentra-tion for M = Si, Ge, Sn, Pd, Ga, In from electrical resis-tivity [94C1].
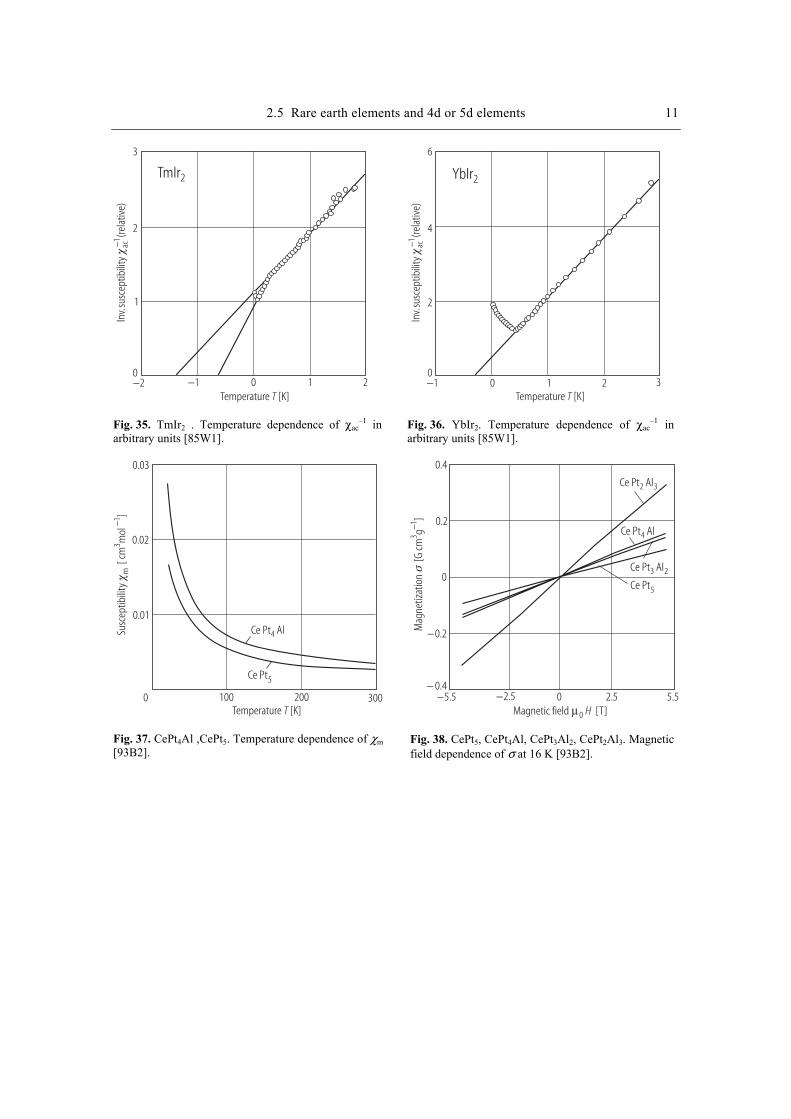
2.5 Rare earth elements and 4d or 5d elements 11
Temperature [K]T
Inv.
susc
eptib
ility
(rela
tive)
ac−1
3
2
1
0−2 −1 0 1 2
TmIr2
Fig. 35. TmIr2 . Temperature dependence of χac
–1 in arbitrary units [85W1].
Temperature [K]T
Inv.
susc
eptib
ility
(rela
tive)
ac−1
6
4
2
0−1 0 1 2
YbIr2
3
Fig. 36. YbIr2. Temperature dependence of χac
–1 in arbitrary units [85W1].
Temperature [K]T
Susc
eptib
ility
[ cm
mol
]m
31−
0.03
0.02
0.01
0 100 200 300
Ce Pt Al4
Ce Pt5
Fig. 37. CePt4Al ,CePt5. Temperature dependence of χm [93B2].
Ce Pt Al2 3
Ce Pt Al3 2
Ce Pt Al4
Ce Pt5
Magnetic field [T]0 Hµ
Mag
netiz
atio
n
[G cm
g]
31−
−5.5 −2.5 0 2.5 5.5
0.4
0.2
0
−0.2
− 0.4
Fig. 38. CePt5, CePt4Al, CePt3Al2, CePt2Al3. Magnetic field dependence of σ at 16 K [93B2].
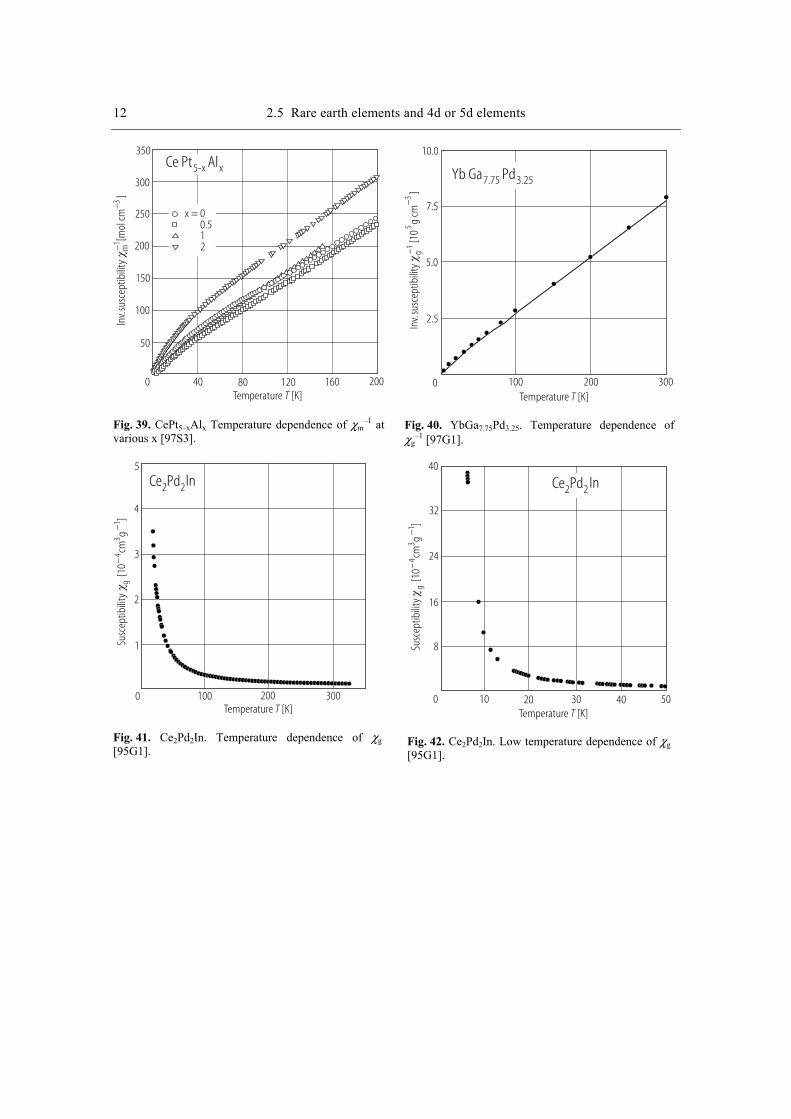
12 2.5 Rare earth elements and 4d or 5d elements
Temperature [K]T
Inv.
susc
eptib
ility
[mol
cm]
m3−
−1
350
300
250
200
150
100
50
0 40 80 120 160 200
Ce Pt Al5-x x
x = 00.512
Fig. 39. CePt5–xAlx Temperature dependence of χm
–1 at various x [97S3].
Temperature [K]T
Inv.
susc
eptib
ility
[10
g cm
]g
53−
−1
Yb Ga Pd7.75 3.25
10.0
7.5
5.0
2.5
0 100 200 300
Fig. 40. YbGa7.75Pd3.25. Temperature dependence of χg
–1 [97G1].
Temperature [K]T
Susc
eptib
ility
[10
cmg
]g
43
1−
−
5
4
3
2
1
0 100 200 300
Ce Pd2 2In
Fig. 41. Ce2Pd2In. Temperature dependence of χg [95G1].
Temperature [K]T
Susc
eptib
ility
[10
cmg
]g
43
1−
−
0
32
16
8
24
40
10 20 30 40 50
Ce Pd2 2In
Fig. 42. Ce2Pd2In. Low temperature dependence of χg [95G1].
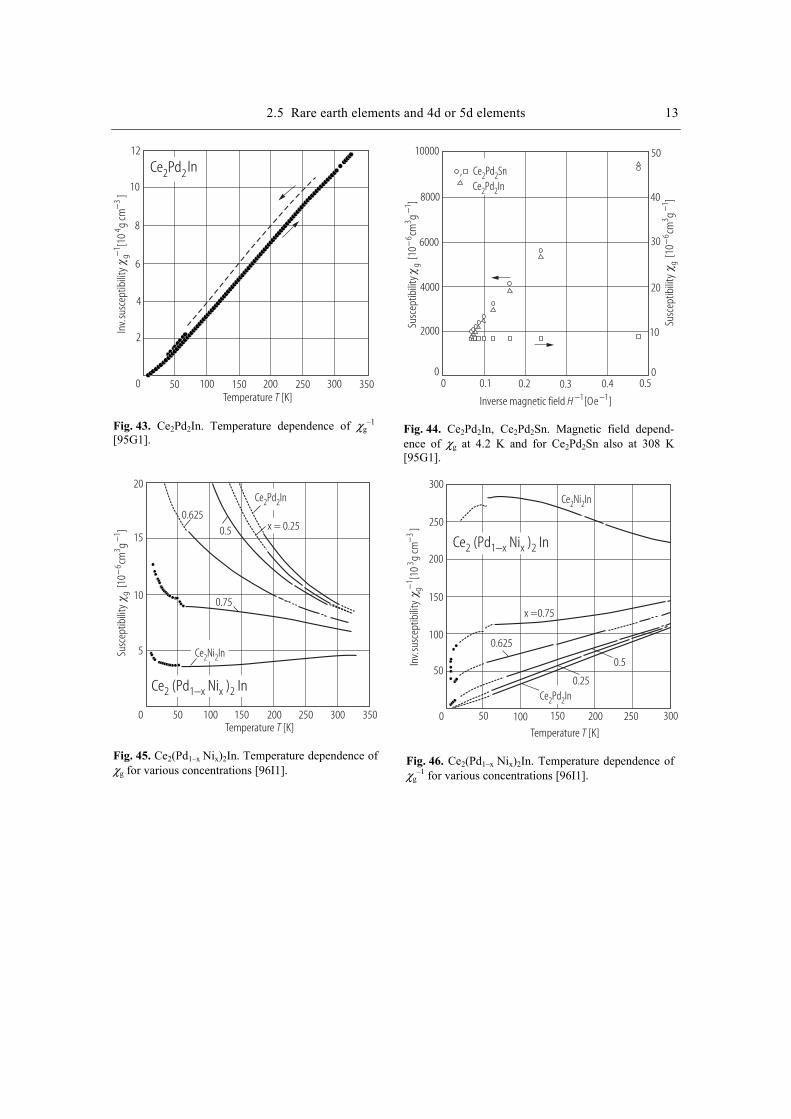
2.5 Rare earth elements and 4d or 5d elements 13
Temperature [K]T
Ce Pd2 2In
Inv.
susc
eptib
ility
[10
g cm
]g
43−
−1
12
10
8
6
4
2
0 100 200 300 35025015050
Fig. 43. Ce2Pd2In. Temperature dependence of χg
–1 [95G1].
Susc
eptib
ility
[10
cmg
]g
63
1−
−
Susc
eptib
ility
[10
cmg
]g
63
1−
−
50
40
30
20
10
00 0.1 0.2 0.3 0.4 0.5
10000
8000
6000
4000
2000
0
, Ce Pd Sn2 2Ce Pd In2 2
Inverse magnetic field [Oe ]H − −1 1
Fig. 44. Ce2Pd2In, Ce2Pd2Sn. Magnetic field depend-ence of χg at 4.2 K and for Ce2Pd2Sn also at 308 K [95G1].
Susc
eptib
ility
[10
cmg
]g
63
1−
−
Ce Ni In2 2
Ce Pd In2 2
Temperature [K]T
20
15
10
5
0 50 100 150 200 250 300 350
Ce (Pd Ni ) In2 1 x x 2−
x = 0.250.5
0.625
0.75
Fig. 45. Ce2(Pd1–x Nix)2In. Temperature dependence of χg for various concentrations [96I1].
Ce Ni In2 2
Ce Pd In2 2
Temperature [K]T
0 50 100 150 200 250 300
Ce (Pd Ni ) In2 1 x x 2−
0.25
0.5
0.625
x =0.75
Inv.
susc
eptib
ility
[10
g cm
]g
33−
−1
300
250
200
150
100
50
Fig. 46. Ce2(Pd1–x Nix)2In. Temperature dependence of χg
–1 for various concentrations [96I1].
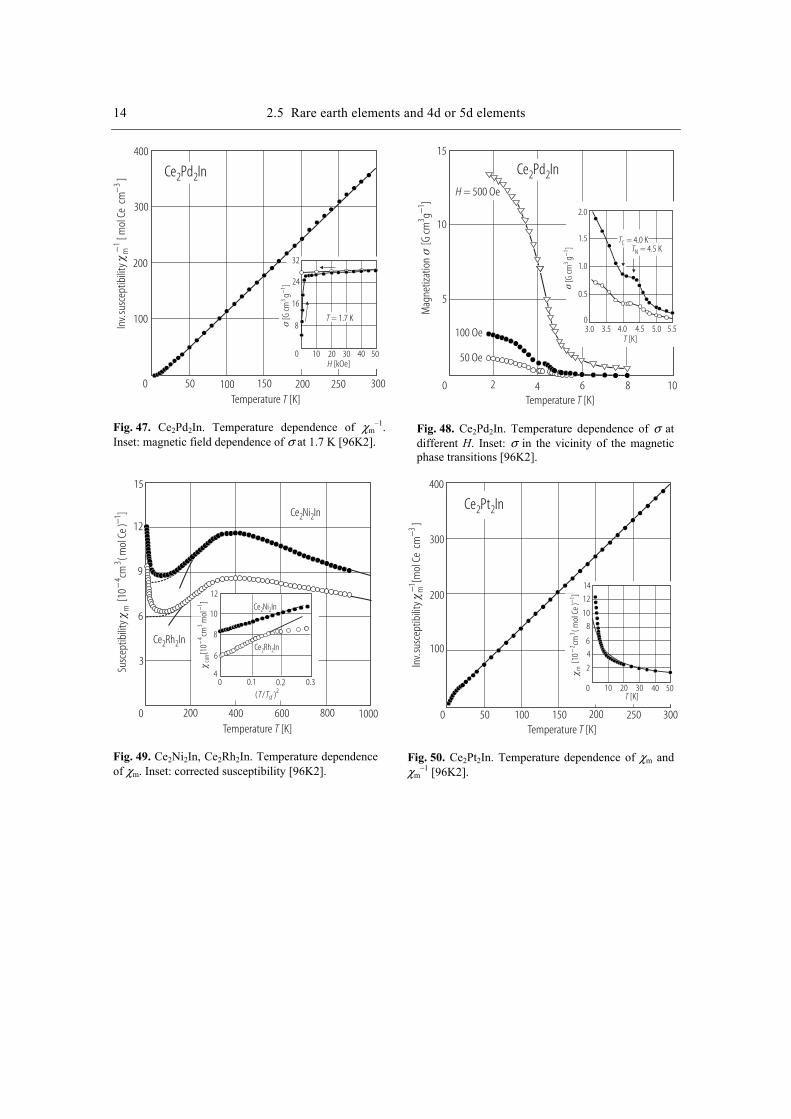
14 2.5 Rare earth elements and 4d or 5d elements
Ce Pd In2 2
Temperature [K]T0 50 100 150 200 250 300
Inv.
susc
eptib
ility
[ mol
Ce
cm]
m3−
−1
300
200
100
400
0 10 20 30 40 50
8
16
24
32
H [kOe]
T = 1.7 K[G cm
g]
31−
Fig. 47. Ce2Pd2In. Temperature dependence of χm
–1. Inset: magnetic field dependence of σ at 1.7 K [96K2].
Ce Pd In2 2
Temperature [K]T
[G cm
g]
31−
Mag
netiz
atio
n
[G cm
g]
31−
15
10
5
0 2 4 6 8 10
H = 500 Oe
100 Oe
50 Oe
2.0
1.5
1.0
0.5
03.0 3.5 4.0 4.5 5.0 5.5
T = 4.5 KN
T = 4.0 KC
[K]T
Fig. 48. Ce2Pd2In. Temperature dependence of σ at different H. Inset: σ in the vicinity of the magnetic phase transitions [96K2].
Ce Rh In2 2
Ce Ni In2 2
Temperature [K]T
Susc
eptib
ility
[10
cm( m
ol C
e )
]m
43
1−
−
15
12
9
6
3
0 200 400 600 800 1000
4
6
8
10
12
0 0.1 0.2 0.3
( / )T Tsf2
[10
cmm
ol]
−−
43
1
Ce Rh In2 2
Ce Ni In2 2
co
rr
Fig. 49. Ce2Ni2In, Ce2Rh2In. Temperature dependence of χm. Inset: corrected susceptibility [96K2].
Ce Pt In2 2
Temperature [K]T
[10
cm(m
olCe
)]
m2
31
−−
Inv.
susc
eptib
ility
[mol
Ce
cm]
m3−
−1
400
300
200
100
0 50 100 150 200 250 300
14
10
6
2
0
4
8
12
10 20 30 40 50T [K]
Fig. 50. Ce2Pt2In. Temperature dependence of χm and χm
–1 [96K2].
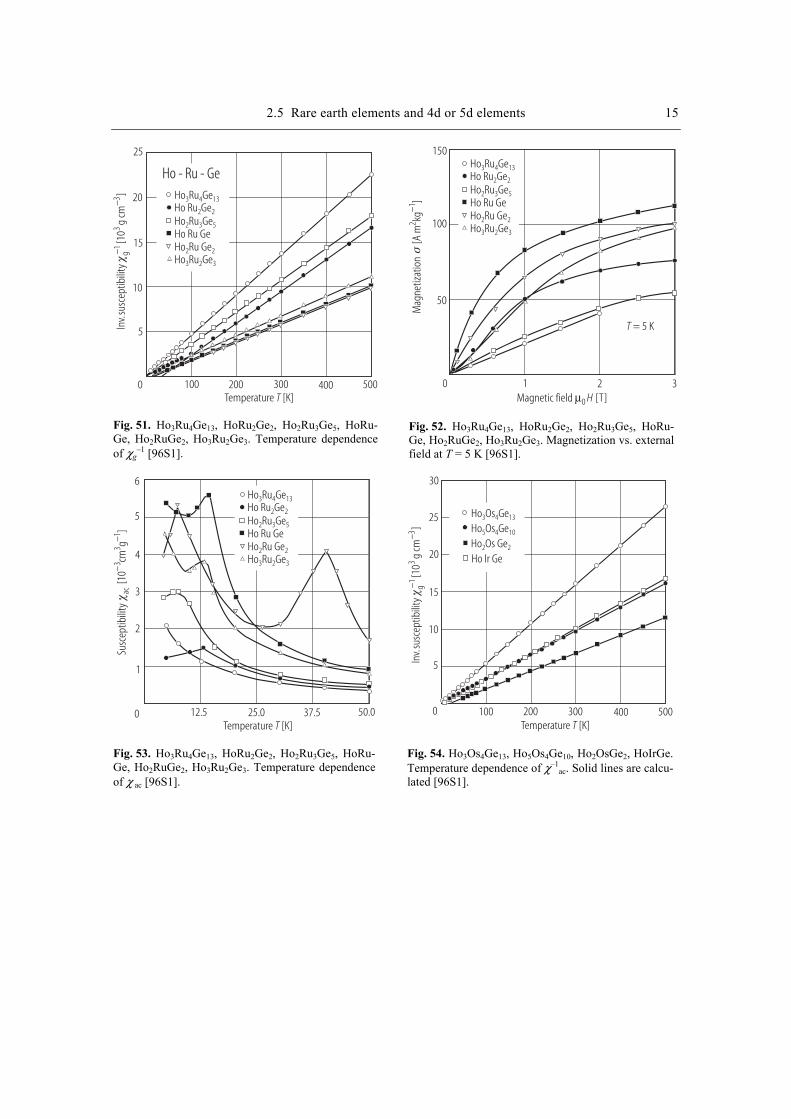
2.5 Rare earth elements and 4d or 5d elements 15
Temperature [K]T0 100 300200 500400
−1In
v.su
scep
tibili
ty[1
0g
cm]
g3
3−
25
20
15
10
5
Ho - Ru - GeHo Ru Ge3 4 13Ho Ru Ge2 2
Ho Ru Ge2 3 5Ho Ru GeHo Ru Ge2 2Ho Ru Ge3 2 3
Fig. 51. Ho3Ru4Ge13, HoRu2Ge2, Ho2Ru3Ge5, HoRu-Ge, Ho2RuGe2, Ho3Ru2Ge3. Temperature dependence of χg
–1 [96S1].
Ho Ru Ge3 4 13Ho Ru Ge2 2
Ho Ru Ge2 3 5Ho Ru GeHo Ru Ge2 2Ho Ru Ge3 2 3
150
100
50
0 1 2 3Magnetic field [T]µ0 H
Mag
netiz
atio
n
[A m
kg]
21−
T = 5 K
Fig. 52. Ho3Ru4Ge13, HoRu2Ge2, Ho2Ru3Ge5, HoRu-Ge, Ho2RuGe2, Ho3Ru2Ge3. Magnetization vs. external field at T = 5 K [96S1].
Temperature [K]T
Susc
eptib
ility
[10
cmg
]ac
33
1−
−
Ho Ru Ge3 4 13Ho Ru Ge2 2
Ho Ru Ge2 3 5Ho Ru GeHo Ru Ge2 2Ho Ru Ge3 2 3
0 12.5 25.0 37.5 50.0
6
5
4
3
2
1
Fig. 53. Ho3Ru4Ge13, HoRu2Ge2, Ho2Ru3Ge5, HoRu-Ge, Ho2RuGe2, Ho3Ru2Ge3. Temperature dependence of χ
ac [96S1].
0
−1In
v.su
scep
tibili
ty[1
0g
cm]
g3
3−
25
20
15
10
5
Temperature [K]T100 300200 500400
30
Ho Os Ge3 4 13
Ho Os Ge5 4 10
Ho Ir GeHo Os Ge2 2
Fig. 54. Ho3Os4Ge13, Ho5Os4Ge10, Ho2OsGe2, HoIrGe. Temperature dependence of χ–1
ac. Solid lines are calcu-lated [96S1].
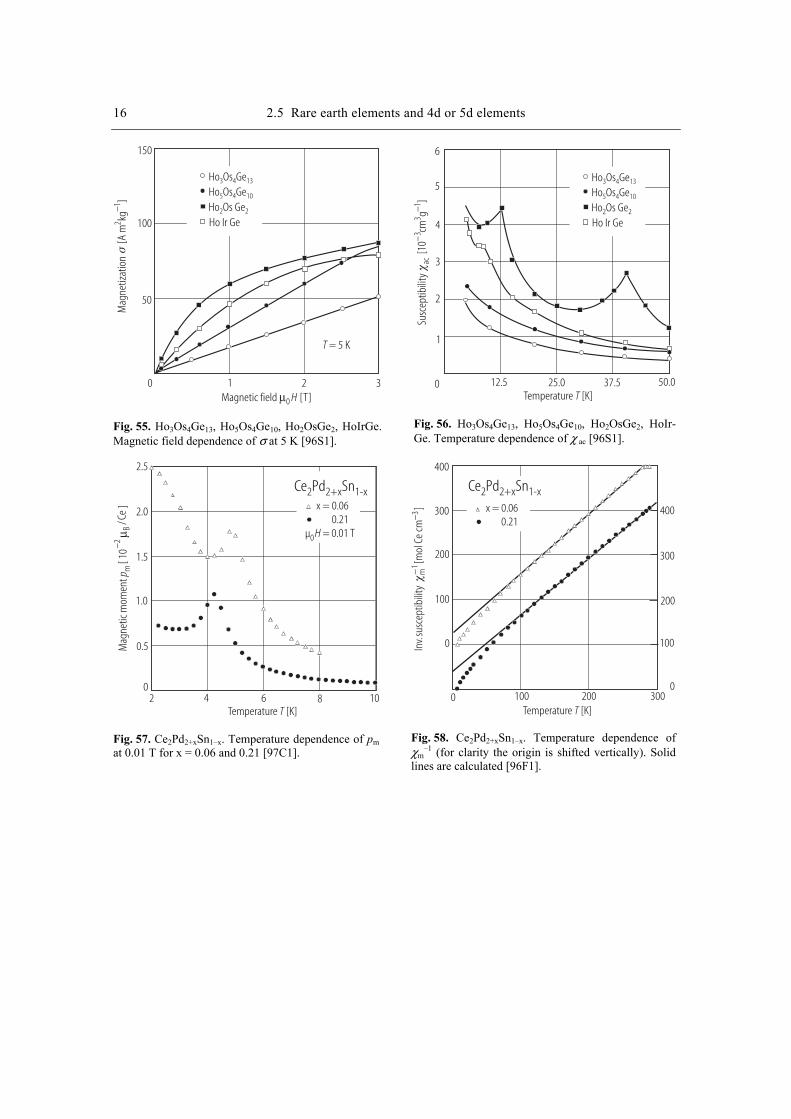
16 2.5 Rare earth elements and 4d or 5d elements
150
100
50
0 1 2 3Magnetic field [T]µ0 H
Mag
netiz
atio
n
[A m
kg]
21−
T = 5 K
Ho Os Ge3 4 13
Ho Os Ge5 4 10
Ho Ir GeHo Os Ge2 2
Fig. 55. Ho3Os4Ge13, Ho5Os4Ge10, Ho2OsGe2, HoIrGe. Magnetic field dependence of σ at 5 K [96S1].
Temperature [K]T
Susc
eptib
ility
[10
cmg
]ac
33
1−
−
0 12.5 25.0 37.5 50.0
6
5
4
3
2
1
Ho Os Ge3 4 13
Ho Os Ge5 4 10
Ho Ir GeHo Os Ge2 2
Fig. 56. Ho3Os4Ge13, Ho5Os4Ge10, Ho2OsGe2, HoIr-Ge. Temperature dependence of χ
ac [96S1].
Temperature [K]T
µ 0.01 T0H =
Ce Pd Sn2 2+x 1-x
Mag
netic
mom
ent
[ 10
]p m
2B
−µ
/Ce x = 0.06
0.21
2.5
2.0
1.5
1.0
0.5
02 4 6 8 10
Fig. 57. Ce2Pd2+xSn1–x. Temperature dependence of pm at 0.01 T for x = 0.06 and 0.21 [97C1].
Temperature [K]T
Ce Pd Sn2 2+x 1-x
x = 0.060.21
Inv.
susc
eptib
ility
[mol
Ce
cm]
−−3
1m
400
300
200
100
0
0
100
200
300
400
0 100 200 300
Fig. 58. Ce2Pd2+xSn1–x. Temperature dependence of χm
–1 (for clarity the origin is shifted vertically). Solid lines are calculated [96F1].
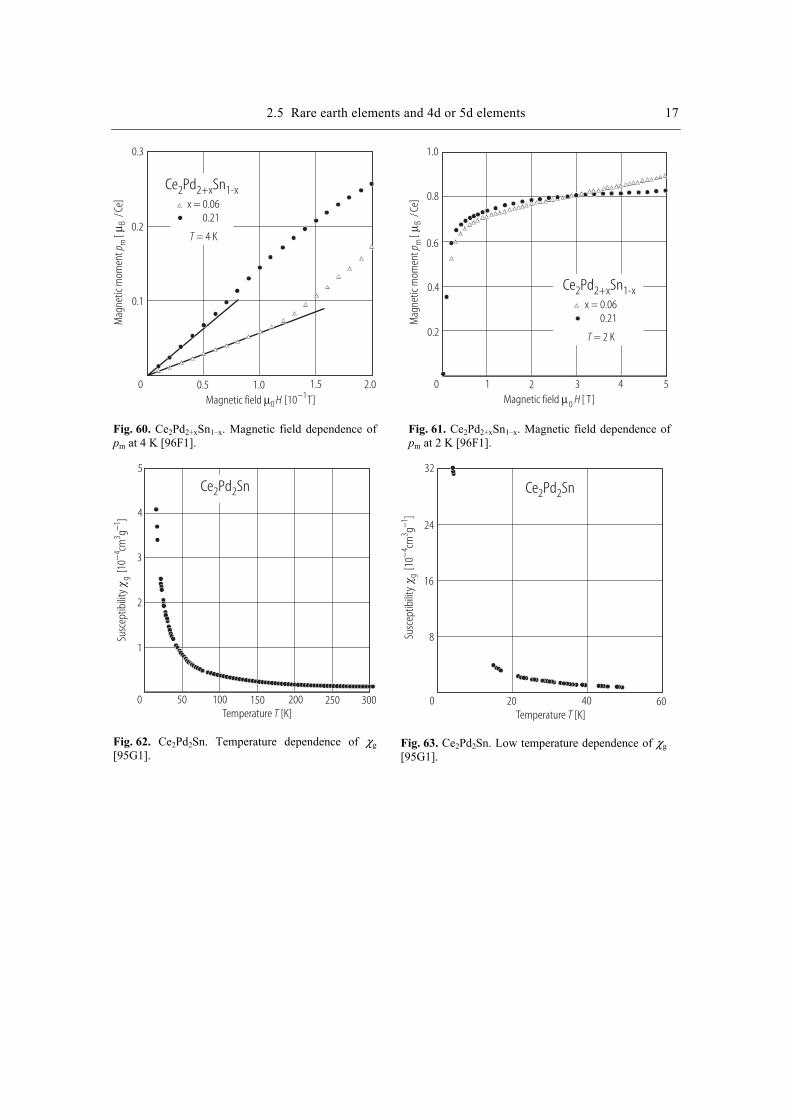
2.5 Rare earth elements and 4d or 5d elements 17 M
agne
tic m
omen
t[
]p m
Bµ/C
e
Magnetic field [10 T]µ01H −
Ce Pd Sn2 2+x 1-xx = 0.06
0.21
= 4 KT
0.3
0.2
0.1
0 0.5 1.0 1.5 2.0
Fig. 60. Ce2Pd2+xSn1–x. Magnetic field dependence of pm at 4 K [96F1].
Mag
netic
mom
ent
[]
p mBµ
/Ce
Magnetic field [ T]µ0 H
Ce Pd Sn2 2+x 1-xx = 0.06
0.21
= 2 KT
0 1 2 3 4 5
0.2
0.4
0.6
0.8
1.0
Fig. 61. Ce2Pd2+xSn1–x. Magnetic field dependence of pm at 2 K [96F1].
Temperature [K]T
Susc
eptib
ility
[10
cmg
]g
43
1−
−
0
5
4
3
2
1
Ce Pd Sn2 2
100 200 30050 150 250
Fig. 62. Ce2Pd2Sn. Temperature dependence of χg [95G1].
Temperature [K]T
Susc
eptib
ility
[10
cmg
]g
43
1−
−
Ce Pd Sn2 2
32
16
0 20 40 60
8
24
Fig. 63. Ce2Pd2Sn. Low temperature dependence of χg [95G1].
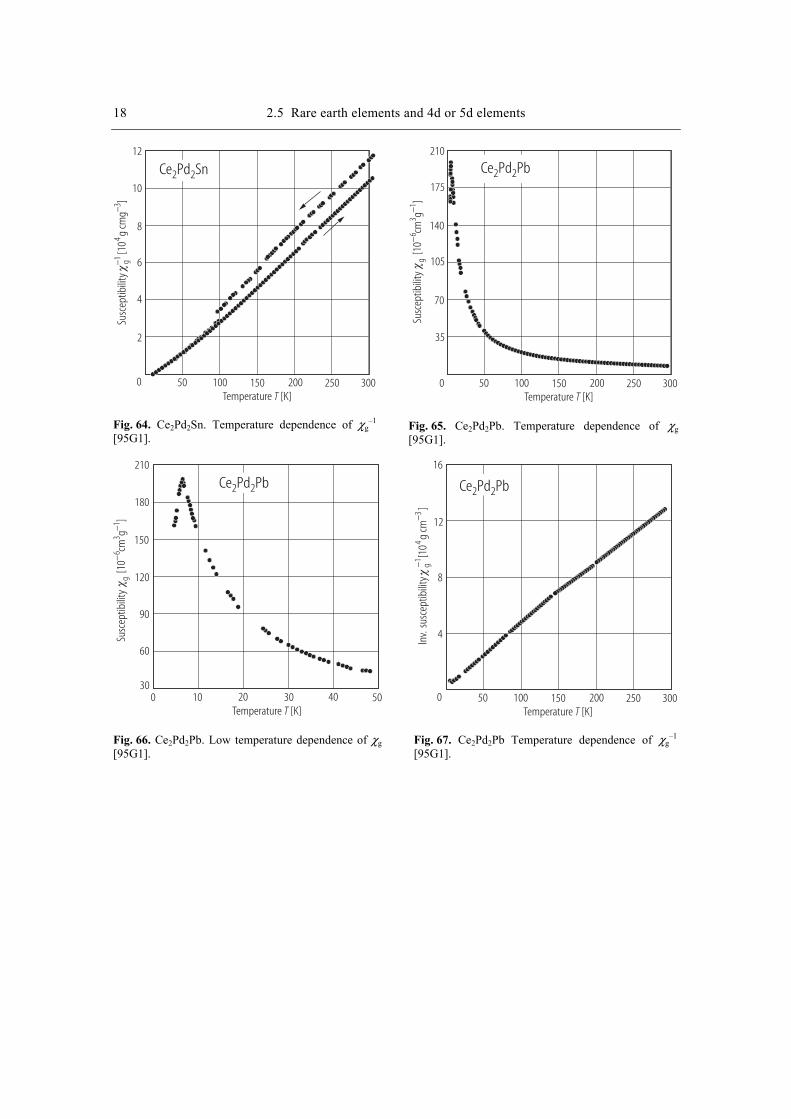
18 2.5 Rare earth elements and 4d or 5d elements
Temperature [K]T0 100 200 30050 150 250
Ce Pd Sn2 2
Susc
eptib
ility
[10
g cm
g]
g4
3−−1
12
10
8
6
4
2
Fig. 64. Ce2Pd2Sn. Temperature dependence of χg
–1 [95G1].
Temperature [K]T
Susc
eptib
ility
[10
cmg
]g
63
1−
−
0 100 200 30050 150 250
Ce Pd Pb2 2
210
140
70
35
105
175
Fig. 65. Ce2Pd2Pb. Temperature dependence of χg [95G1].
Temperature [K]T
Susc
eptib
ility
[10
cmg
]g
63
1−
−
Ce Pd Pb2 2
210
150
90
60
30
120
180
0 10 20 30 40 50
Fig. 66. Ce2Pd2Pb. Low temperature dependence of χg [95G1].
Temperature [K]T0 100 200 30050 150 250
Inv.
susc
eptib
ility
[10
g cm
]g
43−
−1
12
8
4
Ce Pd Pb2 2
16
Fig. 67. Ce2Pd2Pb Temperature dependence of χg
–1 [95G1].
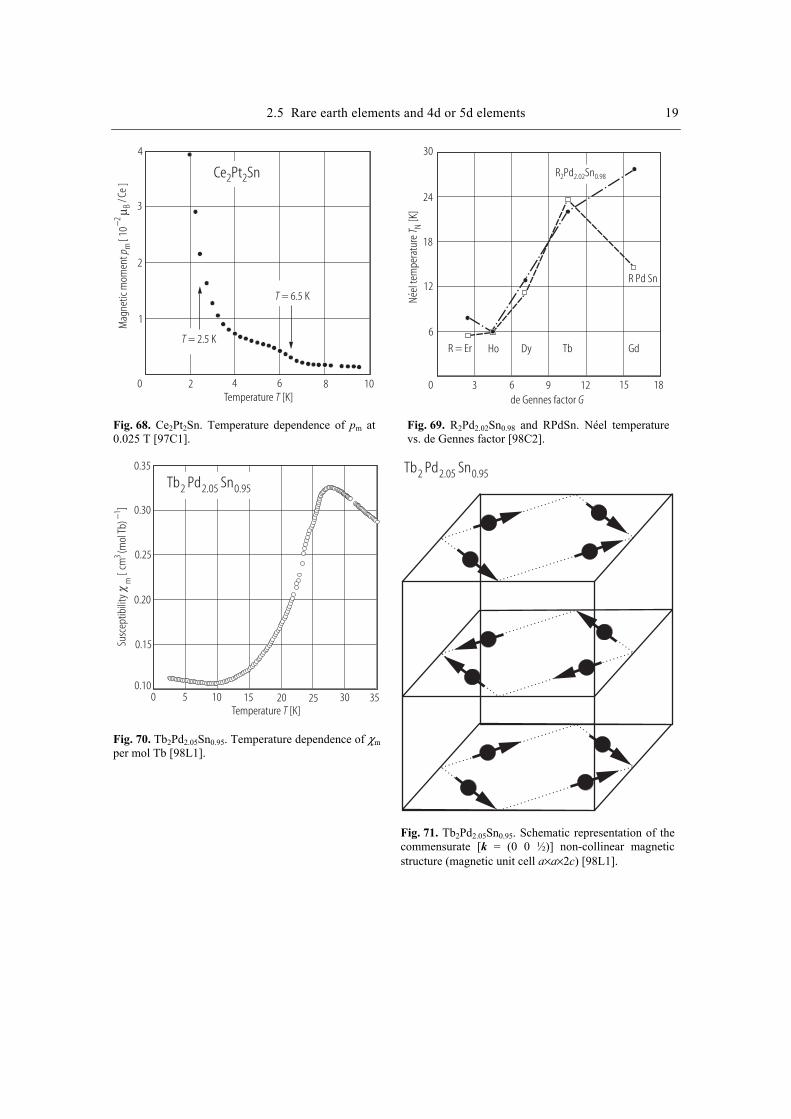
2.5 Rare earth elements and 4d or 5d elements 19
Temperature [K]T0
Mag
netic
mom
ent
[ 10
]p m
2B
−µ
/Ce
Ce Pt Sn2 2
4
3
2
1
2 4 6 8 10
T = 2.5 K
T = 6.5 K
Fig. 68. Ce2Pt2Sn. Temperature dependence of pm at 0.025 T [97C1].
R Pd Sn
R Pd Sn2 2.02 0.98
R = Er Ho Dy Tb Gd
0 3 6 9 12 15 18de Gennes factor G
30
6
12
18
24
Neel
tem
pera
ture
[K]
T N´
Fig. 69. R2Pd2.02Sn0.98 and RPdSn. Néel temperature vs. de Gennes factor [98C2].
Temperature [K]T
Susc
eptib
ility
[ cm
(mol
Tb)
]m
31−
0.35
0.30
0.25
0.20
0.15
0.100 5 10 15 20 25 30 35
Tb Pd Sn2 2.05 0.95
Fig. 70. Tb2Pd2.05Sn0.95. Temperature dependence of χm per mol Tb [98L1].
Tb Pd Sn2 2.05 0.95
Fig. 71. Tb2Pd2.05Sn0.95. Schematic representation of the commensurate [k = (0 0 ½)] non-collinear magnetic structure (magnetic unit cell a×a×2c) [98L1].
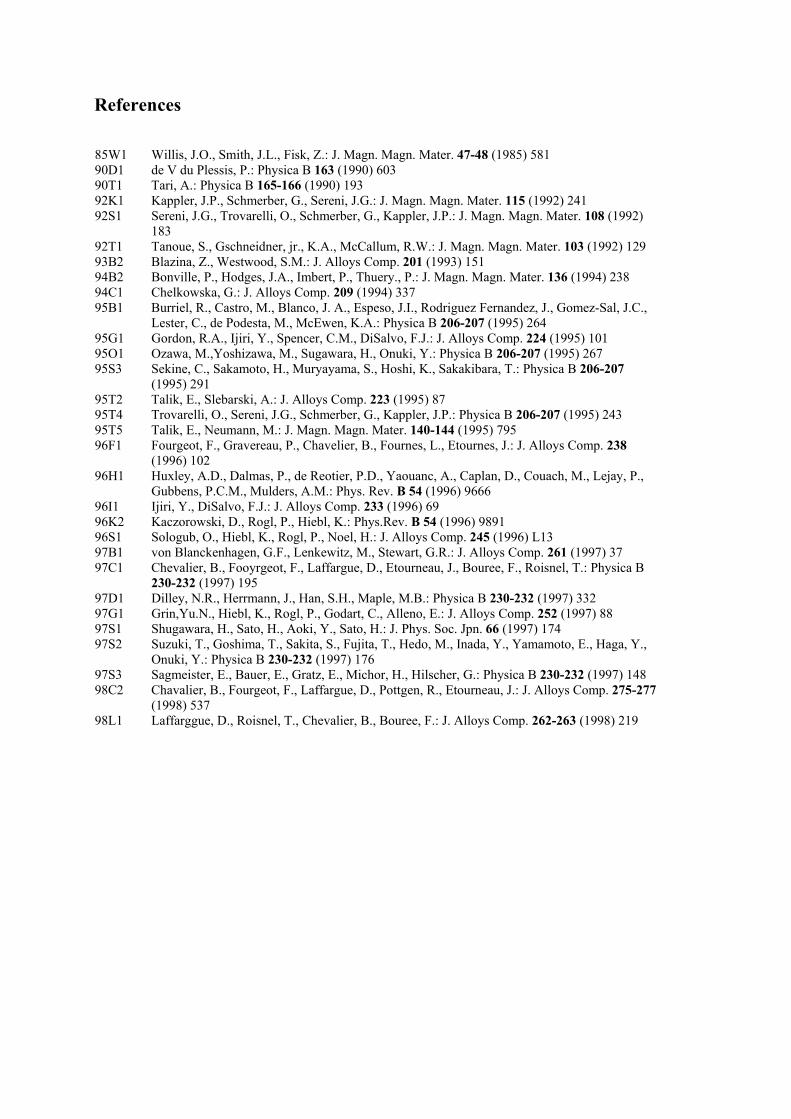
References
85W1 Willis, J.O., Smith, J.L., Fisk, Z.: J. Magn. Magn. Mater. 47-48 (1985) 581 90D1 de V du Plessis, P.: Physica B 163 (1990) 603 90T1 Tari, A.: Physica B 165-166 (1990) 193 92K1 Kappler, J.P., Schmerber, G., Sereni, J.G.: J. Magn. Magn. Mater. 115 (1992) 241 92S1 Sereni, J.G., Trovarelli, O., Schmerber, G., Kappler, J.P.: J. Magn. Magn. Mater. 108 (1992)
183 92T1 Tanoue, S., Gschneidner, jr., K.A., McCallum, R.W.: J. Magn. Magn. Mater. 103 (1992) 129 93B2 Blazina, Z., Westwood, S.M.: J. Alloys Comp. 201 (1993) 151 94B2 Bonville, P., Hodges, J.A., Imbert, P., Thuery., P.: J. Magn. Magn. Mater. 136 (1994) 238 94C1 Chelkowska, G.: J. Alloys Comp. 209 (1994) 337 95B1 Burriel, R., Castro, M., Blanco, J. A., Espeso, J.I., Rodriguez Fernandez, J., Gomez-Sal, J.C.,
Lester, C., de Podesta, M., McEwen, K.A.: Physica B 206-207 (1995) 264 95G1 Gordon, R.A., Ijiri, Y., Spencer, C.M., DiSalvo, F.J.: J. Alloys Comp. 224 (1995) 101 95O1 Ozawa, M.,Yoshizawa, M., Sugawara, H., Onuki, Y.: Physica B 206-207 (1995) 267 95S3 Sekine, C., Sakamoto, H., Muryayama, S., Hoshi, K., Sakakibara, T.: Physica B 206-207
(1995) 291 95T2 Talik, E., Slebarski, A.: J. Alloys Comp. 223 (1995) 87 95T4 Trovarelli, O., Sereni, J.G., Schmerber, G., Kappler, J.P.: Physica B 206-207 (1995) 243 95T5 Talik, E., Neumann, M.: J. Magn. Magn. Mater. 140-144 (1995) 795 96F1 Fourgeot, F., Gravereau, P., Chavelier, B., Fournes, L., Etournes, J.: J. Alloys Comp. 238
(1996) 102 96H1 Huxley, A.D., Dalmas, P., de Reotier, P.D., Yaouanc, A., Caplan, D., Couach, M., Lejay, P.,
Gubbens, P.C.M., Mulders, A.M.: Phys. Rev. B 54 (1996) 9666 96I1 Ijiri, Y., DiSalvo, F.J.: J. Alloys Comp. 233 (1996) 69 96K2 Kaczorowski, D., Rogl, P., Hiebl, K.: Phys.Rev. B 54 (1996) 9891 96S1 Sologub, O., Hiebl, K., Rogl, P., Noel, H.: J. Alloys Comp. 245 (1996) L13 97B1 von Blanckenhagen, G.F., Lenkewitz, M., Stewart, G.R.: J. Alloys Comp. 261 (1997) 37 97C1 Chevalier, B., Fooyrgeot, F., Laffargue, D., Etourneau, J., Bouree, F., Roisnel, T.: Physica B
230-232 (1997) 195 97D1 Dilley, N.R., Herrmann, J., Han, S.H., Maple, M.B.: Physica B 230-232 (1997) 332 97G1 Grin,Yu.N., Hiebl, K., Rogl, P., Godart, C., Alleno, E.: J. Alloys Comp. 252 (1997) 88 97S1 Shugawara, H., Sato, H., Aoki, Y., Sato, H.: J. Phys. Soc. Jpn. 66 (1997) 174 97S2 Suzuki, T., Goshima, T., Sakita, S., Fujita, T., Hedo, M., Inada, Y., Yamamoto, E., Haga, Y.,
Onuki, Y.: Physica B 230-232 (1997) 176 97S3 Sagmeister, E., Bauer, E., Gratz, E., Michor, H., Hilscher, G.: Physica B 230-232 (1997) 148 98C2 Chavalier, B., Fourgeot, F., Laffargue, D., Pottgen, R., Etourneau, J.: J. Alloys Comp. 275-277
(1998) 537 98L1 Laffarggue, D., Roisnel, T., Chevalier, B., Bouree, F.: J. Alloys Comp. 262-263 (1998) 219
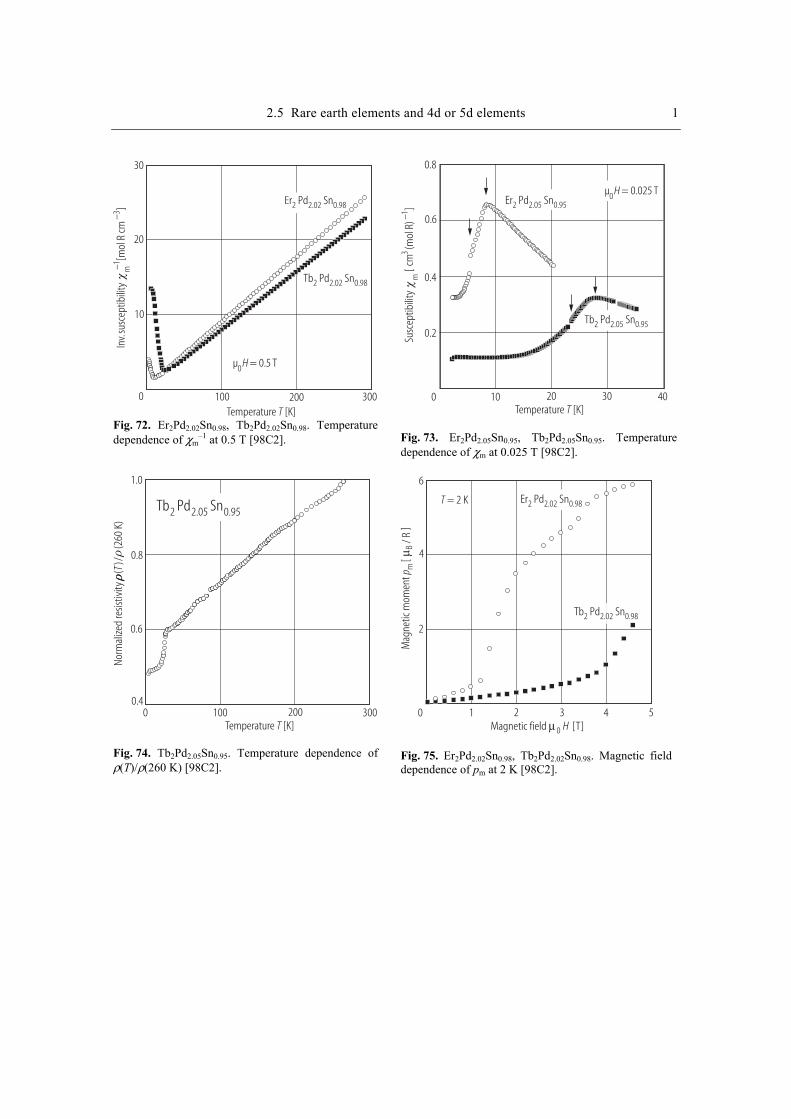
2.5 Rare earth elements and 4d or 5d elements 1
Temperature [K]T
µ = 0.5 T0H
Inv.
susc
eptib
ility
[ mol
R cm
]m
3−−1
30
20
10
0 100 200 300
Tb Pd Sn2 2.02 0.98
Er Pd Sn2 2.02 0.98
Fig. 72. Er2Pd2.02Sn0.98, Tb2Pd2.02Sn0.98. Temperature dependence of χm
–1 at 0.5 T [98C2].
Temperature [K]T
Er Pd Sn2 2.05 0.95
Susc
eptib
ility
[ cm
(mol
R)
]m
31−
µ = 0.025 T0H
Tb Pd Sn2 2.05 0.95
0.8
0.6
0.4
0.2
0 10 20 30 40
Fig. 73. Er2Pd2.05Sn0.95, Tb2Pd2.05Sn0.95. Temperature dependence of χm at 0.025 T [98C2].
Temperature [K]T
Norm
alize
d re
sistiv
ity
()/
(260
K)
T
Tb Pd Sn2 2.05 0.95
1.0
0.8
0.6
0.40 100 200 300
Fig. 74. Tb2Pd2.05Sn0.95. Temperature dependence of ρ(T)/ρ(260 K) [98C2].
Mag
netic
mom
ent
[]
p mBµ
/ R
Magnetic field [T]µ0 H
Er Pd Sn2 2.02 0.98
Tb Pd Sn2 2.02 0.98
T = 2 K
6
4
2
0 1 2 3 4 5
Fig. 75. Er2Pd2.02Sn0.98, Tb2Pd2.02Sn0.98. Magnetic field dependence of pm at 2 K [98C2].
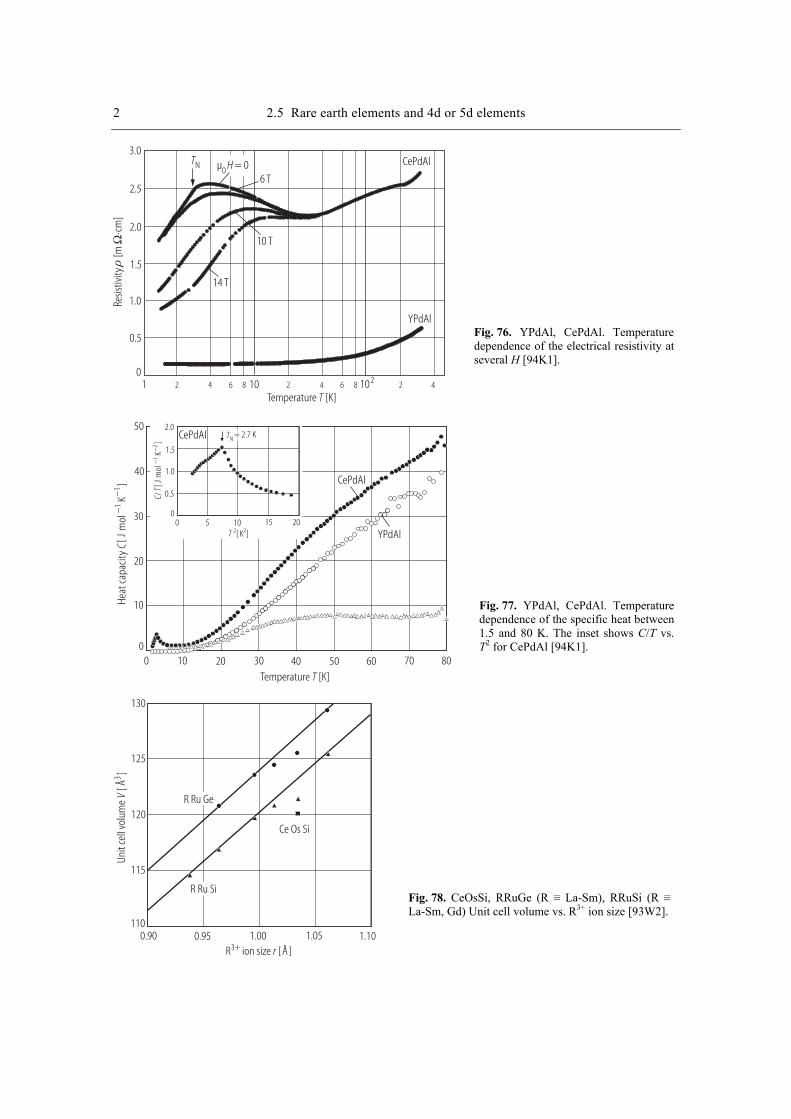
2 2.5 Rare earth elements and 4d or 5d elements
Temperature [K]T
TN
6 T
10 T
14 T
YPdAl
CePdAlµ = 00 H3.0
2.5
2.0
1.5
1.0
0.5
01 10 102
Resis
tivity
[m
cm]
Ω⋅
2 4 6 8 2 4 6 8 2 4
Fig. 76. YPdAl, CePdAl. Temperature dependence of the electrical resistivity at several H [94K1].
YPdAl
CePdAl
Temperature [K]T
Heat
capa
city
[ Jm
olK
]C
−−
11
50
40
30
20
10
00 10 20 30 40 50 60 70 80
TN = 2.7 KCePdAl2.0
1.5
1.0
0.5
00 5 10 15 20
[ K ]T 2 2
CT/
[ Jm
olK
]−
−1
2
Fig. 77. YPdAl, CePdAl. Temperature dependence of the specific heat between 1.5 and 80 K. The inset shows C/T vs. T2 for CePdAl [94K1].
130
125
120
115
1100.90 0.95 1.00 1.05 1.10
Ce Os Si
R ion size [Å ]3+ r
Unit
cell
volu
me
[ Å]
V3
R Ru Si
R Ru Ge
Fig. 78. CeOsSi, RRuGe (R ≡ La-Sm), RRuSi (R ≡ La-Sm, Gd) Unit cell volume vs. R3+ ion size [93W2].
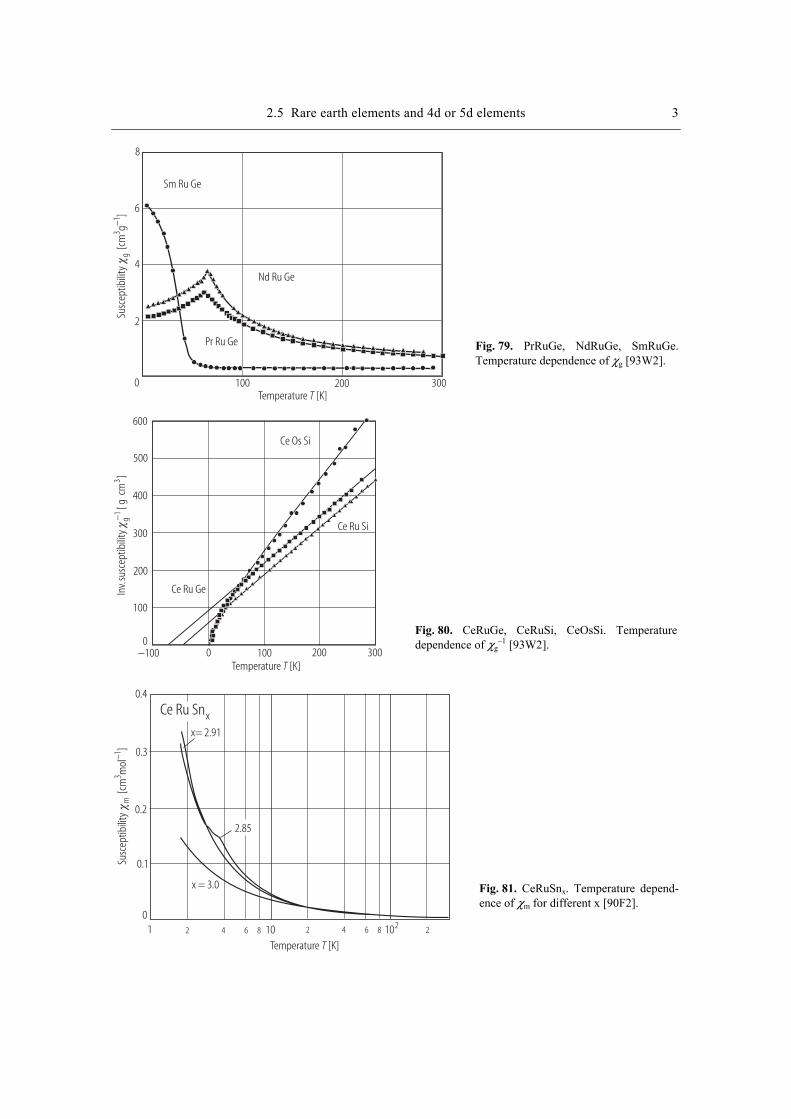
2.5 Rare earth elements and 4d or 5d elements 3
Temperature [K]T
Susc
eptib
ility
[cm
g]
g3
1−
8
6
4
2
0 100 200 300
Sm Ru Ge
Nd Ru Ge
Pr Ru Ge
Fig. 79. PrRuGe, NdRuGe, SmRuGe. Temperature dependence of χg [93W2].
Temperature [K]T100 200 300
−1In
v.su
scep
tibili
ty[ g
cm
]g
3
0−100
600
500
400
300
200
100
0
Ce Os Si
Ce Ru Ge
Ce Ru Si
Fig. 80. CeRuGe, CeRuSi, CeOsSi. Temperature dependence of χg
–1 [93W2].
Temperature [K]T
Susc
eptib
ility
[cm
mol
]m
31−
0.4
0.3
0.2
0.1
01 10 102
2 4 6 8 2 4 6 8 2
Ce Ru Snx
x= 2.91
2.85
x = 3.0
Fig. 81. CeRuSnx. Temperature depend-ence of χm for different x [90F2].
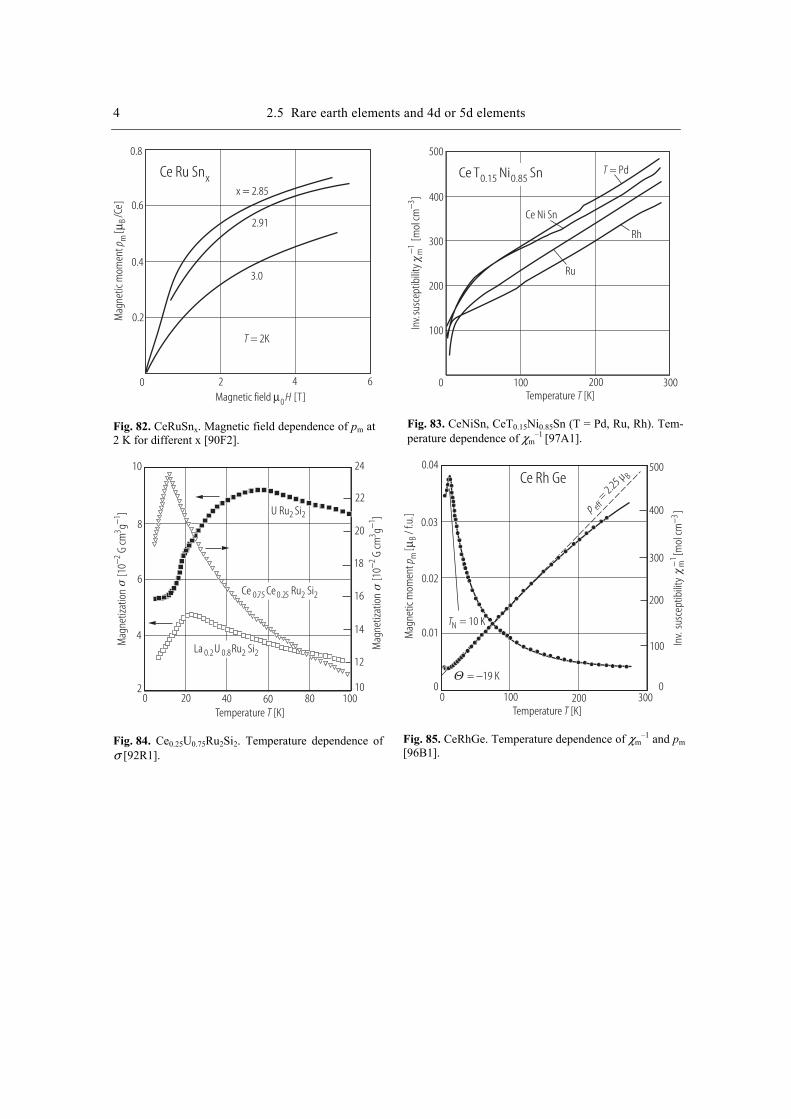
4 2.5 Rare earth elements and 4d or 5d elements
Ce Ru Snxx = 2.85
2.91
3.0
0.8
0.6
0.4
0.2
0 2 4 6Magnetic field [T]µ0 H
Mag
netic
mom
ent
[]
p mBµ
/Ce
T = 2K
Fig. 82. CeRuSnx. Magnetic field dependence of pm at 2 K for different x [90F2].
Temperature [K]T0 100 200 300
500
400
300
200
100
T = PdCe T Ni Sn0.15 0.85
Inv.
susc
eptib
ility
[ mol
cm]
m3−
−1
Rh
Ru
Ce Ni Sn
Fig. 83. CeNiSn, CeT0.15Ni0.85Sn (T = Pd, Ru, Rh). Tem-perature dependence of χm
–1 [97A1].
Temperature [K]T
Mag
netiz
atio
n
[10
G cm
g]
−−
23
1
Mag
netiz
atio
n
[10
G cm
g]
−−
23
1
10
8
6
4
20 20 40 60 80 100
24
22
20
18
16
14
12
10
U Ru Si2 2
Ce Ce Ru Si0.75 0.25 2 2
La U Ru Si0.2 0.8 2 2
Fig. 84. Ce0.25U0.75Ru2Si2. Temperature dependence of σ [92R1].
Temperature [K]T
Inv.
susc
eptib
ility
[mol
cm]
−−3
1m
T = 10 KN
Mag
netic
mom
ent
[]
p mBµ
/ f.u
.
0 100 200 300
0.04
0.03
0.02
0.01
0
500
400
300
200
100
0
Ce Rh Ge
= 19 K−
p= 2.25 µ
eff
B
Fig. 85. CeRhGe. Temperature dependence of χm
–1 and pm [96B1].
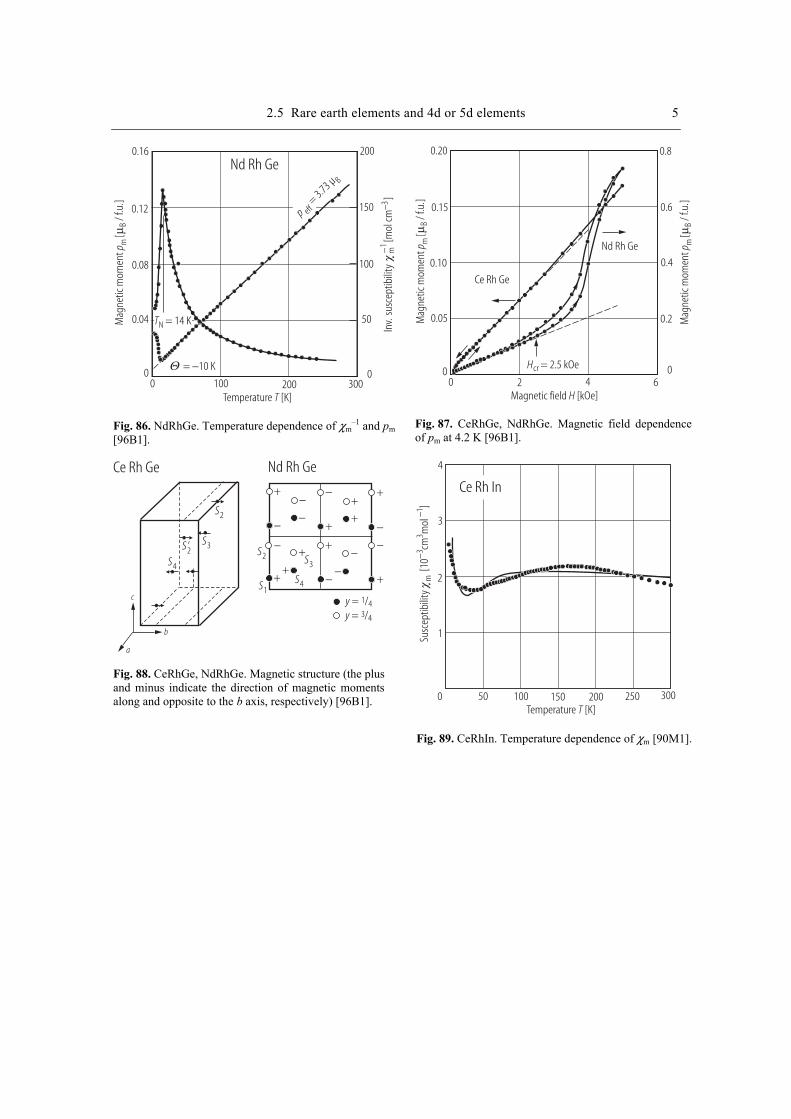
2.5 Rare earth elements and 4d or 5d elements 5
Temperature [K]TIn
v.su
scep
tibili
ty[m
ol cm
]−
−31
m
Mag
netic
mom
ent
[]
p mBµ
/ f.u
.
0 100 200 300
0.16
0.12
0.08
0.04
0
200
150
100
50
0
Nd Rh Ge
= 10 K−
T = 14 KN
p= 3.73 µ
eff
B
Fig. 86. NdRhGe. Temperature dependence of χm
–1 and pm [96B1].
Mag
netic
mom
ent
[]
p mBµ
/ f.u
.
Mag
netic
mom
ent
[]
p mBµ
/ f.u
.
Magnetic field [kOe]H
0.20
0.15
0.10
0.05
00 2 4 6
0.8
0.6
0.4
0.2
0
Ce Rh Ge
Nd Rh Ge
Hcr = 2.5 kOe
Fig. 87. CeRhGe, NdRhGe. Magnetic field dependence of pm at 4.2 K [96B1].
Ce Rh Ge Nd Rh Ge
c
b
a
+−
−
−−
−−
−−
−−
+
+
+
++
++ +
+
S2
S3
S3S4
S4
S2
S1
S’2
y = /1 4
y = /3 4
Fig. 88. CeRhGe, NdRhGe. Magnetic structure (the plus and minus indicate the direction of magnetic moments along and opposite to the b axis, respectively) [96B1].
Temperature [K]T
Susc
eptib
ility
[10
cmm
ol]
m3
31
−−
4
3
2
1
0 50 100 150 200 250 300
Ce Rh In
Fig. 89. CeRhIn. Temperature dependence of χm [90M1].
6 2.5 Rare earth elements and 4d or 5d elements
Temperature [K]T
Susc
eptib
ility
[10
mm
ol]
m9
31
−−
0 100 200 300
200
150
100
50
Ce Rh Pd In1-x x
Ce Pd Inx = 0.95
0.900.850.800.600.400.20
Ce Rh In
Fig. 90. CeRh1–xPdxIn. Temperature dependence of χm. The lines are guide of eyes [93B1].
Temperature [K]T0 100 200 300
Ce Rh Pd In1-x x
Ce Pd In
x = 0.20.40.60.8
Ce Rh In
Inv.
susc
eptib
ility
[10
mol
m]
m6
3−−1
50
40
30
20
10
Fig. 91. CeRh1–xPdxIn. Temperature dependence of χm
–1 at several x [93B1].
2.5 Rare earth elements and 4d or 5d elements 7
Ce Pd Inx = 0.95
0.900.850.800.600.400.20
Ce Rh In
Ce Rh Pd In1-x x
Magnetic field [T]µ0 H
Mag
netic
mom
ent
[]
p mBµ
/ f.u
.
1.2
1.0
0.8
0.6
0.4
0.2
0 10 20 30 40
Fig. 92. CeRh1–xPdxIn. Magnetic field dependence of pm at several x [93B1].
x = 0.95
0.90
0.85
0.80
0.60
Ce Rh Pd In1-x x
Ce Pd In
Magnetic field [T]µ0 H
Mag
netic
mom
ent
[]
p mBµ
/ f.u
.
1.2
0.8
0.4
0
0
0
0
0
0 10 20 30 40
Fig. 93. CeRh1–xPdxIn. Magnetic field dependence of pm with increasing Pd concentration on powder free to be oriented in the field (triangles), and on powder fixed in random orientation by frozen alcohol (circles) [93B1].
8 2.5 Rare earth elements and 4d or 5d elements
Temperature [K]T
Heat
capa
city
/[J
mol
K]
CT
p−
−1
2
Ce Pd Inx = 0.95
0.900.850.800.600.400.20
Ce Rh In
Ce Rh Pd In1-x x
2.0
1.5
1.0
0.5
0 1 2 3 4 5
Fig. 94. CeRh1–xPdxIn. Specific heat capacity Cp/T vs. T at low temperature [93B1].
Temperature [K]T
Ce Rh Pd In1-x x
1.3
1.2
1.1
1.0
0.9
0.8
0.70 1 2 3 4
Norm
alize
d re
sistiv
ity
()/
(300
K)
T
0.95
0.90
0.80
0.85x = 0.80
Ce Rh In
Fig. 95. CePdxRh1–xIn. Temperature dependence of the electrical resistivity for x ≥ 0.6 normalized to the room temperature value [93B1].
Temperature [K]T
Inv.
susc
eptib
ility
[mol
cm]
−−3
1m
Inv.
susc
eptib
ility
[mol
cm]
−−3
1m
Nd Rh Sn
Pr Rh Sn
Ce Rh Sn
H = 1 kOe
70
60
50
40
30
20
10
00 40 80 120
0
160
120
80
40
160
Fig. 96. CeRhSn, PrRhSn, NdRhSn. Temperature de-pendence of χm
–1 at 1 kOe [92R2].
2.5 Rare earth elements and 4d or 5d elements 9
Magnetic field [kOe]H
12
10
8
6
4
2
00 4 8 12 16 20
200
160
120
80
40
0
Mag
netiz
atio
n
[10
G cm
mol
]−
−3
31
m
Mag
netiz
atio
n
[10
G cm
mol
]−
−3
31
m
Ce Rh SnPr Rh SnNd Rh Sn
T = 4.6 K
T = 103 K
T = 30 K
×110−
Fig. 97. CeRhSn, PrRhSn, NdRhSn. Magnetic field dependence of σm at different temperatures [92R2].
Temperature [K]T
Inv.
susc
eptib
ility
[ mol
cm
]m
3−−1
0 100 200 300
300
250
200
150
100
50
50 150 250
Ce Pd Ga
Fig. 98. CePdGa. Temperature dependence of χm
–1 [94A3].
Temperature [K]T
Inv.
susc
eptib
ility
[ mol
cm
]m
3−−1
0 100 200 30050 150 250 350
6
4
2
Ce Pd In
a
c
Fig. 99. CePdIn. Temperature dependence of χm
–1 along a and c axes [90F1].
Temperature [K]T
Susc
eptib
ility
(rela
tive)
m
Susc
eptib
ility
(rela
tive)
m
Ce Pd In
a
c8.3
8.2
8.1
1.50 1.75 2.00 2.25 2.50
9.8
9.7
9.6
Fig. 100. CePdIn. Low temperature dependence of χm
along the a and c axes [90F1].
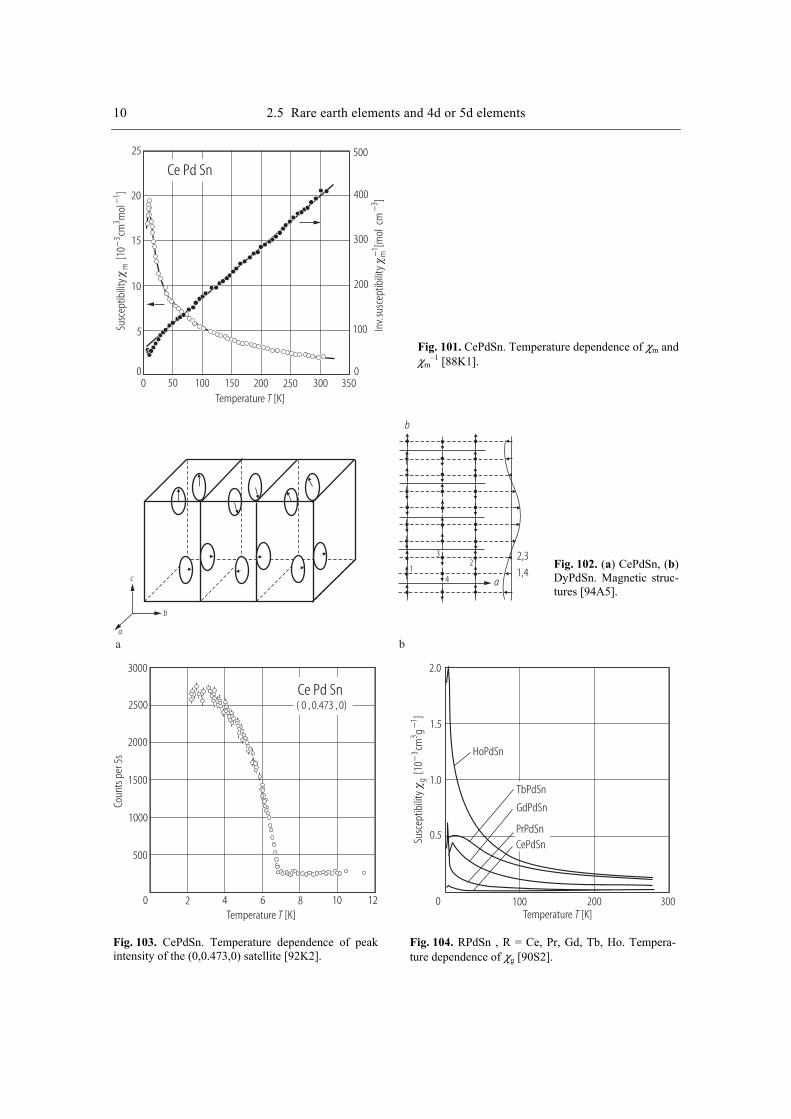
10 2.5 Rare earth elements and 4d or 5d elements
Temperature [K]T
Susc
eptib
ility
[10
cmm
ol]
m3
31
−−
Inv.
susc
eptib
ility
[mol
cm
]m
3−−1
Ce Pd Sn25
20
15
10
5
00 50 100 150 200 250 300 350
500
400
300
200
100
0
Fig. 101. CePdSn. Temperature dependence of χm and χm
–1 [88K1].
c
b
a
b
a
a b
2,3
1,4
32
14
Fig. 102. (a) CePdSn, (b) DyPdSn. Magnetic struc-tures [94A5].
Temperature [K]T
Ce Pd Sn( 0 , 0.473 , 0)
3000
2500
2000
1500
1000
500
0 2 4 6 8 10 12
Coun
ts p
er 5
s
Fig. 103. CePdSn. Temperature dependence of peak intensity of the (0,0.473,0) satellite [92K2].
Temperature [K]T
Susc
eptib
ility
[10
cmg
]g
33
1−
−
2.0
1.5
1.0
0.5
0 100 200 300
HoPdSn
TbPdSn
GdPdSn
PrPdSnCePdSn
Fig. 104. RPdSn , R = Ce, Pr, Gd, Tb, Ho. Tempera-ture dependence of χg [90S2].
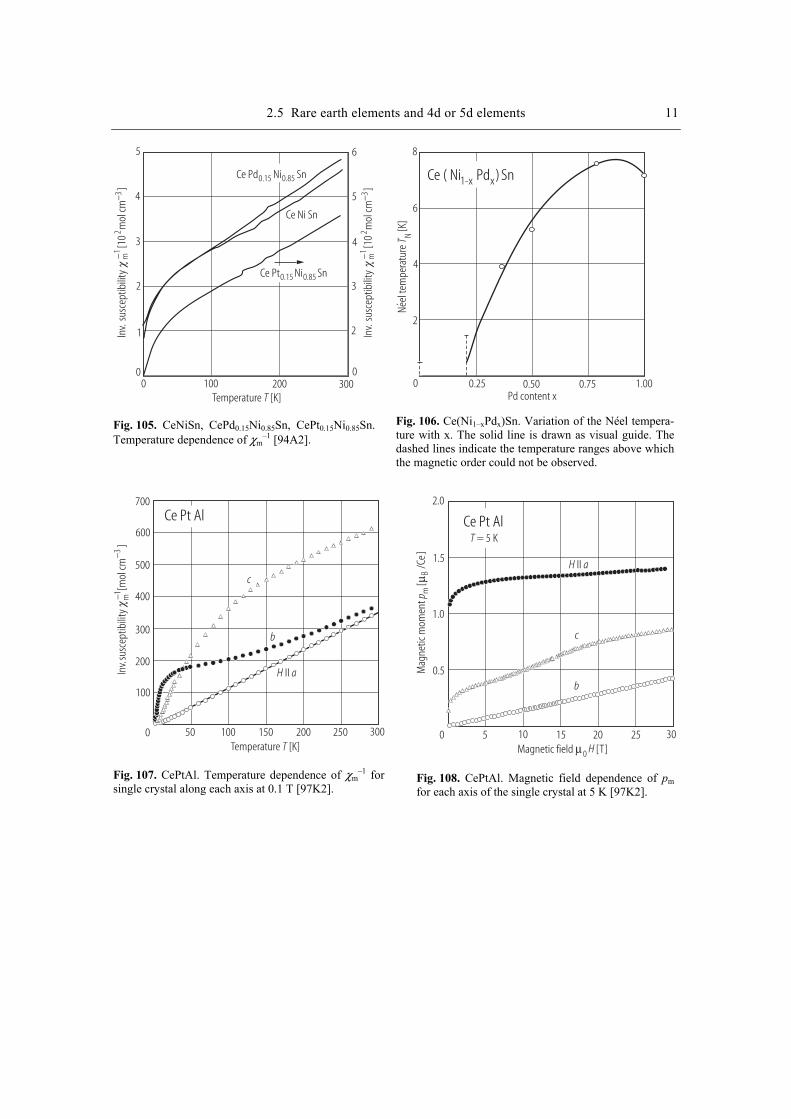
2.5 Rare earth elements and 4d or 5d elements 11
Temperature [K]T
Inv.
susc
eptib
ility
[10
mol
cm]
−−
23
1m
Inv.
susc
eptib
ility
[10
mol
cm]
−−
23
1m
00
100 200 300
5
4
3
2
1
6
5
4
3
2
0
Ce Ni Sn
Ce Pd Ni Sn0.15 0.85
Ce Pt Ni Sn0.15 0.85
Fig. 105. CeNiSn, CePd0.15Ni0.85Sn, CePt0.15Ni0.85Sn. Temperature dependence of χm
–1 [94A2].
Ce ( Ni Pd ) Sn1-x x
8
6
4
2
0 0.25 0.50 0.75 1.00Pd content x
Neel
tem
pera
ture
[K]
T N´
Fig. 106. Ce(Ni1–xPdx)Sn. Variation of the Néel tempera-ture with x. The solid line is drawn as visual guide. The dashed lines indicate the temperature ranges above which the magnetic order could not be observed.
Temperature [K]T
Inv.
susc
eptib
ility
[mol
cm]
m3−
−1
Ce Pt Al
c
b
700
600
500
400
300
200
100
0 50 100 150 200 250 300
H aII
Fig. 107. CePtAl. Temperature dependence of χm
–1 for single crystal along each axis at 0.1 T [97K2].
Magnetic field [T]µ0 H
H aII
Ce Pt Al
Mag
netic
mom
ent
[]
p mBµ
/Ce
T = 5 K
c
b
2.0
1.5
1.0
0.5
0 5 10 15 20 25 30
Fig. 108. CePtAl. Magnetic field dependence of pm for each axis of the single crystal at 5 K [97K2].
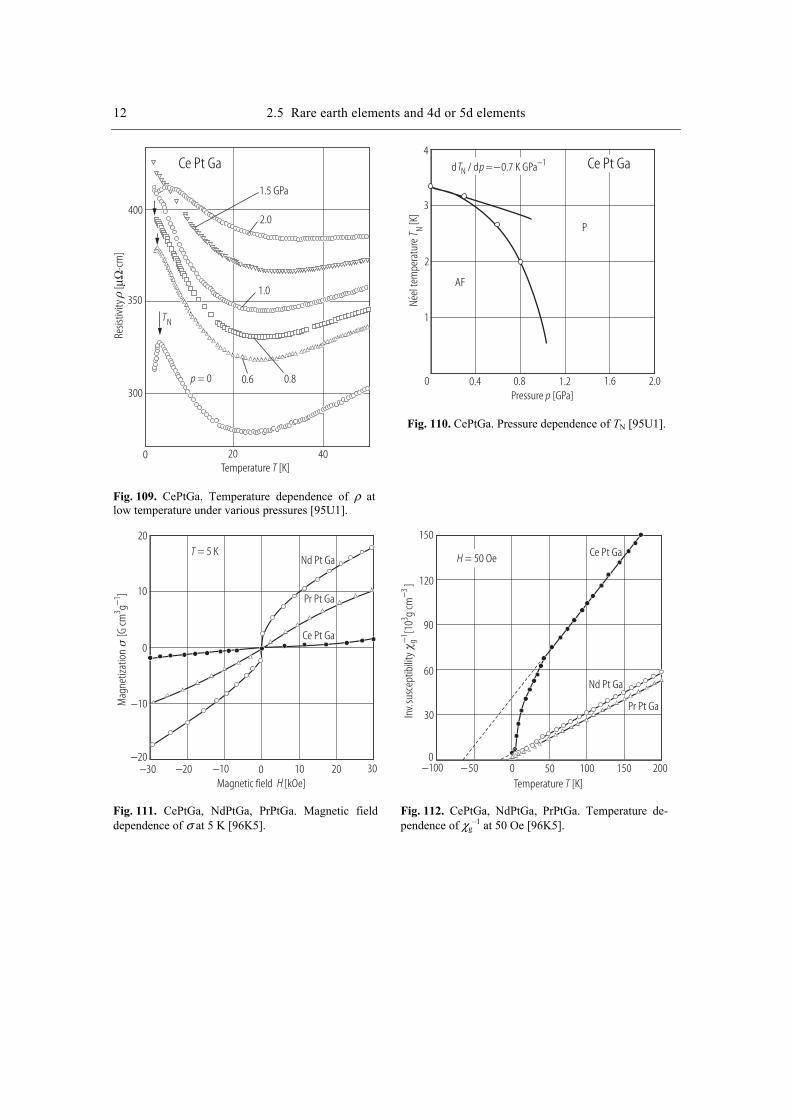
12 2.5 Rare earth elements and 4d or 5d elements
Temperature [K]T
TN
Resis
tivity
[
cm]
µΩ⋅
Ce Pt Ga
1.5 GPa
2.0
1.0
0.80.6p = 0
400
350
300
0 20 40
Fig. 109. CePtGa. Temperature dependence of ρ at low temperature under various pressures [95U1].
4
2
2.0Pressure [GPa]p
Neel
tem
pera
ture
[K]
T N´
3
1
0 0.4 0.8 1.2 1.6
P
AF
Ce Pt Gad / d = 0.7 K GPaT pN1− −
Fig. 110. CePtGa. Pressure dependence of TN [95U1].
Mag
netiz
atio
n
[G cm
g]
31−
Magnetic field [kOe]H
T = 5 KNd Pt Ga
Pr Pt Ga
Ce Pt Ga
20
10
0
−10
−20−30 −20 −10 0 10 20 30
Fig. 111. CePtGa, NdPtGa, PrPtGa. Magnetic field dependence of σ at 5 K [96K5].
Nd Pt Ga
Pr Pt Ga
Ce Pt Ga
Temperature [K]T
Inv.
susc
eptib
ility
[10
g cm
]g
33−
−1
150
120
90
60
30
00 50 100 150 200−50−100
H = 50 Oe
Fig. 112. CePtGa, NdPtGa, PrPtGa. Temperature de-pendence of χg
–1 at 50 Oe [96K5].
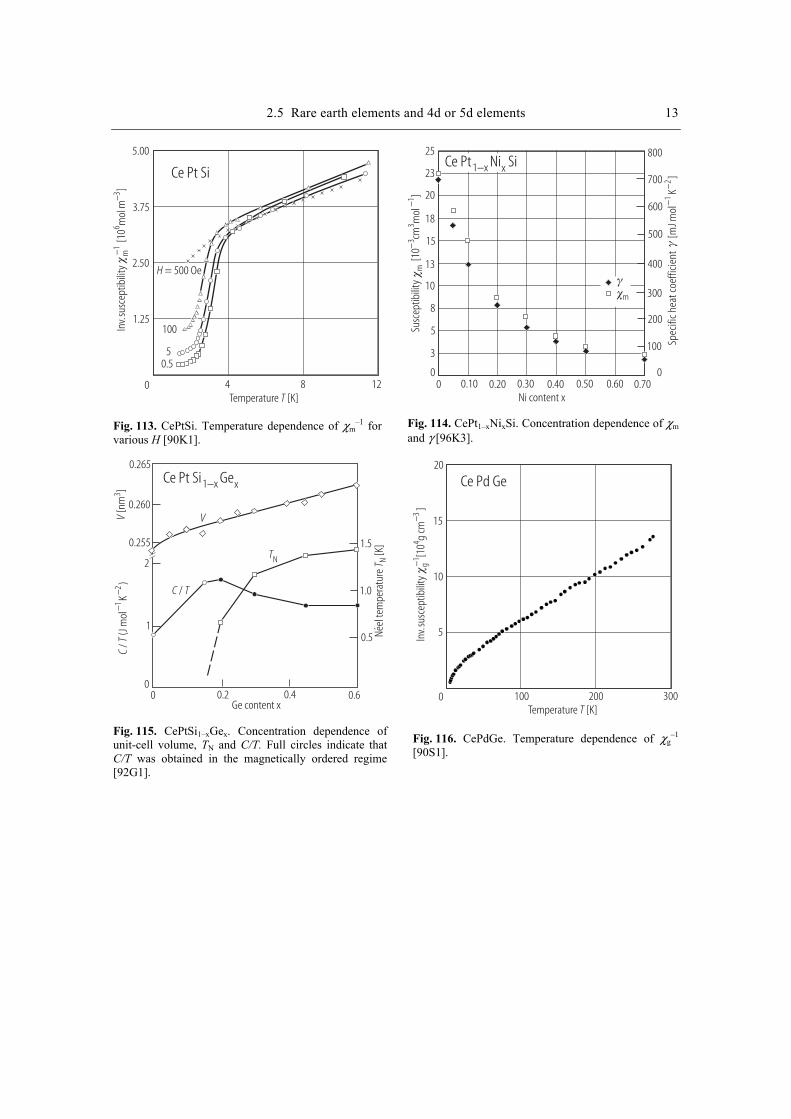
2.5 Rare earth elements and 4d or 5d elements 13
H = 500 Oe
Temperature [K]T
Inv.
susc
eptib
ility
[10
mol
m]
m6
3−−1
Ce Pt Si
100
50.5
5.00
3.75
2.50
1.25
0 4 8 12
Fig. 113. CePtSi. Temperature dependence of χm
–1 for various H [90K1].
Susc
eptib
ility
[10
cmm
ol]
m3
31
−−
Spec
ific h
eat c
oeffi
cien
t[m
Jmol
K]
−−
12
Ni content x
m
25
23
20
18
15
13
10
8
5
3
00 0.10 0.20 0.30 0.40 0.50 0.60 0.70
800
700
600
500
400
300
200
100
0
Ce Pt Ni Si1 x x−
Fig. 114. CePt1–xNixSi. Concentration dependence of χm and γ [96K3].
Ge content x
Ce Pt Si Ge1 x x−
0.265
0.260
0.255
2
1
00 0.2 0.4 0.6
1.5
1.0
0.5
CT/
(J m
olK
)−
−1
2V
[nm
]3
Neel
tem
pera
ture
[K]
T N´
V
C T/
TN
Fig. 115. CePtSi1–xGex. Concentration dependence of unit-cell volume, TN and C/T. Full circles indicate that C/T was obtained in the magnetically ordered regime [92G1].
Temperature [K]T
Ce Pd Ge20
15
10
5
0 100 200 300
Inv.
susc
eptib
ility
[10
g cm
]g
43−
−1
Fig. 116. CePdGe. Temperature dependence of χg
–1 [90S1].
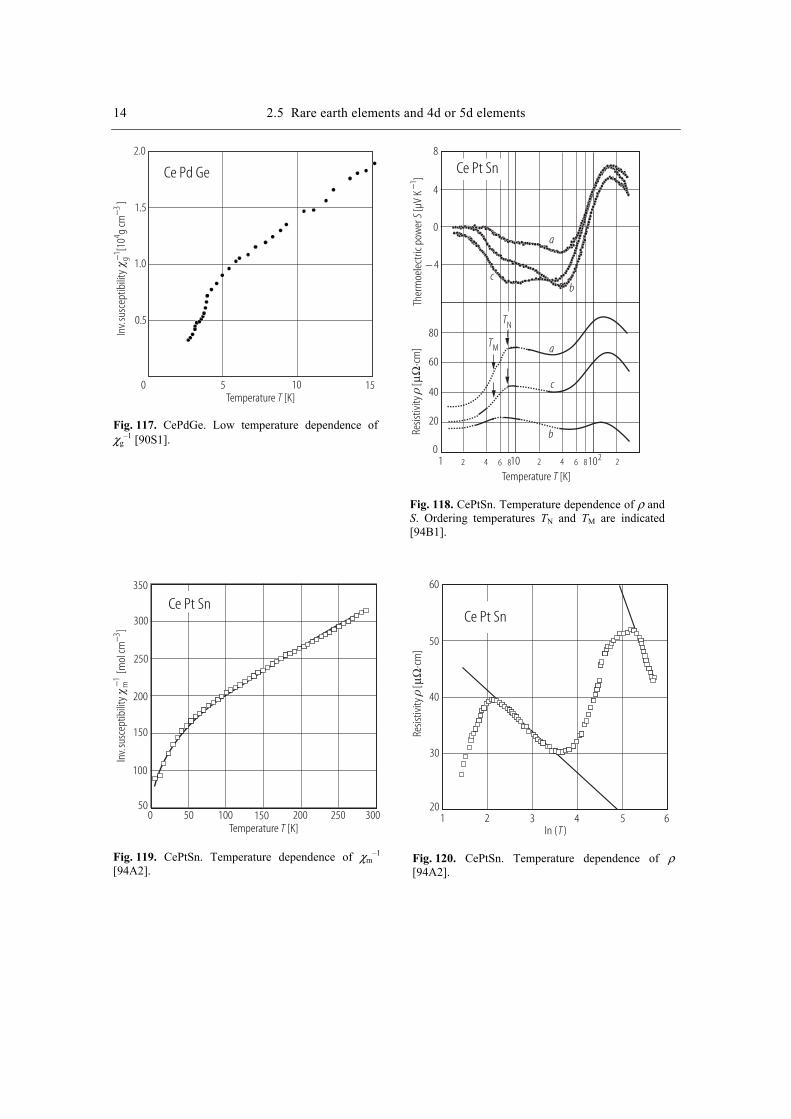
14 2.5 Rare earth elements and 4d or 5d elements
Temperature [K]T
Ce Pd Ge
Inv.
susc
eptib
ility
[10
g cm
]g
43−
−1
2.0
1.0
1.5
0.5
0 5 10 15
Fig. 117. CePdGe. Low temperature dependence of χg
–1 [90S1].
Temperature [K]T
Ce Pt Sn8
4
0
− 4
0
20
40
60
80
1 10 102
a
a
b
b
c
c
TM
TN
2 4 6 8 2 4 6 8 2
Ther
moe
lect
ric p
ower
[µV
K]
S−1
Resis
tivity
[cm
]µΩ
⋅
Fig. 118. CePtSn. Temperature dependence of ρ and S. Ordering temperatures TN and TM are indicated [94B1].
Temperature [K]T
Inv.
susc
eptib
ility
[ mol
cm]
m3−
−1
Ce Pt Sn350
300
250
200
150
100
500 50 100 150 200 250 300
Fig. 119. CePtSn. Temperature dependence of χm
–1 [94A2].
Ce Pt Sn
Resis
tivity
[cm
]µΩ
⋅
60
50
40
30
201 2 3 54 6
In ( )T
Fig. 120. CePtSn. Temperature dependence of ρ [94A2].
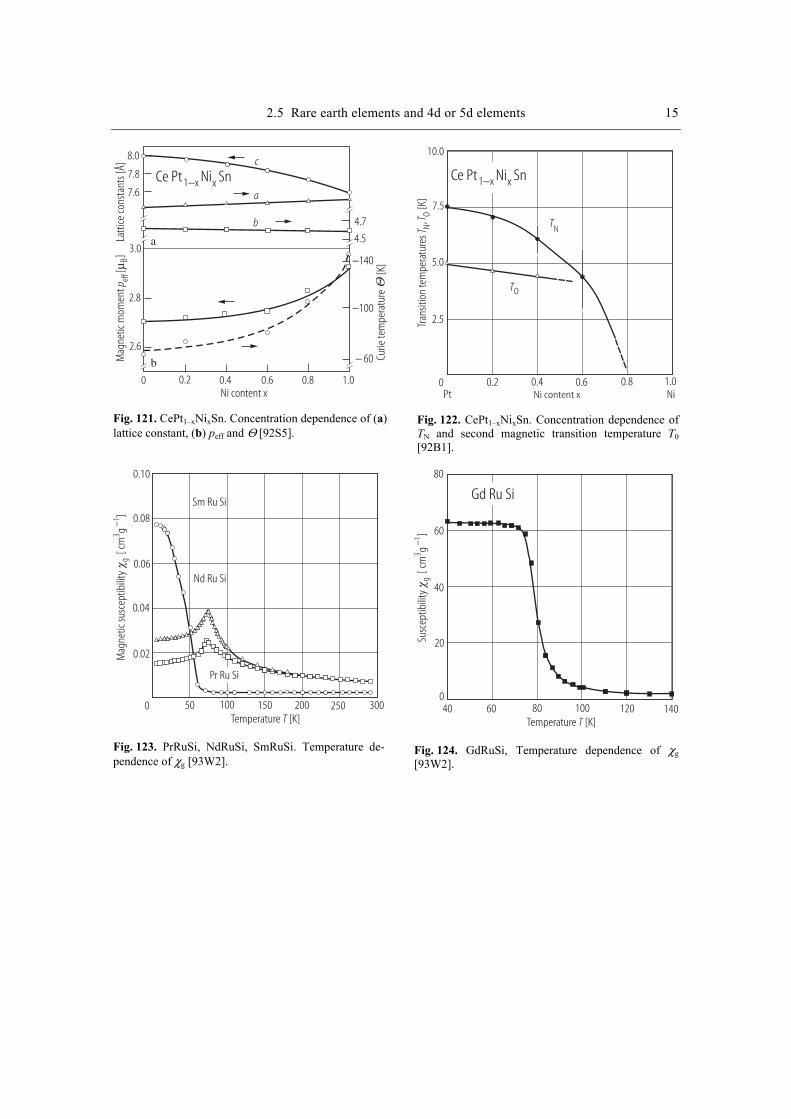
2.5 Rare earth elements and 4d or 5d elements 15 M
agne
tic m
omen
t[
]p ef
fBµ
Latti
ce co
nsta
nts [
Å]
Ce Pt Ni1 x x− Sn
8.0
7.8
7.6
3.0
2.8
2.6
0 0.2 0.4 0.6 0.8 1.0Ni content x
−100
− 60
−140
4.7
4.5
c
a
b
a
b
Cu
rie te
mpe
ratu
re
[K]
Fig. 121. CePt1–xNixSn. Concentration dependence of (a) lattice constant, (b) peff and Θ [92S5].
Ni content x
Ce Pt Ni1 x x− Sn
10.0
7.5
5.0
2.5
0 0.2 0.4 0.6 0.8 1.0Pt Ni
TN
TO
Tran
sitio
n te
mpe
ratu
res
,[K
]T
TN
O
Fig. 122. CePt1–xNixSn. Concentration dependence of TN and second magnetic transition temperature T0 [92B1].
Mag
netic
susc
eptib
ility
[ cm
g]
g3
1−
Temperature [K]T
Sm Ru Si
Nd Ru Si
0.10
0.08
0.06
0.04
0.02
0 50 100 150 200 250 300
Pr Ru Si
Fig. 123. PrRuSi, NdRuSi, SmRuSi. Temperature de-pendence of χg [93W2].
Susc
eptib
ility
[ cm
g]
g3
1−
Temperature [K]T
80
60
40
20
040 60 80 100 120 140
Gd Ru Si
Fig. 124. GdRuSi, Temperature dependence of χg [93W2].
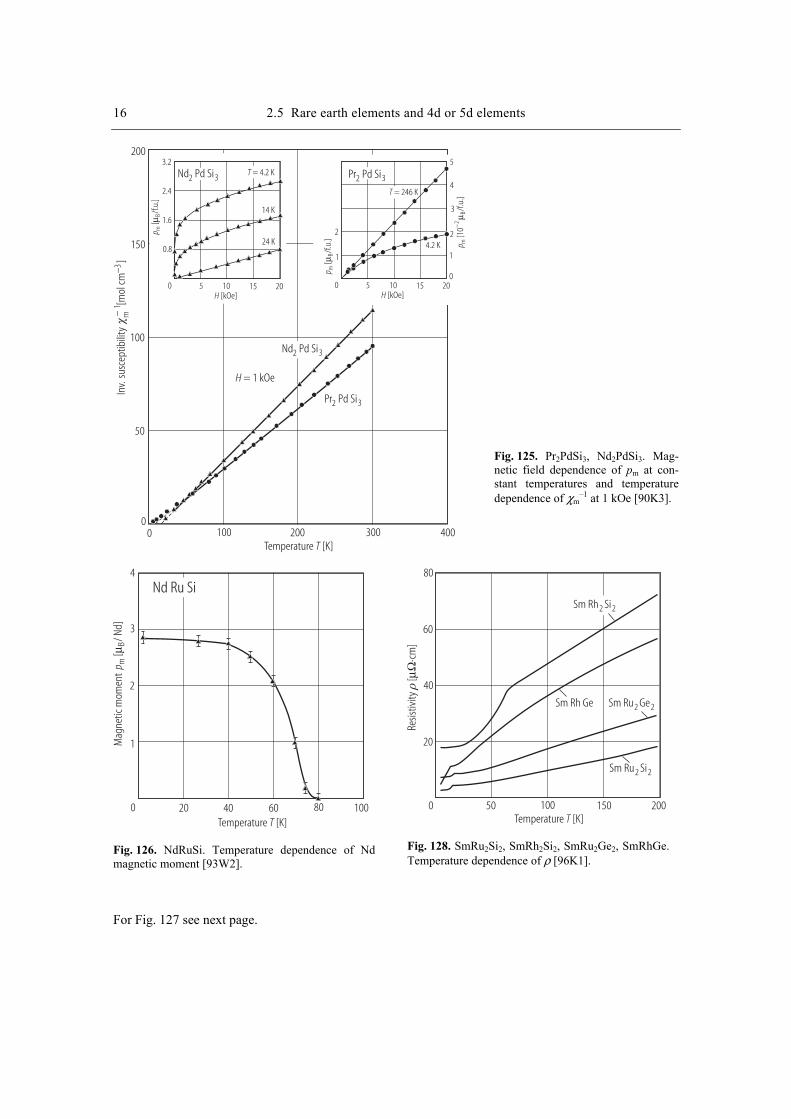
16 2.5 Rare earth elements and 4d or 5d elements
Temperature [K]T
H = 1 kOe
00 100 200 300 400
50
100
150
200
Inv.
susc
eptib
ility
[mol
cm]
−−3
1m
Pr Pd Si2 3
2
1
10 2015500
4
3
2
14.2 K
H [kOe]
5
T = 246 K
Pr Pd Si2 3
p mB
[/f.
u.]
µ
p m2
B[1
0/f.
u.]
−µ
Nd Pd Si2 3
10 201550H [kOe]
T = 4.2 KNd Pd Si2 3
p mB
[/f.
u.]
µ
14 K
24 K0.8
1.6
2.4
3.2
Fig. 125. Pr2PdSi3, Nd2PdSi3. Mag-netic field dependence of pm at con-stant temperatures and temperature dependence of χm
–1 at 1 kOe [90K3].
Temperature [K]T
p mB
[/ N
d]µ
Mag
netic
mom
ent
0 20 40 60 80 100
Nd Ru Si4
2
3
1
Fig. 126. NdRuSi. Temperature dependence of Nd magnetic moment [93W2].
Temperature [K]T
Resis
tivity
[
cm]
µΩ⋅
80
60
40
20
0 50 100 150 200
Sm Ru Ge2 2Sm Rh Ge
Sm Ru Si2 2
Sm Rh Si2 2
Fig. 128. SmRu2Si2, SmRh2Si2, SmRu2Ge2, SmRhGe. Temperature dependence of ρ [96K1].
For Fig. 127 see next page.
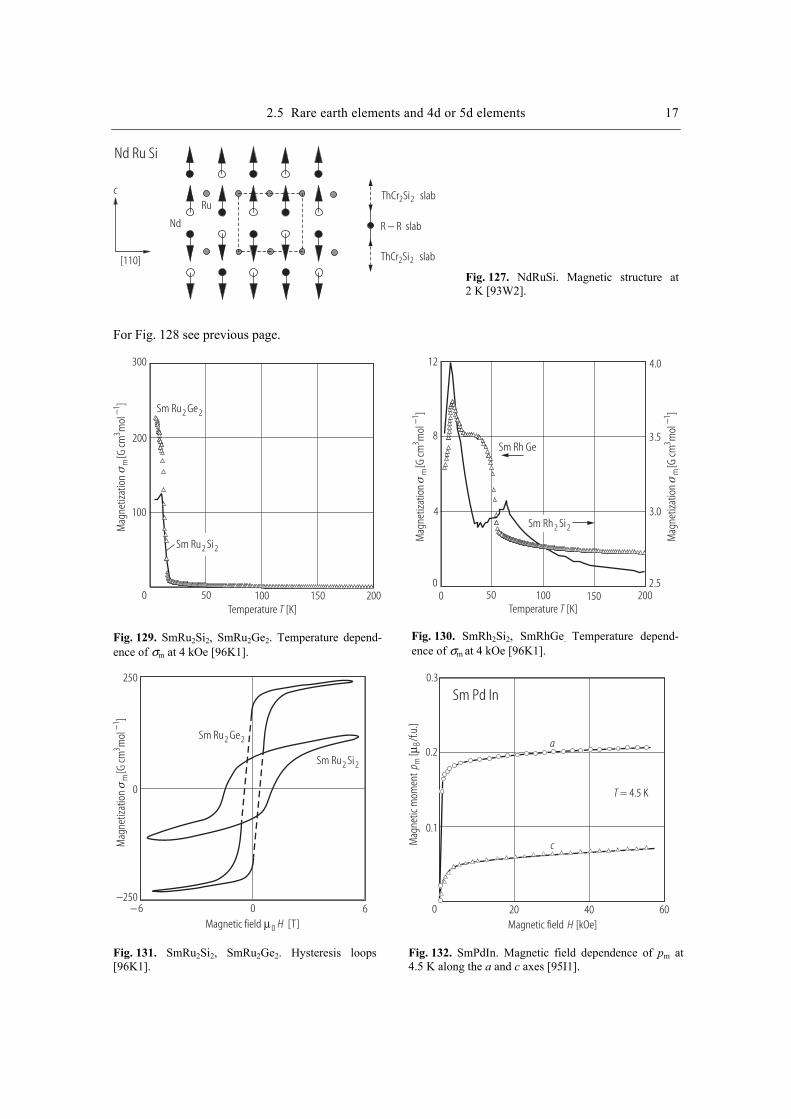
2.5 Rare earth elements and 4d or 5d elements 17
Nd Ru Si
c
[110]
Nd
RuThCr Si slab2 2
ThCr Si slab2 2
R R slab−
Fig. 127. NdRuSi. Magnetic structure at 2 K [93W2].
For Fig. 128 see previous page.
Temperature [K]T
Sm Ru Ge2 2
Sm Ru Si2 2
300
200
100
0 50 100 150 200
Mag
netiz
atio
n
[G
cmm
ol]
31−
m
Fig. 129. SmRu2Si2, SmRu2Ge2. Temperature depend-ence of σm at 4 kOe [96K1].
Temperature [K]T
Sm Rh Ge
00 50 100 150 200
Mag
netiz
atio
n
[G
cmm
ol]
31−
m
Mag
netiz
atio
n
[G
cmm
ol]
31−
m
Sm Rh Si2 2
12
8
4
4.0
3.5
3.0
2.5
Fig. 130. SmRh2Si2, SmRhGe. Temperature depend-ence of σm at 4 kOe [96K1].
Sm Ru Ge2 2
Sm Ru Si2 2
Mag
netiz
atio
n
[G
cmm
ol]
31−
m
Magnetic field [T]0 Hµ
250
0
−250−6 0 6
Fig. 131. SmRu2Si2, SmRu2Ge2. Hysteresis loops [96K1].
p mB
[/f.
u.]
µM
agne
tic m
omen
t
Sm Pd In
Magnetic field [kOe]H
T = 4.5 K
a
c
0.3
0.2
0.1
0 20 40 60
Fig. 132. SmPdIn. Magnetic field dependence of pm at 4.5 K along the a and c axes [95I1].
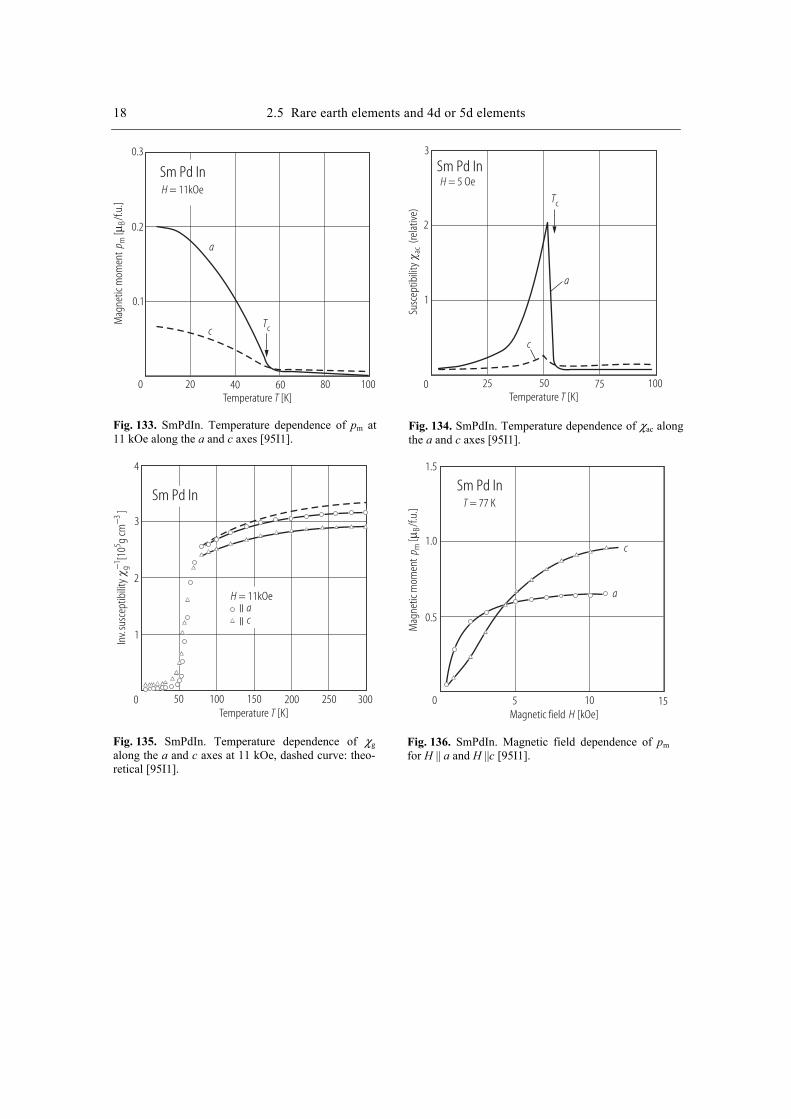
18 2.5 Rare earth elements and 4d or 5d elements p m
B[
/f.u.
]µ
Mag
netic
mom
ent a
c
Temperature [K]T
Sm Pd InH = 11kOe
Tc
0.3
0.2
0.1
0 20 40 60 80 100
Fig. 133. SmPdIn. Temperature dependence of pm at 11 kOe along the a and c axes [95I1].
Temperature [K]T
Sm Pd InH = 5 Oe
Tc
a
c
Susc
eptib
ility
(rela
tive)
ac
3
2
1
0 25 50 75 100
Fig. 134. SmPdIn. Temperature dependence of χac along the a and c axes [95I1].
Temperature [K]T
Inv.
susc
eptib
ility
[10
g cm
]g
53−
−1
Sm Pd In
H = 11kOeaIIcII
4
3
2
1
0 50 100 150 200 250 300
Fig. 135. SmPdIn. Temperature dependence of χg along the a and c axes at 11 kOe, dashed curve: theo-retical [95I1].
Sm Pd In
T = 77 K
a
c
Magnetic field [kOe]H
p mB
[/f.
u.]
µM
agne
tic m
omen
t
1.5
1.0
0.5
0 5 10 15
Fig. 136. SmPdIn. Magnetic field dependence of pm for H || a and H ||c [95I1].

2.5 Rare earth elements and 4d or 5d elements 19
Tc
a
c
c
Expa
nsio
n co
effic
ient
[
10K
]−
−4
1
Resis
tivity
[
cm]
µΩ⋅
20
15
10
5
0
−1 −1
20
2
1
0
Sm Pd In
0 20 40 60 80 100Temperature [K]T
Fig. 137. SmPdIn. Temperature dependence of ρ along the c axis, thermal expansion coefficient along the a and c axes. Dashed curve: calculated for polycrystalline sample [95I1].
Tc
0 20 40 60 80 100Temperature [K]T
Sm Pd In
La Pd In
20
15
10
5Heat
capa
city
[cal
mol
K]
C p−
−1
1 Fig. 138. LaPdIn, SmPdIn. Temperature dependence of Cp. The dashed line is the magnetic portion [95I1].
Temperature [K]T
Sm Pd Sn
Sm Pt Sn
Sm Ni Sn
Resis
tivity
[
cm]
µΩ⋅
200
160
120
80
40
0 100 200 300
Fig. 139. SmTSn, T = Ni, Pd, Pt. Temperature de-pendence of ρ [95S2].
Temperature [K]T
Sm Pd Sn
Sm Pt Sn
Sm Ni Sn
Resis
tivity
[
cm]
µΩ⋅
30
20
10
0 5 10 15 20
Fig. 140. SmTSn, T = Ni, Pd, Pt. Temperature de-pendence of ρ at low temperature [95S2].
References
88K1 Kasaya, M., Tani, T., Iga, F., Kasuya, T.: J. Magn. Magn. Mater. 76-77 (1988) 278 90F1 Fujii, H., Nagasawa, M., Kawanaka, H., Inoue, T., Takabatake, T.: Physica B 165-166 (1990)
435 90F2 Fukuhara. T., Sakamoto, I., Sato, H.: Physica B 165-166 (1990) 443 90K1 Kohler, R., Strobel, B., Kammerer, C., Grauel, A., Gottwick, U., Goring, E., Hohr, A., Sparn,
G., Geibel, C., Horn, S.: J. Magn. Magn. Mater. 90-91 (1990) 428 90K3 Kotsanidis, P., A., Yakinthos, J., K., Gamari-Seale, E.: J. Magn. Magn. Mater. 87 (1990) 199 90M1 Malik, S.K., Adroja, D.T., Pdadalia, B.D., Vijayaraghavan, R.: Physica B 163 (1990) 89 90S1 Sakurai, J., Yamaguchi, Y., Nishigori, S., Suzuki, T., Fujita, T.: J. Magn. Magn. Mater. 90-91
(1990) 422 90S2 Sakurai, J., Yamaguchi, Y., Mibu, K., Shinjo: J. Magn. Magn. Mater. 84 (1990) 157 92B1 Besnus, M.J., Essaihi, A., Fischer, G., Hamdaoui, N., Meyer, A.: J. Magn. Magn. Mater. 104-
107 (1992) 1387 92G1 Geibel, C., Kammerer, C., Seidel, B., Bredl, C.D., Grauel, A., Steglich, F.: J. Magn. Magn.
Mater. 108 (1992) 207 92K2 Kotsanidis, P., Yakinthos, J.K., Semittelou, I., Roudaut, E.: J. Magn. Magn. Mater. 116 (1992)
95 92R1 Roy, S.B., Coles, B.R.: J. Magn. Magn. Mater. 108 (1992) 43 92R2 Routsi, Ch.D., Yakinthos, J.K., Gamari-Seale.: J. Magn. Magn. Mater. 117 (1992) 79 92S5 Sakurai, J., Kawamura, R., Taniguchi, T., Nishigori, S., Ikeda, S., Goshima, H., Suzuki, T.,
Fujita, T.: J. Magn. Magn. Mater. 104-107 (1992) 1415 93B1 Bruck, E., Nakotte, H., Bakker, K., de Boer, F.R., de Chatel, P.F.: J. Alloys Comp. 200 (1993)
79 93W2 Welter, R., Venturini G., Malaman, B.: J. Alloys Comp. 202 (1993) 165 94A2 Adroja, D.T., Rainford, B.D.: J. Magn. Magn. Mater. 135 (1994) 333 94A3 Adroja, D.T., Rainford, B.D., Malik, S.K.: Physica B 194-196 (1994) 169 94A5 Andre, G., Bouree, F., Bombik, A., Oles, A., Sikora, W., Kolenda, M., Szytula, A., Pacyna, A.,
Zygmunt, A.: Acta Phys. Pol. 85 (1994) 275 94B1 Bando, U., Takabatake, T., Tanaka, H., Iwasaki, H., Fujii, H., Malik, S.K.: Physica B 194-196
(1994) 1179 94K1 Kitazawa, H., Matsushita, A., Matsumoto, T., Suzuki, T.: Physica B 199-200 (1994) 28 95I1 Ito, T., Ohkubo, K., Hirasawa, T., Takeuchi, J., Hiromitsu, I., Kurisu, M.: J. Magn. Magn.
Mater. 140-144 (1995) 873 95S2 Sakurai, J., Kegai, K., Kuwai, T., Isikawa, Y., Nisimura, K., Mori, K.: J. Magn. Magn. Mater.
140-144 (1995) 875 95U1 Uwatoko, Y., Ishii, T., Oomi, G., Malik, S.K.: Physica B 206-207 (1995) 199 96B1 Bazela, W., Zygmunt, A., Szytula, A., Ressouche, E., Leciejewicz, J., Sikora, W.: J. Alloys
Comp. 243 (1996) 106 96K1 Kochetkov, Yu.V., Nikiforov, V.N., Klestov, S.A., Morozkin, A.V.: J. Magn. Magn. Mater.
157-158 (1996) 665 96K3 Kolb, R., Mielke, A., Scheidt, E.W., Stewart, G.R.: J. Alloys Comp. 239 (1996) 124 96K5 Kasaya, M., Ito, M., Ono, A., Sakai, O.: Physica B 223-224 (1996) 336 97A1 Adroja, D.T., Rainford, B.D., Houshiar, M.: J. Alloys Comp. 268 (1997) 1 97K2 Kitazawa, H., Nimori, S., Tang, J., Iga, F., Donni, A., Matsumoto, T., Kido, G.: Physica B
237-238 (1997) 212 98C2 Chavalier, B., Fourgeot, F., Laffargue, D., Pottgen, R., Etourneau, J.: J. Alloys Comp. 275-277
(1998) 537
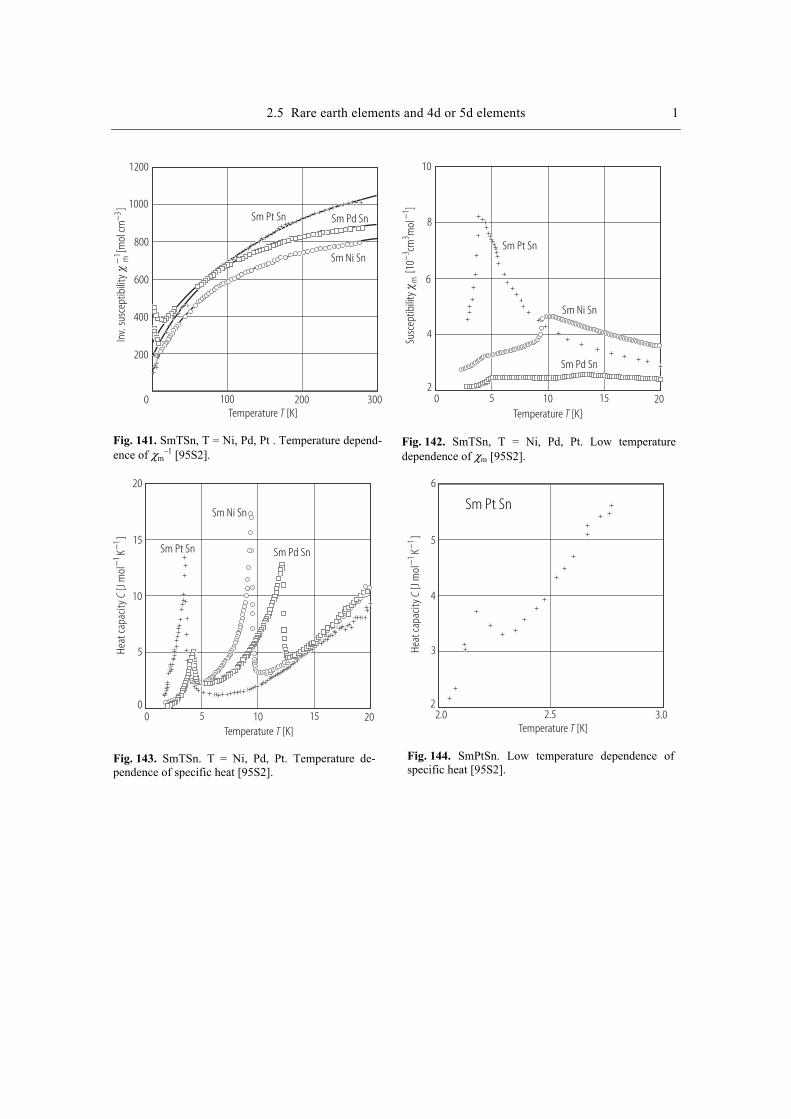
2.5 Rare earth elements and 4d or 5d elements 1
Temperature [K]T
Sm Pd SnSm Pt Sn
Sm Ni Sn
Inv.
susc
eptib
ility
[mol
cm]
−−3
1m
1200
1000
800
600
400
200
0 100 200 300
Fig. 141. SmTSn, T = Ni, Pd, Pt . Temperature depend-ence of χm
–1 [95S2].
Temperature [K]T
Sm Pt Sn
Sm Ni Sn
Sm Pd Sn
Susc
eptib
ility
[10
cmm
ol]
m3
31
−−
10
8
6
4
20 5 10 15 20
Fig. 142. SmTSn, T = Ni, Pd, Pt. Low temperature dependence of χm [95S2].
Temperature [K]T0 5 10 15 20
Sm Pt Sn
Sm Ni Sn
Sm Pd Sn
20
15
10
5
0
Heat
capa
city
[Jm
olK
]C
−−
11
Fig. 143. SmTSn. T = Ni, Pd, Pt. Temperature de-pendence of specific heat [95S2].
Temperature [K]T
Heat
capa
city
[Jm
olK
]C
−−
11
Sm Pt Sn
6
5
4
3
22.0 2.5 3.0
Fig. 144. SmPtSn. Low temperature dependence of specific heat [95S2].
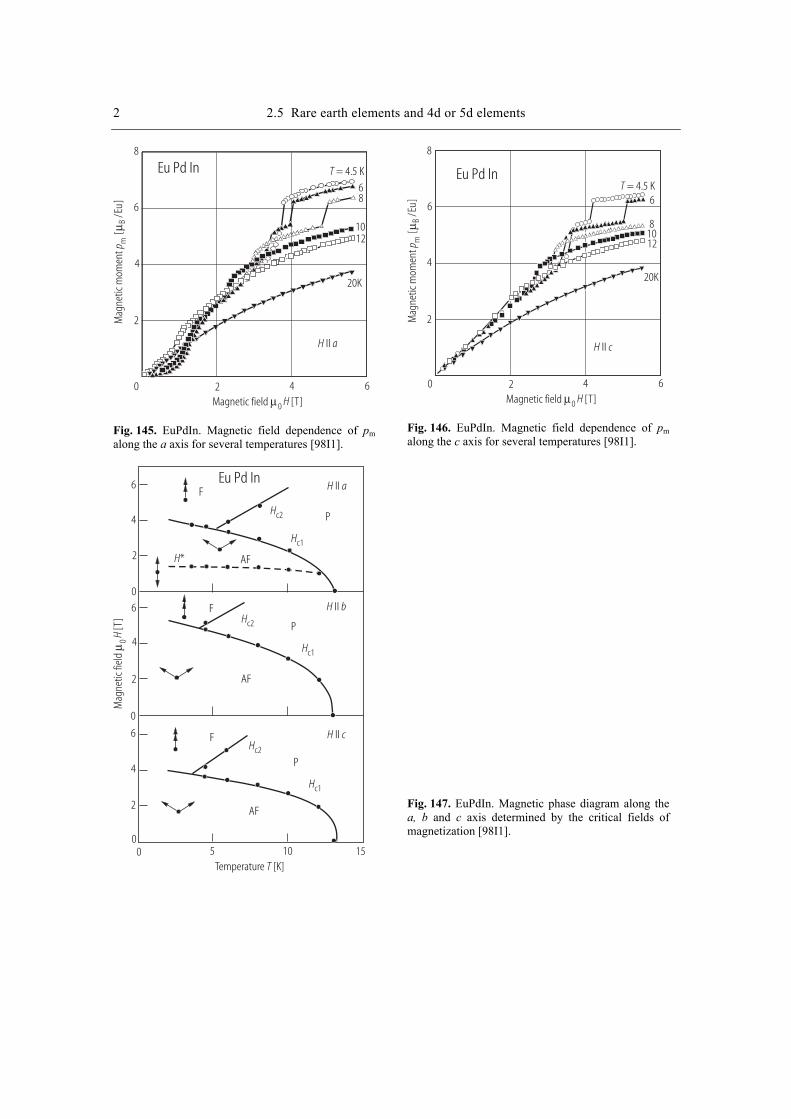
2 2.5 Rare earth elements and 4d or 5d elements
Magnetic field [T]µ0 H
Mag
netic
mom
ent
[]
p mBµ
/Eu
8
6
4
2
0 2 4 6
H aII
Eu Pd In T = 4.5 K
68
1012
20K
Fig. 145. EuPdIn. Magnetic field dependence of pm along the a axis for several temperatures [98I1].
Magnetic field [T]µ0 H
H cII
Eu Pd In
Mag
netic
mom
ent
[]
p mBµ
/Eu
8
6
4
2
0 2 4 6
6
81012
20K
T = 4.5 K
Fig. 146. EuPdIn. Magnetic field dependence of pm along the c axis for several temperatures [98I1].
Temperature [K]T
Mag
netic
fiel
d[T
]µ 0
H
H cII
H bII
H aIIF
AF
P
F
P
AF
F
P
AF
0 5 10 15
6
4
2
0
6
4
2
0
6
4
2
0
H*
Hc2
Hc2
Hc2
Hc1
Hc1
Hc1
Eu Pd In
Fig. 147. EuPdIn. Magnetic phase diagram along the a, b and c axis determined by the critical fields of magnetization [98I1].
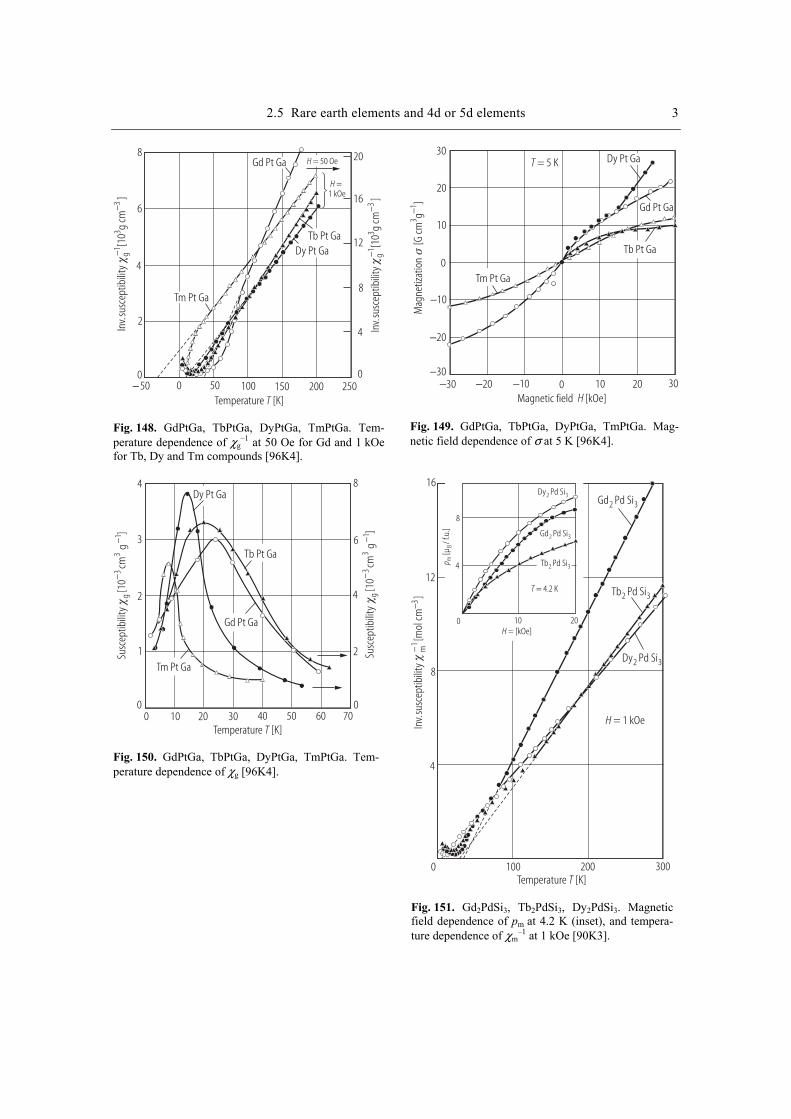
2.5 Rare earth elements and 4d or 5d elements 3
Temperature [K]T
Inv.
susc
eptib
ility
[10
g cm
]g
33−
−1
Inv.
susc
eptib
ility
[10
g cm
]g
33−
−1
0 50 100 150 200−50 250
8
6
4
2
0
20
16
12
8
4
0
H = 50 Oe
H =1 kOe
Gd Pt Ga
Dy Pt GaTb Pt Ga
Tm Pt Ga
⎨⎧
⎩
Fig. 148. GdPtGa, TbPtGa, DyPtGa, TmPtGa. Tem-perature dependence of χg
–1 at 50 Oe for Gd and 1 kOe for Tb, Dy and Tm compounds [96K4].
Mag
netiz
atio
n
[G cm
g]
31−
Magnetic field [kOe]H
20
10
0
−10
−20
−30−30 −20 −10 0 10 20 30
Gd Pt Ga
30T = 5 K Dy Pt Ga
Tm Pt Ga
Tb Pt Ga Fig. 149. GdPtGa, TbPtGa, DyPtGa, TmPtGa. Mag-netic field dependence of σ at 5 K [96K4].
Temperature [K]T
Dy Pt Ga
Gd Pt Ga
Tb Pt Ga
Tm Pt Ga
Susc
eptib
ility
[10
cm]
g3
3−
g−1
Susc
eptib
ility
[10
cm]
g3
3−
g−1
4
3
2
1
0
8
6
4
2
00 10 20 30 40 50 60 70
Fig. 150. GdPtGa, TbPtGa, DyPtGa, TmPtGa. Tem-perature dependence of χg [96K4].
Temperature [K]T
Inv.
susc
eptib
ility
[mol
cm]
−−3
1m
16
12
8
4
0 100 200 300
Gd Pd Si2 3
Tb Pd Si2 3
Dy Pd Si2 3
H = 1 kOe
T = 4.2 K
8
4
0 10 20
p mB
[µ/ f
.u.]
Dy Pd Si2 3
Gd Pd Si2 3
Tb Pd Si2 3
H = [kOe]
Fig. 151. Gd2PdSi3, Tb2PdSi3, Dy2PdSi3. Magnetic field dependence of pm at 4.2 K (inset), and tempera-ture dependence of χm
–1 at 1 kOe [90K3].
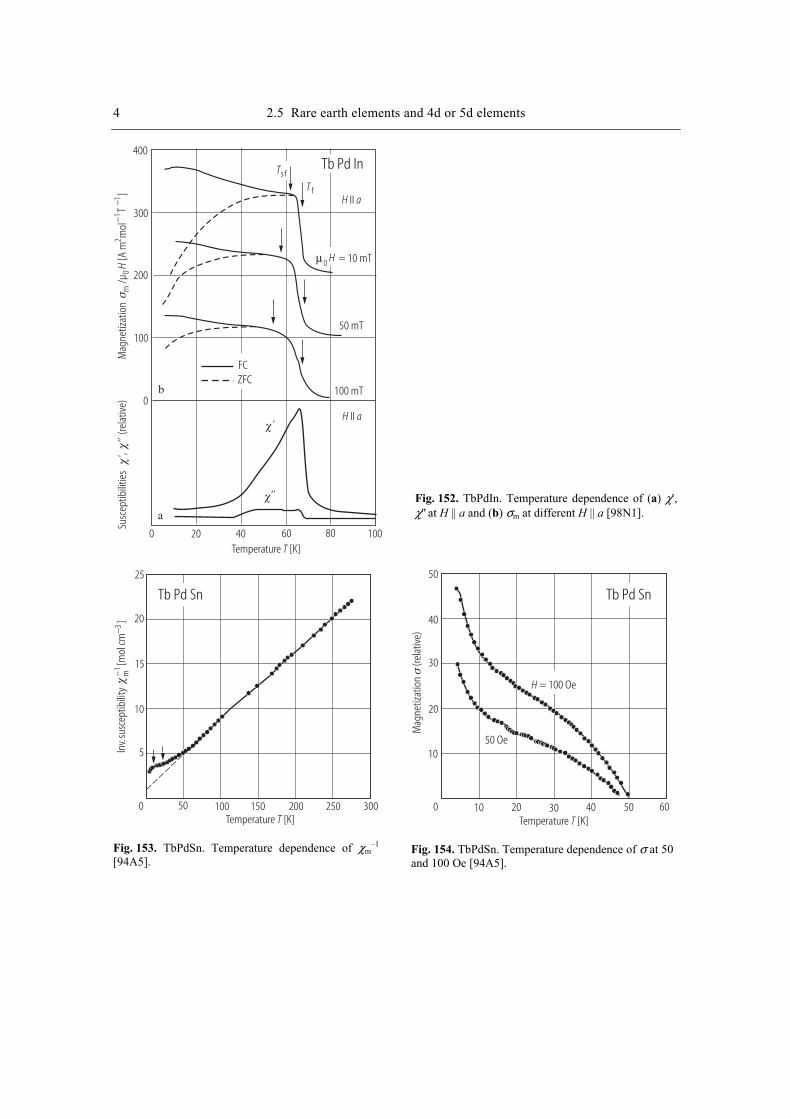
4 2.5 Rare earth elements and 4d or 5d elements
Temperature [K]T
Susc
eptib
ilitie
s‘,
‘’(re
lativ
e)
= 10 mTµ0 H
H aII
H aII
Ts f
T f
50 mT
100 mT
FCZFC
400
300
200
100
0
0 20 40 60 80 100
Mag
netiz
atio
n/µ
[A m
mol
]m
02
1H
−T
−1
‘
‘’
Tb Pd In
a
b
Fig. 152. TbPdIn. Temperature dependence of (a) χ', χ'' at H || a and (b) σm at different H || a [98N1].
Temperature [K]T
Inv.
susc
eptib
ility
[mol
cm]
−−3
1m
0 100 200 300
Tb Pd Sn
50 150 250
25
20
15
10
5
Fig. 153. TbPdSn. Temperature dependence of χm
–1 [94A5].
Temperature [K]T
Tb Pd Sn
Mag
netiz
atio
n
(rela
tive)
H = 100 Oe
50 Oe
0 10 20 30 40 50 60
50
40
30
20
10
Fig. 154. TbPdSn. Temperature dependence of σ at 50 and 100 Oe [94A5].
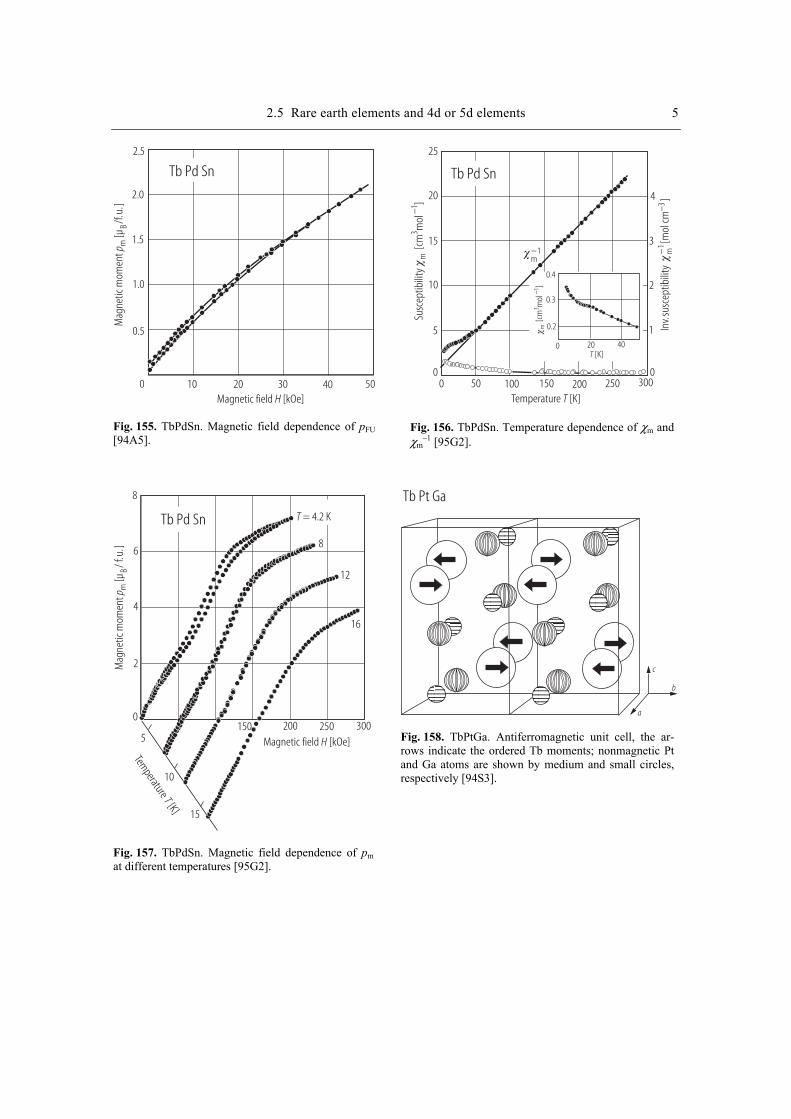
2.5 Rare earth elements and 4d or 5d elements 5
Tb Pd Sn
2.5
2.0
1.5
0.5
0
1.0
10 20 30 40 50Magnetic field [kOe]H
Mag
netic
mom
ent
[µ/f.
u.]
p mB
Fig. 155. TbPdSn. Magnetic field dependence of pFU [94A5].
Temperature [K]T
Inv.
susc
eptib
ility
[mol
cm]
−−3
1m
0100 200 300
Susc
eptib
ility
[cm
mol
]m
31−
Tb Pd Sn
25
20
15
10
5
0 50 150 250
4
3
2
1
0
0.4
0.3
0.2
0 20 40T [K]
[cm
mol
]m
31−
1m−
Fig. 156. TbPdSn. Temperature dependence of χm and χm
–1 [95G2].
Temperature
[K]T
Tb Pd Sn
Magnetic field [kOe]H
Mag
netic
mom
ent
[µ/ f
.u. ]
p mB
8
6
4
2
0
5
10
15
150 200 250 300
T = 4.2 K
8
12
16
Fig. 157. TbPdSn. Magnetic field dependence of pm at different temperatures [95G2].
Tb Pt Ga
a
b
c
Fig. 158. TbPtGa. Antiferromagnetic unit cell, the ar-rows indicate the ordered Tb moments; nonmagnetic Pt and Ga atoms are shown by medium and small circles, respectively [94S3].

6 2.5 Rare earth elements and 4d or 5d elements
Tb Pt Sn
a
aS1
S2
S3
Fig. 159. TbPtSn. Schematic representation of the Tb3+ magnetic moment distribution in a layer, the moment directions in the adjacent layers below and above are the reverse; the magnetic unit cell is doubled along the c direction, the moments make an angle of 56° with the c axis [96S2].
Temperature [K]T
Tb Pt Sn
Mag
netic
mom
ent
[]
p sBµ
/f.u
.
10.0
7.5
5.0
2.5
0 5 10 15
Fig. 160. TbPtSn. Temperature dependence of mag-netization from neutron diffractiom [96S2].
Temperature [K]T
Susc
eptib
ilitie
s‘,
‘’(re
lativ
e)
= 10 mTµ0 H
H cII
H cII
H aII
H aII
FCZFC
Mag
netiz
atio
n[A
mm
ol]
m2
1−
‘
‘
‘’
‘’
Dy Pd In2.0
1.5
1.0
0.5
0
0 10 20 30 40 50
a
b
Fig. 161. DyPdIn. Temperature dependence of (a) χ', χ'' and (b) σm at H || a and c [98N1].
Temperature [K]T
Inv.
susc
eptib
ility
[10
g cm
]g
33−
−1
25
20
15
10
5
0 100 200 300 400 500
Ho Pd Ge2 2Ho Pd Ge3 4 4Ho Pd GeHo Pt Ge2 2Ho Pt GeHo Au Ge
Fig. 162. HoPd2Ge2, Ho3Pd4Ge4, HoPdGe, HoPt2Ge2, HoPtGe. Temperature dependence of χg
–1. Solid lines: calculated [96S1].
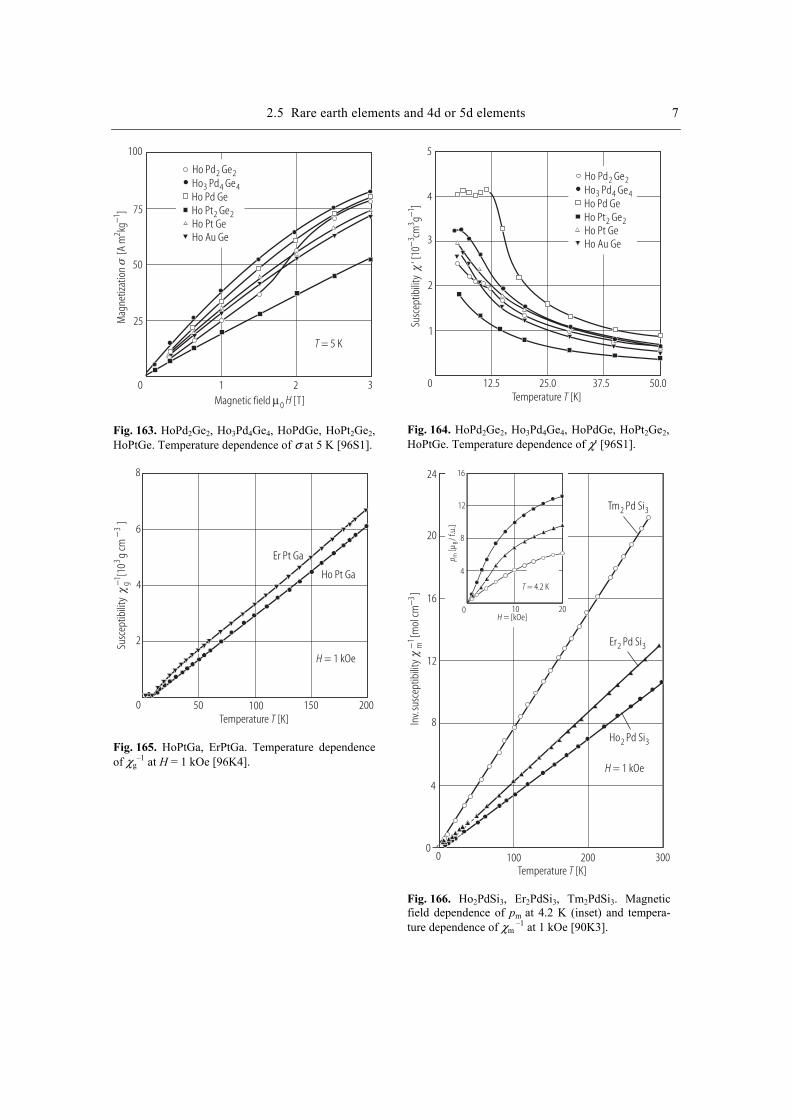
2.5 Rare earth elements and 4d or 5d elements 7
Ho Pd Ge2 2Ho Pd Ge3 4 4Ho Pd GeHo Pt Ge2 2Ho Pt GeHo Au Ge
Magnetic field [T]µ0 H
Mag
netiz
atio
n
[A m
kg]
21−
T = 5 K
100
75
50
25
0 1 2 3
Fig. 163. HoPd2Ge2, Ho3Pd4Ge4, HoPdGe, HoPt2Ge2, HoPtGe. Temperature dependence of σ at 5 K [96S1].
Ho Pd Ge2 2Ho Pd Ge3 4 4Ho Pd GeHo Pt Ge2 2Ho Pt GeHo Au Ge
Temperature [K]T
Susc
eptib
ility
‘ [10
cmg
]−
−3
31
5
4
3
2
1
0 25.012.5 50.037.5
Fig. 164. HoPd2Ge2, Ho3Pd4Ge4, HoPdGe, HoPt2Ge2, HoPtGe. Temperature dependence of χ' [96S1].
Temperature [K]T
Susc
eptib
ility
[10
g cm
]3
3−g−1
8
6
4
2
0 50 100 150 200
H = 1 kOe
Er Pt Ga
Ho Pt Ga
Fig. 165. HoPtGa, ErPtGa. Temperature dependence of χg
–1 at H = 1 kOe [96K4].
Temperature [K]T
Inv.
susc
eptib
ility
[mol
cm]
−−3
1m
0 100 200 300
Tm Pd Si2 3
Er Pd Si2 3
Ho Pd Si2 3
H = 1 kOe
24
20
16
12
8
4
0
H = [kOe]0 10 20
T = 4.2 K
8
4
p mB
[µ/ f
.u.]
12
16
Fig. 166. Ho2PdSi3, Er2PdSi3, Tm2PdSi3. Magnetic field dependence of pm at 4.2 K (inset) and tempera-ture dependence of χm
–1 at 1 kOe [90K3].
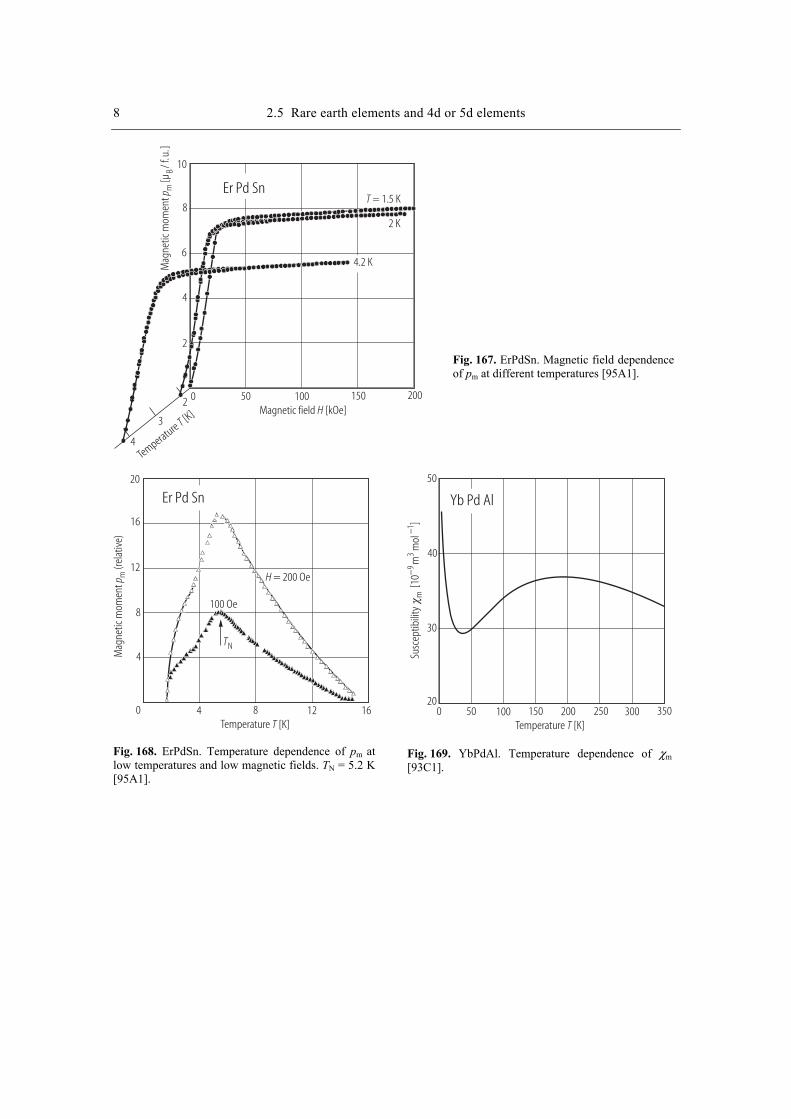
8 2.5 Rare earth elements and 4d or 5d elements
Temperature[K]
TMagnetic field [kOe]H
Mag
netic
mom
ent
[µ/ f
.u. ]
p mB
8
6
4
2
200100 150
T = 1.5 KEr Pd Sn
10
500
4
3
2
2 K
4.2 K
Fig. 167. ErPdSn. Magnetic field dependence of pm at different temperatures [95A1].
Mag
netic
mom
ent
(rela
tive)
p m
Temperature [K]T
Er Pd Sn
TN
100 Oe
H = 200 Oe
16
12
8
4
0
20
4 8 12 16
Fig. 168. ErPdSn. Temperature dependence of pm at low temperatures and low magnetic fields. TN = 5.2 K [95A1].
Temperature [K]T
Susc
eptib
ility
[10
mm
ol]
m9
31
−−
Yb Pd Al
50
40
30
200 100 200 300 35025015050
Fig. 169. YbPdAl. Temperature dependence of χm [93C1].
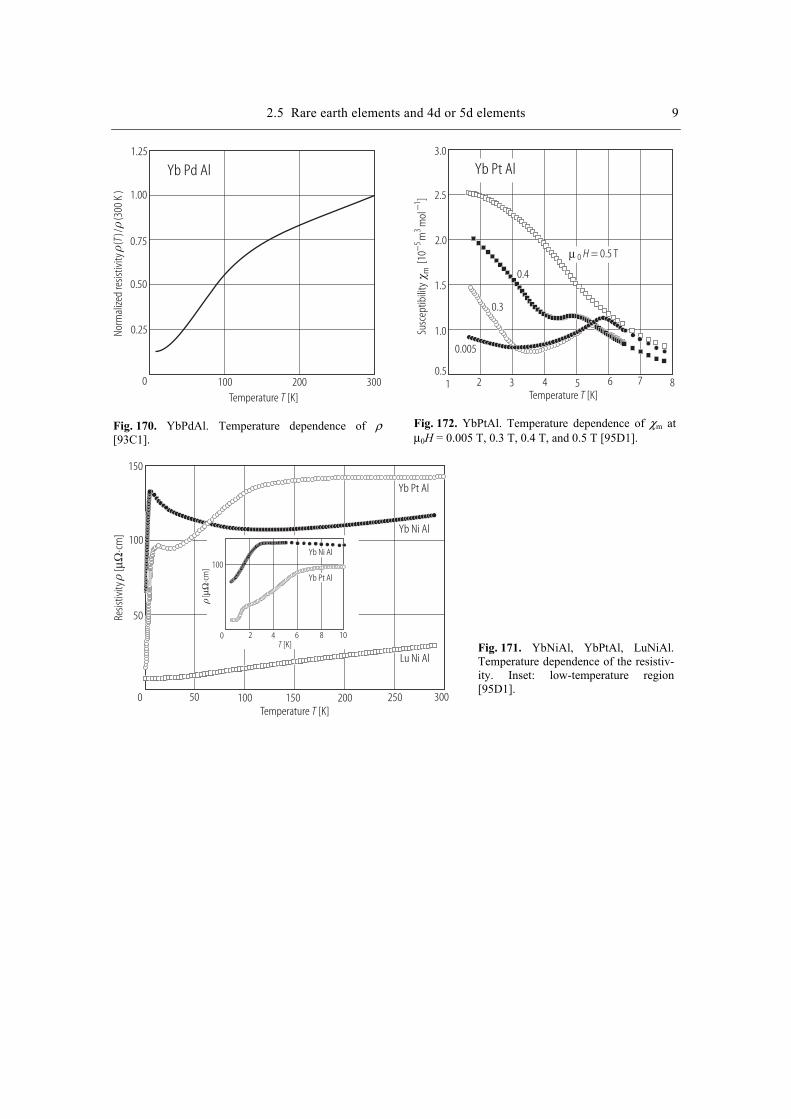
2.5 Rare earth elements and 4d or 5d elements 9
Yb Pd Al
Temperature [K]T
Norm
alize
d re
sistiv
ity
()/
(300
K )
T
1.25
1.00
0.75
0.50
0.25
0 100 200 300
Fig. 170. YbPdAl. Temperature dependence of ρ [93C1].
Temperature [K]T
Susc
eptib
ility
[10
mm
ol]
m5
31
−−
3.0
2.5
2.0
1.5
1.0
0.51 2 3 4 5 6 7 8
µ 0 H = 0.5 T
0.4
0.3
0.005
Yb Pt Al
Fig. 172. YbPtAl. Temperature dependence of χm at µ0H = 0.005 T, 0.3 T, 0.4 T, and 0.5 T [95D1].
Temperature [K]T
[K]T
Resis
tivity
[
cm]
µΩ⋅
[cm
]µΩ
⋅
150
100
50
0 50 100 150 200 250 300
Lu Ni Al
Yb Ni Al
Yb Pt Al
100
0 2 4 6 8 10
Yb Ni Al
Yb Pt Al
Fig. 171. YbNiAl, YbPtAl, LuNiAl. Temperature dependence of the resistiv-ity. Inset: low-temperature region [95D1].
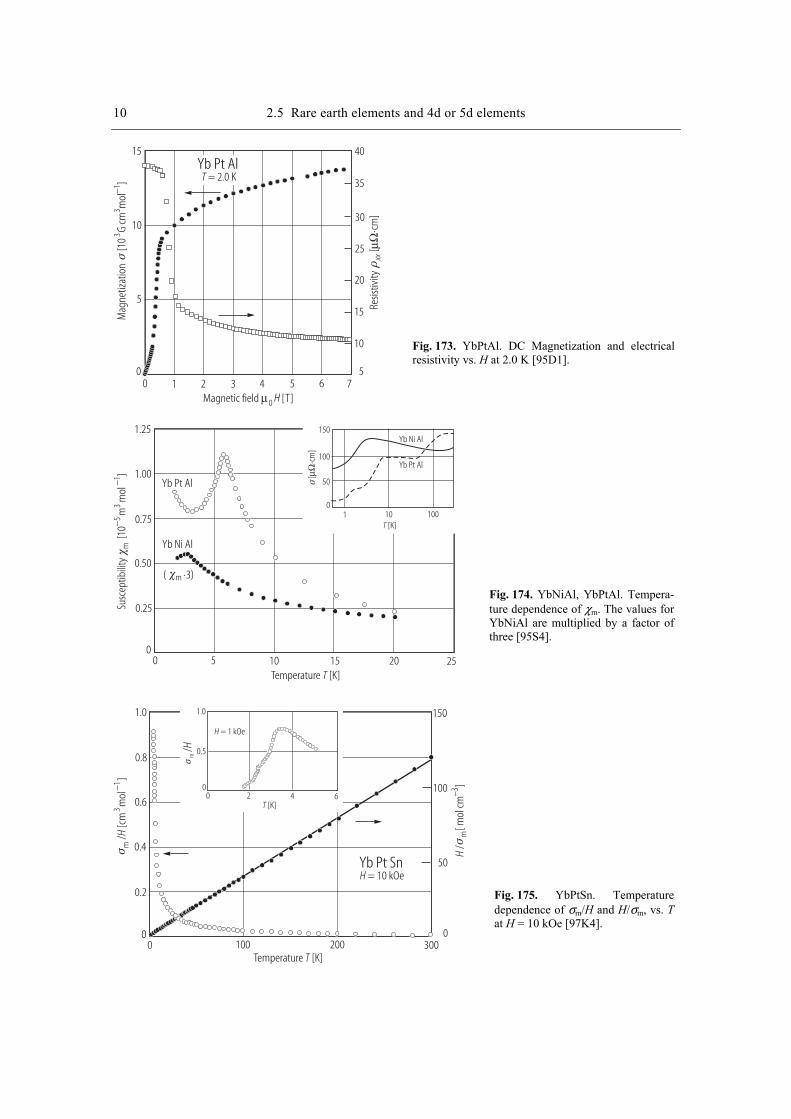
10 2.5 Rare earth elements and 4d or 5d elements
Yb Pt Al
Mag
netiz
atio
n
[10
G cm
mol
]3
31−
Magnetic field [T]µ0 H
T = 2.0 K
Resis
tivity
[cm
]µΩ
⋅xx
15
10
5
00 1 2 3 54 6 7
40
35
30
25
20
15
10
5
Fig. 173. YbPtAl. DC Magnetization and electrical resistivity vs. H at 2.0 K [95D1].
Temperature [K]T
Susc
eptib
ility
[10
mm
ol]
m5
31
−− Yb Pt Al
Yb Ni Al
1.00
0.50
0
0.25
0.75
1.25
0 5 10 15 20 25
( 3)⋅m
[K]T
Yb Ni Al
Yb Pt Al
[cm
]µΩ
⋅
150
100
50
01 10 100
Fig. 174. YbNiAl, YbPtAl. Tempera-ture dependence of χm. The values for YbNiAl are multiplied by a factor of three [95S4].
Temperature [K]T
[K]T
1.0
0.8
0.6
0.4
0.2
00 100 200 300
150
100
50
0
Yb Pt SnH = 10 kOe
H = 1 kOe
m3
1/
[cm
mol
]H
−
m/H
H/
[ mol
cm]
m3−
1.0
0.5
00 2 4 6
Fig. 175. YbPtSn. Temperature dependence of σm/H and H/σm, vs. T at H = 10 kOe [97K4].
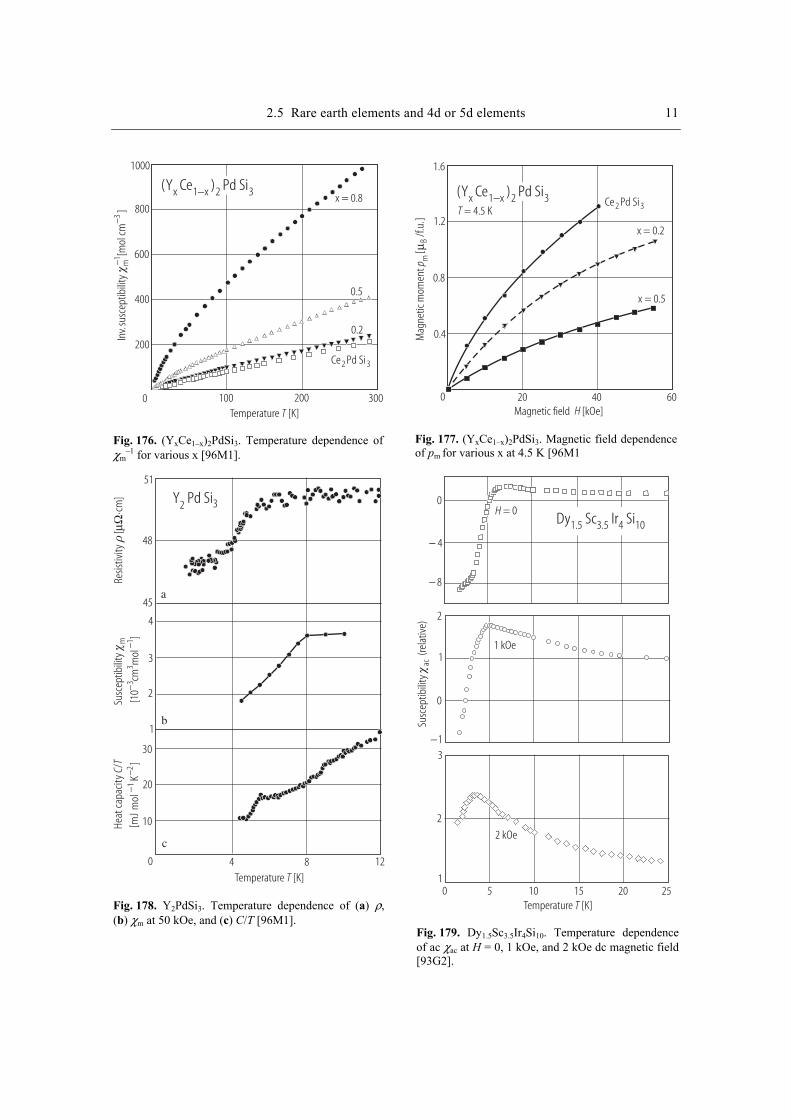
2.5 Rare earth elements and 4d or 5d elements 11
Temperature [K]T
Inv.
susc
eptib
ility
[mol
cm]
m3−
−1
1000
800
600
400
200
0 100 200 300
x = 0.8
0.5
0.2
Ce Pd Si2 3
(Y Ce ) Pd Six 1 x 2 3−
Fig. 176. (YxCe1–x)2PdSi3. Temperature dependence of χm
–1 for various x [96M1].
Ce Pd Si2 3
(Y Ce ) Pd Six 1 x 2 3−
Magnetic field [kOe]HM
agne
tic m
omen
t[
]p m
Bµ/f.
u.
1.6
1.2
0.8
0.4
0 20 40 60
x = 0.5
x = 0.2
T = 4.5 K
Fig. 177. (YxCe1–x)2PdSi3. Magnetic field dependence of pm for various x at 4.5 K [96M1
Temperature [K]T
Susc
eptib
ility
[10
cmm
ol]m
33
1−
−He
atca
paci
ty/
[mJ
mol
K]
CT
−−
12
Resis
tivity
[
cm]
µΩ⋅
0 4 8 12
51
48
45
4
3
2
1
30
20
10
a
b
c
Y Pd Si2 3
Fig. 178. Y2PdSi3. Temperature dependence of (a) ρ, (b) χm at 50 kOe, and (c) C/T [96M1].
Temperature [K]T
Susc
eptib
ility
(rela
tive)
ac
0
− 4
− 8
2
1
0
−13
2
10 5 10 15 20 25
H = 0
1 kOe
2 kOe
Dy Sc Ir Si1.5 3.5 4 10
Fig. 179. Dy1.5Sc3.5Ir4Si10. Temperature dependence of ac χac at H = 0, 1 kOe, and 2 kOe dc magnetic field [93G2].
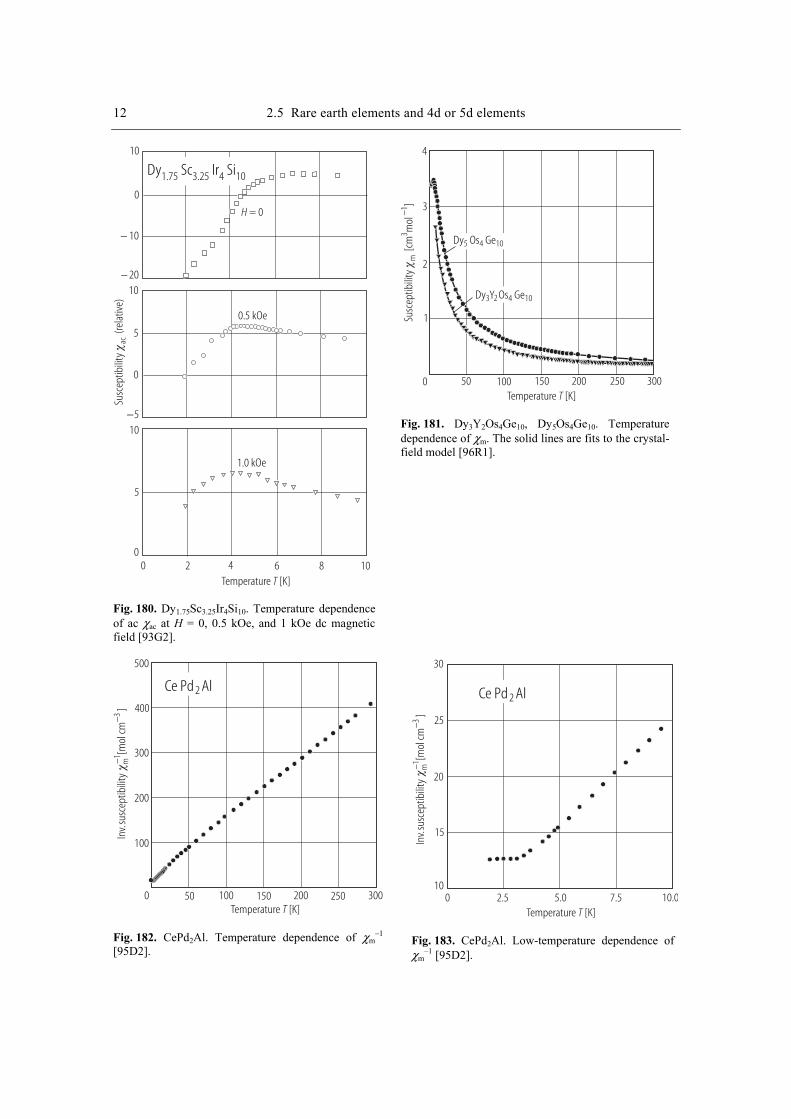
12 2.5 Rare earth elements and 4d or 5d elements
Temperature [K]T
Susc
eptib
ility
(rela
tive)
ac
− 10
− 20
−5
H = 0
0.5 kOe
1.0 kOe
Dy Sc Ir Si1.75 3.25 4 10
0
10
10
5
0
10
5
00 2 4 6 8 10
Fig. 180. Dy1.75Sc3.25Ir4Si10. Temperature dependence of ac χac at H = 0, 0.5 kOe, and 1 kOe dc magnetic field [93G2].
Temperature [K]TSu
scep
tibili
ty[c
mm
ol]
m3
1−
4
3
2
1
0 50 100 150 200 250 300
Dy Os Ge5 4 10
Dy Os Ge3 4 10Y2
Fig. 181. Dy3Y2Os4Ge10, Dy5Os4Ge10. Temperature dependence of χm. The solid lines are fits to the crystal-field model [96R1].
Temperature [K]T
Inv.
susc
eptib
ility
[mol
cm]
m3−
−1
500
400
300
200
100
0 50 100 150 200 250 300
Ce Pd Al2
Fig. 182. CePd2Al. Temperature dependence of χm
–1 [95D2].
Temperature [K]T
Inv.
susc
eptib
ility
[mol
cm]
m3−
−1
Ce Pd Al2
30
20
10
15
25
0 2.5 5.0 7.5 10.0
Fig. 183. CePd2Al. Low-temperature dependence of χm
–1 [95D2].
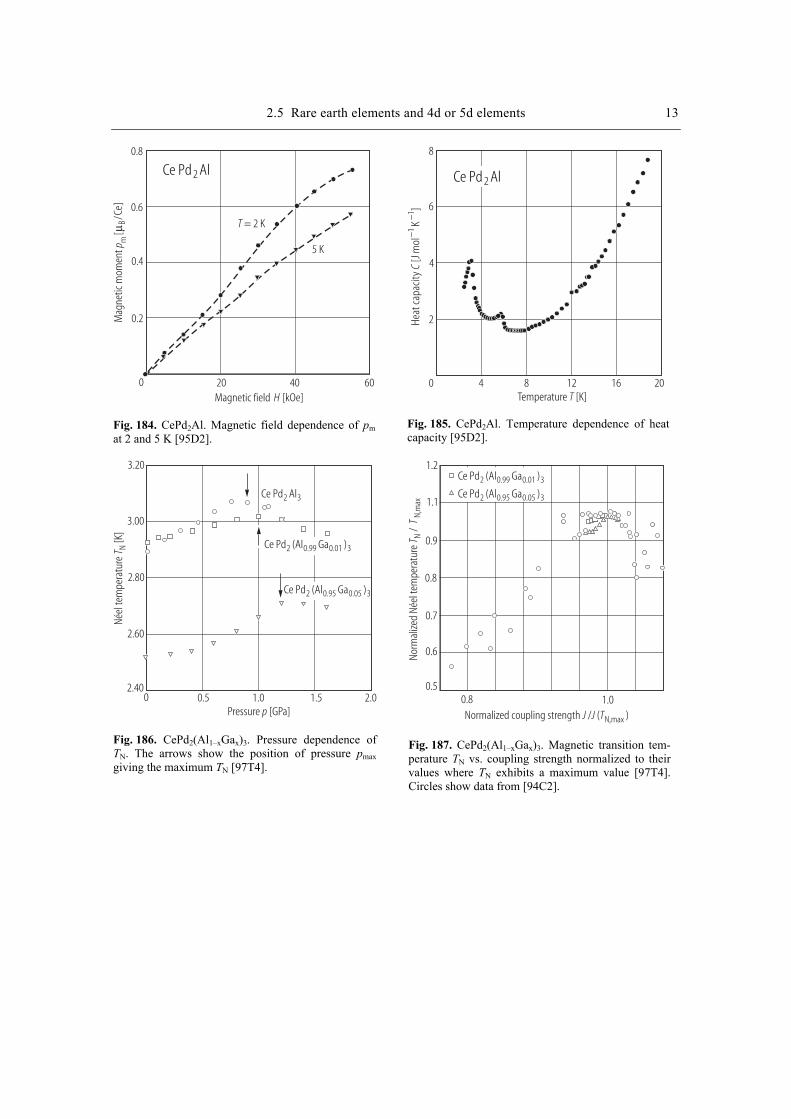
2.5 Rare earth elements and 4d or 5d elements 13
Ce Pd Al2
Magnetic field [kOe]H
Mag
netic
mom
ent
[]
p mBµ
/Ce
0.8
0.4
0.6
0.2
0 20 40 60
T = 2 K
5 K
Fig. 184. CePd2Al. Magnetic field dependence of pm at 2 and 5 K [95D2].
Temperature [K]T
Heat
capa
city
[Jm
olK
]C
−−
11
8
6
4
2
0 4 8 12 16 20
Ce Pd Al2
Fig. 185. CePd2Al. Temperature dependence of heat capacity [95D2].
Néel
tem
pera
ture
[K]
T N
Pressure [GPa]p
Ce Pd Al2 3
Ce Pd (Al Ga )2 0.99 0.01 3
Ce Pd (Al Ga )2 0.95 0.05 3
3.20
3.00
2.80
2.60
2.400 0.5 1.0 1.5 2.0
Fig. 186. CePd2(Al1–xGax)3. Pressure dependence of TN. The arrows show the position of pressure pmax giving the maximum TN [97T4].
Norm
alize
d Né
el te
mpe
ratu
re/
TT
NN,
max
Ce Pd (Al Ga )2 0.99 0.01 3
Ce Pd (Al Ga )2 0.95 0.05 3
1.2
1.1
0.9
0.8
0.7
0.6
0.50.8 1.0Normalized coupling strength / ( )J J TN,max
Fig. 187. CePd2(Al1–xGax)3. Magnetic transition tem-perature TN vs. coupling strength normalized to their values where TN exhibits a maximum value [97T4]. Circles show data from [94C2].
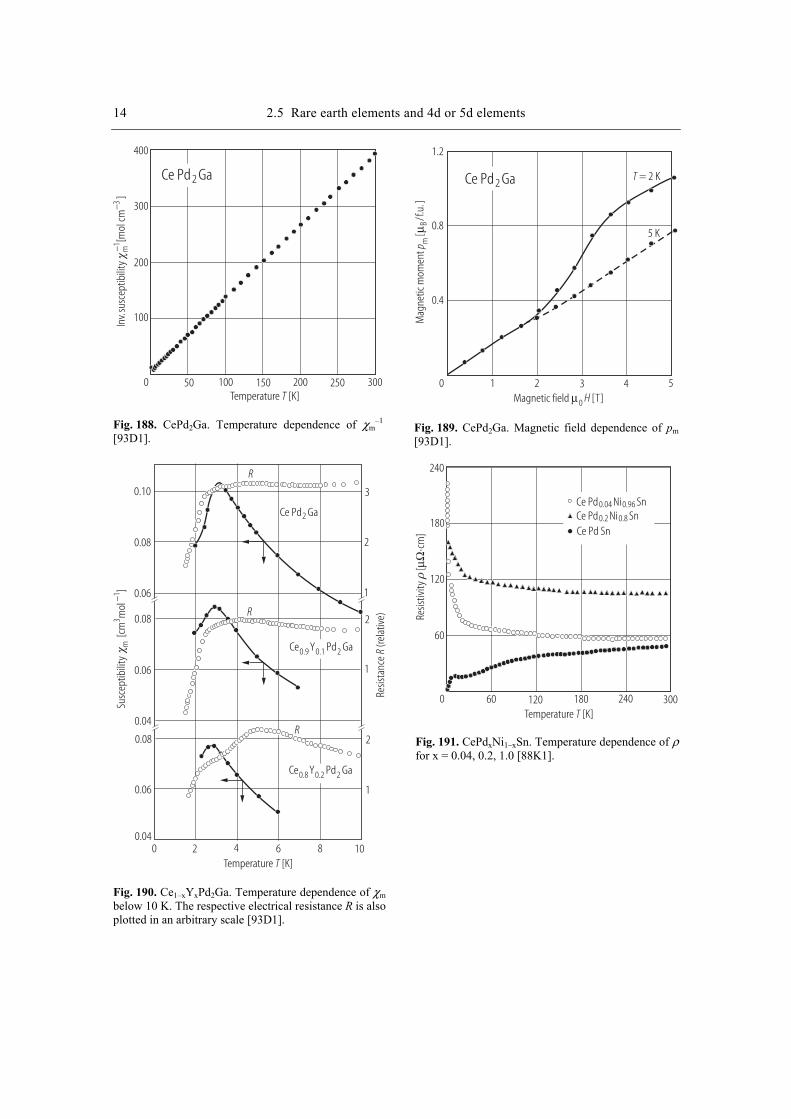
14 2.5 Rare earth elements and 4d or 5d elements
Temperature [K]T
Inv.
susc
eptib
ility
[mol
cm]
m3−
−1
400
300
200
100
0 50 100 150 200 250 300
Ce Pd Ga2
Fig. 188. CePd2Ga. Temperature dependence of χm
–1 [93D1].
Mag
netic
mom
ent
[]
p mBµ
/f.u
.
T = 2 K
5 K
Magnetic field [T]µ0 H
Ce Pd Ga2
1.2
0.8
0.4
0 1 2 3 4 5
Fig. 189. CePd2Ga. Magnetic field dependence of pm [93D1].
Temperature [K]T
Susc
eptib
ility
[cm
mol
]m
31−
0.10
0.08
0.06
0.08
0.06
0.04
0.08
0.06
0.040 2 4 6 8 10
3
2
1
2
1
2
1
Resis
tanc
e(re
lativ
e)R
R
R
R
Ce Pd Ga2
Ce Y Pd Ga0.9 0.1 2
Ce Y Pd Ga0.8 0.2 2
Fig. 190. Ce1–xYxPd2Ga. Temperature dependence of χm below 10 K. The respective electrical resistance R is also plotted in an arbitrary scale [93D1].
Temperature [K]T0 120 240 300
Resis
tivity
[
cm]
µΩ⋅
60 180
240
180
120
60
Ce Pd Ni Sn0.04 0.96Ce Pd Ni Sn0.2 0.8
Ce Pd Sn
Fig. 191. CePdxNi1–xSn. Temperature dependence of ρ for x = 0.04, 0.2, 1.0 [88K1].
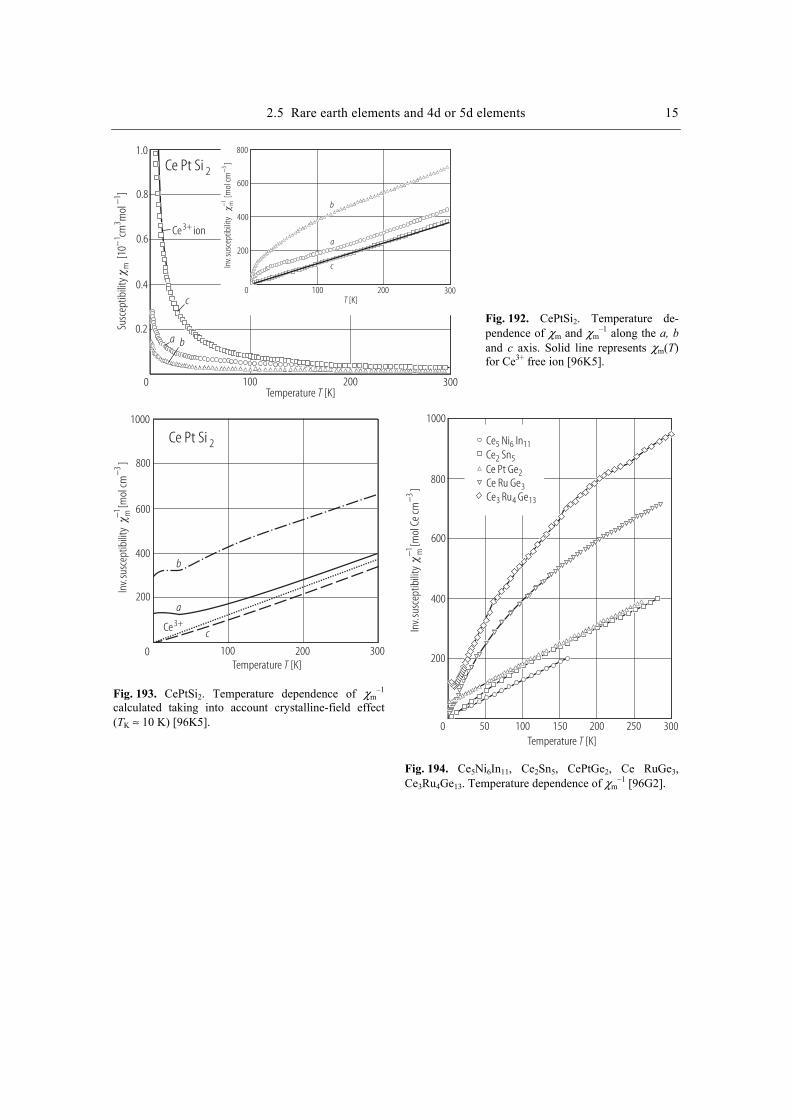
2.5 Rare earth elements and 4d or 5d elements 15
Temperature [K]T
Susc
eptib
ility
[10
cmm
ol]
m1
31
−−
1.0
0.8
0.6
0.4
0.2
0 100 200 300
Ce Pt Si 2
Ce ion3+
c
c
a
a
b
b
0 100 200 300T [K]
800
600
400
200
Inv.
susc
eptib
ility
[mol
cm]
−−
1 m3
Fig. 192. CePtSi2. Temperature de-pendence of χm and χm
–1 along the a, b and c axis. Solid line represents χm(T) for Ce3+ free ion [96K5].
Temperature [K]T
Ce Pt Si 2
Ce3+c
a
b
Inv.
susc
eptib
ility
[mol
cm]
−−
1 m3
1000
0
200
400
600
800
100 200 300
Fig. 193. CePtSi2. Temperature dependence of χm
–1 calculated taking into account crystalline-field effect (TK ≈ 10 K) [96K5].
Temperature [K]T
Inv.
susc
eptib
ility
[mol
Ce
cm]
−−
1 m3
1000
0
200
400
600
800
100 200 30050 150 250
Ce Ni In5 6 11Ce Sn2 5Ce Pt Ge2Ce Ru Ge3Ce Ru Ge3 4 13
Fig. 194. Ce5Ni6In11, Ce2Sn5, CePtGe2, Ce RuGe3, Ce3Ru4Ge13. Temperature dependence of χm
–1 [96G2].

16 2.5 Rare earth elements and 4d or 5d elements
Temperature [K]T
[K]T
Inv.
susc
eptib
ility
[mol
cm]
−−
1 m3
0 100 200 300
Gd Mo Si2 3
18
16
14
12
10
8
6
4
2
50 150 250
40
30
20
10
0 5 10 15 20 25 30H [ kOe ]
H = 2 kOe
[ G cm
g]
31−
2.0
1.5
1.0
0.5
0 4 8 12 16 20
m3
1[ c
mm
ol]
−
T = 5 K
Fig. 195. Gd2Mo3Si4. Temperature dependence of χm
–1 at 2 kOe. Insets: χm vs. T and σ vs. H [95L1].
Temperature [K]T
[K]T
Inv.
susc
eptib
ility
[mol
cm]
−−
1 m3
0 100 200 300
14
12
10
8
6
4
2
50 150 250
0 5 10 15 20 25 30H [ kOe ]
H = 2 kOe
[ G cm
g]
31−
0
m3
1[ c
mm
ol]
−
T = 5 K
H = 1 kOe
5 10 15 20 25
1.501.25
1.00
0.75
0.50
0.25
70605040302010
Tb Mo Si2 3 4
Fig. 196. Tb2Mo3Si4. Temperature de-pendence of χm
–1 at 2 kOe. Insets: χm vs. T and σ vs. H [95L1].
Temperature [K]T
[K]T
Inv.
susc
eptib
ility
[mol
cm]
−−
1 m3
0 100 200 300
12
10
8
6
4
2
50 150 250
H [ kOe ]
H = 1 kOe
[ G cm
g]
31−
m3
1[ c
mm
ol]
−
T = 5 K
Dy Mo Si2 3 4
80
60
40
20
0 5 10 15 20 25 30
5
4
3
2
1
0 5 10 15 20
Fig. 197. Dy2Mo3Si4. Temperature de-pendence of χm
–1 at 1 kOe. Insets: χm vs. T and σ vs. H [95L1].

2.5 Rare earth elements and 4d or 5d elements 17
Temperature [K]T
[K]T
Inv.
susc
eptib
ility
[mol
cm]
−−
1 m3
0 100 200 300
12
10
8
6
4
2
50 150 250
H [ kOe ]
H = 1 kOe
[ G cm
g]
31−
m3
1[ c
mm
ol]
−
T = 5 K
Ho Mo Si2 3 4
80
60
40
20
0 5 10 15 20 25 30
12
14
10
8
60 1 2 3 4 5 6 7 8
H = 2 kOe
Fig. 198. Ho2Mo3Si4. Temperature dependence of χm
–1 at 1 kOe. Insets: χm vs. T and σ vs. H [95L1].
Temperature [K]T
[K]T
Inv.
susc
eptib
ility
[mol
cm]
−−
1 m3
0 100 200 300
12
10
8
6
4
2
50 150 250
H [ kOe ]
H = 1 kOe
[ G cm
g]
31−
m3
1[ c
mm
ol]
−
T = 5 K
Er Mo Si2 3 4
60
40
20
0 2 4 6 8 10 12
5
4
3
2
1
0 5 10 15 20
Fig. 199. ErGd2Mo3Si4. Temperature dependence of χm
–1 at 1 kOe. Insets: χm vs. T and σ vs. H [95L1].
Temperature [K]T
[K]T
Inv.
susc
eptib
ility
[mol
cm]
−−
1 m3
0 100 200 30050 150 250
H [ kOe ]
H = 1 kOe
[ G cm
g]
31−
T = 5 K
Tm Mo Si2 3 4
60
40
20
0
0 5 10 15 20
24
20
16
12
8
4
5 10 15 20 25 30
m3
1[ c
mm
ol]
−
3.0
2.5
2.01.5
1.0
0.5
Fig. 200. Tm2Mo3Si4. Temperature dependence of χm
–1 at 1 kOe. Insets: χm vs. T and σ vs. H [95L1].
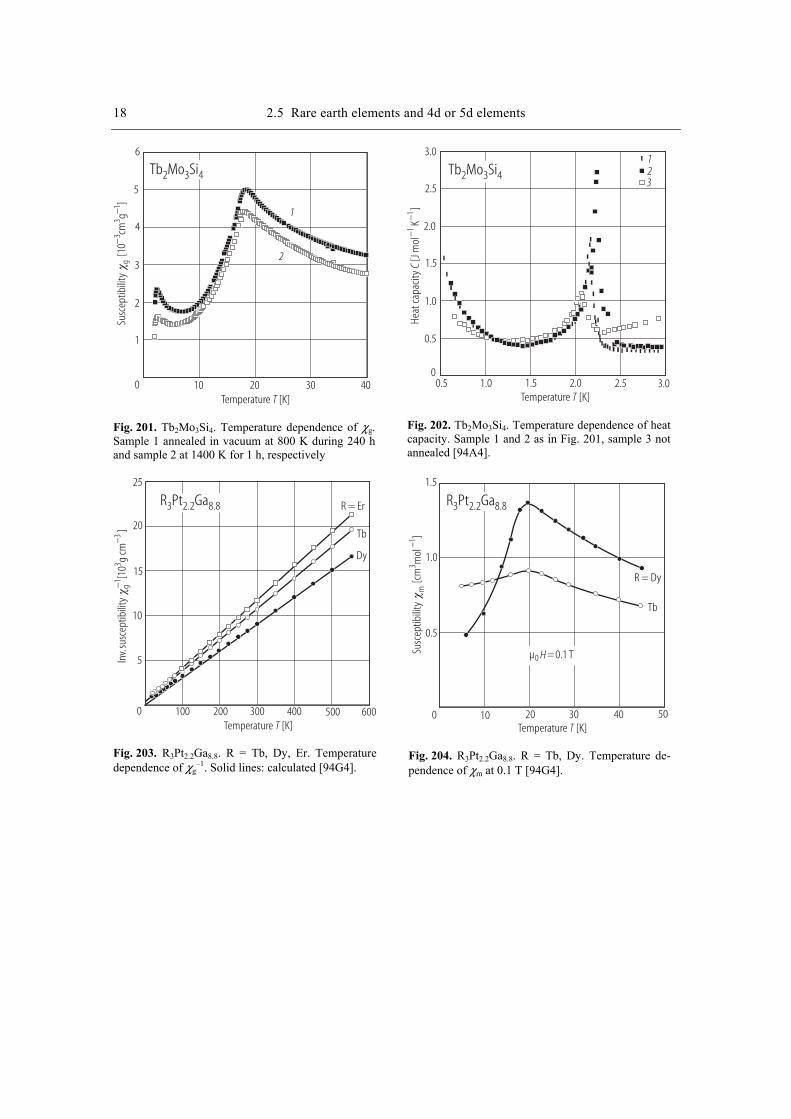
18 2.5 Rare earth elements and 4d or 5d elements
Temperature [K]T
Susc
eptib
ility
[10
cmg
]g
33
1−
−
Tb Mo Si2 3 4
6
5
4
3
2
1
0 10 20 30 40
1
2
Fig. 201. Tb2Mo3Si4. Temperature dependence of χg. Sample 1 annealed in vacuum at 800 K during 240 h and sample 2 at 1400 K for 1 h, respectively
Temperature [K]T
Tb Mo Si2 3 4
123
3.0
2.5
2.0
1.5
1.0
0.5
00.5 1.5 2.52.0 3.01.0
Heat
capa
city
[Jm
olK
]C
−−
11
Fig. 202. Tb2Mo3Si4. Temperature dependence of heat capacity. Sample 1 and 2 as in Fig. 201, sample 3 not annealed [94A4].
Temperature [K]T
R Pt Ga3 2.2 8.8
Inv.
susc
eptib
ility
[10
g cm
]g
33−
−1
25
20
15
10
5
0 100 200 300 400 500 600
R = Er
Tb
Dy
Fig. 203. R3Pt2.2Ga8.8. R = Tb, Dy, Er. Temperature dependence of χg
–1. Solid lines: calculated [94G4].
Temperature [K]T
R Pt Ga3 2.2 8.8
R = Dy
Tb
Susc
eptib
ility
[cm
mol
]m
31−
1.5
1.0
0.5
0 10 20 30 40 50
µ =0.1 T0 H
Fig. 204. R3Pt2.2Ga8.8. R = Tb, Dy. Temperature de-pendence of χm at 0.1 T [94G4].
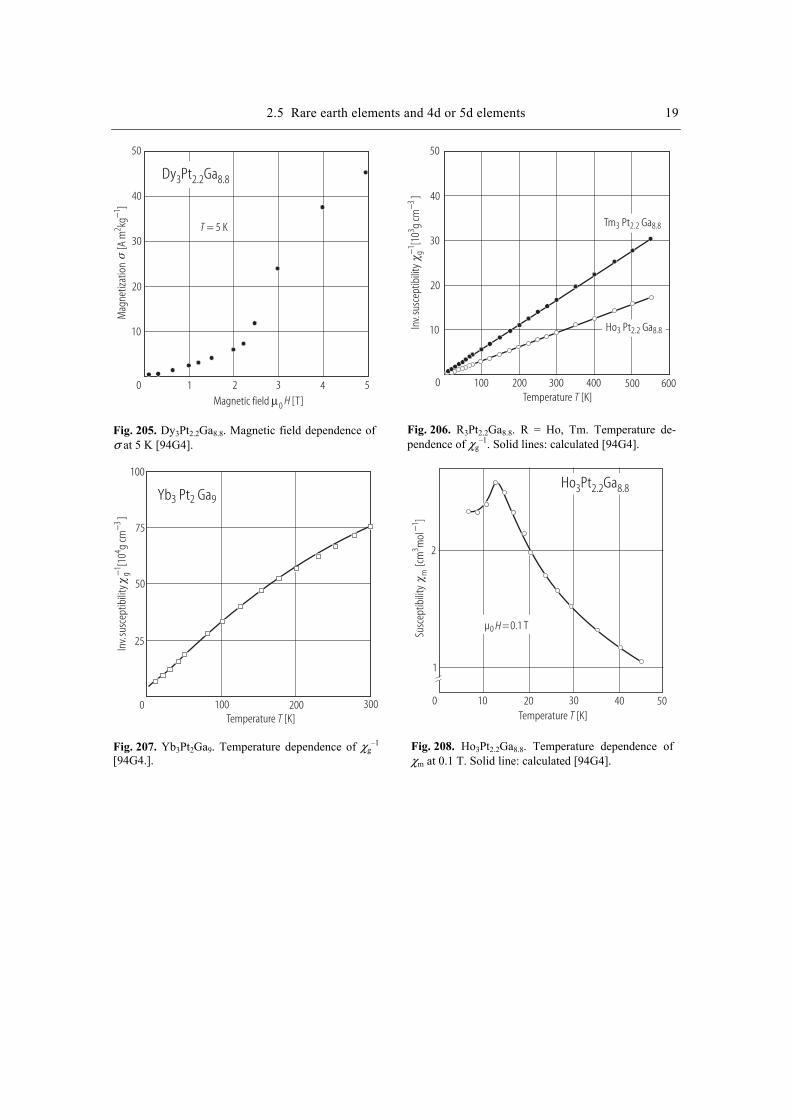
2.5 Rare earth elements and 4d or 5d elements 19
Magnetic field [T]µ0 H
Mag
netiz
atio
n
[A m
kg]
21−
T = 5 K
Dy Pt Ga3 2.2 8.8
50
40
30
20
10
0 1 2 3 4 5
Fig. 205. Dy3Pt2.2Ga8.8. Magnetic field dependence of σ at 5 K [94G4].
Temperature [K]T
Inv.
susc
eptib
ility
[10
g cm
]g
33−
−1
0 100 200 300 400 500 600
Tm Pt Ga3 2.2 8.8
Ho Pt Ga3 2.2 8.8
50
40
30
20
10
Fig. 206. R3Pt2.2Ga8.8. R = Ho, Tm. Temperature de-pendence of χg
–1. Solid lines: calculated [94G4].
Temperature [K]T
Inv.
susc
eptib
ility
[10
g cm
]g
43−
−1
0 100 200 300
Yb Pt Ga3 2 9
50
100
75
25
Fig. 207. Yb3Pt2Ga9. Temperature dependence of χg
–1 [94G4.].
Temperature [K]T
Ho Pt Ga3 2.2 8.8
Susc
eptib
ility
[cm
mol
]m
31−
1
0 10 20 30 40 50
µ =0.1 T0 H
2
Fig. 208. Ho3Pt2.2Ga8.8. Temperature dependence of χm at 0.1 T. Solid line: calculated [94G4].
References
88K1 Kasaya, M., Tani, T., Iga, F., Kasuya, T.: J. Magn. Magn. Mater. 76-77 (1988) 278 90K3 Kotsanidis, P., A., Yakinthos, J., K., Gamari-Seale, E.: J. Magn. Magn. Mater. 87 (1990) 199 93C1 Cordier, G., Friedrich, T., Henseleit, R., Grauel, A., Tegel, U., Schank, Ch., Geibel, Ch.: J.
Alloys Comp. 201 (1993) 197 93D1 Das, I., Sampathkumaran, E.V., Chari, S., Gopalakrishnan, K.V.: J. Alloys Comp. 202 (1993)
L7 93G2 Ghosh, K., Ramakrishnan, S., Nigan, A.K., Chandra, G.: J. Appl. Phys. 73 (1993) 6637 94A4 Aliev, F.G., Gorelenko, Yu.K., Pryadun, V.V., Vieira, S., Villar, R., Paredes, J.: Physica B
194-196 (1994) 171 94A5 Andre, G., Bouree, F., Bombik, A., Oles, A., Sikora, W., Kolenda, M., Szytula, A., Pacyna, A.,
Zygmunt, A.: Acta Phys. Pol. 85 (1994) 275 94C2 Cornelius, A.L., Schilling, J.S.: Phys. Rev. B 49 (1994) 3955 94G4 Gignoux, D., Schmitt, D.: J. Magn. Magn. Mater. 129 (1994) 53 94S3 Schäfer, W., Jansen, E., Will, G., Kosanidis, P.A., Yakinthos, J.K., Tietze-Jaensch.: J. Alloys
Comp. 209 (1994) 225 95A1 Andre, G., Bouree, F., Guillot, M., Kolenda, M., Oles, A., Sikora, W., Szytula, A., Zygmunt,
A.: J. Magn. Magn. Mater. 140-144 (1995) 879 95D1 Diehl, J., Davideit, H., Klimm, S., Tegel, U., Geibel, C., Steglich, F., Horn, S.: Physica B 206-
207 (1995) 344 95D2 Das, I., Sampathkumaran, E.V., Rajarajan, A.K.: J. Alloys Comp. 218 (1995) L11 95G2 Guillot, M., Szytula, A., Tomkowicz, Z., Zach, R.: J. Alloys Comp. 226 (1995) 131 95L1 Le Bihan, T., Noel, H.: J. Alloys Comp. 227 (1995) 154 95S2 Sakurai, J., Kegai, K., Kuwai, T., Isikawa, Y., Nisimura, K., Mori, K.: J. Magn. Magn. Mater.
140-144 (1995) 875 95S4 Schank, C., Olesch, G., Kohler, J., Tegel, U., Klinger, U., Diehl, J., Klimm, S., Sparn, G.,
Horn, S., Geibel, C., Steglich, F.: J. Magn. Magn. Mater. 140-144 (1995) 1237 96G2 Gschneidner, jr., K.A., Pecharsky, V.K.: Physica B 223-224 (1996) 131 96K4 Kotsanidis, P.A., Jakinthos, J.K., Schafer, W., Gamari-Seale, Hel.: J. Alloys Comp. 235 (1996)
188 96K5 Kasaya, M., Ito, M., Ono, A., Sakai, O.: Physica B 223-224 (1996) 336 96M1 Malik, R., Sampathkumaran, E.V.: J. Magn. Magn. Mater. 164 (1996) L13 96R1 Ramakrishnan, S., Ghosh, K.: Physica B 223-224 (1996) 154 96S1 Sologub, O., Hiebl, K., Rogl, P., Noel, H.: J. Alloys Comp. 245 (1996) L13 96S2 Szytula, A., Kolenda, M., Leciejewicz, J., Stuesser, N.: J. Magn. Magn. Mater. 164 (1996) 37797K4 Katoh, K., Tababatake, T., Minami, A., Oguro, I., Sawa, H.: J Alloys Comp. 261 (1997) 32 97T4 Tang, J., Kitazawa, H., Matsushita, A., Matsumoto, T.: Physica B 230-232 (1997) 208 98I1 Ito, T., Nishigori, S., Hiromitsu, I., Kurisu, M.: J. Magn. Magn. Mater. 177-181 (1998) 1079 98N1 Nishigori, S., Hirooka, Y., Ito, T.: J. Magn. Magn. Mater. 177-181 (1998) 137

2.5 Rare earth elements and 4d or 5d elements 1
Temperature [K]T
Susc
eptib
ility
[cm
mol
]m
31−
H cII
H c
T
0.14
0.12
0.10
0.08
0.06
0.04
0.02
1 10 100
x = 0.9
0.7
0.5
0.20.15
0.05
0.90 0
(Y La ) Ce Ru Si0.37 0.63 x 1-x 2 2
0.1
Fig. 209. (Y0.37La0.63)xCe1–xRu2Si2. Temperature dependence of χm for different x [95M2].
Magnetic field [T]µ0 H
T = 1.5 KH cII
Mag
netic
mom
ent
[p m
Bµ/ C
e]
x = 00.05
0.150.50.9
(Y La ) Ce Ru Si0.37 0.63 x 1-x 2 2
1.5
1.0
0.5
0 5 10 15 20 25
Fig. 210. (Y0.37La0.63)xCe1–xRu2Si2. Mag-netization vs. H for different x and H || c at 1.5 K [95M2].
Temperature [K]T
Susc
eptib
ility
[cm
m(ol
Ce)
]m
31−
n = 20
x = 0.9
x =0
n = 10
n = 100
(Y La ) Ce Ru Si0.37 0.63 x 1-x 2 2
imp
0.16
0.14
0.12
0.10
0.08
0.06
0.04
0.02
01 10 102
2 4 6 8 2 24 6 8
Fig. 211. (Y0.37La0.63)xCe1–xRu2Si2. Simulation of χ(T) for random lattice Kondo system, data for x = 0 and x = 0.9. For comparison see Fig. 209. χimp: Kondo impurity susceptibility, n: density of the Ce ions in a region of the simulations [95M2].
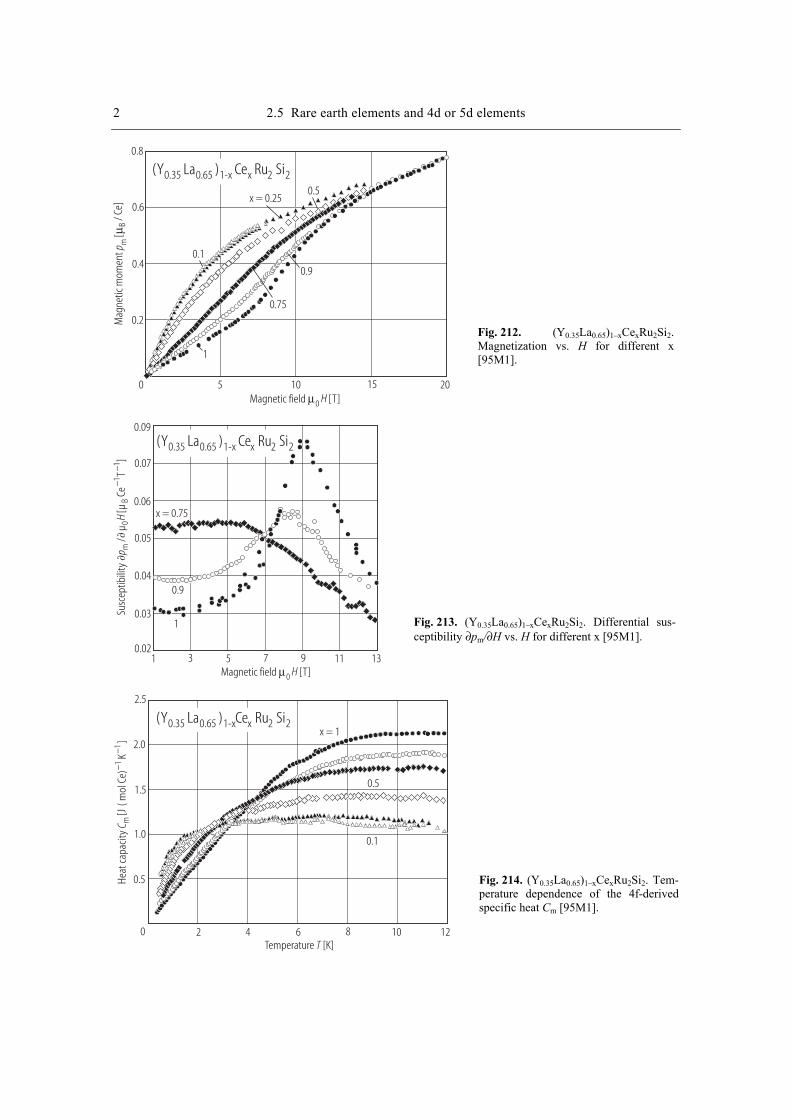
2 2.5 Rare earth elements and 4d or 5d elements
Magnetic field [T]µ0 H
Mag
netic
mom
ent
[p m
Bµ/ C
e]
x = 0.25
(Y La ) Ce Ru Si0.35 0.65 1-x x 2 2
0.1
1
0.8
0.6
0.4
0.2
0 5 10 15 20
0.5
0.9
0.75
Fig. 212. (Y0.35La0.65)1–xCexRu2Si2. Magnetization vs. H for different x [95M1].
Magnetic field [T]µ0 H
(Y La ) Ce Ru Si0.35 0.65 1-x x 2 2
x = 0.75
0.9
1
1 3 5 7 9 11 13
0.09
0.07
0.06
0.05
0.04
0.03
0.02
Susc
eptib
ility
/µ
[ µCe
T]
pH
m0
B1
1−
−
Fig. 213. (Y0.35La0.65)1–xCexRu2Si2. Differential sus-ceptibility ∂pm/∂H vs. H for different x [95M1].
Temperature [K]T
Heat
capa
city
[J( m
olCe
)K
]C m
11
−−
(Y La ) Ce Ru Si0.35 0.65 1-x x 2 2x = 1
0.5
0.1
2.5
2.0
1.5
1.0
0.5
0 2 4 6 8 10 12
Fig. 214. (Y0.35La0.65)1–xCexRu2Si2. Tem-perature dependence of the 4f-derived specific heat Cm [95M1].
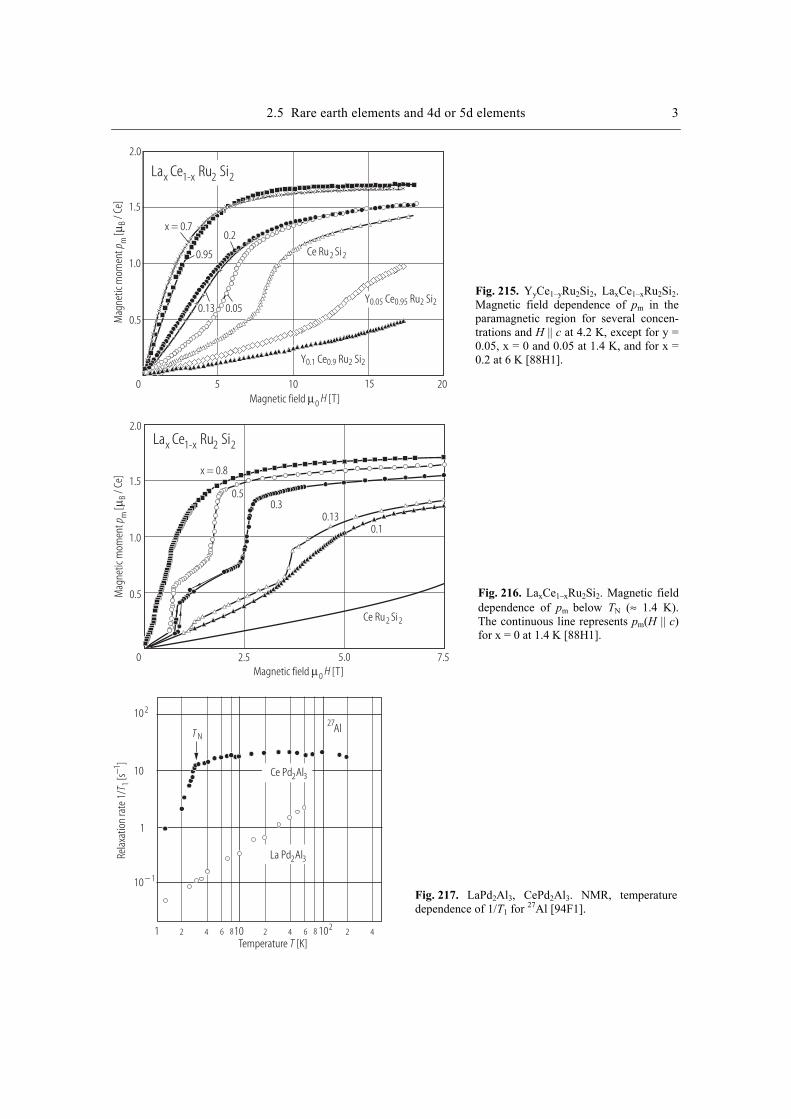
2.5 Rare earth elements and 4d or 5d elements 3
Magnetic field [T]µ0 H
Mag
netic
mom
ent
[p m
Bµ/ C
e]
x = 0.7
La Ce Ru Six 1-x 2 2
0 5 10 15 20
0.95
0.2
0.13 0.05
Ce Ru Si2 2
Y Ce Ru Si0.05 0.95 2 2
Y Ce Ru Si0.1 0.9 2 2
2.0
1.5
1.0
0.5
Fig. 215. YyCe1–yRu2Si2, LaxCe1–xRu2Si2. Magnetic field dependence of pm in the paramagnetic region for several concen-trations and H || c at 4.2 K, except for y = 0.05, x = 0 and 0.05 at 1.4 K, and for x = 0.2 at 6 K [88H1].
Magnetic field [T]µ0 H
Mag
netic
mom
ent
[p m
Bµ/ C
e]
x = 0.8
La Ce Ru Six 1-x 2 2
0
Ce Ru Si2 2
2.0
1.5
1.0
0.5
0.130.1
0.50.3
2.5 5.0 7.5
Fig. 216. LaxCe1–xRu2Si2. Magnetic field dependence of pm below TN (≈ 1.4 K). The continuous line represents pm(H || c) for x = 0 at 1.4 K [88H1].
Temperature [K]T
102
10
1
10 − 1
1 10 102
T N
27Al
Ce Pd Al2 3
La Pd Al2 3Rela
xatio
n ra
te 1
/[s
]T 1
1−
2 2 24 4 46 68 8
Fig. 217. LaPd2Al3, CePd2Al3. NMR, temperature dependence of 1/T1 for 27Al [94F1].
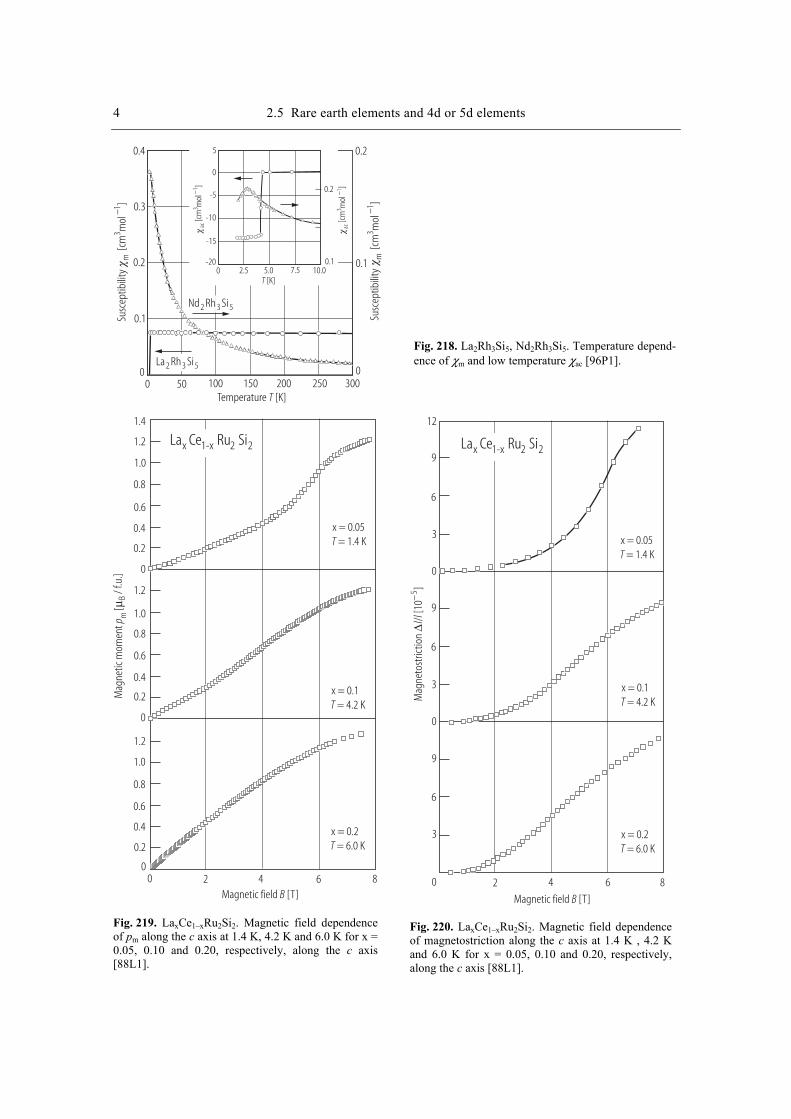
4 2.5 Rare earth elements and 4d or 5d elements
Temperature [K]T
Susc
eptib
ility
[cm
mol
]m
31−
[cm
mol
]ac
31−
[cm
mol
]ac
31−
Susc
eptib
ility
[cm
mol
]m
31−
0.4
0.3
0.2
0.1
00 50 100 150 200 250 300
0
0.1
0.2
Nd Rh Si2 3 5
La Rh Si2 3 5
5
0
-5
-10
-15
-20
0.2
0.10 2.5 5.0 7.5 10.0
T [K]
Fig. 218. La2Rh3Si5, Nd2Rh3Si5. Temperature depend-ence of χm and low temperature χac [96P1].
Magnetic field [T]B
Mag
netic
mom
ent
[p m
Bµ/ f
.u.]
1.4
1.2
1.0
0.8
0.6
0.4
0.2
0
1.2
1.0
0.8
0.6
0.4
0.2
0
1.2
1.0
0.8
0.6
0.4
0.2
00 2 4 6 8
x = 0.05
x = 0.1
x = 0.2
T = 1.4 K
T = 4.2 K
T = 6.0 K
La Ce Ru Six 1-x 2 2
Fig. 219. LaxCe1–xRu2Si2. Magnetic field dependence of pm along the c axis at 1.4 K, 4.2 K and 6.0 K for x = 0.05, 0.10 and 0.20, respectively, along the c axis [88L1].
Magnetic field [T]B
0 2 4 6 8
x = 0.05
x = 0.1
x = 0.2
T = 1.4 K
T = 4.2 K
T = 6.0 K
La Ce Ru Six 1-x 2 2
Mag
neto
stric
tion
/[1
0]
∆l l
−5
12
9
6
3
0
9
6
3
0
9
6
3
Fig. 220. LaxCe1–xRu2Si2. Magnetic field dependence of magnetostriction along the c axis at 1.4 K , 4.2 K and 6.0 K for x = 0.05, 0.10 and 0.20, respectively, along the c axis [88L1].
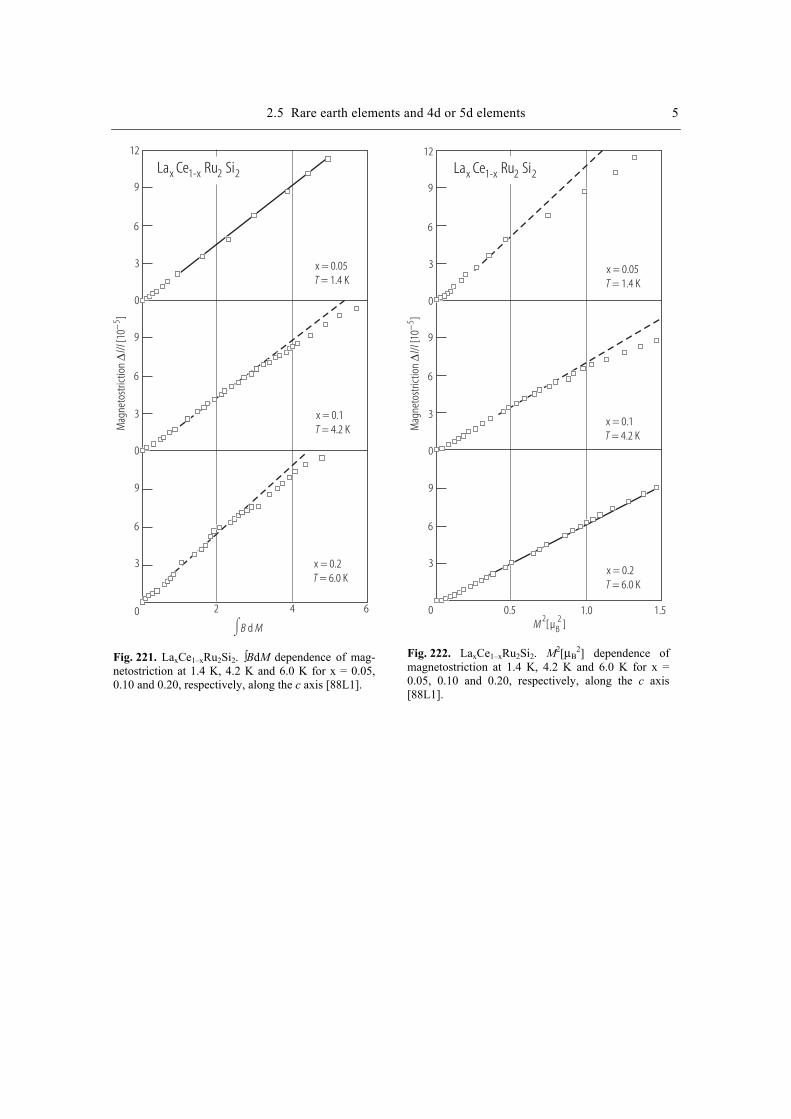
2.5 Rare earth elements and 4d or 5d elements 5
0
x = 0.05
x = 0.1
x = 0.2
T = 1.4 K
T = 4.2 K
T = 6.0 K
La Ce Ru Six 1-x 2 2
Mag
neto
stric
tion
/[1
0]
∆l l
−5
12
9
6
3
0
9
6
3
0
9
6
3
2 4 6⌠⌡B Md
Fig. 221. LaxCe1–xRu2Si2. ∫BdM dependence of mag-netostriction at 1.4 K, 4.2 K and 6.0 K for x = 0.05, 0.10 and 0.20, respectively, along the c axis [88L1].
0
x = 0.05
x = 0.1
x = 0.2
T = 1.4 K
T = 4.2 K
T = 6.0 K
La Ce Ru Six 1-x 2 2
Mag
neto
stric
tion
/[1
0]
∆l l
−5
12
9
6
3
0
9
6
3
0
9
6
3
0.5 1.0 1.5M
2B2
[ µ ] Fig. 222. LaxCe1–xRu2Si2. M2[µB
2] dependence of magnetostriction at 1.4 K, 4.2 K and 6.0 K for x = 0.05, 0.10 and 0.20, respectively, along the c axis [88L1].
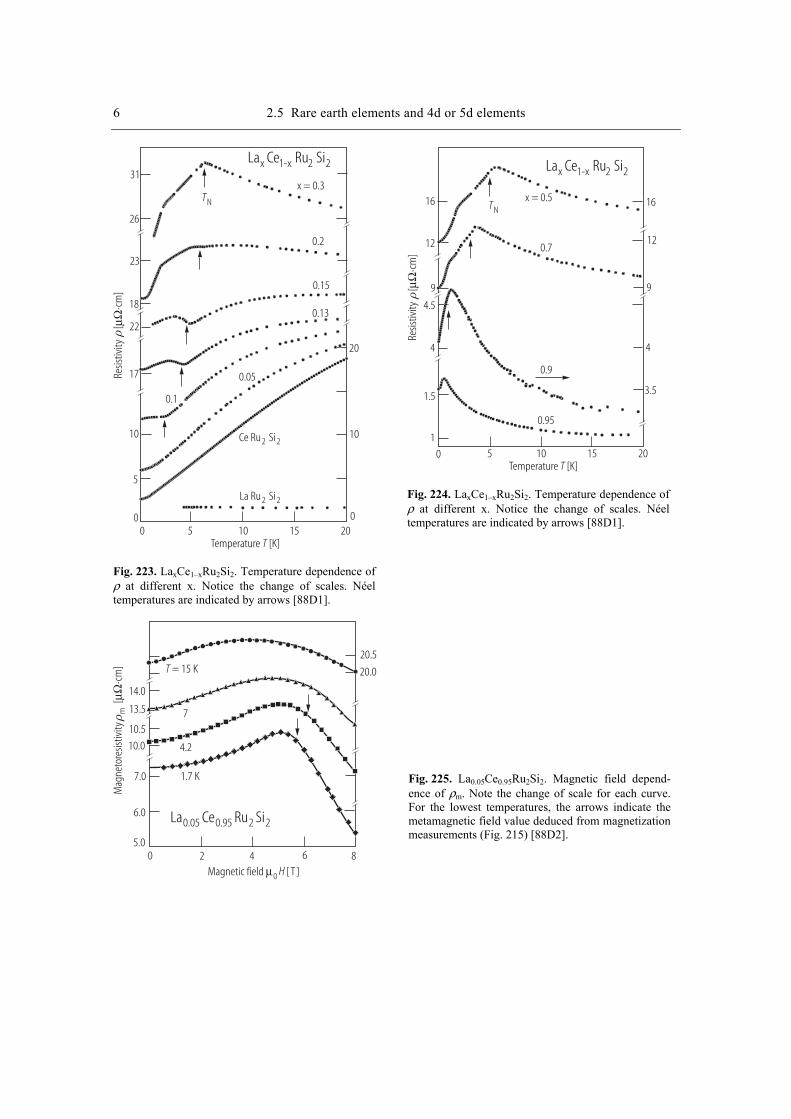
6 2.5 Rare earth elements and 4d or 5d elements
La Ce Ru Six 1-x 2 2
Temperature [K]T
TN
Resis
tivity
[
cm]
µΩ⋅
x = 0.3
0.2
0.15
0.13
0.05
0.1
Ce Ru Si2 2
La Ru Si2 2
20
10
0
26
31
23
18
22
17
10
5
00 5 10 15 20
Fig. 223. LaxCe1–xRu2Si2. Temperature dependence of ρ at different x. Notice the change of scales. Néel temperatures are indicated by arrows [88D1].
La Ce Ru Six 1-x 2 2
Temperature [K]T
TN
Resis
tivity
[
cm]
µΩ⋅
x = 0.5
0 5 10 15 20
16
12
9
4.5
4
1.5
1
16
12
9
4
3.5
0.7
0.9
0.95
Fig. 224. LaxCe1–xRu2Si2. Temperature dependence of ρ at different x. Notice the change of scales. Néel temperatures are indicated by arrows [88D1].
Mag
neto
resis
tivity
[cm
]µΩ
⋅m
T = 15 K
7
4.2
1.7 K
20.5
20.0
14.0
13.5
10.5
10.0
7.0
6.0
5.00 2 4 6 8
Magnetic field [ T ]µ0 H
La Ce Ru Si0.05 0.95 2 2
Fig. 225. La0.05Ce0.95Ru2Si2. Magnetic field depend-ence of ρm. Note the change of scale for each curve. For the lowest temperatures, the arrows indicate the metamagnetic field value deduced from magnetization measurements (Fig. 215) [88D2].

2.5 Rare earth elements and 4d or 5d elements 7 M
agne
tore
sistiv
ity
[
cm]
µΩ⋅
m
T = 8.5 K
0 2 4 6 8Magnetic field [ T ]µ0 H
La Ce Ru Si0.13 0.87 2 2
Hc
Ha
18
14
10
6.5
22
18
14
10
1.86 K
4.2 K
Fig. 226. La0.13Ce0.87Ru2Si2. Magnetic field depend-ence of ρm for 1.86 K. The two transition fields are indicated by vertical arrows [88D2].
Mag
neto
resis
tivity
[cm
]µΩ
⋅m
Magnetic field [ T ]µ0 H
La Ce Ru Si0.2 0.8 2 2
Hc
Hb
Ha
22
20
18
16
150 1 2 3
0
0.5
1.0
Mag
netic
mom
ent
[p m
Bµ/f.
u.]
Fig. 227. La0.2Ge0.8Ru2Si2. Magnetic field dependence of ρm and pm at 1.7 K in increasing (open symbols) and decreasing (solid symbols) H. Hysteresis is observed at Ha and between Hc and Hb [88D2].
Temperature [K]T
TN
La Ce Ru Six 1-x 2 2
Hall
coef
ficie
nt[1
0cm
C]
R H3
31
−−
⋅
Ce Ru Si2 20.13
0.5
0.7
0.9
x = 0.2
7
6
5
4
3
2
1
01 10 10 2
2 4 6 8 2 24 6 8
Fig. 228. LaxCe1–xRu2Si2. Temperature dependence of RH at different x. The vertical arrows indicate TN [88D3].
Hall
resis
tanc
e[
]R
µΩ
Magnetic field [ T ]µ0 H
Hc
HM
Ha
80
60
40
20
0 2 4 6 8
La Ce Ru Si0.2 0.8 2 2
La Ce Ru Si0.05 0.95 2 2
Fig. 229. La0.2Ce0.8Ru2Si2, La0.05Ce0.95 Ru2Si2. Mag-netic field dependence of Hall resistance. The arrows show the transition field values derived from magneti-zation measurements [88D3].
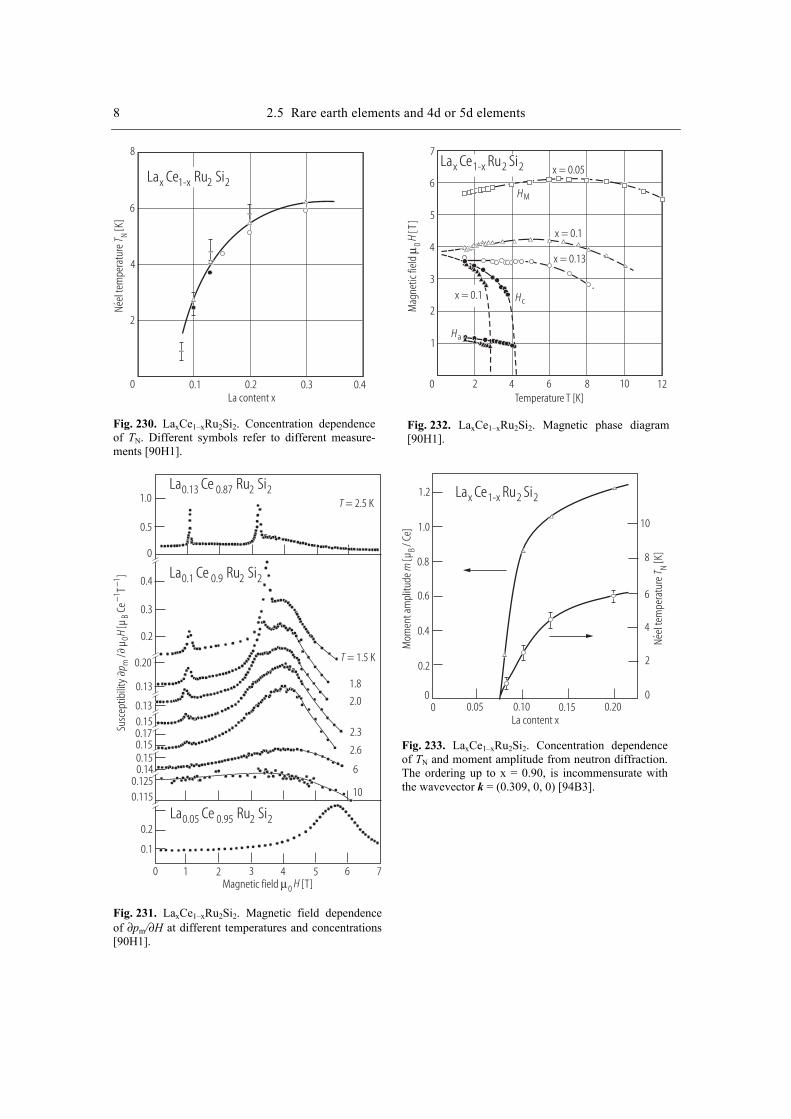
8 2.5 Rare earth elements and 4d or 5d elements
8
6
4
2
0 0.1 0.2 0.3 0.4La content x
Neel
tem
pera
ture
[K]
T N´
La Ce Ru Six 1-x 2 2
Fig. 230. LaxCe1–xRu2Si2. Concentration dependence of TN. Different symbols refer to different measure-ments [90H1].
Mag
netic
fiel
d[T
]µ 0
H
Hc
HM
Ha
La Ce Ru Six 1-x 2 2 x = 0.05
x = 0.13
x = 0.1
x = 0.1
7
6
5
4
3
2
1
0 2 4 6 8 10 12Temperature T [K]
Fig. 232. LaxCe1–xRu2Si2. Magnetic phase diagram [90H1].
La Ce Ru Si0.13 0.87 2 2
La Ce Ru Si0.05 0.95 2 2
La Ce Ru Si0.1 0.9 2 2
Magnetic field [T]µ0 H
Susc
eptib
ility
/µ
[ µCe
T]
pH
m0
B1
1−
−
1.0
0.5
0
0.4
0.3
0.2
0.20
0.13
0.130.150.170.150.150.14
0.1250.115
0.2
0.1
0 1 2 3 4 5 6 7
T = 2.5 K
T = 1.5 K
1.8
2.0
2.3
2.6
6
10
Fig. 231. LaxCe1–xRu2Si2. Magnetic field dependence of ∂pm/∂H at different temperatures and concentrations [90H1].
La Ce Ru Six 1-x 2 2
La content x
Neel
tem
pera
ture
[K]
T N´
Mom
ent a
mpl
itude
[µ/ C
e]m
B
1.2
1.0
0.8
0.6
0.4
0.2
00 0.05 0.10 0.15 0.20
10
8
6
4
2
0
Fig. 233. LaxCe1–xRu2Si2. Concentration dependence of TN and moment amplitude from neutron diffraction. The ordering up to x = 0.90, is incommensurate with the wavevector k = (0.309, 0, 0) [94B3].
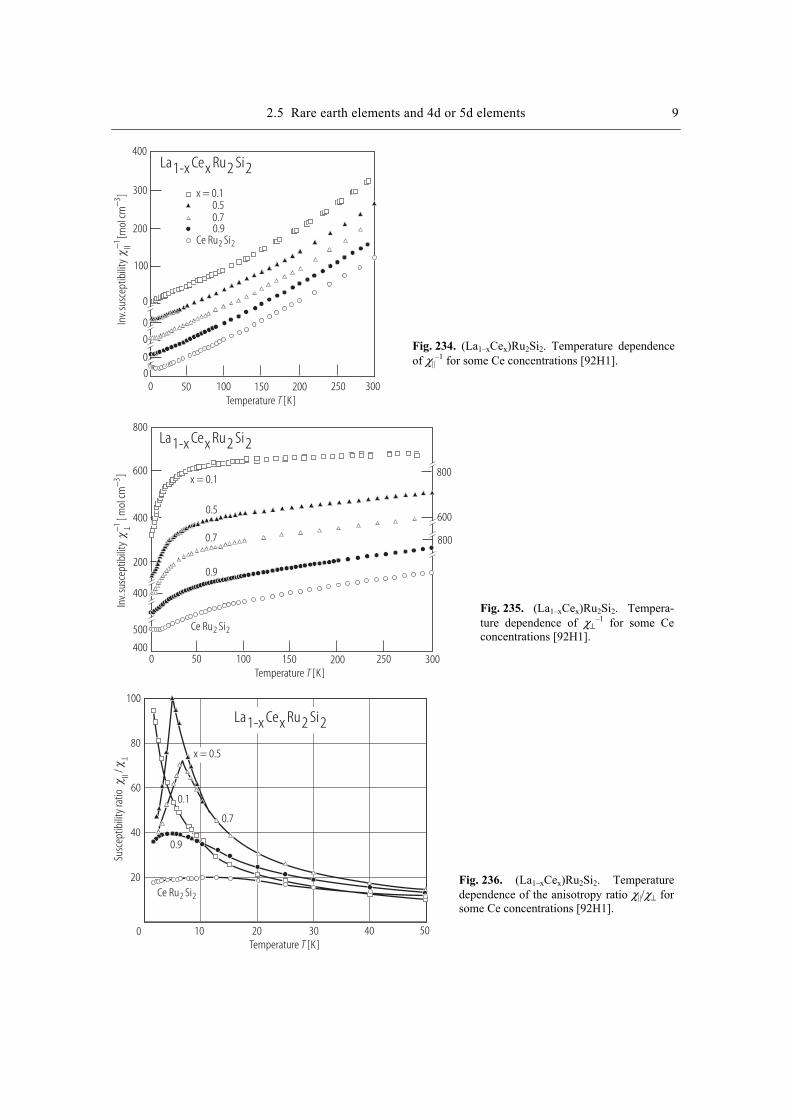
2.5 Rare earth elements and 4d or 5d elements 9
La1-x Cex Ru2 Si2
Temperature [K]T
Inv.
susc
eptib
ility
[ mol
cm]
II3−
−1
x = 0.10.50.70.9
Ce Ru Si2 2
400
300
200
100
0
0
0
0
00 50 100 150 200 250 300
Fig. 234. (La1–xCex)Ru2Si2. Temperature dependence of χ||
–1 for some Ce concentrations [92H1].
La1-x Cex Ru2 Si2
Temperature [K]T
x = 0.1
0.5
0.7
0.9
Ce Ru Si2 2
0 50 100 150 200 250 300
800
600
400
200
400
500
400
800
600
800
Inv.
susc
eptib
ility
[ m
ol cm
−3−1 T
]
Fig. 235. (La1–xCex)Ru2Si2. Tempera-ture dependence of χ⊥
–1 for some Ce concentrations [92H1].
Temperature [K]T
0.7
0.9
Ce Ru Si2 2
La1-x Cex Ru2 Si2
0.1
x = 0.5
100
80
60
40
20
0 10 20 30 40 50
Susc
eptib
ility
ratio
/II
T
Fig. 236. (La1–xCex)Ru2Si2. Temperature dependence of the anisotropy ratio χ||/χ⊥ for some Ce concentrations [92H1].
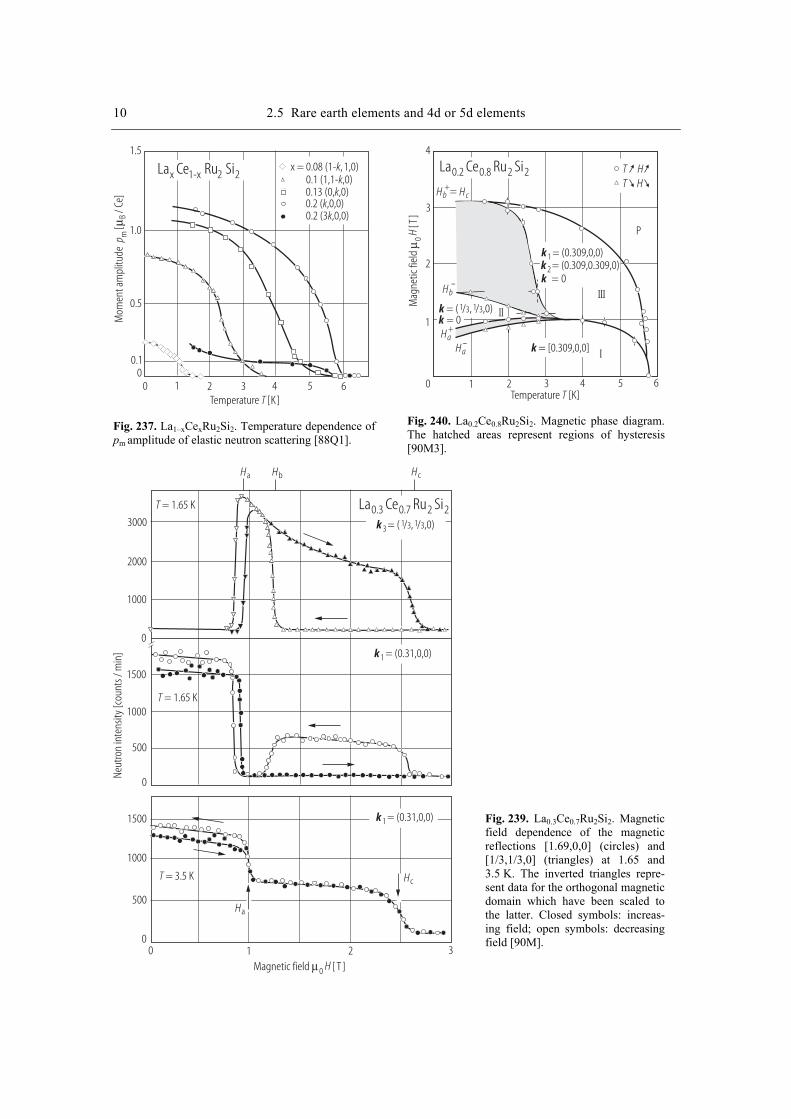
10 2.5 Rare earth elements and 4d or 5d elements M
omen
t am
plitu
de[
p mBµ
/ Ce]
0 1 2 3 4 5 6Temperature [K]T
1.0
0.5
0.10
1.5
La Ce Ru Six 1-x 2 2x = 0.08 (1- , 1,0)k
0.1 (1,1- ,0)k0.13 (0, ,0)k0.2 ( ,0,0)k0.2 (3 ,0,0)k
Fig. 237. La1–xCexRu2Si2. Temperature dependence of pm amplitude of elastic neutron scattering [88Q1].
Mag
netic
fiel
d[T
]µ 0
H
Hb
Ha
La Ce Ru Si0.2 0.8 2 2
k = ( / , / ,0)1 3 1 3
k = [0.309,0,0]
4
3
2
1
0 1 2 3 4 5 6Temperature [K]T
k 1 = (0.309,0,0)k 2 = (0.309,0.309,0)
TT
HH
k = 0
k = 0
HcHb =+
+
Ha-
-
P
I
II
III
Fig. 240. La0.2Ce0.8Ru2Si2. Magnetic phase diagram. The hatched areas represent regions of hysteresis [90M3].
Magnetic field [ T ]µ0 H
T = 1.65 K
T = 1.65 K
T = 3.5 K Hc
HcHb
Ha
Ha
La Ce Ru Si0.3 0.7 2 23000
2000
1000
0
1500
1000
500
0
1500
1000
500
00 1 2 3
k 31 3 1 3= ( / , / ,0)
k 1 = (0.31,0,0)
k 1 = (0.31,0,0)
Neut
ron
inte
nsity
[cou
nts /
min
]
Fig. 239. La0.3Ce0.7Ru2Si2. Magnetic field dependence of the magnetic reflections [1.69,0,0] (circles) and [1/3,1/3,0] (triangles) at 1.65 and 3.5 K. The inverted triangles repre-sent data for the orthogonal magnetic domain which have been scaled to the latter. Closed symbols: increas-ing field; open symbols: decreasing field [90M].
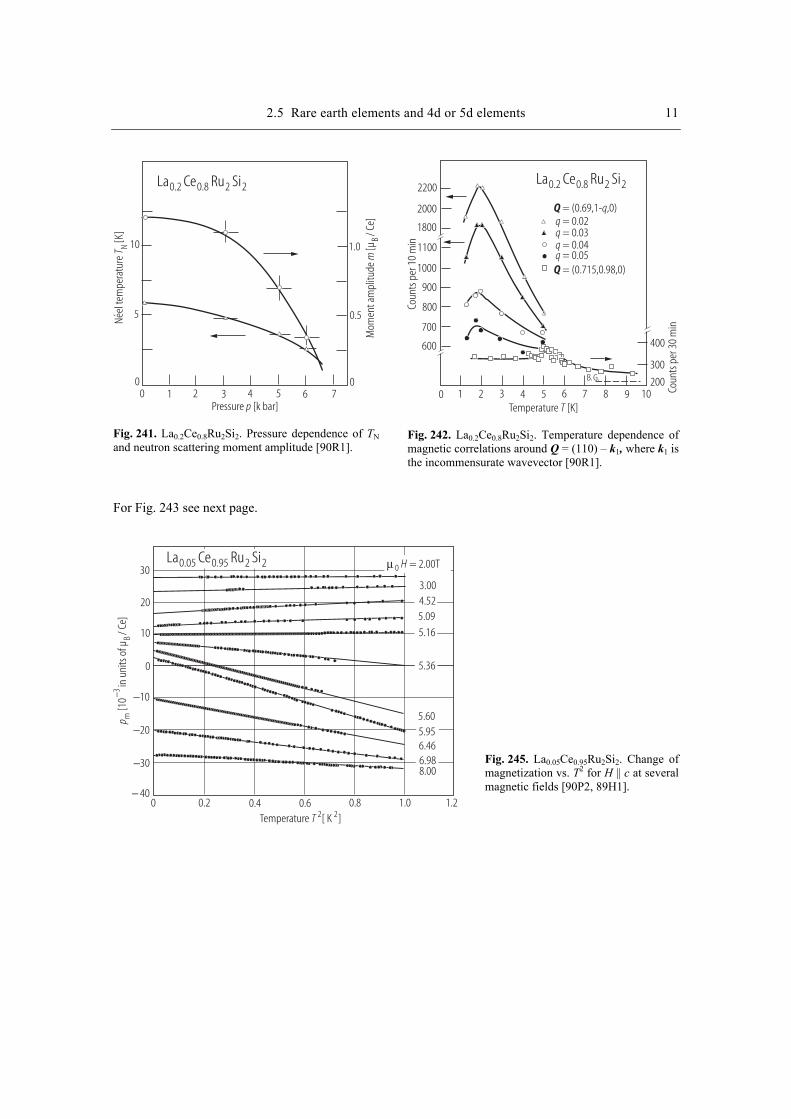
2.5 Rare earth elements and 4d or 5d elements 11
La Ce Ru Si0.2 0.8 2 2
Neel
tem
pera
ture
[K]
T N´
Mom
ent a
mpl
itude
[µ/ C
e]m
B
5
10
00 1 2 3 4 5 6 7
1.0
0.5
0
Pressure [k bar]p Fig. 241. La0.2Ce0.8Ru2Si2. Pressure dependence of TN and neutron scattering moment amplitude [90R1].
La Ce Ru Si0.2 0.8 2 2
Temperature [K]T
2200
2000
1800
1100
1000
900
800
700
600
0 1 2 3 4 5 6 7 8 9 10
400
300
200B. G.
Coun
ts p
er 1
0 m
in
Coun
ts p
er 3
0 m
in
Q = (0.69,1- ,0)q
Q = (0.715,0.98,0)
q = 0.02q = 0.03q = 0.04q = 0.05
Fig. 242. La0.2Ce0.8Ru2Si2. Temperature dependence of magnetic correlations around Q = (110) – k1, where k1 is the incommensurate wavevector [90R1].
For Fig. 243 see next page.
La Ce Ru Si0.05 0.95 2 2 0 Hµ = 2.00T
3.004.525.09
5.16
5.36
5.605.956.466.988.00
30
20
10
0
−10
−20
−30
− 400 0.2 0.4 0.6 0.8 1.0 1.2
Temperature [ K ]T 2 2
p m3
B[1
0in
uni
ts o
f µ/ C
e]−
Fig. 245. La0.05Ce0.95Ru2Si2. Change of magnetization vs. T2 for H || c at several magnetic fields [90P2, 89H1].
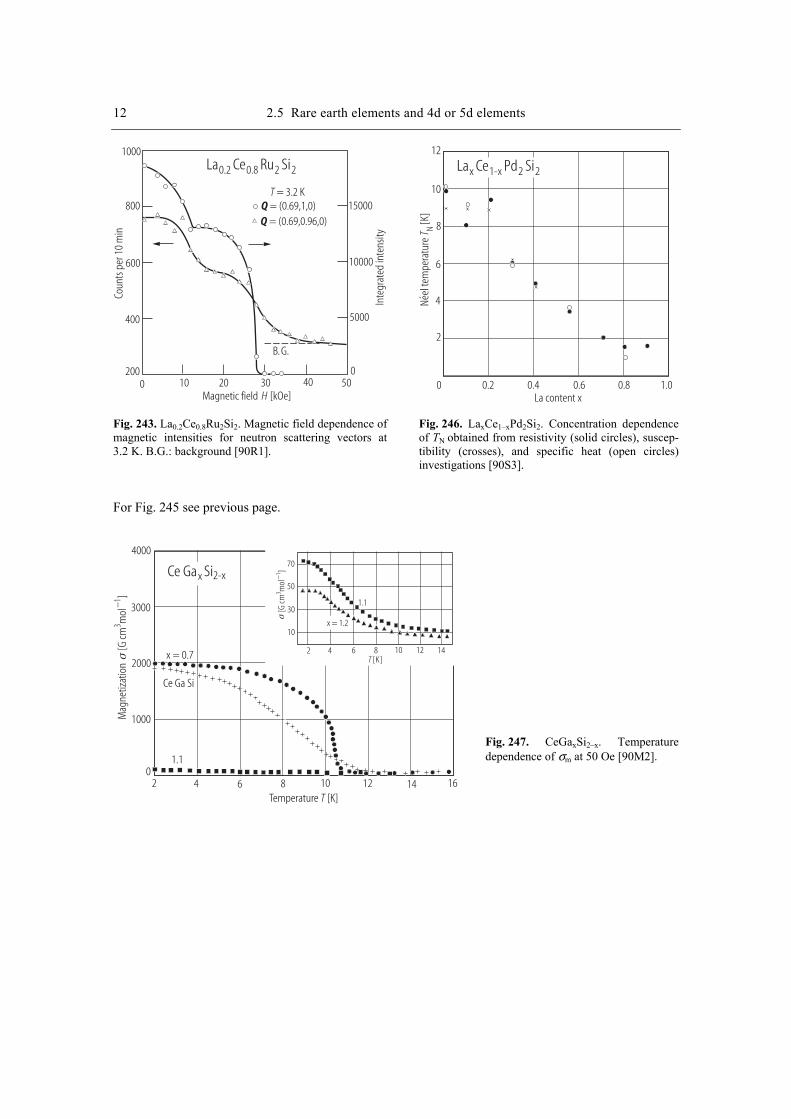
12 2.5 Rare earth elements and 4d or 5d elements
La Ce Ru Si0.2 0.8 2 2
1000
800
600
400
200
Coun
ts p
er 1
0 m
in
Q = (0.69,1,0)Q = (0.69,0.96,0)
15000
10000
5000
00 10 20 30 40 50
Magnetic field [kOe]H
T = 3.2 K
Inte
grat
ed in
tens
ity
B. G.
Fig. 243. La0.2Ce0.8Ru2Si2. Magnetic field dependence of magnetic intensities for neutron scattering vectors at 3.2 K. B.G.: background [90R1].
La content x
Neel
tem
pera
ture
[K]
T N´
10
8
6
4
2
0
La Ce Pd Six 1-x 2 2
0.2 0.4 0.6 0.8 1.0
12
Fig. 246. LaxCe1–xPd2Si2. Concentration dependence of TN obtained from resistivity (solid circles), suscep-tibility (crosses), and specific heat (open circles) investigations [90S3].
For Fig. 245 see previous page.
Temperature [K]T
Mag
netiz
atio
n
[G cm
mol
]3
1−
[G cm
mol
]3
1−Ce Ga Six 2-x
x = 0.7
Ce Ga Si
1.1
3000
1000
2000
4000
02 4 6 8 10 12 14 16
70
50
30
10
2 4 6 8 10 12 14
1.1
x = 1.2
T [K]
Fig. 247. CeGaxSi2–x. Temperature dependence of σm at 50 Oe [90M2].
References
88A1 Amato, A., Jaccard, D., Sierro, J., Lapierre, F., Haen, P., Lejay, P.: J. Magn. Magn. Mater. 76-77(1988) 263
88D1 Djerbi, R., Haen, P., Lapierre, F., Lehmann, P., Kappler, jr., P.: J. Magn. Magn. Mater. 76-77 (1988) 260
88D2 Djerbi, R., Haen, P., Lapierre, F., Mignot, J.-M.: J. Magn. Magn. Mater. 76-77 (1988) 265 88D3 Djerbi, R., Haen, P., Lapierre, F., Mignot, J.-M., Fert, A., Hamzic, A., Kappler, J.P.: J. Magn.
Magn. Mater. 76-77 (1988) 265 88H1 Haen, P., Lapierre, F., Kappler, J.P., Lejay, P., Flouquet, J., Meyer, A.: J. Magn. Magn. Mater.
76-77 (1988) 143 88L1 Lacerda, A., de Visser, A., Puech, L., Lejay, P., Haen, P.: J. Magn. Magn. Mater. 76-77 (1988)
138 88Q1 Quezel, S., Burllet, P., Jacoud, J.L., Regnault, L.P., Rossat-Mignod, J., Vettier, C., Lejay, P.,
Flouquet, J.: J. Magn. Magn. Mater.: 76-77 (1988) 403 89H1 Haen, P., Kappler, J.P., Lapierre, F., Lehmann, P., Lejay, P., Flouquet, J., Meyer, A.: J. Phys.
(Paris) 49 (1989) C8-757 90B1 Bruls, G., Weber, D., Hampel, G., Wolf, B., Kouroudis, I., Luthi, B.: Physica B 163 (1990) 41 90C1 Celemczuk, R., Bonjour, E., Rossat-Mignod, J., Chavalier, B.: J. Magn. Magn. Mater. 90-91
(1990) 477 90H1 Haen, P., Voiron, J., Lapierre, F., Flouquet, J., Lejay, P.: Physica B 163 (1990) 519 90M1 Malik, S.K., Adroja, D.T., Pdadalia, B.D., Vijayaraghavan, R.: Physica B 163 (1990) 89 90M2 Moshchalkov, V.V., Petrenko, O.V., Zalyalutdinov, M.K.: Physica B 163 (1990) 395 90M3 Mignot, J.-L., Jacoud, J.-L., Regnault, L.-P., Rossat-Mignod, J., Lejay, P., Boutrouille, Ph.,
Hennion, B., Petitgrand, D.: Physica B 163 (1990) 611 90P1 Paulsen, C., Lacerda, A., Tholence, J.L., Flouquet, J.: Physica B 165-166 (1990) 433 90P2 Paulsen, C., Lacerda, A., de Visser, A., Bakker, K., Puech, L., Tholence, J.L.: J. Magn. Magn.
Mater. 90-91 (1990) 408 90R1 Regnault, L.P., Jacoud, J.L., Rossat-Mignod, J., Vettier, C., Lejay, P., Flouquet, J.: J. Magn.
Magn. Mater. 90-91 (1990) 398 90S3 Sampathkumaran, E.V., Nakazawa, Y., Ishikawa, Y., Vijayaraghavan, R.: Physica B 163
(1990) 365 90S4 Steeman, R.A., Endstra, T., Mentink, S.A.M., Friikkee, E., Menovsky, A.A., Nieuwenhuys,
G.J., Mydosh, J.A.: Physica B 163 (1990) 597 92B1 Besnus, M.J., Essaihi, A., Fischer, G., Hamdaoui, N., Meyer, A.: J. Magn. Magn. Mater. 104-
107 (1992) 1387 92H1 Haen, P., Lapierre, F., Lejay, P., Voiron, J.: J. Magn. Magn. Mater. 116 (1992) 108 92L1 Lapierre, F., Haen, P.: J. Magn. Magn. Mater. 108 (1992) 167 94B3 Burlet, P., Regnault, L.P., Rossat-Mignod, J., Vettier, C., Flouquet, J.: J. Magn. Magn. Mater.
129 (1994) 10 94F1 Fijiwara, K, Yamanashi, Y., Kumagai, K.: Physica B 199-200 (1994) 107 95M1 Meyer, A., Besuns, M.J., Haen, P., Kappler, J.P., Mathis, G.: Physica B 206-207 (1995) 304 95M2 Mydlarz, T., Talik, E., Szade, J., Heimann, J.: J. Alloys, Comp. 219 (1995) 225 95P1 Park, J.-G., Haen, P., Lapierre, F., Lejay, P., Verniere, A., Voiron, J.: Physica B 206-207
(1995) 285 95S1 Sakakibara, T., Tayama, T., Mitamura, H., Matsuhira, K., Amitsuka, H.: Physica B 206-207
(1995) 249 95T1 Tautz, F.S., Julian, S.R., McMulian, G.J., Lonzarich, G.G.: Physica B 206-207 (1995) 29 96M2 Marumoto, K., Takeuchi, T., Miyako, Y.: Phys.Rev. B 54 (1996) 12194 96P1 Patil, N.G., Ghosh, K., Ramakrishnan, S.: Physica B 223-224 (1996) 392 97L1 Lapierre, F., Mallmann, F., Holtmeier, S., Kambe, S., Haen, P.: Physica B 230-232 (1997) 12097M1 Malik, R., Sampathkumaran, E.V., Paulose, P.L.: Physica B 230-232 (1997) 169 98M2 Marumoto, K., Takayama, F., Miyako, Y.: J. Magn. Magn. Mater. 177-181 (1998) 353
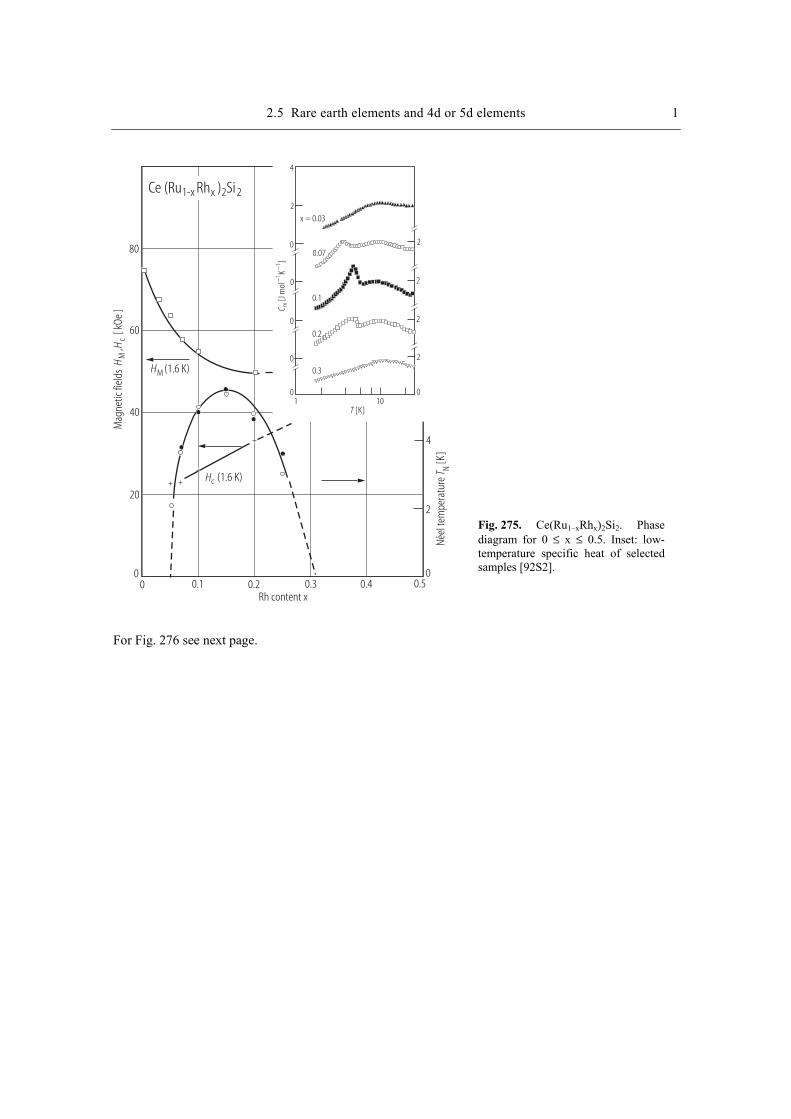
2.5 Rare earth elements and 4d or 5d elements 1
Mag
netic
fiel
ds[ k
Oe ]
H,H
Mc
Ce (Ru Rh ) Si1-x x 2 2
Hc
80
60
40
20
00
[K]T
HM (1.6 K)
(1.6 K)
0.1 0.2 0.3 0.4 0.5Rh content x
4
2
0
Neel
tem
pera
ture
[K]
T N´
2
2
2
2
0
x = 0.03
0.07
0.1
0.2
0.3
4
2
0
0
0
0
0
C m1
1[J
mol
K]
−−
1 10
Fig. 275. Ce(Ru1–xRhx)2Si2. Phase diagram for 0 ≤ x ≤ 0.5. Inset: low-temperature specific heat of selected samples [92S2].
For Fig. 276 see next page.

2 2.5 Rare earth elements and 4d or 5d elements
Magnetic field [ kOe ]H
Mag
netic
mom
ent
[]
p mBµ
/ Ce
Ce Ru Rh Si1.8 0.2 2
T = 4.2 K
0.6
0.4
0.2
0.8
0 10 20 30 40 50 60
2.72.21.6
H cII
Fig. 277. CeRu1.8Rh0.2Si2. Magnetic field dependence of pm at temperatures below TN = 4.2 K [92S2].
I
II
IV
III
40
35
30
25
20
15
10
5
0 0.2 0.4 0.6 0.8 1.0Rh content x
Tem
pera
ture
[K]
T
Ce (Ru Rh ) Si1-x x 2 2
Fig. 278. Ce(Ru1–xRhx)2Si2. Magnetic phase diagram [95K1].
Mag
netic
fiel
d[ k
Oe ]
H
CeRu Rh Si1.8 0.2 2H cII
SQUID
VSMpulse
HM
Hc
AF
80
60
40
20
00 2 4 6 8
Temperature [K]T
[T]0 Hµ
T =1.4K
pauli para
2.02.53.03.64.2
0 2 4 6 8 10 12
∂∂
pH
m0
/µ
Fig. 276. CeRu1.8Rh0.2Si2. H - T phase dia-gram in H || c. Hc: critical field of the peak of ∂pm/∂H (inset) [92S2]. SQUID: supercon-ducting quantum interference device, VSM: vibrating sample magnetometer.
For Fig. 277 see previous page.
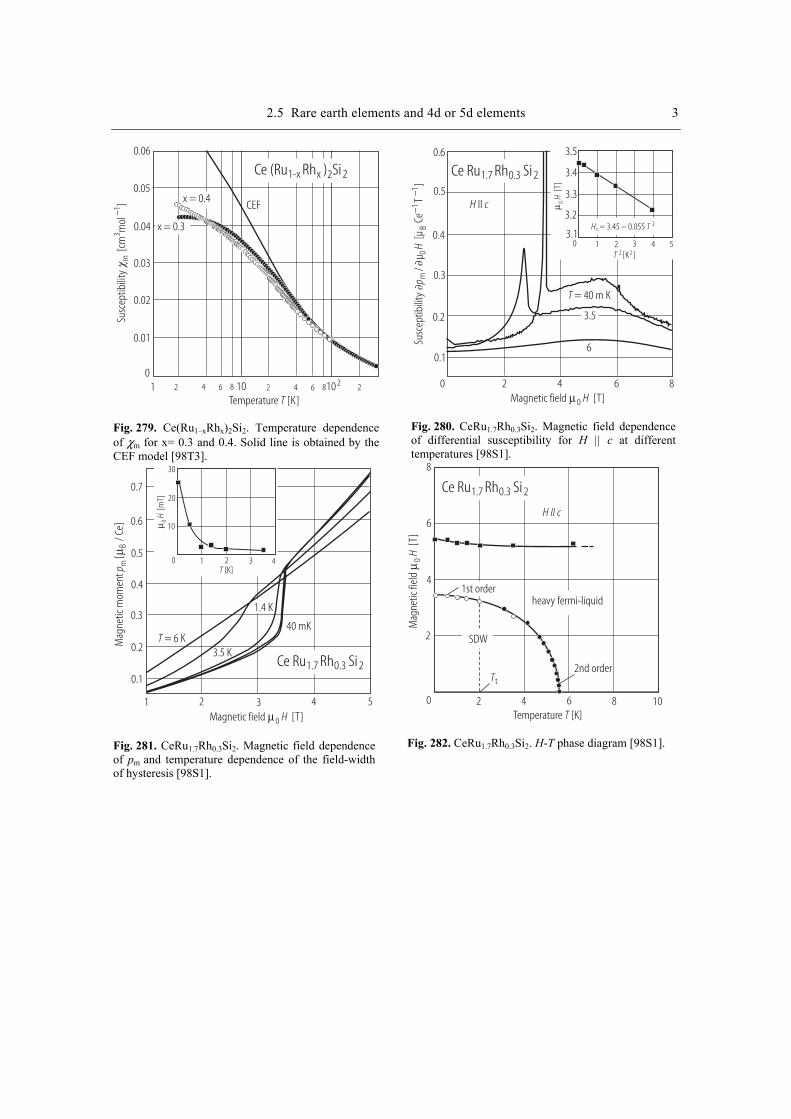
2.5 Rare earth elements and 4d or 5d elements 3
Temperature [K]T
Susc
eptib
ility
[cm
mol
]m
31−
Ce (Ru Rh ) Si1-x x 2 2
CEFx = 0.4
x = 0.3
0.06
0.05
0.04
0.03
0.02
0.01
01 10 1022 24 6 82 4 6 8
Fig. 279. Ce(Ru1–xRhx)2Si2. Temperature dependence of χm for x= 0.3 and 0.4. Solid line is obtained by the CEF model [98T3].
[K ]T 2 2
Magnetic field [T]0 Hµ
[T]
0H
µ
Ce Ru Rh Si1.7 0.3 2
T = 40 m K
0 1 2 3 4 5
3.5
6
H cII
pH
m0
/µ
[µCe
T]
B1
1−
−Su
scep
tibili
ty
0.6
0.5
0.4
0.3
0.2
0.1
0 2 4 6 8
3.5
3.4
3.3
3.2
3.1H Tc
2= 3.45 0.055−
Fig. 280. CeRu1.7Rh0.3Si2. Magnetic field dependence of differential susceptibility for H || c at different temperatures [98S1].
[K]T
Magnetic field [T]0 Hµ
[mT]
0H
µ
Mag
netic
mom
ent
[]
p mBµ
/ Ce
Ce Ru Rh Si1.7 0.3 2
T = 6 K3.5 K
1.4 K
40 mK
0.7
0.6
0.5
0.4
0.3
0.2
0.1
1 2 3 4 5
30
20
10
0 1 2 3 4
Fig. 281. CeRu1.7Rh0.3Si2. Magnetic field dependence of pm and temperature dependence of the field-width of hysteresis [98S1].
Temperature [K]T
Mag
netic
fiel
d[T
]0
Hµ
H II c
Ce Ru Rh Si1.7 0.3 2
8
6
4
2
0 2 4 6 8 10
SDW
heavy fermi-liquid1st order
Tt2nd order
Fig. 282. CeRu1.7Rh0.3Si2. H-T phase diagram [98S1].
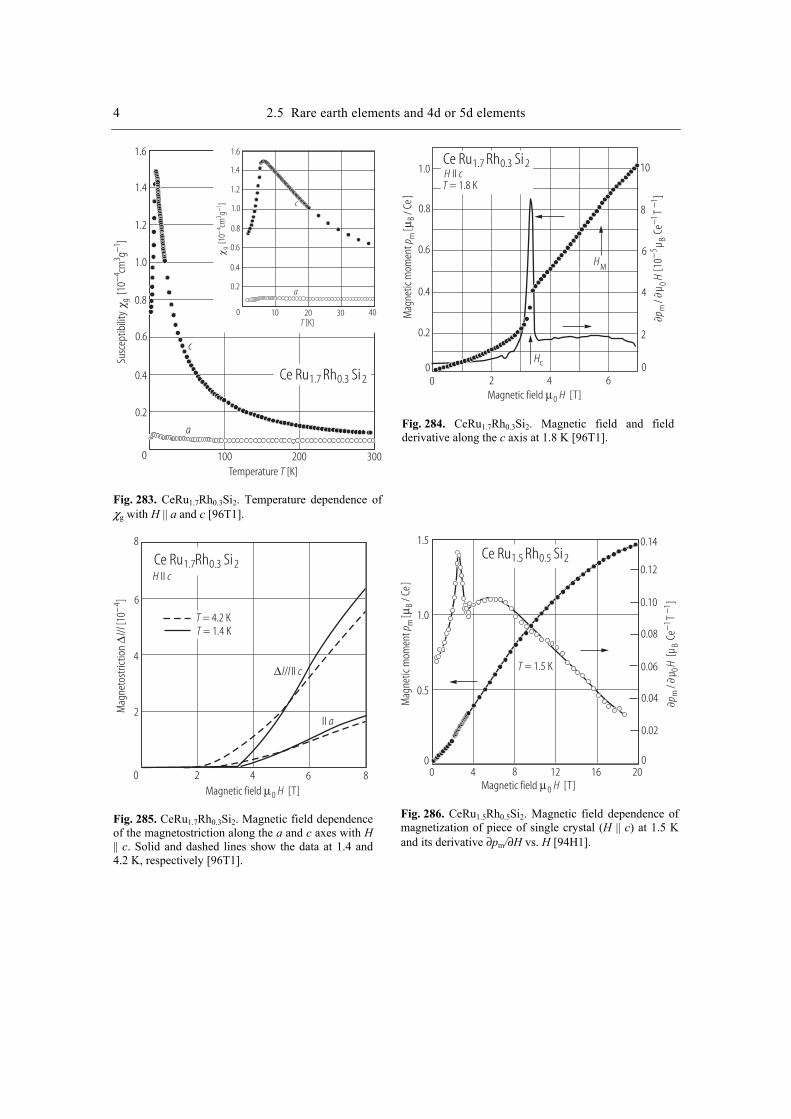
4 2.5 Rare earth elements and 4d or 5d elements
Temperature [K]T
[K]T
Susc
eptib
ility
[10
cmg
]g
43
1−
−
[10
cmg
]g
43
1−
−
Ce Ru Rh Si1.7 0.3 2
1.0
0.8
0.6
0.4
0.2
0 100 200 300
1.2
1.4
1.6
a
a
c
c1.0
0.8
0.6
0.4
0.2
0 10 20 30 40
1.2
1.4
1.6
Fig. 283. CeRu1.7Rh0.3Si2. Temperature dependence of χg with H || a and c [96T1].
Ce Ru Rh Si1.7 0.3 2
Magnetic field [T]0 HµM
agne
tic m
omen
t[
]p m
Bµ/ C
e
T = 1.8 K
HM
Hc
H cII1.0
0
0.2
0.4
0.6
0.8
0 2 4 60
2
4
6
8
10
pH
m0
/µ
[
µ
CeT
]B
11
−−
10−5
Fig. 284. CeRu1.7Rh0.3Si2. Magnetic field and field derivative along the c axis at 1.8 K [96T1].
Ce Ru Rh Si1.7 0.3 2
Magnetic field [T]0 Hµ
Mag
neto
stric
tion
/[1
0]
∆l l
−4
∆ l l c/ II
II a
H cII
T = 4.2 KT = 1.4 K
8
6
4
2
0 2 4 6 8
Fig. 285. CeRu1.7Rh0.3Si2. Magnetic field dependence of the magnetostriction along the a and c axes with H || c. Solid and dashed lines show the data at 1.4 and 4.2 K, respectively [96T1].
Ce Ru Rh Si1.5 0.5 2
Magnetic field [T]0 Hµ
Mag
netic
mom
ent
[]
p mBµ
/ Ce
T = 1.5 K
0.14
0.12
0.10
0.08
0.06
0.04
0.02
00 4 8 12 16 20
1.5
1.0
0.5
0
pH
m0
/µ
[µCe
T]
B1
1−
−
Fig. 286. CeRu1.5Rh0.5Si2. Magnetic field dependence of magnetization of piece of single crystal (H || c) at 1.5 K and its derivative ∂pm/∂H vs. H [94H1].
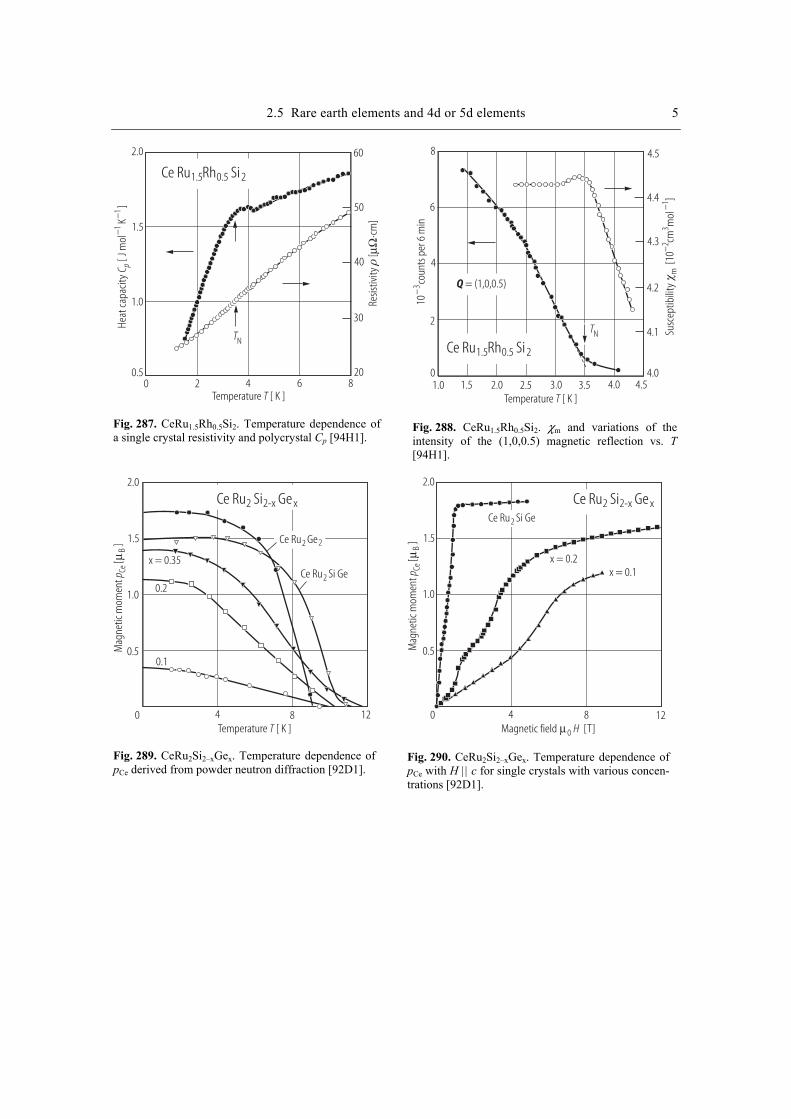
2.5 Rare earth elements and 4d or 5d elements 5
Temperature [ K ]T
Ce Ru Rh Si1.5 0.5 2
TN
Heat
capa
city
[Jm
olK
]C p
−−
11
Resis
tivity
[
cm]
µΩ⋅
2.0
1.5
1.0
0.50 2 4 6 8
60
50
40
30
20
Fig. 287. CeRu1.5Rh0.5Si2. Temperature dependence of a single crystal resistivity and polycrystal Cp [94H1].
Temperature [ K ]T
Susc
eptib
ility
[10
cmm
ol]
m2
31
−−
Ce Ru Rh Si1.5 0.5 2
10co
unts
per
6 m
in−3
Q = (1,0,0.5)
TN
8
6
4
2
01.0 1.5 2.0 2.5 3.0 3.5 4.0 4.5
4.5
4.1
4.2
4.3
4.4
4.0
Fig. 288. CeRu1.5Rh0.5Si2. χm and variations of the intensity of the (1,0,0.5) magnetic reflection vs. T [94H1].
Ce Ru Si Ge2 2-x x
x = 0.35
Mag
netic
mom
ent
[]
p CeB
µ
Ce Ru Si Ge2
Ce Ru Ge2 2
0.2
0.1
Temperature [ K ]T
2.0
1.5
1.0
0.5
0 4 8 12
Fig. 289. CeRu2Si2–xGex. Temperature dependence of pCe derived from powder neutron diffraction [92D1].
Ce Ru Si Ge2 2-x x
x = 0.2x = 0.1
Magnetic field [T]0 Hµ
Mag
netic
mom
ent
[]
p CeB
µ
Ce Ru Si Ge2
2.0
1.5
1.0
0.5
0 4 8 12
Fig. 290. CeRu2Si2–xGex. Temperature dependence of pCe with H || c for single crystals with various concen-trations [92D1].
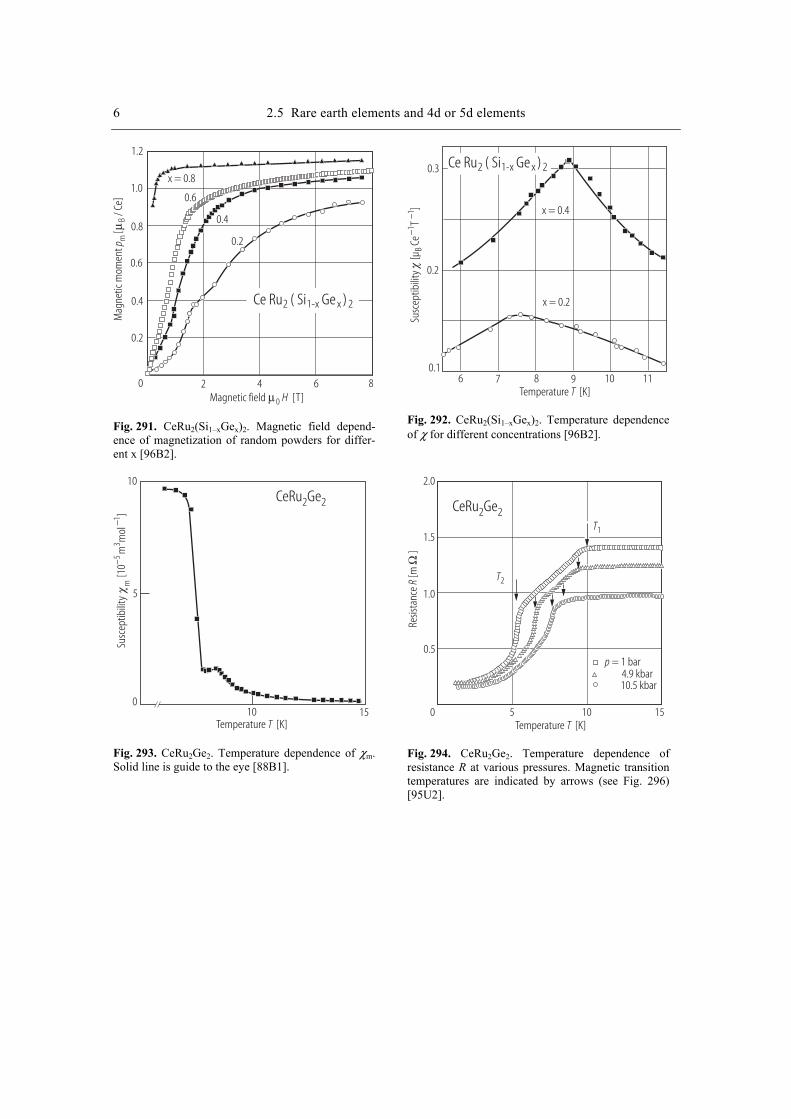
6 2.5 Rare earth elements and 4d or 5d elements
Ce Ru ( Si Ge )2 1-x x 2
x = 0.8
0.2
Magnetic field [T]0 Hµ
Mag
netic
mom
ent
[]
p mB
µ/ C
e
0.4
0.6
1.2
1.0
0.8
0.6
0.4
0.2
0 2 4 6 8
Fig. 291. CeRu2(Si1–xGex)2. Magnetic field depend-ence of magnetization of random powders for differ-ent x [96B2].
Temperature [K]T
Ce Ru ( Si Ge )2 1-x x 2
6 7 8 9 10 11
0.3
0.2
0.1
Susc
eptib
ility
[µ
CeT
]B
11
−− x = 0.4
x = 0.2
Fig. 292. CeRu2(Si1–xGex)2. Temperature dependence of χ for different concentrations [96B2].
Temperature [K]T
CeRu Ge2 2
Susc
eptib
ility
[10
mm
ol]
m5
31
−−
10 150
5
10
Fig. 293. CeRu2Ge2. Temperature dependence of χm. Solid line is guide to the eye [88B1].
Temperature [K]T
CeRu Ge2 2T1
T2
p = 1 bar4.9 kbar10.5 kbar
Resis
tanc
e[m
]R
Ω
2.0
1.5
1.0
0.5
0 5 10 15
Fig. 294. CeRu2Ge2. Temperature dependence of resistance R at various pressures. Magnetic transition temperatures are indicated by arrows (see Fig. 296) [95U2].
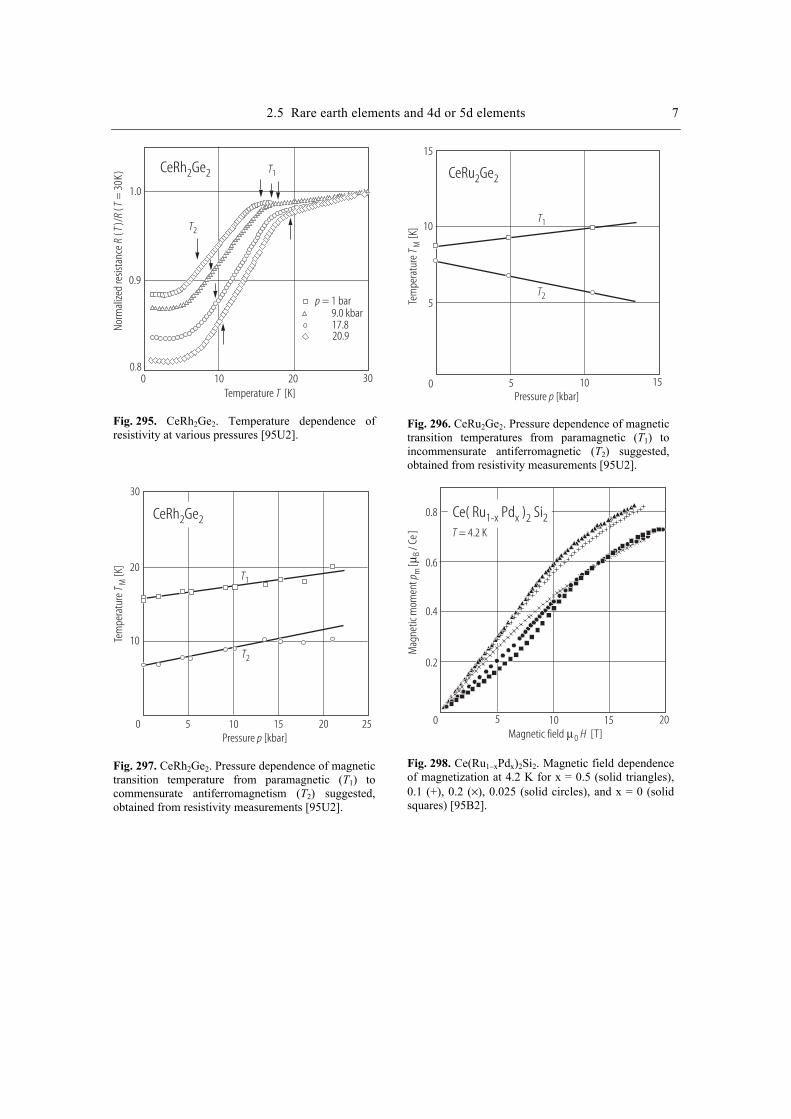
2.5 Rare earth elements and 4d or 5d elements 7
Temperature [K]T
CeRh Ge2 2 T1
T2
1.0
0.9
0.80 10 20 30
Norm
alize
d re
sista
nce
()/
(=
30K
)R
TR
T
p = 1 bar9.0 kbar17.820.9
Fig. 295. CeRh2Ge2. Temperature dependence of resistivity at various pressures [95U2].
Tem
pera
ture
[K]
T M
Pressure [kbar]p
CeRu Ge2 2
T1
T2
10
0 5 10 15
5
15
Fig. 296. CeRu2Ge2. Pressure dependence of magnetic transition temperatures from paramagnetic (T1) to incommensurate antiferromagnetic (T2) suggested, obtained from resistivity measurements [95U2].
Tem
pera
ture
[K]
T M
Pressure [kbar]p
CeRh Ge2 2
T1
T2
30
20
10
0 5 10 15 20 25
Fig. 297. CeRh2Ge2. Pressure dependence of magnetic transition temperature from paramagnetic (T1) to commensurate antiferromagnetism (T2) suggested, obtained from resistivity measurements [95U2].
Magnetic field [T]0 Hµ
Ce( Ru Pd ) Si1-x x 2 2
Mag
netic
mom
ent
[]
p mBµ
/ Ce
0.8
0.6
0.4
0.2
0 5 10 15 20
T = 4.2 K
Fig. 298. Ce(Ru1–xPdx)2Si2. Magnetic field dependence of magnetization at 4.2 K for x = 0.5 (solid triangles), 0.1 (+), 0.2 (×), 0.025 (solid circles), and x = 0 (solid squares) [95B2].
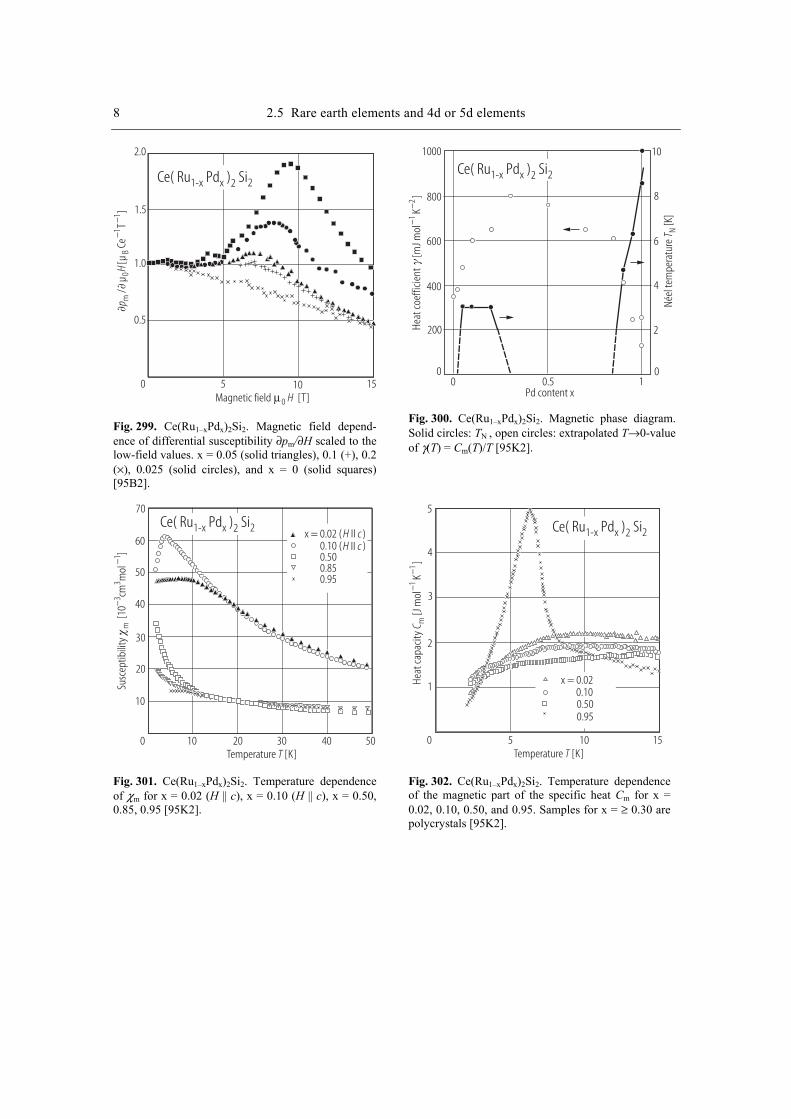
8 2.5 Rare earth elements and 4d or 5d elements
Magnetic field [T]0 Hµ
Ce( Ru Pd ) Si1-x x 2 2
2.0
1.5
1.0
0.5
0 5 10 15
/µ
[ µCe
T]
pH
m0
B1
1−
−
Fig. 299. Ce(Ru1–xPdx)2Si2. Magnetic field depend-ence of differential susceptibility ∂pm/∂H scaled to the low-field values. x = 0.05 (solid triangles), 0.1 (+), 0.2 (×), 0.025 (solid circles), and x = 0 (solid squares) [95B2].
Néel
tem
pera
ture
[K]
T N
Ce( Ru Pd ) Si1-x x 2 2
Heat
coef
ficie
nt[m
Jmol
K]
−−
12
Pd content x
1000
800
600
400
200
00 0.5 1
10
8
6
4
2
0
Fig. 300. Ce(Ru1–xPdx)2Si2. Magnetic phase diagram. Solid circles: TN , open circles: extrapolated T→0-value of γ(T) = Cm(T)/T [95K2].
Ce( Ru Pd ) Si1-x x 2 2
Temperature [K]T
Susc
eptib
ility
[10
cmm
ol]
m3
31
−−
H cIIH cIIx = 0.02 ( )
0.10 ( )0.500.850.95
70
60
50
40
30
20
10
0 10 20 30 40 50
Fig. 301. Ce(Ru1–xPdx)2Si2. Temperature dependence of χm for x = 0.02 (H || c), x = 0.10 (H || c), x = 0.50, 0.85, 0.95 [95K2].
Temperature [K]T
x = 0.020.100.500.95
0 5 10 15
5
4
3
2
1Heat
capa
city
[Jm
olK
]C m
11
−−
Ce( Ru Pd ) Si1-x x 2 2
Fig. 302. Ce(Ru1–xPdx)2Si2. Temperature dependence of the magnetic part of the specific heat Cm for x = 0.02, 0.10, 0.50, and 0.95. Samples for x = ≥ 0.30 are polycrystals [95K2].
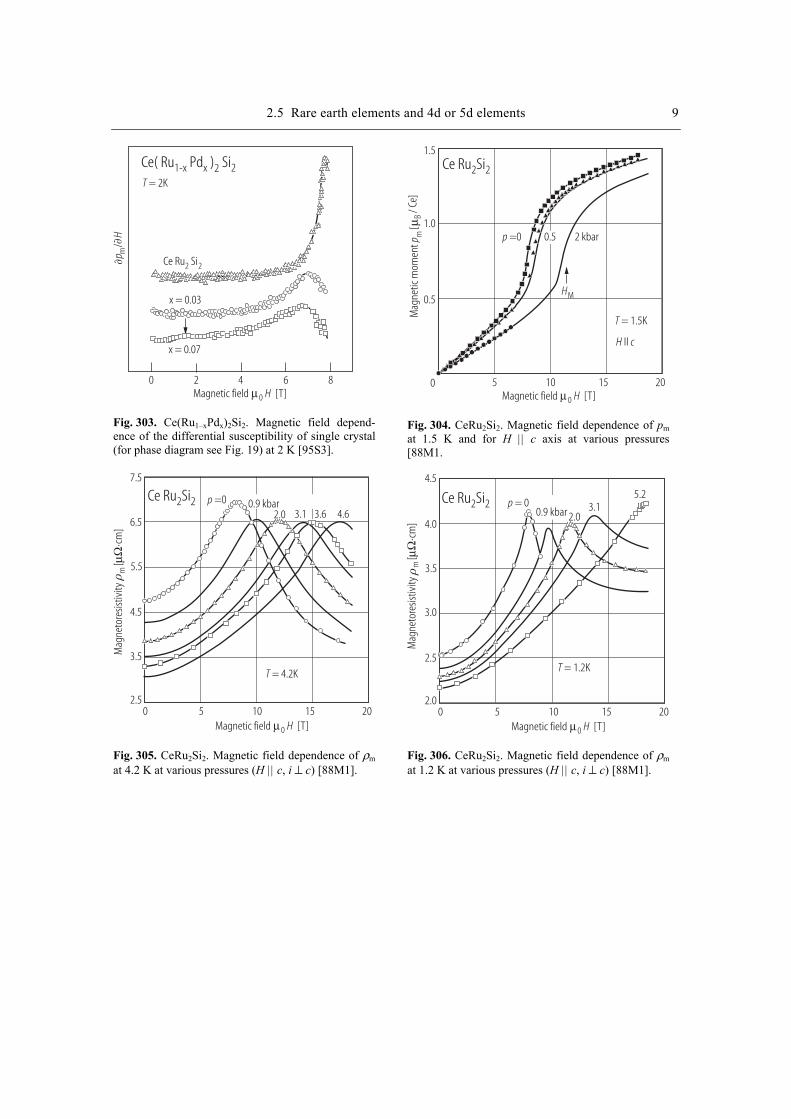
2.5 Rare earth elements and 4d or 5d elements 9
Ce( Ru Pd ) Si1-x x 2 2T = 2K
x = 0.03
x = 0.07
Ce Ru Si2 2
0 2 4 6 8Magnetic field [T]0 Hµ
pH
m/
Fig. 303. Ce(Ru1–xPdx)2Si2. Magnetic field depend-ence of the differential susceptibility of single crystal (for phase diagram see Fig. 19) at 2 K [95S3].
Ce Ru Si2 2
T = 1.5K
Magnetic field [T]0 Hµ
H cII
p =0 2 kbar
HM
0.5
Mag
netic
mom
ent
[p m
Bµ/ C
e]
1.5
1.0
0.5
0 5 10 15 20
Fig. 304. CeRu2Si2. Magnetic field dependence of pm at 1.5 K and for H || c axis at various pressures [88M1.
Ce Ru Si2 2
T = 4.2K
Magnetic field [T]0 Hµ
p =0
0 5 10 15 20
3.1 3.6 4.60.9 kbar
2.0
7.5
6.5
5.5
4.5
3.5
2.5
Mag
neto
resis
tivity
[cm
]µΩ
⋅m
Fig. 305. CeRu2Si2. Magnetic field dependence of ρm at 4.2 K at various pressures (H || c, i ⊥ c) [88M1].
Ce Ru Si2 2
T = 1.2K
Magnetic field [T]0 Hµ
p = 0
0 5 10 15 20
3.15.2
0.9 kbar 2.0
3.5
2.5
Mag
neto
resis
tivity
[cm
]µΩ
⋅m
4.0
4.5
3.0
2.0
Fig. 306. CeRu2Si2. Magnetic field dependence of ρm at 1.2 K at various pressures (H || c, i ⊥ c) [88M1].

10 2.5 Rare earth elements and 4d or 5d elements
CeRu Si2 2
T = 1.4K
Magnetic field [T]0 Hµ0 5 10 15 20
Mag
neto
stric
tion
/[1
0]
∆l l
−4
Mag
neto
stric
tion
/[1
0l l
−4
T]
−1µ 0
H
1.0
0.5
0
3
2
1
Fig. 307. CeRu2Si2. Magnetic field dependence of magnetostriction (H || c) at 1.4 K and its field deriva-tive. Solid lines are fits according to equation MsatΦ[H/Hs(P)] [88M1].
T [K]
Pressure [kbar]p
Néel
tem
pera
ture
[K]
T N
TN L
TN
40
20
00 10 20 30
Ce Pd Si2 2
Ce Pd Si2 2
CeRh Si2 2
Ce Rh Si2 2
0 50
(rela
tive)
Fig. 308. CeRh2Si2, CePd2Si2. Magnetic phase dia-grams [97G2].
Temperature [K]T
Susc
eptib
ility
[10
cmm
ol]
m3
31
−−
Inv.
susc
eptib
ility
[mol
cm]
m3−
−1
Ce Pd Si2 2
Ce Rh Si2 2
14
12
10
8
6
4
12
10
8
6
4
20 50 100 150 200 250 300
500
400
300
200
100
400
350
300
250
200
150
100
II aII c
II aII c
Fig. 309. CeRh2Si2, CePd2Si2. Tem-perature dependence of χm and χm
–1
of single crystal samples along the a and c axis. Solid curves indicate the calculated results [98H1].
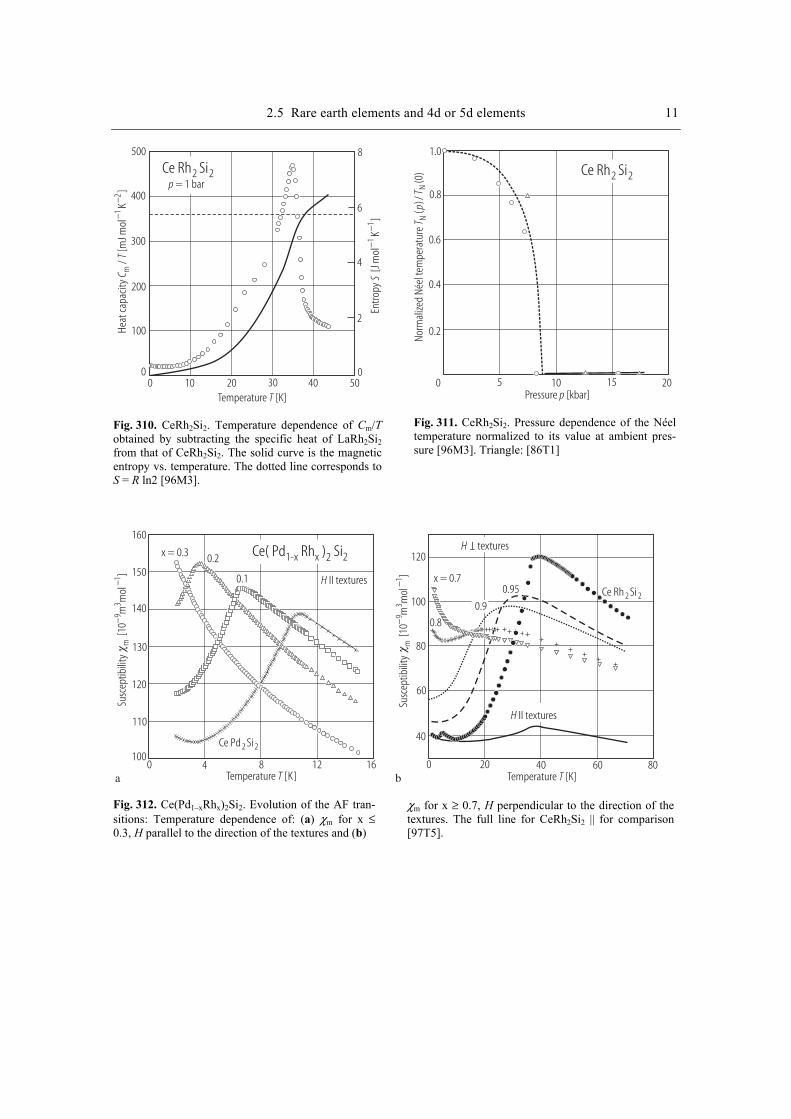
2.5 Rare earth elements and 4d or 5d elements 11
Temperature [K]T
Heat
capa
city
/[m
J mol
K]
CT
m1
2−
−
Entro
py[J
mol
K]
S−
−1
1
Ce Rh Si2 2p = 1 bar
500
400
300
200
100
00 10 20 30 40 50
8
6
4
2
0
Fig. 310. CeRh2Si2. Temperature dependence of Cm/T obtained by subtracting the specific heat of LaRh2Si2 from that of CeRh2Si2. The solid curve is the magnetic entropy vs. temperature. The dotted line corresponds to S = R ln2 [96M3].
Ce Rh Si2 2
Pressure [kbar]p
Norm
alize
d Né
el te
mpe
ratu
re(
Tp
N/
(0)
T N
1.0
0.8
0.6
0.4
0.2
0 5 10 15 20
)
Fig. 311. CeRh2Si2. Pressure dependence of the Néel temperature normalized to its value at ambient pres-sure [96M3]. Triangle: [86T1]
Temperature [K]T Temperature [K]T
Susc
eptib
ility
[10
mm
ol]
m9
31
−−
Susc
eptib
ility
[10
mm
ol]
m9
31
−−
Ce Pd Si2 2
Ce Rh Si2 2
H II textures
H II textures
H textures
T
x = 0.3 0.2
0.10.95
x = 0.7
0.9
0.8
120
100
80
60
40
0 20 40 60 80
160
150
140
130
120
110
1000 4 8 12 16
a b
Ce( Pd Rh ) Si1-x x 2 2
Fig. 312. Ce(Pd1–xRhx)2Si2. Evolution of the AF tran-sitions: Temperature dependence of: (a) χm for x ≤ 0.3, H parallel to the direction of the textures and (b)
χm for x ≥ 0.7, H perpendicular to the direction of the textures. The full line for CeRh2Si2 || for comparison [97T5].
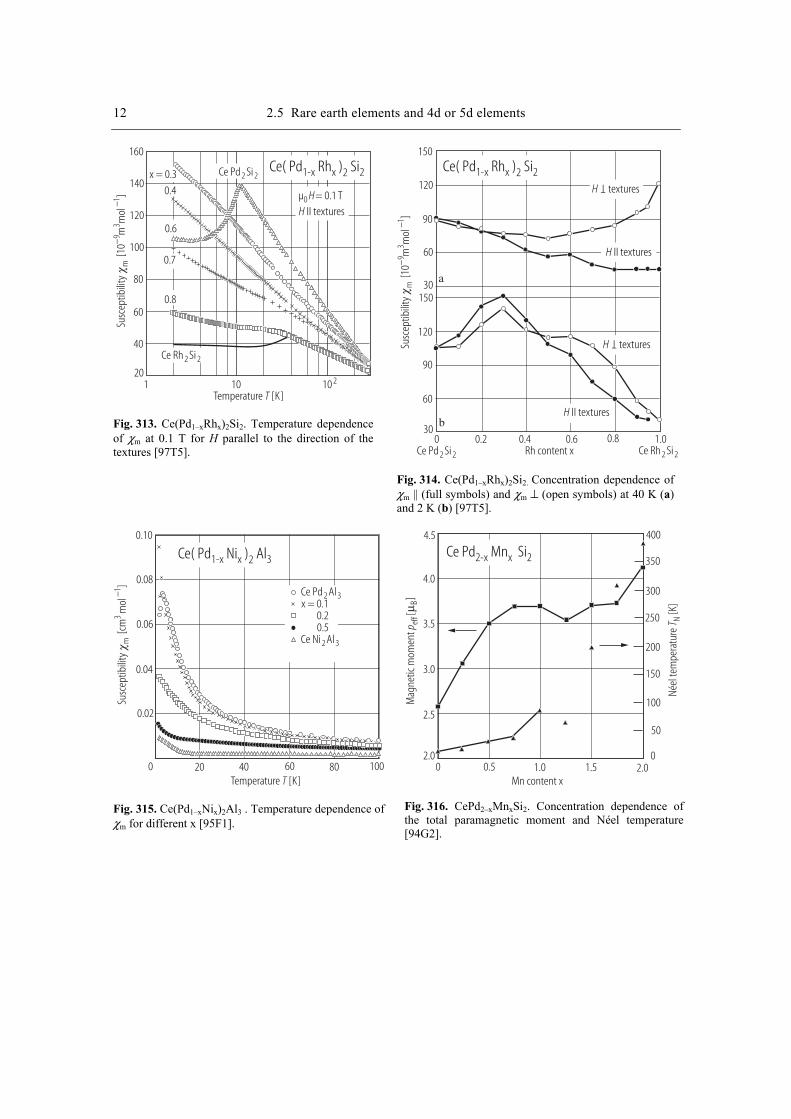
12 2.5 Rare earth elements and 4d or 5d elements
Temperature [K]T
Susc
eptib
ility
[10
mm
ol]
m9
31
−−
Ce Rh Si2 2
Ce( Pd Rh ) Si1-x x 2 2
H II textures
Ce Pd Si2 2x = 0.3
0.6
0.7
0.8
µ = 0.1 T0 H0.4
160
140
120
100
80
60
40
201 10 10 2
Fig. 313. Ce(Pd1–xRhx)2Si2. Temperature dependence of χm at 0.1 T for H parallel to the direction of the textures [97T5].
Susc
eptib
ility
[10
mm
ol]
m9
31
−−
Ce Rh Si2 2
Ce( Pd Rh ) Si1-x x 2 2
Ce Pd Si2 2
H textures
T
H textures
T
a
b
H II textures
H II textures
150
120
90
60
30150
120
90
60
300 0.2 0.4 0.6 0.8 1.0
Rh content x
Fig. 314. Ce(Pd1–xRhx)2Si2. Concentration dependence of χm || (full symbols) and χm ⊥ (open symbols) at 40 K (a) and 2 K (b) [97T5].
Temperature [K]T
Susc
eptib
ility
[cm
mol
]m
31−
Ce Ni Al2 3
Ce Pd Al2 3
Ce( Pd Ni ) Al1-x x 2 3
0.10
0.08
0.06
0.04
0.02
0 20 40 60 80 100
x = 0.10.20.5
Fig. 315. Ce(Pd1–xNix)2Al3 . Temperature dependence of χm for different x [95F1].
Ce Pd Mn Si2-x x 2
4.5
4.0
3.5
3.0
2.5
2.0
400
350
300
250
200
150
100
50
00 2.01.00.5 1.5
Mn content x
Mag
netic
mom
ent
[]
p eff
Bµ
Néel
tem
pera
ture
[K]
T N
Fig. 316. CePd2–xMnxSi2. Concentration dependence of the total paramagnetic moment and Néel temperature [94G2].
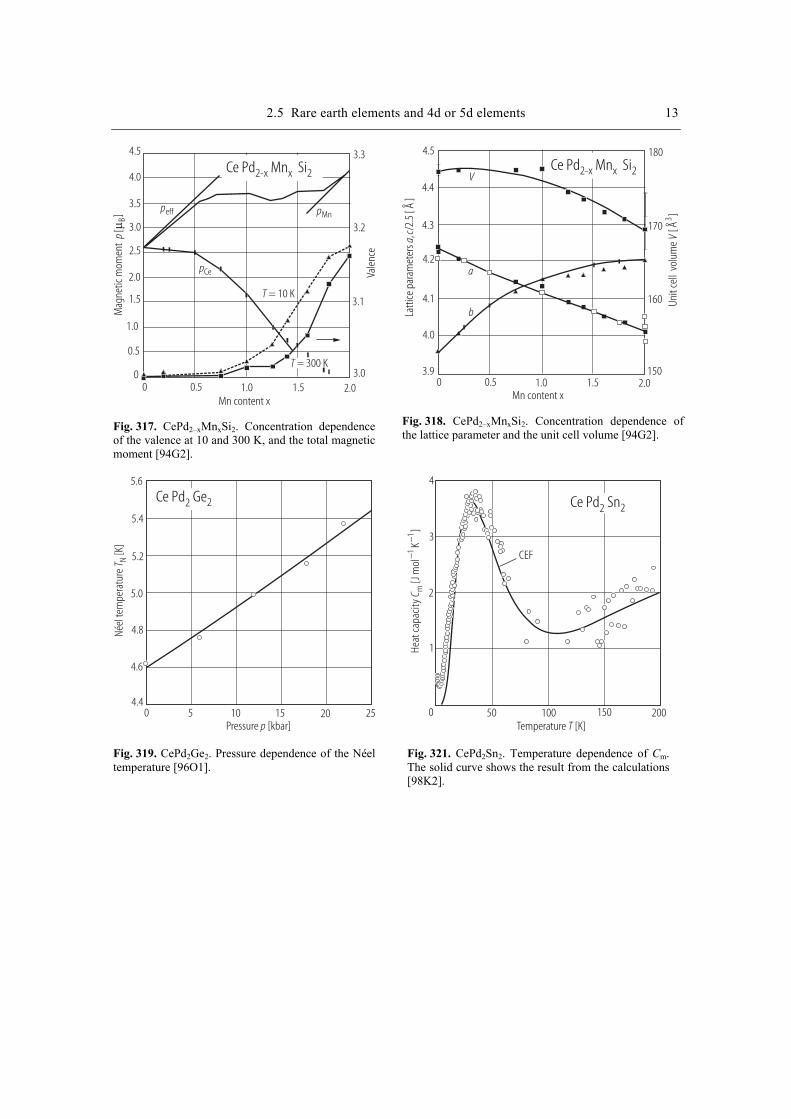
2.5 Rare earth elements and 4d or 5d elements 13
Ce Pd Mn Si2-x x 2
4.5
4.0
3.5
3.0
2.5
2.0
0 2.01.00.5 1.5Mn content x
Mag
netic
mom
ent
[]
pµ B
1.5
1.0
0.5
0
3.3
3.2
3.1
3.0Va
lenc
e
peff
pCe
pMn
T = 10 K
T = 300 K
Fig. 317. CePd2–xMnxSi2. Concentration dependence of the valence at 10 and 300 K, and the total magnetic moment [94G2].
Ce Pd Mn Si2-x x 2
4.5
4.4
4.3
4.2
4.1
4.0
0 2.01.00.5 1.5Mn content x
3.9
Latti
ce p
aram
eter
s,
/2.5
[ A°]
ac
180
170
160
150
Unit
cell
vol
ume
[A°]
V3
V
a
b
Fig. 318. CePd2–xMnxSi2. Concentration dependence of the lattice parameter and the unit cell volume [94G2].
Pressure [kbar]p
Néel
tem
pera
ture
[K]
T N
Ce Pd Ge2 2
5.6
5.4
5.2
5.0
4.8
4.6
4.40 5 10 15 20 25
Fig. 319. CePd2Ge2. Pressure dependence of the Néel temperature [96O1].
CEF
Ce Pd Sn2 2
4
3
2
1
0 50 100 150 200Temperature [K]T
Heat
capa
city
[Jm
olK
]C m
11
−−
Fig. 321. CePd2Sn2. Temperature dependence of Cm. The solid curve shows the result from the calculations [98K2].
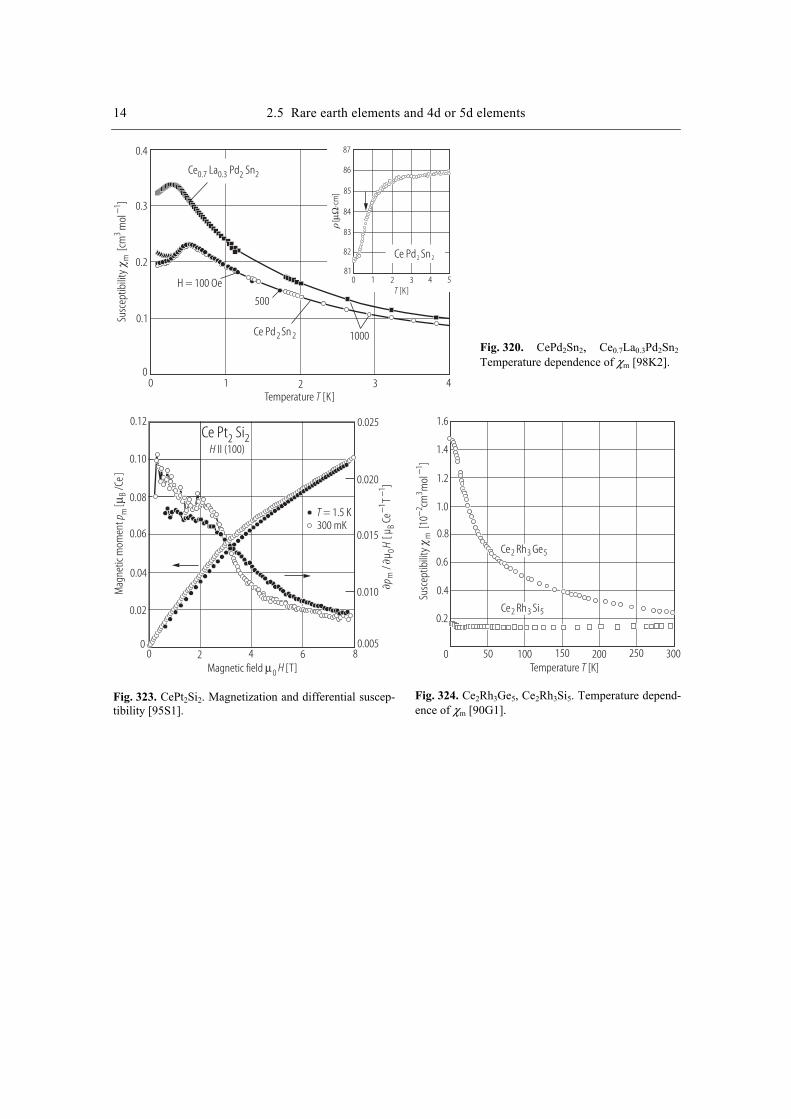
14 2.5 Rare earth elements and 4d or 5d elements
Temperature [K]T
Susc
eptib
ility
[cm
mol
]m
31−
Ce Pd Sn2 2
Ce Pd Sn2 2
Ce La Pd Sn0.7 0.3 2 2
1000
H = 100 Oe
500
0.4
0.3
0.2
0.1
00 1 2 3 4
87
86
85
84
83
82
810 1 2 3 4 5
[cm
]µΩ
⋅
[K]T
Fig. 320. CePd2Sn2, Ce0.7La0.3Pd2Sn2 Temperature dependence of χm [98K2].
Ce Pt Si2 2
Magnetic field [T]µ0 H
H II (100)
T = 1.5 K
Mag
netic
mom
ent
[]
p mBµ
/Ce
0.12
0.10
0.08
0.06
0.04
0.02
00 2 4 6 8
300 mK
0.025
0.020
0.015
0.010
0.005
pH
m0
/µ
[ µCe
T]
B1
1−
−
Fig. 323. CePt2Si2. Magnetization and differential suscep-tibility [95S1].
Temperature [K]T
Susc
eptib
ility
[10
cmm
ol]
m2
31
−−
Ce Rh Si2 3 5
Ce Rh Ge2 3 5
1.4
1.6
1.2
1.0
0.8
0.6
0.4
0.2
0 50 100 150 200 250 300
Fig. 324. Ce2Rh3Ge5, Ce2Rh3Si5. Temperature depend-ence of χm [90G1].
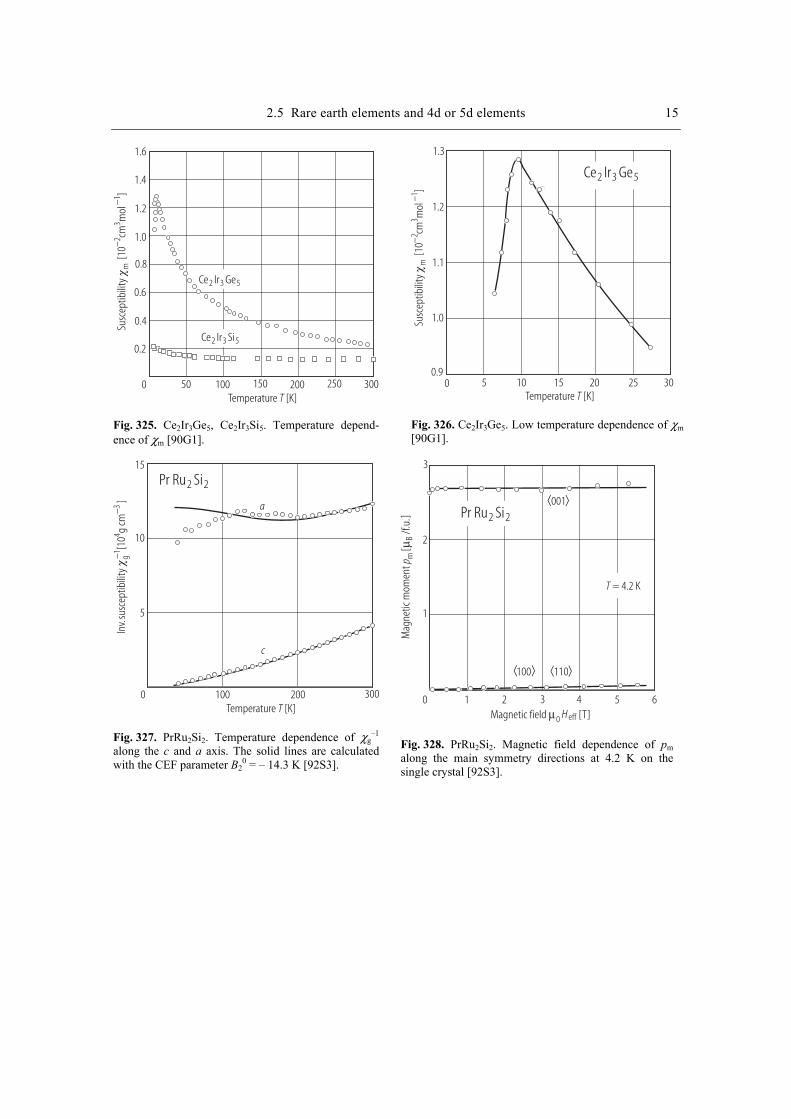
2.5 Rare earth elements and 4d or 5d elements 15
Temperature [K]T
Susc
eptib
ility
[10
cmm
ol]
m2
31
−−
Ce Ir Si2 3 5
Ce Ir Ge2 3 5
1.4
1.6
1.2
1.0
0.8
0.6
0.4
0.2
0 50 100 150 200 250 300
Fig. 325. Ce2Ir3Ge5, Ce2Ir3Si5. Temperature depend-ence of χm [90G1].
Temperature [K]T
Susc
eptib
ility
[10
cmm
ol]
m2
31
−−
Ce Ir Ge2 3 5
1.3
1.2
1.1
1.0
0.90 5 10 15 20 25 30
Fig. 326. Ce2Ir3Ge5. Low temperature dependence of χm [90G1].
Temperature [K]T
Pr Ru Si2 2
Inv.
susc
eptib
ility
[10
g cm
]g
43−
−1
a
c
15
10
5
0 100 200 300
Fig. 327. PrRu2Si2. Temperature dependence of χg
–1 along the c and a axis. The solid lines are calculated with the CEF parameter B2
0 = – 14.3 K [92S3].
Mag
netic
mom
ent
[]
p mBµ
/f.u.
Magnetic field [T]µ0 H eff
T = 4.2 K
Pr Ru Si2 2
3
2
1
0 1 2 3 4 5 6
100 110
001⟨ ⟩
⟨ ⟩ ⟨ ⟩
Fig. 328. PrRu2Si2. Magnetic field dependence of pm along the main symmetry directions at 4.2 K on the single crystal [92S3].
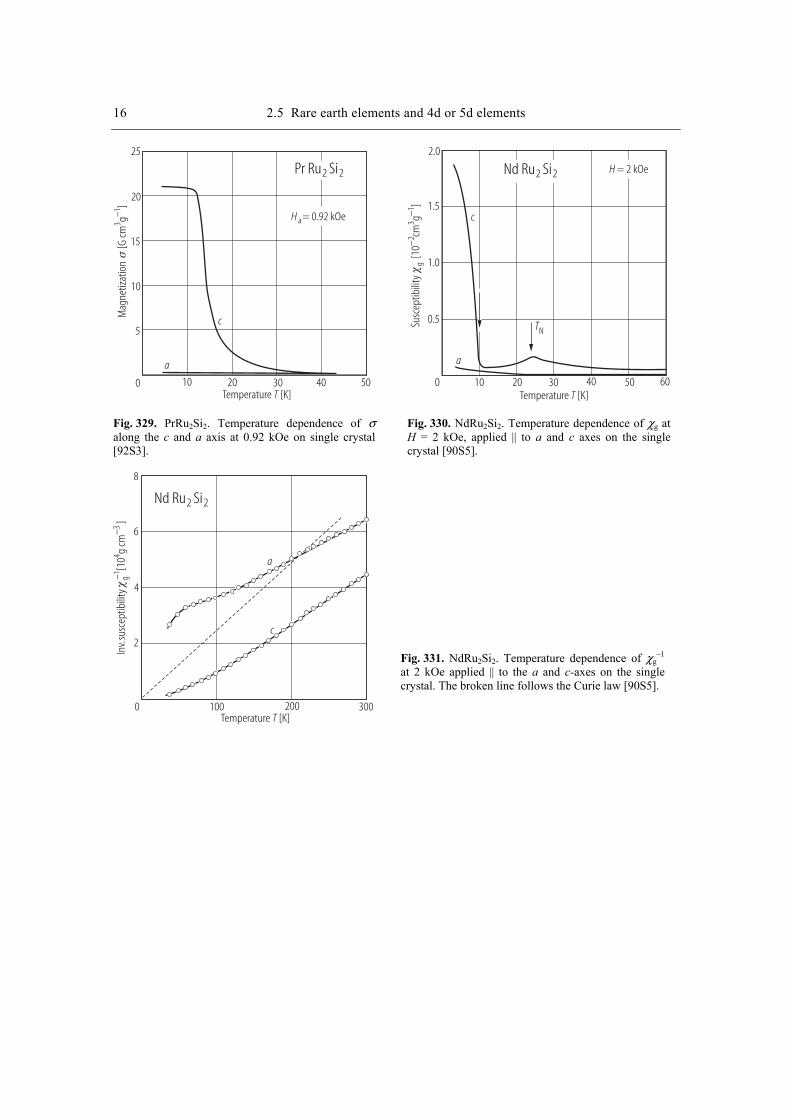
16 2.5 Rare earth elements and 4d or 5d elements
Temperature [K]T
Mag
netiz
atio
n
[G cm
g]
31−
Pr Ru Si2 2
H a= 0.92 kOe
a
c
25
20
15
10
5
0 10 20 30 40 50
Fig. 329. PrRu2Si2. Temperature dependence of σ along the c and a axis at 0.92 kOe on single crystal [92S3].
Temperature [K]T
Nd Ru Si2 2 H = 2 kOe
a
c
0 10 20 30 40 50
Susc
eptib
ility
[10
cmg
]g
23
1−
−
60
2.0
1.5
1.0
0.5TN
Fig. 330. NdRu2Si2. Temperature dependence of χg at H = 2 kOe, applied || to a and c axes on the single crystal [90S5].
Temperature [K]T
Nd Ru Si2 2
a
c
Inv.
susc
eptib
ility
[10
g cm
]g
43−
−1
8
6
4
2
0 100 200 300
Fig. 331. NdRu2Si2. Temperature dependence of χg
–1 at 2 kOe applied || to the a and c-axes on the single crystal. The broken line follows the Curie law [90S5].
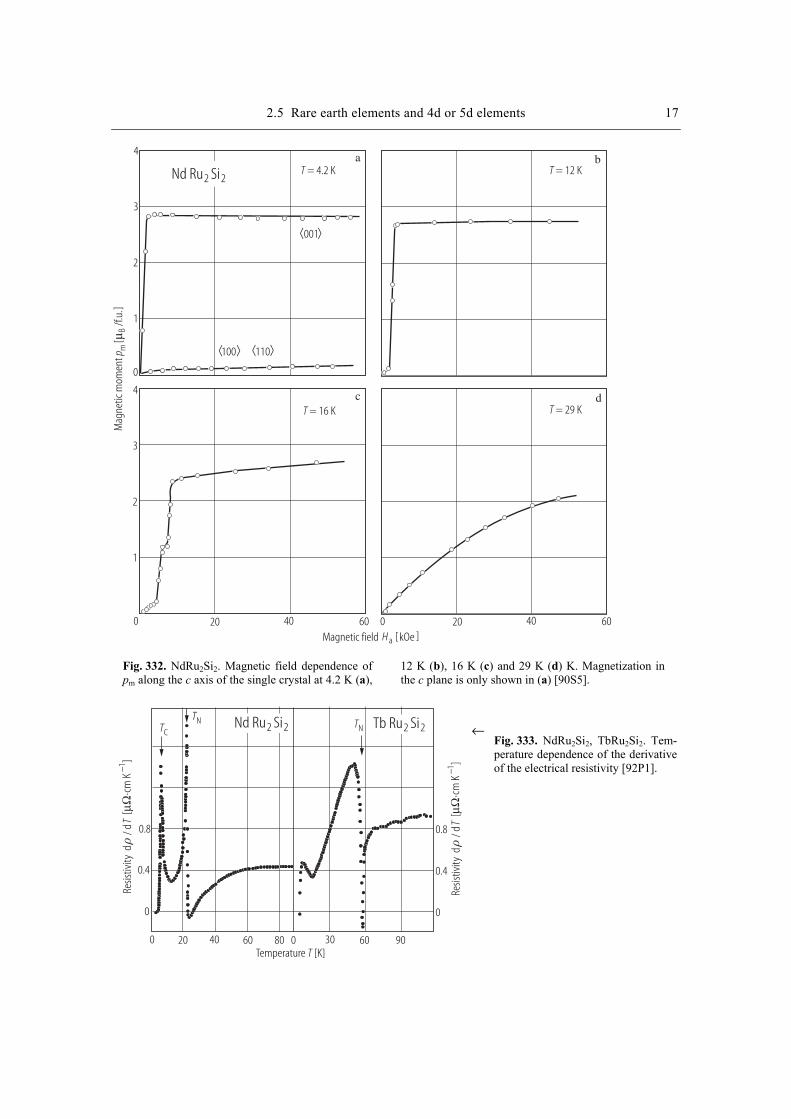
2.5 Rare earth elements and 4d or 5d elements 17 M
agne
tic m
omen
t[
]p m
Bµ/f.
u.
Magnetic field [kOe ]H a
T T= 4.2 K = 12 K
100 110
001
T = 16 K T = 29 K
Nd Ru Si2 2
0
0
020 2040 4060 60
4
4
3
3
2
2
1
1
a b
c d
⟨ ⟩
⟨ ⟩ ⟨ ⟩
Fig. 332. NdRu2Si2. Magnetic field dependence of pm along the c axis of the single crystal at 4.2 K (a),
12 K (b), 16 K (c) and 29 K (d) K. Magnetization in the c plane is only shown in (a) [90S5].
Temperature [K]T
Resis
tivity
d
/ dT
Resis
tivity
d
/ dT
[cm
K]
µΩ⋅
−1
[cm
K]
µΩ⋅
−1
Tb Ru Si2 2Nd Ru Si2 2TC
TN TN
0.8
0.4
0
0 20 40 60 80 0 30 60 90
0
0.4
0.8
←
Fig. 333. NdRu2Si2, TbRu2Si2. Tem-perature dependence of the derivative of the electrical resistivity [92P1].
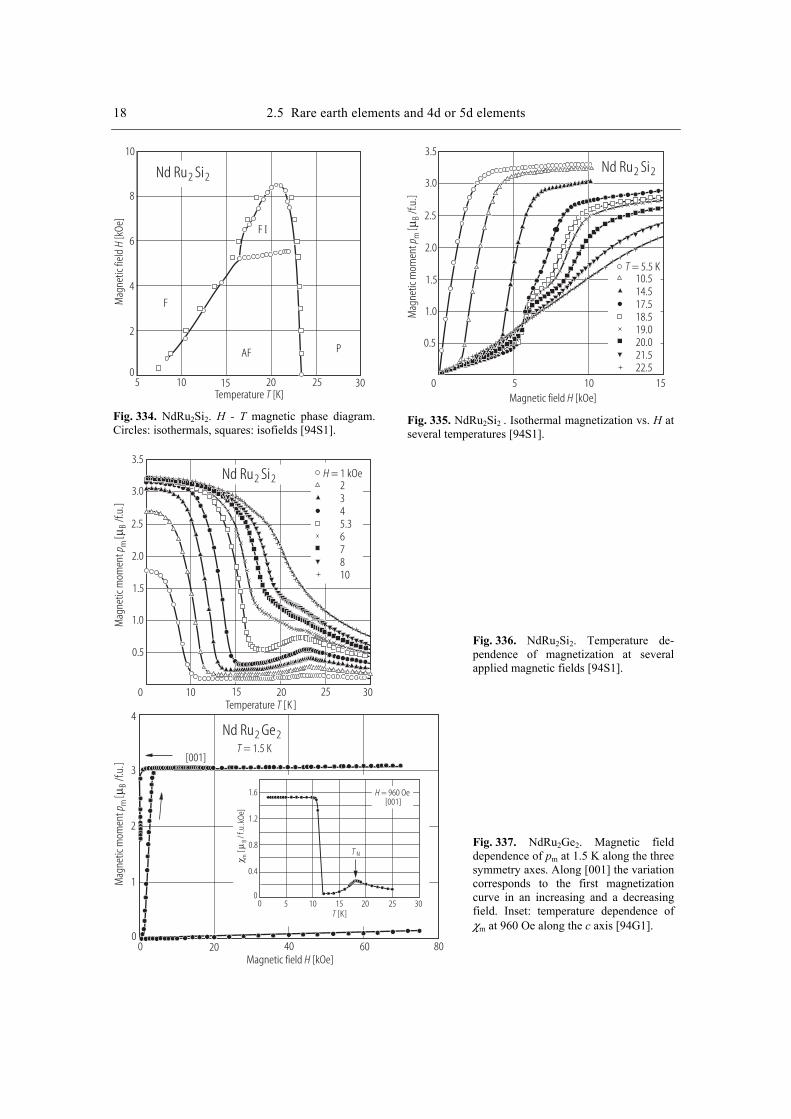
18 2.5 Rare earth elements and 4d or 5d elements
Temperature [K]T
Nd Ru Si2 2
10
8
6
4
2
05 10 15 20 25 30
AF
F
P
F I
Mag
netic
fiel
d[k
Oe]
H
Fig. 334. NdRu2Si2. H - T magnetic phase diagram. Circles: isothermals, squares: isofields [94S1].
Nd Ru Si2 2
Magnetic field [kOe]HM
agne
tic m
omen
t[
]p m
Bµ/f.
u.
3.5
3.0
2.5
2.0
1.5
1.0
0.5
0 5 10 15
T = 5.5 K10.514.517.518.519.020.021.522.5
Fig. 335. NdRu2Si2 . Isothermal magnetization vs. H at several temperatures [94S1].
Mag
netic
mom
ent
[]
p mBµ
/f.u.
3.5
3.0
2.5
2.0
1.5
1.0
0.5
0
H = 1 kOe2345.367810
Nd Ru Si2 2
10 15 20 25 30Temperature [K ]T
Fig. 336. NdRu2Si2. Temperature de-pendence of magnetization at several applied magnetic fields [94S1].
Nd Ru Ge2 2
Magnetic field [kOe]H
Mag
netic
mom
ent
[]
p mBµ
/f.u.
T = 1.5 K
[K]T
4
3
2
1
00 20 40 60 80
[001]
[kO
e]/f
mB
µ.u
.
1.6
1.2
0.8
0.4
00 5 10 15 20 25 30
T N
H = 960 Oe[001]
Fig. 337. NdRu2Ge2. Magnetic field dependence of pm at 1.5 K along the three symmetry axes. Along [001] the variation corresponds to the first magnetization curve in an increasing and a decreasing field. Inset: temperature dependence of χm at 960 Oe along the c axis [94G1].
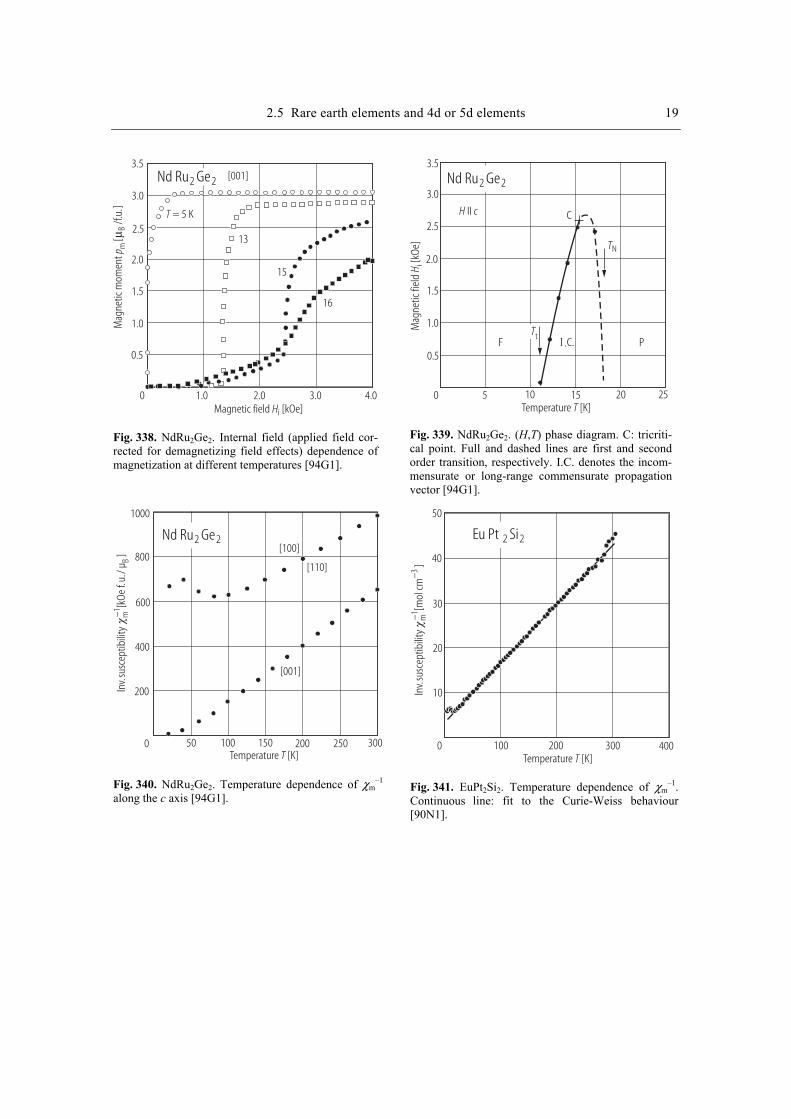
2.5 Rare earth elements and 4d or 5d elements 19
Magnetic field [kOe]Hi
Mag
netic
mom
ent
[]
p mBµ
/f.u. T = 5 K
[001]Nd Ru Ge2 2
3.5
3.0
2.5
2.0
1.5
1.0
0.5
0 1.0 2.0 3.0 4.0
13
15
16
Fig. 338. NdRu2Ge2. Internal field (applied field cor-rected for demagnetizing field effects) dependence of magnetization at different temperatures [94G1].
Mag
netic
fiel
d[k
Oe]
H i
Nd Ru Ge2 2
3.5
3.0
2.5
2.0
1.5
0.5
1.0
0 5 10 15 20 25Temperature [K]T
H cII
TN
C
C.F PI .Tt
Fig. 339. NdRu2Ge2. (H,T) phase diagram. C: tricriti-cal point. Full and dashed lines are first and second order transition, respectively. I.C. denotes the incom-mensurate or long-range commensurate propagation vector [94G1].
Temperature [K]T
Inv.
susc
eptib
ility
[kOe
f.u.
/ µ]
mB
−1
Nd Ru Ge2 2
1000
800
600
400
200
0 50 100 150 200 250 300
[100]
[110]
[001]
Fig. 340. NdRu2Ge2. Temperature dependence of χm
–1 along the c axis [94G1].
Temperature [K]T
Inv.
susc
eptib
ility
[mol
cm]
m3−
−1
50
40
30
20
10
0 100 200 300
Eu Pt Si2 2
400
Fig. 341. EuPt2Si2. Temperature dependence of χm
–1. Continuous line: fit to the Curie-Weiss behaviour [90N1].
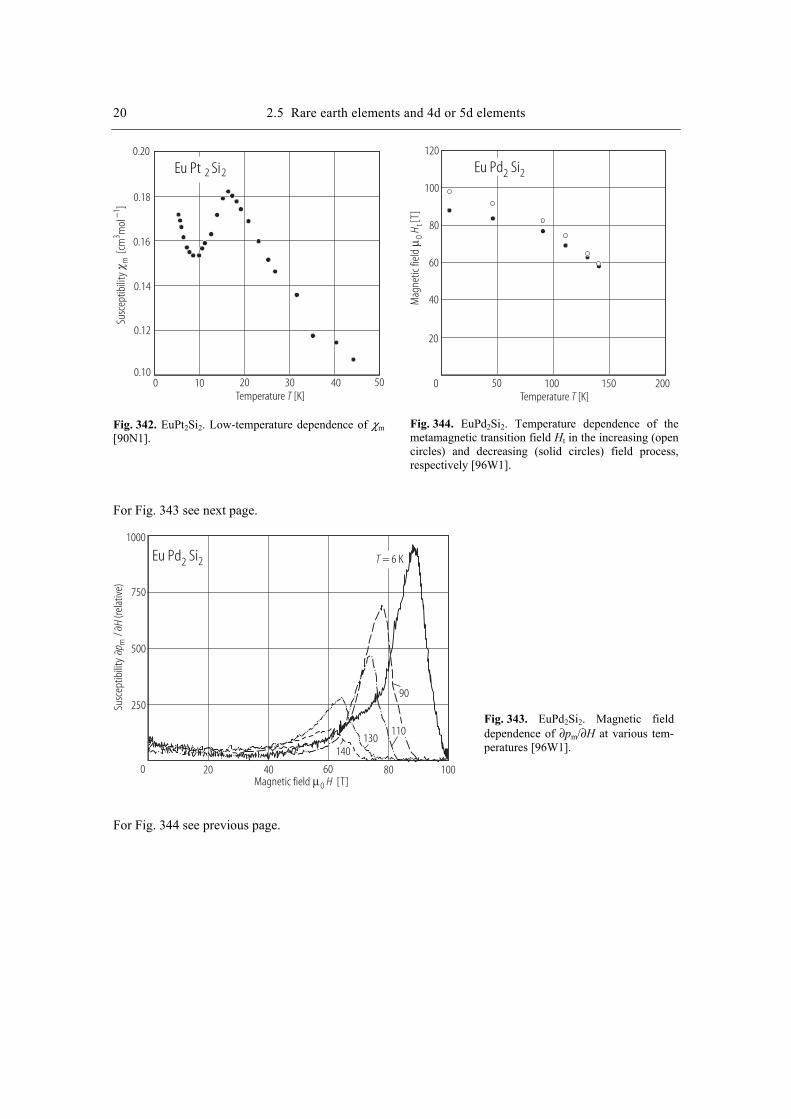
20 2.5 Rare earth elements and 4d or 5d elements
Temperature [K]T0 10 20 30 40 50
Eu Pt Si2 2
Susc
eptib
ility
[cm
mol
]m
31−
0.10
0.12
0.14
0.16
0.18
0.20
Fig. 342. EuPt2Si2. Low-temperature dependence of χm [90N1].
Temperature [K]T
Eu Pd Si2 2
Mag
netic
fiel
d[T
]0
Hµ
t
120
100
80
60
40
20
0 50 100 150 200
Fig. 344. EuPd2Si2. Temperature dependence of the metamagnetic transition field Ht in the increasing (open circles) and decreasing (solid circles) field process, respectively [96W1].
For Fig. 343 see next page.
Eu Pd Si2 2
Magnetic field [T]0 Hµ
T = 6 K
90
110130
140
0 20 40 60 80 100
pH
m/
Susc
eptib
ility
(re
lativ
e)
1000
750
500
250
Fig. 343. EuPd2Si2. Magnetic field dependence of ∂pm/∂H at various tem-peratures [96W1].
For Fig. 344 see previous page.

References
86T1 Thompson, J.D., Parks, R.D., Borges, H.: J. Magn. Magn. Mater. 54-57 (1986) 377 88B1 Bohm, A., Caspary, R., Habel, U., Pawlak, L., Zuber, A., Steglich, F.: J. Magn. Magn. Mater.
76-77 (1988) 150 88M1 Mignot, J.-M., Flouquet, J., Haen, P., Lapierre, L., Puech, L., Voiron, J.: J. Magn. Magn.
Mater. 76- 77 (1988) 97 90G1 Godart, C., Gupta, L., C., Tomy, C., V., Patil, S., Nagarajan, R., Beaurepaire, E.: Physica B 163
(1990) 163 90N1 Nagarajan, R., Sampathkumaran, E., Vijayaraghavan, R.: Physica B 163 (1990) 591 90S5 Schobinger-Papamantellos, P., de Mooij, D.B., Buschow, K.H.J.: J. Less-Common Met. 163
(1990) 319 92D1 Dakin, S., Rapson, G., Rainford, B.D.: J. Magn. Magn. Mater. 108 (1992) 117 92P1 Pinto, R.P., Amado, M.M., Salgueiro Silva, M., Braga, M.E., Sousa, J.B., Chavalier, B.,
Etourneau, J.: J. Magn. Magn. Mater. 104-107 (1992) 1235 92S2 Sakakibara ,T., Sekine, C., Amitsuka, H., Miyako Y.: J. Magn. Magn. Mater. 108 (1992)193 92S3 Shigeoka, T., Iwata, N., Fujii, H.: J. Magn. Magn. Mater. 104-107 (1992) 1229 94G1 Garnier, A., Gignoux, D., Schmitt, D., Shigeoka, F.Y., Zhang: J. Magn. Magn. Mater. 140-144
(1994) 897 94G2 Godart, C., Flandorfer, H., Fogl, P.: Physica B 199-200 (1994) 512 94H1 Hu, Z., Yelon, W.B.: J. Appl. Phys. 76 (1994) 6162 94S1 Salgueiro da Silva, M., Sousa, J.B., Chevalier, B., Etourneau, J.: J. Appl. Phys. 76 (1994) 634495B2 Besnus, M.J., Braghta, A., Haen, P., Kappler, J.P., Meyer, A.: Physica B 206-207 (1995) 295 95F1 Fujiwara, K., Yamanashi, Y., Kumagai, K.: Physica B 206-207 (1995) 228 95K1 Kawarazaki, S., Kobashi, Y., Fernandez-Baca, J.A., Murayama, S., Onuki, Y., Miyako, Y.:
Physica B 206-207 (1995) 298 95K2 Kusumoto, T., Takagi, S., Suzuki, H.: Physica B 206-207 (1995) 301 95S1 Sakakibara, T., Tayama, T., Mitamura, H., Matsuhira, K., Amitsuka, H.: Physica B 206-207
(1995) 249 95S3 Sekine, C., Sakamoto, H., Muryayama, S., Hoshi, K., Sakakibara, T.: Physica B 206-207
(1995) 291 95U2 Uwatoko, Y., Oomi, G., Graf, T., Thompson,J.D., Canifield, P.C., Borges, H.A., Godart, C.,
Gupta, L.C.: Physica B 206-207 (1995) 236 96B2 Besnus, M.J., Haen, P., Mallmann, F., Kappler, J.P., Meyer, A.: Physica B 223-224 (1996) 32296M3 Movshovich, R., Graf, T., Mandrus, D., Hundley, M.F., Thompson, J.D., Fisher, R.A., Phillips,
N.E., Smith, J.L.: Physica B 223-224 (1996) 126 96O1 Oomi, G., Uwatoko, Y., Sampathkumaran, E.V., Ishikawa, M.: Physica B 223-224 (1996) 303 96T1 Takeuchi, T., Miyako, Y.: J. Phys Soc. Jpn. 65 (1996) 3242 96W1 Wada, H., Mitsuda, A., Shiga, M.: J. Phys. Soc. Jpn. 65 (1996) 3471 97G2 Grosche, F.M., Julian, S.R., Mathur, N.D., Carter, F.V., Lonzarich, G.G.: Physica B 237-238
(1997) 197 97T5 Trovvarelli, O., Gomez-Berisso, M., Pedrazzini, P., Bosse, D., Geibel, C., Sereni, J.G.,
Steglich, F.: J. Alloys Comp. 275-277 (1997) 569 98H1 Hideki Abe, Hideaki Kitazawa, Hiroyuki Suzuki, Giyuu Kido, Takehiko Matsumoto.: J. Magn.
Magn. Mater. 177-181 (1998) 479 98K2 Kuwai, T., Takagi, H., Ito, H., Isikawa, Y., Sakurai, J., Nishimura, K., Paulsen, C.C.: J. Magn.
Magn. Mater. 177-181 (1998) 399 98S1 Sekine, C., Tayama, T., Sakakibara, T., Murayama, S., Shirotani, I., Onuki, Y.: J. Magn.
Magn. Mater. 177-181 (1998) 411 98T3 Taniguchi, T., Tabata, Y., Tanabe, H., Miyako, Y.: J. Magn. Magn. Mater. 177-181 (1998) 419
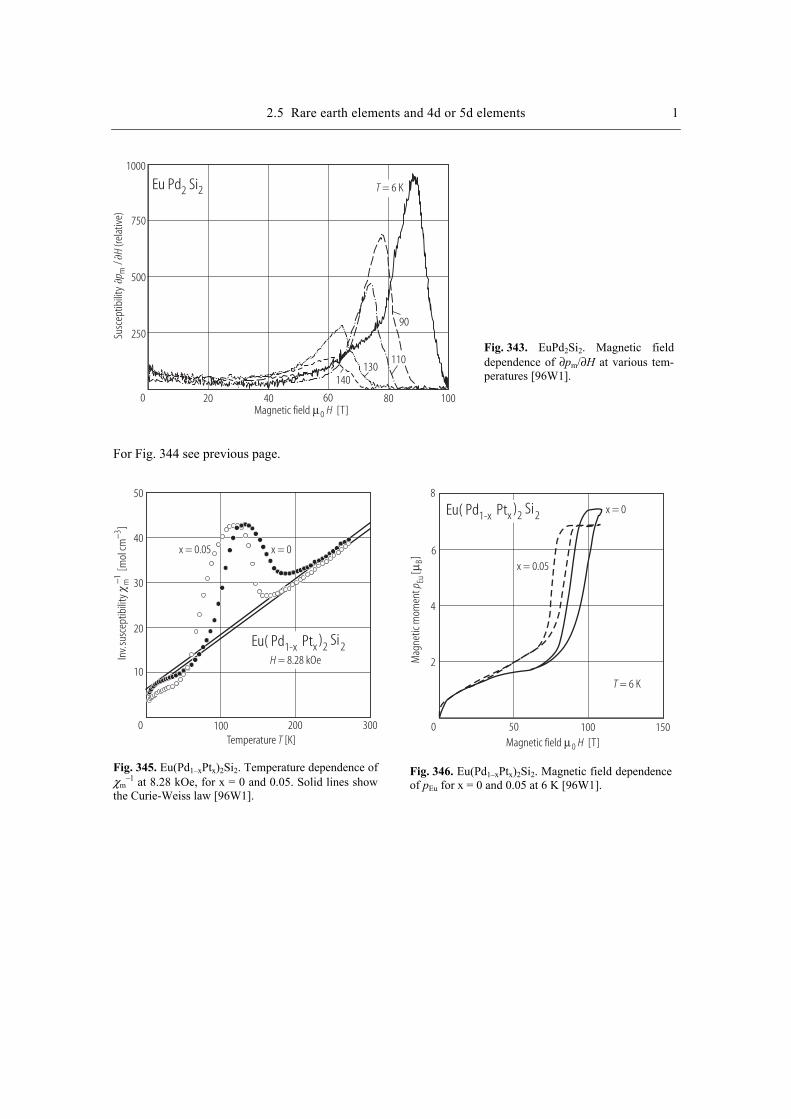
2.5 Rare earth elements and 4d or 5d elements 1
Eu Pd Si2 2
Magnetic field [T]0 Hµ
T = 6 K
90
110130
140
0 20 40 60 80 100
pH
m/
Susc
eptib
ility
(re
lativ
e)
1000
750
500
250
Fig. 343. EuPd2Si2. Magnetic field dependence of ∂pm/∂H at various tem-peratures [96W1].
For Fig. 344 see previous page.
Temperature [K]T
Inv.
susc
eptib
ility
[ mol
cm]
m3−
−1
Eu( Pd Pt1-x x ) Si2 2
50
40
30
20
10
0 100 200 300
x = 0.05 x = 0
H = 8.28 kOe
Fig. 345. Eu(Pd1–xPtx)2Si2. Temperature dependence of χm
–1 at 8.28 kOe, for x = 0 and 0.05. Solid lines show the Curie-Weiss law [96W1].
x = 0.05
x = 0
Magnetic field [T]0 Hµ
Mag
netic
mom
ent
[]
p EuBµ
T = 6 K
Eu( Pd Pt1-x x ) Si2 2
8
6
4
2
0 50 100 150
Fig. 346. Eu(Pd1–xPtx)2Si2. Magnetic field dependence of pEu for x = 0 and 0.05 at 6 K [96W1].

2 2.5 Rare earth elements and 4d or 5d elements
Temperature [K]T
Inv.
susc
eptib
ility
[T
kg A
m]
−−
12
−1
0 100 200 300
2.00
1.60
1.20
0.80
0.40
Gd Ru Si2 2Gd Rh Si2 2Gd Pd Si2 2Gd Ag Si2 2
Fig. 347. GdRu2Si2, GdRh2Si2, GdPd2Si2, Temperature dependence of χ–1 [97T1].
Gd Ru Si2 2Gd Rh Si2 2Gd Pd Si2 2Gd Ag Si2 2
Magnetic field [T]0 Hµ
Mag
netic
mom
ent
[]
p GdBµ
8
6
4
2
0 4 8 12 16 20
Fig. 348. GdRu2Si2, GdRh2Si2, GdPd2Si2. Magnetic field dependence of pGd at 4.2 K [97T1].
Temperature [K]T
Susc
eptib
ility
[/ f
.u.k
Oe]
mBµ
Gd Ru Si2 2
[100]
[110]
[001]
H = 0.96 kOe
0.9
0.8
0.7
0.6
0.5
0.4
0.3
0.20 10 20 30 40 50 60 70
Fig. 349. GdRu2Si2. Temperature dependence of χm for the three main crystallographic axes at 0.96 kOe. Note that the three curves along the main crystallo-graphic axes are superimposed [95G3].
Temperature [K]T
Inv.
susc
eptib
ility
[ kOe
f.u.
/ µ]
mB
Gd Ru Si2 2
[100][001] and
200
150
100
50
0 100 200 300
Fig. 350. GdRu2Si2. Temperature dependence of χm
–1 along the [001] and [100] axes [95G3].
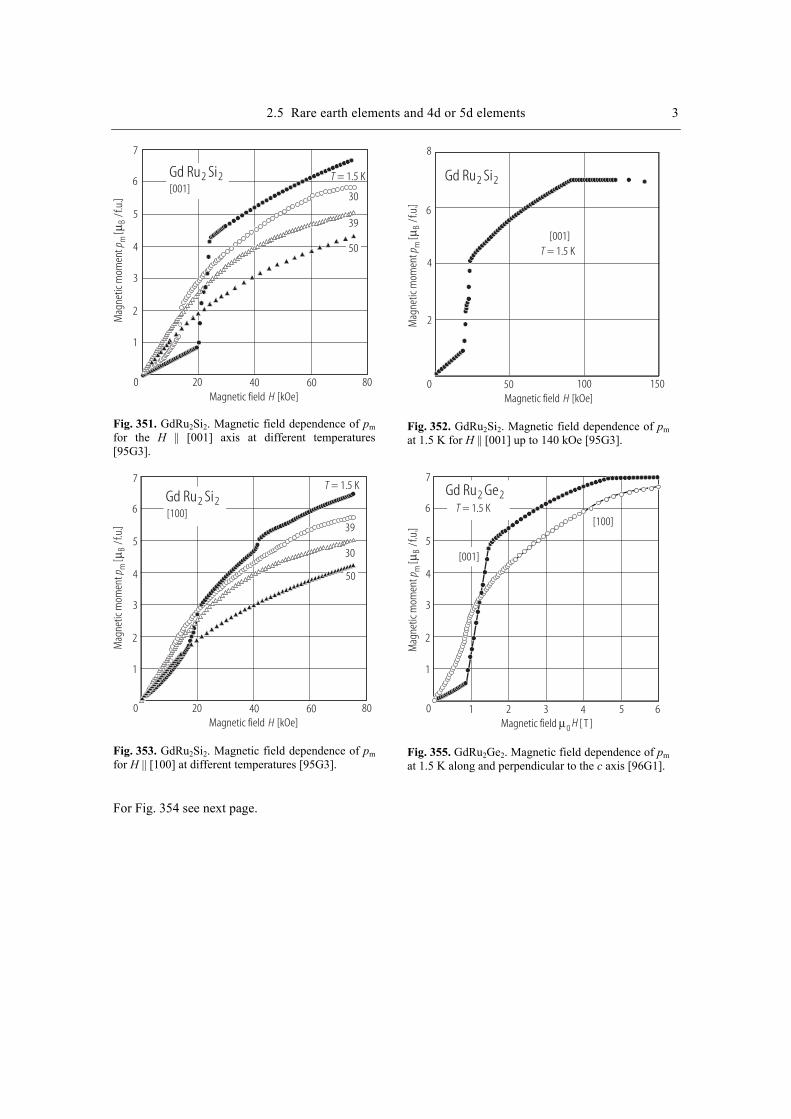
2.5 Rare earth elements and 4d or 5d elements 3
Magnetic field [kOe]H
Mag
netic
mom
ent
[]
p mBµ
/f.u
.
Gd Ru Si2 2[001]
T = 1.5 K
30
39
50
0 20 40 60 80
2
4
6
7
5
3
1
Fig. 351. GdRu2Si2. Magnetic field dependence of pm for the H || [001] axis at different temperatures [95G3].
Gd Ru Si2 2
[001]
Magnetic field [kOe]HM
agne
tic m
omen
t[
]p m
Bµ/f
.u.
T = 1.5 K
8
6
4
2
0 50 100 150
Fig. 352. GdRu2Si2. Magnetic field dependence of pm at 1.5 K for H || [001] up to 140 kOe [95G3].
Magnetic field [kOe]H
Mag
netic
mom
ent
[]
p mBµ
/f.u
.
T = 1.5 K
30
39
50
0 20 40 60 80
2
4
6
7
5
3
1
Gd Ru Si2 2[100]
Fig. 353. GdRu2Si2. Magnetic field dependence of pm for H || [100] at different temperatures [95G3].
Mag
netic
mom
ent
[]
p mBµ
/f.u
.
T = 1.5 K
0
2
4
6
7
5
3
1
Gd Ru Ge2 2
[100]
[001]
Magnetic field [ T ]µ0 H1 2 3 4 5 6
Fig. 355. GdRu2Ge2. Magnetic field dependence of pm at 1.5 K along and perpendicular to the c axis [96G1].
For Fig. 354 see next page.
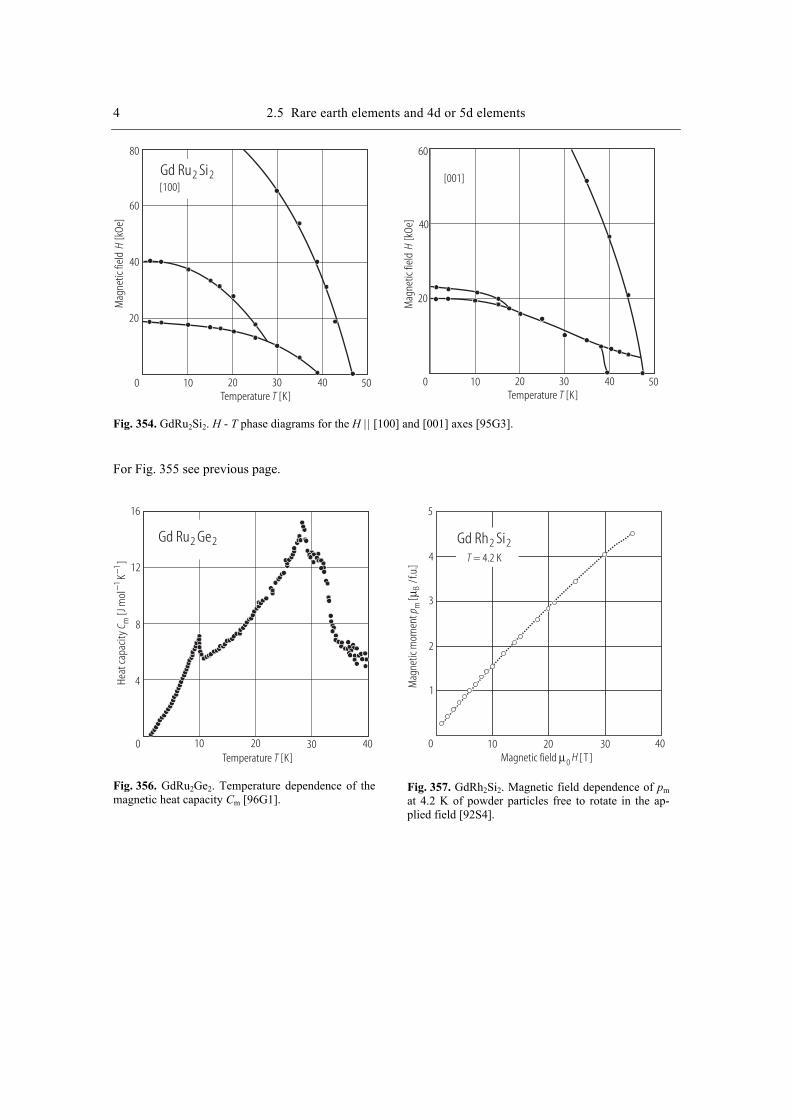
4 2.5 Rare earth elements and 4d or 5d elements M
agne
tic fi
eld
[kOe
]H
Mag
netic
fiel
d[k
Oe]
H
Gd Ru Si2 2[100]
[001]
Temperature [K]T Temperature [K]T
80
60
60
40
40
20
20
0 010 1020 2030 3040 4050 50
Fig. 354. GdRu2Si2. H - T phase diagrams for the H || [100] and [001] axes [95G3]. For Fig. 355 see previous page.
Gd Ru Ge2 2
Temperature [K]T
Heat
capa
city
[Jm
olK
]C m
11
−−
16
12
8
4
0 10 20 30 40
Fig. 356. GdRu2Ge2. Temperature dependence of the magnetic heat capacity Cm [96G1].
Mag
netic
mom
ent
[]
p mBµ
/f.u
.
T = 4.2 K
Magnetic field [ T ]µ0 H
Gd Rh Si2 2
5
4
3
2
1
0 10 20 30 40
Fig. 357. GdRh2Si2. Magnetic field dependence of pm at 4.2 K of powder particles free to rotate in the ap-plied field [92S4].
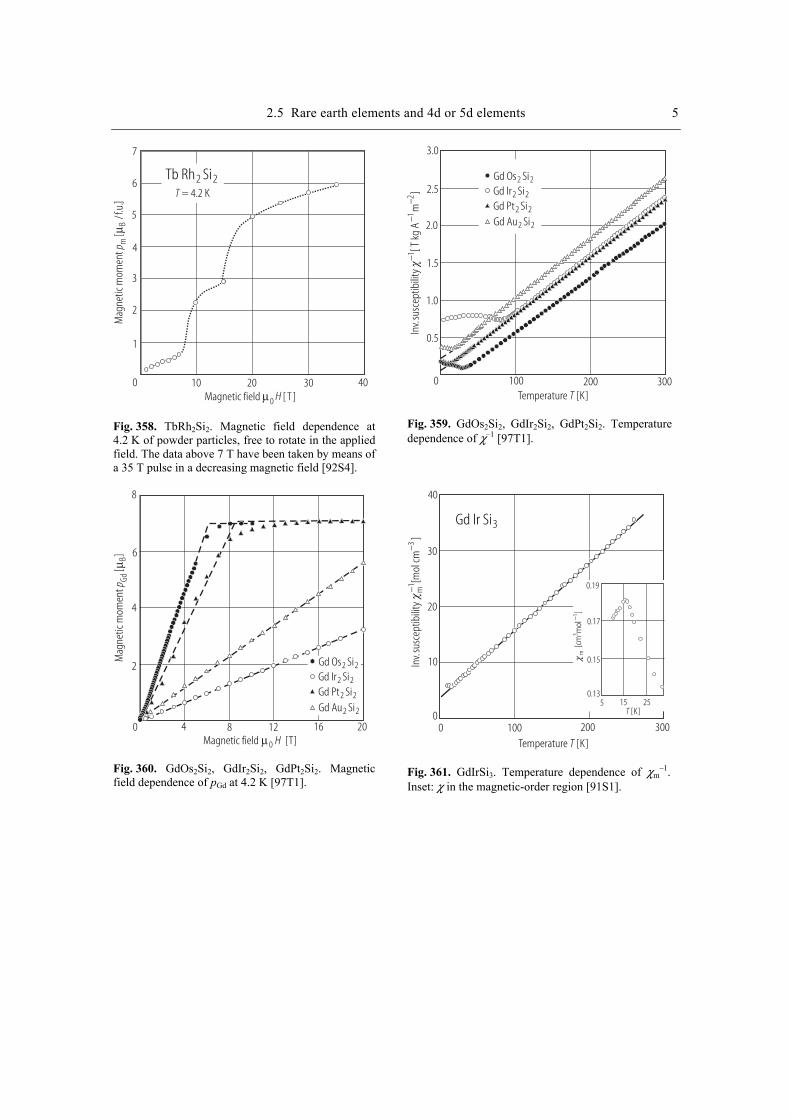
2.5 Rare earth elements and 4d or 5d elements 5 M
agne
tic m
omen
t[
]p m
Bµ/f
.u.
T = 4.2 K
Magnetic field [ T ]µ0 H
Tb Rh Si2 2
5
4
3
2
1
0 10 20 30 40
6
7
Fig. 358. TbRh2Si2. Magnetic field dependence at 4.2 K of powder particles, free to rotate in the applied field. The data above 7 T have been taken by means of a 35 T pulse in a decreasing magnetic field [92S4].
Temperature [K]T
Inv.
susc
eptib
ility
[ T kg
Am
]−
−1
2
Gd Os Si2 2Gd Ir Si2 2
Gd Pt Si2 2
Gd Au Si2 2
0 100 200 300
3.0
2.5
2.0
1.5
1.0
0.5
−1
Fig. 359. GdOs2Si2, GdIr2Si2, GdPt2Si2. Temperature dependence of χ–1 [97T1].
Gd Os Si2 2Gd Ir Si2 2
Gd Pt Si2 2
Gd Au Si2 2
8
6
4
2
0 4 8 12 16 20Magnetic field [T]0 Hµ
Mag
netic
mom
ent
[]
p GdBµ
Fig. 360. GdOs2Si2, GdIr2Si2, GdPt2Si2. Magnetic field dependence of pGd at 4.2 K [97T1].
Gd Ir Si3
Temperature [K]T
Inv.
susc
eptib
ility
[mol
cm]
m3−
−1
40
30
20
10
00 100 200 300
[cm
mol
]m
31−
χ0.19
0.17
0.15
0.135 15 25
[K]T
Fig. 361. GdIrSi3. Temperature dependence of χm
–1. Inset: χ in the magnetic-order region [91S1].
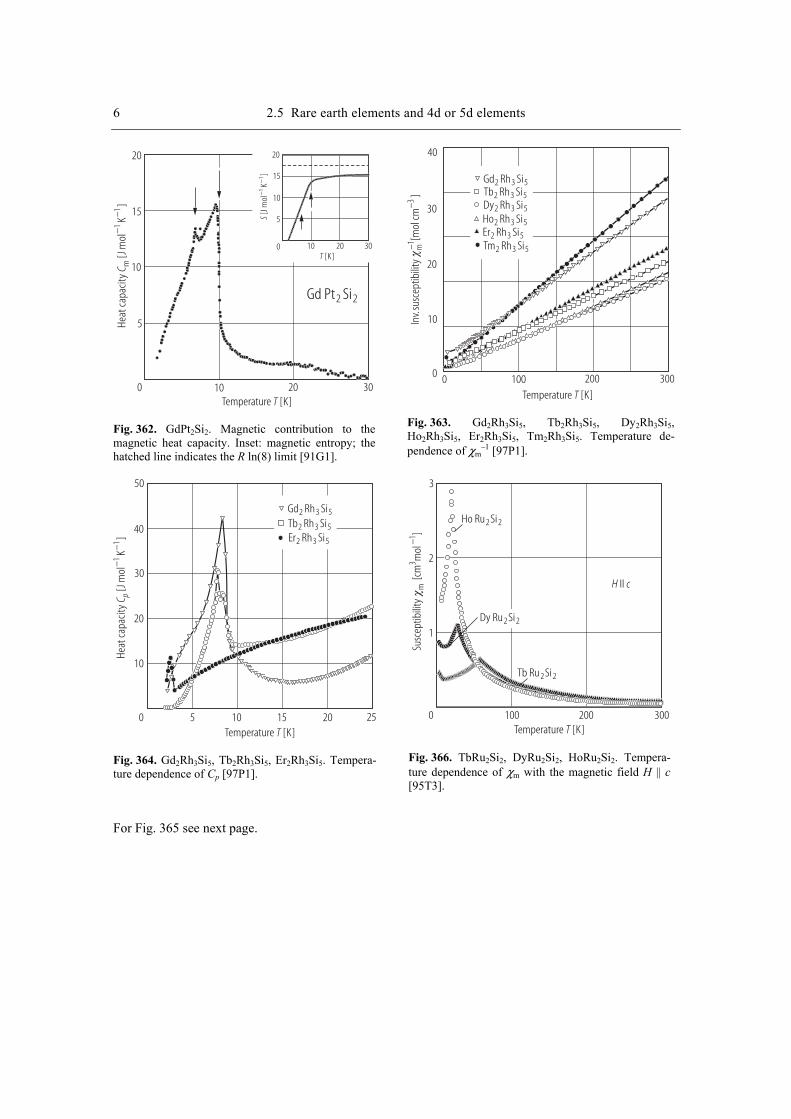
6 2.5 Rare earth elements and 4d or 5d elements
Gd Pt Si2 2
Temperature [K]T
[K]T
0 10 20 30
10 20 30
20
15
10
5Heat
capa
city
[Jm
olK
]C m
11
−− S[J
mol
K]
−−
11
20
10
0
15
5
Fig. 362. GdPt2Si2. Magnetic contribution to the magnetic heat capacity. Inset: magnetic entropy; the hatched line indicates the R ln(8) limit [91G1].
Temperature [K]T
Inv.
susc
eptib
ility
[mol
cm]
m3−
−1
40
30
20
10
0 0 100 200 300
Gd Rh Si2 3 5Tb Rh Si2 3 5Dy Rh Si2 3 5
Er Rh Si2 3 5
Ho Rh Si2 3 5
Tm Rh Si2 3 5 Fig. 363. Gd2Rh3Si5, Tb2Rh3Si5, Dy2Rh3Si5, Ho2Rh3Si5, Er2Rh3Si5, Tm2Rh3Si5. Temperature de-pendence of χm
–1 [97P1].
Temperature [K]T
Gd Rh Si2 3 5Tb Rh Si2 3 5Er Rh Si2 3 5
Heat
capa
city
[Jm
olK
]C p
−−
11
50
40
30
20
10
0 5 10 15 20 25
Fig. 364. Gd2Rh3Si5, Tb2Rh3Si5, Er2Rh3Si5. Tempera-ture dependence of Cp [97P1].
Temperature [K]T
Susc
eptib
ility
[cm
mol
]m
31−
H cII
Ho Ru Si2 2
Tb Ru Si2 2
Dy Ru Si2 2
3
2
1
0 100 200 300
Fig. 366. TbRu2Si2, DyRu2Si2, HoRu2Si2. Tempera-ture dependence of χm with the magnetic field H || c [95T3].
For Fig. 365 see next page.
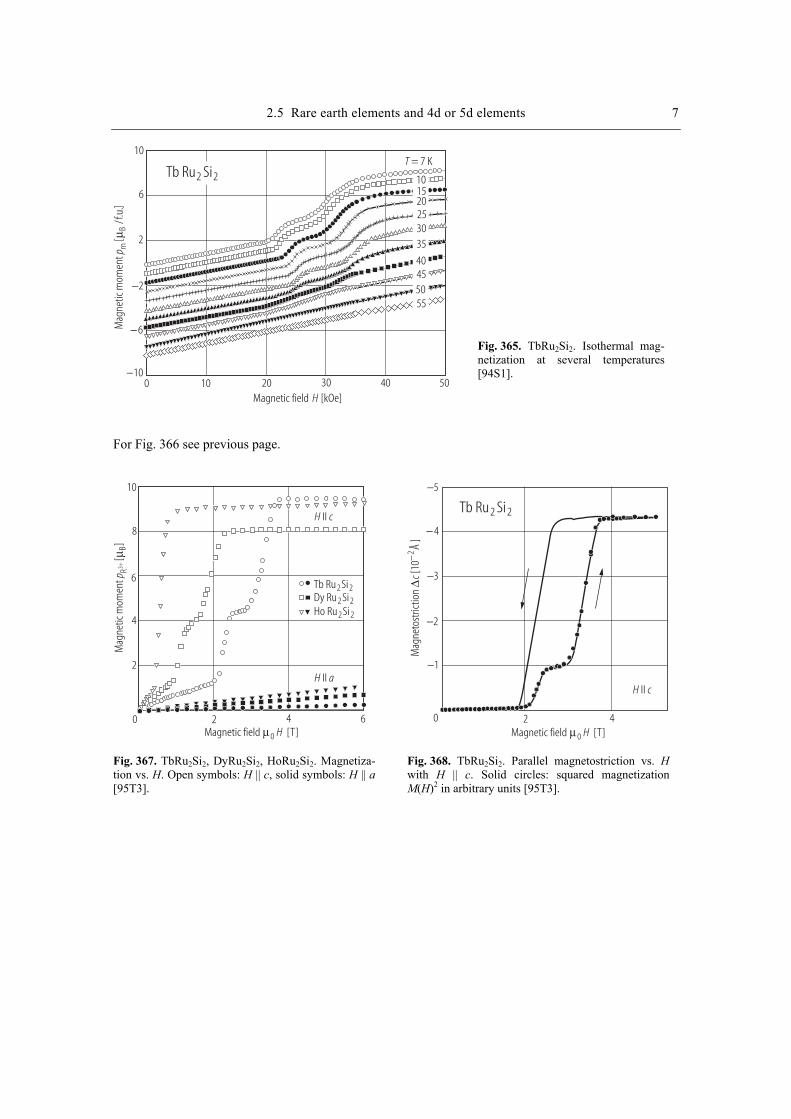
2.5 Rare earth elements and 4d or 5d elements 7
Magnetic field [kOe]H
Mag
netic
mom
ent
[]
p mBµ
/f.u
.
Tb Ru Si2 2T = 7 K
10
6
2
−2
−6
−100 10 20 30 40 50
101520253035
40455055
Fig. 365. TbRu2Si2. Isothermal mag-netization at several temperatures [94S1].
For Fig. 366 see previous page.
H cII
H aII
Ho Ru Si2 2
Tb Ru Si2 2Dy Ru Si2 2
Magnetic field [T]0 Hµ
Mag
netic
mom
ent
[]
p RB
3+µ
10
8
6
4
2
0 2 4 6
Fig. 367. TbRu2Si2, DyRu2Si2, HoRu2Si2. Magnetiza-tion vs. H. Open symbols: H || c, solid symbols: H || a [95T3].
H cII
Tb Ru Si2 2
Magnetic field [T]0 Hµ0 2 4
Mag
neto
stric
tion
[10
]∆
c−
2 Å
−4
−3
−2
−1
−5
Fig. 368. TbRu2Si2. Parallel magnetostriction vs. H with H || c. Solid circles: squared magnetization M(H)2 in arbitrary units [95T3].
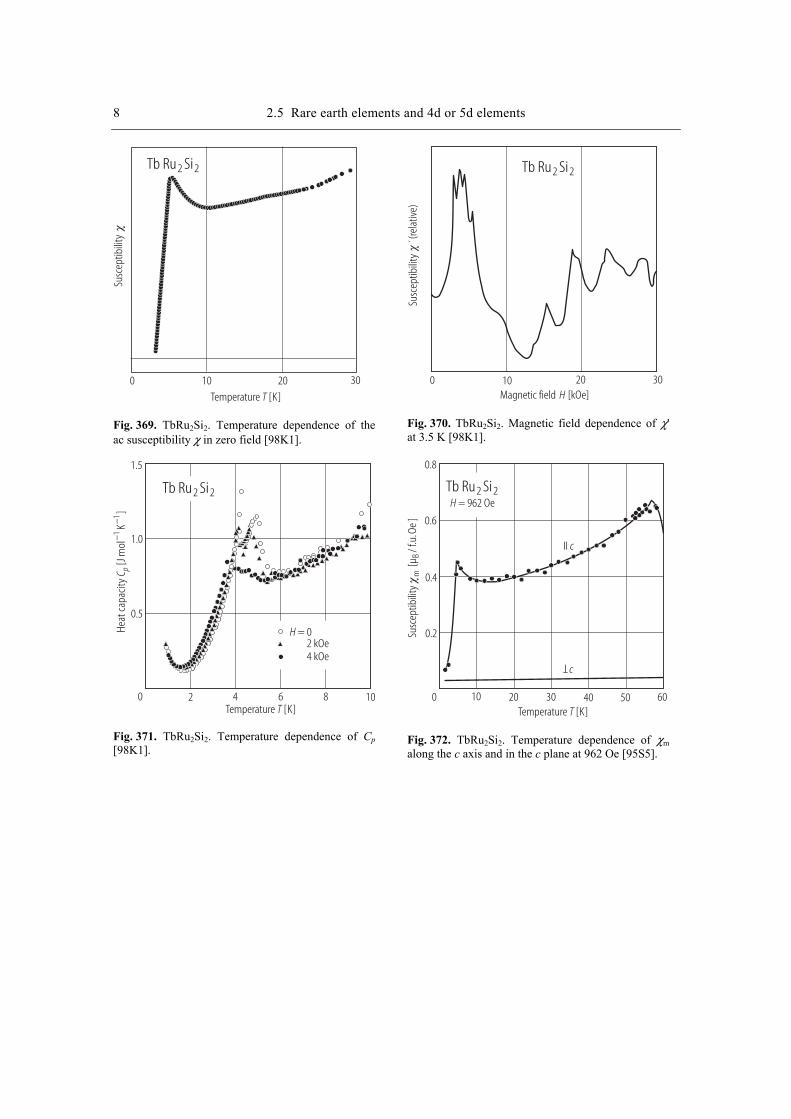
8 2.5 Rare earth elements and 4d or 5d elements
Tb Ru Si2 2
Temperature [K]T
Susc
eptib
ility
0 10 20 30
Fig. 369. TbRu2Si2. Temperature dependence of the ac susceptibility χ in zero field [98K1].
Tb Ru Si2 2
Magnetic field [kOe]H
Susc
eptib
ility
‘ (rel
ativ
e)
0 10 20 30
Fig. 370. TbRu2Si2. Magnetic field dependence of χ' at 3.5 K [98K1].
Tb Ru Si2 2
H = 02 kOe4 kOe
1.5
1.0
0.5
0 2 4 6 8 10Temperature [K]T
Heat
capa
city
[Jm
olK
]C p
−−
11
Fig. 371. TbRu2Si2. Temperature dependence of Cp [98K1].
Temperature [K]T
Susc
eptib
ility
[µ/ f
.u.O
e]
mB
II c
c
T
Tb Ru Si2 2H = 962 Oe
0.8
0.6
0.4
0.2
0 10 20 30 40 50 60
Fig. 372. TbRu2Si2. Temperature dependence of χm along the c axis and in the c plane at 962 Oe [95S5].
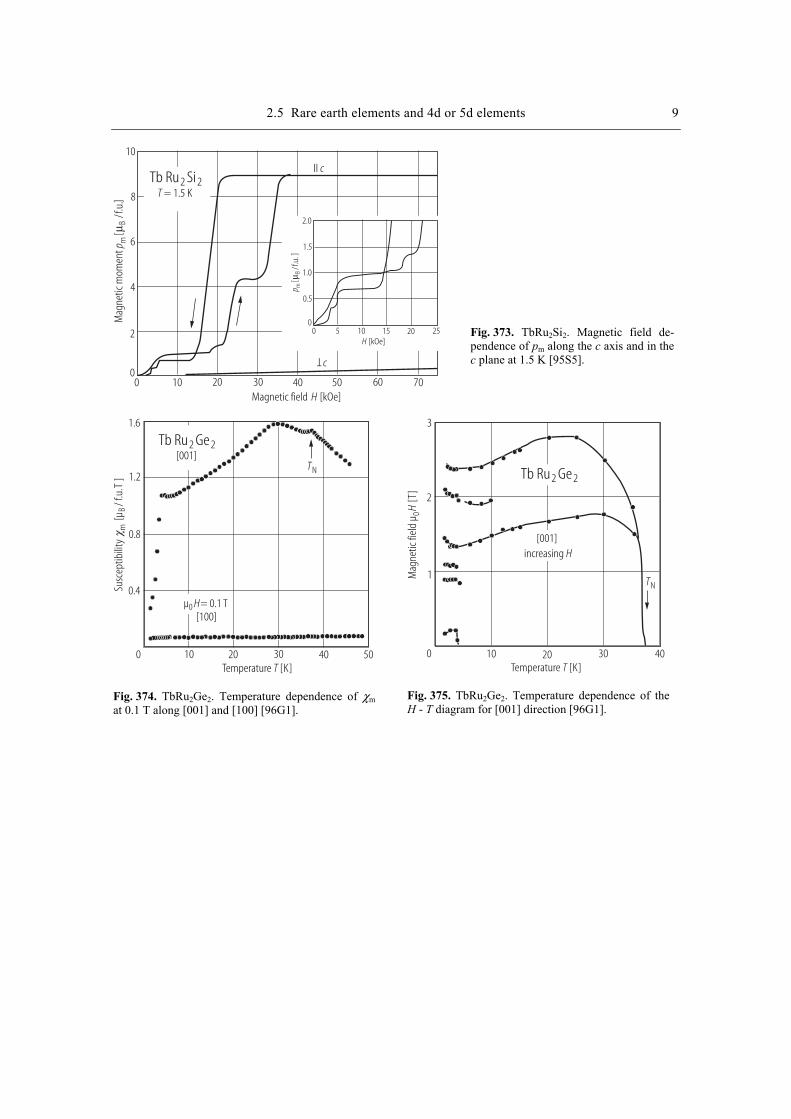
2.5 Rare earth elements and 4d or 5d elements 9
II c
c
T
Tb Ru Si2 2T = 1.5 K
Magnetic field [kOe]H
[kOe]H
Mag
netic
mom
ent
[]
p mBµ
/f.u
.
[]
p mBµ
/f.u
.
10
8
6
4
2
00 10 20 30 40 50 60 70
2.0
1.5
1.0
0.5
00 5 10 15 20 25
Fig. 373. TbRu2Si2. Magnetic field de-pendence of pm along the c axis and in the c plane at 1.5 K [95S5].
Temperature [K]T
Susc
eptib
ility
[µ/ f
.u.T
]m
B
Tb Ru Ge2 2
0 10 20 30 40 50
[001]TN
[100]µ = 0.1 T0 H
1.6
1.2
0.8
0.4
Fig. 374. TbRu2Ge2. Temperature dependence of χm at 0.1 T along [001] and [100] [96G1].
Temperature [K]T
Tb Ru Ge2 2
10 20 30 40
[001]
Mag
netic
fiel
d µ
[T]
0H3
2
1
0
TN
increasing H
Fig. 375. TbRu2Ge2. Temperature dependence of the H - T diagram for [001] direction [96G1].
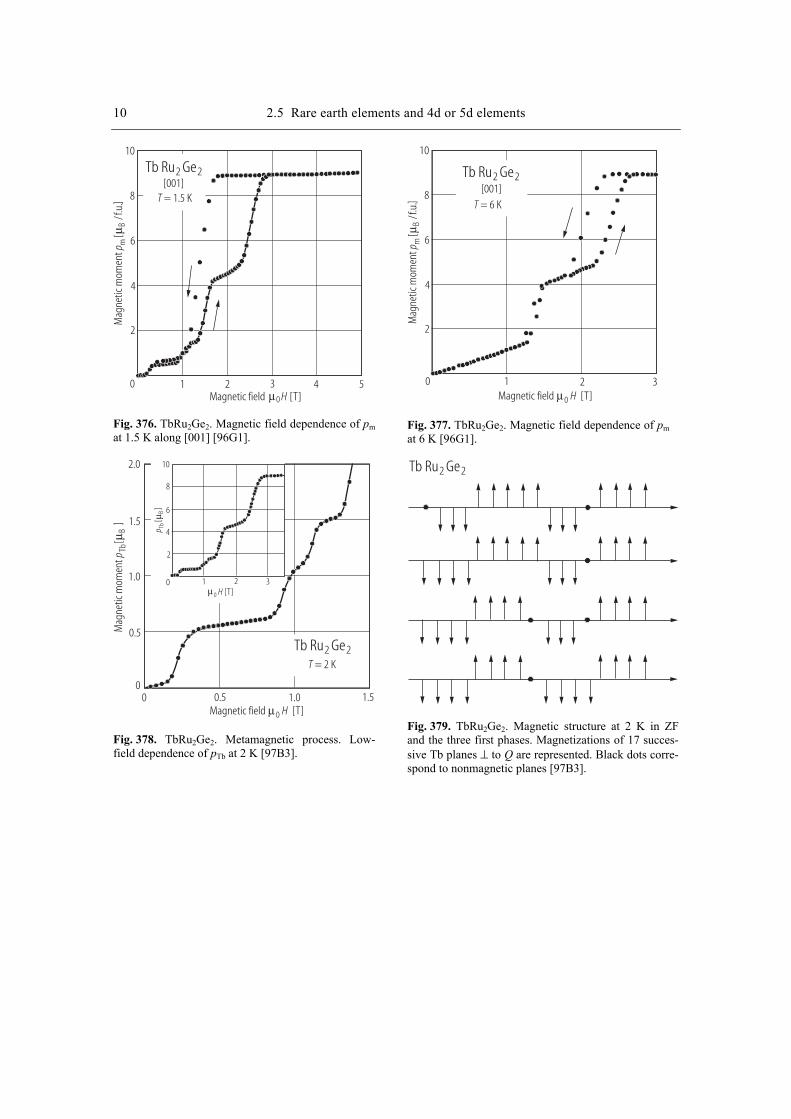
10 2.5 Rare earth elements and 4d or 5d elements
Magnetic field [T]H
Mag
netic
mom
ent
[]
p mBµ
/f.u
.
Tb Ru Ge2 2[001]
T = 1.5 K
10
8
6
2
4
0 1 2 3 4 5µ0
Fig. 376. TbRu2Ge2. Magnetic field dependence of pm at 1.5 K along [001] [96G1].
Mag
netic
mom
ent
[]
p mBµ
/f.u
.
Tb Ru Ge2 2[001]
T = 6 K
10
8
6
2
4
0 1 2 3Magnetic field [T]0 Hµ
Fig. 377. TbRu2Ge2. Magnetic field dependence of pm at 6 K [96G1].
Mag
netic
mom
ent
[]
p TbBµ
[]
p TbBµ
Tb Ru Ge2 2T = 2 K
Magnetic field [T]0 Hµ
[T]0 Hµ
2.0
1.5
1.0
0.5
00 0.5 1.0 1.5
10
8
6
4
2
0 1 2 3
Fig. 378. TbRu2Ge2. Metamagnetic process. Low-field dependence of pTb at 2 K [97B3].
Tb Ru Ge2 2
Fig. 379. TbRu2Ge2. Magnetic structure at 2 K in ZF and the three first phases. Magnetizations of 17 succes-sive Tb planes ⊥ to Q are represented. Black dots corre-spond to nonmagnetic planes [97B3].
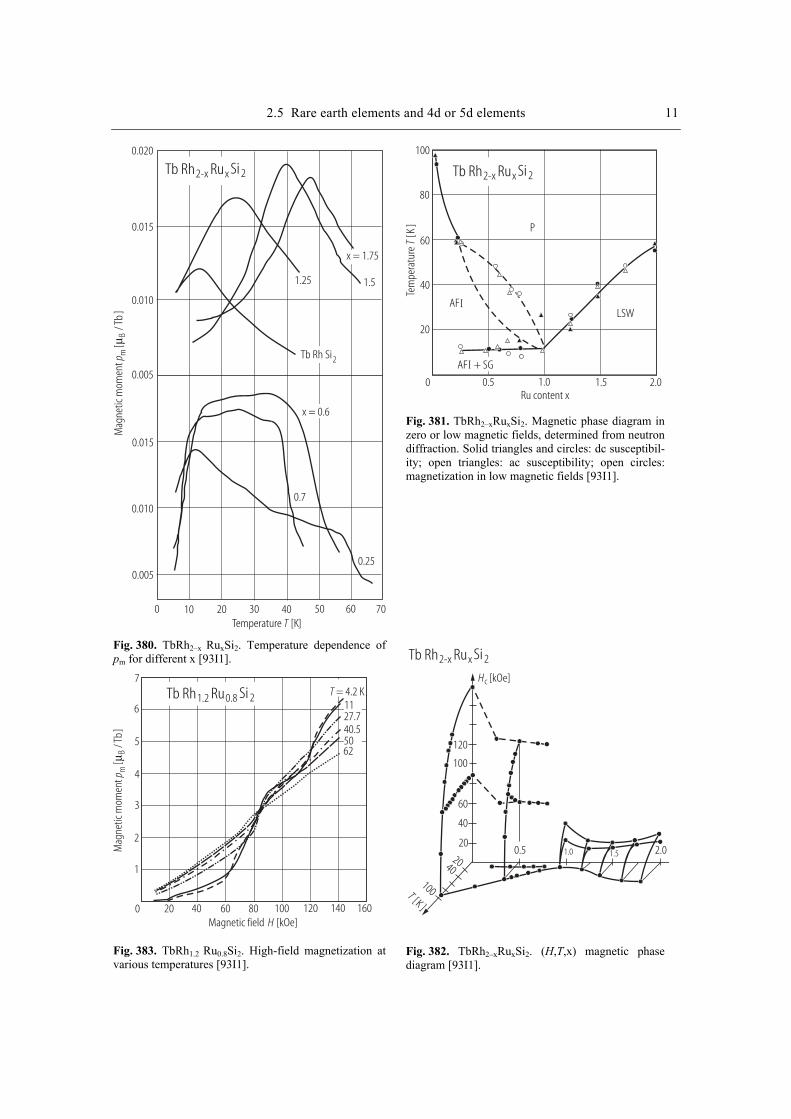
2.5 Rare earth elements and 4d or 5d elements 11 M
agne
tic m
omen
t[
]p m
Bµ/ T
b
Tb Rh Ru2-x x Si 2
0.020
0.015
0.010
0.005
0.015
0.010
0.005
0 10 20 30 40 50 60 70Temperature [K]T
x = 1.75
x = 0.6
1.51.25
Tb Rh Si2
0.7
0.25
Fig. 380. TbRh2–x RuxSi2. Temperature dependence of pm for different x [93I1].
Magnetic field [kOe]H
Mag
netic
mom
ent
[]
p mBµ
/ Tb
T = 4.2 K
0
2
4
6
7
5
3
1
Tb Rh Ru1.2 0.8 Si 21127.740.55062
20 40 60 80 100 120 140 160
Fig. 383. TbRh1.2 Ru0.8Si2. High-field magnetization at various temperatures [93I1].
Tb Rh Ru2-x x Si 2
Tem
pera
ture
[K]
T
100
80
60
40
20
0 1.0 2.00.5 1.5Ru content x
LSW
P
AF
I
I
AF + SG
Fig. 381. TbRh2–xRuxSi2. Magnetic phase diagram in zero or low magnetic fields, determined from neutron diffraction. Solid triangles and circles: dc susceptibil-ity; open triangles: ac susceptibility; open circles: magnetization in low magnetic fields [93I1]. Tb Rh Ru2-x x Si 2
[K ]T
Hc [kOe]
120
100
60
40
202040
100
0.5 1.0 1.5 2.0
Fig. 382. TbRh2–xRuxSi2. (H,T,x) magnetic phase diagram [93I1].
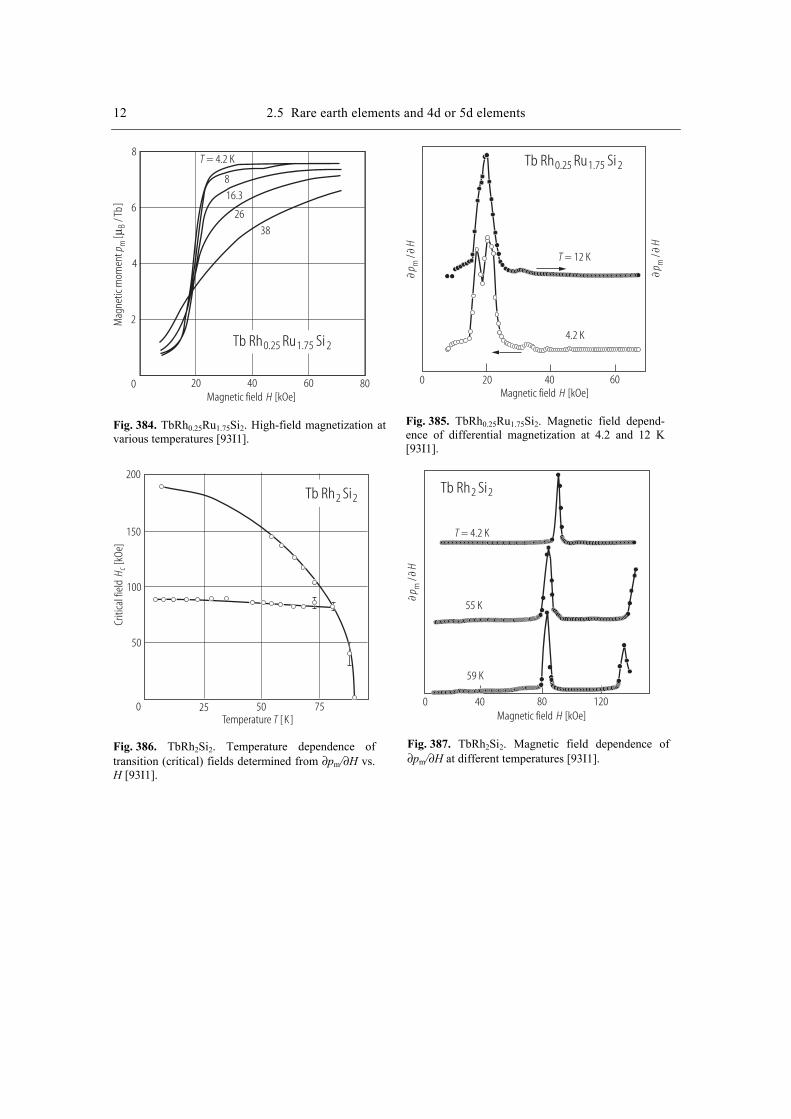
12 2.5 Rare earth elements and 4d or 5d elements
Magnetic field [kOe]H
Mag
netic
mom
ent
[]
p mBµ
/ Tb
T = 4.2 K
0
2
4
6
Tb Rh Ru0.25 1.75 Si 2
8
20 40 60 80
8
16.3
26
38
Fig. 384. TbRh0.25Ru1.75Si2. High-field magnetization at various temperatures [93I1].
Magnetic field [kOe]H
T = 12 K
0
Tb Rh Ru0.25 1.75 Si 2
20 40 60
4.2 K
/
pH
m
/
pH
m
Fig. 385. TbRh0.25Ru1.75Si2. Magnetic field depend-ence of differential magnetization at 4.2 and 12 K [93I1].
Criti
cal f
ield
[kOe
]H c
Tb Rh Si2 2
200
150
100
50
0 25 50 75Temperature [ K ]T
Fig. 386. TbRh2Si2. Temperature dependence of transition (critical) fields determined from ∂pm/∂H vs. H [93I1].
Magnetic field [kOe]H0
Tb Rh Si2 2
40
T = 4.2 K
/
pH
m
55 K
59 K
80 120
Fig. 387. TbRh2Si2. Magnetic field dependence of ∂pm/∂H at different temperatures [93I1].
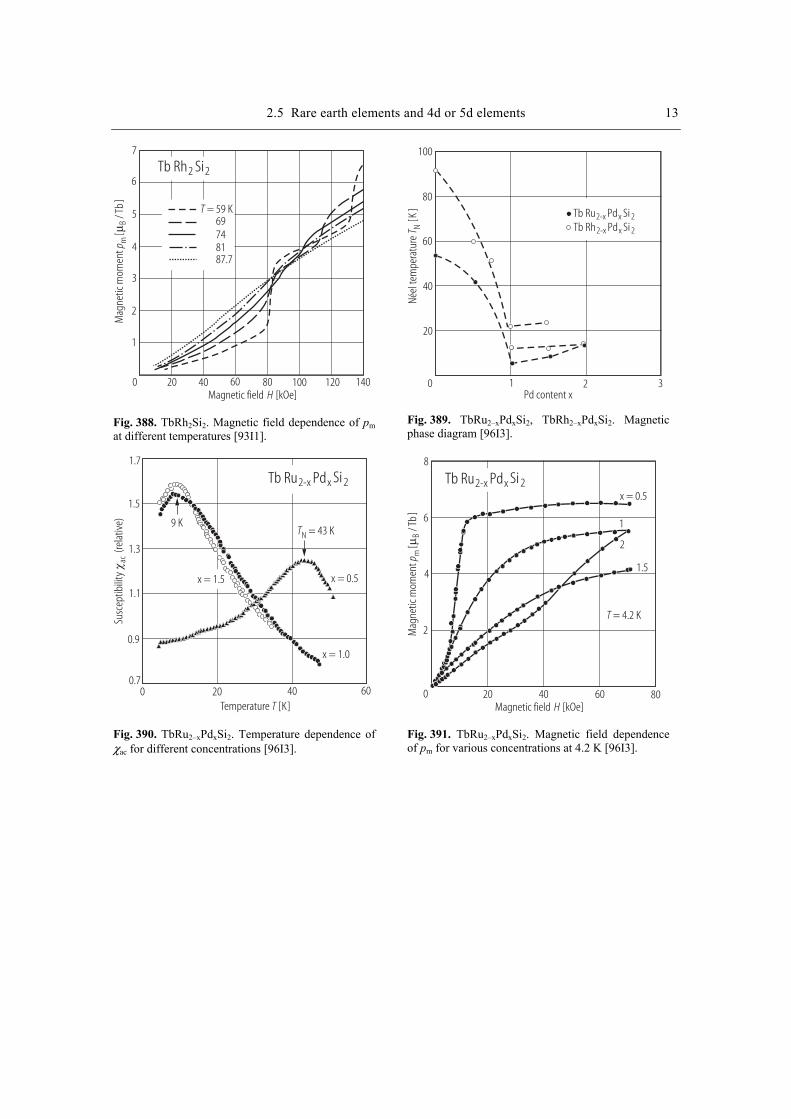
2.5 Rare earth elements and 4d or 5d elements 13
Tb Rh Si2 2
Magnetic field [kOe]H
Mag
netic
mom
ent
[]
p mBµ
/ Tb
0
2
4
6
7
5
3
1
20 40 60 80 100 120 140
69748187.7
T = 59 K
Fig. 388. TbRh2Si2. Magnetic field dependence of pm at different temperatures [93I1].
Tb Ru Pd2-x x Si 2Tb Rh Pd2-x x Si 2
Pd content x
Neel
tem
pera
ture
[K]
T N´
100
80
60
40
20
0 1 2 3
Fig. 389. TbRu2–xPdxSi2, TbRh2–xPdxSi2. Magnetic phase diagram [96I3].
Tb Ru Pd2-x x Si 2
Temperature [K]T
Susc
eptib
ility
(rela
tive)
ac
TN = 43 K9 K
x = 1.5
x = 1.0
x = 0.5
1.7
1.5
1.3
1.1
0.9
0.70 20 40 60
Fig. 390. TbRu2–xPdxSi2. Temperature dependence of χac for different concentrations [96I3].
Magnetic field [kOe]H
Mag
netic
mom
ent
[]
p mBµ
/Tb
T = 4.2 K
0
2
4
6
8
20 40 60 80
Tb Ru Pd2-x x Si 2x = 0.5
1
2
1.5
Fig. 391. TbRu2–xPdxSi2. Magnetic field dependence of pm for various concentrations at 4.2 K [96I3].
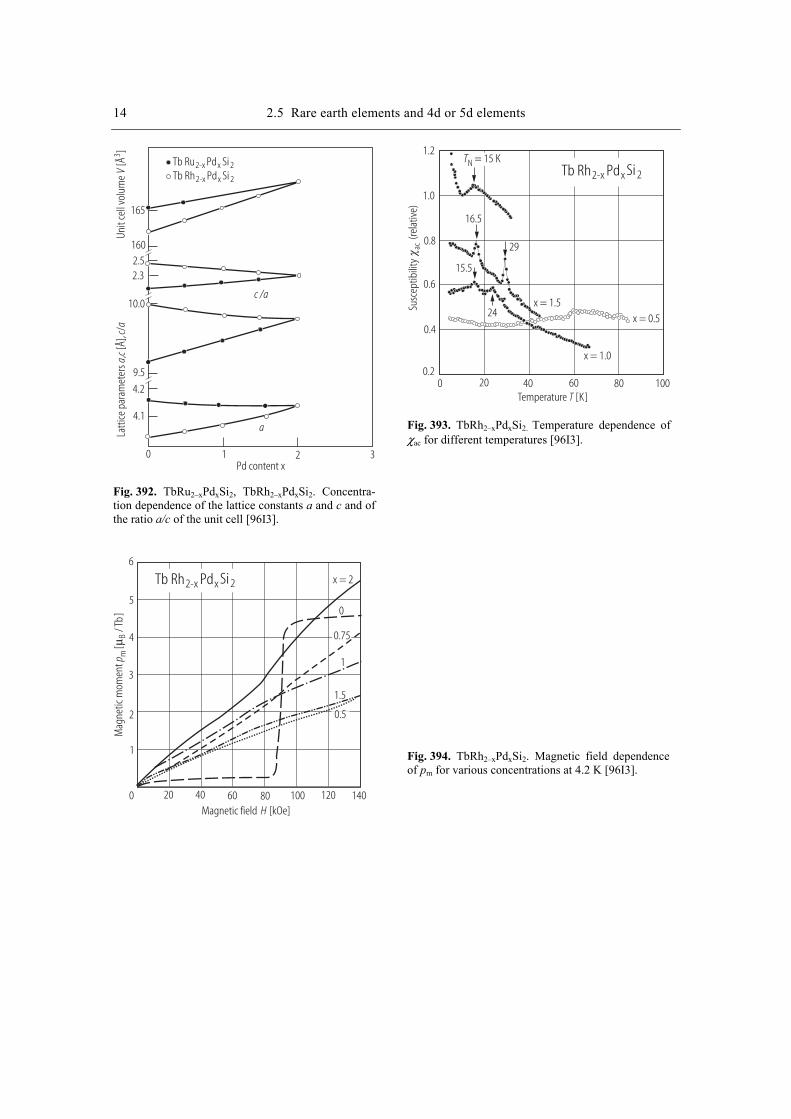
14 2.5 Rare earth elements and 4d or 5d elements
Tb Ru Pd2-x x Si 2Tb Rh Pd2-x x Si 2
Pd content x0 1 2 3
165
1602.52.3
10.0
9.5
4.2
4.1a
c /a
Latti
ce p
aram
eter
s,
[Å],
/a
cc
aUn
it ce
ll vo
lum
e[Å
]V
3
Fig. 392. TbRu2–xPdxSi2, TbRh2–xPdxSi2. Concentra-tion dependence of the lattice constants a and c and of the ratio a/c of the unit cell [96I3].
Tb Rh Pd2-x x Si 2
Temperature [K]TSu
scep
tibili
ty(re
lativ
e)ac
TN = 15 K
x = 1.5
x = 1.0
x = 0.524
16.5
15.5
29
1.2
1.0
0.8
0.6
0.4
0.20 20 40 60 80 100
Fig. 393. TbRh2–xPdxSi2. Temperature dependence of χac for different temperatures [96I3].
Magnetic field [kOe]H
Mag
netic
mom
ent
[]
p mBµ
/ Tb
Tb Rh Pd2-x x Si 2 x = 2
6
5
4
3
2
1
0 20 40 60 80 100 120 140
0
1
1.5
0.75
0.5
Fig. 394. TbRh2–xPdxSi2. Magnetic field dependence of pm for various concentrations at 4.2 K [96I3].
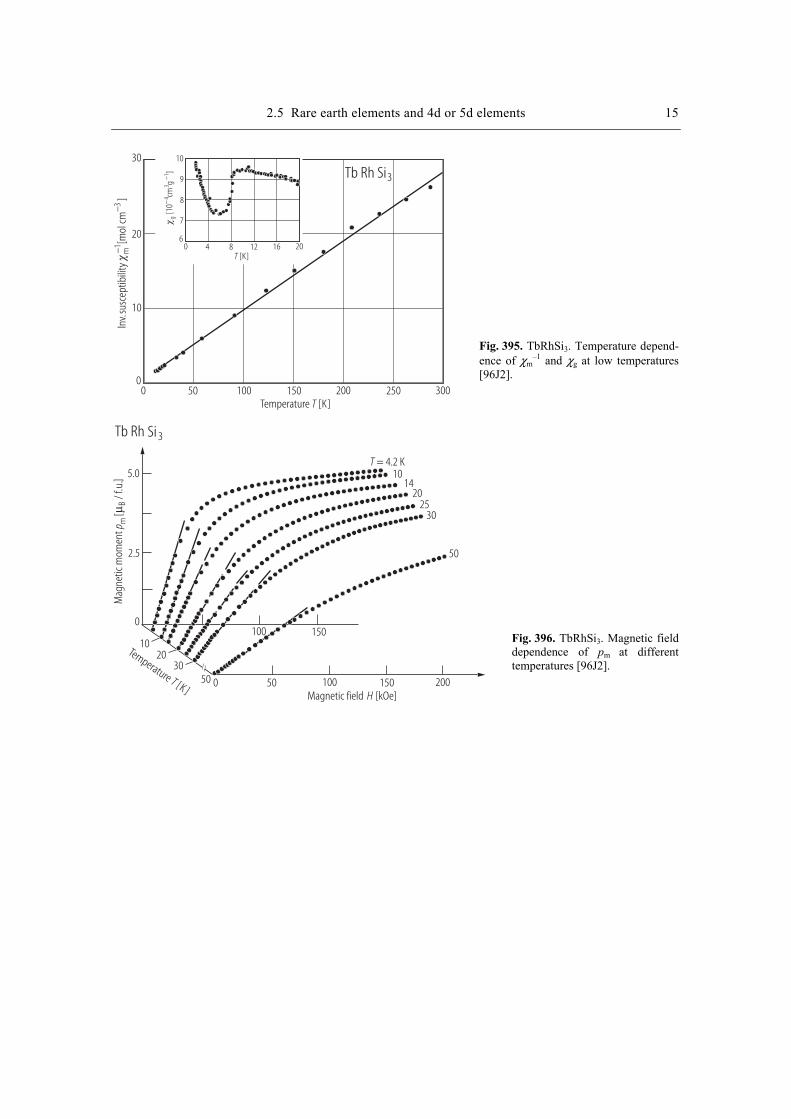
2.5 Rare earth elements and 4d or 5d elements 15
Tb Rh Si3
Temperature [K]T
[K]T
[10
cmg
]g
43
1−
−
Inv.
susc
eptib
ility
[mol
cm]
m3−
−1
30
20
10
00 100 200 300
9
10
8
7
60 4 8 12 16 20
50 150 250
Fig. 395. TbRhSi3. Temperature depend-ence of χm
–1 and χg at low temperatures [96J2].
Magnetic field [kOe]H
Mag
netic
mom
ent
[]
p mBµ
/ f.u
.
T = 4.2 K
Tb Rh Si 3
Temperature[K ]
T
1014
2025
30
50
100 150
0 50 100 150 200
5.0
2.5
0
1020
3050
Fig. 396. TbRhSi3. Magnetic field dependence of pm at different temperatures [96J2].

16 2.5 Rare earth elements and 4d or 5d elements
Tb Rh Si 3
a b Fig. 397. TbRhSi3. Magnetic structure: (a) helicoidal and (b) sine-modulated [96J2].
Tb Pd2 Si 2
a
b
c
Fig. 398. TbPd2Si2. Schematic representation of the magnetic structure at 1.5 K [97B5].
Tb Pd2 Si 2
Temperature [K]T
Wav
evec
tork
y
Wav
evec
tor k
z
0.18
0.17
0.16
0.19 0.41
0.40
0.39
0 5 10 15 20
Fig. 399. TbPd2Si2. Temperature dependence of wavevector components kz and ky [97B5].
Temperature [K]T
Mag
netic
mom
ent
[]
p TbBµ
Tb Pd2 Si 2
10.0
7.5
5.0
2.5
0 5 10 15 20
Fig. 400. TbPd2Si2. Temperature dependence of pTb [97B5].
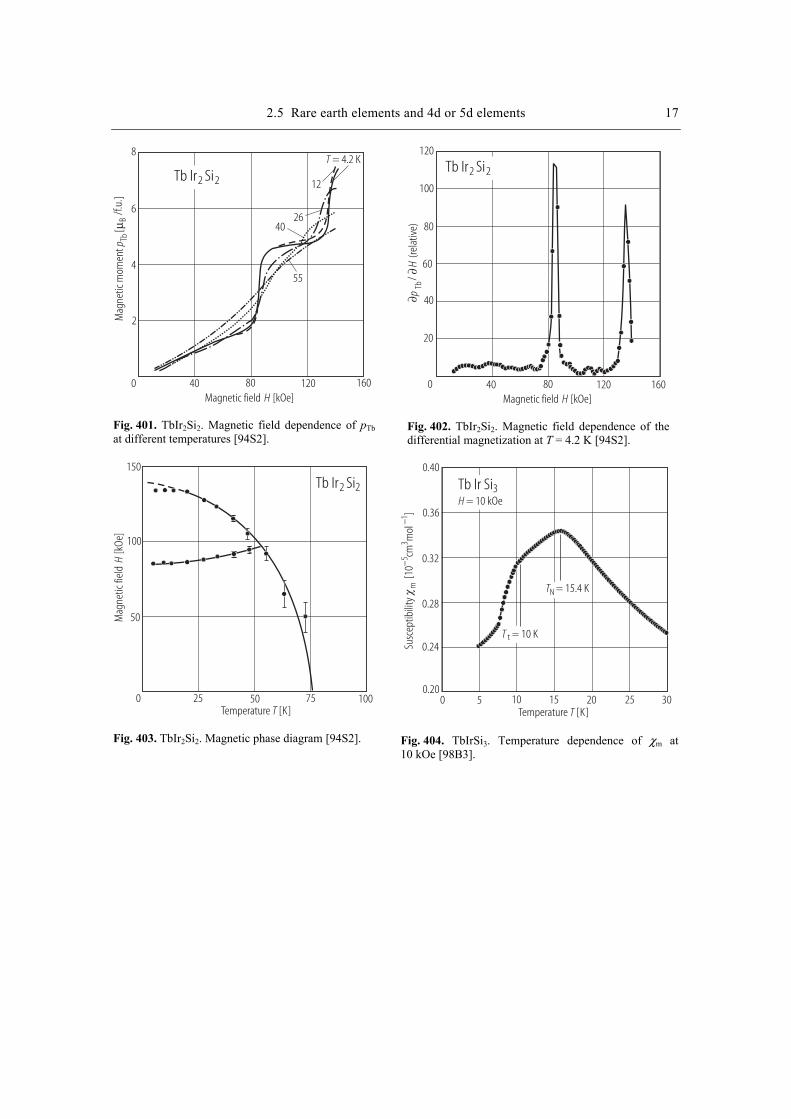
2.5 Rare earth elements and 4d or 5d elements 17
T = 4.2 K
Mag
netic
mom
ent
[]
p TbBµ
Magnetic field [kOe]H
Tb Ir Si2 2 12
2640
55
8
6
4
2
0 40 80 120 160
/f.u.
Fig. 401. TbIr2Si2. Magnetic field dependence of pTb at different temperatures [94S2].
Magnetic field [kOe]H
Tb Ir Si2 2
120
100
80
60
40
20
0 40 80 120 160
/(re
lativ
e)∂
∂ pTb
H
Fig. 402. TbIr2Si2. Magnetic field dependence of the differential magnetization at T = 4.2 K [94S2].
Temperature [K]T
Tb Ir Si2 2
Mag
netic
fiel
d[k
Oe]
H
150
100
50
0 25 50 75 100
Fig. 403. TbIr2Si2. Magnetic phase diagram [94S2].
Temperature [K]T
Tb Ir Si3
T = 10 Kt
T = 15.4 KN
H = 10 kOe
0 5 10 15 20 25 30
0.40
0.36
0.32
0.28
0.24
0.20
Susc
eptib
ility
[10
cmm
ol]
m5
31
−−
Fig. 404. TbIrSi3. Temperature dependence of χm at 10 kOe [98B3].
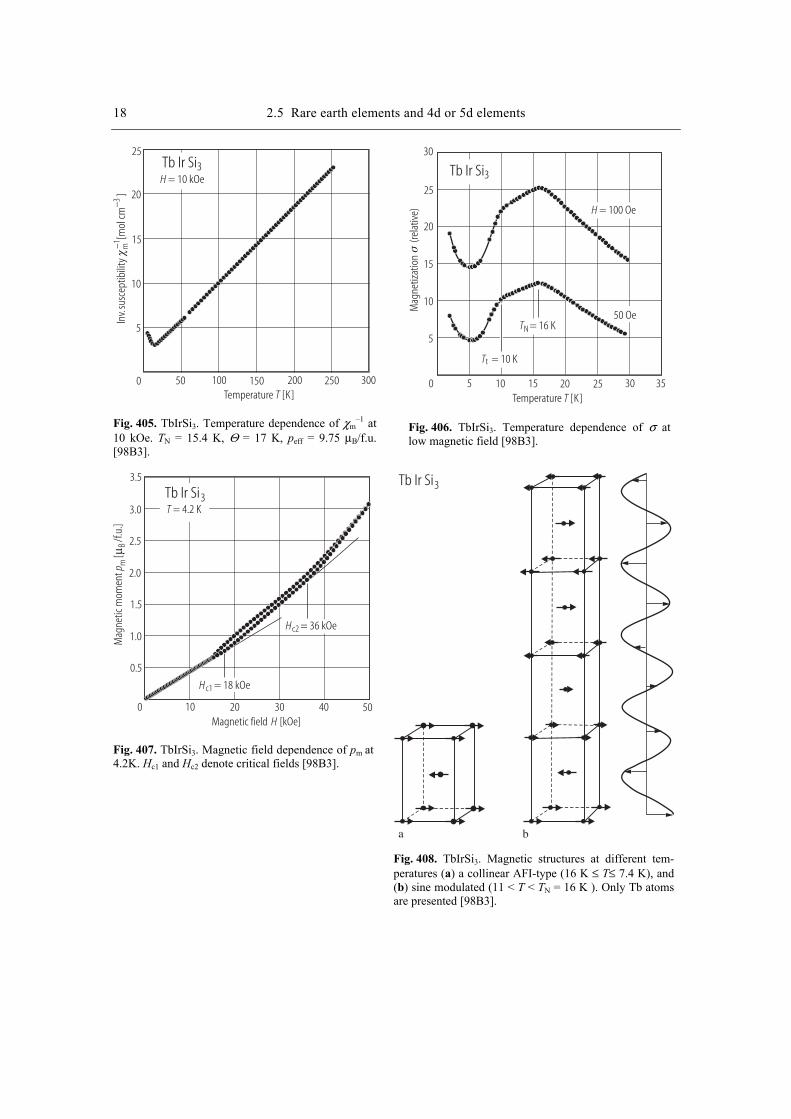
18 2.5 Rare earth elements and 4d or 5d elements
Temperature [K]T
Tb Ir Si3H = 10 kOe
25
20
15
10
5
0 50 100 150 200 250 300
Inv.
susc
eptib
ility
[mol
cm]
m3−
−1
Fig. 405. TbIrSi3. Temperature dependence of χm
–1 at 10 kOe. TN = 15.4 K, Θ = 17 K, peff = 9.75 µB/f.u. [98B3].
Temperature [K]TM
agne
tizat
ion
(r
elat
ive)
Tb Ir Si3
T = 16 KN
T = 10 Kt
H = 100 Oe
50 Oe
30
25
20
15
10
5
0 5 10 15 20 25 30 35
Fig. 406. TbIrSi3. Temperature dependence of σ at low magnetic field [98B3].
Magnetic field [kOe]H
Tb Ir Si3T = 4.2 K
Mag
netic
mom
ent
[]
p mBµ
/f.u.
3.5
3.0
2.5
2.0
1.5
1.0
0.5
0 10 20 30 40 50
Hc1 = 18 kOe
Hc2 = 36 kOe
Fig. 407. TbIrSi3. Magnetic field dependence of pm at 4.2K. Hc1 and Hc2 denote critical fields [98B3].
a b
Tb Ir Si3
Fig. 408. TbIrSi3. Magnetic structures at different tem-peratures (a) a collinear AFI-type (16 K ≤ T≤ 7.4 K), and (b) sine modulated (11 < T < TN = 16 K ). Only Tb atoms are presented [98B3].
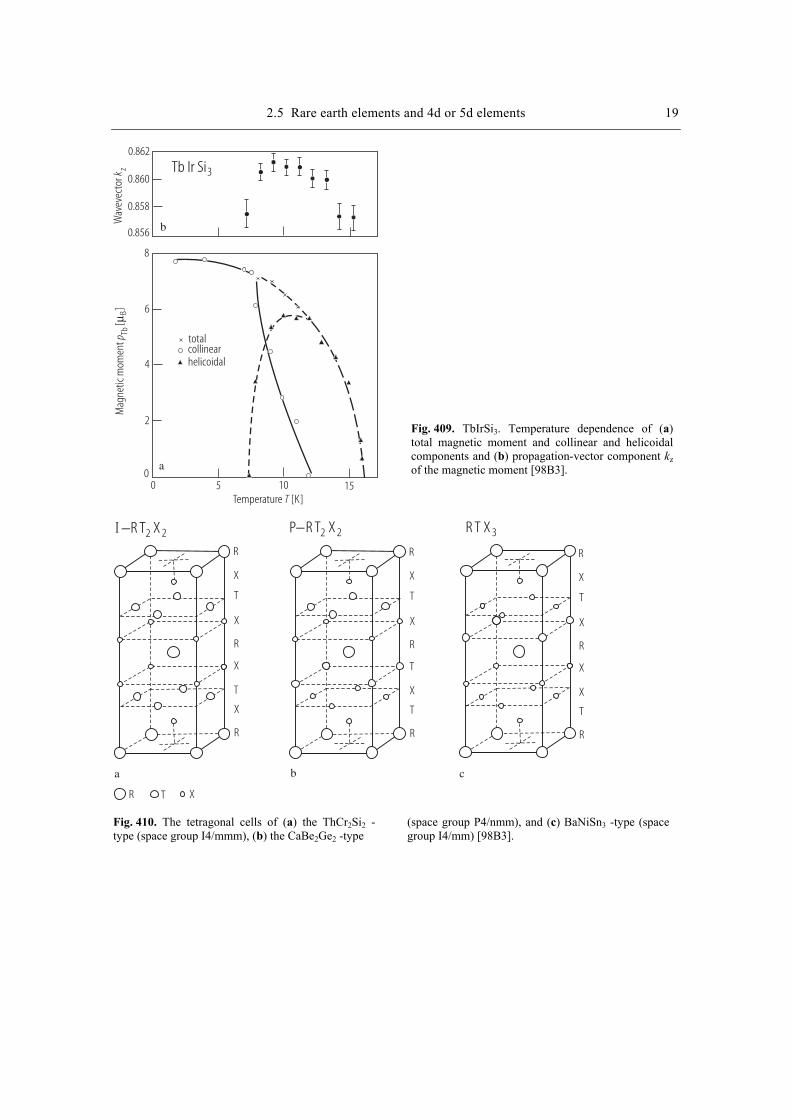
2.5 Rare earth elements and 4d or 5d elements 19
Temperature [K]T
Mag
netic
mom
ent
[]
p TbBµ
Wav
evec
tor k
z
a
b
0.862
0.860
0.858
0.856
Tb Ir Si3
8
6
4
2
00 5 10 15
totalcollinearhelicoidal
Fig. 409. TbIrSi3. Temperature dependence of (a) total magnetic moment and collinear and helicoidal components and (b) propagation-vector component kz of the magnetic moment [98B3].
a b c
R T X 3R T X2 2R T X2 2 P−−I
R T X
R R R
X X X
T T T
X X X
R R R
X T X
T X X
X T T
R R R
Fig. 410. The tetragonal cells of (a) the ThCr2Si2 -type (space group I4/mmm), (b) the CaBe2Ge2 -type
(space group P4/nmm), and (c) BaNiSn3 -type (space group I4/mm) [98B3].
References
91G1 Gignoux, D., Morin, M., Schmitt, D.: J. Magn. Magn. Mater. 102 (1991) 33 91S1 Sanchez, J.P., Tomala, K., Łątka, K.: J. Magn. Magn. Mater. 99 (1991) 95 92S4 Szytula, A., Radwanski, R.J., de Boer, F.R.: J. Magn. Magn. Mater. 104-107 (1992) 1237 93I1 Ivanov. V., Vinokurowa, L., Szytula, A.: J. Alloys Comp. 201 (1993)109 94S1 Salgueiro da Silva, M., Sousa, J.B., Chevalier, B., Etourneau, J.: J. Appl. Phys. 76 (1994) 634494S2 Szytula, A., Ivanov, V., Vinokurova, L.: Acta Phys. Pol. 85 (1994) 95G3 Garnier, A., Gignoux, D., Iwata, N., Schmitt, D., Shigeoka, T., Zhang, F.Y.: J. Magn. Magn.
Mater. 140-144 (1995) 899 95S5 Shigeoka, T., Iwata, N., Garnier, A., Gignoux, D., Schmitt, D., Zhang, F.Y.: J. Magn. Magn.
Mater. 140-144 (1995) 901 95T3 Takeuchi, T., Taniguchi, T., Kudoh, D., Miyako, Y.: Physica B 206-207 (1995) 398 96G1 Garnier, A., Gignoux, D., Schmitt., D., Shigeoka, T.: J. Magn. Magn. Mater. 157-158 (1996)
389 96I3 Ivanov, V., Vinokurova, L., Mydlarz, T., Szytula, A.: J. Alloys Comp. 230 (1996) L5 96J2 Jaworska-Golab, T., Guillot, M., Kolenda, M., Ressouche, E., Szytula, A.: J. Magn. Magn.
Mater. 164 (1996) 371 96W1 Wada, H., Mitsuda, A., Shiga, M.: J. Phys. Soc. Jpn. 65 (1996) 3471 97B3 Blanco, J.A., Garnier, A., Gignoux, D., Schmitt, D.: J. Alloys Comp. 275-277 (1997) 565 97B5 Bazela, W., Baran, S., Leciejewicz, J., Szytula, A., Ding, Y.: J. Cond. Matter 9 (1997) 2267 97P1 Patil, N.G., Ramakrishnan, S.: Physica B 237-238 (1997) 597 97T1 Tung, L.D., Franse, J.J.M., Buschow, K.H.J., Brommer, P.E., Thuy, N.P.: J. Alloys Comp. 260
(1997) 35 98B3 Bazela, W., Stusser, N., Szytula, A., Zygmunt, A.: J. Alloys Comp. 275-277 (1998) 578 98K1 Kawae, T., Sakita, H., Hitaka, M., Takeda, K., Sigeoka, T., Iwata, N.: J. Magn. Magn. Mater.
177-181 (1998) 795

2.5 Rare earth elements and 4d or 5d elements 1
-
-
- -
+
+ + + +
+
+ +
+
+ +
+
+
+
J2
J2
J2
J2
J1
J1
J1
J1
kz = 0kz = 1
kz = 1/2= 1/4
= 1/2
AF
AF AF
I
II I
IILSW LSW
F
1 > > 0.5kz 1< < 0.5k
R ( T,X ) 4 Fig. 411. R(T,X)4. Stability conditions of the ternary compounds for the exchange integrals J1 and J2 [97W1, 97B3].
Tb Rh Ir2 x x− Si2
150
0
1.0
2.0
100
x
T [K]
H [kOe]
100
Fig. 412. TbRh2–xIrxSi2. Magnetic phase diagram (H,T,x) [95I2].
Tb Rh Ir2 x x− Si 2
Néel
tem
pera
ture
[K]
T N
75
85
95
650 1.0 2.01.50.5
Ir content x Fig. 413. TbRh2–xIrxSi2. Concentration dependence of TN [95I2].
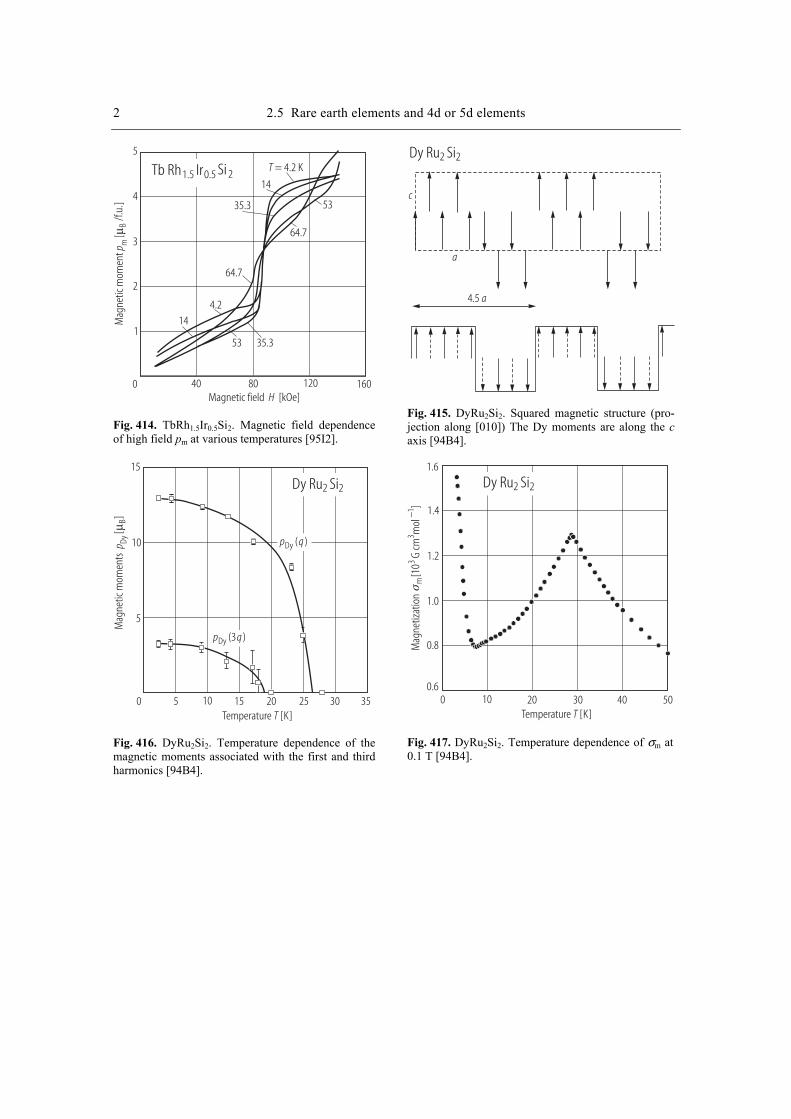
2 2.5 Rare earth elements and 4d or 5d elements
Tb Rh Ir1.5 0.5 Si 2
Magnetic field [kOe]H
Mag
netic
mom
ent
[]
p mBµ
/f.u.
T = 4.2 K
14
35.3 53
64.7
64.7
35.353
4.2
14
0 40 80 120 160
5
4
3
2
1
Fig. 414. TbRh1.5Ir0.5Si2. Magnetic field dependence of high field pm at various temperatures [95I2].
Dy Ru Si2 2
c
a
4.5 a
Fig. 415. DyRu2Si2. Squared magnetic structure (pro-jection along [010]) The Dy moments are along the c axis [94B4].
Temperature [K]T
Dy Ru Si2 2
Mag
netic
mom
ents
[]
p DyBµ
15
10
5
0 5 10 15 20 25 30 35
p qDy ( )
p qDy (3 )
Fig. 416. DyRu2Si2. Temperature dependence of the magnetic moments associated with the first and third harmonics [94B4].
Temperature [K]T
Dy Ru Si2 2
Mag
netiz
atio
n
[10
G cm
mol
]3
31−
m
1.6
1.4
1.2
1.0
0.8
0.60 10 20 30 40 50
Fig. 417. DyRu2Si2. Temperature dependence of σm at 0.1 T [94B4].

2.5 Rare earth elements and 4d or 5d elements 3
Magnetic field [T]0 Hµ
Dy Ru Si2 2
10
8
6
4
2
0 1 2 3 4 5
Mag
netic
mom
ent
[]
p mBµ
/ f.u
.
T = 10 K
18
30
50
100
Fig. 418. DyRu2Si2. Magnetic field dependence of pm at different temperatures [94B4].
Magnetic field [T]0 Hµ
H cII
Dy Ru Si2 2
Mag
neto
stric
tion
[10
]∆
c−
2 Å
− 1.4
− 1.6
− 1.2
− 0.8
− 0.6
− 0.4
− 0.2
− 1.0
0 2 431
Fig. 420. DyRu2Si2. Parallel magnetostriction vs. mag-netic field with H || c. Open circles: squared magnetiza-tion M(H)2 in arbitrary units [95T3].
H = 10 kOe
Dy Pd
Si2
2
Er Pd
Si2
2
3
2
1
0
0 10 20 30 40 50 60 70 80
3
2
1
0
Temperature [K]T
Inv.
mol
ar su
scep
tibili
ty[1
0g
cm]
g3
3−−1
Inv.
mol
ar su
scep
tibili
ty[1
0g
cm]
g3
3−−1
Fig. 421. DyPd2Si2, ErPd2Si2. Temperature depend-ence of χg
–1 at 10 kOe [91B1].
Mag
netiz
atio
n
[G cm
g]
31−
Mag
netiz
atio
n
[G cm
g]
31−
Magnetic field [kOe]H
T = 4.2 K
Dy Pd
Si2
2Er
PdSi
22
70
60
50
40
30
20
10
0 10 20 30 40 50
60
50
40
30
20
10
0
Fig. 422. DyPd2Si2. Magnetic field dependence of σ at 4.2 K [91B1].
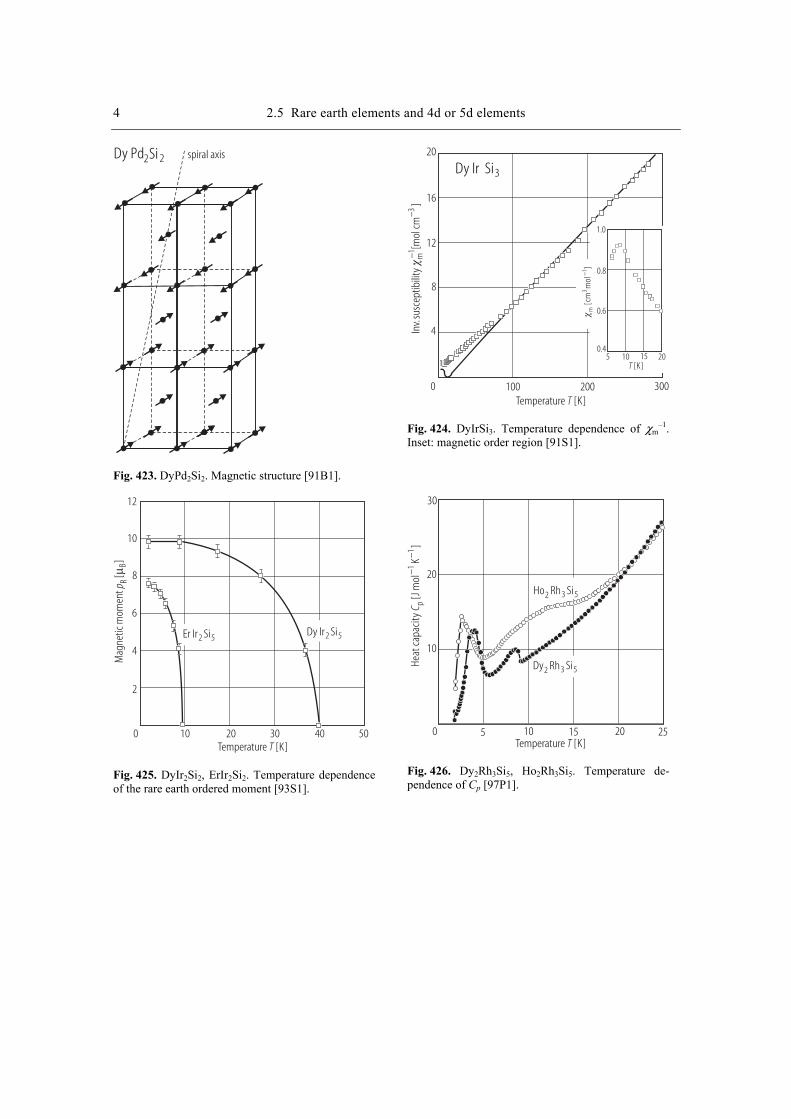
4 2.5 Rare earth elements and 4d or 5d elements
Dy Pd2Si 2 spiral axis
Fig. 423. DyPd2Si2. Magnetic structure [91B1].
Temperature [K]T
Dy Ir Si3
[K]T
Inv.
susc
eptib
ility
[mol
cm]
m3−
−1
20
0
4
8
12
16
100 200 300
1.0
0.8
0.6
0.45 10 15 20
[cm
mol
]m
31−
Fig. 424. DyIrSi3. Temperature dependence of χm
–1. Inset: magnetic order region [91S1].
Temperature [K]T0 10 20 30 40 50
Dy Ir Si2 5Er Ir Si2 5
Mag
netic
mom
ent
[]
p RBµ
12
10
8
6
4
2
Fig. 425. DyIr2Si2, ErIr2Si2. Temperature dependence of the rare earth ordered moment [93S1].
Temperature [K]T
Heat
capa
city
[Jm
olK
]C p
11
−−
Dy Rh Si2 3 5
Ho Rh Si2 3 5
0 5 10 15 20 25
30
20
10
Fig. 426. Dy2Rh3Si5, Ho2Rh3Si5. Temperature de-pendence of Cp [97P1].

2.5 Rare earth elements and 4d or 5d elements 5
Magnetic field [T]0 Hµ
Mag
neto
stric
tion
[10
]∆
c−
3 Å
− 4
−3
−2
−1
0 2.0
Ho Ru Si2 2
H cII
1.0
Fig. 427. HoRu2Si2. Parallel magnetostriction vs. magnetic field with H || c. Open circles: squared mag-netization M(H)2 in arbitrary units [95T3].
Magnetic field [kOe]H
Mag
netic
mom
ent
[]
p HoBµ
T = 4.2 K
x=0.5
x = 1
Ho Rh Si2 2Ho Pd Si2 2
8
6
4
2
0 40 80 120 160
Fig. 428. HoRh2Si2, HoPd2Si2. Magnetic field de-pendence of pHo/at 4.2 K..
Temperature [K]T
Susc
eptib
ility
(rela
tive)
ac
Ho Rh Ru Si2-x x 2TN = 10 K
0 10 20 30 40
x = 0.5
x = 1.5
x = 1
x = 0
7.7
6.1
18.7
11.9
28
20
15
10
5
Fig. 429. HoRh2–xRuxSi2. Temperature dependence of χac for different x [96I2].
Néel
tem
pera
ture
[K]
T N
Ho Rh Ru Si2-x x 2 Ho Rh Pd Si2-x x 2
30
20
10
02 1 0 1 2
x x Fig. 430. HoRh2–xPdxSi2, HoRh2–xRuxSi2. Magnetic phase diagrams [96I2].
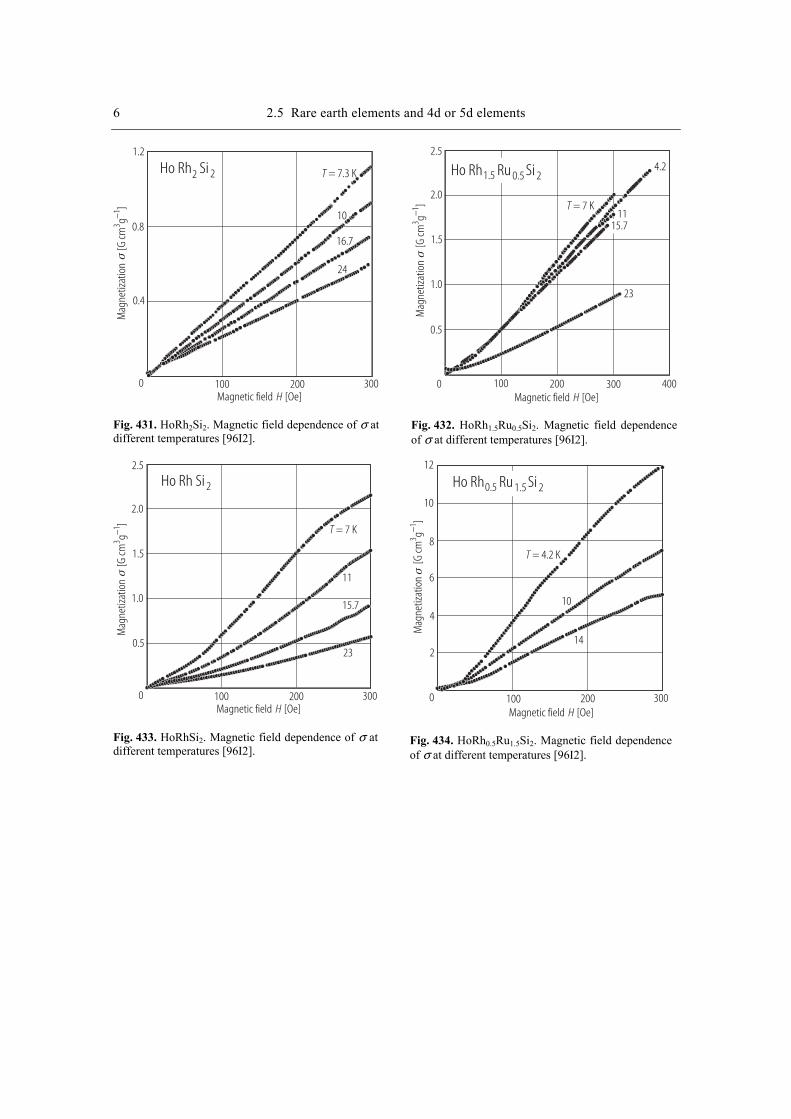
6 2.5 Rare earth elements and 4d or 5d elements M
agne
tizat
ion
[G
cmg
]3
1−
Magnetic field [Oe]H
Ho Rh Si2 2 T = 7.3 K
0 100 200 300
10
16.7
24
1.2
0.8
0.4
Fig. 431. HoRh2Si2. Magnetic field dependence of σ at different temperatures [96I2].
Mag
netiz
atio
n
[G cm
g]
31−
Magnetic field [Oe]H
Ho Rh Ru Si1.5 0.5 2
T = 7 K
0 200 400
4.2
1115.7
23
2.5
2.0
1.5
1.0
0.5
100 300
Fig. 432. HoRh1.5Ru0.5Si2. Magnetic field dependence of σ at different temperatures [96I2].
Mag
netiz
atio
n
[G cm
g]
31−
Magnetic field [Oe]H
Ho Rh Si 2
T = 7 K
11
15.7
23
2.5
2.0
1.5
1.0
0.5
0 100 200 300
Fig. 433. HoRhSi2. Magnetic field dependence of σ at different temperatures [96I2].
Mag
netiz
atio
n
[G cm
g]
31−
Magnetic field [Oe]H
Ho Rh Ru Si0.5 1.5 2
T = 4.2 K
10
14
12
10
8
6
4
2
0 100 200 300
Fig. 434. HoRh0.5Ru1.5Si2. Magnetic field dependence of σ at different temperatures [96I2].
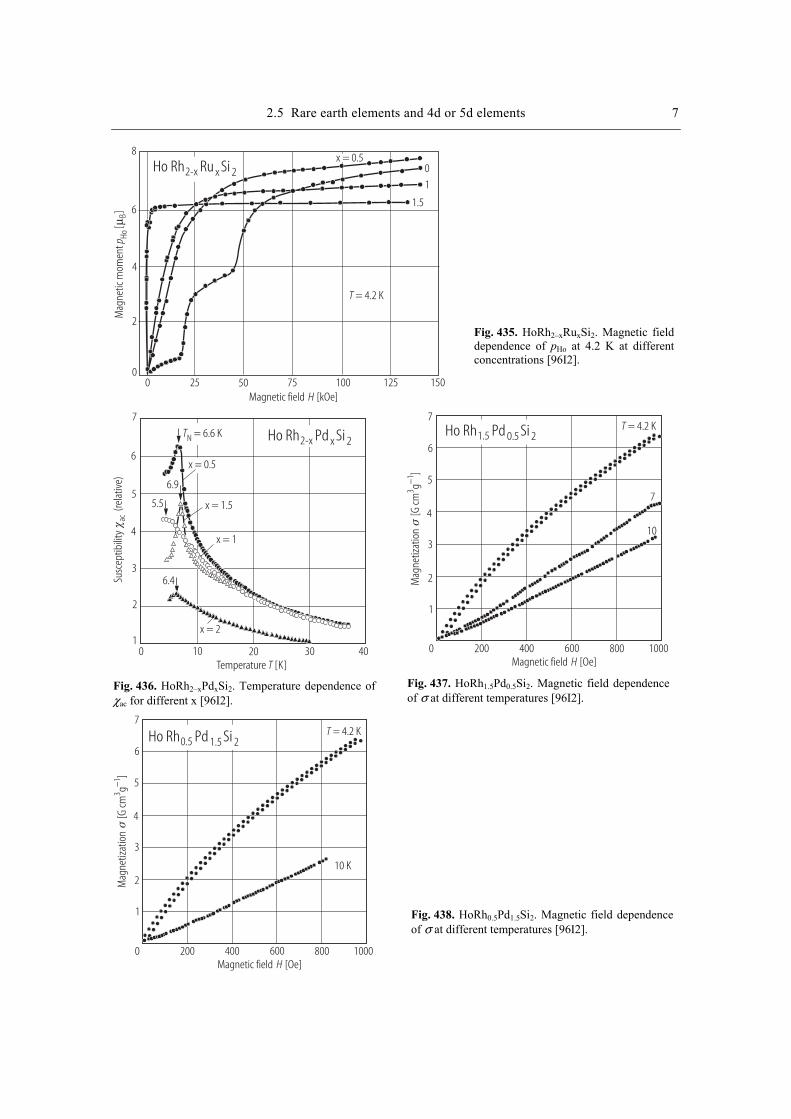
2.5 Rare earth elements and 4d or 5d elements 7
Magnetic field [kOe]H
Mag
netic
mom
ent
[]
p HoBµ
T = 4.2 K
Ho Rh Ru Si2-x x 2
8
6
4
2
00 50 100 15025 75 125
0
1
1.5
x = 0.5 Fig. 435. HoRh2–xRuxSi2. Magnetic field dependence of pHo at 4.2 K at different concentrations [96I2].
Temperature [K]T
Susc
eptib
ility
(rela
tive)
ac
Ho Rh Pd Si2-x x 2TN = 6.6 K
7
6
5
4
3
2
10 10 20 30 40
x = 0.5
6.9
5.5 x = 1.5
x = 1
6.4
x = 2
Fig. 436. HoRh2–xPdxSi2. Temperature dependence of χac for different x [96I2].
M
agne
tizat
ion
[G
cmg
]3
1−
Magnetic field [Oe]H
Ho Rh Pd Si1.5 0.5 2T = 4.2 K
0 200 400 600 800 1000
7
6
5
4
3
2
1
7
10
Fig. 437. HoRh1.5Pd0.5Si2. Magnetic field dependence of σ at different temperatures [96I2].
Mag
netiz
atio
n
[G cm
g]
31−
Magnetic field [Oe]H
Ho Rh Pd Si0.5 1.5 2T = 4.2 K
0 200 400 600 800 1000
10 K
7
6
5
4
3
2
1
Fig. 438. HoRh0.5Pd1.5Si2. Magnetic field dependence of σ at different temperatures [96I2].
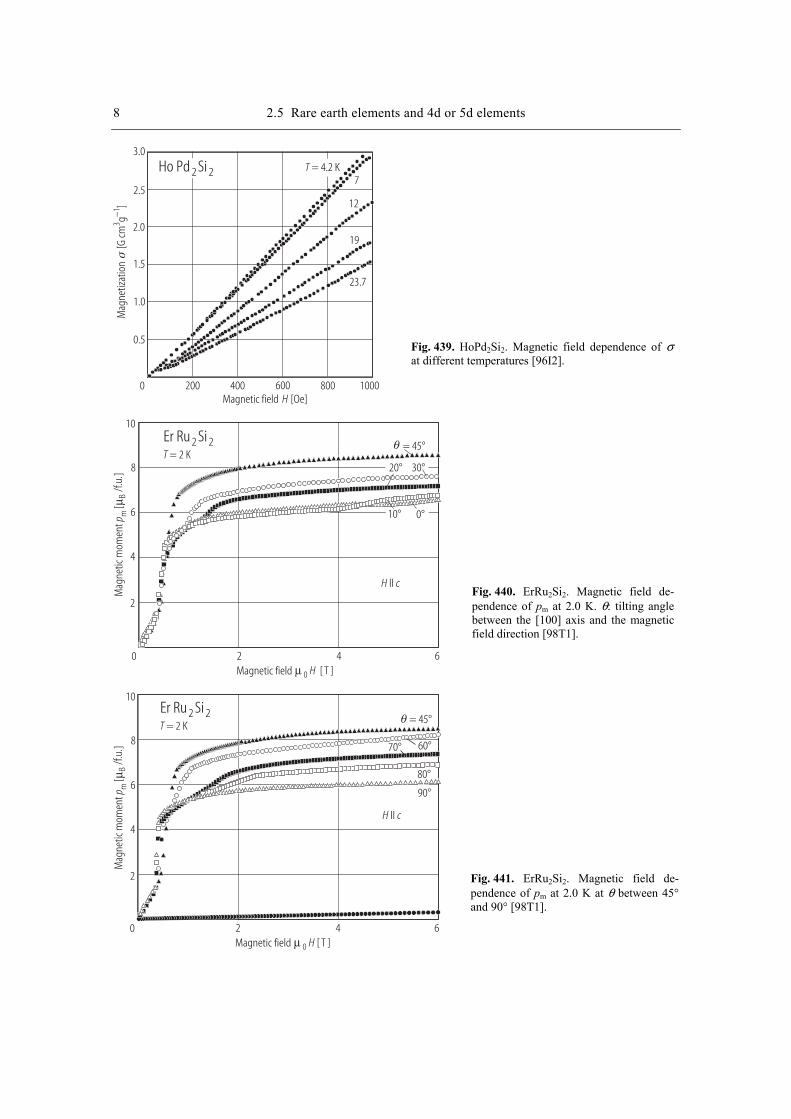
8 2.5 Rare earth elements and 4d or 5d elements M
agne
tizat
ion
[G
cmg
]3
1−
Magnetic field [Oe]H
7
12
19
23.7
Ho Pd Si2 2 T = 4.2 K3.0
2.5
2.0
1.5
1.0
0.5
0 200 400 600 800 1000
Fig. 439. HoPd2Si2. Magnetic field dependence of σ at different temperatures [96I2].
T = 2 K
Mag
netic
mom
ent
[]
p mBµ
/f.u.
Er Ru Si2 2
10
8
6
4
2
0[ T ]0 HµMagnetic field
2 4 6
= 45°
30°20°
10° 0°
H cII
Fig. 440. ErRu2Si2. Magnetic field de-pendence of pm at 2.0 K. θ: tilting angle between the [100] axis and the magnetic field direction [98T1].
T = 2 K
Mag
netic
mom
ent
[]
p mBµ
/f.u.
Er Ru Si2 2
10
8
6
4
2
0[ T ]0 HµMagnetic field
2 4 6
= 45°
60°70°
80°
90°
H cII
Fig. 441. ErRu2Si2. Magnetic field de-pendence of pm at 2.0 K at θ between 45° and 90° [98T1].
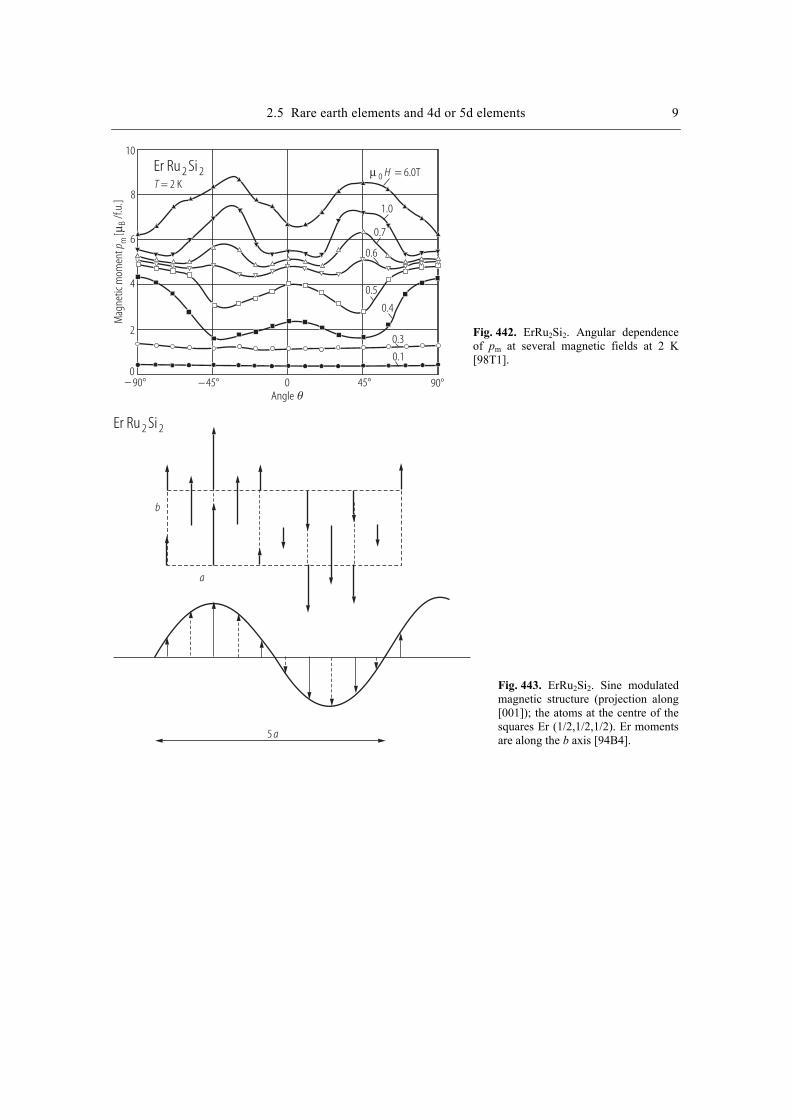
2.5 Rare earth elements and 4d or 5d elements 9
T = 2 K= 6.0T0 Hµ
Mag
netic
mom
ent
[]
p mBµ
/f.u.
Er Ru Si2 2
10
8
6
4
2
0− 90° −45° 0 45° 90°
Angle
1.0
0.7
0.6
0.5
0.4
0.3
0.1
Fig. 442. ErRu2Si2. Angular dependence of pm at several magnetic fields at 2 K [98T1].
Er Ru Si2 2
a
b
5 a
Fig. 443. ErRu2Si2. Sine modulated magnetic structure (projection along [001]); the atoms at the centre of the squares Er (1/2,1/2,1/2). Er moments are along the b axis [94B4].

10 2.5 Rare earth elements and 4d or 5d elements
Er Ru Si2 2
Temperature [K]T
3.2
2.8
2.4
2.0
02 4 6 8 10
Mag
netiz
atio
n
[1
0G
cmm
ol]
33
1−m
Fig. 444. ErRu2Si2. Temperature dependence of σm at 0.1 T [94B4].
T = 2 K
Magnetic field [T]0 HµM
agne
tic m
omen
t[
]p m
Bµ/f.
u.
ErRu Si2 24.4 8
14
50
200
10
8
6
4
2
0 1 2 3 4 5
Fig. 445. ErRu2Si2. Magnetic field dependence of pm at different temperatures [94B4].
Temperature [K]T
Inv.
susc
eptib
ility
[mol
cm]
−−3
1m
Er Pd Si2 21 T0 H =µ25
20
15
10
5
0
30
50 100 150 200 250 300 350
Fig. 446. ErPd2Si2. Temperature dependence of χm
–1 at 1 T [94T1].
Temperature [K]T
Inv.
susc
eptib
ility
[mol
cm]
−−3
1m
Er Pd Si2 20.1 T0 H =µ
2.0
1.8
1.6
1.4
1.22 3 4 5 6 7 8 9
Fig. 447. ErPd2Si2. Temperature dependence of χm
–1 at 0.1 T [94T1].
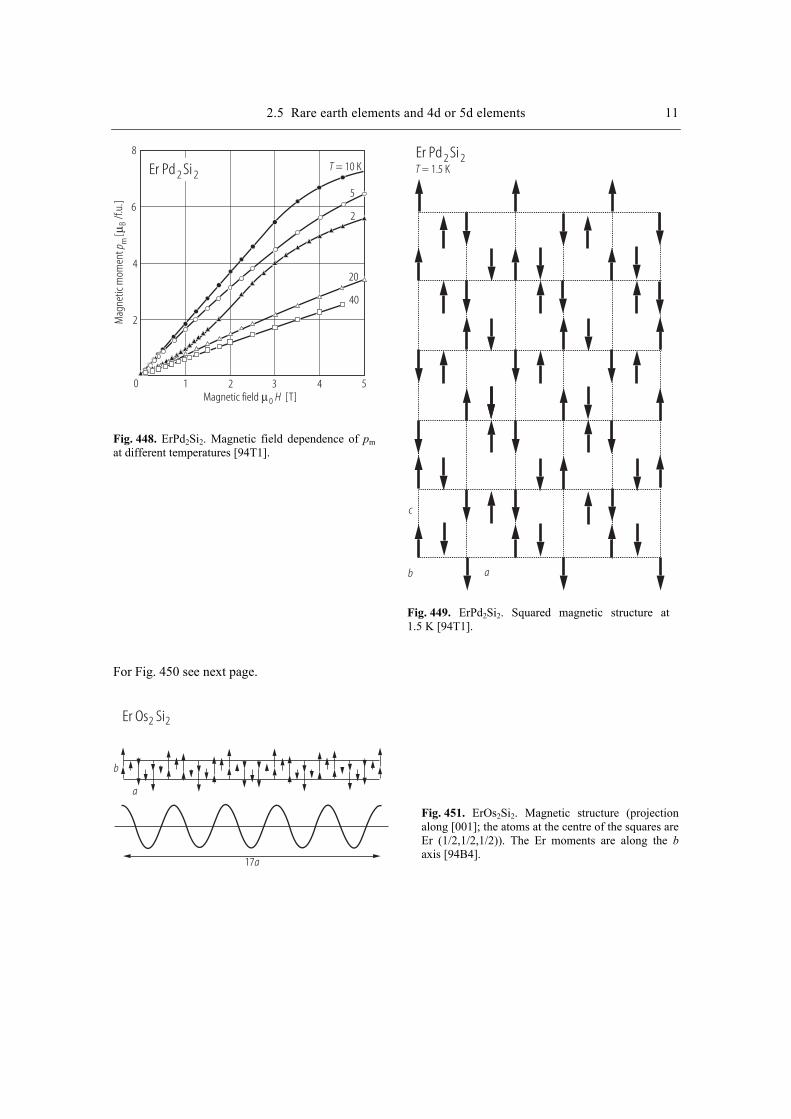
2.5 Rare earth elements and 4d or 5d elements 11
T = 10 K
Magnetic field [T]0 Hµ
Er Pd Si2 2
5
2
20
40
8
6
4
2
0 1 2 3 4 5
Mag
netic
mom
ent
[]
p mBµ
/f.u.
Fig. 448. ErPd2Si2. Magnetic field dependence of pm at different temperatures [94T1].
c
b a
T = 1.5 KEr Pd Si2 2
Fig. 449. ErPd2Si2. Squared magnetic structure at 1.5 K [94T1].
For Fig. 450 see next page.
b
a
17a
Er Os Si2 2 Fig. 451. ErOs2Si2. Magnetic structure (projection along [001]; the atoms at the centre of the squares are Er (1/2,1/2,1/2)). The Er moments are along the b axis [94B4].
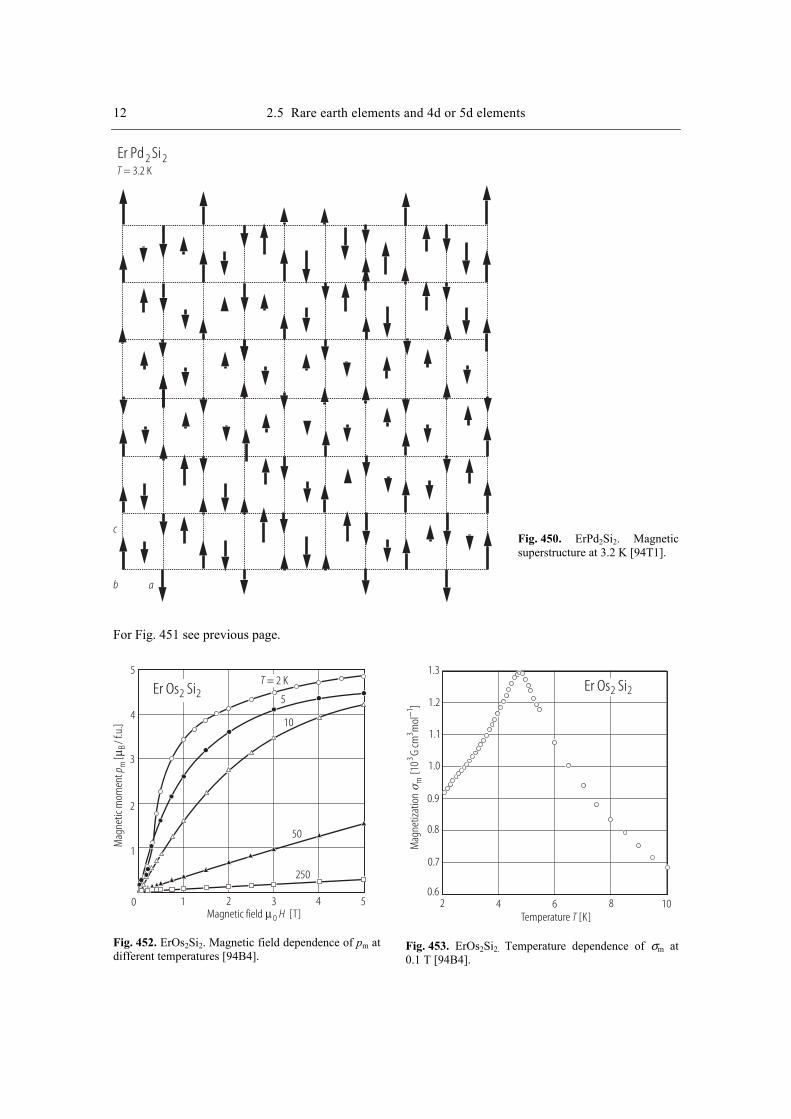
12 2.5 Rare earth elements and 4d or 5d elements
c
b a
T = 3.2 K
Er Pd Si2 2 Fig. 450. ErPd2Si2. Magnetic superstructure at 3.2 K [94T1].
For Fig. 451 see previous page.
Magnetic field [T]0 Hµ
Mag
netic
mom
ent
[]
p mBµ
/ f.u
.
T = 2 KEr Os Si2 2 5
10
50
250
5
4
3
2
1
0 1 2 3 4 5
Fig. 452. ErOs2Si2. Magnetic field dependence of pm at different temperatures [94B4].
Temperature [K]T
Mag
netiz
atio
n[1
0G
cmm
ol]
m3
31−
Er Os Si2 2
1.3
1.2
1.1
1.0
0.9
0.8
0.7
0.62 4 6 8 10
Fig. 453. ErOs2Si2. Temperature dependence of σm at 0.1 T [94B4].

2.5 Rare earth elements and 4d or 5d elements 13
Temperature [K]T
Susc
eptib
ility
[cm
mol
]m
31−
0.55
0.51
0.47
0.43
0.39
0.354 6 8 10 12 14
Er Ir Si2 2
Fig. 454. ErIr2Si2. Temperature dependence of χm at 0.1 T [93S1].
Temperature [K]TIn
v.su
scep
tibili
ty[m
ol cm
]m
3−−1
Ce Pd Al2 3
450
400
350
300
250
200
150
100
50
0 50 100 150 200 250 300
Fig. 455. CePd2Al3. Temperature dependence of χm
–1 [93G1].
Temperature [K]T
Inv.
susc
eptib
ility
[mol
cm]
m3−
−1
Ce Pd Al2 3
50
40
30
20
10
0 5 10 15 20
Fig. 456. CePd2Al3. Low-temperature dependence of χm
–1 [93G1].
Temperature [K]T
Ce Pd Al2 3
Resis
tivity
[cm
]µΩ
⋅
500
400
300
200
100
0 50 100 150 200 250 300
Fig. 457. CePd2Al3. Temperature dependence of ρ [93G1].
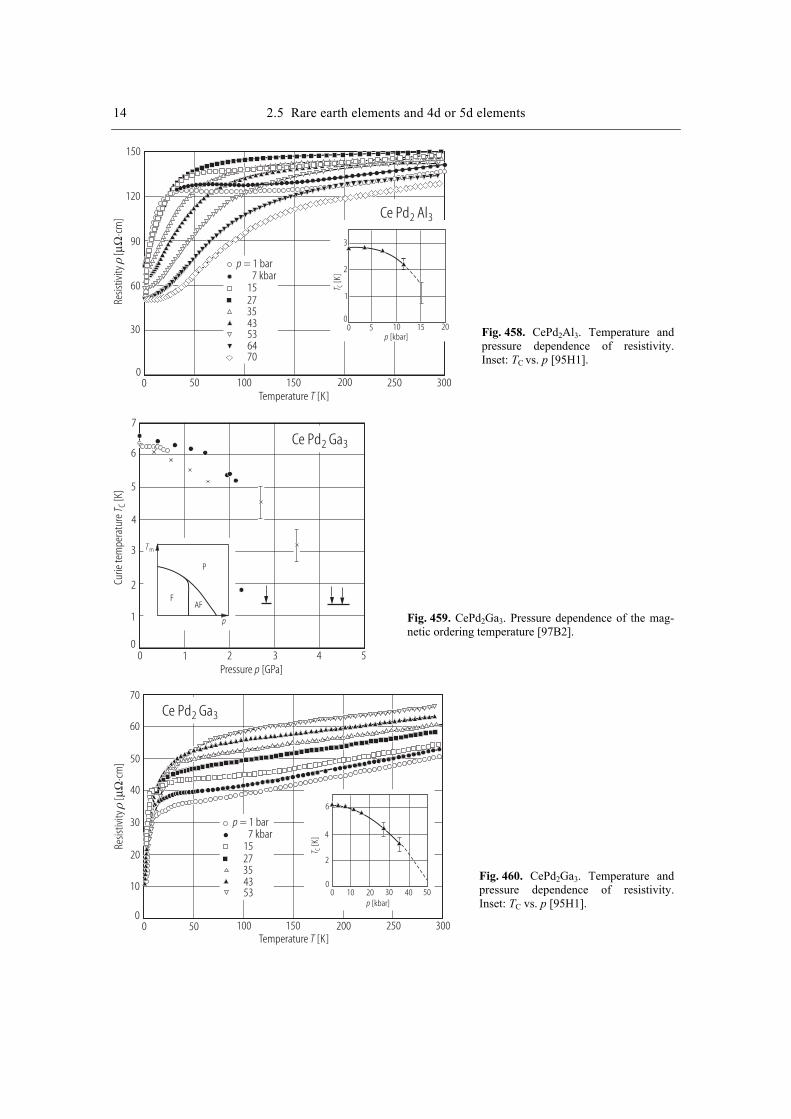
14 2.5 Rare earth elements and 4d or 5d elements
Temperature [K]T
Ce Pd Al2 3
Resis
tivity
[cm
]µΩ
⋅
150
120
90
60
30
00 50 100 150 200 250 300
0 5 10 15 20p [kbar]
3
2
1
0
T C[K
]
p = 1 bar7 kbar
15273543536470
Fig. 458. CePd2Al3. Temperature and pressure dependence of resistivity. Inset: TC vs. p [95H1].
Ce Pd Ga2 3
Pressure [GPa]p
Curie
tem
pera
ture
[K]
T C
0 1 2 3 4 5
7
6
5
4
3
2
1
0
T m
FAF
P
p
Fig. 459. CePd2Ga3. Pressure dependence of the mag-netic ordering temperature [97B2].
Ce Pd Ga2 3
Temperature [K]T
Resis
tivity
[cm
]µΩ
⋅
00
50 100 150 200 250 300
0 10 20 30 40 50p [kbar]
6
4
2
0
T C[K
]
p = 1 bar7 kbar
1527354353
70
60
50
40
30
20
10
Fig. 460. CePd2Ga3. Temperature and pressure dependence of resistivity. Inset: TC vs. p [95H1].
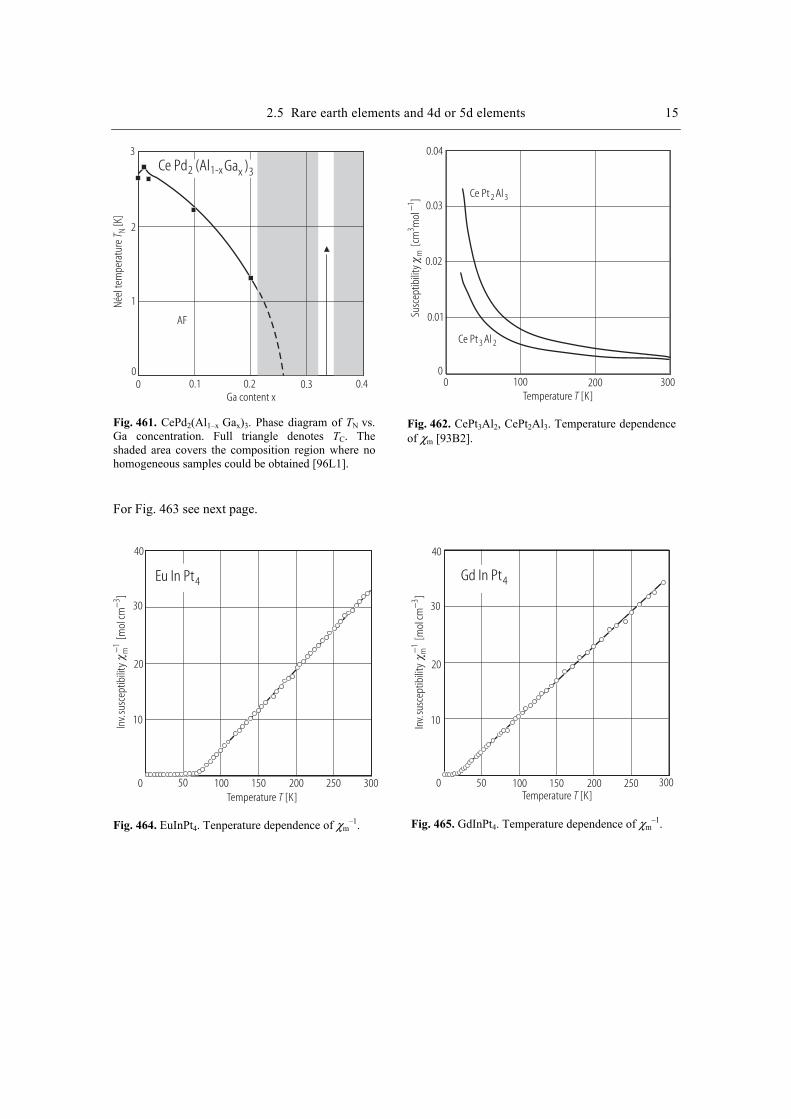
2.5 Rare earth elements and 4d or 5d elements 15 Né
el te
mpe
ratu
re[K
]T N
3
2
1
00 0.1 0.2 0.3 0.4
Ga content x
Ce Pd (Al2 1-x Ga )x 3
AF
Fig. 461. CePd2(Al1–x Gax)3. Phase diagram of TN vs. Ga concentration. Full triangle denotes TC. The shaded area covers the composition region where no homogeneous samples could be obtained [96L1].
Temperature [K]T
Susc
eptib
ility
[cm
mol
]m
31−
Ce Pt Al2 3
Ce Pt Al3 2
0.04
0.03
0.02
0.01
00 100 200 300
Fig. 462. CePt3Al2, CePt2Al3. Temperature dependence of χm [93B2].
For Fig. 463 see next page.
Inv.
susc
eptib
ility
[ mol
cm]
m3−
−1
Temperature [K]T
Eu In Pt4
40
30
20
10
0 50 100 150 200 250 300
Fig. 464. EuInPt4. Tenperature dependence of χm
–1.
Inv.
susc
eptib
ility
[ mol
cm]
m3−
−1
Temperature [K]T
Gd In Pt4
40
30
20
10
0 50 100 150 200 250 300
Fig. 465. GdInPt4. Temperature dependence of χm
–1.
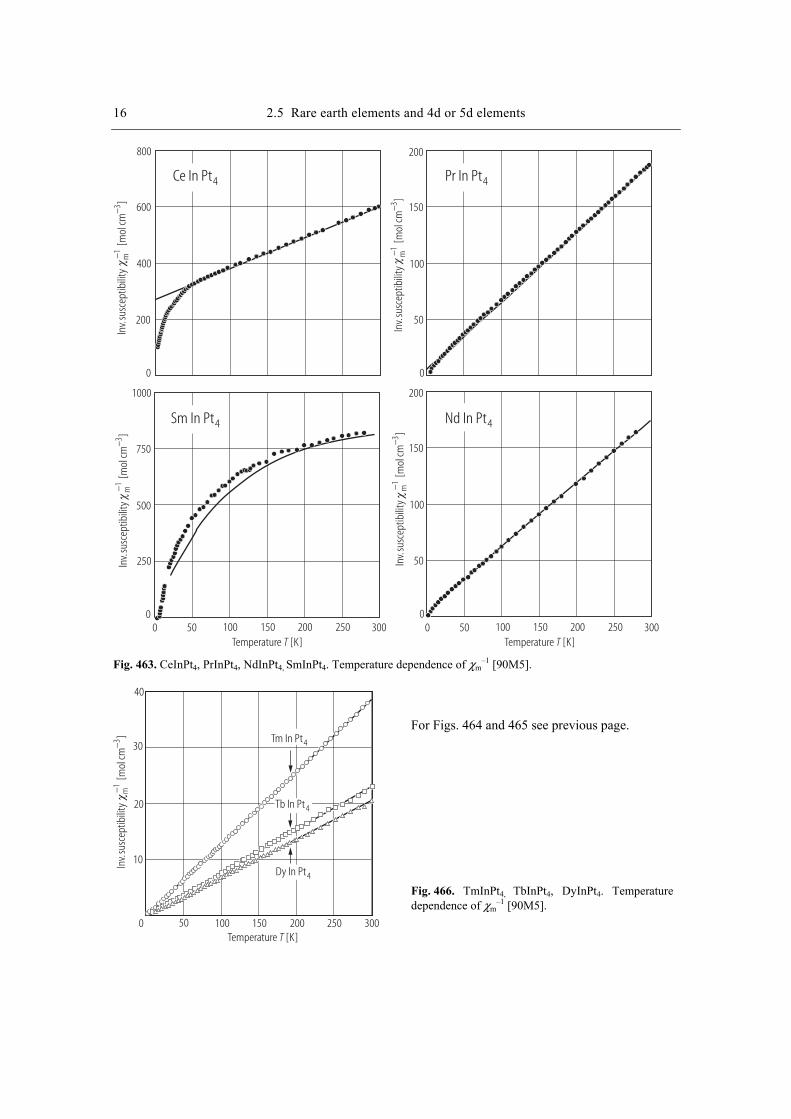
16 2.5 Rare earth elements and 4d or 5d elements In
v.su
scep
tibili
ty[ m
olcm
]m
3−−1
Inv.
susc
eptib
ility
[ mol
cm]
m3−
−1
Inv.
susc
eptib
ility
[ mol
cm]
m3−
−1In
v.su
scep
tibili
ty[ m
olcm
]m
3−−1
Temperature [K]T Temperature [K]T
800
600
400
200
0
0
250
500
750
1000
0 050 50100 100150 150200 200250 250300 300
200
200
150
150
100
100
50
50
0
0
Ce In Pt4 Pr In Pt4
Nd In Pt4Sm In Pt4
Fig. 463. CeInPt4, PrInPt4, NdInPt4, SmInPt4. Temperature dependence of χm–1 [90M5].
Inv.
susc
eptib
ility
[ mol
cm]
m3−
−1
Temperature [K]T
40
30
20
10
0 50 100 150 200 250 300
Tm In Pt4
Tb In Pt4
Dy In Pt4
For Figs. 464 and 465 see previous page. Fig. 466. TmInPt4, TbInPt4, DyInPt4. Temperature dependence of χm
–1 [90M5].
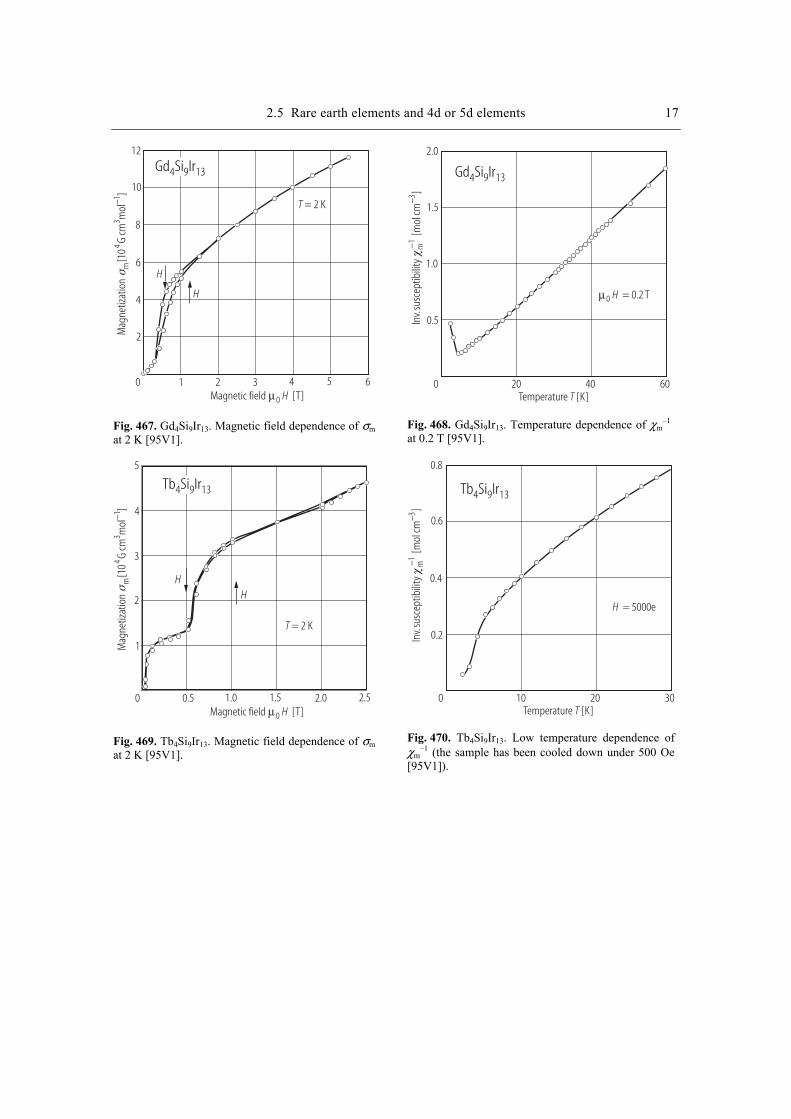
2.5 Rare earth elements and 4d or 5d elements 17
Magnetic field [T]0 Hµ
T = 2 K
H
H
Mag
netiz
atio
n
[10
G cm
mol
]4
31−
m
Gd Si Ir4 9 13
12
10
8
6
4
2
0 1 2 3 4 5 6
Fig. 467. Gd4Si9Ir13. Magnetic field dependence of σm at 2 K [95V1].
Gd Si Ir4 9 13
Inv.
susc
eptib
ility
[ mol
cm]
m3−
−1Temperature [K]T
= 0.2 T0 Hµ
2.0
1.5
1.0
0.5
0 20 40 60
Fig. 468. Gd4Si9Ir13. Temperature dependence of χm
–1 at 0.2 T [95V1].
Magnetic field [T]0 Hµ
T = 2 K
HH
Mag
netiz
atio
n
[10
G cm
mol
]4
31−
m
Tb Si Ir4 9 13
4
2
0 1.0 2.00.5 1.5 2.5
1
3
5
Fig. 469. Tb4Si9Ir13. Magnetic field dependence of σm at 2 K [95V1].
Tb Si Ir4 9 13
Inv.
susc
eptib
ility
[ mol
cm]
m3−
−1
Temperature [K]T
= 5000eH
0.8
0.4
0.2
0 10 20 30
0.6
Fig. 470. Tb4Si9Ir13. Low temperature dependence of χm
–1 (the sample has been cooled down under 500 Oe [95V1]).
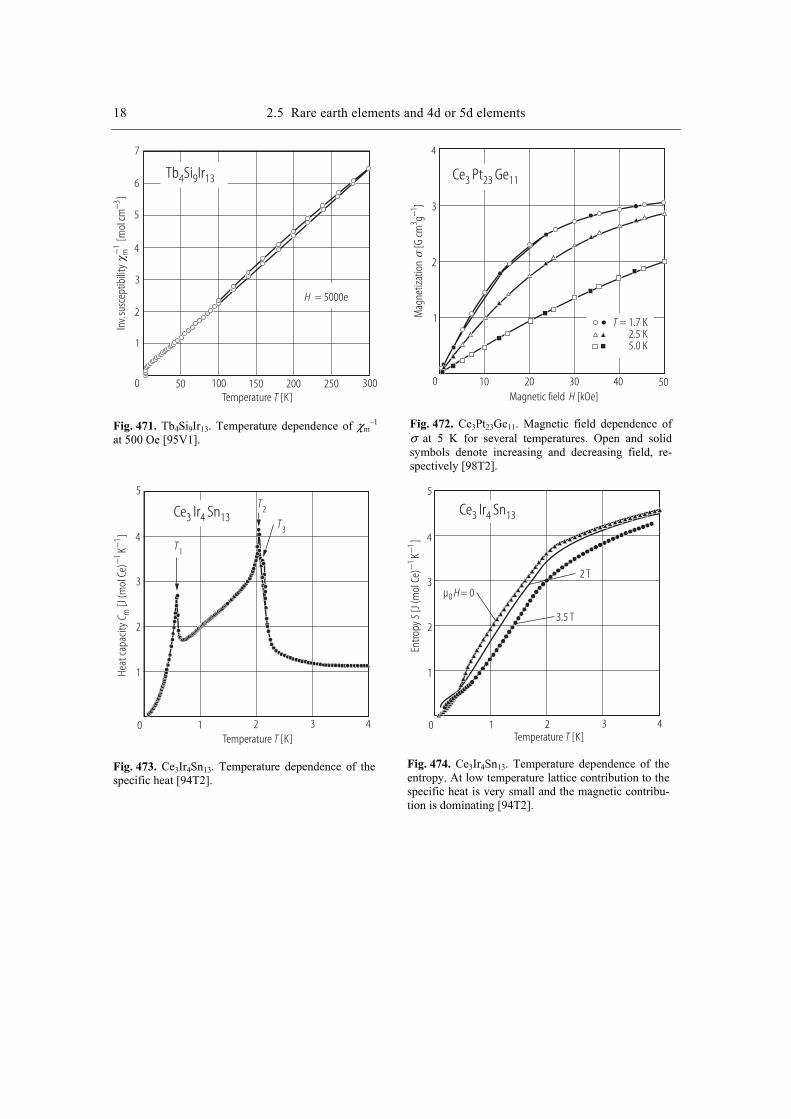
18 2.5 Rare earth elements and 4d or 5d elements In
v.su
scep
tibili
ty[ m
olcm
]m
3−−1
Temperature [K]T
Tb Si Ir4 9 13
= 5000eH
7
6
5
4
3
2
1
0 50 100 150 200 250 300
Fig. 471. Tb4Si9Ir13. Temperature dependence of χm
–1 at 500 Oe [95V1].
Magnetic field [kOe]H
Mag
netiz
atio
n
[G cm
g]
31−
4
3
2
1
0 10 20 30 40 50
T = 1.7 K2.5 K5.0 K
Ce Pt Ge3 23 11
Fig. 472. Ce3Pt23Ge11. Magnetic field dependence of σ at 5 K for several temperatures. Open and solid symbols denote increasing and decreasing field, re-spectively [98T2].
Temperature [K]T
Ce Ir Sn3 4 13
Heat
capa
city
[J(m
olCe
)K
]C m
11
−− T1
T2
T3
5
4
3
2
1
0 1 2 3 4
Fig. 473. Ce3Ir4Sn13. Temperature dependence of the specific heat [94T2].
Temperature [K]T
Ce Ir Sn3 4 13
Entro
py[J
(mol
Ce)
K]
S−
−1
1
5
4
3
2
1
0 1 2 3 4
µ = 00 H
2 T
3.5 T
Fig. 474. Ce3Ir4Sn13. Temperature dependence of the entropy. At low temperature lattice contribution to the specific heat is very small and the magnetic contribu-tion is dominating [94T2].
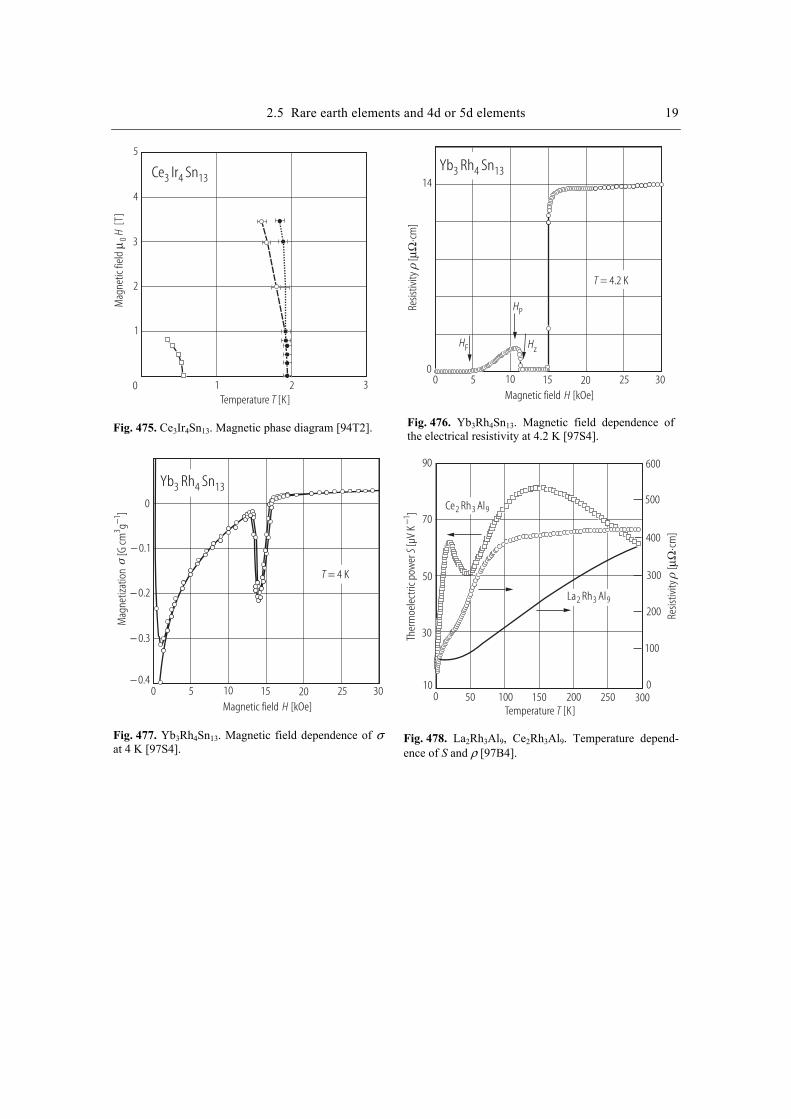
2.5 Rare earth elements and 4d or 5d elements 19
Temperature [K]T
Ce Ir Sn3 4 13
0 1 2 3
Mag
netic
fiel
d[T
]0
Hµ
5
4
3
2
1
Fig. 475. Ce3Ir4Sn13. Magnetic phase diagram [94T2].
Magnetic field [kOe]H
Resis
tivity
[
cm]
µΩ⋅
T = 4.2 K
Yb Rh Sn3 4 13
HF
HP
Hz
0
14
0 5 10 15 20 25 30
Fig. 476. Yb3Rh4Sn13. Magnetic field dependence of the electrical resistivity at 4.2 K [97S4].
Magnetic field [kOe]H
T = 4 K
Yb Rh Sn3 4 13
0 5 10 15 20 25 30
Mag
netiz
atio
n
[G cm
g]
31−
0
− 0.4
− 0.2
− 0.3
− 0.1
Fig. 477. Yb3Rh4Sn13. Magnetic field dependence of σ at 4 K [97S4].
Temperature [K]T
Ther
moe
lect
ric p
ower
[µV
K]
S−1
Resis
tivity
[
cm]
µΩ⋅
Ce Rh Al2 3 9
La Rh Al2 3 9
70
90
50
30
100 50 100 150 200 250 300
600
500
400
300
200
100
0
Fig. 478. La2Rh3Al9, Ce2Rh3Al9. Temperature depend-ence of S and ρ [97B4].
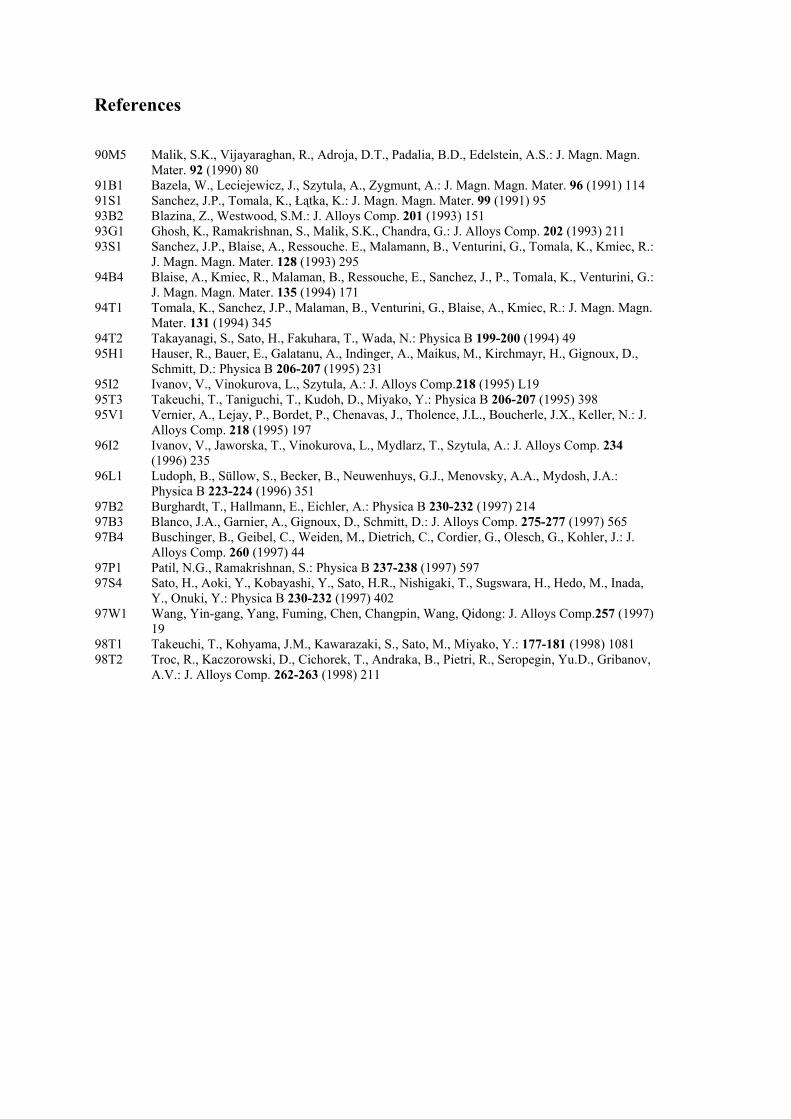
References
90M5 Malik, S.K., Vijayaraghan, R., Adroja, D.T., Padalia, B.D., Edelstein, A.S.: J. Magn. Magn. Mater. 92 (1990) 80
91B1 Bazela, W., Leciejewicz, J., Szytula, A., Zygmunt, A.: J. Magn. Magn. Mater. 96 (1991) 114 91S1 Sanchez, J.P., Tomala, K., Łątka, K.: J. Magn. Magn. Mater. 99 (1991) 95 93B2 Blazina, Z., Westwood, S.M.: J. Alloys Comp. 201 (1993) 151 93G1 Ghosh, K., Ramakrishnan, S., Malik, S.K., Chandra, G.: J. Alloys Comp. 202 (1993) 211 93S1 Sanchez, J.P., Blaise, A., Ressouche. E., Malamann, B., Venturini, G., Tomala, K., Kmiec, R.:
J. Magn. Magn. Mater. 128 (1993) 295 94B4 Blaise, A., Kmiec, R., Malaman, B., Ressouche, E., Sanchez, J., P., Tomala, K., Venturini, G.:
J. Magn. Magn. Mater. 135 (1994) 171 94T1 Tomala, K., Sanchez, J.P., Malaman, B., Venturini, G., Blaise, A., Kmiec, R.: J. Magn. Magn.
Mater. 131 (1994) 345 94T2 Takayanagi, S., Sato, H., Fakuhara, T., Wada, N.: Physica B 199-200 (1994) 49 95H1 Hauser, R., Bauer, E., Galatanu, A., Indinger, A., Maikus, M., Kirchmayr, H., Gignoux, D.,
Schmitt, D.: Physica B 206-207 (1995) 231 95I2 Ivanov, V., Vinokurova, L., Szytula, A.: J. Alloys Comp.218 (1995) L19 95T3 Takeuchi, T., Taniguchi, T., Kudoh, D., Miyako, Y.: Physica B 206-207 (1995) 398 95V1 Vernier, A., Lejay, P., Bordet, P., Chenavas, J., Tholence, J.L., Boucherle, J.X., Keller, N.: J.
Alloys Comp. 218 (1995) 197 96I2 Ivanov, V., Jaworska, T., Vinokurova, L., Mydlarz, T., Szytula, A.: J. Alloys Comp. 234
(1996) 235 96L1 Ludoph, B., Süllow, S., Becker, B., Neuwenhuys, G.J., Menovsky, A.A., Mydosh, J.A.:
Physica B 223-224 (1996) 351 97B2 Burghardt, T., Hallmann, E., Eichler, A.: Physica B 230-232 (1997) 214 97B3 Blanco, J.A., Garnier, A., Gignoux, D., Schmitt, D.: J. Alloys Comp. 275-277 (1997) 565 97B4 Buschinger, B., Geibel, C., Weiden, M., Dietrich, C., Cordier, G., Olesch, G., Kohler, J.: J.
Alloys Comp. 260 (1997) 44 97P1 Patil, N.G., Ramakrishnan, S.: Physica B 237-238 (1997) 597 97S4 Sato, H., Aoki, Y., Kobayashi, Y., Sato, H.R., Nishigaki, T., Sugswara, H., Hedo, M., Inada,
Y., Onuki, Y.: Physica B 230-232 (1997) 402 97W1 Wang, Yin-gang, Yang, Fuming, Chen, Changpin, Wang, Qidong: J. Alloys Comp.257 (1997)
19 98T1 Takeuchi, T., Kohyama, J.M., Kawarazaki, S., Sato, M., Miyako, Y.: 177-181 (1998) 1081 98T2 Troc, R., Kaczorowski, D., Cichorek, T., Andraka, B., Pietri, R., Seropegin, Yu.D., Gribanov,
A.V.: J. Alloys Comp. 262-263 (1998) 211
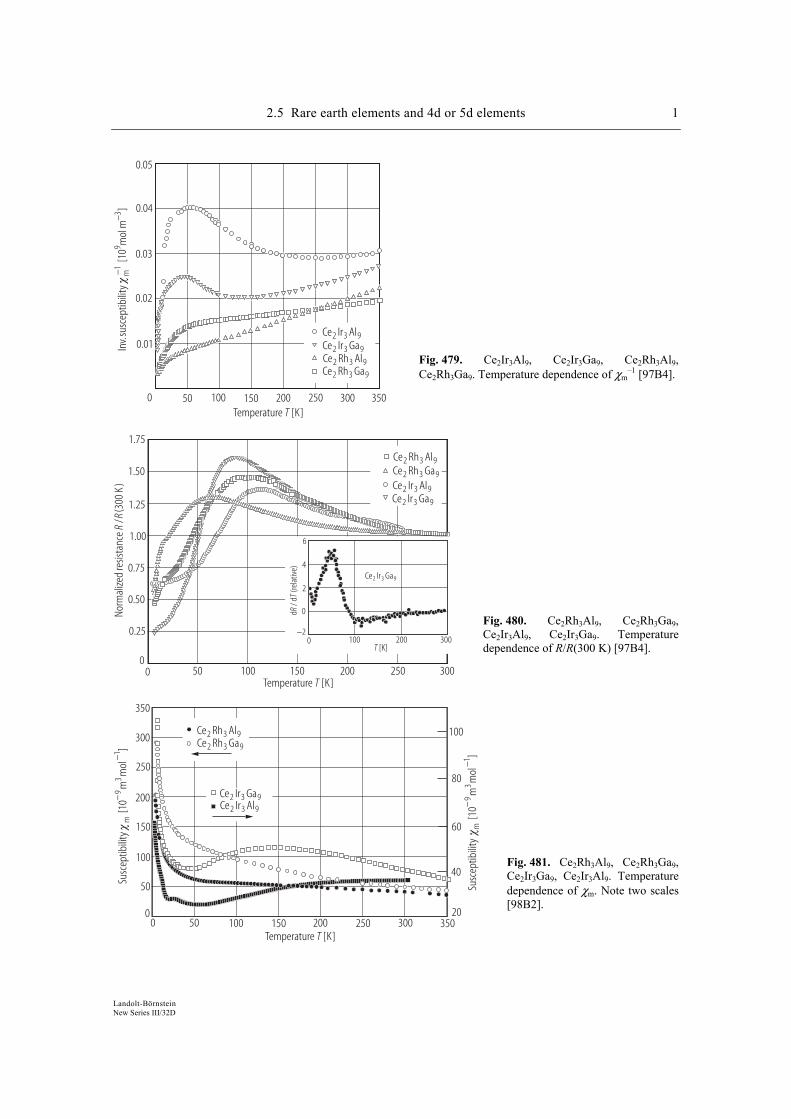
2.5 Rare earth elements and 4d or 5d elements 1
Landolt-Börnstein New Series III/32D
Temperature [K]T
Inv.
susc
eptib
ility
[10
mol
m]
m9
3−−1
0.05
0.04
0.03
0.02
0.01
0 50 100 150 200 250 300 350
Ce Rh Al2 3 9Ce Rh Ga2 3 9
Ce Ir Ga2 3 9
Ce Ir Al2 3 9
Fig. 479. Ce2Ir3Al9, Ce2Ir3Ga9, Ce2Rh3Al9, Ce2Rh3Ga9. Temperature dependence of χm
–1 [97B4].
Temperature [K]T
Ce Rh Al2 3 9
Ce Ir Ga2 3 9
Ce Rh Ga2 3 9Ce Ir Al2 3 9
Ce Ir Ga2 3 9
1.50
1.00
0.50
00 50
0.75
0.25
1.25
1.75
100 150 200 250 300
Norm
alize
d re
sista
nce
/(3
00 K
)R
R
0 100 200 300T [K]
6
4
2
0
−2
d/ d
(rela
tive)
RT
Fig. 480. Ce2Rh3Al9, Ce2Rh3Ga9, Ce2Ir3Al9, Ce2Ir3Ga9. Temperature dependence of R/R(300 K) [97B4].
Temperature [K]T
050 100 150 200 250 300 350
Susc
eptib
ility
[10
mm
93
−m
ol]
−1
Susc
eptib
ility
[10
mm
93
−m
ol]
−1
300
350
250
200
150
100
50
Ce Rh Al2 3 9Ce Rh Ga2 3 9
Ce Ir Ga2 3 9Ce Ir Al2 3 9
100
80
60
40
200
Fig. 481. Ce2Rh3Al9, Ce2Rh3Ga9, Ce2Ir3Ga9, Ce2Ir3Al9. Temperature dependence of χm. Note two scales [98B2].
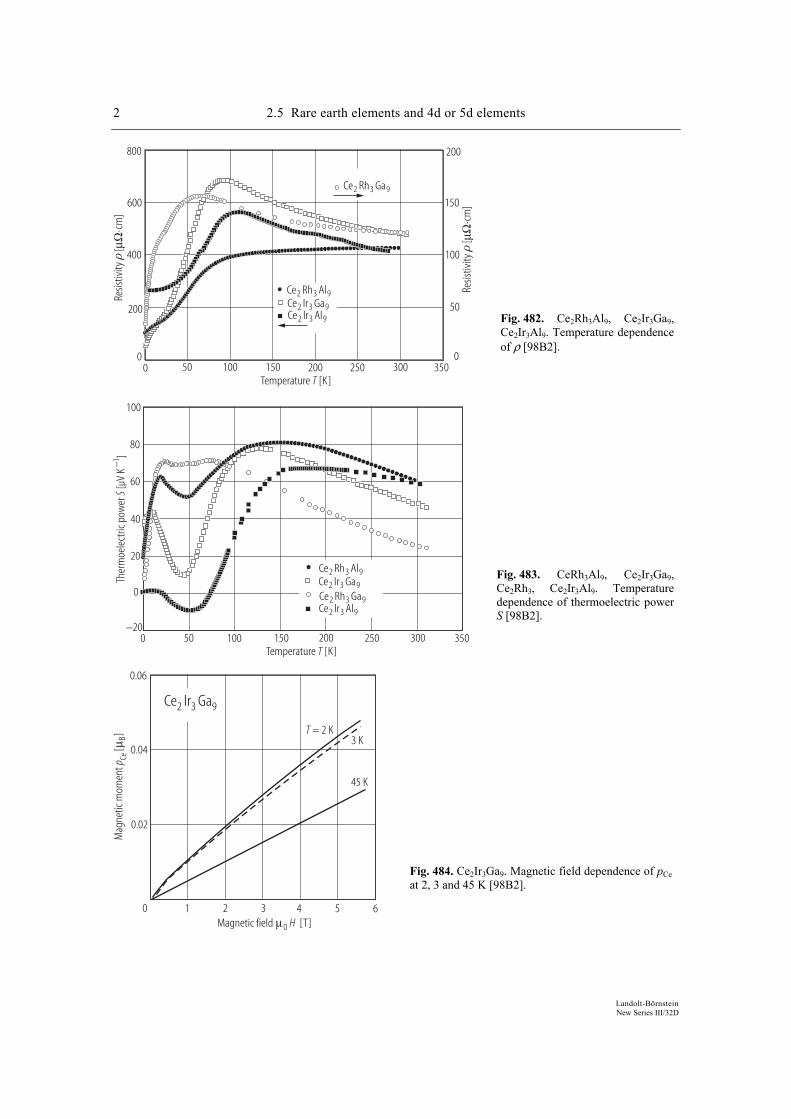
2 2.5 Rare earth elements and 4d or 5d elements
Landolt-Börnstein New Series III/32D
Temperature [K]T
Ce Rh Al2 3 9
Ce Rh Ga2 3 9
Ce Ir Ga2 3 9Ce Ir Al2 3 9
Resis
tivity
[
cm]
µΩ⋅
Resis
tivity
[
cm]
µΩ⋅
800
600
400
200
00 50 100 200150 250 300 350
200
150
100
50
0
Fig. 482. Ce2Rh3Al9, Ce2Ir3Ga9, Ce2Ir3Al9. Temperature dependence of ρ [98B2].
Temperature [K]T
Ce Rh Al2 3 9
Ce Rh Ga2 3 9
Ce Ir Ga2 3 9
Ce Ir Al2 3 9
Ther
moe
lect
ric p
ower
[µV
K]
S−1
0 50 100 150 200 250 300 350
100
80
60
40
20
0
−20
Fig. 483. CeRh3Al9, Ce2Ir3Ga9, Ce2Rh3, Ce2Ir3Al9. Temperature dependence of thermoelectric power S [98B2].
Magnetic field [T]0 Hµ
Mag
netic
mom
ent
[]
p CeBµ
T = 2 K3 K
45 K
Ce Ir Ga2 3 9
0.06
0.04
0.02
0 1 2 3 4 5 6
Fig. 484. Ce2Ir3Ga9. Magnetic field dependence of pCe at 2, 3 and 45 K [98B2].
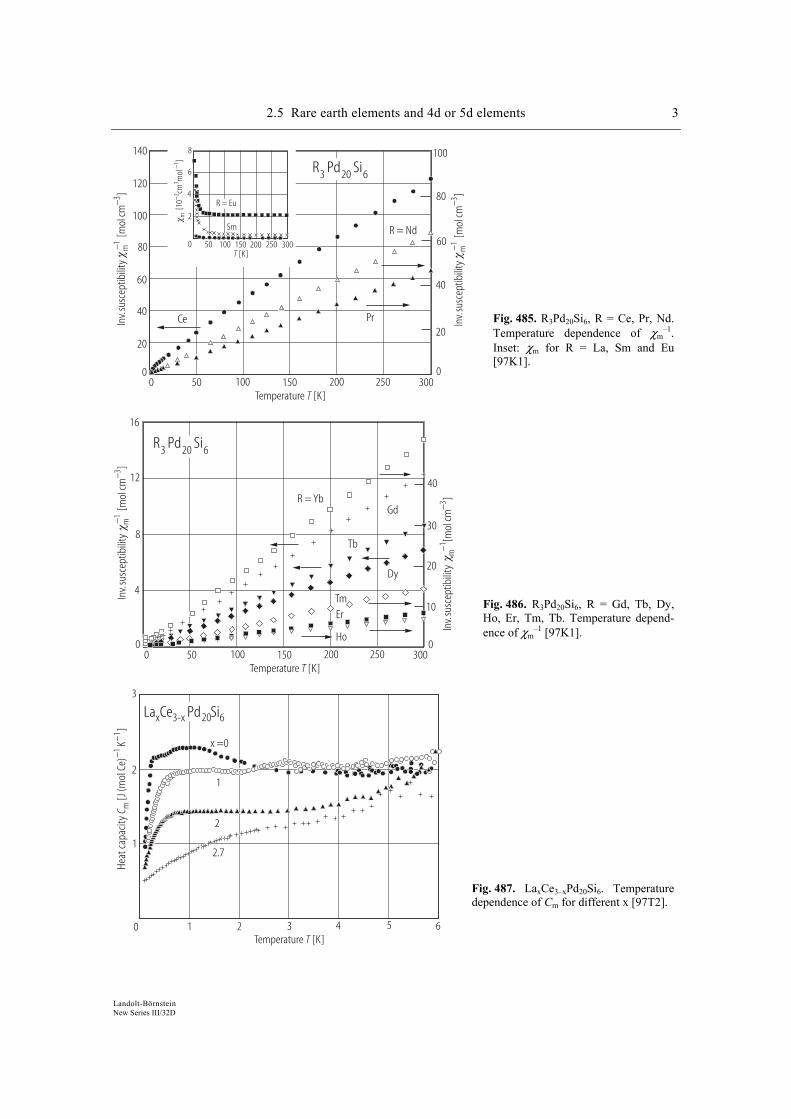
2.5 Rare earth elements and 4d or 5d elements 3
Landolt-Börnstein New Series III/32D
Inv.
susc
eptib
ility
[ mol
cm]
m3−
−1
Inv.
susc
eptib
ility
[ mol
cm]
m3−
−1
Temperature [K]T
[K]T
0 50 100 150 200 250 300
R Pd Si3 20 6
140
120
100
80
60
40
20
0
100
80
60
40
20
0
R = Nd
PrCe
R = Eu
Sm
[10
cmm
ol]
m2
31
−−
8
6
4
2
0 50 100 150 200 250 300
Fig. 485. R3Pd20Si6, R = Ce, Pr, Nd. Temperature dependence of χm
–1. Inset: χm for R = La, Sm and Eu [97K1].
Inv.
susc
eptib
ility
[ mol
cm]
m3−
−1
Inv.
susc
eptib
ility
[ mol
cm]
m3−
−1
Temperature [K]T0 50 100 150 200 250 300
R Pd Si3 20 6
12
8
4
0
40
20
0
R = Yb
16
10
30Gd
Tb
Dy
TmEr
Ho
Fig. 486. R3Pd20Si6, R = Gd, Tb, Dy, Ho, Er, Tm, Tb. Temperature depend-ence of χm
–1 [97K1].
Temperature [K]T
Heat
capa
city
[J(m
olCe
)K
]C m
11
−− x =0
1
2
2.7
0 1 2 3 4 5 6
3
2
1
La Ce Pd Six 3-x 20 6
Fig. 487. LaxCe3–xPd20Si6. Temperature dependence of Cm for different x [97T2].
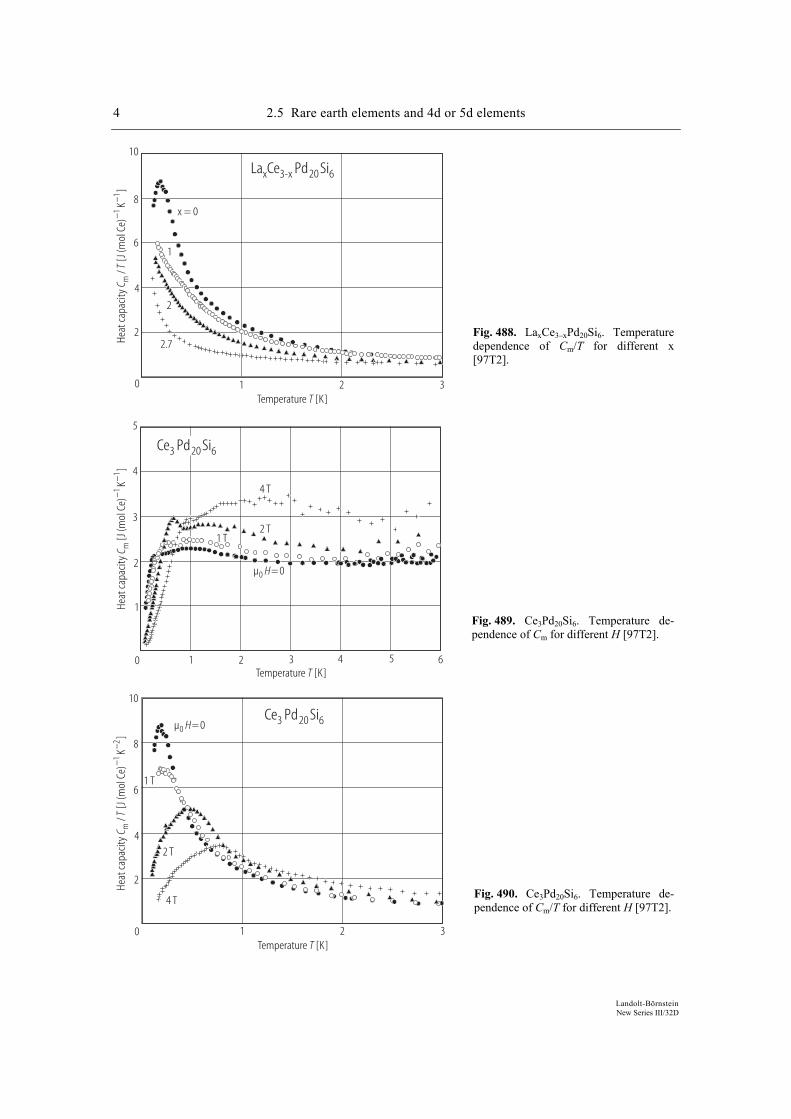
4 2.5 Rare earth elements and 4d or 5d elements
Landolt-Börnstein New Series III/32D
Temperature [K]T
Heat
capa
city
/[J
(mol
Ce)
K]
CT
m1
1−
−
x = 0
1
2
2.7
0 1 2 3
La Ce Pd Six 3-x 20 6
10
8
6
4
2
Fig. 488. LaxCe3–xPd20Si6. Temperature dependence of Cm/T for different x [97T2].
Temperature [K]T
Heat
capa
city
[J(m
olCe
)K
]C m
11
−−
0 1 2 3 4 5 6
Ce Pd Si3 20 6
µ = 00 H
1 T2 T
4 T
5
4
3
2
1
Fig. 489. Ce3Pd20Si6. Temperature de-pendence of Cm for different H [97T2].
Ce Pd Si3 20 6µ = 00 H
1 T
2 T
4 T
Temperature [K]T
Heat
capa
city
/[J
(mol
Ce)
K]
CT
m1
2−
−
0 1 2 3
10
8
6
4
2
Fig. 490. Ce3Pd20Si6. Temperature de-pendence of Cm/T for different H [97T2].
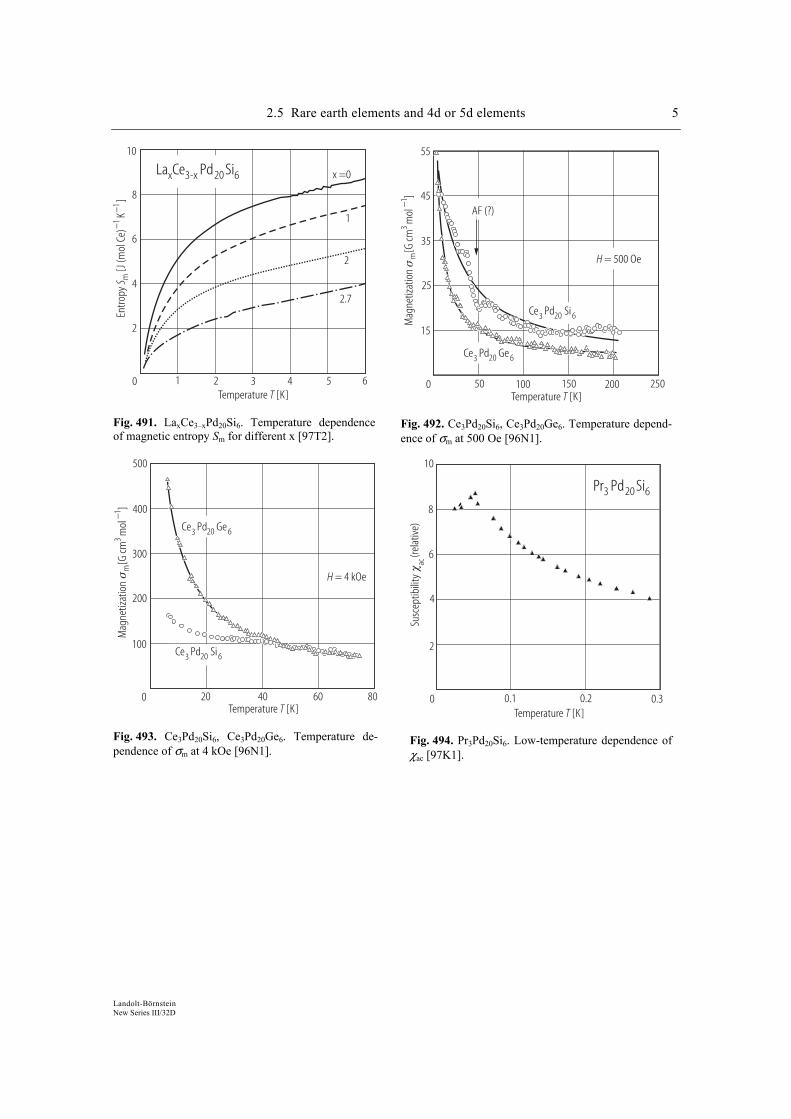
2.5 Rare earth elements and 4d or 5d elements 5
Landolt-Börnstein New Series III/32D
Temperature [K]T
Entro
py[J
(mol
Ce)
K]
S m1
1−
−
x =0
1
2
2.7
0 1 2 3 4 5 6
La Ce Pd Six 3-x 20 6
10
8
6
4
2
Fig. 491. LaxCe3–xPd20Si6. Temperature dependence of magnetic entropy Sm for different x [97T2].
Temperature [K]TM
agne
tizat
ion
[
G cm
mol
]3
1−m
55
45
35
25
15
0 50 100 150 200 250
AF (?)
H = 500 Oe
Ce Pd Si3 20 6
Ce Pd Ge3 20 6
Fig. 492. Ce3Pd20Si6, Ce3Pd20Ge6. Temperature depend-ence of σm at 500 Oe [96N1].
Temperature [K]T
Mag
netiz
atio
n
[G
cmm
ol]
31−
m
Ce Pd Si3 20 6
Ce Pd Ge3 20 6
500
400
300
200
100
0 20 40 60 80
H = 4 kOe
Fig. 493. Ce3Pd20Si6, Ce3Pd20Ge6. Temperature de-pendence of σm at 4 kOe [96N1].
Temperature [K]T
Pr Pd Si3 20 6
0 0.1 0.2 0.3
10
2
4
6
8
ac(re
lativ
e)Su
scep
tibili
ty
Fig. 494. Pr3Pd20Si6. Low-temperature dependence of χac [97K1].
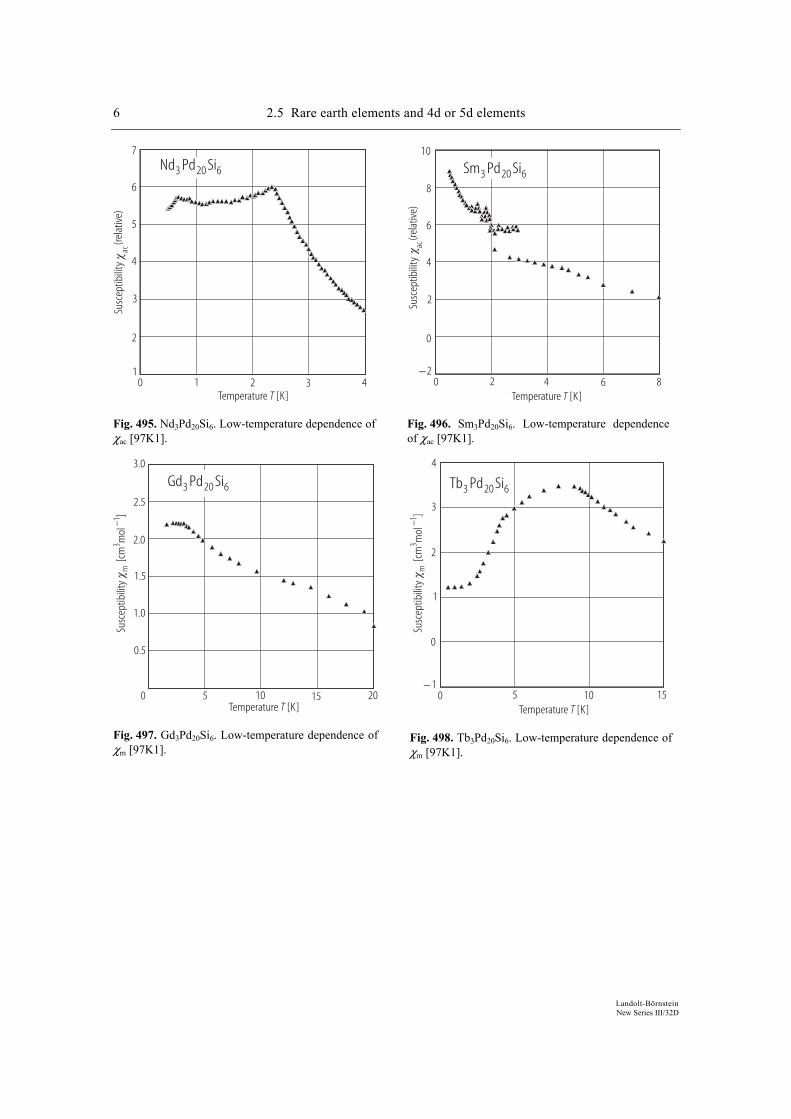
6 2.5 Rare earth elements and 4d or 5d elements
Landolt-Börnstein New Series III/32D
Temperature [K]T
ac(re
lativ
e)Su
scep
tibili
ty
Nd Pd Si3 20 6
7
6
5
4
3
2
10 1 2 3 4
Fig. 495. Nd3Pd20Si6. Low-temperature dependence of χac [97K1].
Temperature [K]T
ac(re
lativ
e)Su
scep
tibili
ty
Sm Pd Si3 20 6
10
8
6
4
2
0
−20 2 4 6 8
Fig. 496. Sm3Pd20Si6. Low-temperature dependence of χac [97K1].
Temperature [K]T
Gd Pd Si3 20 6
0 5 10 15 20
Susc
eptib
ility
[cm
mol
]m
31−
3.0
2.5
2.0
1.5
1.0
0.5
Fig. 497. Gd3Pd20Si6. Low-temperature dependence of χm [97K1].
Temperature [K]T
Tb Pd Si3 20 6
0 5 10 15
Susc
eptib
ility
[cm
mol
]m
31−
4
3
2
1
0
− 1
Fig. 498. Tb3Pd20Si6. Low-temperature dependence of χm [97K1].
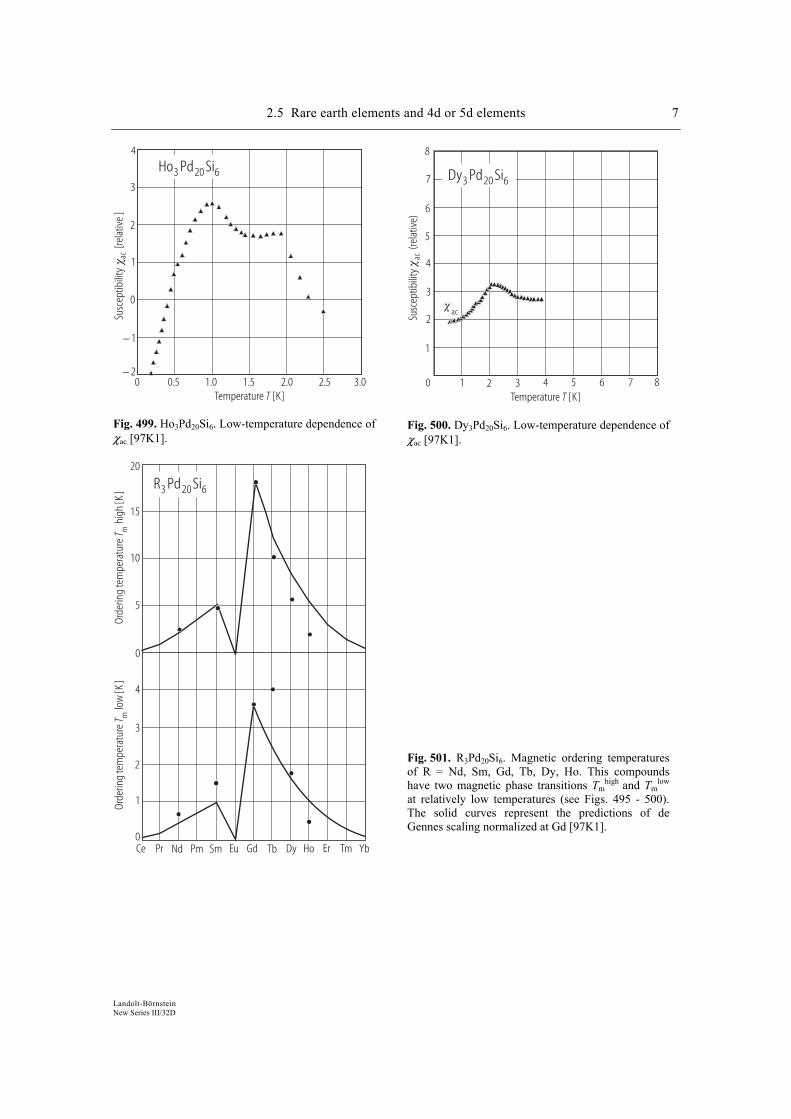
2.5 Rare earth elements and 4d or 5d elements 7
Landolt-Börnstein New Series III/32D
Temperature [K]T
Susc
eptib
ility
[rela
tive
]ac
4
3
2
1
0
− 1
− 2
Ho Pd Si3 20 6
0 0.5 1.0 1.5 2.0 2.5 3.0
Fig. 499. Ho3Pd20Si6. Low-temperature dependence of χac [97K1].
Temperature [K]T
Dy Pd Si3 20 6
Susc
eptib
ility
(rela
tive)
ac
8
7
6
5
4
3
2
1
0 1 2 3 4 5 6 7 8
ac
Fig. 500. Dy3Pd20Si6. Low-temperature dependence of χac [97K1].
R Pd Si3 20 6
20
15
10
5
0
4
3
2
1
0
Orde
ring
tem
pera
ture
low
[K]
T mOr
derin
g te
mpe
ratu
rehi
gh[K
]T m
Ce Pr Nd Pm Sm Eu Gd Tb Dy Ho Er Tm Yb
Fig. 501. R3Pd20Si6. Magnetic ordering temperatures of R = Nd, Sm, Gd, Tb, Dy, Ho. This compounds have two magnetic phase transitions Tm
high and Tm
low at relatively low temperatures (see Figs. 495 - 500). The solid curves represent the predictions of de Gennes scaling normalized at Gd [97K1].
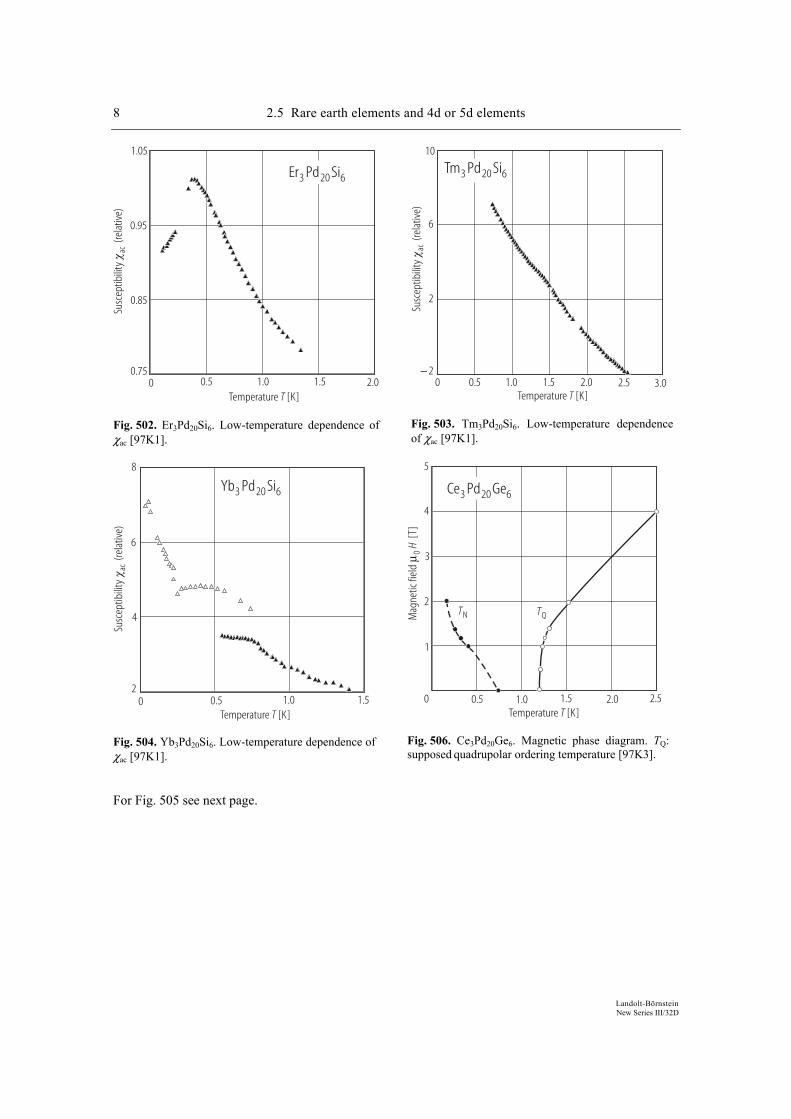
8 2.5 Rare earth elements and 4d or 5d elements
Landolt-Börnstein New Series III/32D
Temperature [K]T
Susc
eptib
ility
(rela
tive)
ac
Er Pd Si3 20 6
0 0.5 1.0 1.5 2.0
1.05
0.95
0.85
0.75
Fig. 502. Er3Pd20Si6. Low-temperature dependence of χac [97K1].
Temperature [K]T
Susc
eptib
ility
(rela
tive)
ac
Tm Pd Si3 20 6
0 0.5 1.0 1.5 2.0 2.5 3.0
10
6
2
− 2
Fig. 503. Tm3Pd20Si6. Low-temperature dependence of χac [97K1].
Temperature [K]T
Susc
eptib
ility
(rela
tive)
ac
Yb Pd Si3 20 6
0 0.5 1.0 1.52
4
6
8
Fig. 504. Yb3Pd20Si6. Low-temperature dependence of χac [97K1].
Mag
netic
fiel
d[T
]0
Hµ
TN TQ
Temperature [K]T
Ce Pd Ge3 20 6
5
4
3
2
1
0 0.5 1.0 1.5 2.0 2.5
Fig. 506. Ce3Pd20Ge6. Magnetic phase diagram. TQ: supposed quadrupolar ordering temperature [97K3].
For Fig. 505 see next page.
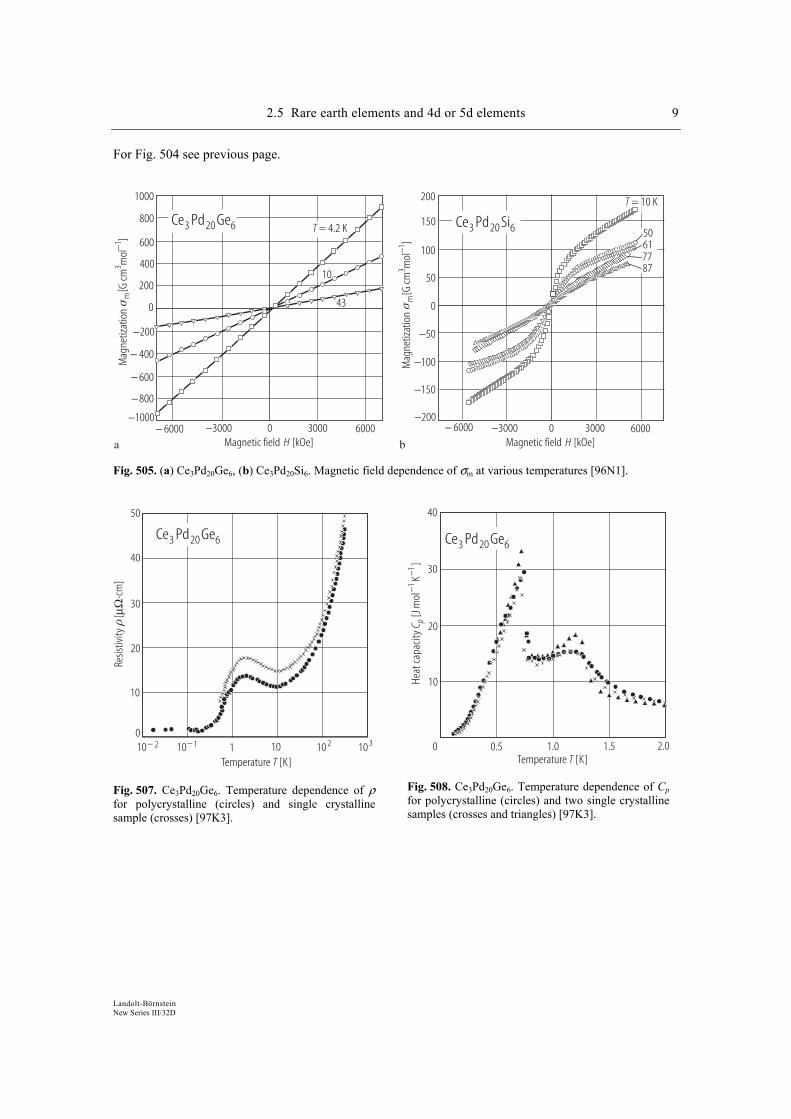
2.5 Rare earth elements and 4d or 5d elements 9
Landolt-Börnstein New Series III/32D
For Fig. 504 see previous page.
Magnetic field [kOe]H
Ce Pd Ge3 20 6
10
43
Mag
netiz
atio
n
[G
cmm
ol]
31−
m
T = 4.2 K
1000
800
600
400
200
0
−200
− 400
− 600
−800
−1000− 6000 −3000 0 3000 6000
Magnetic field [kOe]H
T = 10 K
Ce Pd Si3 20 6 50617787
Mag
netiz
atio
n
[G
cmm
ol]
31−
m
− 6000 −3000 0 3000 6000
200
150
100
50
0
−50
−100
−150
−200
a b
Fig. 505. (a) Ce3Pd20Ge6, (b) Ce3Pd20Si6. Magnetic field dependence of σm at various temperatures [96N1].
Temperature [K]T
Ce Pd Ge3 20 6
Resis
tivity
[
cm]
µΩ⋅
50
40
30
20
10
01 10 10 2 10 310− 110 − 2
Fig. 507. Ce3Pd20Ge6. Temperature dependence of ρ for polycrystalline (circles) and single crystalline sample (crosses) [97K3].
Temperature [K]T
Ce Pd Ge3 20 6
0 0.5 1.0 1.5 2.0
40
30
20
10Heat
capa
city
[Jm
olK
]C p
−−
11
Fig. 508. Ce3Pd20Ge6. Temperature dependence of Cp for polycrystalline (circles) and two single crystalline samples (crosses and triangles) [97K3].
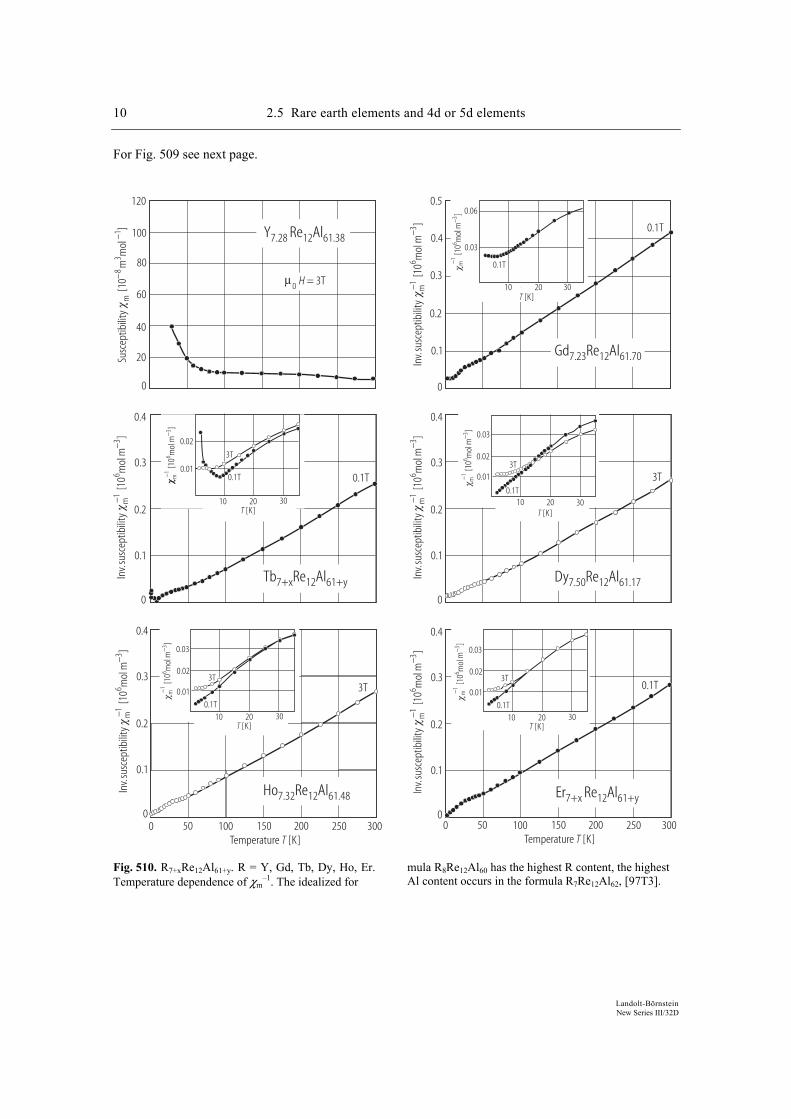
10 2.5 Rare earth elements and 4d or 5d elements
Landolt-Börnstein New Series III/32D
For Fig. 509 see next page.
Ho Re Al7.32 12 61.48
Tb Re Al7+x 12 61+y
Y Re Al7.28 12 61.38
Susc
eptib
ility
[10
mm
ol]
m8
31
−−
Inv.
susc
eptib
ility
[10
mol
m]
m6
3−−1
0.4
0.3
0.2
0.1
0
Inv.
susc
eptib
ility
[10
mol
m]
m6
3−−1
0.4
0.3
0.2
0.1
0
Temperature [K]T0 50 100 150 200 250 300
[K]T
[10
mol
m]
m6
3−−1
10 20 30
0.03
0.02
0.01
3T
0.1T
[K]T
[10
mol
m]
m6
3−−1
10 20 30
0.02
0.01
3T
0.1T
40
20
0
60
80
100
120
µ0 H = 3T
0.1T
Gd Re Al7.23 12 61.70
Dy Re Al7.50 12 61.17
Er Re Al7+x 12 61+y
Inv.
susc
eptib
ility
[10
mol
m]
m6
3−−1
0.4
0.3
0.2
0.1
0
Inv.
susc
eptib
ility
[10
mol
m]
m6
3−−1
0.4
0.3
0.2
0.1
0
Inv.
susc
eptib
ility
[10
mol
m]
m6
3−−1
0.4
0.3
0.2
0.1
0
Temperature [K]T0 50 100 150 200 250 300
[K]T
[10
mol
m]
m6
3−−1
10 20 30
0.03
0.02
0.013T
0.1T
[K]T
[10
mol
m]
m6
3−−1
10 20 30
0.03
0.06
0.1T
[K]T
[10
mol
m]
m6
3−−1
10 20 30
0.03
0.02
0.01
3T
0.1T
0.5
0.1T
3T
0.1T3T
Fig. 510. R7+xRe12Al61+y. R = Y, Gd, Tb, Dy, Ho, Er. Temperature dependence of χm
–1. The idealized for mula R8Re12Al60 has the highest R content, the highest
Al content occurs in the formula R7Re12Al62, [97T3].
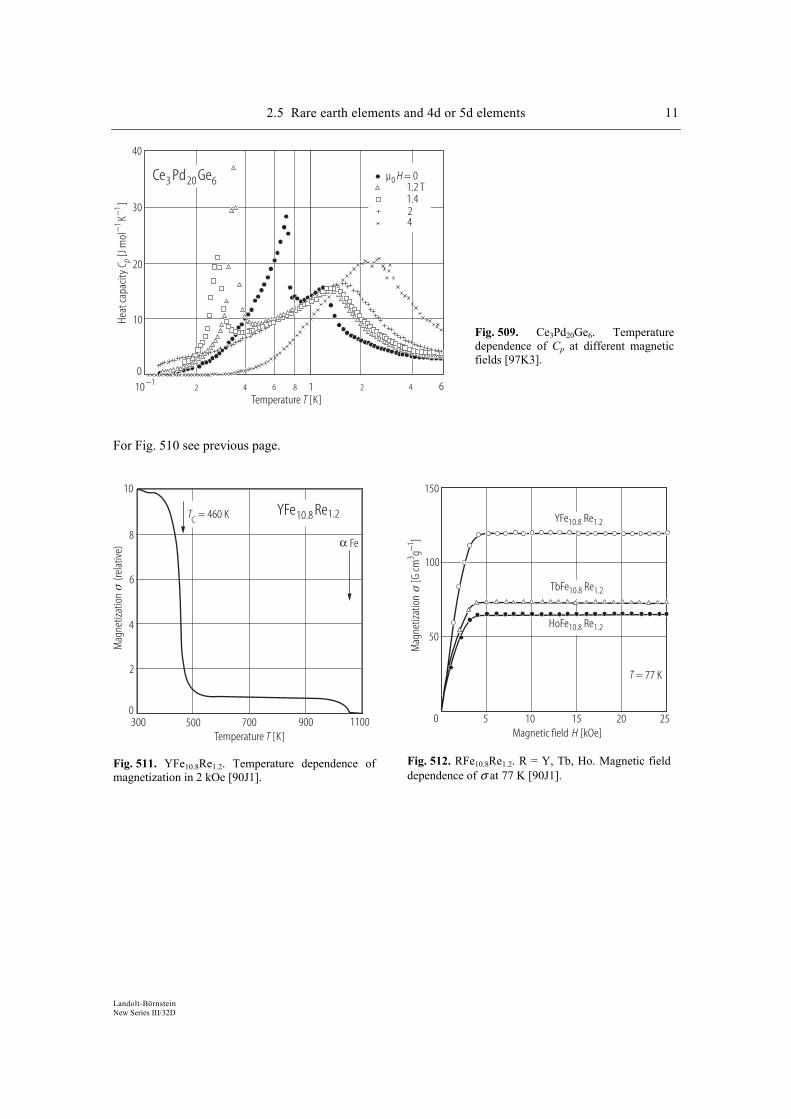
2.5 Rare earth elements and 4d or 5d elements 11
Landolt-Börnstein New Series III/32D
Temperature [K]T
Ce Pd Ge3 20 6
0
40
30
20
10Heat
capa
city
[Jm
olK
]C p
−−
11
10 −1 12 24 46 8 6
µ = 00 H
1.424
1.2 T
Fig. 509. Ce3Pd20Ge6. Temperature dependence of Cp at different magnetic fields [97K3].
For Fig. 510 see previous page.
Temperature [K]T
Mag
netiz
atio
n
(rel
ativ
e)
T = 460 KCYFe Re10.8 1.2
α Fe
300 500 700 900 1100
10
8
6
4
2
0
Fig. 511. YFe10.8Re1.2. Temperature dependence of magnetization in 2 kOe [90J1].
Mag
netiz
atio
n
[G cm
g]
31−
Magnetic field [kOe]H
T = 77 K
150
100
50
0 5 10 15 20 25
YFe Re10.8 1.2
TbFe Re10.8 1.2
HoFe Re10.8 1.2
Fig. 512. RFe10.8Re1.2. R = Y, Tb, Ho. Magnetic field dependence of σ at 77 K [90J1].
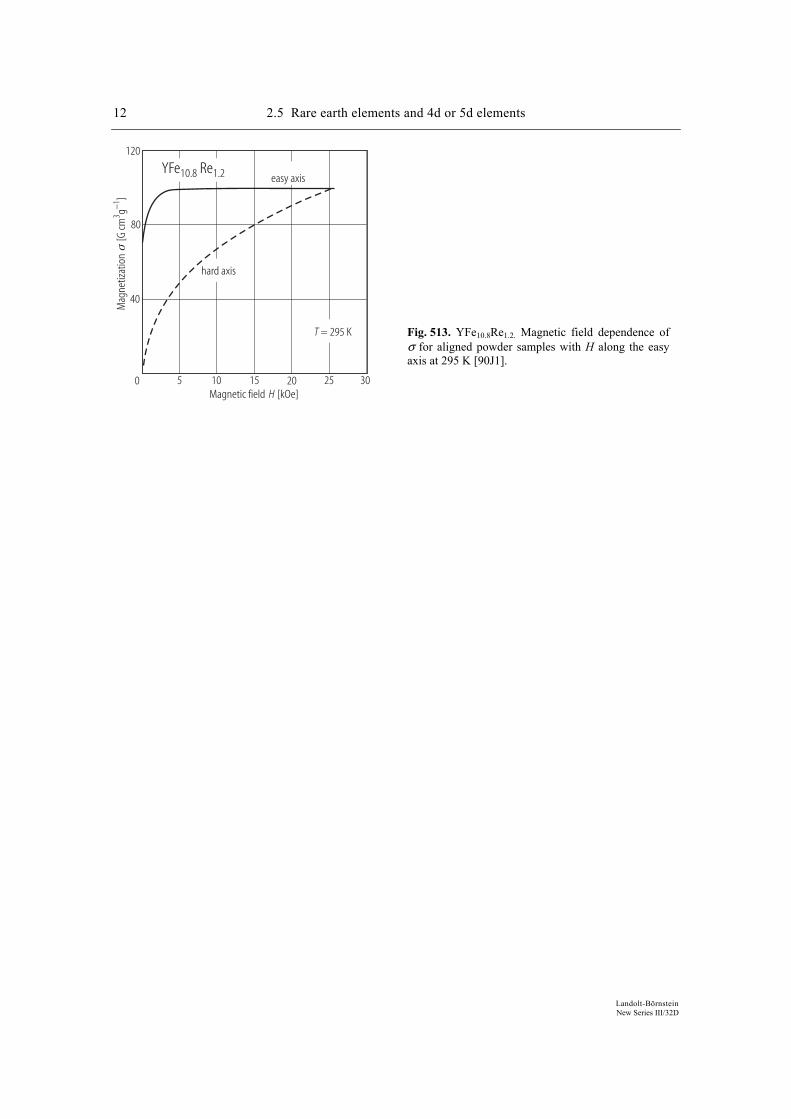
12 2.5 Rare earth elements and 4d or 5d elements
Landolt-Börnstein New Series III/32D
Mag
netiz
atio
n
[G cm
g]
31−
Magnetic field [kOe]H
120
80
40
0 5 10 15 20 25
YFe Re10.8 1.2
T = 295 K
30
easy axis
hard axis
Fig. 513. YFe10.8Re1.2. Magnetic field dependence of σ for aligned powder samples with H along the easy axis at 295 K [90J1].
References
90J1 Jurczyk, M.: J. Magn. Magn. Mater. 89 (1990) L5 96N1 Nikiforov, V.N., Koksharov, Yu.A., Mirkovic, J., Kochetkov, Yu.V.: J. Magn. Magn. Mater.
163 (1996) 184 97B4 Buschinger, B., Geibel, C., Weiden, M., Dietrich, C., Cordier, G., Olesch, G., Kohler, J.: J.
Alloys Comp. 260 (1997) 44 97K1 Kitagawa, J., Takeda, N., Ishikawa, W.: J. Alloys Comp. 256 (1997) 48 97K3 Kitakawa, J., Takeda, N., Ishikawa, M., Ishiguro, A., Komatsubara, T.: Physica B 230-232
(1997) 139 97T2 Takeda, N., Kitagawa, J., Ishikawa, M.: Physica B 230-232 (1997) 145 97T3 Thiede, V.M.T., Gerdes, M.H., Rodewald, U.Ch., Jeitschko, W.: J. Alloys Comp. 261 (1997)
54 98B2 Buschinger, B., Trovarrelli, O., Weiden, M., Geibel, C., Steglich, F.: J. Alloys Comp. 275-277
(1998) 633
354 2.7 Compounds of rare earth elements and Be, Mg, Zn, Cd, or Hg [Ref. p. 404
Landolt-Börnstein New Series III/32D
2.7 Compounds of rare earth elements and Be, Mg, Zn, Cd, or Hg
2.7.1 Introduction
The present work is a continuation of the previous review of Morin in the same series [89M1]. General considerations about crystallography, metallurgy and basic magnetic couplings have then been omitted to avoid redundancy. As far as the ternary compounds are concerned, only non magnetic alloyed atoms have been considered. This allowed us to focus ourselves to the fundamental aspects of the only 4f magnetism, as for the binary systems. The importance of studies on monocrystalline materials has been still growing (see subsects. 2.7.2 and 2.7.3). Besides, new series have been elaborated and magnetically characterized on polycrystalline samples. Some particular series or compounds such as the RX and RX2 series have been detailed elsewhere (Table 1). In the present review, the same organization as the previous one has been followed, i.e. compounds are successively presented according to their stoichiometry. Subsects. 2.7.2 to 2.7.5 are then devoted to the RX, RX2, R2X17 and RBe13 series, respectively. Other X-rich compounds are gathered in subsect. 2.7.6 while the ternary systems are considered in subsect. 2.7.7. Table 1. General reviews.
Subject Reference
Compounds of RE and Be, Mg, Zn, Cd, Hg 89M1 Quadrupolar interactions 90M1 Metamagnetism in intermetallic systems 95G2 Magnetic properties of rare earth compounds 97G1 Thermodynamic data of rare earth alloys 94C1 High pressure studies of anomalous Ce and Yb compounds 94T1
2.7.2 RX compounds
The main studies performed on these cubic CsCl-type compounds are devoted to the Mg and Zn series, and more particularly to measurements carried out on single crystals or under hydrostatic pressure (Figs. 1 - 28). Using single crystals allows one to obtain very specific information on the magnetic couplings, the effects of which may strongly depend on the direction under investigation because of the presence of magnetocrystalline anisotropy. On the other hand, many previous studies have shown the importance of magnetoelastic and two-ion quadrupolar interactions in these series [90M1]. Applying a pressure then leads to influence the magnetic properties through the magnetoelasticity. This effect is especially important in cerium compounds, owing to the weakly localized character of the 4f electron which may give rise to Kondo or heavy fermion behaviour [92C1]. The role of the 5d conduction electrons in the pressure dependence of the exchange interactions has been also investigated in GdMg and GdZn compounds through band structure calculations [96B2]. As far as the two-ion quadrupolar interactions are concerned, the main previous studies were limited to ferroquadrupolar-type couplings, in the RZn series and the Tm-based compounds [89M1]. Later, they have been extended to CeMg and CeZn compounds (Table 2). In more recent works, antiferroquadrupolar interactions have been thoroughly investigated, through their effects on the antiferromagnetic moment arrangements. In particular, it has been shown that multiaxial (non collinear) structures can be stabilized by this type of coupling, even under an external field [95A1, 96A1]. Finally, some progress has been realized about the structural transformations in the RCd series (Figs. 29 - 32) [87K1].
References
89M1 Morin, P., in: Magnetic Properties of Metals (Wijn, H.P.J., ed.), Landolt-Börnstein, New Series, Berlin, Heidelberg, New York: Springer, Vol. 19e2 1989, p. 1
90M1 Morin, P., Schmitt, D., in: Ferromagnetic Materials (Buschow, K.H.J., Wohlfarth, E.P., eds.), Amsterdam: North-Holland, Vol. 5 1990, Chap. 1, p. 1
94C1 Colinet, C., Pasturel, A., in: Handbook on the Physics and Chemistry of Rare Earths (Gschneidner Jr., K.A., Eyring, L., Lander, G.H., Choppin, G.R., eds.), Amsterdam: Elsevier, Vol. 19 1994, Chap. 134, p. 479
94T1 Thompson, J.D., Lawrence, J.M., in: Handbook on the Physics and Chemistry of Rare Earths (Gschneidner Jr., K.A., Eyring, L., Lander, G.H., Choppin, G.R., eds.), Amsterdam: Elsevier, Vol. 19 1994, Chap. 133, p. 383
95G2 Gignoux, D., Schmitt, D., in: Handbook on the Physics and Chemistry of Rare Earths (Gschneidner Jr., K.A., Eyring, L., eds.), Amsterdam: Elsevier, Vol. 20 1995, Chap. 138, p. 293
97G1 Gignoux, D., Schmitt, D., in: Handbook of Magnetic Materials (Buschow, K.H.J., ed.), Amsterdam: Elsevier, Vol. 10 1997, Chap. 2, p. 239

354 2.7 Compounds of rare earth elements and Be, Mg, Zn, Cd, or Hg [Ref. p. 404
Landolt-Börnstein New Series III/32D
2.7 Compounds of rare earth elements and Be, Mg, Zn, Cd, or Hg
2.7.1 Introduction
The present work is a continuation of the previous review of Morin in the same series [89M1]. General considerations about crystallography, metallurgy and basic magnetic couplings have then been omitted to avoid redundancy. As far as the ternary compounds are concerned, only non magnetic alloyed atoms have been considered. This allowed us to focus ourselves to the fundamental aspects of the only 4f magnetism, as for the binary systems. The importance of studies on monocrystalline materials has been still growing (see subsects. 2.7.2 and 2.7.3). Besides, new series have been elaborated and magnetically characterized on polycrystalline samples. Some particular series or compounds such as the RX and RX2 series have been detailed elsewhere (Table 1). In the present review, the same organization as the previous one has been followed, i.e. compounds are successively presented according to their stoichiometry. Subsects. 2.7.2 to 2.7.5 are then devoted to the RX, RX2, R2X17 and RBe13 series, respectively. Other X-rich compounds are gathered in subsect. 2.7.6 while the ternary systems are considered in subsect. 2.7.7. Table 1. General reviews.
Subject Reference
Compounds of RE and Be, Mg, Zn, Cd, Hg 89M1 Quadrupolar interactions 90M1 Metamagnetism in intermetallic systems 95G2 Magnetic properties of rare earth compounds 97G1 Thermodynamic data of rare earth alloys 94C1 High pressure studies of anomalous Ce and Yb compounds 94T1
2.7.2 RX compounds
The main studies performed on these cubic CsCl-type compounds are devoted to the Mg and Zn series, and more particularly to measurements carried out on single crystals or under hydrostatic pressure (Figs. 1 - 28). Using single crystals allows one to obtain very specific information on the magnetic couplings, the effects of which may strongly depend on the direction under investigation because of the presence of magnetocrystalline anisotropy. On the other hand, many previous studies have shown the importance of magnetoelastic and two-ion quadrupolar interactions in these series [90M1]. Applying a pressure then leads to influence the magnetic properties through the magnetoelasticity. This effect is especially important in cerium compounds, owing to the weakly localized character of the 4f electron which may give rise to Kondo or heavy fermion behaviour [92C1]. The role of the 5d conduction electrons in the pressure dependence of the exchange interactions has been also investigated in GdMg and GdZn compounds through band structure calculations [96B2]. As far as the two-ion quadrupolar interactions are concerned, the main previous studies were limited to ferroquadrupolar-type couplings, in the RZn series and the Tm-based compounds [89M1]. Later, they have been extended to CeMg and CeZn compounds (Table 2). In more recent works, antiferroquadrupolar interactions have been thoroughly investigated, through their effects on the antiferromagnetic moment arrangements. In particular, it has been shown that multiaxial (non collinear) structures can be stabilized by this type of coupling, even under an external field [95A1, 96A1]. Finally, some progress has been realized about the structural transformations in the RCd series (Figs. 29 - 32) [87K1].
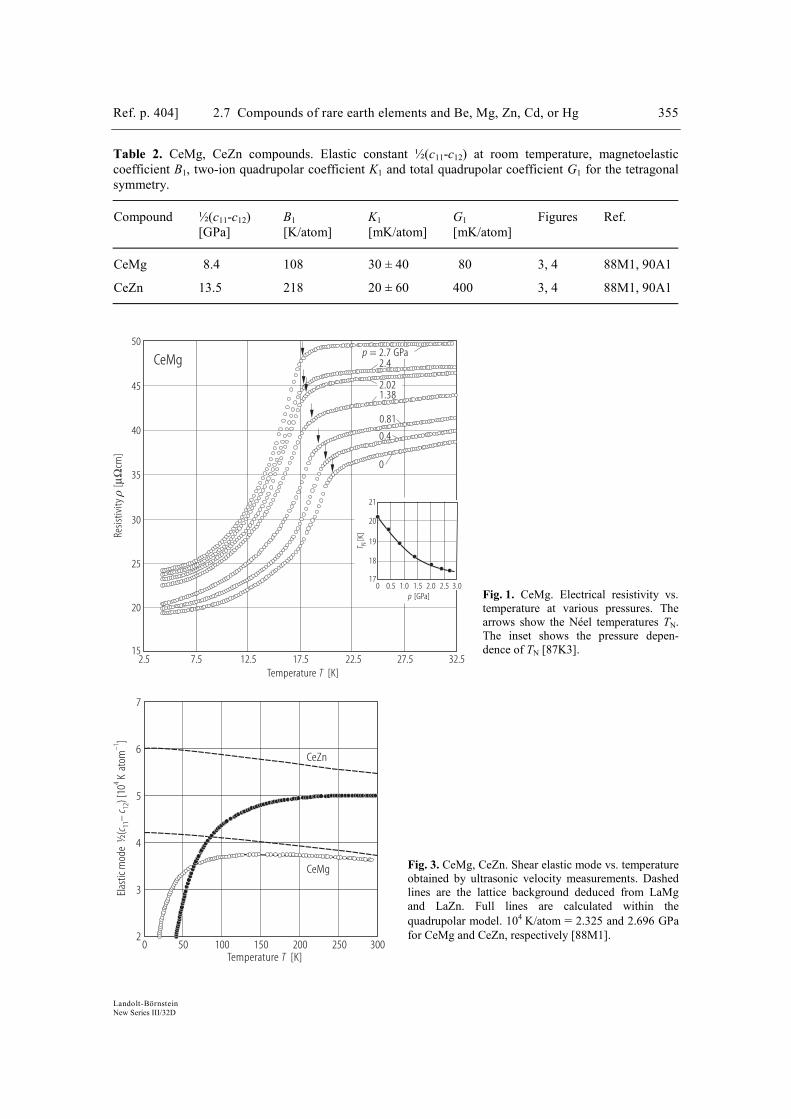
Ref. p. 404] 2.7 Compounds of rare earth elements and Be, Mg, Zn, Cd, or Hg 355
Landolt-Börnstein New Series III/32D
Table 2. CeMg, CeZn compounds. Elastic constant ½(c11-c12) at room temperature, magnetoelastic coefficient B1, two-ion quadrupolar coefficient K1 and total quadrupolar coefficient G1 for the tetragonal symmetry.
Compound ½(c11-c12) [GPa]
B1 [K/atom]
K1 [mK/atom]
G1 [mK/atom]
Figures Ref.
CeMg 8.4 108 30 ± 40 80 3, 4 88M1, 90A1
CeZn 13.5 218 20 ± 60 400 3, 4 88M1, 90A1
2.5 7.5 12.5 17.5 22.5 27.5 32.515
20
25
50
30
35
45
40
Resis
tivity
[cm
]ρ
µΩ
Temperature [K]T
T N[K
]
1.0 1.50.5p [GPa]
0 2.0 3.0
21
19
2.5
20
18
17
CeMgp = 2.7 GPa
2.4
2.021.38
0.81
0.4
0
Elas
tic m
ode
½(
–) [
10K
atom
]c
c11
124
–1
3
4
5
6
7
Temperature [K]T0 50 100 150 200 250 300
2
CeZn
CeMg
Fig. 1. CeMg. Electrical resistivity vs. temperature at various pressures. The arrows show the Néel temperatures TN. The inset shows the pressure depen-dence of TN [87K3].
Fig. 3. CeMg, CeZn. Shear elastic mode vs. temperature obtained by ultrasonic velocity measurements. Dashed lines are the lattice background deduced from LaMg and LaZn. Full lines are calculated within the quadrupolar model. 104 K/atom = 2.325 and 2.696 GPa for CeMg and CeZn, respectively [88M1].
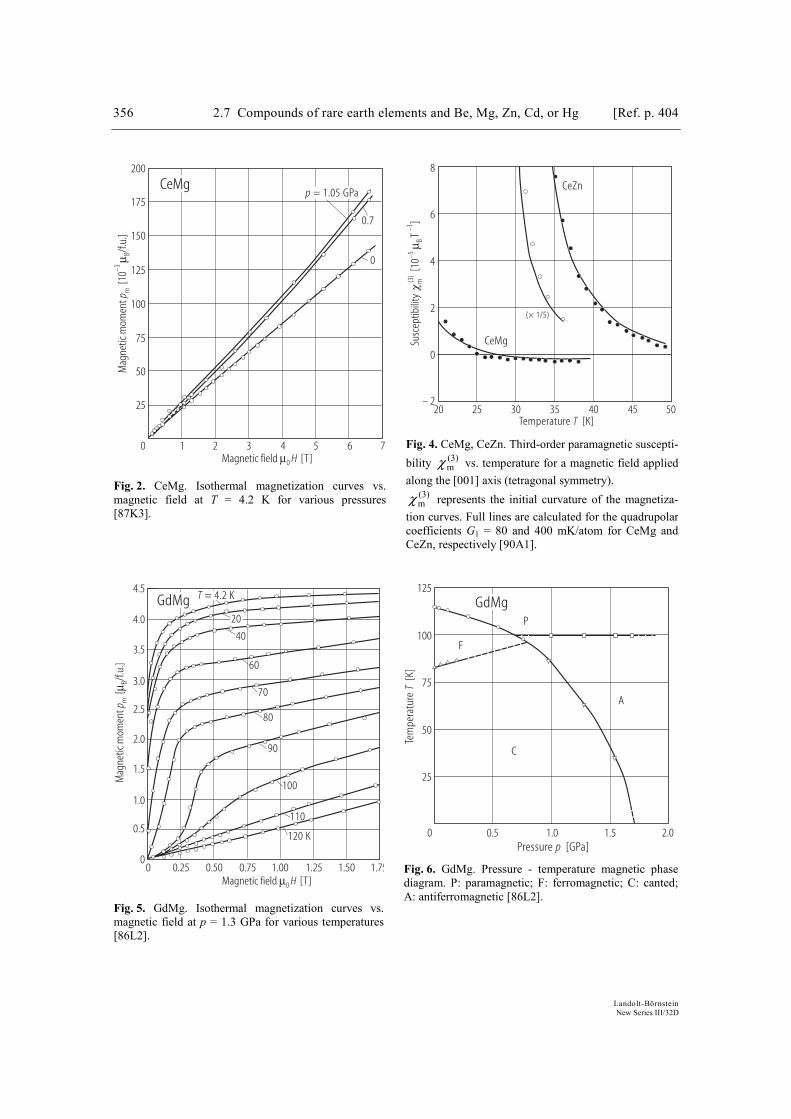
356 2.7 Compounds of rare earth elements and Be, Mg, Zn, Cd, or Hg [Ref. p. 404
Landolt-Börnstein New Series III/32D
0 1 2 3 4 65 7Magnetic field [T]µ0 H
Mag
netic
mom
ent
[10
/f.u.
]p m
B–3
µ
25
50
75
100
125
150
175
200
CeMgp = 1.05 GPa
0.7
0
Fig. 2. CeMg. Isothermal magnetization curves vs.magnetic field at T = 4.2 K for various pressures[87K3].
Susc
eptib
ility
[10
]χ m(3
)–5
–1µ B
T
0
2
4
6
8
Temperature [K]T20 25 30 35 40 45 50
– 2
CeZn
(× 1/5)
CeMg
Fig. 4. CeMg, CeZn. Third-order paramagnetic suscepti-bility (3)
mχ vs. temperature for a magnetic field applied along the [001] axis (tetragonal symmetry).
(3)mχ represents the initial curvature of the magnetiza-
tion curves. Full lines are calculated for the quadrupolar coefficients G1 = 80 and 400 mK/atom for CeMg and CeZn, respectively [90A1].
Magnetic field [T]µ0 H
Mag
netic
mom
ent
[/f.
u.]
p mBµ
0.5
1.0
4.5
3.5
1.5
4.0
2.0
2.5
0
3.0
0 0.25 0.50 1.000.75 1.25 1.50 1.75
GdMg T = 4.2 K
20
40
60
70
80
90
100
110
120 K
Fig. 5. GdMg. Isothermal magnetization curves vs.magnetic field at p = 1.3 GPa for various temperatures[86L2].
0 0.5 1.0 1.5 2.0
Tem
pera
ture
[K]
T
25
50
75
100
125
Pressure [GPa]p
GdMgP
A
C
F
Fig. 6. GdMg. Pressure - temperature magnetic phase diagram. P: paramagnetic; F: ferromagnetic; C: canted; A: antiferromagnetic [86L2].
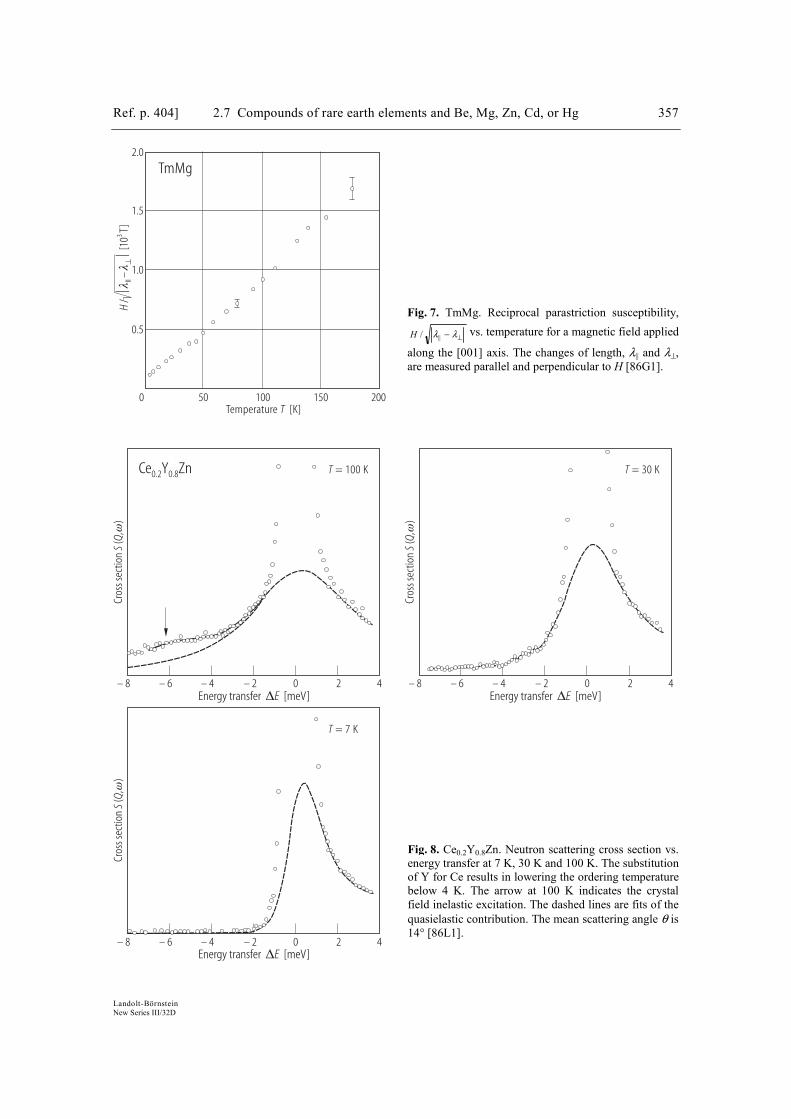
Ref. p. 404] 2.7 Compounds of rare earth elements and Be, Mg, Zn, Cd, or Hg 357
Landolt-Börnstein New Series III/32D
H/
–[1
0T]
λλ
II⊥
3
0 50 100 150 200Temperature [K]T
0.5
1.0
1.5
2.0
TmMg
Fig. 7. TmMg. Reciprocal parastriction susceptibility,
⊥− λλ||/H vs. temperature for a magnetic field applied
along the [001] axis. The changes of length, λ|| and λ⊥, are measured parallel and perpendicular to H [86G1].
Cros
s sec
tion
(,
)S
Qω
Energy transfer [meV]∆E– 8 – 6 – 4 – 2 0 2 4
Cros
s sec
tion
(,
)S
Qω
Energy transfer [meV]∆E– 8 – 6 – 4 – 2 0 2 4
Cros
s sec
tion
(,
)S
Qω
Energy transfer [meV]∆E– 8 – 6 – 4 – 2 0 2 4
Ce Y Zn0.2 0.8 T = 100 K T = 30 K
T = 7 K
Fig. 8. Ce0.2Y0.8Zn. Neutron scattering cross section vs. energy transfer at 7 K, 30 K and 100 K. The substitution of Y for Ce results in lowering the ordering temperature below 4 K. The arrow at 100 K indicates the crystal field inelastic excitation. The dashed lines are fits of the quasielastic contribution. The mean scattering angle θ is 14° [86L1].
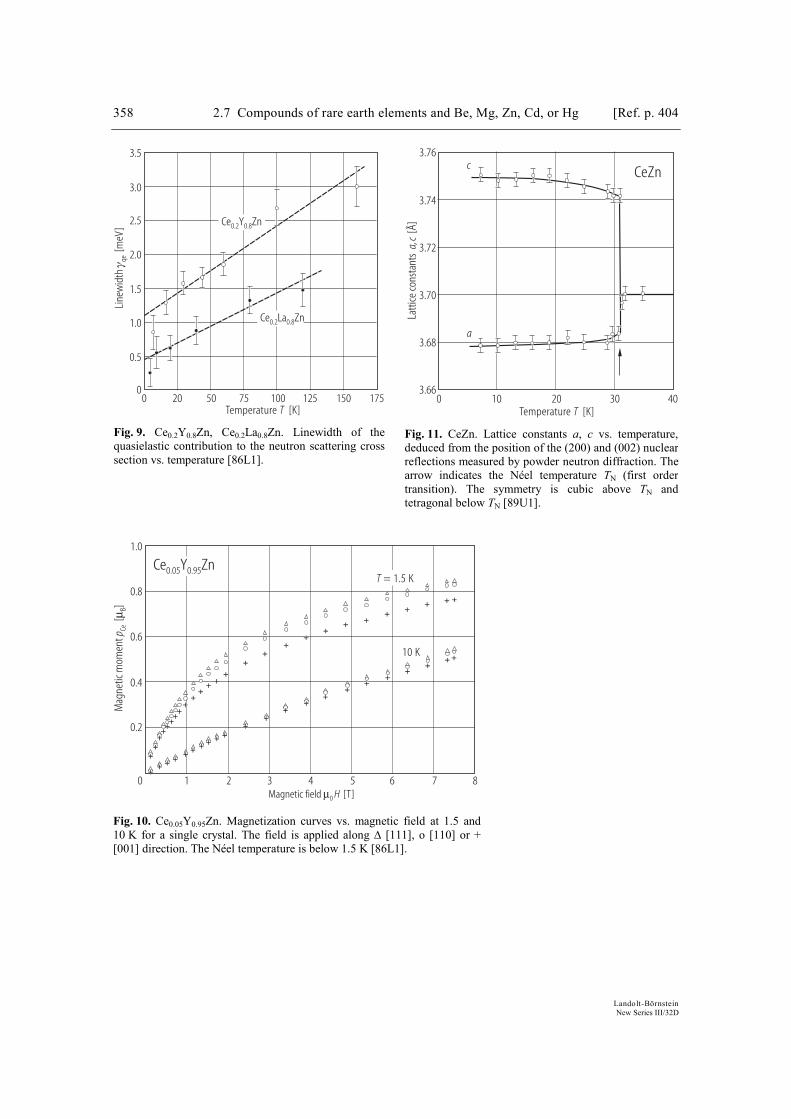
358 2.7 Compounds of rare earth elements and Be, Mg, Zn, Cd, or Hg [Ref. p. 404
Landolt-Börnstein New Series III/32D
Line
wid
th[m
eV]
γ qe
0
0.5
1.0
1.5
2.0
2.5
3.0
3.5
0 20 50 75 100 125 175Temperature [K]T
150
Ce Y Zn0.2 0.8
Ce La Zn0.2 0.8
Fig. 9. Ce0.2Y0.8Zn, Ce0.2La0.8Zn. Linewidth of the quasielastic contribution to the neutron scattering cross section vs. temperature [86L1].
0 10 20 30 40La
ttice
cons
tant
s[Å
]a,
c
3.66
3.68
3.70
3.72
3.74
3.76
Temperature [K]T
c CeZn
a
Fig. 11. CeZn. Lattice constants a, c vs. temperature, deduced from the position of the (200) and (002) nuclear reflections measured by powder neutron diffraction. The arrow indicates the Néel temperature TN (first order transition). The symmetry is cubic above TN and tetragonal below TN [89U1].
0 1 2 3 4 5 8
1.0
Magnetic field [T]µ0 H
Mag
netic
mom
ent
[]
p CeBµ
0.2
0.4
0.8
0.6
6 7
Ce Y Zn0.05 0.95T = 1.5 K
10 K
Fig. 10. Ce0.05Y0.95Zn. Magnetization curves vs. magnetic field at 1.5 and 10 K for a single crystal. The field is applied along ∆ [111], o [110] or + [001] direction. The Néel temperature is below 1.5 K [86L1].
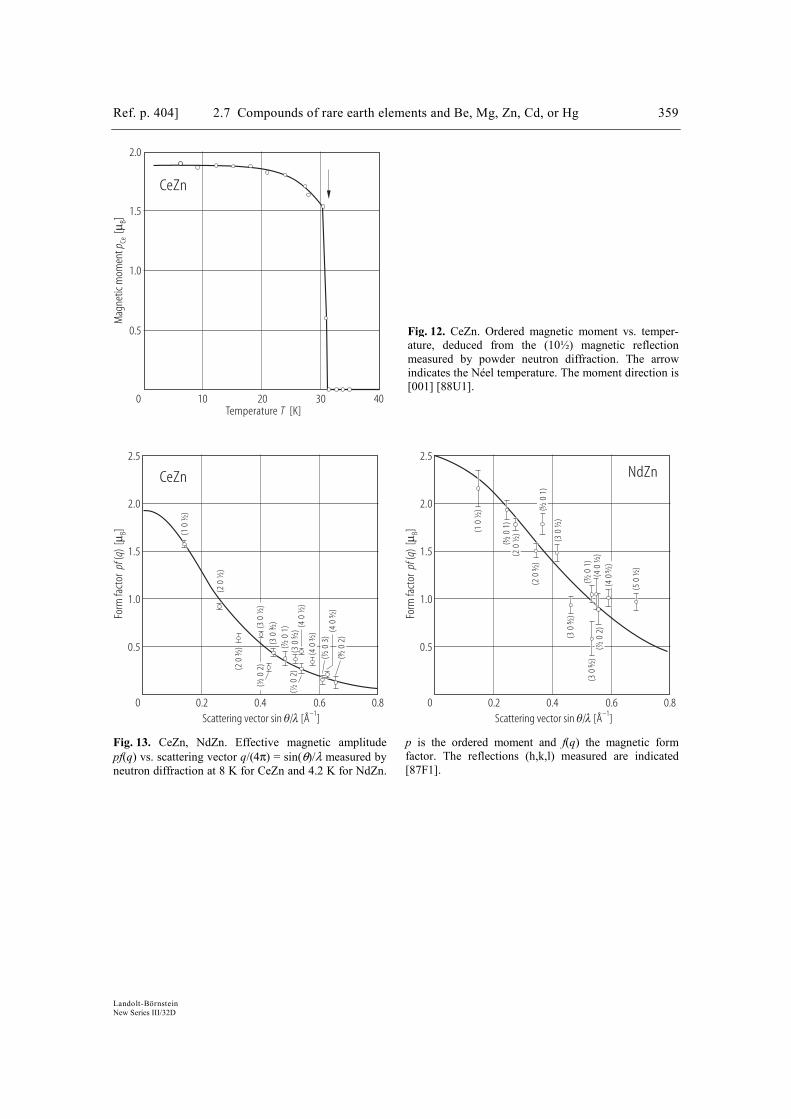
Ref. p. 404] 2.7 Compounds of rare earth elements and Be, Mg, Zn, Cd, or Hg 359
Landolt-Börnstein New Series III/32D
Mag
netic
mom
ent
[]
p CeBµ
0 10 20 30 40Temperature [K]T
0.5
1.0
1.5
2.0
CeZn
Scattering vector sin [Å ]θ/λ –10
0.5
0.2 0.4 0.6 0.8
1.0
1.5
2.0
2.5
0
0.5
0.2 0.4 0.6 0.8
1.0
1.5
2.0
2.5
Form
fact
or(
)[
]pf
qµ B
CeZn
Form
fact
or(
)[
]pf
qµ B
Scattering vector sin [Å ]θ/λ –1
NdZn
(10
½)
(20
½)
(20
½)
3
(30
½)
(½0
2)5
(½0
1)7
(40
½)
5(½
03)
7(40
½)
3
(½0
2)7
(40
½)
(30
½)
3
(½0
2)9
(30
½)
5
(10
½)
(50
½)
(30
½)
(½0
1)5
(30
½)
5
(½0
1)7
(40
½)
5(½
02)
7(4
0½
)
(20
½)
3
(30
½)
5
(½0
1)3
(20
½)
2
Fig. 13. CeZn, NdZn. Effective magnetic amplitude pf(q) vs. scattering vector q/(4π) = sin(θ)/λ measured by neutron diffraction at 8 K for CeZn and 4.2 K for NdZn.
p is the ordered moment and f(q) the magnetic form factor. The reflections (h,k,l) measured are indicated [87F1].
Fig. 12. CeZn. Ordered magnetic moment vs. temper-ature, deduced from the (10½) magnetic reflection measured by powder neutron diffraction. The arrow indicates the Néel temperature. The moment direction is [001] [88U1].
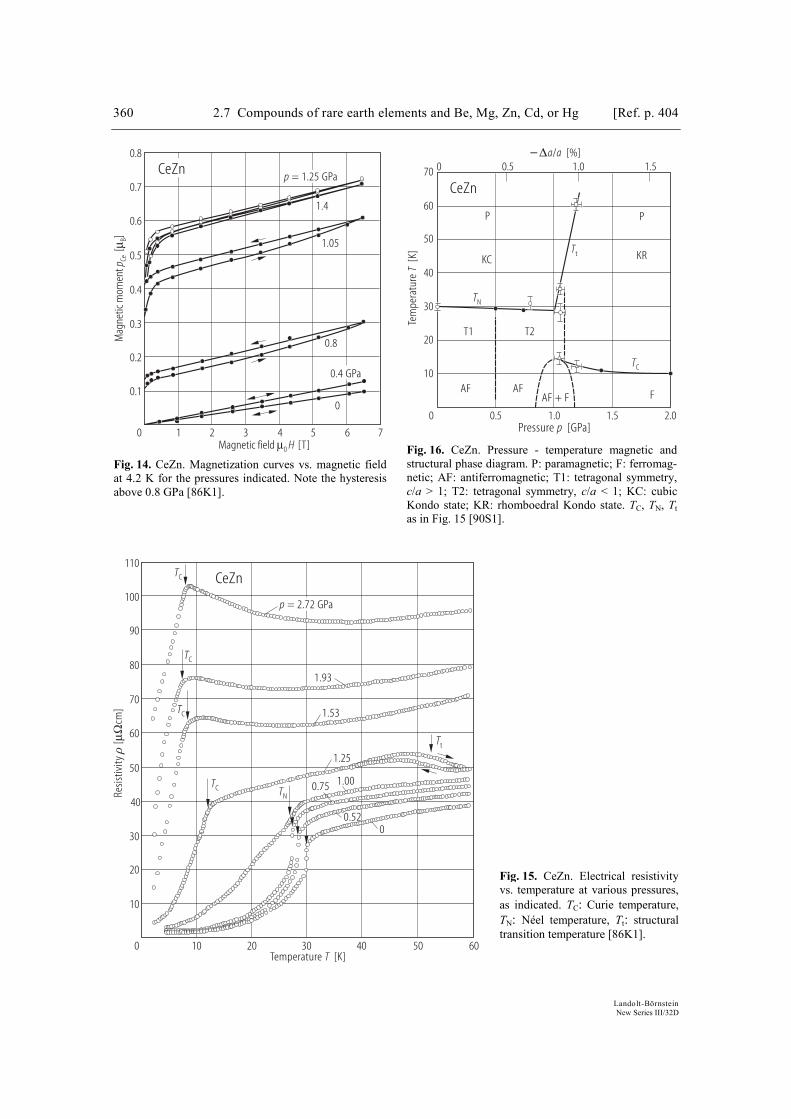
360 2.7 Compounds of rare earth elements and Be, Mg, Zn, Cd, or Hg [Ref. p. 404
Landolt-Börnstein New Series III/32D
Mag
netic
mom
ent
[]
p CeBµ
0 1 2 3 4 65 7Magnetic field [T]µ0 H
0.1
0.2
0.3
0.4
0.5
0.6
0.7
0.8
0
0.4 GPa
0.8
1.05
1.4
p = 1.25 GPaCeZn
Fig. 14. CeZn. Magnetization curves vs. magnetic field at 4.2 K for the pressures indicated. Note the hysteresis above 0.8 GPa [86K1].
0 0.5 1.0 1.5 2.0
10
20
30
40
50
60
70
Pressure [GPa]pTe
mpe
ratu
re[K
]T
0 0.5 1.0 1.5−∆a a/ [%]
P P
KRKC
T1 T2
AF AFAF + F F
TN
TC
Tt
CeZn
Fig. 16. CeZn. Pressure - temperature magnetic and structural phase diagram. P: paramagnetic; F: ferromag-netic; AF: antiferromagnetic; T1: tetragonal symmetry, c/a > 1; T2: tetragonal symmetry, c/a < 1; KC: cubic Kondo state; KR: rhomboedral Kondo state. TC, TN, Ttas in Fig. 15 [90S1].
0 10 20 30 40 50 60
Resis
tivity
[cm
]ρ
µΩ
Temperature [K]T
10
40
20
60
50
30
70
90
80
100
110
TN
TC
TC
TC
TC1.000.75
0.520
1.25
Tt
1.53
1.93
p = 2.72 GPa
CeZn
Fig. 15. CeZn. Electrical resistivity vs. temperature at various pressures, as indicated. TC: Curie temperature, TN: Néel temperature, Tt: structural transition temperature [86K1].
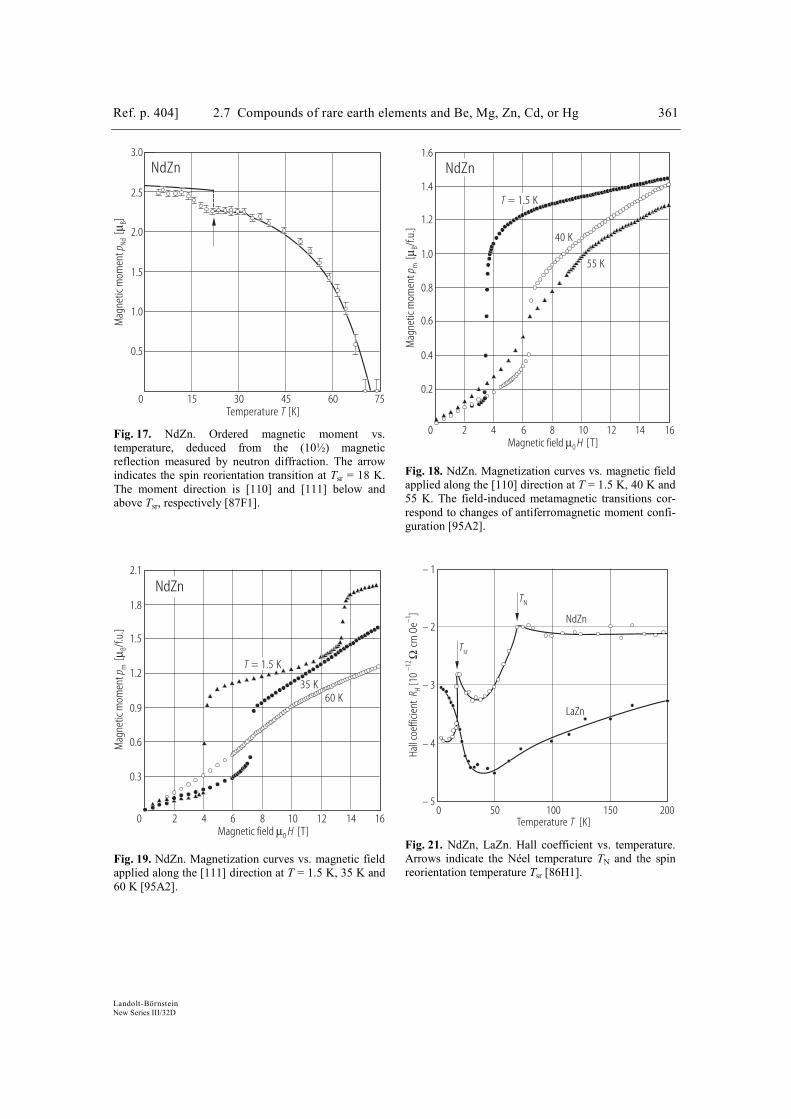
Ref. p. 404] 2.7 Compounds of rare earth elements and Be, Mg, Zn, Cd, or Hg 361
Landolt-Börnstein New Series III/32D
0.5
1.0
1.5
2.0
2.5
3.0
0 15 30 45 60 75Temperature [K]T
Mag
netic
mom
ent
[]
p NdBµ
NdZn
Fig. 17. NdZn. Ordered magnetic moment vs.temperature, deduced from the (10½) magnetic reflection measured by neutron diffraction. The arrowindicates the spin reorientation transition at Tsr = 18 K. The moment direction is [110] and [111] below andabove Tsr, respectively [87F1].
0.6
1.2
0.2
0.8
1.4
0.4
1.0
1.6
0 2 4 6 8 12 1410 16
Mag
netic
mom
ent
[/f.
u.]
p mBµ
Magnetic field [T]µ0 H
T = 1.5 K
40 K
55 K
NdZn
Fig. 18. NdZn. Magnetization curves vs. magnetic field applied along the [110] direction at T = 1.5 K, 40 K and 55 K. The field-induced metamagnetic transitions cor-respond to changes of antiferromagnetic moment confi-guration [95A2].
0.3
0.6
0.9
1.2
1.5
1.8
2.1
0 2 4 8 10 12 166 14Magnetic field [T]µ0 H
NdZn
Mag
netic
mom
ent
[/f.
u.]
p mBµ
T = 1.5 K
35 K60 K
Fig. 19. NdZn. Magnetization curves vs. magnetic fieldapplied along the [111] direction at T = 1.5 K, 35 K and60 K [95A2].
Hall
coef
ficie
nt[1
0cm
Oe
]R H
–12
–1Ω
0 50 100 150 200Temperature [K]T
– 5
– 4
– 3
– 2
– 1
TN
Tsr
NdZn
LaZn
Fig. 21. NdZn, LaZn. Hall coefficient vs. temperature. Arrows indicate the Néel temperature TN and the spin reorientation temperature Tsr [86H1].
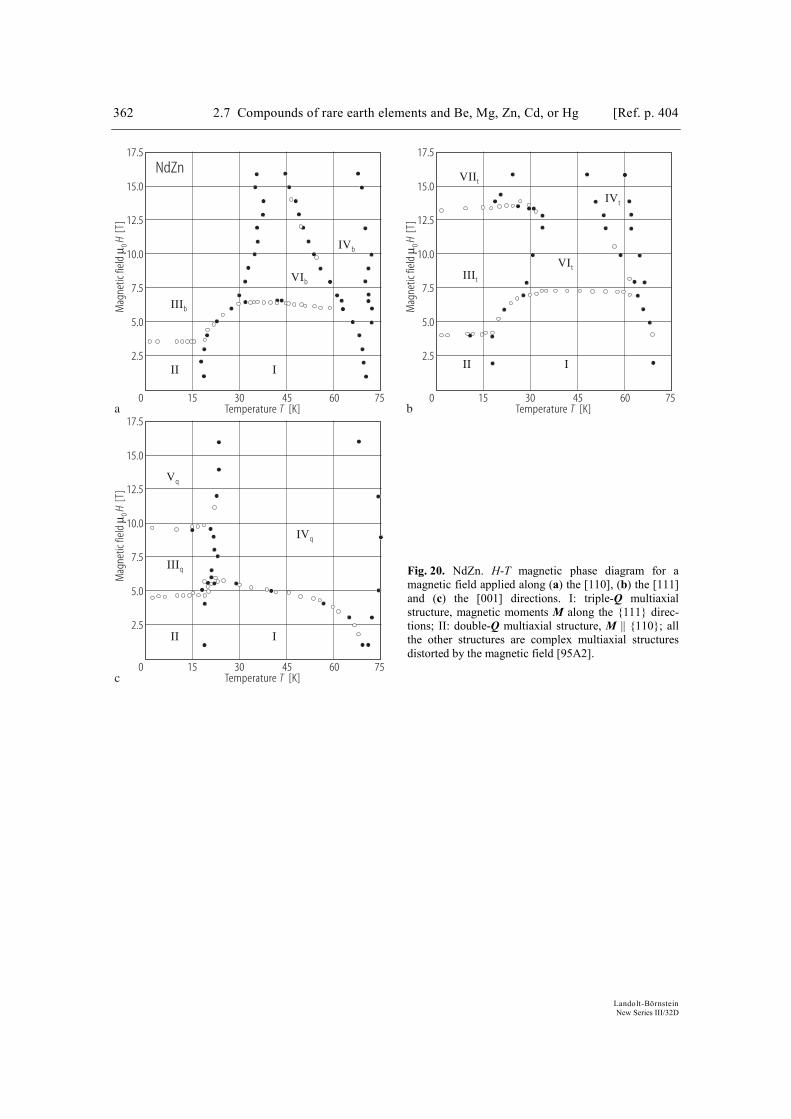
362 2.7 Compounds of rare earth elements and Be, Mg, Zn, Cd, or Hg [Ref. p. 404
Landolt-Börnstein New Series III/32D
0 15 30 45 60 75
Mag
netic
fiel
d[T
]µ 0
H
Temperature [K]T
2.5
5.0
7.5
10.0
12.5
15.0
17.5
0 15 30 45 60 75M
agne
tic fi
eld
[T]
µ 0H
Temperature [K]T
2.5
5.0
7.5
10.0
12.5
15.0
17.5
0 15 30 45 60 75
Mag
netic
fiel
d[T
]µ 0
H
Temperature [K]T
2.5
5.0
7.5
10.0
12.5
15.0
17.5a b
c
NdZn
IIIb
VIb
IVb
II I
IIIt
VIt
IVt
II I
VIIt
IIIq
Vq
IVq
II I
Fig. 20. NdZn. H-T magnetic phase diagram for a magnetic field applied along (a) the [110], (b) the [111] and (c) the [001] directions. I: triple-Q multiaxial structure, magnetic moments M along the 111 direc-tions; II: double-Q multiaxial structure, M || 110; all the other structures are complex multiaxial structures distorted by the magnetic field [95A2].
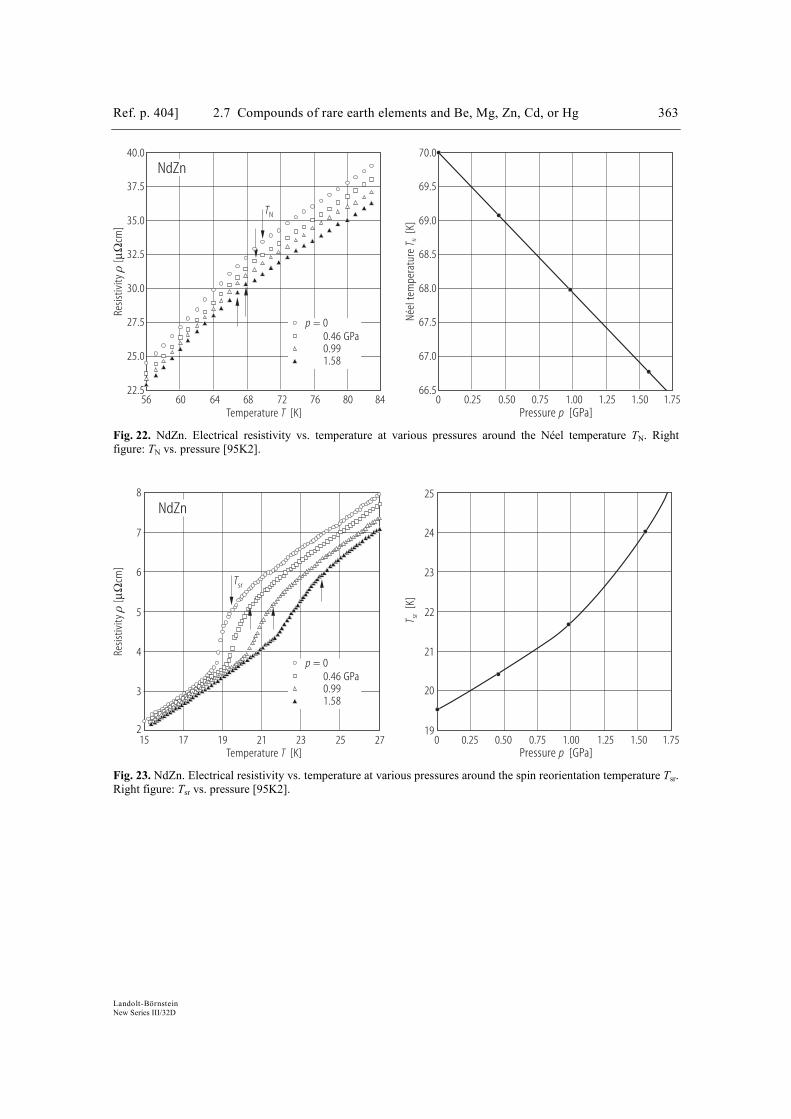
Ref. p. 404] 2.7 Compounds of rare earth elements and Be, Mg, Zn, Cd, or Hg 363
Landolt-Börnstein New Series III/32D
56 60 64 68 72 76 80 8422.5
25.0
27.5
30.0
32.5
35.0
37.5
40.0
Temperature [K]T
Resis
tivity
[cm
]ρ
µΩ
0 0.25 0.50 0.75 1.00 1.25 1.50 1.7566.5
67.0
67.5
68.0
68.5
69.0
69.5
70.0
Pressure [GPa]pNé
elte
mpe
ratu
re[K
]T N
TN
NdZn
p = 00.46 GPa0.991.58
Fig. 22. NdZn. Electrical resistivity vs. temperature at various pressures around the Néel temperature TN. Right figure: TN vs. pressure [95K2].
15 27
3
2
8
4
5
6
7
17 19 21 23 25Temperature [K]T
Resis
tivity
[cm
]ρ
µΩ
Pressure [GPa]p
[K]
T sr
19
21
23
25
20
22
24
0 0.25 0.50 1.000.75 1.25 1.50 1.75
Tsr
NdZn
p = 00.46 GPa0.991.58
Fig. 23. NdZn. Electrical resistivity vs. temperature at various pressures around the spin reorientation temperature Tsr. Right figure: Tsr vs. pressure [95K2].

364 2.7 Compounds of rare earth elements and Be, Mg, Zn, Cd, or Hg [Ref. p. 404
Landolt-Börnstein New Series III/32D
Ther
moe
lect
ricpo
wer
[V
K]
Qµ
–1
–15.0
–12.5
–10.0
–7.5
–5.0
–2.5
2.5
0 50 100 150 200 250 300Temperature [K]T
0TC
GdZn
Fig. 24. GdZn. Thermoelectric power referred to copper vs. temperature. TC is the Curie temperature [88P1].
0 50 100 150 200 250Temperature [K]T
TC
TbZn
Tsr
Ther
moe
lect
ricpo
wer
[V
K]
Qµ
–1
–20.0
–10.0
–5.0
0
5
–15.0
Fig. 26. TbZn. Thermoelectric power referred to copper vs. temperature. TC is the Curie temperature, Tsr the spin reorientation temperature. The moment direction is [110] and [001] below and above Tsr, respectively [88P1].
150.0
187.5
225.0
262.5
300.0–0.20
–0.15
–0.10
–0.05
–405
0
–400
–410
–395
Distance [Å]dGd-Gd
∂∂
H/
pi
[kOe
kba
r]
–1
3.60 3.63 3.66 3.69 3.72 3.75
–390
GdZn GdHg GdCd
3.70
157Gd
H i[k
Oe]
T C[K
]
157Gd
Fig. 25. GdZn, GdHg, GdCd. Effective magnetic field Hi(Gd), its pressure derivative and Curie temperature TCvs. next-nearest Gd-Gd distance, obtained by high pressure NMR measurements [87K2].
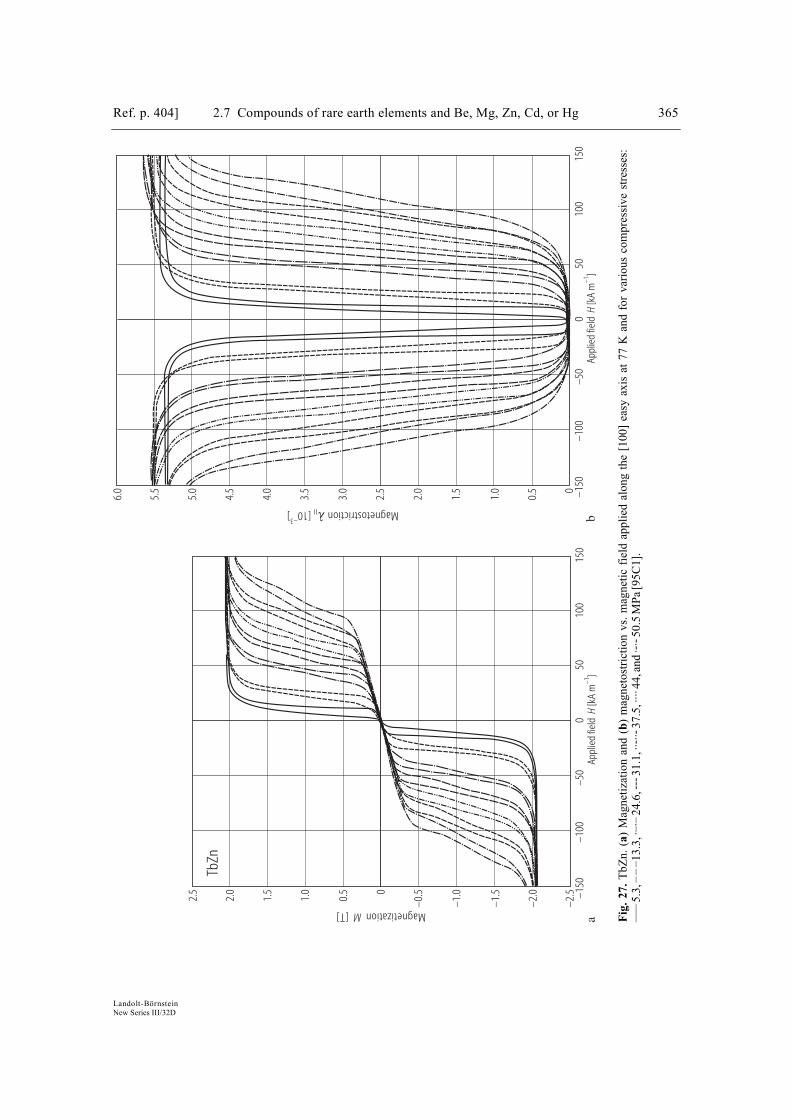
Ref. p. 404] 2.7 Compounds of rare earth elements and Be, Mg, Zn, Cd, or Hg 365
Landolt-Börnstein New Series III/32D
–150
–100
–50
050
100
150
–2.5
–2.0
–1.5
–0.5
–1.00
0.5
Appl
ied
field
[kA
m]
H–1
Magnetization[T] M
1.0
1.5
2.0
2.5
–150
–100
–50
050
100
150
0
0.5
1.0
2.0
1.5
2.5
3.0
Appl
ied
field
[kA
m]
H–1
Magnetostriction[10] lII–3
3.5
4.0
4.5
5.0
5.5
6.0
ab
TbZn
Fig
.27.
ab
TbZ
n.
()
Mag
net
izat
ion
and
()
mag
net
ost
rict
ion
vs.
mag
net
icfi
eld
appli
edal
ong
the
[100]
easy
axis
at77
Kan
dfo
rvar
ious
com
pre
ssiv
est
ress
es:
–––
5.3
,––
–13.3
,·–·–
24.6
,---
31.1
,··-
··-37.5
,····4
4,a
nd
·-·-
50.5
MP
a[9
5C
1].

366 2.7 Compounds of rare earth elements and Be, Mg, Zn, Cd, or Hg [Ref. p. 404
Landolt-Börnstein New Series III/32D
X Γ M R–4
–3
–2
0
–1
1
3
2
4
Qzz
() [
10]
q2
K
X Γ M R
DyZn
M
M'
X
X'
3.75
Latti
ce p
aram
eter
s[Å
]
0 50 100 150 200 250Temperature [K]T
3.91
3.87
3.83
3.79
3.95c
a
a'/2 2√
c'/2
b'/3 2√
a0
CeCd
Tt2
Tt1
Fig. 28. DyZn. Ab-initio calculated Fourier transform θzz*(q) = 1/3J(J+1) Jzz(q) of the two-ion anisotropic bilinear exchange coupling constants Jzz(Rij) for the main symmetry directions of the cubic Brillouin zone [86S1].
Fig. 29. CeCd. Lattice parameters vs. temperature, de-termined by X-ray diffraction measurements on single crystal. The structure is cubic above Tt1 = 220 K, tetragonal between Tt1 and Tt2 = 100 K and ortho-rhombic below Tt2. Full circles and squares: increasing temperature; open circles and triangles: decreasing temperature [88N1].
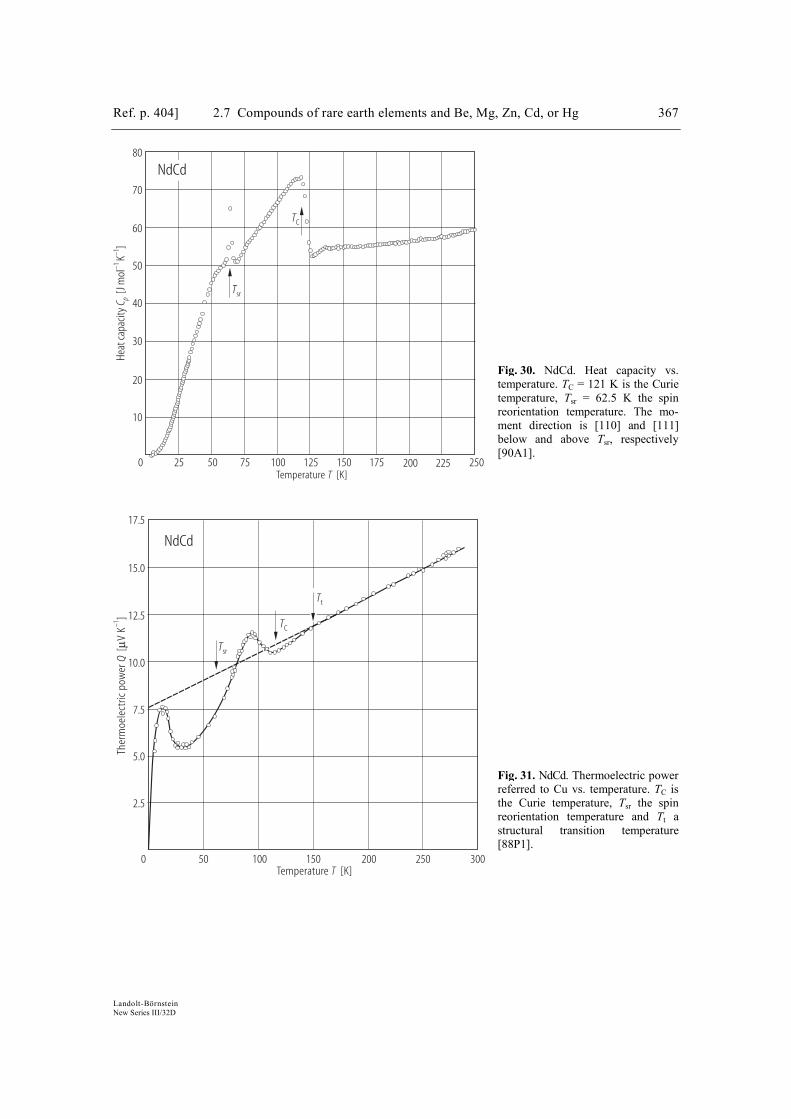
Ref. p. 404] 2.7 Compounds of rare earth elements and Be, Mg, Zn, Cd, or Hg 367
Landolt-Börnstein New Series III/32D
0 25 50 100 125 150 250
10
20
40
30
50
70
60
80
Temperature [K]T
Heat
capa
city
[J m
olK
]C p
–1–1
75 175 200 225
NdCd
TC
Tsr
2.5
5.0
17.5
7.5
10.0
15.0
12.5
Temperature [K]T0 50 100 150 200 250 300
NdCd
TC
Tsr
Tt
Ther
moe
lect
ricpo
wer
[V
K]
Qµ
–1
Fig. 30. NdCd. Heat capacity vs. temperature. TC = 121 K is the Curie temperature, Tsr = 62.5 K the spin reorientation temperature. The mo-ment direction is [110] and [111] below and above Tsr, respectively [90A1].
Fig. 31. NdCd. Thermoelectric power referred to Cu vs. temperature. TC is the Curie temperature, Tsr the spin reorientation temperature and Tt a structural transition temperature [88P1].
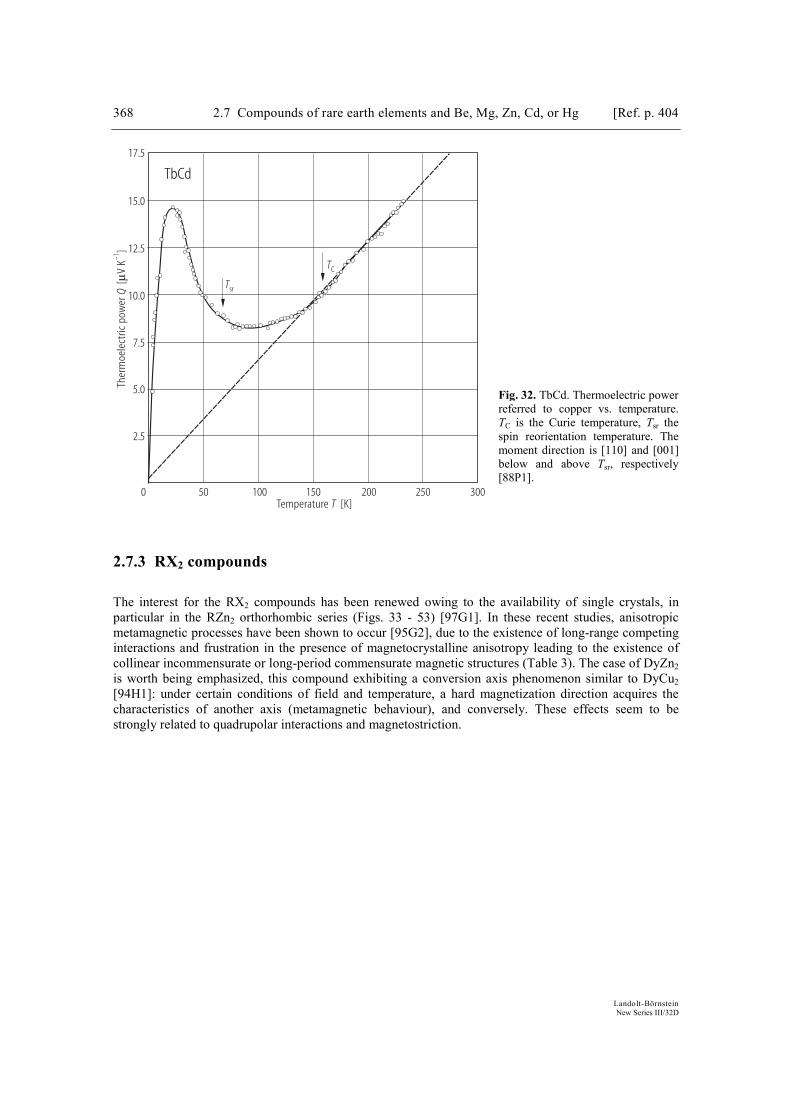
368 2.7 Compounds of rare earth elements and Be, Mg, Zn, Cd, or Hg [Ref. p. 404
Landolt-Börnstein New Series III/32D
2.5
5.0
17.5
7.5
10.0
15.0
12.5
Temperature [K]T0 50 100 150 200 250 300
Ther
moe
lect
ricpo
wer
[V
K]
Qµ
–1
TbCd
TC
Tsr
2.7.3 RX2 compounds
The interest for the RX2 compounds has been renewed owing to the availability of single crystals, in particular in the RZn2 orthorhombic series (Figs. 33 - 53) [97G1]. In these recent studies, anisotropic metamagnetic processes have been shown to occur [95G2], due to the existence of long-range competing interactions and frustration in the presence of magnetocrystalline anisotropy leading to the existence of collinear incommensurate or long-period commensurate magnetic structures (Table 3). The case of DyZn2 is worth being emphasized, this compound exhibiting a conversion axis phenomenon similar to DyCu2 [94H1]: under certain conditions of field and temperature, a hard magnetization direction acquires the characteristics of another axis (metamagnetic behaviour), and conversely. These effects seem to be strongly related to quadrupolar interactions and magnetostriction.
Fig. 32. TbCd. Thermoelectric power referred to copper vs. temperature. TC is the Curie temperature, Tsr the spin reorientation temperature. The moment direction is [110] and [001] below and above Tsr, respectively [88P1].
References
86G1 Giraud, M., Morin, P., Rouchy, J., Schmitt, D.: J. Magn. Magn. Mater. 59 (1986) 255 86H1 Hiraoka, T.: J. Phys. Soc. Jpn. 55 (1986) 4417 86K1 Kadomatsu, H., Tanaka, H., Kurisu, M., Fujiwara, H.: Phys. Rev. B 33 (1986) 4799 86L1 Lahiouel, R., Galera, R.M., Murani, A.P., Pierre, J., Siaud, E.: Z. Phys. B 62 (1986) 457 86L2 Liu, W.L., Kurisu, M., Kadomatsu, H., Fujiwara, H.: J. Phys. Soc. Jpn. 55 (1986) 33 86S1 Schmitt, D.: J. Magn. Magn. Mater. 54-57 (1986) 461 87F1 Fujii, H., Uwatoko, Y., Motoya, K., Ito, Y., Okamoto, T.: J. Magn. Magn. Mater. 63-64
(1987) 114 87K1 Kadomatsu, H., Kurisu, M., Fujiwara, H.: J. Phys. F 17 (1987) L305 87K2 Kasamatsu, Y., Tohyama, T., Kojima, K., Hihara, T.: J. Magn. Magn. Mater. 70 (1987) 294 87K3 Kurisu, M., Tanaka, H., Kadomatsu, H., Fujiwara, H.: J. Phys. Soc. Jpn. 56 (1987) 1127 88M1 Morin, P., Rouchy, J., Miyako, Y., Nishioka, T.: J. Magn. Magn. Mater. 76-77 (1988) 319 88N1 Nakazato, M., Wakabayashi, N., Kitai, T.: J. Phys. Soc. Jpn. 57 (1988) 953 88P1 Pinto, R.P., Amado, M.M., Braga, M.E., Sousa, J.B., Morin, P., Aléonard, A.: J. Magn.
Magn. Mater. 72 (1988) 152 88U1 Uwatoko, Y., Fujii, H., Nishi, M., Motoya, K., Ito, Y.: J. Magn. Magn. Mater. 76-77 (1988)
411 89M1 Morin, P., in: Magnetic Properties of Metals (Wijn, H.P.J., ed.), Landolt-Börnstein, New
Series, Berlin, Heidelberg, New York: Springer, Vol. 19 e2 1989, p. 1 89U1 Uwatoko, Y., Fujii, H., Nishi, M., Motoya, K., Ito, Y.: Solid State Commun. 72 (1989) 941 90A1 Aléonard, R., Morin, P.: J. Magn. Magn. Mater. 84 (1990) 255 90M1 Morin, P., Schmitt, D., in: Ferromagnetic Materials (Buschow, K.H.J., Wohlfarth, E.P., eds.),
Amsterdam: North-Holland, Vol. 5 1990, Chap. 1, p. 1 90S1 Shigeoka, T., Uwatoko, Y., Fujii, H., Reberlsky, L., Shapiro, S.M., Asai, K.: Phys. Rev. B 42
(1990) 8394 92C1 Continenza, A., Monachesi, P.: Phys. Rev. B 46 (1992) 6217 95A1 Amara, M., Morin, P.: Physica B 205 (1995) 379 95A2 Amara, M., Morin, P., Burlet, P.: Physica B 210 (1995) 157 95K2 Kurisu, M., Kadomatsu, H., Fujiwara, H., Hiraoka, T.: J. Magn. Magn. Mater. 140-144
(1995) 1146 96A1 Amara, M., Morin, P.: Physica B 222 (1996) 61 96B2 Buschow, K.H.J., Grechnev, G.E., Hjelm, A., Kasamatsu, Y., Panfilov, A.S., Svechkarev,
I.V.: J. Alloys Compounds 244 (1996) 113

368 2.7 Compounds of rare earth elements and Be, Mg, Zn, Cd, or Hg [Ref. p. 404
Landolt-Börnstein New Series III/32D
2.5
5.0
17.5
7.5
10.0
15.0
12.5
Temperature [K]T0 50 100 150 200 250 300
Ther
moe
lect
ricpo
wer
[V
K]
Qµ
–1
TbCd
TC
Tsr
2.7.3 RX2 compounds
The interest for the RX2 compounds has been renewed owing to the availability of single crystals, in particular in the RZn2 orthorhombic series (Figs. 33 - 53) [97G1]. In these recent studies, anisotropic metamagnetic processes have been shown to occur [95G2], due to the existence of long-range competing interactions and frustration in the presence of magnetocrystalline anisotropy leading to the existence of collinear incommensurate or long-period commensurate magnetic structures (Table 3). The case of DyZn2 is worth being emphasized, this compound exhibiting a conversion axis phenomenon similar to DyCu2 [94H1]: under certain conditions of field and temperature, a hard magnetization direction acquires the characteristics of another axis (metamagnetic behaviour), and conversely. These effects seem to be strongly related to quadrupolar interactions and magnetostriction.
Fig. 32. TbCd. Thermoelectric power referred to copper vs. temperature. TC is the Curie temperature, Tsr the spin reorientation temperature. The moment direction is [110] and [001] below and above Tsr, respectively [88P1].
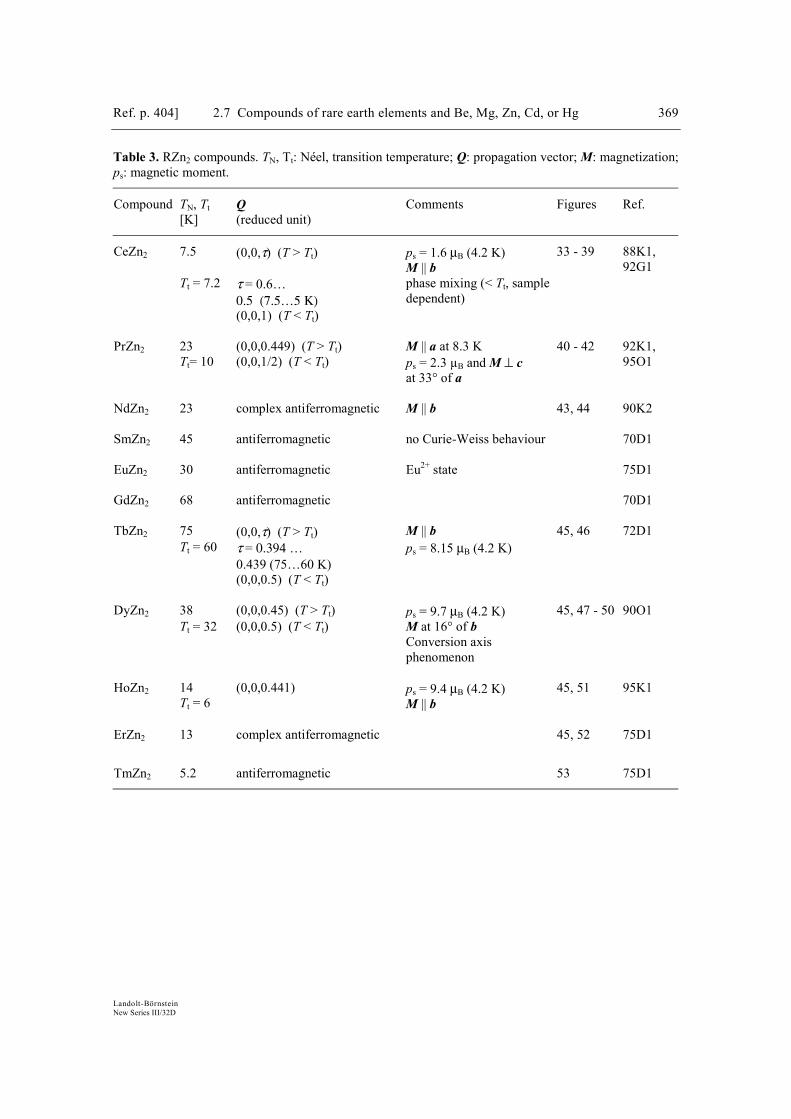
Ref. p. 404] 2.7 Compounds of rare earth elements and Be, Mg, Zn, Cd, or Hg 369
Landolt-Börnstein New Series III/32D
Table 3. RZn2 compounds. TN, Tt: Néel, transition temperature; Q: propagation vector; M: magnetization; ps: magnetic moment.
Compound TN, Tt [K]
Q (reduced unit)
Comments Figures Ref.
CeZn2 7.5 (0,0,τ) (T > Tt) ps = 1.6 µB (4.2 K) M || b
33 - 39 88K1, 92G1
Tt = 7.2 τ = 0.6… 0.5 (7.5…5 Κ) (0,0,1) (T < Tt)
phase mixing (< Tt, sample dependent)
PrZn2 23 (0,0,0.449) (T > Tt) M || a at 8.3 K 40 - 42 92K1, Tt= 10 (0,0,1/2) (T < Tt) ps = 2.3 µB and M ⊥ c
at 33° of a 95O1
NdZn2 23 complex antiferromagnetic M || b 43, 44 90K2 SmZn2 45 antiferromagnetic no Curie-Weiss behaviour 70D1 EuZn2 30 antiferromagnetic Eu2+ state 75D1 GdZn2 68 antiferromagnetic 70D1 TbZn2 75 (0,0,τ) (T > Tt) M || b 45, 46 72D1 Tt = 60 τ = 0.394 …
0.439 (75…60 K) (0,0,0.5) (T < Tt)
ps = 8.15 µB (4.2 K)
DyZn2 38 (0,0,0.45) (T > Tt) ps = 9.7 µB (4.2 K) 45, 47 - 50 90O1 Tt = 32 (0,0,0.5) (T < Tt) M at 16° of b
Conversion axis phenomenon
HoZn2 14
Tt = 6 (0,0,0.441) ps = 9.4 µB (4.2 K)
M || b 45, 51 95K1
ErZn2 13 complex antiferromagnetic 45, 52 75D1
TmZn2 5.2 antiferromagnetic 53 75D1
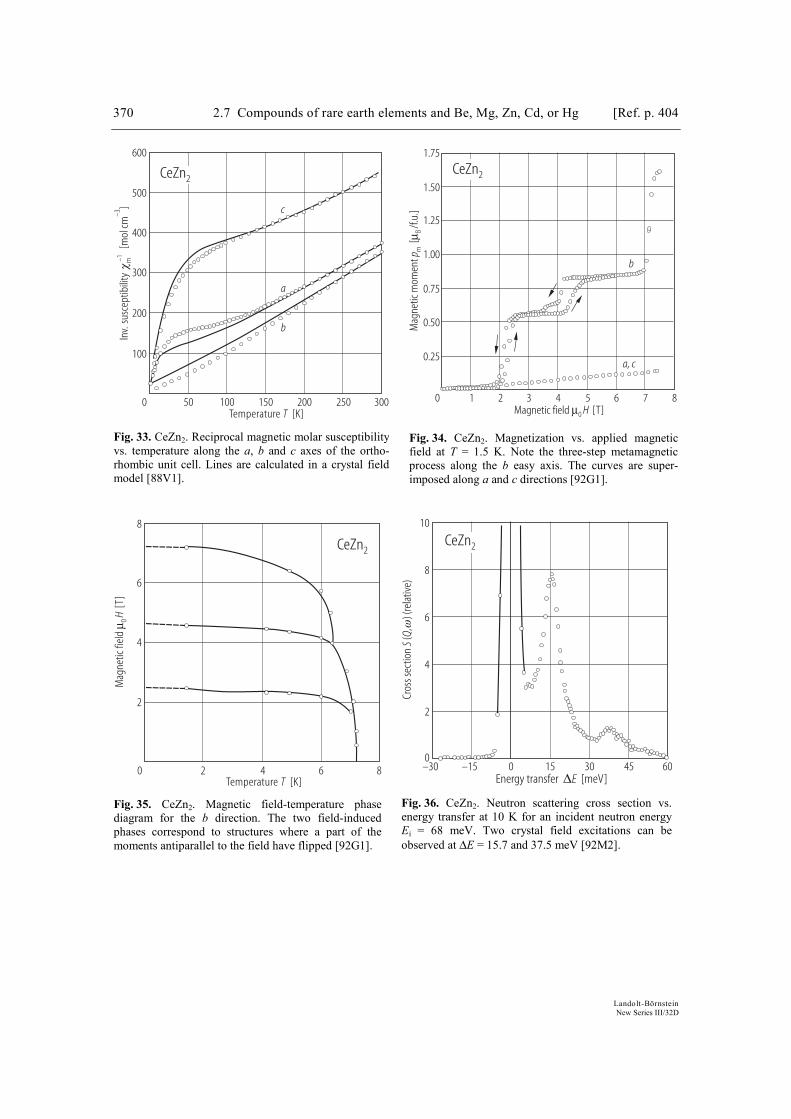
370 2.7 Compounds of rare earth elements and Be, Mg, Zn, Cd, or Hg [Ref. p. 404
Landolt-Börnstein New Series III/32D
Inv.
susc
eptib
ility
[mol
cm]
χ m–1–3
100
200
300
400
500
600
0 50 100 150 200 250 300Temperature [K]T
c
a
b
CeZn2
Fig. 33. CeZn2. Reciprocal magnetic molar susceptibilityvs. temperature along the a, b and c axes of the ortho-rhombic unit cell. Lines are calculated in a crystal fieldmodel [88V1].
Mag
netic
mom
ent
[]
p mBµ
/f.u.
0.25
0.50
0.75
1.00
1.25
1.50
1.75
0 1 2 4 5 6 8Magnetic field [T]µ0 H
3 7
a, c
b
CeZn2
Fig. 34. CeZn2. Magnetization vs. applied magnetic field at T = 1.5 K. Note the three-step metamagnetic process along the b easy axis. The curves are super-imposed along a and c directions [92G1].
Mag
netic
fiel
d[T
]µ 0
H
0 2 4 6 8Temperature [K]T
2
4
6
8
CeZn2
Fig. 35. CeZn2. Magnetic field-temperature phase diagram for the b direction. The two field-induced phases correspond to structures where a part of the moments antiparallel to the field have flipped [92G1].
Cros
s sec
tion
(,
)(re
lativ
e)S
Qω
2
4
6
8
10
Energy transfer [meV]∆E–30 –15 0 15 30 45 600
CeZn2
Fig. 36. CeZn2. Neutron scattering cross section vs. energy transfer at 10 K for an incident neutron energy Ei = 68 meV. Two crystal field excitations can be observed at ∆E = 15.7 and 37.5 meV [92M2].
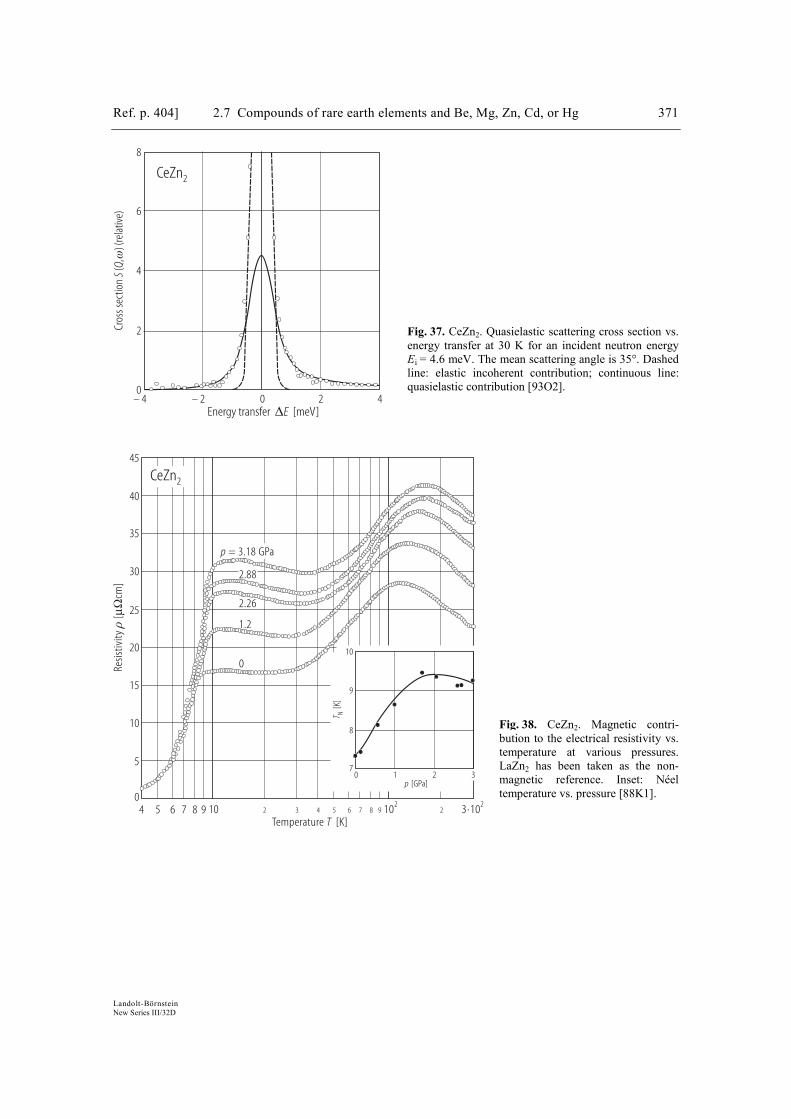
Ref. p. 404] 2.7 Compounds of rare earth elements and Be, Mg, Zn, Cd, or Hg 371
Landolt-Börnstein New Series III/32D
– 4 – 2 0 2 40
2
4
6
8
Cros
s sec
tion
(,
) (re
lativ
e)S
Qω
Energy transfer [meV]∆E
CeZn2
0
15
5
25
20
10
30
40
35
45
Resis
tivity
[cm
]ρ
µΩ
42 6 84 10 102
CeZn2
Temperature [K]T25 6 7 8 9 3 10⋅ 2
p = 3.18 GPa
2.88
2.26
1.2
0
T N[K
]
2 31p [GPa]
0
9
10
7
3 5 7 9
8
Fig. 37. CeZn2. Quasielastic scattering cross section vs. energy transfer at 30 K for an incident neutron energy Ei = 4.6 meV. The mean scattering angle is 35°. Dashed line: elastic incoherent contribution; continuous line: quasielastic contribution [93O2].
Fig. 38. CeZn2. Magnetic contri-bution to the electrical resistivity vs. temperature at various pressures. LaZn2 has been taken as the non-magnetic reference. Inset: Néel temperature vs. pressure [88K1].
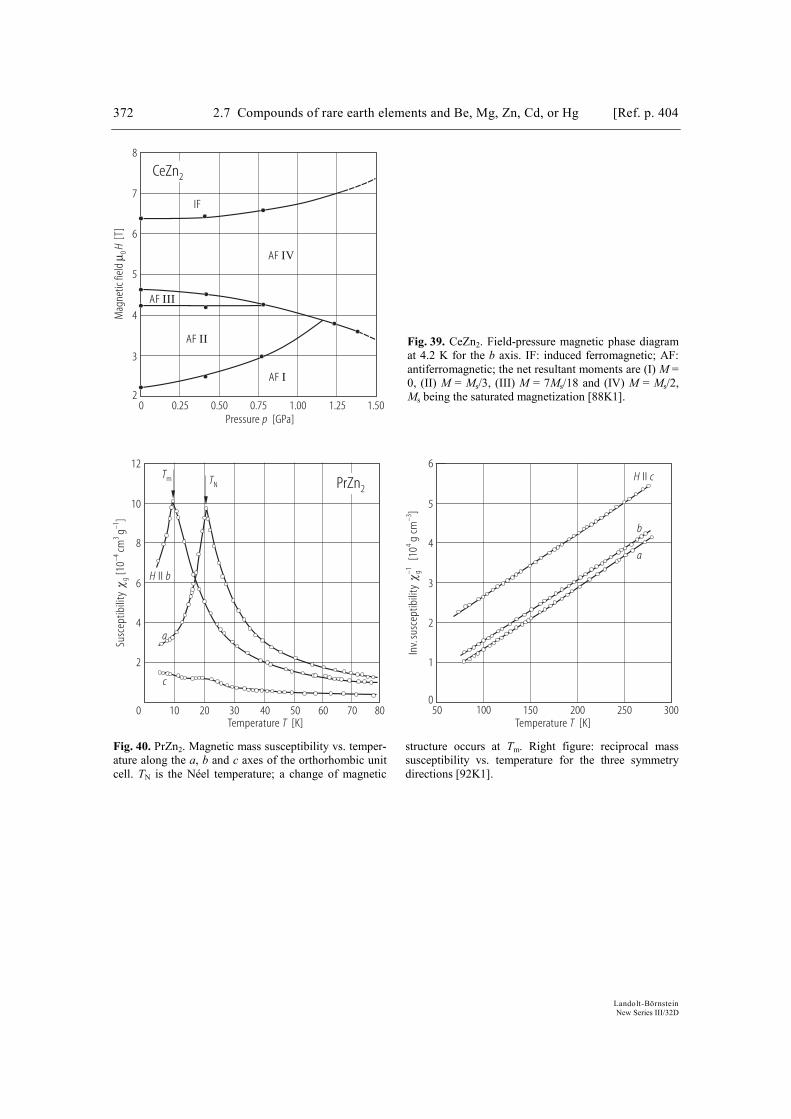
372 2.7 Compounds of rare earth elements and Be, Mg, Zn, Cd, or Hg [Ref. p. 404
Landolt-Börnstein New Series III/32D
3
2
4
5
6
7
8
Pressure [GPa]p0 0.25 0.50 0.75 1.00 1.25 1.50
Mag
netic
fiel
d[T
]µ 0
H
CeZn2
IF
AF IV
AF III
AF II
AF I
a
c
0 20 8010 504030 60 70
2
12
4
6
8
10
Susc
eptib
ility
[10
cmg
]χ g
–43
–1
Temperature [K]T
Tm TN
H bII
PrZn2
1
2
3
4
5
6
50 100 150 200 250 300Temperature [K]T
Inv.
susc
eptib
ility
[10
gcm
]χ g–1
4–3
a
b
H cII
0
Fig. 40. PrZn2. Magnetic mass susceptibility vs. temper-ature along the a, b and c axes of the orthorhombic unit cell. TN is the Néel temperature; a change of magnetic
structure occurs at Tm. Right figure: reciprocal mass susceptibility vs. temperature for the three symmetry directions [92K1].
Fig. 39. CeZn2. Field-pressure magnetic phase diagram at 4.2 K for the b axis. IF: induced ferromagnetic; AF: antiferromagnetic; the net resultant moments are (I) M = 0, (II) M = Ms/3, (III) M = 7Ms/18 and (IV) M = Ms/2, Ms being the saturated magnetization [88K1].
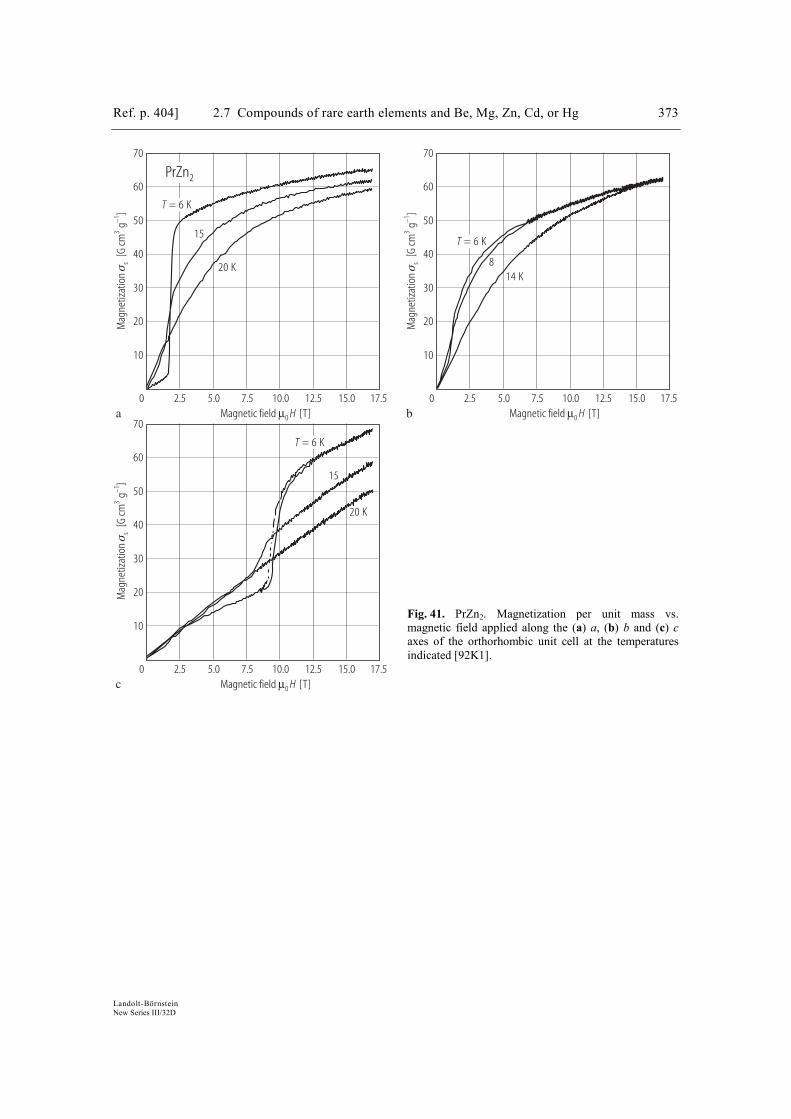
Ref. p. 404] 2.7 Compounds of rare earth elements and Be, Mg, Zn, Cd, or Hg 373
Landolt-Börnstein New Series III/32D
a b0 2.5 5.0 7.5 10.0 12.5 15.0 17.5
10
20
30
40
50
60
70
Magnetic field [T]µ0 H
Mag
netiz
atio
n[G
cmg
]σ s
3–1
0 2.5 5.0 7.5 10.0 12.5 15.0 17.5
10
20
30
40
50
60
70
Magnetic field [T]µ0 HM
agne
tizat
ion
[G cm
g]
σ s3
–1
c0 2.5 5.0 7.5 10.0 12.5 15.0 17.5
10
20
30
40
50
60
70
Magnetic field [T]µ0 H
Mag
netiz
atio
n[G
cmg
]σ s
3–1
T = 6 K
15
20 K
T = 6 K
15
20 K
T = 6 K
814 K
PrZn2
Fig. 41. PrZn2. Magnetization per unit mass vs. magnetic field applied along the (a) a, (b) b and (c) c axes of the orthorhombic unit cell at the temperatures indicated [92K1].
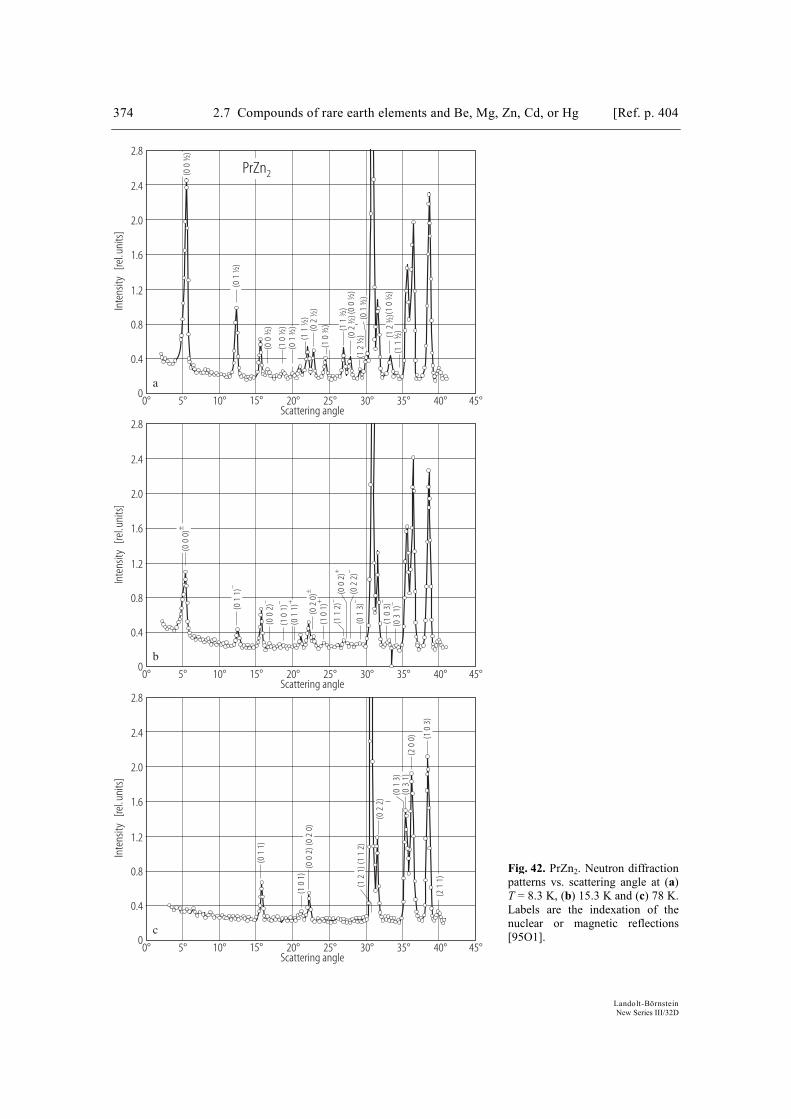
374 2.7 Compounds of rare earth elements and Be, Mg, Zn, Cd, or Hg [Ref. p. 404
Landolt-Börnstein New Series III/32D
0
0.4
0.8
2.8
1.2
1.6
2.4
2.0
Inte
nsity
[rel.u
nits
]
Scattering angle0° 5° 10° 15° 20° 25° 35° 40°30° 45°
c
0
0.4
0.8
2.8
1.2
1.6
2.4
2.0
Inte
nsity
[rel.u
nits
]
Scattering angle0° 5° 10° 15° 20° 25° 35° 40°30° 45°
b
0
0.4
0.8
2.8
1.2
1.6
2.4
2.0
Inte
nsity
[rel.u
nits
]
Scattering angle0° 5° 10° 15° 20° 25° 35° 40°30° 45°
a
(01
½)
PrZn2(0
00)
±
(01
1)–
(00
2)–
(10
1)–
(01
1)+
(02
0)±
(10
1)+
(00
2)+
(11
2)–
(01
3)–
(10
3)–
(03
1)–
(01
1)
(10
1)(0
02)
(02
0)
(12
1)(1
12)
(02
2)
(01
3)(0
31)
(10
3)
(21
1)
(00
½)
(00
½)
3
(10
½)
(01
½)
3
(11
½)
(02
½)
(10
½)
3 (11
½)
3
(02
½)
3
(12
½)
3
(00
½)
5
(12
½)
(01
½)
5
(10
½)
5
(11
½)
5
(02
2)–
(20
0)
Fig. 42. PrZn2. Neutron diffraction patterns vs. scattering angle at (a) T = 8.3 K, (b) 15.3 K and (c) 78 K. Labels are the indexation of the nuclear or magnetic reflections [95O1].
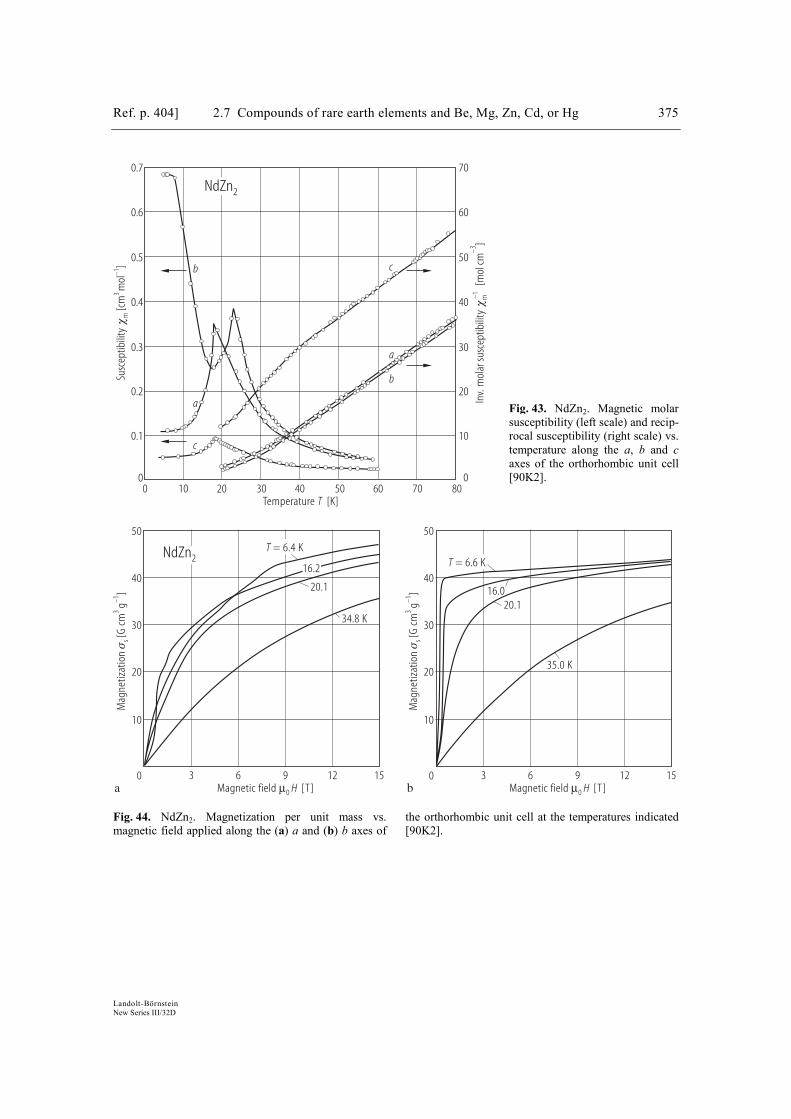
Ref. p. 404] 2.7 Compounds of rare earth elements and Be, Mg, Zn, Cd, or Hg 375
Landolt-Börnstein New Series III/32D
0 10 20 30 40 50 600
0.1
0.2
0.7
0.3
0.4
0.6
0.5
Susc
eptib
ility
[cm
mol
]χ m
3–1
Temperature [K]T70 80
Inv.
mol
ar su
scep
tibili
ty[m
ol cm
]χ m–1
–30
10
20
70
30
40
60
50c
a
b
NdZn2
c
a
b
a bMagnetic field [T]µ0 H0
20
Mag
netiz
atio
n[G
cmg
]σ s
3–1
3 6 9 12 15
30
40
50
Magnetic field [T]µ0 H0
Mag
netiz
atio
n[G
cmg
]σ s
3–1
3 6 9 12 15
T = 6.6 K
16.020.1
35.0 K
T = 6.4 K
16.2
20.1
34.8 K
NdZn2
10
20
30
40
50
10
Fig. 44. NdZn2. Magnetization per unit mass vs. magnetic field applied along the (a) a and (b) b axes of
the orthorhombic unit cell at the temperatures indicated [90K2].
Fig. 43. NdZn2. Magnetic molar susceptibility (left scale) and recip-rocal susceptibility (right scale) vs. temperature along the a, b and c axes of the orthorhombic unit cell [90K2].
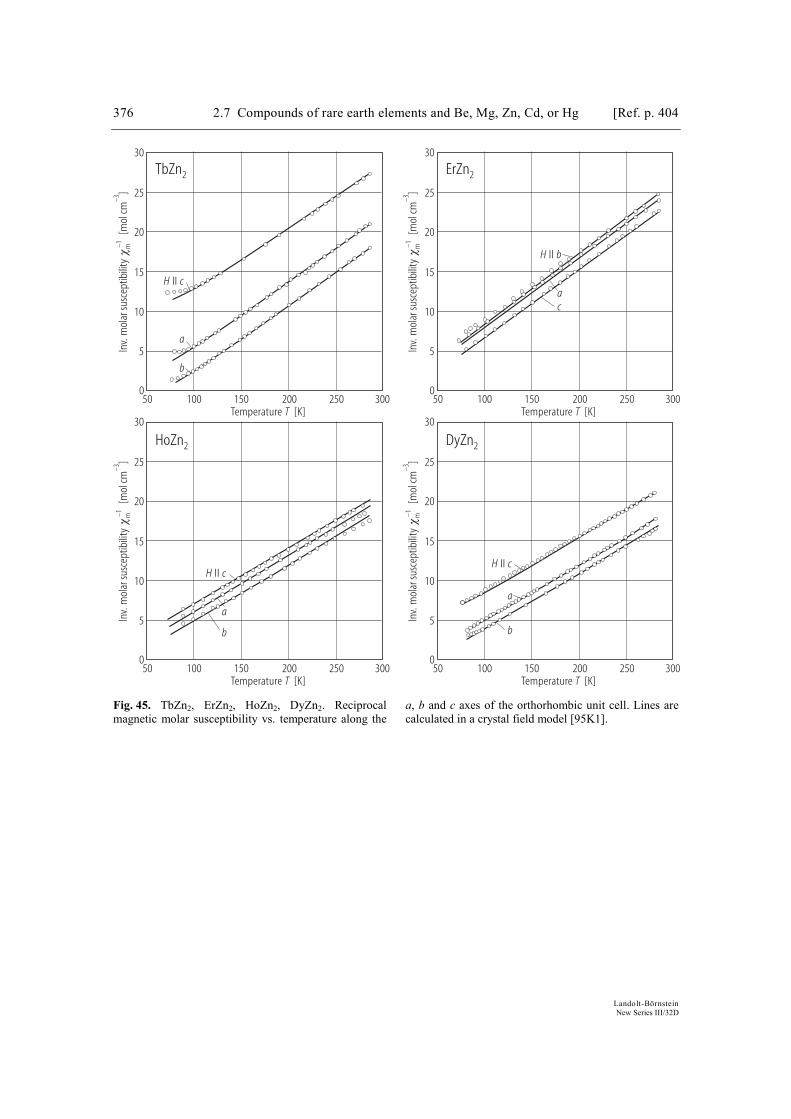
376 2.7 Compounds of rare earth elements and Be, Mg, Zn, Cd, or Hg [Ref. p. 404
Landolt-Börnstein New Series III/32D
0300
Temperature [K]T
5
30
10
15
20
25
Inv.
mol
ar su
scep
tibili
ty[m
ol cm
]χ m–1
–3
50 100 150 200 250In
v.m
olar
susc
eptib
ility
[mol
cm]
χ m–1–3
Inv.
mol
ar su
scep
tibili
ty[m
ol cm
]χ m–1
–3
Inv.
mol
ar su
scep
tibili
ty[m
ol cm
]χ m–1
–3
0300
Temperature [K]T
5
30
10
15
20
25
50 100 150 200 250
0300
Temperature [K]T
5
30
10
15
20
25
50 100 150 200 2500
300Temperature [K]T
5
30
10
15
20
25
50 100 150 200 250
TbZn2 ErZn2
HoZn2 DyZn2
a
b
H cIIac
H bII
a
b
H cII
a
b
H cII
Fig. 45. TbZn2, ErZn2, HoZn2, DyZn2. Reciprocal magnetic molar susceptibility vs. temperature along the
a, b and c axes of the orthorhombic unit cell. Lines are calculated in a crystal field model [95K1].
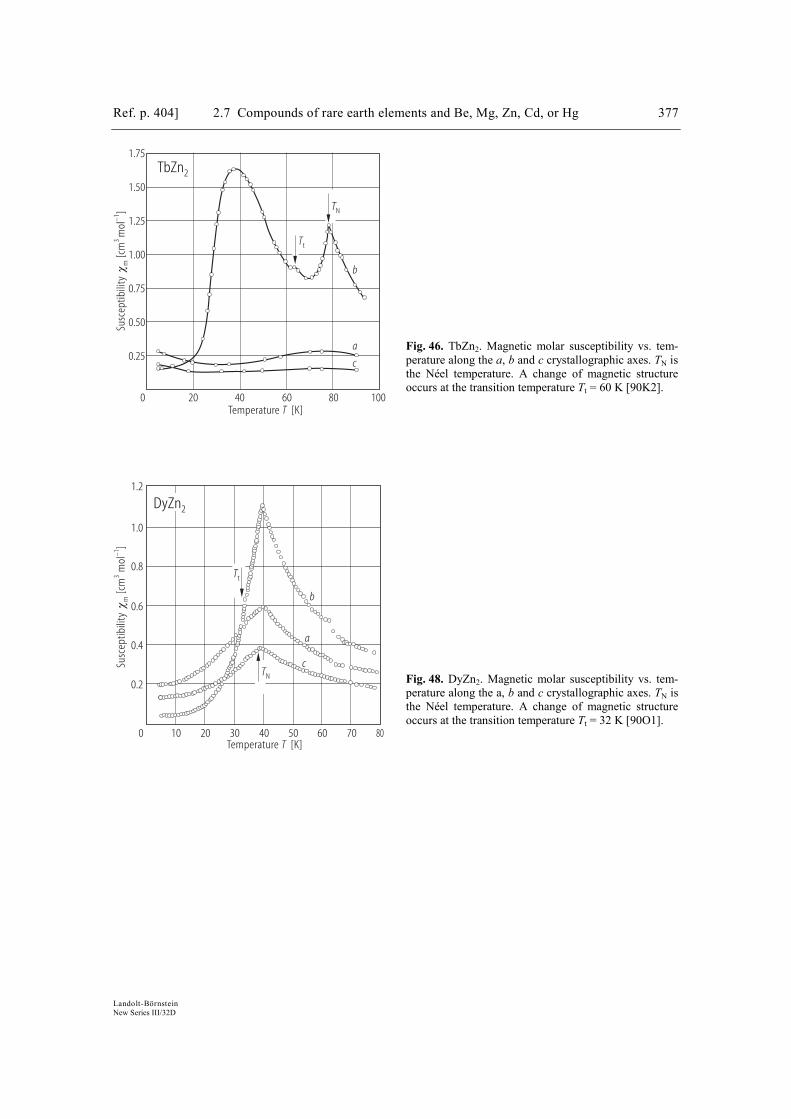
Ref. p. 404] 2.7 Compounds of rare earth elements and Be, Mg, Zn, Cd, or Hg 377
Landolt-Börnstein New Series III/32D
0 20 40 60 80 100Temperature [K]T
Susc
eptib
ility
[cm
mol
]χ m
3–1
0.25
0.50
0.75
1.00
1.25
1.50
1.75TbZn2
TN
Tt
b
a
c
Fig. 46. TbZn2. Magnetic molar susceptibility vs. tem-perature along the a, b and c crystallographic axes. TN is the Néel temperature. A change of magnetic structure occurs at the transition temperature Tt = 60 K [90K2].
0.2
0.4
0.6
0.8
1.0
1.2
0 10 20 30 40 50 60 70 80Temperature [K]T
DyZn2
TN
Tt
b
a
cSusc
eptib
ility
[]
χ m1
cmm
ol3
–
Fig. 48. DyZn2. Magnetic molar susceptibility vs. tem-perature along the a, b and c crystallographic axes. TN is the Néel temperature. A change of magnetic structure occurs at the transition temperature Tt = 32 K [90O1].
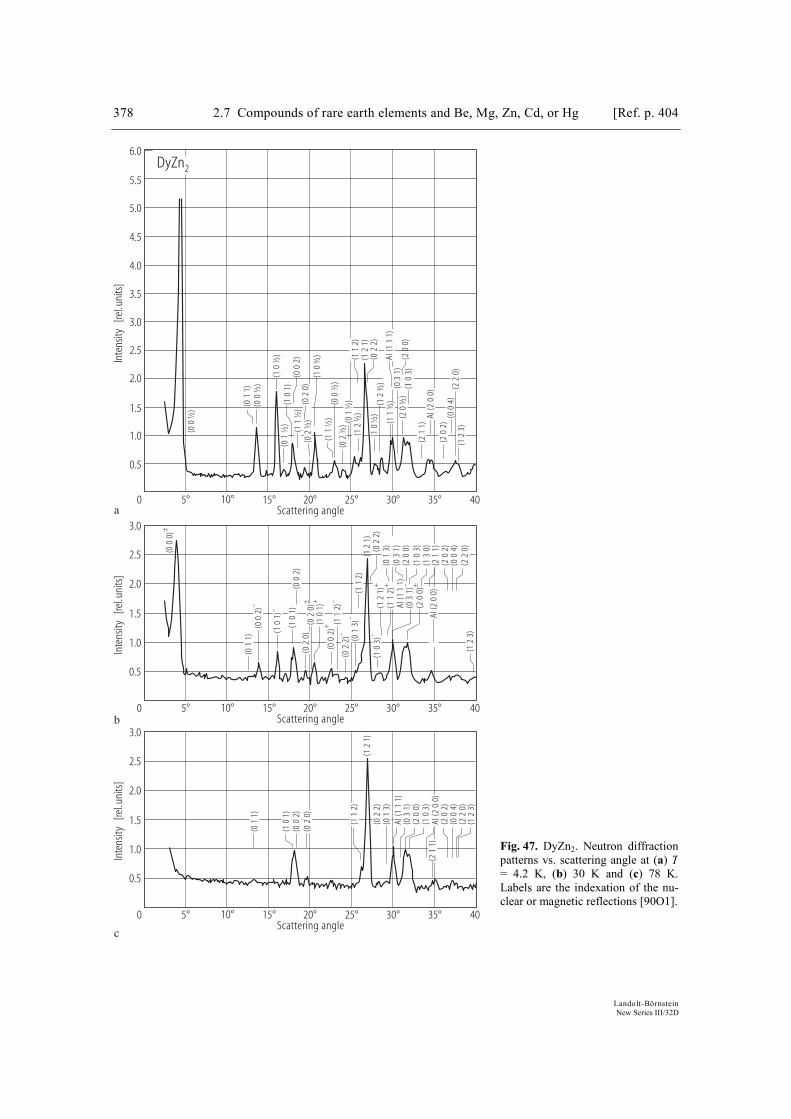
378 2.7 Compounds of rare earth elements and Be, Mg, Zn, Cd, or Hg [Ref. p. 404
Landolt-Börnstein New Series III/32D
0.5
2.0
1.0
3.0
2.5
1.5
3.5
4.5
4.0
5.0
Inte
nsity
[rel.u
nits
]
5.5
Scattering angle
6.0
0 5° 10° 20° 25° 35° 40°15° 30°
Scattering angle0 5° 10° 20° 25° 35° 40°15° 30°
0.5
2.0
1.0
3.0
2.5
1.5
Scattering angle0 5° 10° 20° 25° 35° 40°15° 30°
0.5
2.0
1.0
3.0
2.5
1.5
DyZn2
(10
½)
(00
½)
(01
1)
(02
0)
(20
½)
c
b
a
(03
1)(1
03)
(21
1)Al
20
0)(
(20
2)(0
04)
(12
3)(2
20)
(01
1)(0
02)
–
(10
1)–
(10
1)(0
02)
(02
0)(0
20)
±
(10
1)+
(00
2)+ (1
12)
–
(02
2)– (0
13)
–(1
12)
(12
1)(0
22)
(10
3)–
(12
1)+
(11
2)+
(03
1)–
(20
0)±
Al1
11)
((2
00)
(10
3)(1
30)
(20
2)(0
04)
(22
0)(1
23)
Al2
00)
(
(01
3)
(00
2)(1
01)
(02
0)
(01
3)
(11
2)
Al1
11)
(
(01
1)
(02
2)(1
21)
(03
1)(2
00)
(10
3)(2
11)
Al2
00)
((2
02)
(00
4)(2
20)
Inte
nsity
[rel.u
nits
]In
tens
ity[re
l.uni
ts]
(12
3)
(00
0)±
(03
1)
(21
1)
(00
½)
3
(10
1)(1
1½
)(0
02)
(01
½)
3
(12
1)
Al1
11)
(
(02
2)
(11
½)
3
(00
½)
5
(02
½)
3
(01
½)
5
(10
½)
5
(12
½)
3
(11
½)
5
(10
½)
3(0
2½
)
(11
2)(1
2½
)
(20
0)
Fig. 47. DyZn2. Neutron diffraction patterns vs. scattering angle at (a) T= 4.2 K, (b) 30 K and (c) 78 K. Labels are the indexation of the nu-clear or magnetic reflections [90O1].

Ref. p. 404] 2.7 Compounds of rare earth elements and Be, Mg, Zn, Cd, or Hg 379
Landolt-Börnstein New Series III/32D
0 2.5 5.0 7.5 10.0 15.012.5 17.5
25
50
75
100
125
150
175
Magnetic field [T]µ0 H
Mag
netiz
atio
n[G
cmg
]σ s
3–1
T = 5 K
30 K
DyZn2
0 2.5 5.0 7.5 10.0 15.012.5 17.5
25
50
75
100
125
150
175
Magnetic field [T]µ0 H
Mag
netiz
atio
n[G
cmg
]σ s
3–1
T = 5 K
40 K
0 2.5 5.0 7.5 10.0 15.012.5 17.5
25
50
75
100
125
150
175
Magnetic field [T]µ0 H
Mag
netiz
atio
n[G
cmg
]σ s
3–1
T = 5 K
200 200
30
H aII H bII
H cII(2)
(4)
(3)
(1)
a b
c
Fig. 49. DyZn2. Magnetization per unit mass vs. magnetic field applied along the (a) a, (b) b and (c) c axes of the orthorhombic unit cell at the temperatures indicated. The numbers in (c) correspond to the successive measurements, showing the conversion axis phenomenon: after a transition under µ0Hc = 14.6 T, the c axis behaves as a a axis; the virgin behaviour is recovered after annealing the sample [92A1].
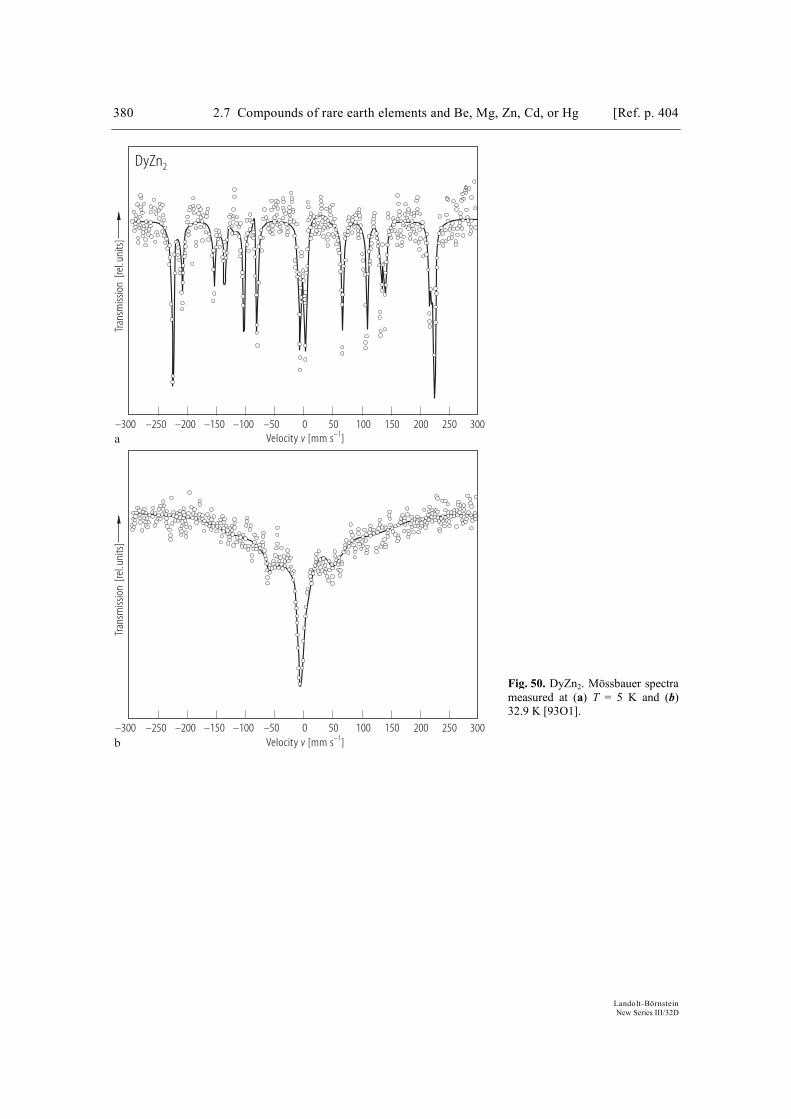
380 2.7 Compounds of rare earth elements and Be, Mg, Zn, Cd, or Hg [Ref. p. 404
Landolt-Börnstein New Series III/32D
–250 –200 –150 0 150 300–300
Tran
smiss
ion
[rel.u
nits
]
–100 50–50 100 200 250Velocity [mm s ]v –1
–250 –200 –150 0 150 300–300
Tran
smiss
ion
[rel.u
nits
]
–100 50–50 100 200 250
a
b
DyZn2
Velocity [mm s ]v –1
Fig. 50. DyZn2. Mössbauer spectra measured at (a) T = 5 K and (b) 32.9 K [93O1].
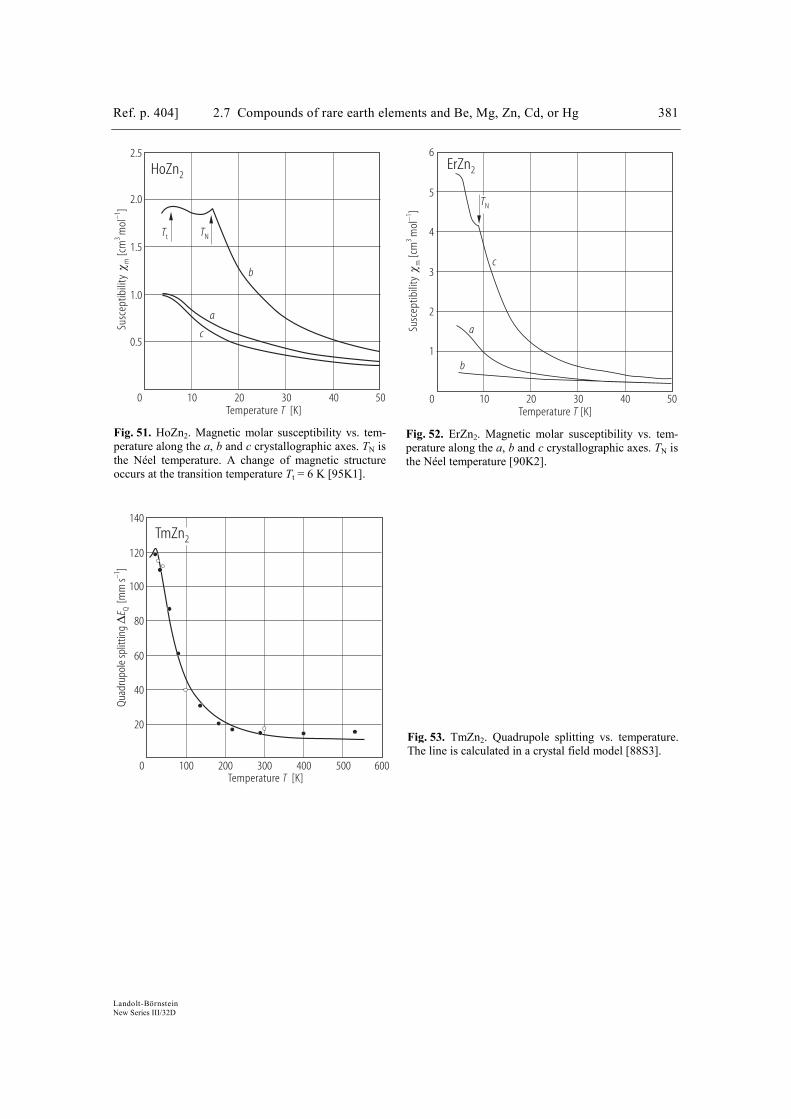
Ref. p. 404] 2.7 Compounds of rare earth elements and Be, Mg, Zn, Cd, or Hg 381
Landolt-Börnstein New Series III/32D
0 10 20 30 40 50Temperature [K]T
2.0
1.5
1.0
0.5
2.5
HoZn2
TNTt
b
a
c
Susc
eptib
ility
[cm
mol
]χ m
3–1
Fig. 51. HoZn2. Magnetic molar susceptibility vs. tem-perature along the a, b and c crystallographic axes. TN is the Néel temperature. A change of magnetic structureoccurs at the transition temperature Tt = 6 K [95K1].
1
2
3
4
5
6
0 10 20 30 40 50Temperature [K]T
ErZn2
TN
b
a
c
Susc
eptib
ility
[cm
mol
]χ m
3–1
Fig. 52. ErZn2. Magnetic molar susceptibility vs. tem-perature along the a, b and c crystallographic axes. TN is the Néel temperature [90K2].
Quad
rupo
le sp
littin
g[m
m s
]∆
E Q–1
20
40
60
80
100
120
140
0 100 200 300 400 500 600Temperature [K]T
TmZn2
Fig. 53. TmZn2. Quadrupole splitting vs. temperature. The line is calculated in a crystal field model [88S3].
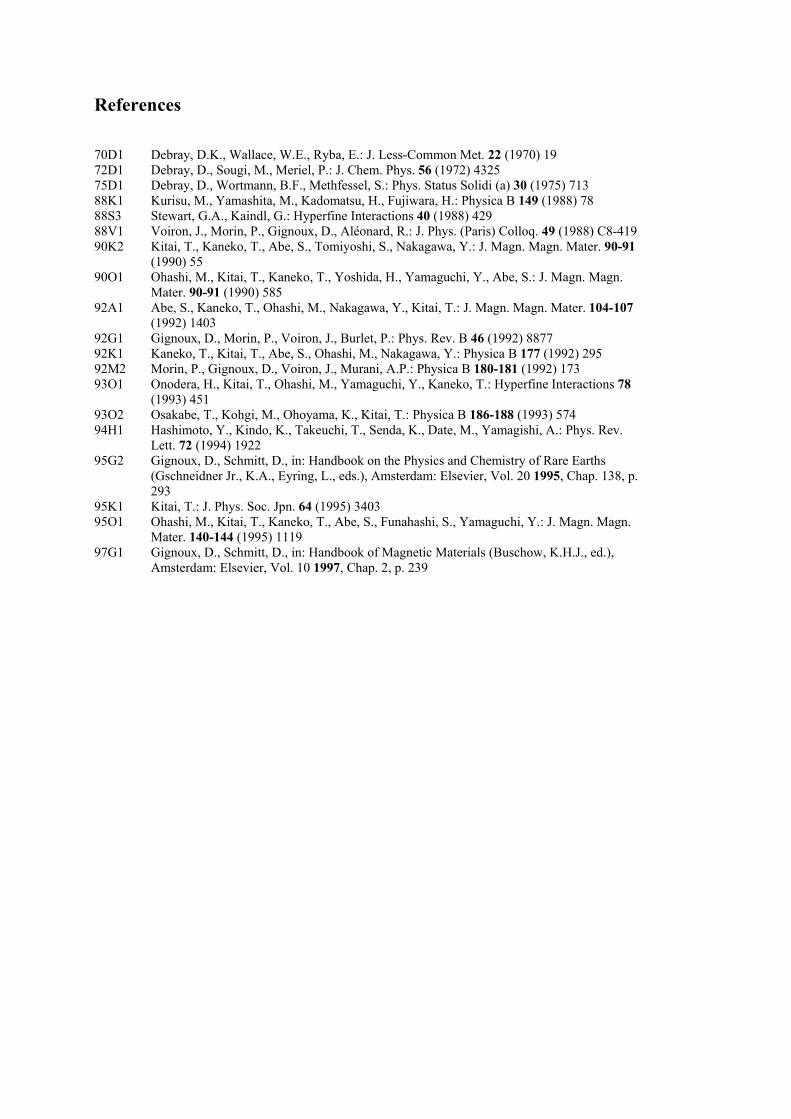
References
70D1 Debray, D.K., Wallace, W.E., Ryba, E.: J. Less-Common Met. 22 (1970) 19 72D1 Debray, D., Sougi, M., Meriel, P.: J. Chem. Phys. 56 (1972) 4325 75D1 Debray, D., Wortmann, B.F., Methfessel, S.: Phys. Status Solidi (a) 30 (1975) 713 88K1 Kurisu, M., Yamashita, M., Kadomatsu, H., Fujiwara, H.: Physica B 149 (1988) 78 88S3 Stewart, G.A., Kaindl, G.: Hyperfine Interactions 40 (1988) 429 88V1 Voiron, J., Morin, P., Gignoux, D., Aléonard, R.: J. Phys. (Paris) Colloq. 49 (1988) C8-419 90K2 Kitai, T., Kaneko, T., Abe, S., Tomiyoshi, S., Nakagawa, Y.: J. Magn. Magn. Mater. 90-91
(1990) 55 90O1 Ohashi, M., Kitai, T., Kaneko, T., Yoshida, H., Yamaguchi, Y., Abe, S.: J. Magn. Magn.
Mater. 90-91 (1990) 585 92A1 Abe, S., Kaneko, T., Ohashi, M., Nakagawa, Y., Kitai, T.: J. Magn. Magn. Mater. 104-107
(1992) 1403 92G1 Gignoux, D., Morin, P., Voiron, J., Burlet, P.: Phys. Rev. B 46 (1992) 8877 92K1 Kaneko, T., Kitai, T., Abe, S., Ohashi, M., Nakagawa, Y.: Physica B 177 (1992) 295 92M2 Morin, P., Gignoux, D., Voiron, J., Murani, A.P.: Physica B 180-181 (1992) 173 93O1 Onodera, H., Kitai, T., Ohashi, M., Yamaguchi, Y., Kaneko, T.: Hyperfine Interactions 78
(1993) 451 93O2 Osakabe, T., Kohgi, M., Ohoyama, K., Kitai, T.: Physica B 186-188 (1993) 574 94H1 Hashimoto, Y., Kindo, K., Takeuchi, T., Senda, K., Date, M., Yamagishi, A.: Phys. Rev.
Lett. 72 (1994) 1922 95G2 Gignoux, D., Schmitt, D., in: Handbook on the Physics and Chemistry of Rare Earths
(Gschneidner Jr., K.A., Eyring, L., eds.), Amsterdam: Elsevier, Vol. 20 1995, Chap. 138, p. 293
95K1 Kitai, T.: J. Phys. Soc. Jpn. 64 (1995) 3403 95O1 Ohashi, M., Kitai, T., Kaneko, T., Abe, S., Funahashi, S., Yamaguchi, Y.: J. Magn. Magn.
Mater. 140-144 (1995) 1119 97G1 Gignoux, D., Schmitt, D., in: Handbook of Magnetic Materials (Buschow, K.H.J., ed.),
Amsterdam: Elsevier, Vol. 10 1997, Chap. 2, p. 239

382 2.7 Compounds of rare earth elements and Be, Mg, Zn, Cd, or Hg [Ref. p. 404
Landolt-Börnstein New Series III/32D
2.7.4 R2X17 compounds
The only new magnetic results have been obtained with zinc. The magnetic behaviour has been investigated in the whole series and its antiferromagnetic nature confirmed (Figs. 54 - 64 and Table 4). The de Gennes law is far to be followed for some particular compounds (see the values of Θ for Ce2Zn17 and of TN for Gd2Zn17 and Tb2Zn17). Only Ce2Zn17 has been studied on a single crystal (Figs. 61, 62). Five compounds in the series exhibit a transition in the ordered range, probably related to a change of the magnetic structure which remains to be confirmed by neutron diffraction experiments. A close similarity can be observed between the heat capacity anomalies and the temperature derivatives of the electrical resistivity (see e.g. Figs. 55 and 56). Table 4. R2Zn17 compounds. Θ: paramagnetic Curie temperature; peff: effective paramagnetic moment; TN: Néel temperature, Tt: transition temperature in ordered range.
Compound Θ [K]
peff [µB]
TN [K]
Tt [K]
Figures Ref.
Ce2Zn17 – 24.0 2.31 1.7 61, 62 87O1 Pr2Zn17 – 5.5 3.76 2.2 1.7 55, 56, 59, 63 93M1, 94G1 Nd2Zn17 – 16.7 3.66 1.1 57 93M1, 94G1 Sm2Zn17 – 41.5 1.11 4.1 3.3 55 87O1 Gd2Zn17 – 58.4 8.27 9.0 54, 58 94G1, 96M1 Tb2Zn17 – 60.7 9.45 22.7 7.2 54, 60 87O1, 93M1 Dy2Zn17 – 21.0 10.96 8.8 54 93M1, 94G1 Ho2Zn17 – 12.5 10.82 3.0 2.5 55, 64 87O1, 94G1 Er2Zn17 – 5.8 9.66 1.6 1.4 93M1, 94G1 Tm2Zn17 – 6.3 7.87 0.8 87O1 Yb2Zn17 0 94G1 For Figs. 54 and 55 see next page.
Heat
capa
city
/[J
mol
K]
CT
–1–2
0 1 2 3 4Temperature [K]T
20
40
60
80
Pr Zn2 17Tt
TN
Fig. 56. Pr2Zn17. Heat capacity divided by temperature vs. temperature. The arrows show the Néel temperature TN and the transition temperature Tt in the ordered range [93M1].
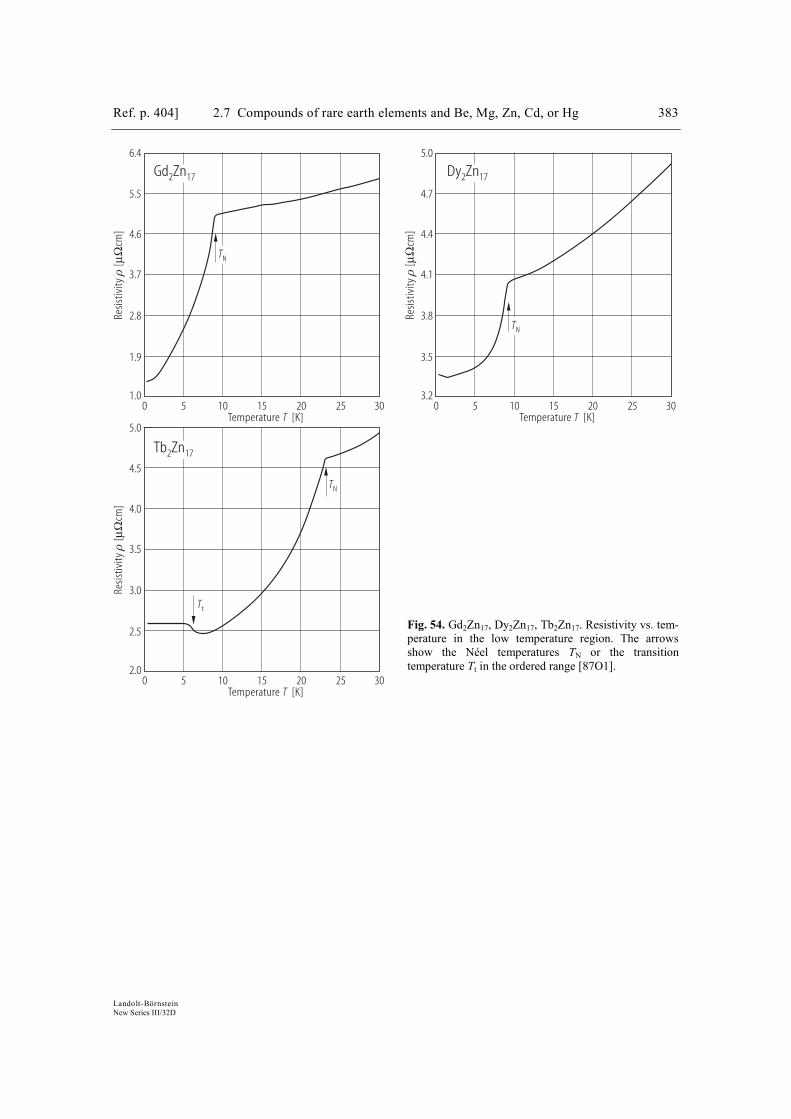
Ref. p. 404] 2.7 Compounds of rare earth elements and Be, Mg, Zn, Cd, or Hg 383
Landolt-Börnstein New Series III/32D
Resis
tivity
[cm
]ρ
µΩ
1.9
1.0
2.8
3.7
4.6
5.5
6.4
Temperature [K]T0 5 10 15 20 25 30
Resis
tivity
[cm
]ρ
µΩ
3.5
3.2
3.8
4.1
4.4
4.7
5.0
Temperature [K]T0 5 10 15 20 25 30
Resis
tivity
[cm
]ρ
µΩ
2.5
2.0
3.0
3.5
4.0
4.5
5.0
Temperature [K]T0 5 10 15 20 25 30
Tt
TN
Gd Zn2 17
TN
Dy Zn2 17
TN
Tb Zn2 17
Fig. 54. Gd2Zn17, Dy2Zn17, Tb2Zn17. Resistivity vs. tem-perature in the low temperature region. The arrows show the Néel temperatures TN or the transition temperature Tt in the ordered range [87O1].
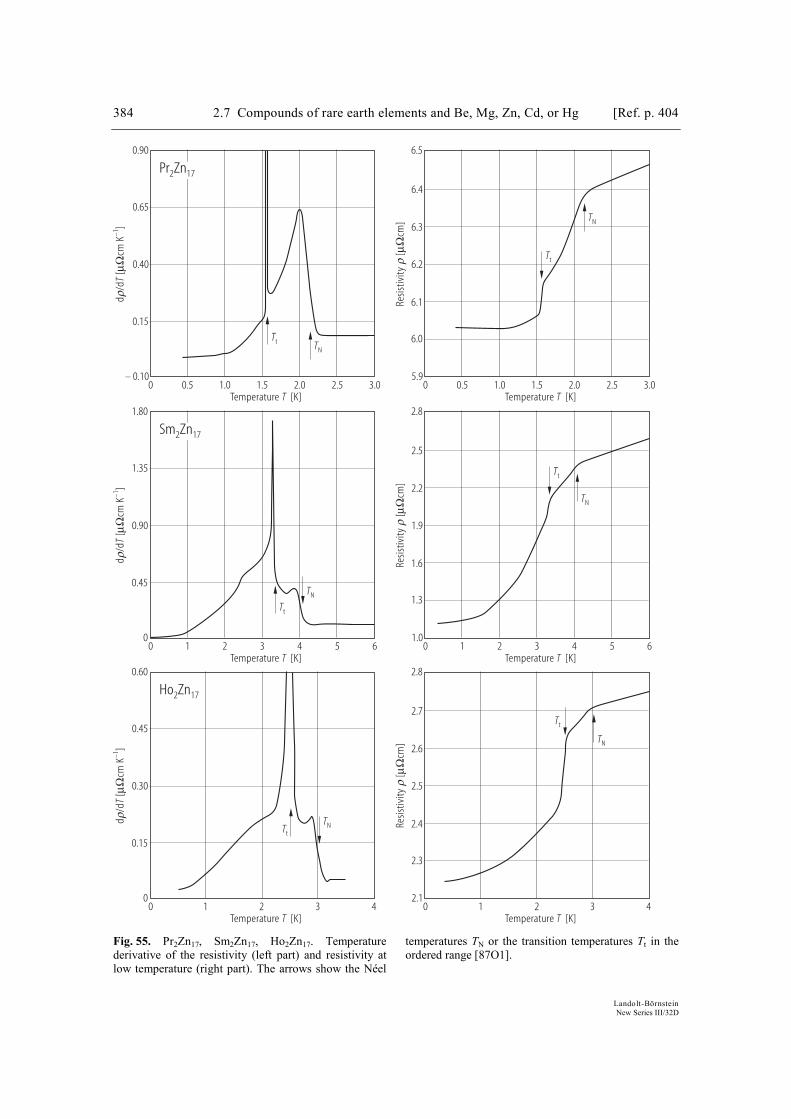
384 2.7 Compounds of rare earth elements and Be, Mg, Zn, Cd, or Hg [Ref. p. 404
Landolt-Börnstein New Series III/32D
0 3.0Temperature [K]T
0.15
0.90
0.65
0.5 1.0 1.5 2.0 2.5
Tt
TN
Pr Zn2 17
Resis
tivity
[cm
]r
mW
– 0.10
0.40
0 3.0Temperature [K]T
6.0
6.5
6.4
0.5 1.0 1.5 2.0 2.5
d/d
[cm
K]
rT
mW–1
5.9
6.2
6.1
6.3
Tt TN
0 6Temperature [K]T
0.45
1.80
1.35
1 2 3 4 5
Tt
TN
Sm Zn2 17
Resis
tivity
[cm
]r
mW
0
0.90
0 6Temperature [K]T
1.3
2.8
2.5
1 2 3 4 5
d/d
[cm
K]
rT
mW–1
1.0
1.9
1.6
2.2
Tt
TN
0Temperature [K]T
0.15
0.60
0.45
1 2 3 4
Tt
TN
Ho Zn2 17
Resis
tivity
[cm
]r
mW
0
0.30
0Temperature [K]T
2.3
2.8
2.7
1 2 3 4
d/d
[cm
K]
rT
mW–1
2.1
2.5
2.4
2.6
Tt
TN
Fig. 55. Pr2Zn17, Sm2Zn17, Ho2Zn17. Temperature derivative of the resistivity (left part) and resistivity at low temperature (right part). The arrows show the Néel
temperatures TN or the transition temperatures Tt in the ordered range [87O1].
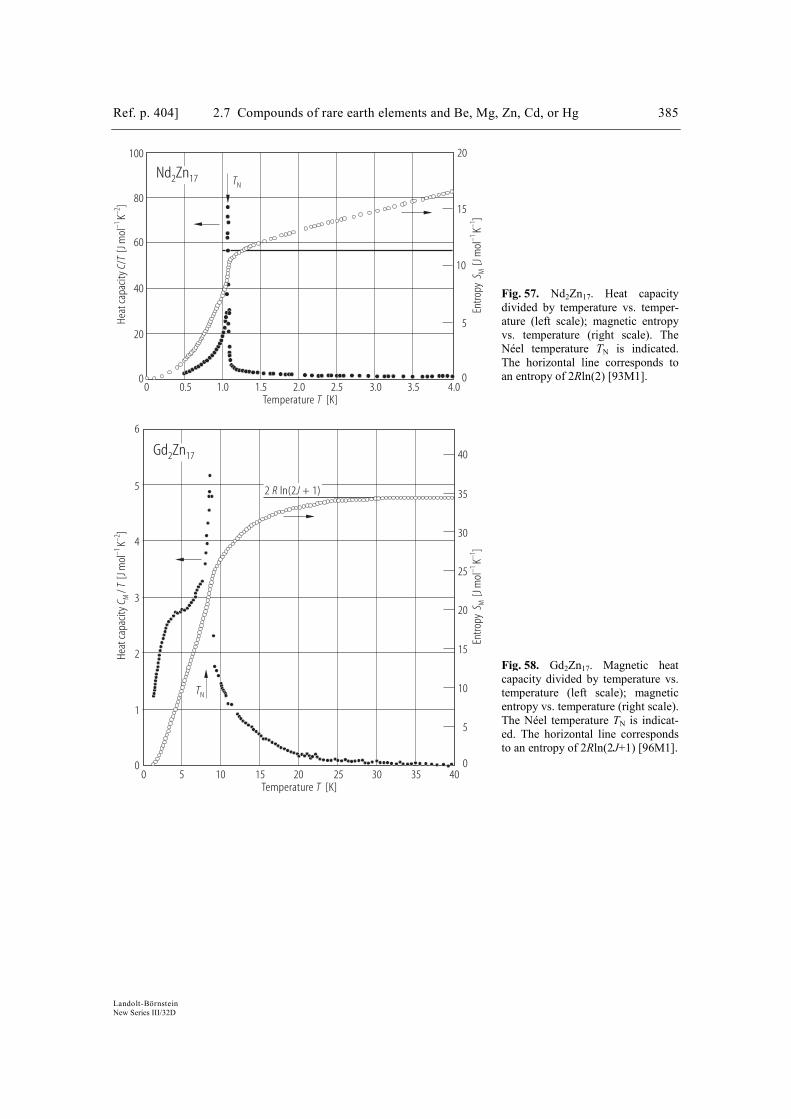
Ref. p. 404] 2.7 Compounds of rare earth elements and Be, Mg, Zn, Cd, or Hg 385
Landolt-Börnstein New Series III/32D
0 0.5 1.5 2.0 2.5 4.00
40
5
0
20
10
60
1580
100
3.5
20
Temperature [K]T
Entro
py[J
mol
K]
S M–1
–1
1.0 3.0
Heat
capa
city
/[J
mol
K]
CT
–1–2
Nd Zn2 17 TN
0 5 10 15 20 25 30Temperature [K]T
35 40
5
20
25
30
35
0
2
0
1
3
4
6
5En
tropy
[J m
olK
]S M
–1–1
Heat
capa
city
/[J
mol
K]
CT
M–1
–2
Gd Zn2 17
TN
2 ln(2 + 1)R J
15
10
40
Fig. 57. Nd2Zn17. Heat capacity divided by temperature vs. temper-ature (left scale); magnetic entropy vs. temperature (right scale). The Néel temperature TN is indicated. The horizontal line corresponds to an entropy of 2Rln(2) [93M1].
Fig. 58. Gd2Zn17. Magnetic heat capacity divided by temperature vs. temperature (left scale); magnetic entropy vs. temperature (right scale). The Néel temperature TN is indicat-ed. The horizontal line corresponds to an entropy of 2Rln(2J+1) [96M1].
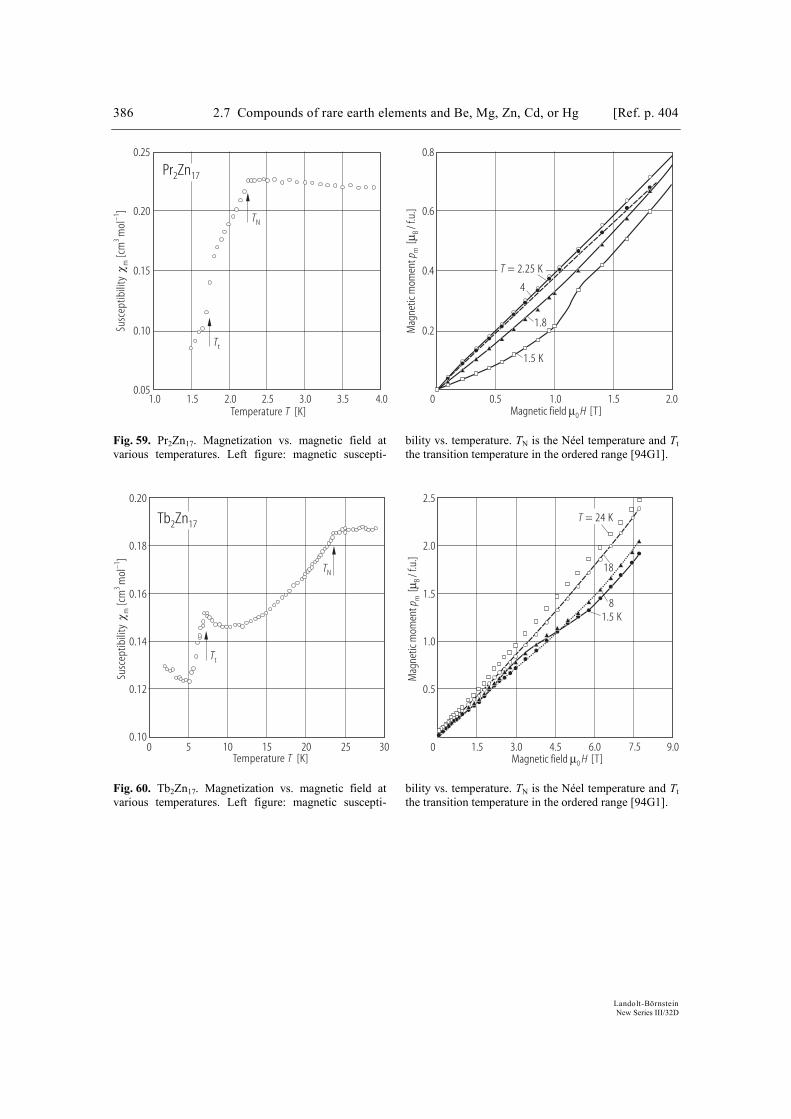
386 2.7 Compounds of rare earth elements and Be, Mg, Zn, Cd, or Hg [Ref. p. 404
Landolt-Börnstein New Series III/32D
4.03.51.51.0 2.0 2.5 3.00.05
0.10
0.15
0.20
0.25
Susc
eptib
ility
[cm
mol
]χ m
3–1
Temperature [K]T
Pr Zn2 17
Tt
TN
0 0.5 1.0 1.5 2.0Magnetic field [T]µ0 H
0.2
0.4
0.6
0.8
Mag
netic
mom
ent
[/ f
.u.]
p mBµ
T = 2.25 K
4
1.8
1.5 K
Fig. 59. Pr2Zn17. Magnetization vs. magnetic field at various temperatures. Left figure: magnetic suscepti-
bility vs. temperature. TN is the Néel temperature and Tt the transition temperature in the ordered range [94G1].
5 10 15 20 25 30Temperature [K]T
0
0.12
0.14
0.16
0.18
0.20
0.10
Susc
eptib
ility
[cm
mol
]χ m
3–1
Tb Zn2 17
Tt
TN
1.5 3.0 4.5 6.0 7.5 9.00
0.5
1.0
1.5
2.0
2.5
Magnetic field [T]µ0 H
Mag
netic
mom
ent
[/ f
.u.]
p mBµ
T = 24 K
18
81.5 K
Fig. 60. Tb2Zn17. Magnetization vs. magnetic field at various temperatures. Left figure: magnetic suscepti-
bility vs. temperature. TN is the Néel temperature and Tt the transition temperature in the ordered range [94G1].
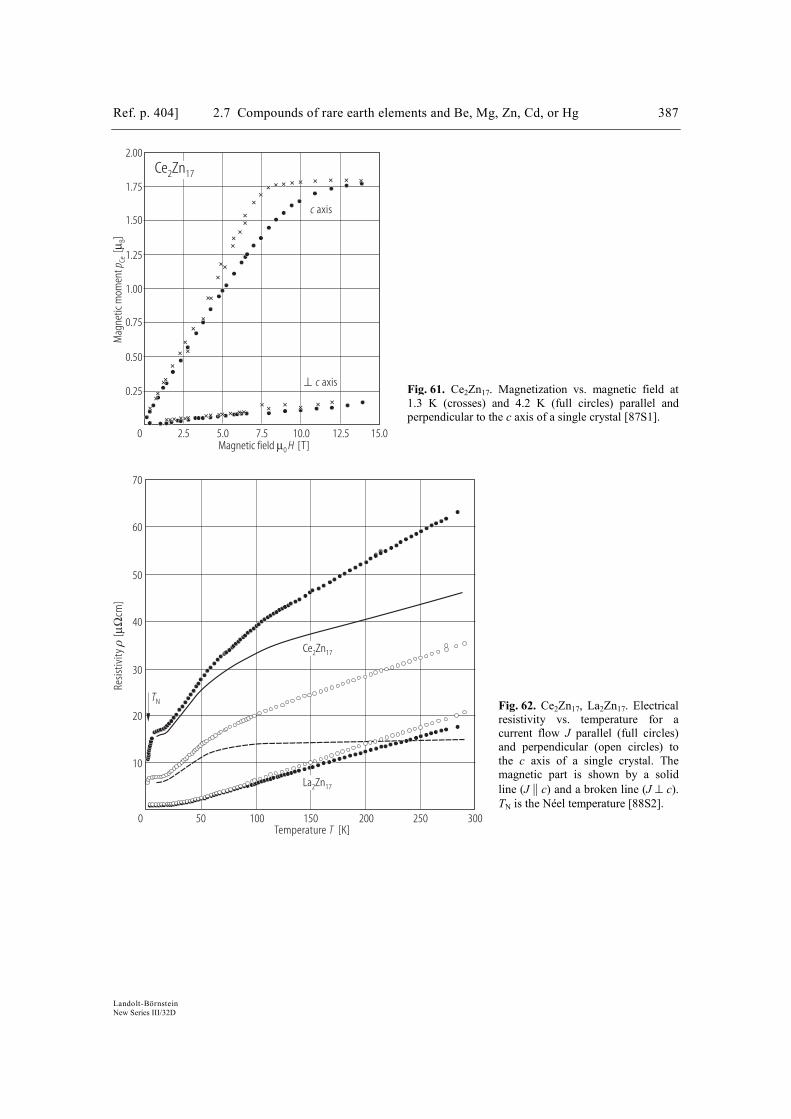
Ref. p. 404] 2.7 Compounds of rare earth elements and Be, Mg, Zn, Cd, or Hg 387
Landolt-Börnstein New Series III/32D
0.75
1.50
0.25
1.00
1.75
0.50
1.25
2.00
0 2.5 5.0 7.5 10.0 12.5 15.0
Ce Zn2 17
Magnetic field [T]µ0 H
Mag
netic
mom
ent
[]
p CeBµ
c axis
⊥ c axis
10
20
70
30
40
60
50
Resis
tivity
[cm
]ρ
µΩ
Temperature [K]T0 50 100 150 200 250 300
Ce Zn2 17
La Zn2 17
TN
Fig. 61. Ce2Zn17. Magnetization vs. magnetic field at 1.3 K (crosses) and 4.2 K (full circles) parallel and perpendicular to the c axis of a single crystal [87S1].
Fig. 62. Ce2Zn17, La2Zn17. Electrical resistivity vs. temperature for a current flow J parallel (full circles) and perpendicular (open circles) to the c axis of a single crystal. The magnetic part is shown by a solid line (J || c) and a broken line (J ⊥ c). TN is the Néel temperature [88S2].
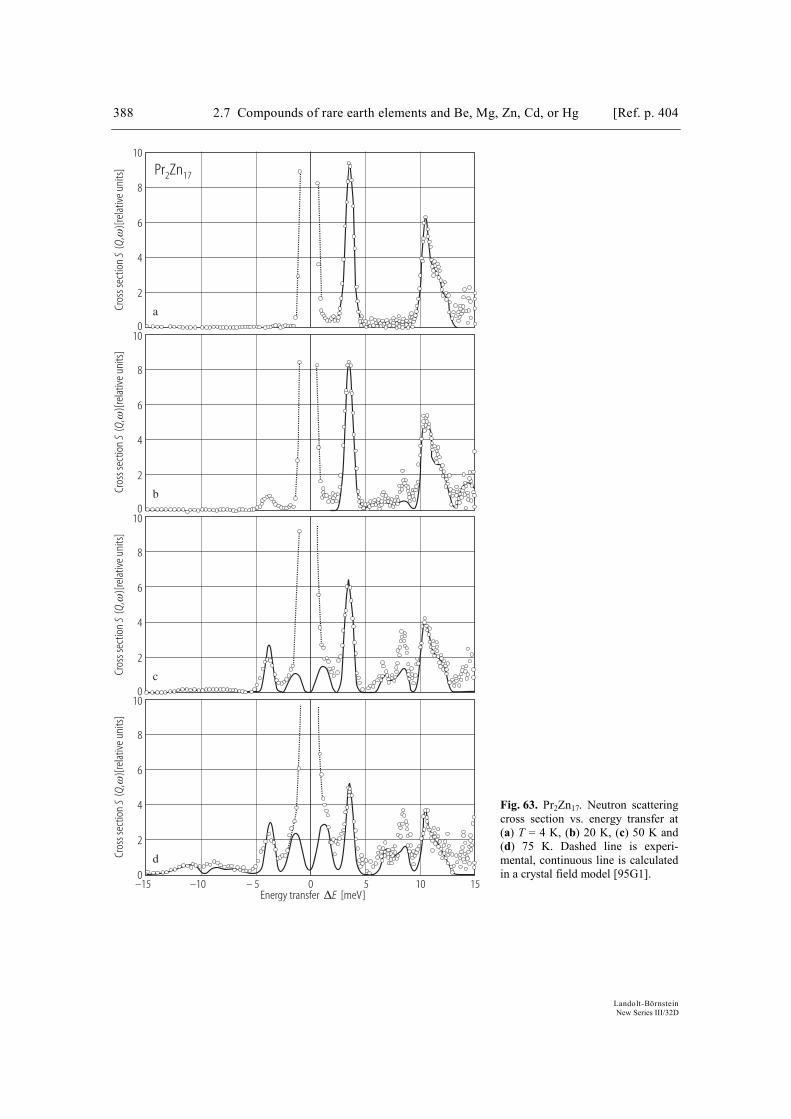
388 2.7 Compounds of rare earth elements and Be, Mg, Zn, Cd, or Hg [Ref. p. 404
Landolt-Börnstein New Series III/32D
–15 –10 – 5 0 5 10 150
10
Energy transfer [meV]∆E
Cros
s sec
tion
(,
)[rel
ativ
e un
its]
SQ
ω
2
4
8
6
d
0
10
Cros
s sec
tion
(,
)[rel
ativ
e un
its]
SQ
ω
2
4
8
6
c
0
10
Cros
s sec
tion
(,
)[rel
ativ
e un
its]
SQ
ω
2
4
8
6
b
0
10
Cros
s sec
tion
(,
)[rel
ativ
e un
its]
SQ
ω
2
4
8
6
Pr Zn2 17
a
Fig. 63. Pr2Zn17. Neutron scattering cross section vs. energy transfer at (a) T = 4 K, (b) 20 K, (c) 50 K and (d) 75 K. Dashed line is experi-mental, continuous line is calculated in a crystal field model [95G1].
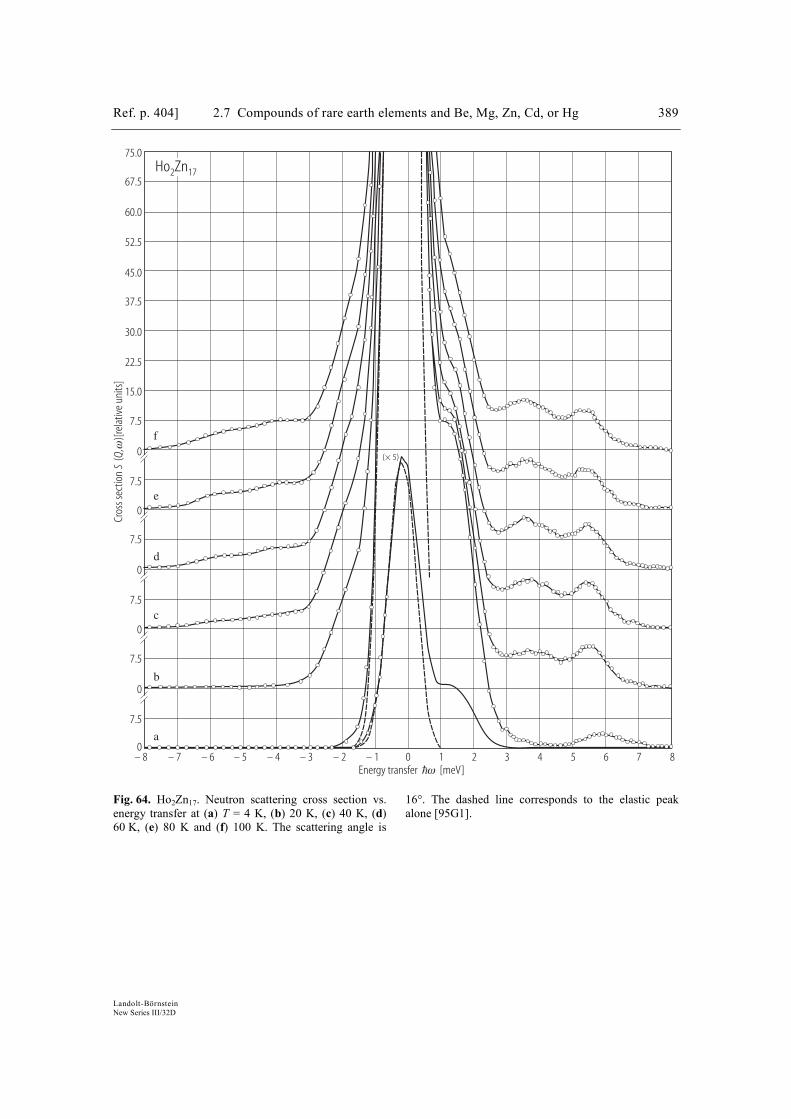
Ref. p. 404] 2.7 Compounds of rare earth elements and Be, Mg, Zn, Cd, or Hg 389
Landolt-Börnstein New Series III/32D
0
7.5
0
0
7.5
0
Energy transfer [meV]ω
7.5
0
7.5
– 8 8– 7 – 6 – 5 – 4 – 3 – 2 – 1 0 1 2 3 4 5 6 7
22.5
15.0
30.0
37.5
45.0
7.5
0
7.5
52.5
60.0
67.5
75.0
d
c
Cros
s sec
tion
(,
)[rel
ativ
e un
its]
SQ
ω
b
Ho Zn2 17
f
e
a
(× 5)
Fig. 64. Ho2Zn17. Neutron scattering cross section vs. energy transfer at (a) T = 4 K, (b) 20 K, (c) 40 K, (d) 60 K, (e) 80 K and (f) 100 K. The scattering angle is
16°. The dashed line corresponds to the elastic peak alone [95G1].
References
87O1 Olivier, M., Siegrist, T., McAlister, S.P.: J. Magn. Magn. Mater. 63-64 (1987) 281 87S1 Sato, N., Kontani, M., Abe, H., Adachi, K.: J. Magn. Magn. Mater. 70 (1987) 372 88S2 Sato, N., Kontani, M., Abe, H., Adachi, K.: J. Phys. Soc. Jpn. 57 (1988) 1069 93M1 Marquina, C., Kim-Ngan, N.H., Bakker, K., Radwanski, R.J., Jacobs, T.H., Buschow, K.H.J.,
Franse, J.J.M., Ibarra, M.R.: J. Phys.: Condens. Matter 5 (1993) 2009 94G1 Gignoux, D., Schmitt, D., Garcia-Landa, B., Ibarra, M.R., Marquina, C.: J. Alloys
Compounds 210 (1994) 91 95G1 Garcia-Landa, B., Ibarra, M.R., Algarabel, P.A., Moze, O.: Phys. Rev. B 51 (1995) 15132 96M1 Marquina, C., Kim-Ngan, N.H., Buschow, K.H.J., Franse, J.J.M., Ibarra, M.R.: J. Magn.
Magn. Mater. 157-158 (1996) 403
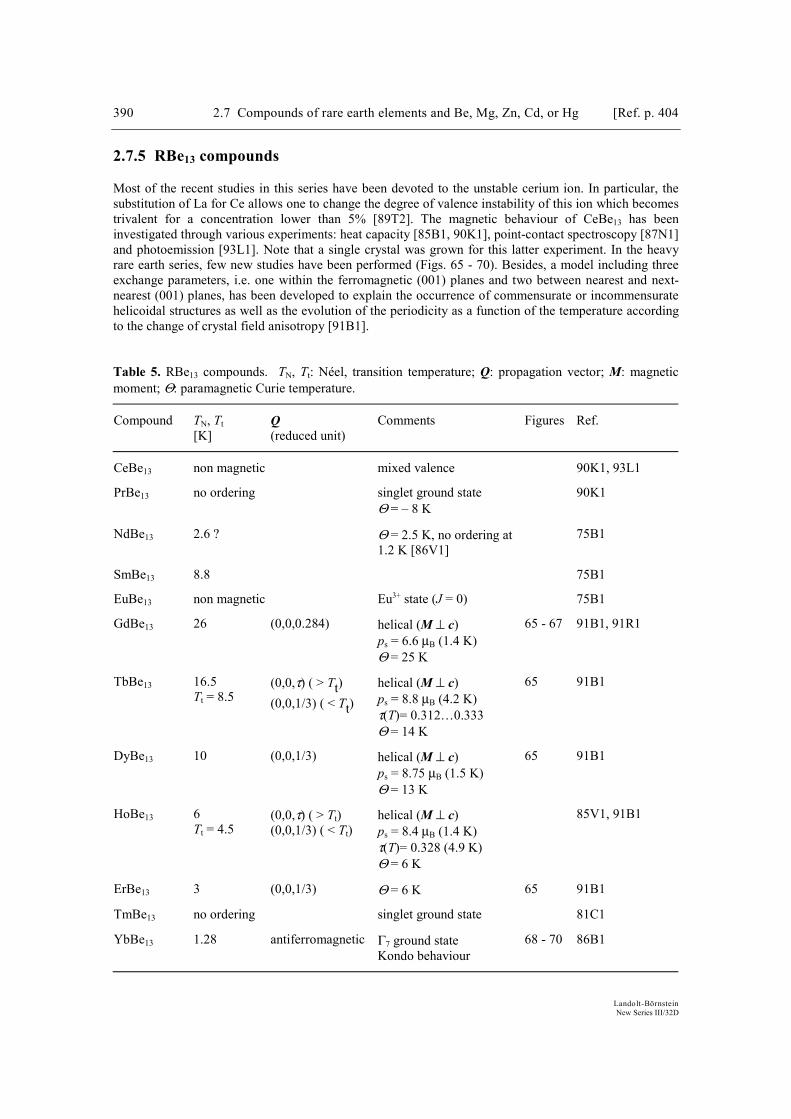
390 2.7 Compounds of rare earth elements and Be, Mg, Zn, Cd, or Hg [Ref. p. 404
Landolt-Börnstein New Series III/32D
2.7.5 RBe13 compounds
Most of the recent studies in this series have been devoted to the unstable cerium ion. In particular, the substitution of La for Ce allows one to change the degree of valence instability of this ion which becomes trivalent for a concentration lower than 5% [89T2]. The magnetic behaviour of CeBe13 has been investigated through various experiments: heat capacity [85B1, 90K1], point-contact spectroscopy [87N1] and photoemission [93L1]. Note that a single crystal was grown for this latter experiment. In the heavy rare earth series, few new studies have been performed (Figs. 65 - 70). Besides, a model including three exchange parameters, i.e. one within the ferromagnetic (001) planes and two between nearest and next-nearest (001) planes, has been developed to explain the occurrence of commensurate or incommensurate helicoidal structures as well as the evolution of the periodicity as a function of the temperature according to the change of crystal field anisotropy [91B1]. Table 5. RBe13 compounds. TN, Tt: Néel, transition temperature; Q: propagation vector; M: magnetic moment; Θ: paramagnetic Curie temperature.
Compound TN, Tt [K]
Q (reduced unit)
Comments Figures Ref.
CeBe13 non magnetic mixed valence 90K1, 93L1
PrBe13 no ordering singlet ground state Θ = – 8 K
90K1
NdBe13 2.6 ? Θ = 2.5 K, no ordering at 1.2 K [86V1]
75B1
SmBe13 8.8 75B1
EuBe13 non magnetic Eu3+ state (J = 0) 75B1
GdBe13 26 (0,0,0.284) helical (M ⊥ c) ps = 6.6 µB (1.4 K) Θ = 25 K
65 - 67 91B1, 91R1
TbBe13 16.5 Tt = 8.5
(0,0,τ) ( > Tt) (0,0,1/3) ( < Tt)
helical (M ⊥ c) ps = 8.8 µB (4.2 K) τ(T)= 0.312…0.333 Θ = 14 K
65 91B1
DyBe13 10 (0,0,1/3) helical (M ⊥ c) ps = 8.75 µB (1.5 K) Θ = 13 K
65 91B1
HoBe13 6 Tt = 4.5
(0,0,τ) ( > Tt) (0,0,1/3) ( < Tt)
helical (M ⊥ c) ps = 8.4 µB (1.4 K) τ(T)= 0.328 (4.9 K) Θ = 6 K
85V1, 91B1
ErBe13 3 (0,0,1/3) Θ = 6 K 65 91B1
TmBe13 no ordering singlet ground state 81C1
YbBe13 1.28 antiferromagnetic Γ7 ground state Kondo behaviour
68 - 70 86B1
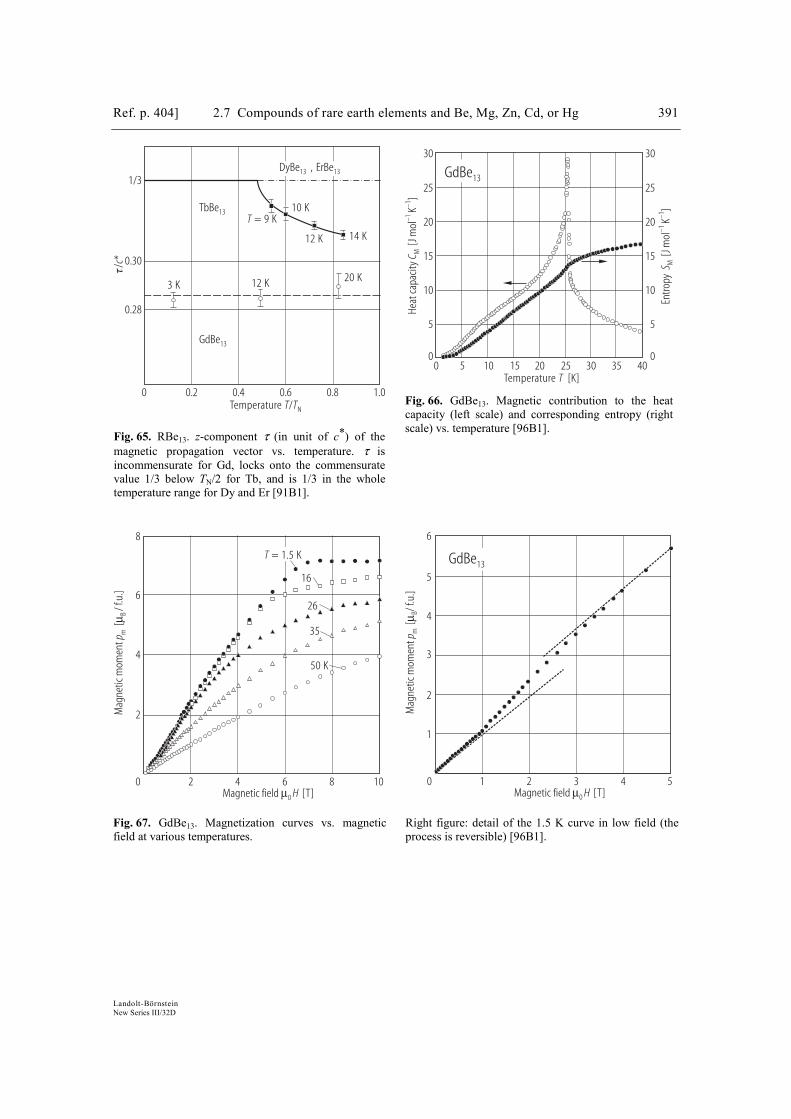
Ref. p. 404] 2.7 Compounds of rare earth elements and Be, Mg, Zn, Cd, or Hg 391
Landolt-Börnstein New Series III/32D
τ/c*
0 0.2 0.4 0.6 0.8 1.0Temperature /T TN
1/3
0.30
0.28
DyBe ErBe13 13,
TbBe13
GdBe13
T = 9 K10 K
12 K 14 K
3 K 12 K 20 K
Fig. 65. RBe13. z-component τ (in unit of c*) of the magnetic propagation vector vs. temperature. τ is incommensurate for Gd, locks onto the commensuratevalue 1/3 below TN/2 for Tb, and is 1/3 in the wholetemperature range for Dy and Er [91B1].
Heat
capa
city
[J m
olK
]C M
–1–1
Entro
py[J
mol
K]
S M–1
–1
5
0
10
15
20
25
Temperature [K]T10 15 25 4020 35
30
5
0
10
15
20
25
30
50 30
GdBe13
Fig. 66. GdBe13. Magnetic contribution to the heat capacity (left scale) and corresponding entropy (right scale) vs. temperature [96B1].
Mag
netic
mom
ent
[/ f
.u.]
p mBµ
Magnetic field [T]µ0 H
4
3
5
6
0 1 2 3 4 5
Mag
netic
mom
ent
[/ f
.u.]
p mBµ
Magnetic field [T]µ0 H
2
4
6
8
0 2 4 6 8 10
GdBe13
H ↑H ↓
T = 1.5 K
16
26
35
50 K
1
2
Fig. 67. GdBe13. Magnetization curves vs. magnetic field at various temperatures.
Right figure: detail of the 1.5 K curve in low field (the process is reversible) [96B1].
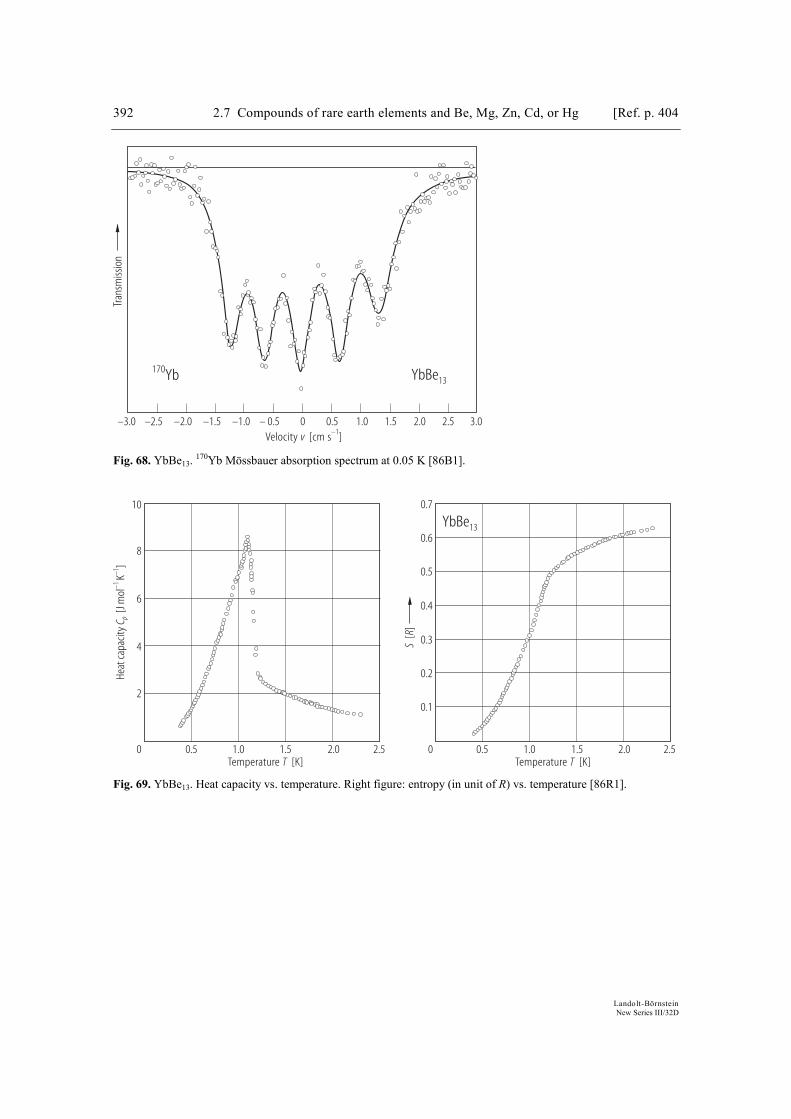
392 2.7 Compounds of rare earth elements and Be, Mg, Zn, Cd, or Hg [Ref. p. 404
Landolt-Börnstein New Series III/32D
–2.5 –2.0 –1.5 0 1.5 3.0–3.0
Tran
smiss
ion
–1.0 0.5– 0.5 1.0Velocity [cm s ]v –1
2.0 2.5
YbBe13170Yb
Fig. 68. YbBe13. 170Yb Mössbauer absorption spectrum at 0.05 K [86B1].
0 0.5 1.0 1.5 2.0 2.5
SR[
]
0.1
0.2
0.3
0.4
0.5
0.6
0.7
Heat
capa
city
[J m
olK
]C p
–1–1
0 0.5 1.0 1.5 2.0 2.5Temperature [K]T
8
6
4
2
10
Temperature [K]T
YbBe13
Fig. 69. YbBe13. Heat capacity vs. temperature. Right figure: entropy (in unit of R) vs. temperature [86R1].

Ref. p. 404] 2.7 Compounds of rare earth elements and Be, Mg, Zn, Cd, or Hg 393
Landolt-Börnstein New Series III/32D
– 1.00
– 0.25
0.50
– 0.75
0
0.75
– 0.50
0.25
1.00
Energy [meV]E
d/d
[rela
tive
units
]2
2V
T
–30 –20 –10 0 10 20 30
YbBe13
2.7.6 Other X-rich compounds
Apart from the rare earth series quoted above, the other X-rich compounds have been little investigated in the past decade (Figs. 71 - 78). The main studies involve cerium ion in relation with its possible Kondo or heavy fermion behaviour. Several binary compounds with magnesium as well as the corresponding pseudo-ternary (diluted) compounds Ce-Y-Mg have been investigated, showing magnetic results consistent with a normal Ce3+state [96F1]. Some anomalous effects nevertheless are present, as shown in CeMg3 through the temperature dependence of the thermoelectric power (Fig. 71) [88S1] and of the quasielastic linewidth in neutron scattering spectra [87L1]. Compounds with cadmium at different stoichiometries have also been studied and do not exhibit heavy fermion behaviour (Table 6). Finally, a study of the pseudo-ternary compounds EuxSr1–xMg5.2, (EuxSr1–x)3Mg13 and Eu(Mg1–-xAlx)5.2 has been performed in relation with the magnetism of europium clusters [88L1, 92L1], while the magnetic behaviour of the pseudo-ternary compounds YbMxGa4–x (M = Zn, Cd) is characterized by a non-magnetic Yb2+ groundstate [95G3]. Table 6. X-rich compounds. TN: Néel temperature; Θ: paramagnetic Curie temperature; peff: effective paramagnetic moment.
Compound TN [K]
Θ [K]
peff [µB]
Comments Figures Ref.
CeCd2 ≈ 20 – 56 2.65 two peaks at 18.5 and 22 K in the heat capacity curve
89T1
CeCd3 2 – 52 2.60 89T1 Ce13Cd58 < 1.3 – 12 2.60 89T1 CeCd6 < 1.3 – 9.5 2.53 89T1 CeCd11 < 1.3 – 7.8 2.57 77 89T1 PrCd11 < 1.2 ≈ 0 ≈ 3.58 78 92M1 CeZn11 2.0 – 1.83 2.34 76 93N1
Fig. 70. YbBe13. d2V/dT2 spectrum of point contact vs. energy (corresponding to the applied voltage) at 1.6 K [87N1].
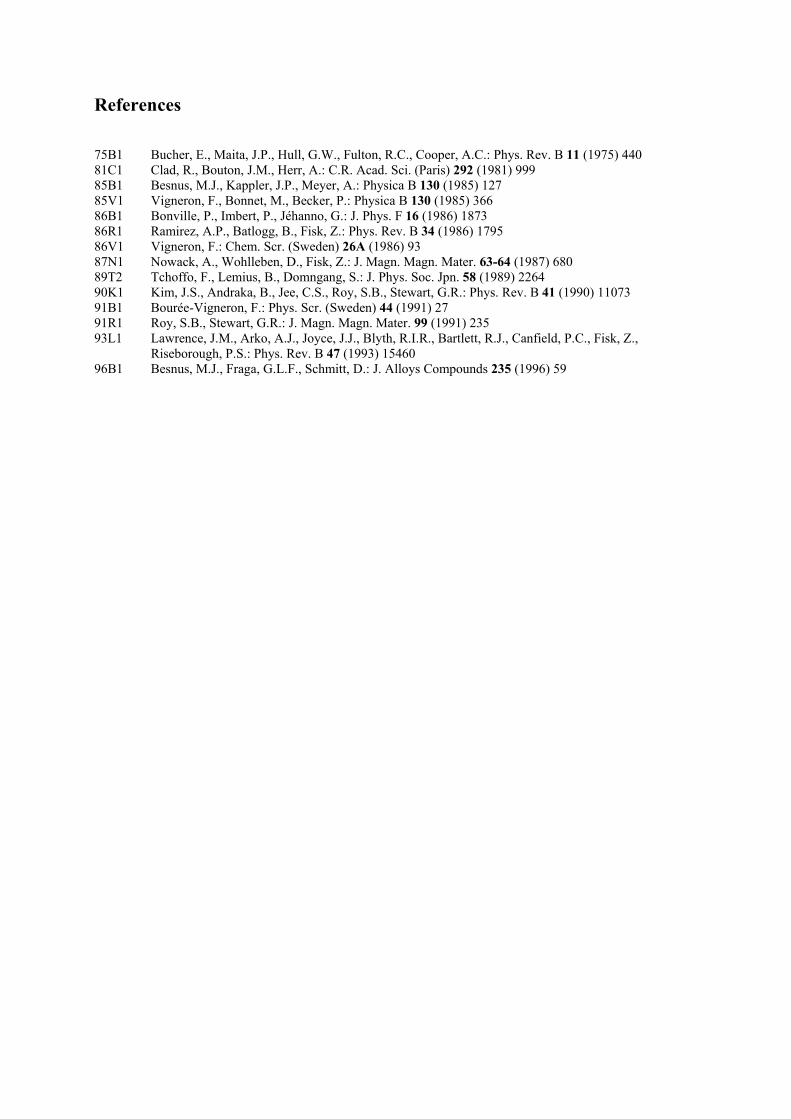
References
75B1 Bucher, E., Maita, J.P., Hull, G.W., Fulton, R.C., Cooper, A.C.: Phys. Rev. B 11 (1975) 440 81C1 Clad, R., Bouton, J.M., Herr, A.: C.R. Acad. Sci. (Paris) 292 (1981) 999 85B1 Besnus, M.J., Kappler, J.P., Meyer, A.: Physica B 130 (1985) 127 85V1 Vigneron, F., Bonnet, M., Becker, P.: Physica B 130 (1985) 366 86B1 Bonville, P., Imbert, P., Jéhanno, G.: J. Phys. F 16 (1986) 1873 86R1 Ramirez, A.P., Batlogg, B., Fisk, Z.: Phys. Rev. B 34 (1986) 1795 86V1 Vigneron, F.: Chem. Scr. (Sweden) 26A (1986) 93 87N1 Nowack, A., Wohlleben, D., Fisk, Z.: J. Magn. Magn. Mater. 63-64 (1987) 680 89T2 Tchoffo, F., Lemius, B., Domngang, S.: J. Phys. Soc. Jpn. 58 (1989) 2264 90K1 Kim, J.S., Andraka, B., Jee, C.S., Roy, S.B., Stewart, G.R.: Phys. Rev. B 41 (1990) 11073 91B1 Bourée-Vigneron, F.: Phys. Scr. (Sweden) 44 (1991) 27 91R1 Roy, S.B., Stewart, G.R.: J. Magn. Magn. Mater. 99 (1991) 235 93L1 Lawrence, J.M., Arko, A.J., Joyce, J.J., Blyth, R.I.R., Bartlett, R.J., Canfield, P.C., Fisk, Z.,
Riseborough, P.S.: Phys. Rev. B 47 (1993) 15460 96B1 Besnus, M.J., Fraga, G.L.F., Schmitt, D.: J. Alloys Compounds 235 (1996) 59
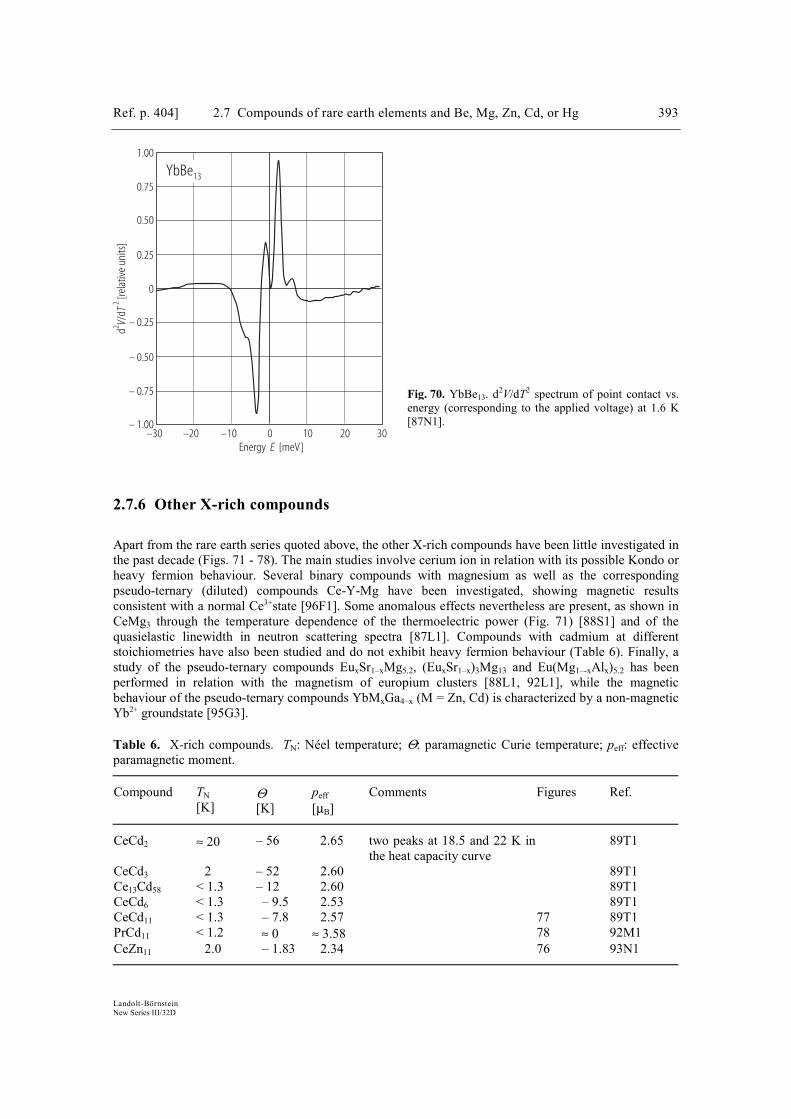
Ref. p. 404] 2.7 Compounds of rare earth elements and Be, Mg, Zn, Cd, or Hg 393
Landolt-Börnstein New Series III/32D
– 1.00
– 0.25
0.50
– 0.75
0
0.75
– 0.50
0.25
1.00
Energy [meV]E
d/d
[rela
tive
units
]2
2V
T
–30 –20 –10 0 10 20 30
YbBe13
2.7.6 Other X-rich compounds
Apart from the rare earth series quoted above, the other X-rich compounds have been little investigated in the past decade (Figs. 71 - 78). The main studies involve cerium ion in relation with its possible Kondo or heavy fermion behaviour. Several binary compounds with magnesium as well as the corresponding pseudo-ternary (diluted) compounds Ce-Y-Mg have been investigated, showing magnetic results consistent with a normal Ce3+state [96F1]. Some anomalous effects nevertheless are present, as shown in CeMg3 through the temperature dependence of the thermoelectric power (Fig. 71) [88S1] and of the quasielastic linewidth in neutron scattering spectra [87L1]. Compounds with cadmium at different stoichiometries have also been studied and do not exhibit heavy fermion behaviour (Table 6). Finally, a study of the pseudo-ternary compounds EuxSr1–xMg5.2, (EuxSr1–x)3Mg13 and Eu(Mg1–-xAlx)5.2 has been performed in relation with the magnetism of europium clusters [88L1, 92L1], while the magnetic behaviour of the pseudo-ternary compounds YbMxGa4–x (M = Zn, Cd) is characterized by a non-magnetic Yb2+ groundstate [95G3]. Table 6. X-rich compounds. TN: Néel temperature; Θ: paramagnetic Curie temperature; peff: effective paramagnetic moment.
Compound TN [K]
Θ [K]
peff [µB]
Comments Figures Ref.
CeCd2 ≈ 20 – 56 2.65 two peaks at 18.5 and 22 K in the heat capacity curve
89T1
CeCd3 2 – 52 2.60 89T1 Ce13Cd58 < 1.3 – 12 2.60 89T1 CeCd6 < 1.3 – 9.5 2.53 89T1 CeCd11 < 1.3 – 7.8 2.57 77 89T1 PrCd11 < 1.2 ≈ 0 ≈ 3.58 78 92M1 CeZn11 2.0 – 1.83 2.34 76 93N1
Fig. 70. YbBe13. d2V/dT2 spectrum of point contact vs. energy (corresponding to the applied voltage) at 1.6 K [87N1].
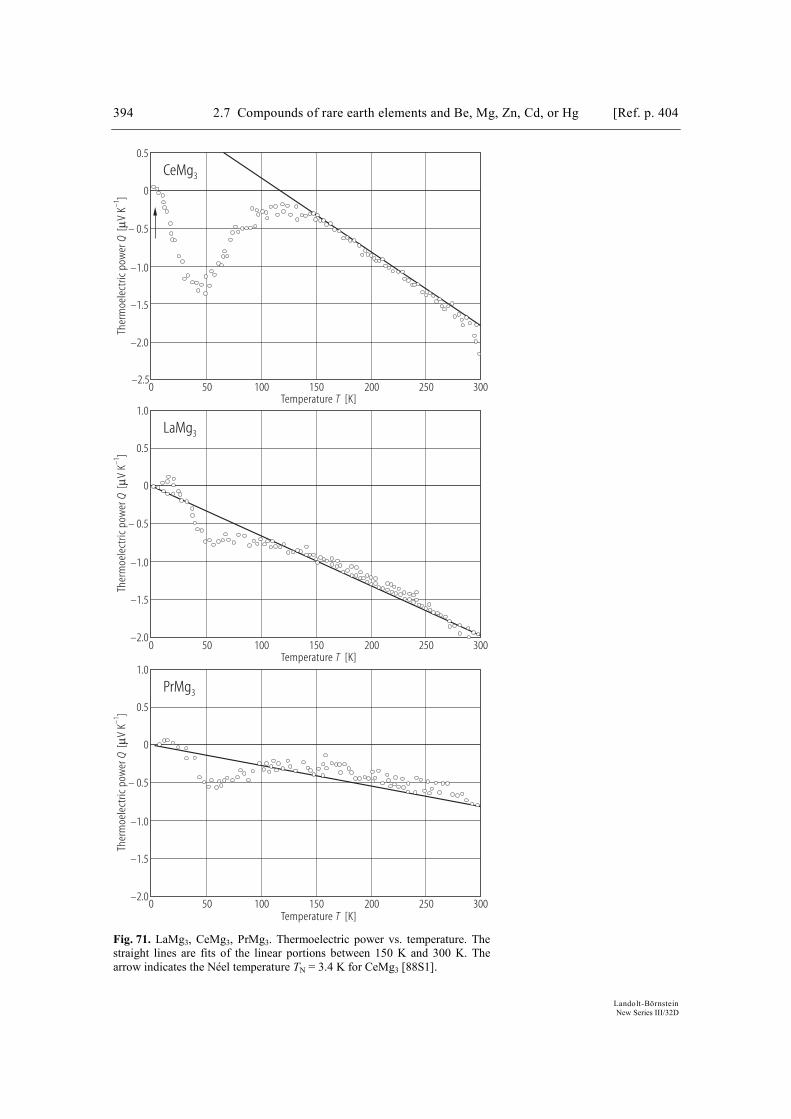
394 2.7 Compounds of rare earth elements and Be, Mg, Zn, Cd, or Hg [Ref. p. 404
Landolt-Börnstein New Series III/32D
0 50 100 150 200 250 300
–2.0
–1.5
–1.0
0
– 0.5
0.5
Ther
moe
lect
ricpo
wer
[V
K]
Qµ
–1
Temperature [K]T
CeMg3
–2.0
–1.5
–1.0
0
– 0.5
0.5
1.0
Ther
moe
lect
ricpo
wer
[V
K]
Qµ
–1
Temperature [K]T
LaMg3
–2.0
–1.5
–1.0
0
– 0.5
0.5
1.0
Ther
moe
lect
ricpo
wer
[V
K]
Qµ
–1
Temperature [K]T
PrMg3
0 50 100 150 200 250 300
0 50 100 150 200 250 300
–2.5
Fig. 71. LaMg3, CeMg3, PrMg3. Thermoelectric power vs. temperature. The straight lines are fits of the linear portions between 150 K and 300 K. The arrow indicates the Néel temperature TN = 3.4 K for CeMg3 [88S1].

Ref. p. 404] 2.7 Compounds of rare earth elements and Be, Mg, Zn, Cd, or Hg 395
Landolt-Börnstein New Series III/32D
For Fig. 72 see p. 397.
– 40 – 30 – 20 0 10 30 400
0.5
1.0
2.0
1.5
2.5
3.0
Cros
s sec
tion
(,
)S
Qm
ω
Energy transfer [meV]∆E– 10 20
a
– 40 – 30 – 20 0 10 30 400
0.5
1.0
2.0
1.5
Energy transfer [meV]∆E– 10 20
b
– 40 – 30 – 20 0 10 30 400
0.5
1.0
2.0
1.5
Energy transfer [meV]∆E– 10 20
c
CeZn5
Cros
s sec
tion
(,
)S
Qm
ωCr
oss s
ectio
n(
,)
SQ
mω
Fig. 73. CeZn5. Magnetic neutron scattering cross section vs. energy transfer at (a) T = 8 K, (b) 120 K and (c) 250 K. The incident neutron energy is E0 = 67 meV. Continuous lines are least square fits [90G1].
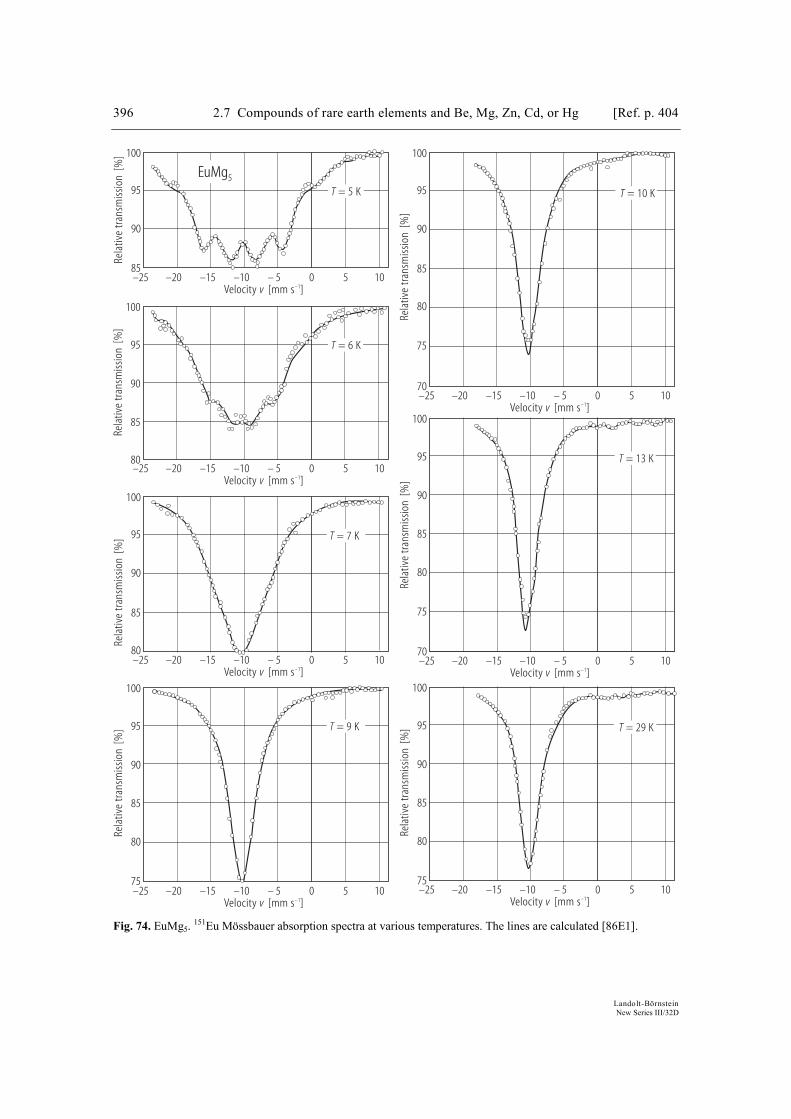
396 2.7 Compounds of rare earth elements and Be, Mg, Zn, Cd, or Hg [Ref. p. 404
Landolt-Börnstein New Series III/32D
Rela
tive
tran
smiss
ion
[%]
85
90
95
100
EuMg5
T = 5 K
Rela
tive
tran
smiss
ion
[%]
80
85
90
95
100
T = 6 K
Rela
tive
tran
smiss
ion
[%]
80
85
90
95
100
T = 7 K
Rela
tive
tran
smiss
ion
[%]
–25 –20 – 5–15 0–10 5 10Velocity [mm s ]v –1
80
85
90
95
100
T = 9 K
75
Rela
tive
tran
smiss
ion
[%]
–25 –20 – 5–15 0–10 5 10Velocity [mm s ]v –1
80
85
90
95
100
T = 10 K
Rela
tive
tran
smiss
ion
[%]
–25 –20 – 5–15 0–10 5 10Velocity [mm s ]v –1
80
85
90
95
100
T = 13 K
75
75
–25 –20 – 5–15 0–10 5 10Velocity [mm s ]v –1
–25 –20 – 5–15 0–10 5 10Velocity [mm s ]v –1
–25 –20 – 5–15 0–10 5 10Velocity [mm s ]v –1
Rela
tive
tran
smiss
ion
[%]
–25 –20 – 5–15 0–10 5 10Velocity [mm s ]v –1
80
85
90
95
100
T = 29 K
75
70
70
Fig. 74. EuMg5. 151Eu Mössbauer absorption spectra at various temperatures. The lines are calculated [86E1].
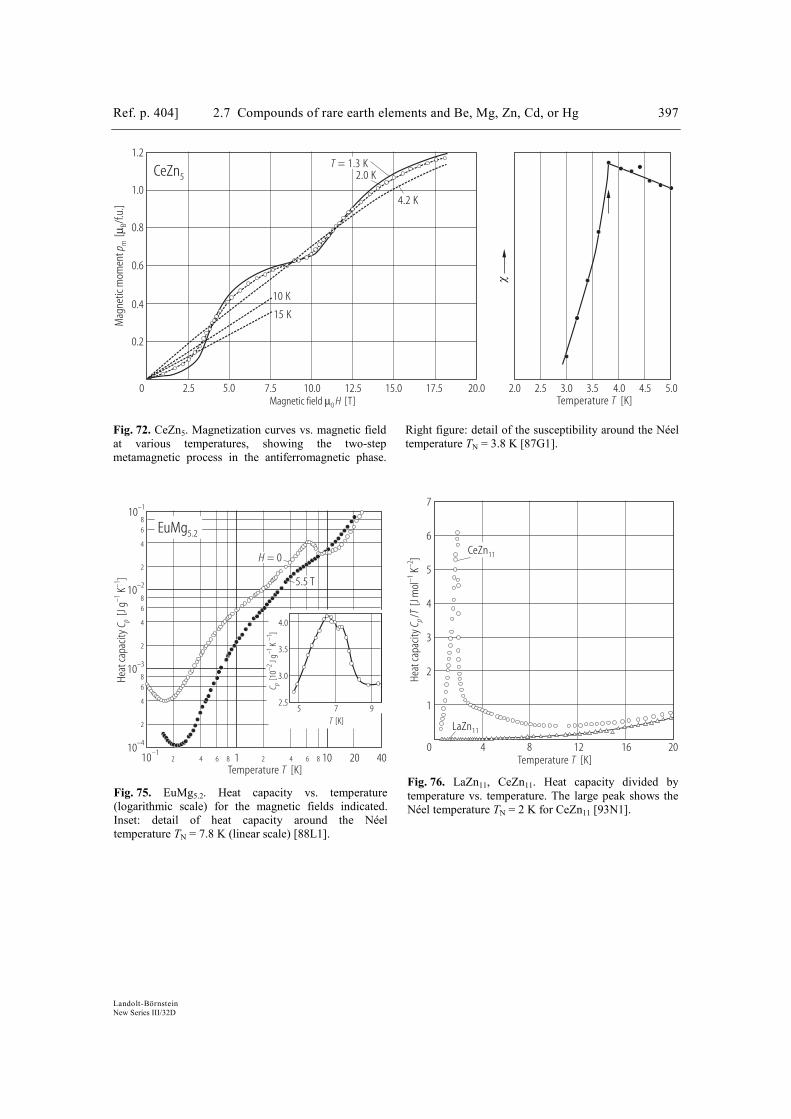
Ref. p. 404] 2.7 Compounds of rare earth elements and Be, Mg, Zn, Cd, or Hg 397
Landolt-Börnstein New Series III/32D
0 2.5 5.0 10.0 12.5 17.5 20.0
0.2
0.4
0.8
0.6
1.0
1.2
Mag
netic
mom
ent
[/f.
u.]
p mBµ
Magnetic field [T]µ0 H7.5 15.0
CeZn5
Temperature [K]T2.0 2.5 3.0 3.5 4.0 4.5 5.0
χ
T = 1.3 K2.0 K
4.2 K
10 K
15 K
Fig. 72. CeZn5. Magnetization curves vs. magnetic field at various temperatures, showing the two-step metamagnetic process in the antiferromagnetic phase.
Right figure: detail of the susceptibility around the Néel temperature TN = 3.8 K [87G1].
2
4
68
10–4
10–1
Heat
capa
city
[J g
K]
C p–1
–1
Temperature [K]T1010–1
10–3
10–2
2
4
68
2
4
68
42 6 8 1 20 4042 6 8
EuMg5.2
H = 0
5.5 T
C p[1
0J g
K]
–1–1
–2
97
T [K]
5
3.0
2.5
4.0
3.5
Fig. 75. EuMg5.2. Heat capacity vs. temperature(logarithmic scale) for the magnetic fields indicated.Inset: detail of heat capacity around the Néeltemperature TN = 7.8 K (linear scale) [88L1].
0 4 8 12 16 20
1
2
3
4
5
6
7
CeZn11
LaZn11
Heat
capa
city
/[J
mol
K]
CT
p–1
–2
Temperature [K]T
Fig. 76. LaZn11, CeZn11. Heat capacity divided by temperature vs. temperature. The large peak shows the Néel temperature TN = 2 K for CeZn11 [93N1].
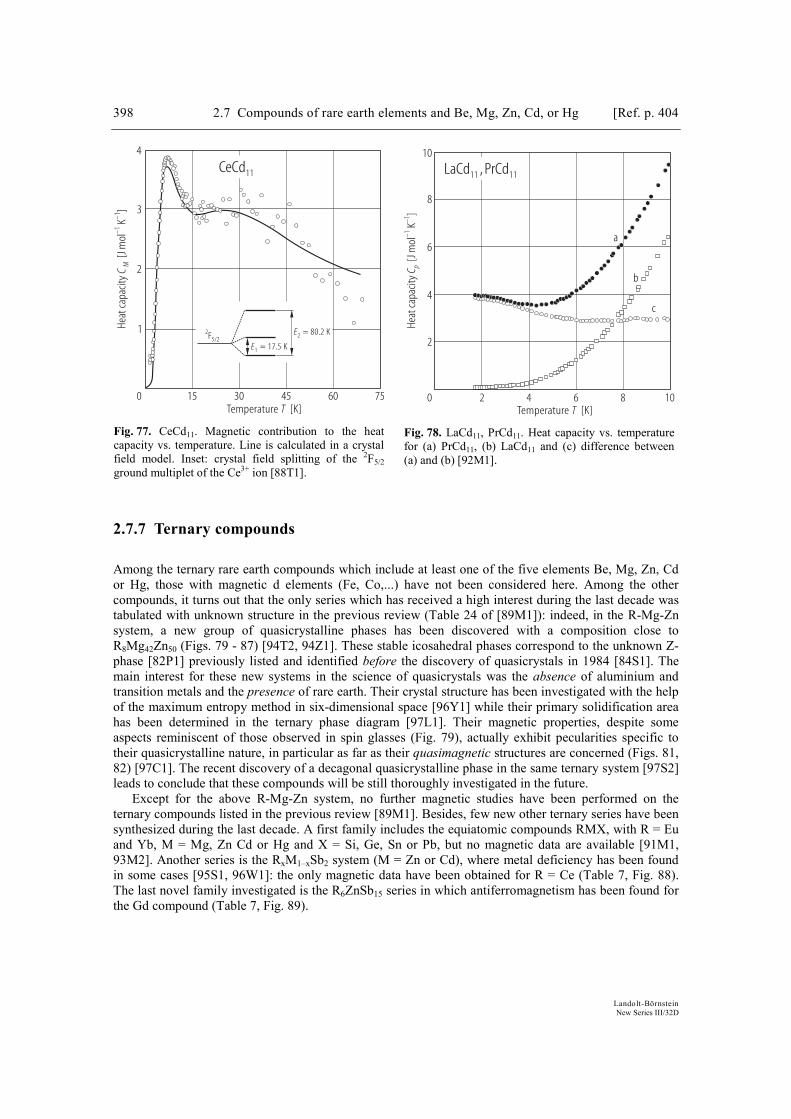
398 2.7 Compounds of rare earth elements and Be, Mg, Zn, Cd, or Hg [Ref. p. 404
Landolt-Börnstein New Series III/32D
1
2
3
4
0 15 30 45 60 75
Heat
capa
city
[J m
olK
]C
M–1
–1
Temperature [K]T
CeCd11
2F5/2E2 = 80.2 K
E1 = 17.5 K
Fig. 77. CeCd11. Magnetic contribution to the heatcapacity vs. temperature. Line is calculated in a crystalfield model. Inset: crystal field splitting of the 2F5/2ground multiplet of the Ce3+ ion [88T1].
0 2 4 6 8 10Temperature [K]T
8
6
4
2
10
Heat
capa
city
[J m
olK
]C p
–1–1
LaCd , PrCd11 11
a
b
c
Fig. 78. LaCd11, PrCd11. Heat capacity vs. temperature for (a) PrCd11, (b) LaCd11 and (c) difference between (a) and (b) [92M1].
2.7.7 Ternary compounds
Among the ternary rare earth compounds which include at least one of the five elements Be, Mg, Zn, Cd or Hg, those with magnetic d elements (Fe, Co,...) have not been considered here. Among the other compounds, it turns out that the only series which has received a high interest during the last decade was tabulated with unknown structure in the previous review (Table 24 of [89M1]): indeed, in the R-Mg-Zn system, a new group of quasicrystalline phases has been discovered with a composition close to R8Mg42Zn50 (Figs. 79 - 87) [94T2, 94Z1]. These stable icosahedral phases correspond to the unknown Z-phase [82P1] previously listed and identified before the discovery of quasicrystals in 1984 [84S1]. The main interest for these new systems in the science of quasicrystals was the absence of aluminium and transition metals and the presence of rare earth. Their crystal structure has been investigated with the help of the maximum entropy method in six-dimensional space [96Y1] while their primary solidification area has been determined in the ternary phase diagram [97L1]. Their magnetic properties, despite some aspects reminiscent of those observed in spin glasses (Fig. 79), actually exhibit pecularities specific to their quasicrystalline nature, in particular as far as their quasimagnetic structures are concerned (Figs. 81, 82) [97C1]. The recent discovery of a decagonal quasicrystalline phase in the same ternary system [97S2] leads to conclude that these compounds will be still thoroughly investigated in the future. Except for the above R-Mg-Zn system, no further magnetic studies have been performed on the ternary compounds listed in the previous review [89M1]. Besides, few new other ternary series have been synthesized during the last decade. A first family includes the equiatomic compounds RMX, with R = Eu and Yb, M = Mg, Zn Cd or Hg and X = Si, Ge, Sn or Pb, but no magnetic data are available [91M1, 93M2]. Another series is the RxM1–xSb2 system (M = Zn or Cd), where metal deficiency has been found in some cases [95S1, 96W1]: the only magnetic data have been obtained for R = Ce (Table 7, Fig. 88). The last novel family investigated is the R6ZnSb15 series in which antiferromagnetism has been found for the Gd compound (Table 7, Fig. 89).
References
86E1 El Massalami, M., de Groot, H.J.M., Thiel, R.C., de Jongh, L.J.: Hyperfine Interactions 28 (1986) 667
87L1 Lopes, L.C., Coqblin, B.: J. Magn. Magn. Mater. 63-64 (1987) 213 88L1 Lueken, H., Brauers, T., Erassme, J., Deussen, M., Löhneysen, H.v., Schröder, A., Wosnitza,
J., Sauer, C.: J. Less-Common Met. 142 (1988) 221 88S1 Sakurai, J., Yamaguchi, Y., Galera, R.M., Pierre, J.: J. Phys. (Paris) Colloq. 49 (1988) C8-
787 89T1 Tang, J., Gschneidner Jr., K.A.: J. Less-Common Met. 149 (1989) 341 90G1 Gignoux, D., Schmitt, D., Bauer, E., Murani, A.P.: J. Magn. Magn. Mater. 88 (1990) 63 92L1 Lueken, H., Scheins, W., Handrick, K.: J. Less-Common Met. 183 (1992) 271 92M1 Malik, S.K., Tang, J., Gschneidner Jr., K.A.: J. Magn. Magn. Mater. 109 (1992) 316 93N1 Nakazawa, Y., Ishikawa, M., Noguchi, S., Okuda, K.: J. Phys. Soc. Jpn. 62 (1993) 3003 95G3 Grin, Y., Hiebl, K., Rogl, P.: J. Alloys Compounds 227 (1995) L4 96F1 Flandorfer, H., Kosticas, A., Rogl, P., Godart, C., Giovannini, M., Saccone, A., Ferro, R.: J.
Alloys Compounds 240 (1996) 116

398 2.7 Compounds of rare earth elements and Be, Mg, Zn, Cd, or Hg [Ref. p. 404
Landolt-Börnstein New Series III/32D
1
2
3
4
0 15 30 45 60 75
Heat
capa
city
[J m
olK
]C
M–1
–1
Temperature [K]T
CeCd11
2F5/2E2 = 80.2 K
E1 = 17.5 K
Fig. 77. CeCd11. Magnetic contribution to the heatcapacity vs. temperature. Line is calculated in a crystalfield model. Inset: crystal field splitting of the 2F5/2ground multiplet of the Ce3+ ion [88T1].
0 2 4 6 8 10Temperature [K]T
8
6
4
2
10
Heat
capa
city
[J m
olK
]C p
–1–1
LaCd , PrCd11 11
a
b
c
Fig. 78. LaCd11, PrCd11. Heat capacity vs. temperature for (a) PrCd11, (b) LaCd11 and (c) difference between (a) and (b) [92M1].
2.7.7 Ternary compounds
Among the ternary rare earth compounds which include at least one of the five elements Be, Mg, Zn, Cd or Hg, those with magnetic d elements (Fe, Co,...) have not been considered here. Among the other compounds, it turns out that the only series which has received a high interest during the last decade was tabulated with unknown structure in the previous review (Table 24 of [89M1]): indeed, in the R-Mg-Zn system, a new group of quasicrystalline phases has been discovered with a composition close to R8Mg42Zn50 (Figs. 79 - 87) [94T2, 94Z1]. These stable icosahedral phases correspond to the unknown Z-phase [82P1] previously listed and identified before the discovery of quasicrystals in 1984 [84S1]. The main interest for these new systems in the science of quasicrystals was the absence of aluminium and transition metals and the presence of rare earth. Their crystal structure has been investigated with the help of the maximum entropy method in six-dimensional space [96Y1] while their primary solidification area has been determined in the ternary phase diagram [97L1]. Their magnetic properties, despite some aspects reminiscent of those observed in spin glasses (Fig. 79), actually exhibit pecularities specific to their quasicrystalline nature, in particular as far as their quasimagnetic structures are concerned (Figs. 81, 82) [97C1]. The recent discovery of a decagonal quasicrystalline phase in the same ternary system [97S2] leads to conclude that these compounds will be still thoroughly investigated in the future. Except for the above R-Mg-Zn system, no further magnetic studies have been performed on the ternary compounds listed in the previous review [89M1]. Besides, few new other ternary series have been synthesized during the last decade. A first family includes the equiatomic compounds RMX, with R = Eu and Yb, M = Mg, Zn Cd or Hg and X = Si, Ge, Sn or Pb, but no magnetic data are available [91M1, 93M2]. Another series is the RxM1–xSb2 system (M = Zn or Cd), where metal deficiency has been found in some cases [95S1, 96W1]: the only magnetic data have been obtained for R = Ce (Table 7, Fig. 88). The last novel family investigated is the R6ZnSb15 series in which antiferromagnetism has been found for the Gd compound (Table 7, Fig. 89).
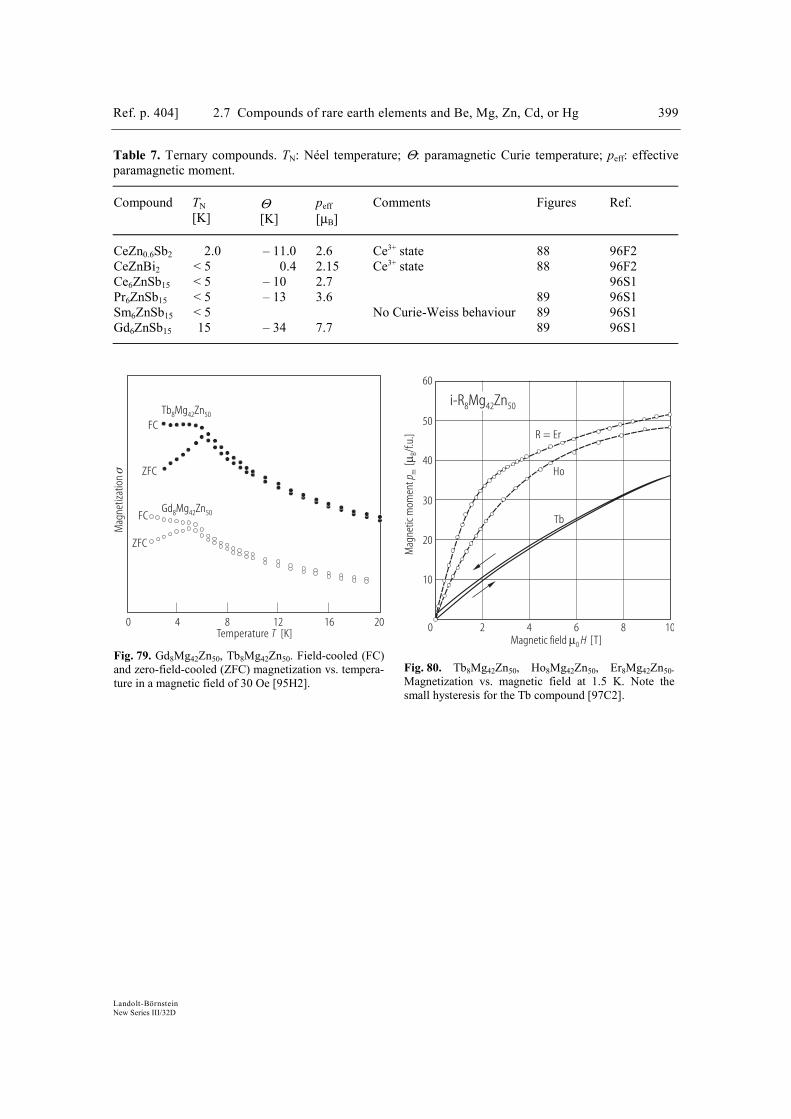
Ref. p. 404] 2.7 Compounds of rare earth elements and Be, Mg, Zn, Cd, or Hg 399
Landolt-Börnstein New Series III/32D
Table 7. Ternary compounds. TN: Néel temperature; Θ: paramagnetic Curie temperature; peff: effective paramagnetic moment.
Compound TN [K]
Θ [K]
peff [µB]
Comments Figures Ref.
CeZn0.6Sb2 2.0 – 11.0 2.6 Ce3+ state 88 96F2 CeZnBi2 < 5 0.4 2.15 Ce3+ state 88 96F2 Ce6ZnSb15 < 5 – 10 2.7 96S1 Pr6ZnSb15 < 5 – 13 3.6 89 96S1 Sm6ZnSb15 < 5 No Curie-Weiss behaviour 89 96S1 Gd6ZnSb15 15 – 34 7.7 89 96S1
Mag
netiz
atio
nσ
0 4 8 12 16 20Temperature [K]T
Tb Mg Zn8 42 50
Gd Mg Zn8 42 50
FC
ZFC
FC
ZFC
Fig. 79. Gd8Mg42Zn50, Tb8Mg42Zn50. Field-cooled (FC)and zero-field-cooled (ZFC) magnetization vs. tempera-ture in a magnetic field of 30 Oe [95H2].
10
20
30
40
50
60
0 2 4 6 8 10Magnetic field [T]µ0 H
Mag
netic
mom
ent
[/f.
u.]
p mBµ
i-R Mg Zn8 42 50
R = Er
Ho
Tb
Fig. 80. Tb8Mg42Zn50, Ho8Mg42Zn50, Er8Mg42Zn50. Magnetization vs. magnetic field at 1.5 K. Note the small hysteresis for the Tb compound [97C2].
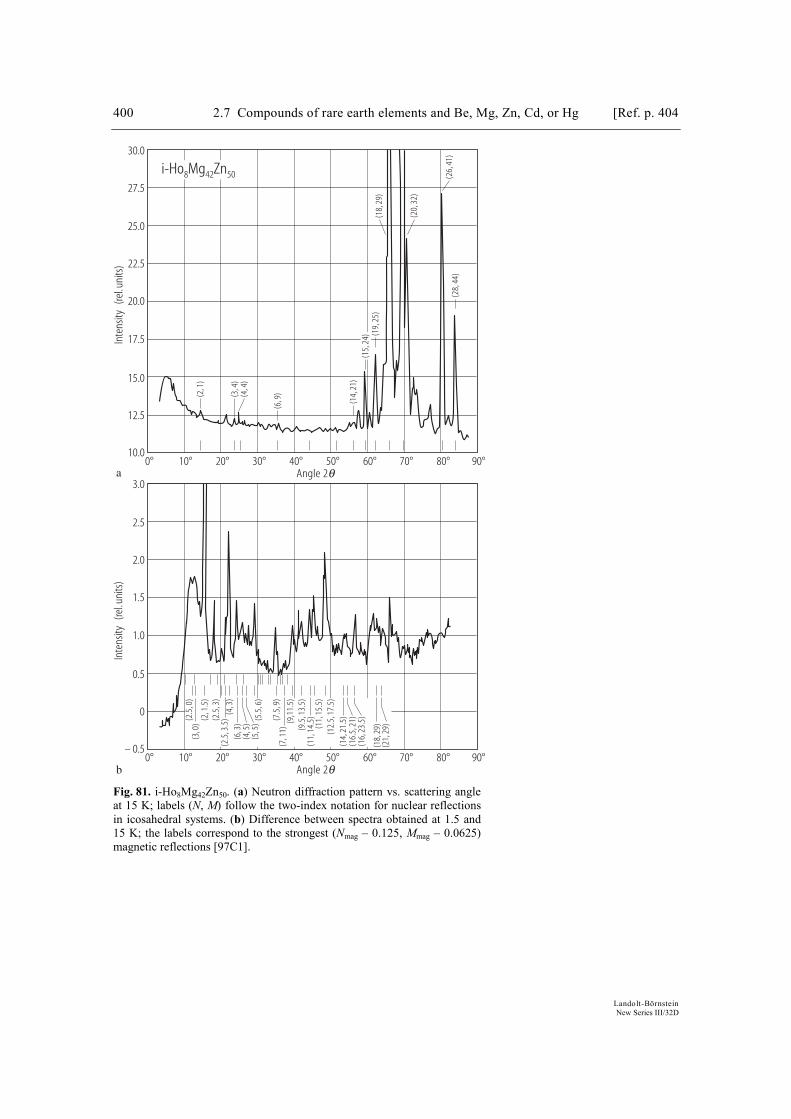
400 2.7 Compounds of rare earth elements and Be, Mg, Zn, Cd, or Hg [Ref. p. 404
Landolt-Börnstein New Series III/32D
10.0
12.5
15.0
20.0
17.5
22.5
27.5
25.0
30.0
Inte
nsity
(rel.u
nits
)
0° 10° 20° 30° 40° 50° 70° 80°60° 90°Angle 2q
i-Ho Mg Zn8 42 50
(2,1
)
(3,4
)(4
,4)
(6, 9
)
(14,
21)
(15,
24) (1
9,25
)(1
8,29
)
(20,
32)
(26,
41)
(28,
44)
a
– 0.5
0
0.5
1.5
1.0
2.0
3.0
2.5
Inte
nsity
(rel.u
nits
)
0° 10° 20° 30° 40° 50° 70° 80°60° 90°Angle 2qb
(2.5
, 0)
(3, 0
)(2
, 1.5
)(2
.5, 3
)
(4, 3
)(2
.5, 3
.5)
(6, 3
)(4
, 5)
(5, 5
)
(7, 1
1)
(5.5
, 6)
(7.5
, 9)
(9,1
1.5)
(9.5
, 13.
5)
(11,
15.5
)(1
2.5,
17.5
)
(11,
14.5
)
(14,
21.5
)(1
6.5,
21)
(16,
23.5
)
(18,
29)
(21,
29)
Fig. 81. i-Ho8Mg42Zn50. (a) Neutron diffraction pattern vs. scattering angle at 15 K; labels (N, M) follow the two-index notation for nuclear reflections in icosahedral systems. (b) Difference between spectra obtained at 1.5 and 15 K; the labels correspond to the strongest (Nmag – 0.125, Mmag – 0.0625) magnetic reflections [97C1].
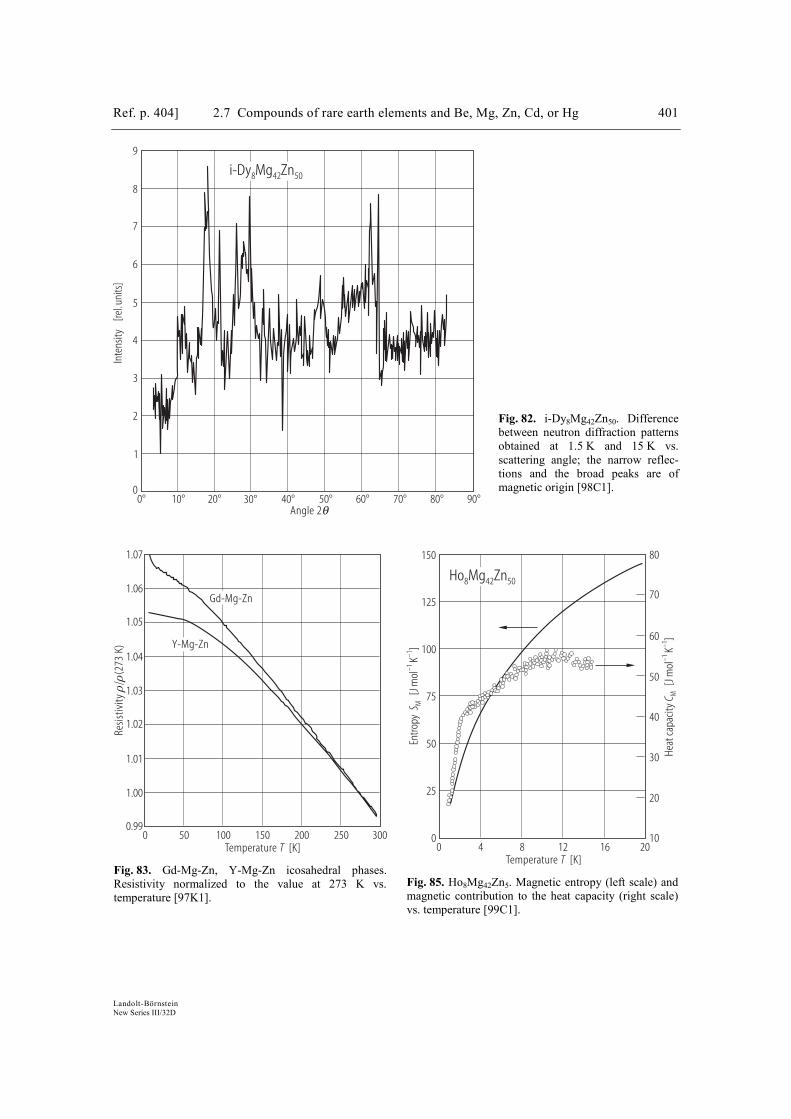
Ref. p. 404] 2.7 Compounds of rare earth elements and Be, Mg, Zn, Cd, or Hg 401
Landolt-Börnstein New Series III/32D
0
3
1
5
4
2
6
8
7
9
0° 30° 40° 50° 60° 70° 90°80°20°10°
i-Dy Mg Zn8 42 50
Inte
nsity
[rel.u
nits
]
Angle 2q
0.99
1.02
1.05
1.00
1.03
1.06
1.01
1.04
1.07
Temperature [K]T
Resis
tivity
(273
K)ρ/
ρ
0 50 100 150 200 250 300
Gd-Mg-Zn
Y-Mg-Zn
Fig. 83. Gd-Mg-Zn, Y-Mg-Zn icosahedral phases. Resistivity normalized to the value at 273 K vs. temperature [97K1].
0 10
20
30
40
70
50
80
60
25
50
75
100
125
150
0 204 8 12 16
Entro
pyS M
[J m
olK
]–1
–1
Heat
capa
city
C M[J
mol
K]
–1–1
Ho Mg Zn8 42 50
Temperature [K]T
Fig. 85. Ho8Mg42Zn5. Magnetic entropy (left scale) and magnetic contribution to the heat capacity (right scale) vs. temperature [99C1].
Fig. 82. i-Dy8Mg42Zn50. Difference between neutron diffraction patterns obtained at 1.5 K and 15 K vs. scattering angle; the narrow reflec-tions and the broad peaks are of magnetic origin [98C1].

402 2.7 Compounds of rare earth elements and Be, Mg, Zn, Cd, or Hg [Ref. p. 404
Landolt-Börnstein New Series III/32D
0 4 8 12 16 20Temperature [K]T
Heat
capa
city
[Jm
olK
]C p
–1–1
16
80
32
96
48
112
64
128
Y Mg Zn8 42 50
Tb Mg Zn8 42 50
Gd Mg Zn8 42 50
Fig. 84. Gd8Mg42Zn50, Tb8Mg42Zn50, Y8Mg42Zn50. Heat capacity vs. temperature; the arrows indicate the spin freezing temperatures Tf determined by ac magnetic susceptibility measurement [95H1].
2 3 4 5 6– 0.2
– 0.1
0
0.4
0.1
0.2
0.3
EXAF
Sos
cilla
tions
() [
rela
tive
units
]k
kχ
Wavevector [Å ]k –17 8 9 10 11 12 13 14
Y Mg Zn8 42 50
Dy Mg Zn8 42 50
Fig. 86. Y8Mg42Zn50, Dy8Mg42Zn50. EXAFS oscillations vs. wavevector for the K edge of Y (upper curve) and the L3 edge of Dy (lower curve); the arrow shows the phase shift arising from the different nature of the atoms emitting the photoelectron [99C1].
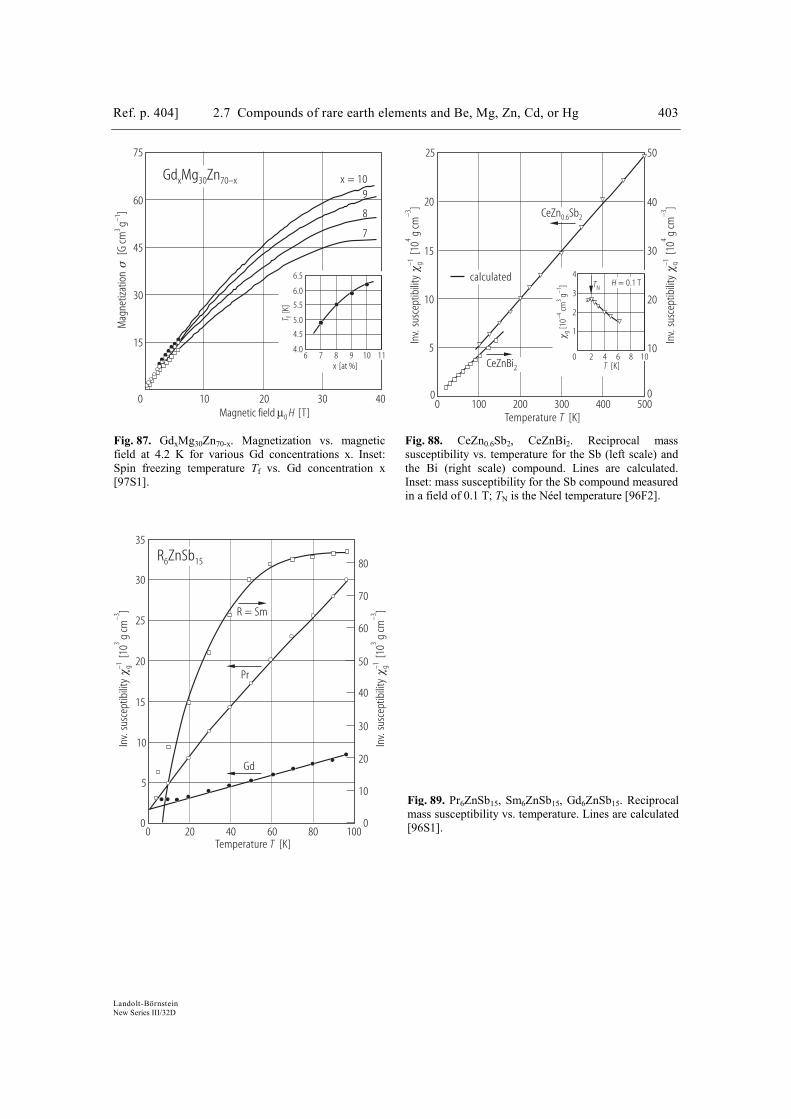
Ref. p. 404] 2.7 Compounds of rare earth elements and Be, Mg, Zn, Cd, or Hg 403
Landolt-Börnstein New Series III/32D
0 10 20 30 40
Mag
netiz
atio
nσ
[G cm
g]
3–1
15
30
45
60
75
Magnetic field [T]µ0 H
T f[K
]
x [at %]6 7 8 9 10 11
Gd Mg Znx 30 70–x x = 109
8
7
6.0
4.0
5.0
6.5
4.5
5.5
Fig. 87. GdxMg30Zn70-x. Magnetization vs. magneticfield at 4.2 K for various Gd concentrations x. Inset:Spin freezing temperature Tf vs. Gd concentration x[97S1].
10
0 0
20
30
40
25 50
0 100 200 300 400 500In
v.su
scep
tibili
ty[1
0g
cm]
χ g–14
–3
Temperature [K]T
5
10
15
20
2 4 6 8 100
1
2
3
4
T [K]
[10
cmg
]χ g
–43
–1
H = 0.1 TTN
CeZn Sb0.6 2
CeZnBi2
calculated
Inv.
susc
eptib
ility
[10
g cm
]χ g–1
4–3
Fig. 88. CeZn0.6Sb2, CeZnBi2. Reciprocal mass susceptibility vs. temperature for the Sb (left scale) and the Bi (right scale) compound. Lines are calculated. Inset: mass susceptibility for the Sb compound measured in a field of 0.1 T; TN is the Néel temperature [96F2].
0 0
10
30
40
70
50
80
60
10
15
20
25
30
35
0 10020 40 60 80
Inv.
susc
eptib
ility
[10
g cm
]χ g–1
3–3
Temperature [K]T
Inv.
susc
eptib
ility
[10
g cm
]χ g–1
3–3
5
20
R ZnSb6 15
R = Sm
Pr
Gd
Fig. 89. Pr6ZnSb15, Sm6ZnSb15, Gd6ZnSb15. Reciprocal mass susceptibility vs. temperature. Lines are calculated [96S1].
References
82P1 Padezhnova, E.M., Mel'Nik, E.V., Miliyevskiy, R.A., Dobatkina, T.V., Kinzhibalo, V.V.: Russ. Metall. (Engl. Trans.) 4 (1982) 185
84S1 Schechtman, D., Blech, I., Gratias, D., Cahn, J.W.: Phys. Rev. Lett. 53 (1984) 1951 89M1 Morin, P., in: Magnetic Properties of Metals (Wijn, H.P.J., ed.), Landolt-Börnstein, New
Series, Berlin, Heidelberg, New York: Springer, Vol. 19 e2 1989, p. 1 91M1 Merlo, F., Pani, M., Fornasini, M.L.: J. Alloys Compounds 171 (1991) 329 93M2 Merlo, F., Pani, M., Fornasini, M.: J. Alloys Compounds 196 (1993) 145 94T2 Tsai, A.P., Niikura, A., Inoue, A., Masumoto, T., Nishida, Y., Tsuda, K., Tanaka, M.: Philos.
Mag. Lett. 70 (1994) 169 94Z1 Zhao, D., Tang, Y., Luo, Z., Wang, R., Shen, N., Zhang, S.: J. Phys.: Condens. Matter 6
(1994) 7329 95H1 Hattori, Y., Fukamichi, K., Suzuki, K., Niikura, A., Tsai, A.P., Inoue, A., Masumoto, T.: J.
Phys.: Condens. Matter 7 (1995) 4183 95H2 Hattori, Y., Niikura, A., Tsai, A.P., Inoue, A., Masumoto, T., Fukamichi, K., Aruga-Katori,
H., Goto, T.: J. Phys.: Condens. Matter 7 (1995) 2313 95S1 Sologub, O., Hiebl, K., Rogl, P., Bodak, O.: J. Alloys Compounds 227 (1995) 40 96F2 Flandorfer, H., Sologub, O., Godart, C., Hiebl, K., Leithe-Jasper, A., Rogl, P., Noël, H.: Solid
State Commun. 97 (1996) 561 96S1 Sologub, O., Vybornov, M., Rogl, P., Hiebl, K., Cordier, G., Woll, P.: J. Solid State Chem.
122 (1996) 266 96W1 Wollesen, P., Jeitschko, W., Brylak, M., Dietrich, L.: J. Alloys Compounds 245 (1996) L5 96Y1 Yamamoto, A., Weber, S., Sato, A., Kato, K., Ohshima, K.I., Tsai, A.P., Niikura, A., Hiraga,
K., Inoue, A., Masumoto, T.: Philos. Mag. Lett. 73 (1996) 247 97C1 Charrier, B., Ouladdiaf, B., Schmitt, D.: Phys. Rev. Lett. 78 (1997) 4637 97C2 Charrier, B., Schmitt, D.: J. Magn. Magn. Mater. 171 (1997) 106 97K1 Kondo, R., Hashimoto, T., Edagawa, K., Takeuchi, S., Takeuchi, T., Mizutani, U.: J. Phys.
Soc. Jpn. 66 (1997) 1097 97L1 Langsdorf, A., Ritter, F., Assmus, W.: Phil. Mag. Lett. 75 (1997) 381 97S1 Saito, H., Fukamichi, K., Goto, T., Tsai, A.P., Inoue, A., Masumoto, T.: J. Alloys
Compounds 252 (1997) 6 97S2 Sato, T.J., Abe, E., Tsai, A.P.: Jpn. J. Appl. Phys. 36 (1997) L1038 98C1 Charrier, B., Ouladdiaf, B., Schmitt, D.: Physica B 241-243 (1998) 733 99C1 Charrier, B., Schmitt, D., in: Aperiodic '97 (de Boissieu, M., Verger-Gaugry, J.L., Currant,
R., eds.), Singapour: World Scientific, 1999, p. 733
Related Documents