2 Linear and Quadratic Functions Prom (p. 57) Dirt Bike (p. 43) Meteorologist (p. 93) Soccer (p. 89) Kangaroo (p. 79) Di Dirt B Bik ike ( (p. 43 43) ) SEE the Big Idea 2.1 Parent Functions and Transformations 2.2 Transformations of Linear and Absolute Value Functions 2.3 Modeling with Linear Functions 2.4 Solving Linear Systems 2.5 Transformations of Quadratic Functions 2.6 Characteristics of Quadratic Functions 2.7 Modeling with Quadratic Functions

Welcome message from author
This document is posted to help you gain knowledge. Please leave a comment to let me know what you think about it! Share it to your friends and learn new things together.
Transcript
2 Linear and Quadratic Functions
Prom (p. 57)
Dirt Bike (p. 43)
Meteorologist (p. 93)
Soccer (p. 89)
Kangaroo (p. 79)
DiDirt BBikike ((p. 4343))
SEE the Big Idea
2.1 Parent Functions and Transformations2.2 Transformations of Linear and Absolute Value Functions2.3 Modeling with Linear Functions2.4 Solving Linear Systems2.5 Transformations of Quadratic Functions2.6 Characteristics of Quadratic Functions2.7 Modeling with Quadratic Functions
Int_Math3_PE_02.OP.indd 36Int_Math3_PE_02.OP.indd 36 1/30/15 2:13 PM1/30/15 2:13 PM

Dynamic Solutions available at BigIdeasMath.com 37D i S l ti il bl t BigId M th 3
Maintaining Mathematical ProficiencyMaintaining Mathematical ProficiencyEvaluating Expressions
Example 1 Evaluate the expression 36 ÷ (32 × 2) − 3.
36 ÷ (32 × 2) − 3 = 36 ÷ (9 × 2) − 3 Evaluate the power within parentheses.
= 36 ÷ 18 − 3 Multiply within parentheses.
= 2 − 3 Divide.
= −1 Subtract.
Evaluate.
1. 5 ⋅ 23 + 7 2. 4 − 2(3 + 2)2 3. 48 ÷ 42 + 3 —
5
4. 50 ÷ 52 ⋅ 2 5. 1 —
2 (22 + 22) 6.
1 —
6 (6 + 18) − 22
Transformations of Figures
Example 2 Reflect the black rectangle in the x-axis. Then translate the new rectangle 5 units to the left and 1 unit down.
x
y4
2
−4
−2
4−2−4
AB
CD
A′ B′
C′D′
A″ B″
C″D″ Take the opposite ofeach y-coordinate.
Move each vertex 5 unitsleft and 1 unit down.
Graph the transformation of the figure.
7. Translate the rectangle
1 unit right and
4 units up.
8. Reflect the triangle in the
y-axis. Then translate
2 units left.
9. Translate the trapezoid
3 units down. Then
reflect in the x-axis.
x
y3
1
−5
31−3
x
y
4
6
−2
42−2−4
x
y4
2
−4
−2
2−2−4−6
10. ABSTRACT REASONING Give an example to show why the order of operations is important
when evaluating a numerical expression. Is the order of transformations of fi gures important?
Justify your answer.
Int_Math3_PE_02.OP.indd 37Int_Math3_PE_02.OP.indd 37 1/30/15 2:13 PM1/30/15 2:13 PM
38 Chapter 2 Linear and Quadratic Functions
Mathematical Mathematical PracticesPractices
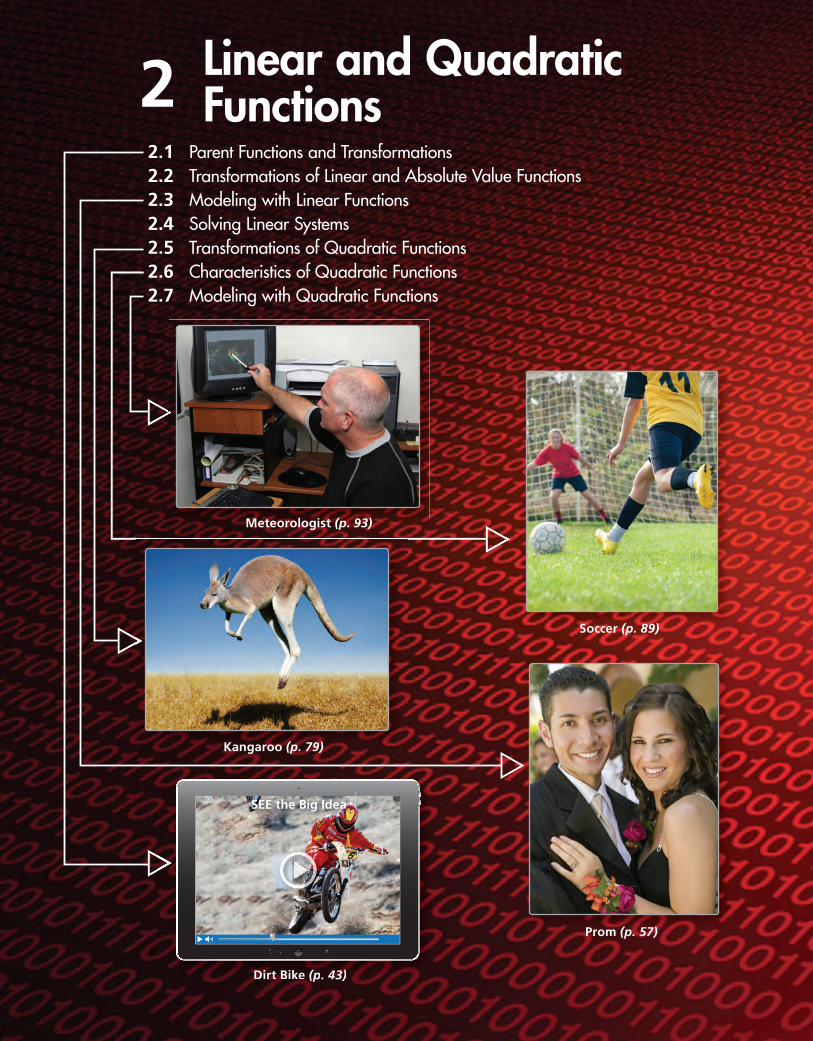
Mathematically profi cient students use technological tools to explore concepts.
Monitoring ProgressMonitoring ProgressUse a graphing calculator to graph the equation using the standard viewing window and a square viewing window. Describe any differences in the graphs.
1. y = 2x − 3 2. y = −x + 1 3. y = − ∣ x − 4 ∣ 4. y = ∣ x + 2 ∣ 5. y = x2 − 2 6. y = −x2 + 1
Determine whether the viewing window is square. Explain.
7. −8 ≤ x ≤ 8, −2 ≤ y ≤ 8 8. −7 ≤ x ≤ 8, −2 ≤ y ≤ 8
9. −6 ≤ x ≤ 9, −2 ≤ y ≤ 8 10. −2 ≤ x ≤ 2, −3 ≤ y ≤ 3
11. −4 ≤ x ≤ 5, −3 ≤ y ≤ 3 12. −4 ≤ x ≤ 4, −3 ≤ y ≤ 3
Using a Graphing Calculator
Using a Graphing Calculator
Use a graphing calculator to graph y = ∣ x ∣ − 3.
SOLUTION
In the standard viewing window, notice that
the tick marks on the y-axis are closer together
than those on the x-axis. This implies that the
graph is not shown in its true perspective.
In a square viewing window, notice that the
tick marks on both axes have the same spacing.
This implies that the graph is shown in its
true perspective.
Core Core ConceptConceptStandard and Square Viewing WindowsA typical screen on a graphing calculator has a height-to-width
ratio of 2 to 3. This means that when you view a graph using
the standard viewing window of −10 to 10 (on each axis),
the graph will not be shown in its true perspective.
To view a graph in its true perspective, you need to change to
a square viewing window, where the tick marks on the x-axis
are spaced the same as the tick marks on the y-axis.
Xmin=-10WINDOW
Xmax=10Xscl=1Ymin=-10Ymax=10Yscl=1
This is the standardviewingwindow.
Xmin=-9WINDOW
Xmax=9Xscl=1Ymin=-6Ymax=6Yscl=1
This is asquareviewingwindow.
10
−10
−10
10
This is the graphin the standardviewing window.
6
−4
−6
4
This is the graphin a squareviewing window.
Int_Math3_PE_02.OP.indd 38Int_Math3_PE_02.OP.indd 38 1/30/15 2:14 PM1/30/15 2:14 PM
Section 2.1 Parent Functions and Transformations 39
Parent Functions and Transformations2.1
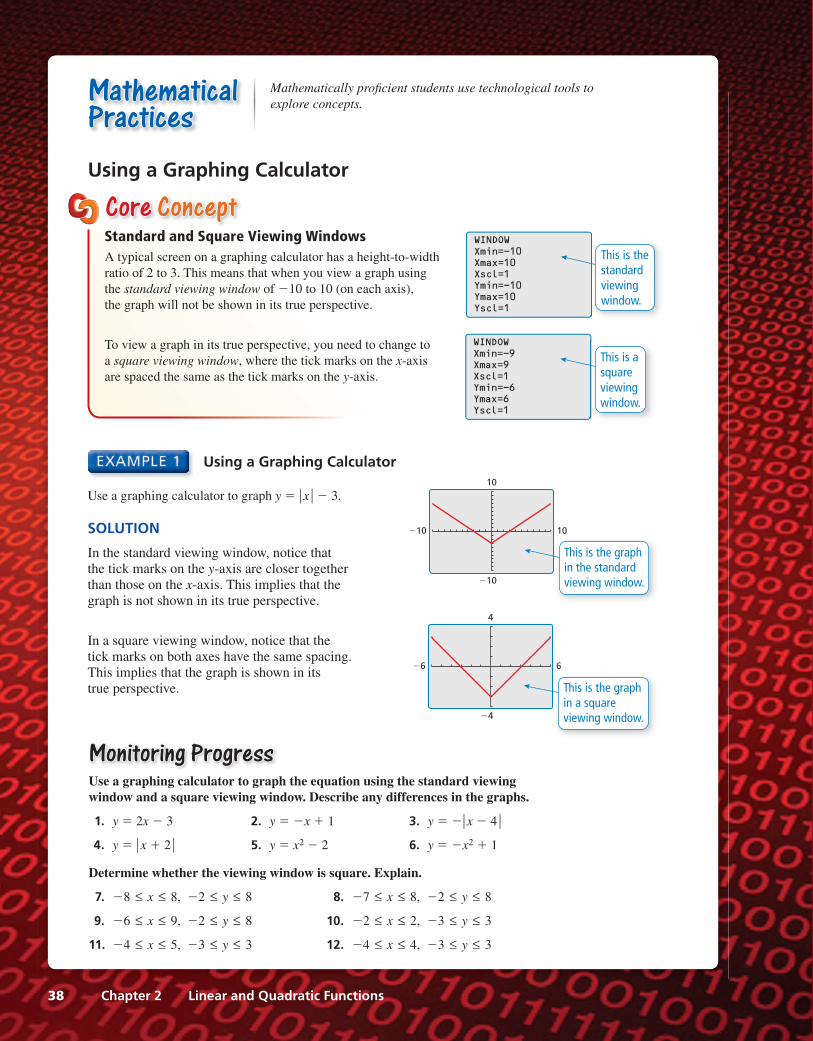
Essential QuestionEssential Question What are the characteristics of some of the
basic parent functions?
Identifying Basic Parent Functions
Work with a partner. Graphs of four basic parent functions are shown below.
Classify each function as linear, absolute value, quadratic, or exponential. Justify
your reasoning.
a.
6
−4
−6
4 b.
6
−4
−6
4
c.
6
−4
−6
4 d.
6
−4
−6
4
Identifying Basic Parent Functions
Work with a partner. Graphs of four basic parent functions that you will study later
in this course are shown below. Classify each function as square root, cube root, cubic,
or reciprocal. Justify your reasoning.
a.
6
−4
−6
4 b.
6
−4
−6
4
c.
6
−4
−6
4 d.
6
−4
−6
4
Communicate Your AnswerCommunicate Your Answer 3. What are the characteristics of some of the basic parent functions?
4. Write an equation for each function whose graph is shown in Exploration 1.
Then use a graphing calculator to verify that your equations are correct.
JUSTIFYING CONCLUSIONSTo be profi cient in math, you need to justify your conclusions and communicate them clearly to others.
Int_Math3_PE_02.01.indd 39Int_Math3_PE_02.01.indd 39 1/30/15 2:02 PM1/30/15 2:02 PM
40 Chapter 2 Linear and Quadratic Functions
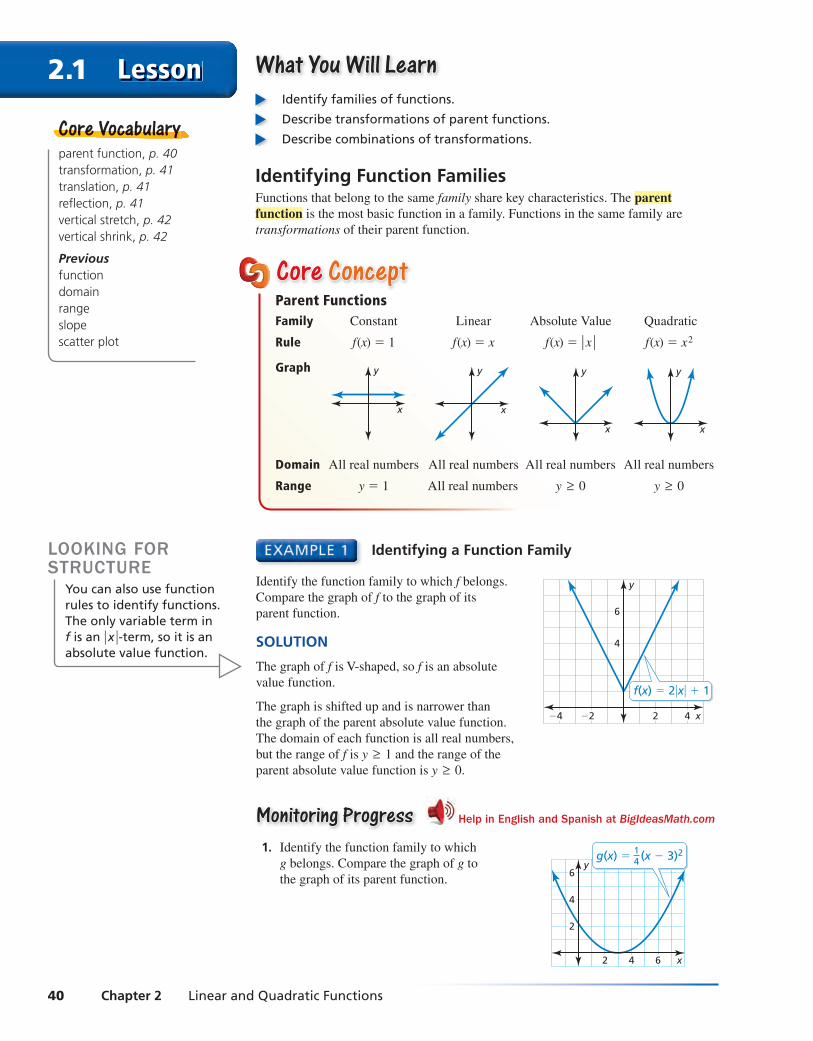
2.1 Lesson What You Will LearnWhat You Will Learn Identify families of functions.
Describe transformations of parent functions.
Describe combinations of transformations.
Identifying Function FamiliesFunctions that belong to the same family share key characteristics. The parent function is the most basic function in a family. Functions in the same family are
transformations of their parent function.
parent function, p. 40transformation, p. 41translation, p. 41refl ection, p. 41vertical stretch, p. 42vertical shrink, p. 42
Previousfunctiondomainrangeslopescatter plot
Core VocabularyCore Vocabullarry
Identifying a Function Family
Identify the function family to which f belongs.
x
y
4
6
42−2−4
f(x) = 2�x� + 1
Compare the graph of f to the graph of its
parent function.
SOLUTION
The graph of f is V-shaped, so f is an absolute
value function.
The graph is shifted up and is narrower than
the graph of the parent absolute value function.
The domain of each function is all real numbers,
but the range of f is y ≥ 1 and the range of the
parent absolute value function is y ≥ 0.
Monitoring ProgressMonitoring Progress Help in English and Spanish at BigIdeasMath.com
1. Identify the function family to which
x
y
4
2
6
42 6
g(x) = (x − 3)214g belongs. Compare the graph of g to
the graph of its parent function.
LOOKING FORSTRUCTURE
You can also use function rules to identify functions. The only variable term in f is an ∣ x ∣ -term, so it is an absolute value function.
Core Core ConceptConceptParent FunctionsFamily Constant Linear Absolute Value Quadratic
Rule f(x) = 1 f(x) = x f(x) = ∣ x ∣ f(x) = x2
Graph
x
y
x
y
x
y
x
y
Domain All real numbers All real numbers All real numbers All real numbers
Range y = 1 All real numbers y ≥ 0 y ≥ 0
Int_Math3_PE_02.01.indd 40Int_Math3_PE_02.01.indd 40 1/30/15 2:02 PM1/30/15 2:02 PM
Section 2.1 Parent Functions and Transformations 41
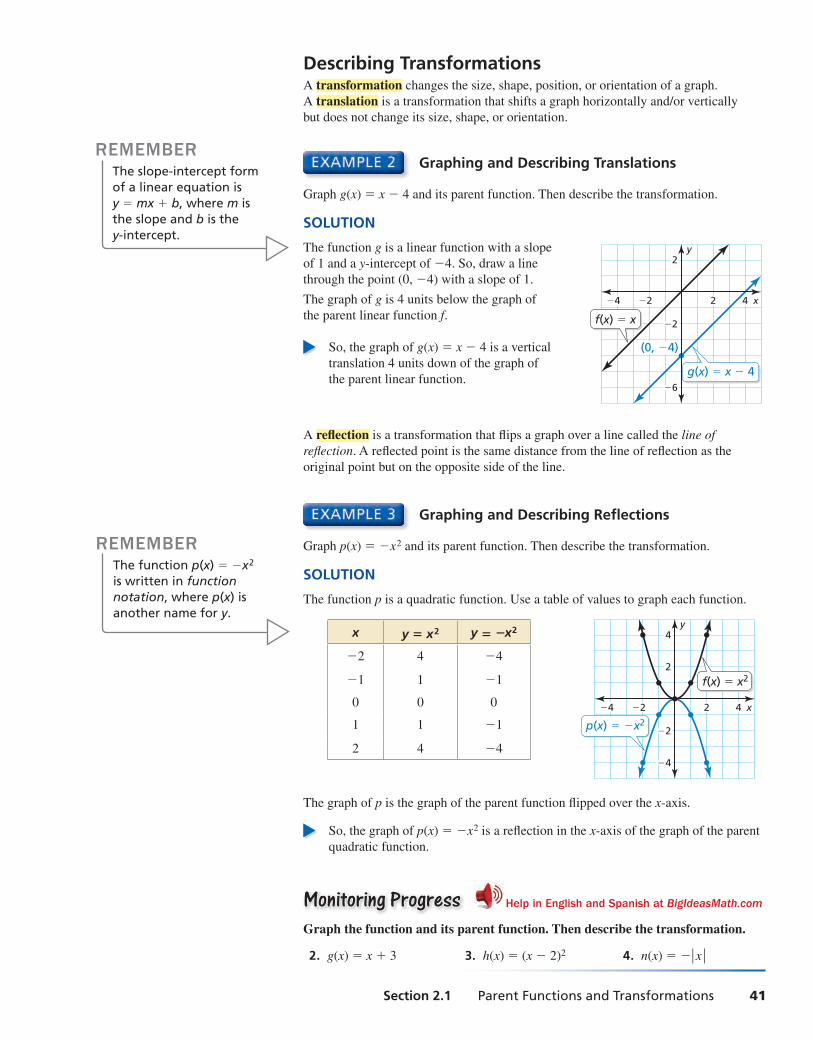
Describing TransformationsA transformation changes the size, shape, position, or orientation of a graph.
A translation is a transformation that shifts a graph horizontally and/or vertically
but does not change its size, shape, or orientation.
Graphing and Describing Translations
Graph g(x) = x − 4 and its parent function. Then describe the transformation.
SOLUTION
The function g is a linear function with a slope
x
y2
−6
−2
42−2−4
g(x) = x − 4
f(x) = x
(0, −4)
of 1 and a y-intercept of −4. So, draw a line
through the point (0, −4) with a slope of 1.
The graph of g is 4 units below the graph of
the parent linear function f.
So, the graph of g(x) = x − 4 is a vertical
translation 4 units down of the graph of
the parent linear function.
A refl ection is a transformation that fl ips a graph over a line called the line of refl ection. A refl ected point is the same distance from the line of refl ection as the
original point but on the opposite side of the line.
REMEMBERThe slope-intercept form of a linear equation isy = mx + b, where m is the slope and b is the y-intercept.
Graphing and Describing Refl ections
Graph p(x) = −x2 and its parent function. Then describe the transformation.
SOLUTION
The function p is a quadratic function. Use a table of values to graph each function.
x y = x2 y = −x2
−2 4 −4
−1 1 −1
0 0 0
1 1 −1
2 4 −4
x
y4
2
−4
−2
42−2−4
f(x) = x2
p(x) = −x2
The graph of p is the graph of the parent function fl ipped over the x-axis.
So, the graph of p(x) = −x2 is a refl ection in the x-axis of the graph of the parent
quadratic function.
Monitoring ProgressMonitoring Progress Help in English and Spanish at BigIdeasMath.com
Graph the function and its parent function. Then describe the transformation.
2. g(x) = x + 3 3. h(x) = (x − 2)2 4. n(x) = − ∣ x ∣
REMEMBERThe function p(x) = −x2 is written in function notation, where p(x) is another name for y.
Int_Math3_PE_02.01.indd 41Int_Math3_PE_02.01.indd 41 1/30/15 2:02 PM1/30/15 2:02 PM
42 Chapter 2 Linear and Quadratic Functions
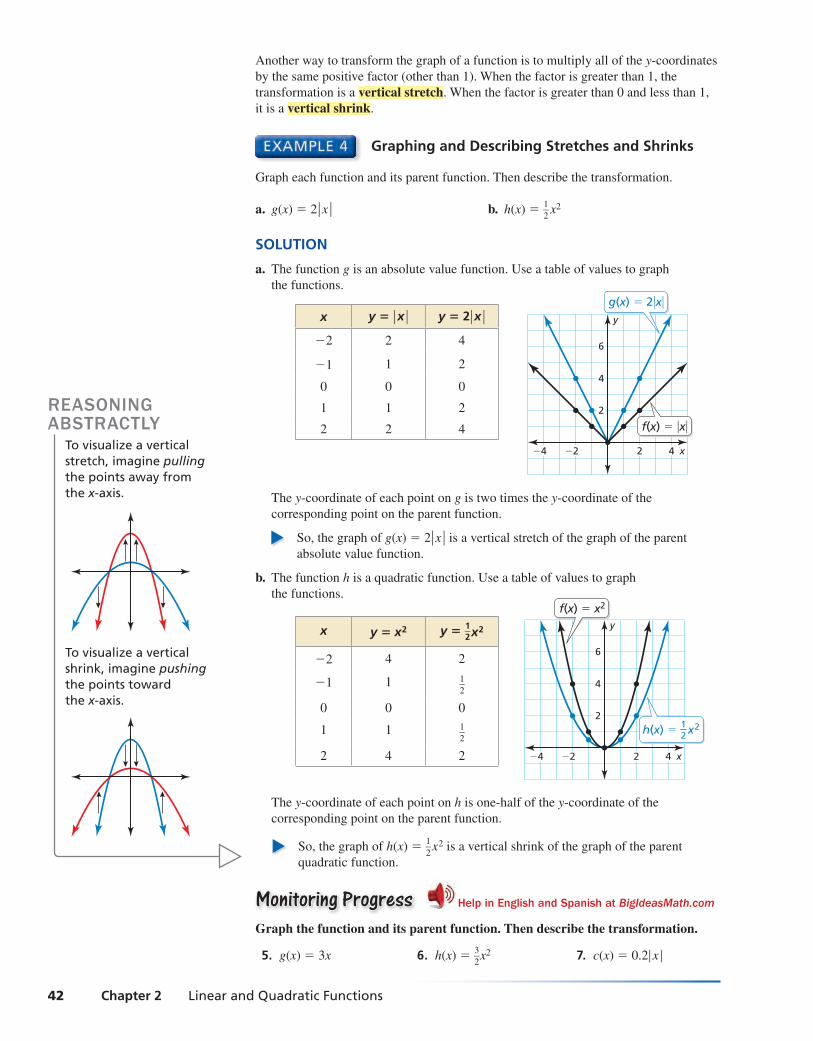
Another way to transform the graph of a function is to multiply all of the y-coordinates
by the same positive factor (other than 1). When the factor is greater than 1, the
transformation is a vertical stretch. When the factor is greater than 0 and less than 1,
it is a vertical shrink.
Graphing and Describing Stretches and Shrinks
Graph each function and its parent function. Then describe the transformation.
a. g(x) = 2 ∣ x ∣ b. h(x) = 1 —
2 x2
SOLUTION
a. The function g is an absolute value function. Use a table of values to graph
the functions.
x y = ∣ x ∣ y = 2 ∣ x ∣ −2 2 4
−1 1 2
0 0 0
1 1 2
2 2 4
x
y
4
2
6
42−2−4
g(x) = 2�x�
f(x) = �x�
The y-coordinate of each point on g is two times the y-coordinate of the
corresponding point on the parent function.
So, the graph of g(x) = 2 ∣ x ∣ is a vertical stretch of the graph of the parent
absolute value function.
b. The function h is a quadratic function. Use a table of values to graph
the functions.
x y = x2 y = 1 — 2 x2
−2 4 2
−1 1 1 —
2
0 0 0
1 1 1 —
2
2 4 2
x
y
4
2
6
42−2−4
f(x) = x2
h(x) = x212
The y-coordinate of each point on h is one-half of the y-coordinate of the
corresponding point on the parent function.
So, the graph of h(x) = 1 —
2 x2 is a vertical shrink of the graph of the parent
quadratic function.
Monitoring ProgressMonitoring Progress Help in English and Spanish at BigIdeasMath.com
Graph the function and its parent function. Then describe the transformation.
5. g(x) = 3x 6. h(x) = 3 —
2 x2 7. c(x) = 0.2 ∣ x ∣
REASONINGABSTRACTLY
To visualize a vertical stretch, imagine pulling the points away from the x-axis.
To visualize a vertical shrink, imagine pushing the points toward the x-axis.
Int_Math3_PE_02.01.indd 42Int_Math3_PE_02.01.indd 42 1/30/15 2:02 PM1/30/15 2:02 PM
Section 2.1 Parent Functions and Transformations 43
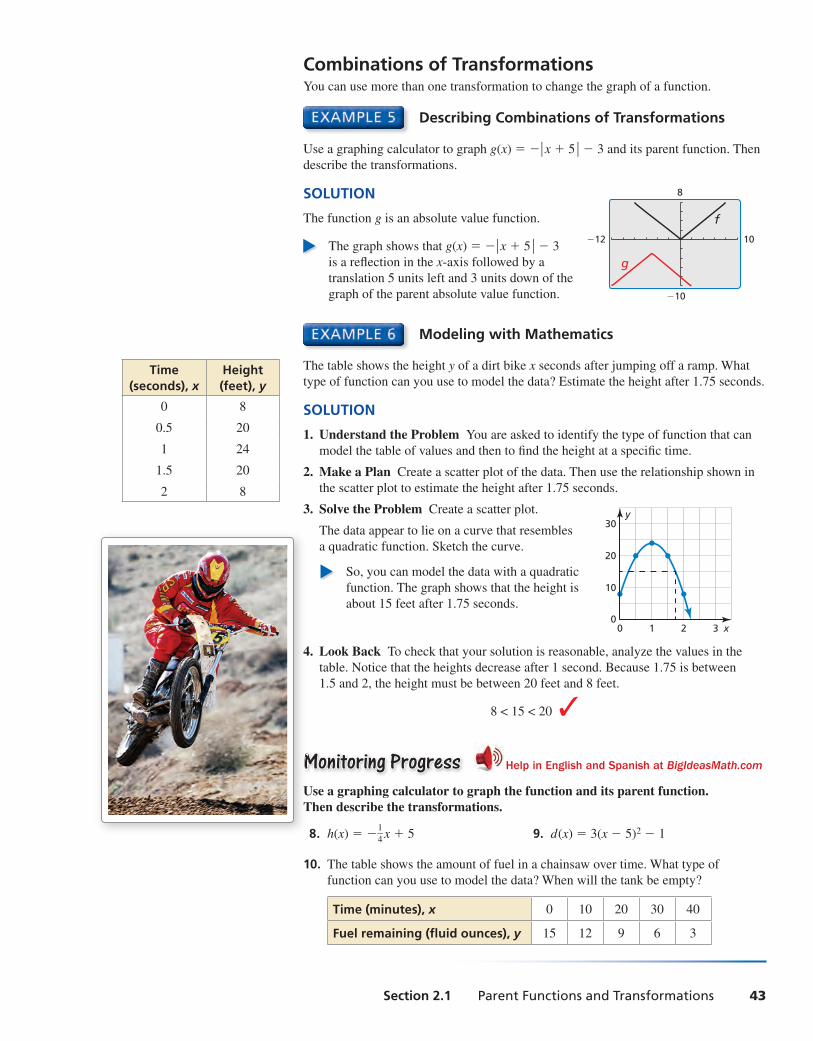
Combinations of TransformationsYou can use more than one transformation to change the graph of a function.
Describing Combinations of Transformations
Use a graphing calculator to graph g(x) = − ∣ x + 5 ∣ − 3 and its parent function. Then
describe the transformations.
SOLUTION
The function g is an absolute value function.
The graph shows that g(x) = − ∣ x + 5 ∣ − 3
is a refl ection in the x-axis followed by a
translation 5 units left and 3 units down of the
graph of the parent absolute value function.
Modeling with Mathematics
The table shows the height y of a dirt bike x seconds after jumping off a ramp. What
type of function can you use to model the data? Estimate the height after 1.75 seconds.
SOLUTION
1. Understand the Problem You are asked to identify the type of function that can
model the table of values and then to fi nd the height at a specifi c time.
2. Make a Plan Create a scatter plot of the data. Then use the relationship shown in
the scatter plot to estimate the height after 1.75 seconds.
3. Solve the Problem Create a scatter plot.
The data appear to lie on a curve that resembles
a quadratic function. Sketch the curve.
So, you can model the data with a quadratic
function. The graph shows that the height is
about 15 feet after 1.75 seconds.
4. Look Back To check that your solution is reasonable, analyze the values in the
table. Notice that the heights decrease after 1 second. Because 1.75 is between
1.5 and 2, the height must be between 20 feet and 8 feet.
8 < 15 < 20 ✓
Monitoring Progress Help in English and Spanish at BigIdeasMath.com
Use a graphing calculator to graph the function and its parent function. Then describe the transformations.
8. h(x) = − 1 —
4 x + 5 9. d(x) = 3(x − 5)2 − 1
10. The table shows the amount of fuel in a chainsaw over time. What type of
function can you use to model the data? When will the tank be empty?
Time (minutes), x 0 10 20 30 40
Fuel remaining (fl uid ounces), y 15 12 9 6 3
Time(seconds), x
Height(feet), y
0 8
0.5 20
1 24
1.5 20
2 8
10
−10
−12
8
f
g
x
y
20
10
0
30
210 3
4
MMUT
Int_Math3_PE_02.01.indd 43Int_Math3_PE_02.01.indd 43 1/30/15 2:02 PM1/30/15 2:02 PM
44 Chapter 2 Linear and Quadratic Functions
Exercises2.1 Dynamic Solutions available at BigIdeasMath.com
In Exercises 3–6, identify the function family to which f belongs. Compare the graph of f to the graph of its parent function. (See Example 1.)
3. 4.
x
y
−4
−2
−2−4
f(x) = 2�x + 2� − 8
x
y
−2
42−2−4
f(x) = −2x2 + 3
5. 6.
x
y20
10
−20
42 6−2
f(x) = 5x − 2
x
y
4
6
2
−2
42−2−4
f(x) = 3
7. MODELING WITH MATHEMATICS At 8:00 a.m.,
the temperature is 43°F. The temperature increases
2°F each hour for the next 7 hours. Graph the
temperatures over time t (t = 0 represents 8:00 a.m.).
What type of function can you use to model the data?
Explain.
8. MODELING WITH MATHEMATICS You purchase a car
from a dealership for $10,000. The trade-in value of
the car each year after the purchase is given by the
function f(x) = 10,000 − 250x2. Identify the function
family to which f belongs.
In Exercises 9–18, graph the function and its parent function. Then describe the transformation. (See Examples 2 and 3.)
9. g(x) = x + 4 10. f(x) = x − 6
11. f(x) = x2 − 1 12. h(x) = (x + 4)2
13. g(x) = ∣ x − 5 ∣ 14. f(x) = 4 + ∣ x ∣
15. h(x) = −x2 16. g(x) = −x
17. f(x) = 3 18. f(x) = −2
Monitoring Progress and Modeling with MathematicsMonitoring Progress and Modeling with Mathematics
1. COMPLETE THE SENTENCE The function f(x) = x2 is the ______ of f(x) = 2x2 − 3.
2. DIFFERENT WORDS, SAME QUESTION Which is different? Find “both” answers.
What are the vertices of the fi gure after a
refl ection in the x-axis, followed by a translation
2 units right?
What are the vertices of the fi gure after a
translation 6 units up and 2 units right?
What are the vertices of the fi gure after
a translation 2 units right, followed by a
refl ection in the x-axis?
What are the vertices of the fi gure after a
translation 6 units up, followed by a refl ection
in the x-axis?
Vocabulary and Core Concept Check
x
y4
2
−4
−2
42−2−4
Int_Math3_PE_02.01.indd 44Int_Math3_PE_02.01.indd 44 1/30/15 2:02 PM1/30/15 2:02 PM
Section 2.1 Parent Functions and Transformations 45
In Exercises 19–26, graph the function and its parent function. Then describe the transformation. (See Example 4.)
19. f(x) = 1 —
3 x 20. g(x) = 4x
21. f(x) = 2x2 22. h(x) = 1 —
3 x2
23. h(x) = 3 —
4 x 24. g(x) =
4 —
3 x
25. h(x) = 3 ∣ x ∣ 26. f(x) = 1 —
2 ∣ x ∣
In Exercises 27–34, use a graphing calculator to graph the function and its parent function. Then describe the transformations. (See Example 5.)
27. f(x) = 3x + 2 28. h(x) = −x + 5
29. h(x) = −3 ∣ x ∣ − 1 30. f(x) = 3 —
4 ∣ x ∣ + 1
31. g(x) = 1 —
2 x2 − 6 32. f(x) = 4x2 − 3
33. f(x) = −(x + 3)2 + 1 —
4
34. g(x) = − ∣ x − 1 ∣ − 1 —
2
ERROR ANALYSIS In Exercises 35 and 36, identify and correct the error in describing the transformation of the parent function.
35.
x
y
−8
−12
−4
42−2−4
The graph is a refl ection in the x-axis
and a vertical shrink of the parent
quadratic function.
✗
36.
x
y
4
2
42 6
The graph is a translation 3 units right of
the parent absolute value function, so the
function is f(x) = ∣ x + 3 ∣ .
✗
MATHEMATICAL CONNECTIONS In Exercises 37 and 38, fi nd the coordinates of the fi gure after the transformation.
37. Translate 2 units 38. Refl ect in the x-axis.
down.
x
y4
2
−4
4−2−4
A
C
B
x
y4
−2
−4
42−2−4
A
CD
B
USING TOOLS In Exercises 39–44, identify the function family and describe the domain and range. Use a graphing calculator to verify your answer.
39. g(x) = ∣ x + 2 ∣ − 1 40. h(x) = ∣ x − 3 ∣ + 2
41. g(x) = 3x + 4 42. f(x) = −4x + 11
43. f(x) = 5x2 − 2 44. f(x) = −2x2 + 6
45. MODELING WITH MATHEMATICS The table shows
the speeds of a car as it travels through an intersection
with a stop sign. What type of function can you use to
model the data? Estimate the speed of the car when it
is 20 yards past the intersection. (See Example 6.)
Displacement from
sign (yards), xSpeed
(miles per hour), y
−100 40
−50 20
−10 4
0 0
10 4
50 20
100 40
46. THOUGHT PROVOKING In the same coordinate plane,
sketch the graph of the parent quadratic function
and the graph of a quadratic function that has no
x-intercepts. Describe the transformation(s) of the
parent function.
47. USING STRUCTURE Graph the functions
f(x) = ∣ x − 4 ∣ and g(x) = ∣ x ∣ − 4. Are they
equivalent? Explain.
Int_Math3_PE_02.01.indd 45Int_Math3_PE_02.01.indd 45 1/30/15 2:02 PM1/30/15 2:02 PM
46 Chapter 2 Linear and Quadratic Functions
Maintaining Mathematical ProficiencyMaintaining Mathematical ProficiencyDetermine whether the ordered pair is a solution of the equation. (Skills Review Handbook)
55. f(x) = ∣ x + 2 ∣ ; (1, −3) 56. f(x) = ∣ x ∣ − 3; (−2, −5)
57. f(x) = x − 3; (5, 2) 58. f(x) = x − 4; (12, 8)
Find the x-intercept and the y-intercept of the graph of the equation. (Skills Review Handbook)
59. y = x 60. y = x + 2
61. 3x + y = 1 62. x − 2y = 8
Reviewing what you learned in previous grades and lessons
48. HOW DO YOU SEE IT? Consider the graphs of f, g,
and h.
x
y4
2
−4
−2
42−4
fg
h
a. Does the graph of g represent a vertical stretch
or a vertical shrink of the graph of f ? Explain
your reasoning.
b. Describe how to transform the graph of f to obtain
the graph of h.
49. MAKING AN ARGUMENT Your friend says two
different translations of the graph of the parent linear
function can result in the graph of f(x) = x − 2. Is
your friend correct? Explain.
50. DRAWING CONCLUSIONS A person swims at a
constant speed of 1 meter per second. What type
of function can be used to model the distance the
swimmer travels? If the person has a 10-meter head
start, what type of transformation does this
represent? Explain.
51. PROBLEM SOLVING You are playing basketball with
your friends. The height (in feet) of the ball above
the ground t seconds after a shot is released from
your hand is modeled by the function
f(t) = −16t2 + 32t + 5.2.
a. Without graphing, identify the type of function
that models the height of the basketball.
b. What is the value of t when the ball is released
from your hand? Explain your reasoning.
c. How many feet above the ground is the ball when
it is released from your hand? Explain.
52. MODELING WITH MATHEMATICS The table shows the
battery lives of a computer over time. What type of
function can you use to model the data? Interpret the
meaning of the x-intercept in this situation.
Time (hours), x
Battery life remaining, y
1 80%
3 40%
5 0%
6 20%
8 60%
53. REASONING Compare each function with its parent
function. State whether it contains a horizontal translation, vertical translation, both, or neither.
Explain your reasoning.
a. f(x) = 2 ∣ x ∣ − 3 b. f(x) = (x − 8)2
c. f(x) = ∣ x + 2 ∣ + 4 d. f(x) = 4x2
54. CRITICAL THINKING Use the values −1, 0, 1,
and 2 in the correct box so the graph of each function
intersects the x-axis. Explain your reasoning.
a. f(x) = 3x + 1 b. f(x) = ∣ 2x − 6 ∣ −
c. f(x) = x2 + 1 d. f(x) =
Int_Math3_PE_02.01.indd 46Int_Math3_PE_02.01.indd 46 1/30/15 2:02 PM1/30/15 2:02 PM

Section 2.2 Transformations of Linear and Absolute Value Functions 47
Essential QuestionEssential Question How do the graphs of y = f(x) + k,
y = f (x − h), and y = −f(x) compare to the graph of the parent
function f ?
Transformations of the Parent Absolute Value Function
Work with a partner. Compare
the graph of the function
y = ∣ x ∣ + k Transformation
to the graph of the parent function
f (x) = ∣ x ∣ . Parent function
USING TOOLS STRATEGICALLYTo be profi cient in math, you need to use technological tools to visualize results and explore consequences.
Transformations of the Parent Absolute Value Function
Work with a partner. Compare
the graph of the function
y = ∣ x − h ∣ Transformation
to the graph of the parent function
f (x) = ∣ x ∣ . Parent function
Transformation of the Parent Absolute Value Function
Work with a partner. Compare
the graph of the function
y = − ∣ x ∣ Transformation
to the graph of the parent function
f (x) = ∣ x ∣ . Parent function
Communicate Your AnswerCommunicate Your Answer4. How do the graphs of y = f (x) + k, y = f (x − h), and y = −f(x) compare to the
graph of the parent function f ?
5. Compare the graph of each function to the graph of its parent function f. Use a
graphing calculator to verify your answers are correct.
a. y = 2x − 4 b. y = 2x + 4 c. y = −2x
d. y = x2 + 1 e. y = (x − 1)2 f. y = −x2
6
−4
−6
4y = �x� y = �x� + 2
6
y = �x� − 2
6
−4
−6
4y = �x − 2�
4y = �x�
−6
y = �x + 3�
6
−4
−6
4
6
y = −�x�
4y = �x�
2.2 Transformations of Linear and Absolute Value Functions
Int_Math3_PE_02.02.indd 47Int_Math3_PE_02.02.indd 47 1/30/15 2:04 PM1/30/15 2:04 PM
48 Chapter 2 Linear and Quadratic Functions
2.2 Lesson What You Will LearnWhat You Will Learn Write functions representing translations and refl ections.
Write functions representing stretches and shrinks.
Write functions representing combinations of transformations.
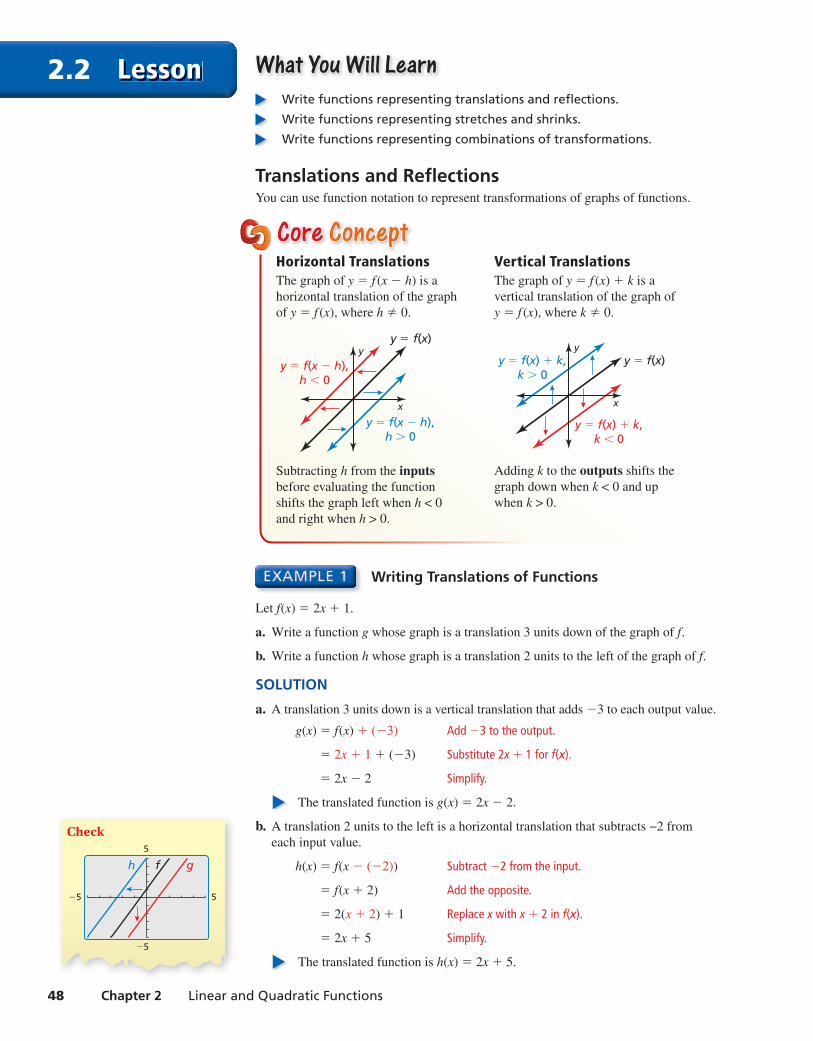
Translations and Refl ectionsYou can use function notation to represent transformations of graphs of functions.
Writing Translations of Functions
Let f(x) = 2x + 1.
a. Write a function g whose graph is a translation 3 units down of the graph of f.
b. Write a function h whose graph is a translation 2 units to the left of the graph of f.
SOLUTION
a. A translation 3 units down is a vertical translation that adds −3 to each output value.
g(x) = f(x) + (−3) Add −3 to the output.
= 2x + 1 + (−3) Substitute 2x + 1 for f(x).
= 2x − 2 Simplify.
The translated function is g(x) = 2x − 2.
b. A translation 2 units to the left is a horizontal translation that subtracts −2 from
each input value.
h(x) = f(x − (−2)) Subtract −2 from the input.
= f(x + 2) Add the opposite.
= 2(x + 2) + 1 Replace x with x + 2 in f(x).
= 2x + 5 Simplify.
The translated function is h(x) = 2x + 5.
Check
5
−5
−5
5
f gh
Core Core ConceptConceptHorizontal Translations Vertical TranslationsThe graph of y = f (x − h) is a
horizontal translation of the graph
of y = f (x), where h ≠ 0.
The graph of y = f (x) + k is a
vertical translation of the graph of
y = f (x), where k ≠ 0.
x
y
y = f(x − h),h < 0
y = f(x − h),h > 0
y = f(x)
x
y
y = f(x) + k,k < 0
y = f(x) + k,k > 0
y = f(x)
Subtracting h from the inputs
before evaluating the function
shifts the graph left when h < 0
and right when h > 0.
Adding k to the outputs shifts the
graph down when k < 0 and up
when k > 0.
Int_Math3_PE_02.02.indd 48Int_Math3_PE_02.02.indd 48 1/30/15 2:04 PM1/30/15 2:04 PM

Section 2.2 Transformations of Linear and Absolute Value Functions 49
Writing Refl ections of Functions
Let f(x) = ∣ x + 3 ∣ + 1.
a. Write a function g whose graph is a refl ection in the x-axis of the graph of f.
b. Write a function h whose graph is a refl ection in the y-axis of the graph of f.
SOLUTION
a. A refl ection in the x-axis changes the sign of each output value.
g(x) = −f(x) Multiply the output by −1.
= − ( ∣ x + 3 ∣ + 1 ) Substitute ∣ x + 3 ∣ + 1 for f(x).
= − ∣ x + 3 ∣ − 1 Distributive Property
The refl ected function is g(x) = − ∣ x + 3 ∣ − 1.
b. A refl ection in the y-axis changes the sign of each input value.
h(x) = f(−x) Multiply the input by −1.
= ∣ −x + 3 ∣ + 1 Replace x with −x in f(x).
= ∣ −(x − 3) ∣ + 1 Factor out −1.
= ∣ −1 ∣ ⋅ ∣ x − 3 ∣ + 1 Product Property of Absolute Value
= ∣ x − 3 ∣ + 1 Simplify.
The refl ected function is h(x) = ∣ x − 3 ∣ + 1.
Monitoring ProgressMonitoring Progress Help in English and Spanish at BigIdeasMath.com
Write a function g whose graph represents the indicated transformation of the graph of f. Use a graphing calculator to check your answer.
1. f(x) = 3x; translation 5 units up
2. f(x) = ∣ x ∣ − 3; translation 4 units to the right
3. f(x) = − ∣ x + 2 ∣ − 1; refl ection in the x-axis
4. f(x) = 1 —
2 x + 1; refl ection in the y-axis
Check
10
−10
−10
10
f
g
h
STUDY TIPWhen you refl ect a function in a line, the graphs are symmetric about that line.
Core Core ConceptConceptRefl ections in the x-Axis Refl ections in the y-Axis
The graph of y = −f (x) is a
refl ection in the x-axis of the graph
of y = f (x).
The graph of y = f (−x) is a refl ection
in the y-axis of the graph of y = f (x).
x
y
y = −f(x)
y = f(x)
x
yy = f(−x) y = f(x)
Multiplying the outputs by −1
changes their signs.
Multiplying the inputs by −1
changes their signs.
Int_Math3_PE_02.02.indd 49Int_Math3_PE_02.02.indd 49 1/30/15 2:04 PM1/30/15 2:04 PM

50 Chapter 2 Linear and Quadratic Functions
Core Core ConceptConceptHorizontal Stretches and ShrinksThe graph of y = f (ax) is a horizontal stretch
or shrink by a factor of 1 —
a of the graph of
y = f(x), where a > 0 and a ≠ 1.
Multiplying the inputs by a before evaluating
the function stretches the graph horizontally
(away from the y-axis) when 0 < a < 1, and
shrinks the graph horizontally (toward the
y-axis) when a > 1.
Vertical Stretches and ShrinksThe graph of y = a ⋅ f(x) is a vertical stretch or
shrink by a factor of a of the graph of y = f(x),
where a > 0 and a ≠ 1.
Multiplying the outputs by a stretches the graph
vertically (away from the x-axis) when a > 1,
and shrinks the graph vertically (toward the
x-axis) when 0 < a < 1.
Stretches and ShrinksIn the previous section, you learned that vertical stretches and shrinks transform
graphs. You can also use horizontal stretches and shrinks to transform graphs.
STUDY TIPThe graphs of y = f(−ax)and y = −a ⋅ f(x) represent a stretch or shrink and a refl ection in the x- or y-axis of the graph of y = f (x).
Writing Stretches and Shrinks of Functions
Let f(x) = ∣ x − 3 ∣ − 5. Write (a) a function g whose graph is a horizontal shrink of
the graph of f by a factor of 1 —
3 , and (b) a function h whose graph is a vertical stretch of
the graph of f by a factor of 2.
SOLUTION
a. A horizontal shrink by a factor of 1 —
3 multiplies each input value by 3.
g(x) = f(3x) Multiply the input by 3.
= ∣ 3x − 3 ∣ − 5 Replace x with 3x in f(x).
The transformed function is g(x) = ∣ 3x − 3 ∣ − 5.
b. A vertical stretch by a factor of 2 multiplies each output value by 2.
h(x) = 2 ⋅ f(x) Multiply the output by 2.
= 2 ⋅ ( ∣ x − 3 ∣ − 5 ) Substitute ∣ x − 3 ∣ − 5 for f(x).
= 2 ∣ x − 3 ∣ − 10 Distributive Property
The transformed function is h(x) = 2 ∣ x − 3 ∣ − 10.
Monitoring ProgressMonitoring Progress Help in English and Spanish at BigIdeasMath.com
Write a function g whose graph represents the indicated transformation of the graph of f. Use a graphing calculator to check your answer.
5. f(x) = 4x + 2; horizontal stretch by a factor of 2
6. f(x) = ∣ x ∣ − 3; vertical shrink by a factor of 1 —
3
Check
14
−12
−10
4
fg h
x
y
y = f(ax),0 < a < 1
y = f(ax),a > 1
y = f(x)
The y-interceptstays the same.
x
y
y = a ∙ f(x),0 < a < 1
y = a ∙ f(x),a > 1
y = f(x)
The x-interceptstays the same.
Int_Math3_PE_02.02.indd 50Int_Math3_PE_02.02.indd 50 1/30/15 2:04 PM1/30/15 2:04 PM
Section 2.2 Transformations of Linear and Absolute Value Functions 51
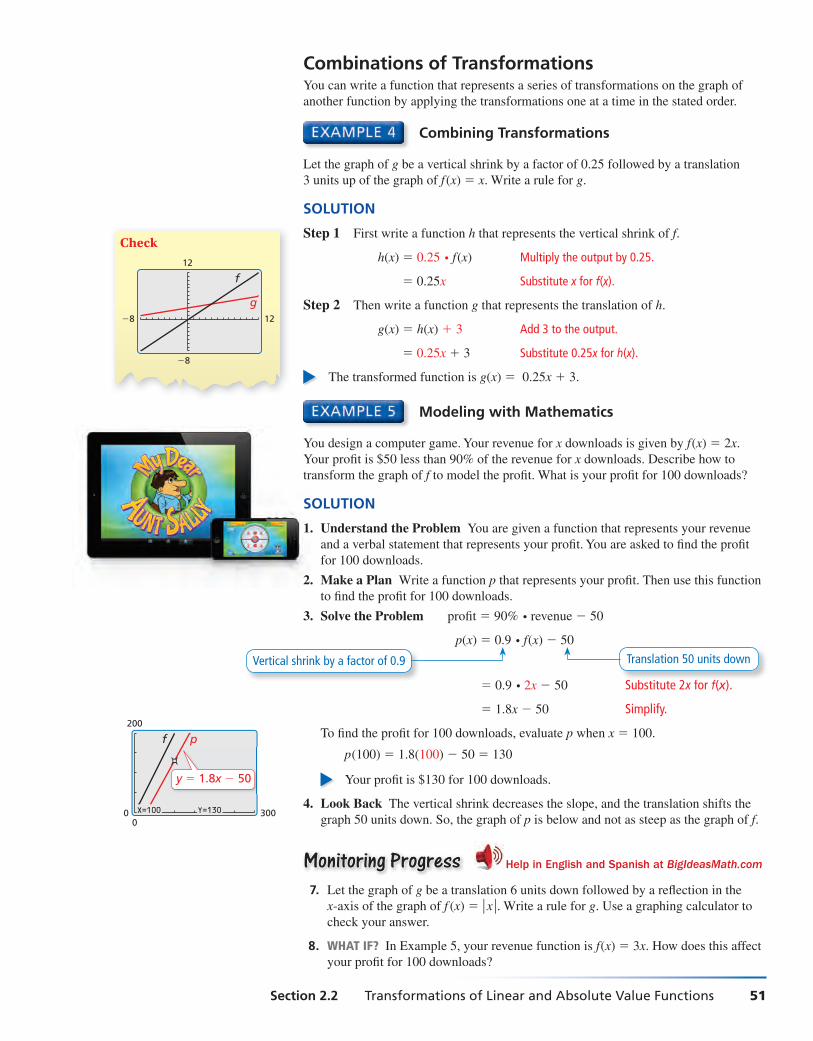
Combinations of TransformationsYou can write a function that represents a series of transformations on the graph of
another function by applying the transformations one at a time in the stated order.
Check
12
−8
−8
12
g
f
Combining Transformations
Let the graph of g be a vertical shrink by a factor of 0.25 followed by a translation
3 units up of the graph of f (x) = x. Write a rule for g.
SOLUTION
Step 1 First write a function h that represents the vertical shrink of f.
h(x) = 0.25 ⋅ f(x) Multiply the output by 0.25.
= 0.25x Substitute x for f(x).
Step 2 Then write a function g that represents the translation of h.
g(x) = h(x) + 3 Add 3 to the output.
= 0.25x + 3 Substitute 0.25x for h(x).
The transformed function is g(x) = 0.25x + 3.
Modeling with Mathematics
You design a computer game. Your revenue for x downloads is given by f(x) = 2x.
Your profi t is $50 less than 90% of the revenue for x downloads. Describe how to
transform the graph of f to model the profi t. What is your profi t for 100 downloads?
SOLUTION
1. Understand the Problem You are given a function that represents your revenue
and a verbal statement that represents your profi t. You are asked to fi nd the profi t
for 100 downloads.
2. Make a Plan Write a function p that represents your profi t. Then use this function
to fi nd the profi t for 100 downloads.
3. Solve the Problem profi t = 90% ⋅ revenue − 50
p(x) = 0.9 ⋅ f(x) − 50
= 0.9 ⋅ 2x − 50 Substitute 2x for f(x).
= 1.8x − 50 Simplify.
To fi nd the profi t for 100 downloads, evaluate p when x = 100.
p(100) = 1.8(100) − 50 = 130
Your profi t is $130 for 100 downloads.
4. Look Back The vertical shrink decreases the slope, and the translation shifts the
graph 50 units down. So, the graph of p is below and not as steep as the graph of f.
Monitoring ProgressMonitoring Progress Help in English and Spanish at BigIdeasMath.com
7. Let the graph of g be a translation 6 units down followed by a refl ection in the
x-axis of the graph of f (x) = ∣ x ∣ . Write a rule for g. Use a graphing calculator to
check your answer.
8. WHAT IF? In Example 5, your revenue function is f(x) = 3x. How does this affect
your profi t for 100 downloads?
Vertical shrink by a factor of 0.9
b f f(f )
Translation 50 units down
3000
0
200
f p
y = 1.8x − 50
X=100 Y=130
Int_Math3_PE_02.02.indd 51Int_Math3_PE_02.02.indd 51 1/30/15 2:04 PM1/30/15 2:04 PM
52 Chapter 2 Linear and Quadratic Functions
Exercises2.2 Dynamic Solutions available at BigIdeasMath.com
In Exercises 3–8, write a function g whose graph represents the indicated transformation of the graph of f. Use a graphing calculator to check your answer. (See Example 1.)
3. f(x) = x − 5; translation 4 units to the left
4. f(x) = x + 2; translation 2 units to the right
5. f(x) = ∣ 4x + 3 ∣ + 2; translation 2 units down
6. f(x) = 2x − 9; translation 6 units up
7. f(x) = 4 − ∣ x + 1 ∣ 8. f(x) = ∣ 4x ∣ + 5
x
y5
1
31−1
f g
x
y
2
4
2−2
fg
9. WRITING Describe two different translations of the
graph of f that result in the graph of g.
x
y2
−6
42−2
f(x) = −x − 5
g(x) = −x − 2
10. PROBLEM SOLVING You open a café. The function
f(x) = 4000x represents your expected net income
(in dollars) after being open x weeks. Before you
open, you incur an extra expense of $12,000. What
transformation of f is necessary to model this
situation? How many weeks will it take to pay off
the extra expense?
In Exercises 11–16, write a function g whose graph represents the indicated transformation of the graph of f. Use a graphing calculator to check your answer.(See Example 2.)
11. f(x) = −5x + 2; refl ection in the x-axis
12. f(x) = 1 —
2 x − 3; refl ection in the x-axis
13. f(x) = ∣ 6x ∣ − 2; refl ection in the y-axis
14. f(x) = ∣ 2x − 1 ∣ + 3; refl ection in the y-axis
15. f(x) = −3 + ∣ x − 11 ∣ ; refl ection in the y-axis
16. f(x) = −x + 1; refl ection in the y-axis
Monitoring Progress and Modeling with MathematicsMonitoring Progress and Modeling with Mathematics
1. COMPLETE THE SENTENCE The function g(x) = ∣ 5x ∣ − 4 is a horizontal ___________ of the
function f (x) = ∣ x ∣ − 4.
2. WHICH ONE DOESN'T BELONG? Which transformation does not belong with the other three?
Explain your reasoning.
Translate the graph of f(x) = 2x + 3
up 2 units.
Shrink the graph of f(x) = x + 5
horizontally by a factor of 1 —
2 .
Stretch the graph of f(x) = x + 3
vertically by a factor of 2.
Translate the graph of f(x) = 2x + 3
left 1 unit.
Vocabulary and Core Concept CheckVocabulary and Core Concept Check
Int_Math3_PE_02.02.indd 52Int_Math3_PE_02.02.indd 52 1/30/15 2:04 PM1/30/15 2:04 PM
Section 2.2 Transformations of Linear and Absolute Value Functions 53
In Exercises 17–22, write a function g whose graph represents the indicated transformation of the graph of f. Use a graphing calculator to check your answer. (See Example 3.)
17. f(x) = x + 2; vertical stretch by a factor of 5
18. f(x) = 2x + 6; vertical shrink by a factor of 1 —
2
19. f(x) = ∣ 2x ∣ + 4; horizontal shrink by a factor of 1 —
2
20. f(x) = ∣ x + 3 ∣ ; horizontal stretch by a factor of 4
21. f(x) = −2 ∣ x − 4 ∣ + 2
x
y2
−2
4
f
g
(4, 2)(4, 1)
22. f(x) = 6 − x
x
y
f
4
2
6
84−4
(0, 6)
g
ANALYZING RELATIONSHIPS
x
y
f
In Exercises 23–26, match the graph of the transformation of f with the correct equation shown. Explain your reasoning.
23.
x
y 24.
x
y
25.
x
y 26.
x
y
A. y = 2f(x) B. y = f (2x)
C. y = f (x + 2) D. y = f(x) + 2
In Exercises 27–32, write a function g whose graph represents the indicated transformations of the graph of f. (See Example 4.)
27. f(x) = x; vertical stretch by a factor of 2 followed by a
translation 1 unit up
28. f(x) = x; translation 3 units down followed by a
vertical shrink by a factor of 1 —
3
29. f(x) = ∣ x ∣ ; translation 2 units to the right followed by
a horizontal stretch by a factor of 2
30. f(x) = ∣ x ∣ ; refl ection in the y-axis followed by a
translation 3 units to the right
31. f (x) = ∣ x ∣ 32. f (x) = ∣ x ∣
x
y4
−4
−12
84−4−8
f
g
x
y4
2
−4
42−2−4
f
g
ERROR ANALYSIS In Exercises 33 and 34, identify and correct the error in writing the function g whose graph represents the indicated transformations of the graph of f.
33. f (x) = ∣ x ∣ ; translation
3 units to the right followed by a translation 2 units up
g(x) = ∣ x + 3 ∣ + 2
✗
34. f (x) = x ; translation 6 units down followed by a vertical stretch by a factor of 5
g(x) = 5x − 6
✗
35. MAKING AN ARGUMENT Your friend claims that
when writing a function whose graph represents
a combination of transformations, the order is not
important. Is your friend correct? Justify your answer.
Int_Math3_PE_02.02.indd 53Int_Math3_PE_02.02.indd 53 1/30/15 2:04 PM1/30/15 2:04 PM

54 Chapter 2 Linear and Quadratic Functions
Maintaining Mathematical ProficiencyMaintaining Mathematical ProficiencyEvaluate the function for the given value of x. (Skills Review Handbook)
46. f(x) = x + 4; x = 3 47. f(x) = 4x − 1; x = −1
48. f(x) = −x + 3; x = 5 49. f(x) = −2x − 2; x = −1
Create a scatter plot of the data. (Skills Review Handbook)
50. x 8 10 11 12 15
f(x) 4 9 10 12 12
51. x 2 5 6 10 13
f(x) 22 13 15 12 6
Reviewing what you learned in previous grades and lessons
36. MODELING WITH MATHEMATICS During a recent
period of time, bookstore sales have been declining.
The sales (in billions of dollars) can be modeled by
the function f(t) = − 7 —
5 t + 17.2, where t is the number
of years since 2006. Suppose sales decreased at twice
the rate. How can you transform the graph of f to
model the sales? Explain how the sales in 2010 are
affected by this change. (See Example 5.)
MATHEMATICAL CONNECTIONS For Exercises 37–40, describe the transformation of the graph of f to the graph of g. Then fi nd the area of the shaded triangle.
37. f(x) = ∣ x − 3 ∣ 38. f(x) = − ∣ x ∣ − 2
f g
x
y6
−2
42−2−4
x
y
−4
2−2
f
g
39. f(x) = −x + 4 40. f(x) = x − 5
x
y
f
g2
−2
4 62−2
f g
xy
−2
2−2
41. ABSTRACT REASONING The functions f(x) = mx + b
and g(x) = mx + c represent two parallel lines.
a. Write an expression for the vertical translation of
the graph of f to the graph of g.
b. Use the defi nition of slope to write an expression
for the horizontal translation of the graph of f to
the graph of g.
42. HOW DO YOU SEE IT? Consider the graph of
f(x) = mx + b. Describe the effect each
transformation has on the slope of the line and
the intercepts of the graph.
x
y
f
a. Refl ect the graph of f in the y-axis.
b. Shrink the graph of f vertically by a factor of 1 —
3 .
c. Stretch the graph of f horizontally by a factor of 2.
43. REASONING The graph of g(x) = −4 ∣ x ∣ + 2 is a
refl ection in the x-axis, vertical stretch by a factor
of 4, and a translation 2 units down of the graph of
its parent function. Choose the correct order for the
transformations of the graph of the parent function to
obtain the graph of g. Explain your reasoning.
44. THOUGHT PROVOKING You are planning a
cross-country bicycle trip of 4320 miles. Your distance
d (in miles) from the halfway point can be modeled
by d = 72 ∣ x − 30 ∣ , where x is the time (in days) and
x = 0 represents June 1. Your plans are altered so that
the model is now a right shift of the original model.
Give an example of how this can happen. Sketch both
the original model and the shifted model.
45. CRITICAL THINKING Use the correct value 0, −2, or 1
with a, b, and c so the graph of g(x) = a ∣ x − b ∣ + c is
a refl ection in the x-axis followed by a translation one
unit to the left and one unit up of the graph of
f(x) = 2 ∣ x − 2 ∣ + 1. Explain your reasoning.
Int_Math3_PE_02.02.indd 54Int_Math3_PE_02.02.indd 54 1/30/15 2:04 PM1/30/15 2:04 PM
Section 2.3 Modeling with Linear Functions 55
Modeling with Linear Functions2.3
Essential QuestionEssential Question How can you use a linear function to model and
analyze a real-life situation?
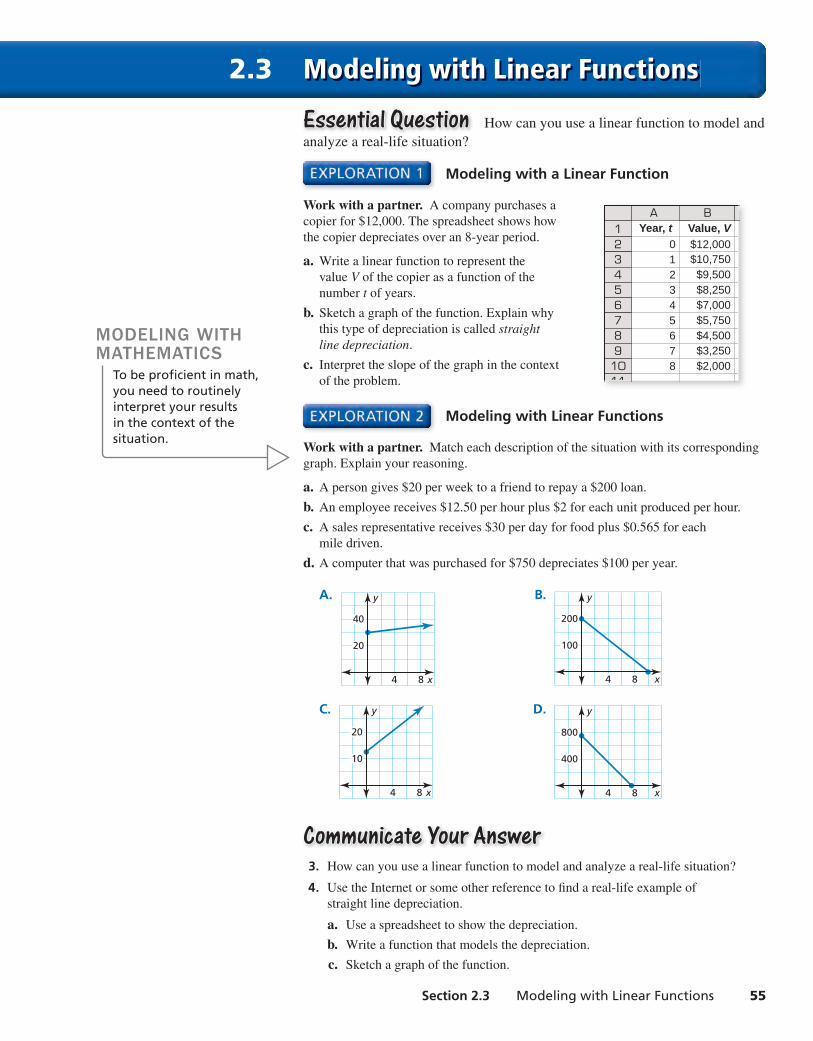
Modeling with a Linear Function
Work with a partner. A company purchases a
copier for $12,000. The spreadsheet shows how
the copier depreciates over an 8-year period.
a. Write a linear function to represent the
value V of the copier as a function of the
number t of years.
b. Sketch a graph of the function. Explain why
this type of depreciation is called straight line depreciation.
c. Interpret the slope of the graph in the context
of the problem.
Modeling with Linear Functions
Work with a partner. Match each description of the situation with its corresponding
graph. Explain your reasoning.
a. A person gives $20 per week to a friend to repay a $200 loan.
b. An employee receives $12.50 per hour plus $2 for each unit produced per hour.
c. A sales representative receives $30 per day for food plus $0.565 for each
mile driven.
d. A computer that was purchased for $750 depreciates $100 per year.
A.
x
y
40
20
84
B.
x
y
200
100
84
C.
x
y
20
10
84
D.
x
y
800
400
84
Communicate Your AnswerCommunicate Your Answer 3. How can you use a linear function to model and analyze a real-life situation?
4. Use the Internet or some other reference to fi nd a real-life example of
straight line depreciation.
a. Use a spreadsheet to show the depreciation.
b. Write a function that models the depreciation.
c. Sketch a graph of the function.
MODELING WITHMATHEMATICS
To be profi cient in math, you need to routinely interpret your results in the context of the situation.
AYear, t
012345678
BValue, V$12,000$10,750
$9,500$8,250$7,000$5,750$4,500$3,250$2,000
21
34567891011
Int_Math3_PE_02.03.indd 55Int_Math3_PE_02.03.indd 55 1/30/15 2:05 PM1/30/15 2:05 PM

56 Chapter 2 Linear and Quadratic Functions
2.3 Lesson
line of fi t, p. 58 line of best fi t, p. 59 correlation coeffi cient, p. 59
Previous slope slope-intercept form point-slope form scatter plot
Core VocabularyCore Vocabullarry
What You Will LearnWhat You Will Learn Write equations of linear functions using points and slopes.
Find lines of fi t and lines of best fi t.
Writing Linear Equations
Writing a Linear Equation from a Graph
The graph shows the distance Asteroid 2012 DA14 travels in x seconds. Write an
equation of the line and interpret the slope. The asteroid came within 17,200 miles
of Earth in February, 2013. About how long does it take the asteroid to travel
that distance?
SOLUTION
From the graph, you can see the slope is m = 24
— 5 = 4.8 and the y-intercept is b = 0.
Use slope-intercept form to write an equation of the line.
y = mx + b Slope-intercept form
= 4.8x + 0 Substitute 4.8 for m and 0 for b.
The equation is y = 4.8x. The slope indicates that the asteroid travels 4.8 miles per
second. Use the equation to fi nd how long it takes the asteroid to travel 17,200 miles.
17,200 = 4.8x Substitute 17,200 for y.
3583 ≈ x Divide each side by 4.8.
Because there are 3600 seconds in 1 hour, it takes the asteroid about 1 hour to
travel 17,200 miles.
Monitoring ProgressMonitoring Progress Help in English and Spanish at BigIdeasMath.com
1. The graph shows the remaining
balance y on a car loan after
making x monthly payments.
Write an equation of the line and
interpret the slope and y-intercept.
What is the remaining balance
after 36 payments?
REMEMBERAn equation of the form y = mx indicates that x and y are in a proportional relationship.
Core Core ConceptConceptWriting an Equation of a Line
Given slope m and y-intercept b Use slope-intercept form:
y = mx + b
Given slope m and a point (x1, y1) Use point-slope form:
y − y1 = m(x − x1)
Given points (x1, y1) and (x2, y2) First use the slope formula to fi nd m.
Then use point-slope form with either
given point.
Asteroid 2012 DA14Asteroid 2012 DA14
Dis
tan
ce (
mile
s)
0
8
16
24
y
Time (seconds)60 2 4 x
(5, 24)
Car LoanCar Loan
Bal
ance
(th
ou
san
ds
of
do
llars
)
0
6
12
18y
Number of payments300 10 20 40 50 60 x
(0, 18)
(10, 15)
Int_Math3_PE_02.03.indd 56Int_Math3_PE_02.03.indd 56 1/30/15 2:05 PM1/30/15 2:05 PM
Section 2.3 Modeling with Linear Functions 57
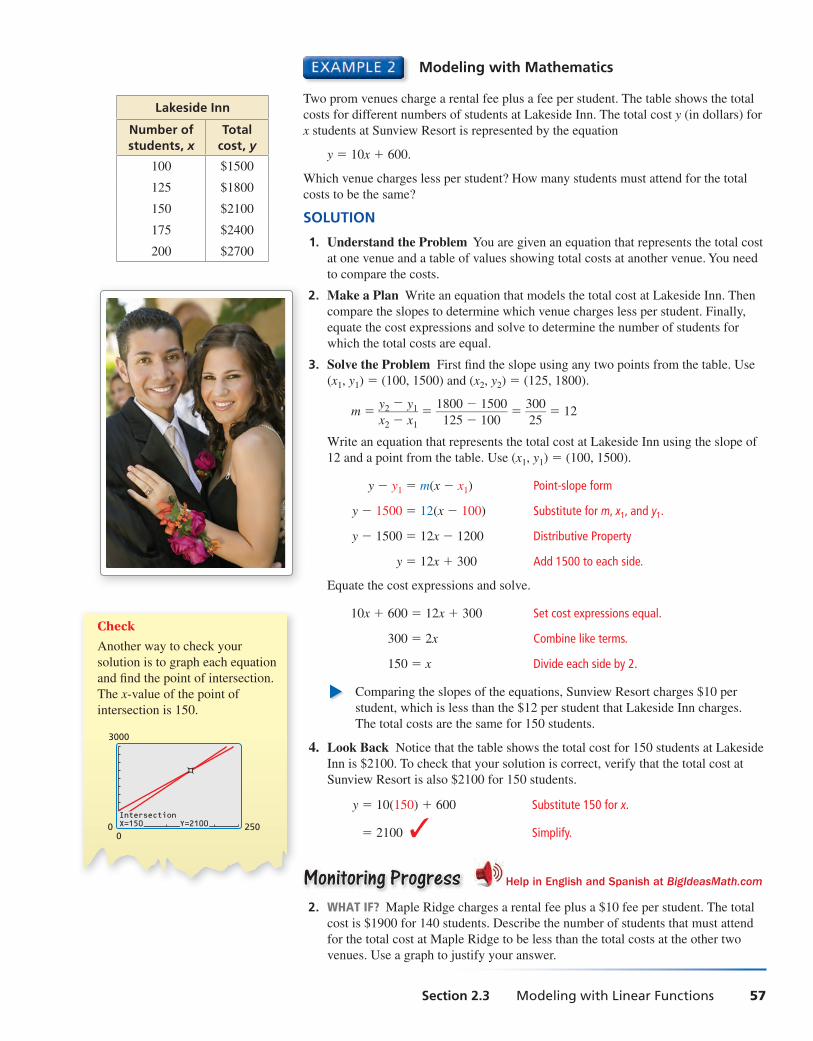
Modeling with Mathematics
Two prom venues charge a rental fee plus a fee per student. The table shows the total
costs for different numbers of students at Lakeside Inn. The total cost y (in dollars) for
x students at Sunview Resort is represented by the equation
y = 10x + 600.
Which venue charges less per student? How many students must attend for the total
costs to be the same?
SOLUTION
1. Understand the Problem You are given an equation that represents the total cost
at one venue and a table of values showing total costs at another venue. You need
to compare the costs.
2. Make a Plan Write an equation that models the total cost at Lakeside Inn. Then
compare the slopes to determine which venue charges less per student. Finally,
equate the cost expressions and solve to determine the number of students for
which the total costs are equal.
3. Solve the Problem First fi nd the slope using any two points from the table. Use
(x1, y1) = (100, 1500) and (x2, y2) = (125, 1800).
m = y2
− y1 — x2 − x1
= 1800 − 1500
—— 125 − 100
= 300
— 25
= 12
Write an equation that represents the total cost at Lakeside Inn using the slope of
12 and a point from the table. Use (x1, y1) = (100, 1500).
y − y1 = m(x − x1) Point-slope form
y − 1500 = 12(x − 100) Substitute for m, x1, and y1.
y − 1500 = 12x − 1200 Distributive Property
y = 12x + 300 Add 1500 to each side.
Equate the cost expressions and solve.
10x + 600 = 12x + 300 Set cost expressions equal.
300 = 2x Combine like terms.
150 = x Divide each side by 2.
Comparing the slopes of the equations, Sunview Resort charges $10 per
student, which is less than the $12 per student that Lakeside Inn charges.
The total costs are the same for 150 students.
4. Look Back Notice that the table shows the total cost for 150 students at Lakeside
Inn is $2100. To check that your solution is correct, verify that the total cost at
Sunview Resort is also $2100 for 150 students.
y = 10(150) + 600 Substitute 150 for x.
= 2100 ✓ Simplify.
Monitoring ProgressMonitoring Progress Help in English and Spanish at BigIdeasMath.com
2. WHAT IF? Maple Ridge charges a rental fee plus a $10 fee per student. The total
cost is $1900 for 140 students. Describe the number of students that must attend
for the total cost at Maple Ridge to be less than the total costs at the other two
venues. Use a graph to justify your answer.
Lakeside Inn
Number of students, x
Total cost, y
100 $1500
125 $1800
150 $2100
175 $2400
200 $2700
Check
Another way to check your
solution is to graph each equation
and fi nd the point of intersection.
The x-value of the point of
intersection is 150.
2500
0
3000
IntersectionX=150 Y=2100
Int_Math3_PE_02.03.indd 57Int_Math3_PE_02.03.indd 57 1/30/15 2:05 PM1/30/15 2:05 PM

58 Chapter 2 Linear and Quadratic Functions
Finding Lines of Fit and Lines of Best FitData do not always show an exact linear relationship. When the data in a scatter plot
show an approximately linear relationship, you can model the data with a line of fi t.
Finding a Line of Fit
The table shows the femur lengths (in centimeters) and heights (in centimeters) of
several people. Do the data show a linear relationship? If so, write an equation of a line
of fi t and use it to estimate the height of a person whose femur is 35 centimeters long.
SOLUTION
Step 1 Create a scatter plot of the data.
The data show a linear relationship.
Step 2 Sketch the line that most closely appears
to fi t the data. One possibility is shown.
Step 3 Choose two points on the line.
For the line shown, you might
choose (40, 170) and (50, 195).
Step 4 Write an equation of the line.
First, fi nd the slope.
m = y2 − y1 — x2 − x1
= 195 − 170
— 50 − 40
= 25
— 10
= 2.5
Use point-slope form to write an equation. Use (x1, y1) = (40, 170).
y − y1 = m(x − x1) Point-slope form
y − 170 = 2.5(x − 40) Substitute for m, x1, and y1.
y − 170 = 2.5x − 100 Distributive Property
y = 2.5x + 70 Add 170 to each side.
Use the equation to estimate the height of the person.
y = 2.5(35) + 70 Substitute 35 for x.
= 157.5 Simplify.
The approximate height of a person with a 35-centimeter femur is
157.5 centimeters.
Femurlength, x
Height, y
40 170
45 183
32 151
50 195
37 162
41 174
30 141
34 151
47 185
45 182
Core Core ConceptConceptFinding a Line of FitStep 1 Create a scatter plot of the data.
Step 2 Sketch the line that most closely appears to follow the trend given by
the data points. There should be about as many points above the line as
below it.
Step 3 Choose two points on the line and estimate the coordinates of each point.
These points do not have to be original data points.
Step 4 Write an equation of the line that passes through the two points from
Step 3. This equation is a model for the data.
Human SkeletonHuman Skeleton
Hei
gh
t(c
enti
met
ers)
0
80
160
y
Femur length(centimeters)
50 x0 30 40
(40, 170)
(50, 195)
Int_Math3_PE_02.03.indd 58Int_Math3_PE_02.03.indd 58 1/30/15 2:05 PM1/30/15 2:05 PM
Section 2.3 Modeling with Linear Functions 59
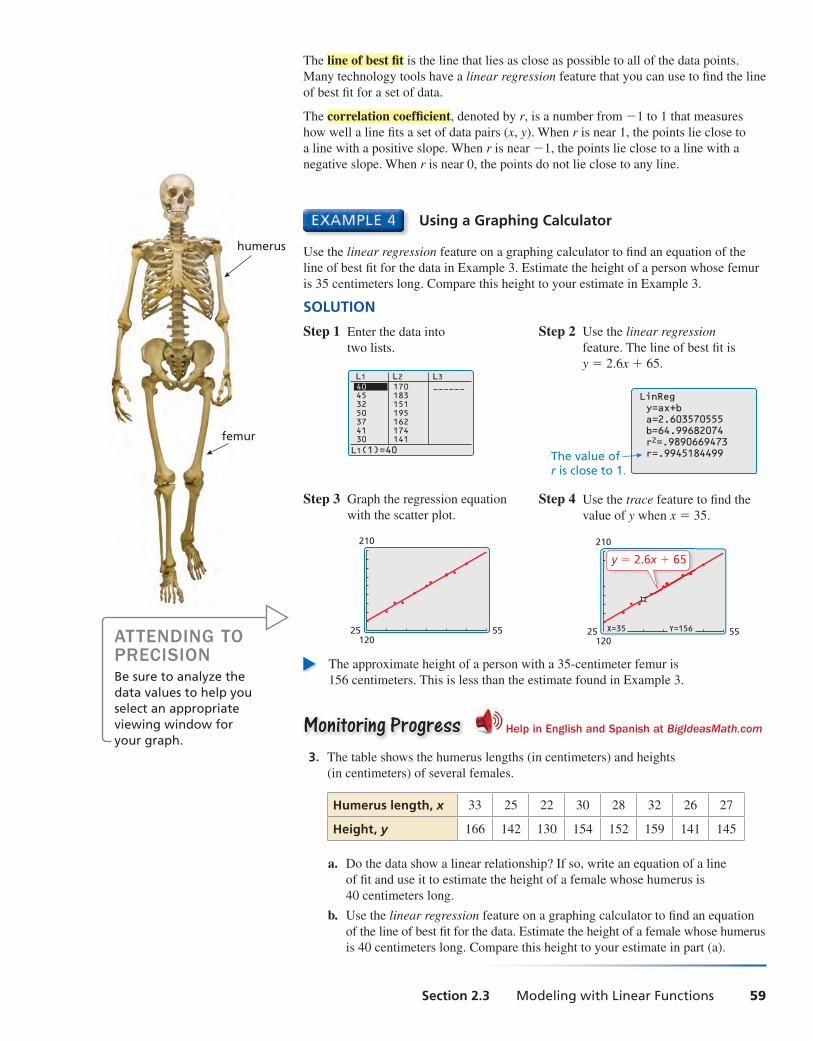
The line of best fi t is the line that lies as close as possible to all of the data points.
Many technology tools have a linear regression feature that you can use to fi nd the line
of best fi t for a set of data.
The correlation coeffi cient, denoted by r, is a number from −1 to 1 that measures
how well a line fi ts a set of data pairs (x, y). When r is near 1, the points lie close to
a line with a positive slope. When r is near −1, the points lie close to a line with a
negative slope. When r is near 0, the points do not lie close to any line.
Using a Graphing Calculator
Use the linear regression feature on a graphing calculator to fi nd an equation of the
line of best fi t for the data in Example 3. Estimate the height of a person whose femur
is 35 centimeters long. Compare this height to your estimate in Example 3.
SOLUTION
Step 1 Enter the data into
two lists.
Step 2 Use the linear regression
feature. The line of best fi t is
y = 2.6x + 65.
L2 L3L1
L1(1)=40
170183151195162174141
4540
3250374130
y=ax+bLinReg
a=2.603570555b=64.99682074r2=.9890669473r=.9945184499The value of
r is close to 1.
Step 3 Graph the regression equation
with the scatter plot.
Step 4 Use the trace feature to fi nd the
value of y when x = 35.
55120
25
210
55120
25
210
X=35 Y=156
y = 2.6x + 65
The approximate height of a person with a 35-centimeter femur is
156 centimeters. This is less than the estimate found in Example 3.
Monitoring ProgressMonitoring Progress Help in English and Spanish at BigIdeasMath.com
3. The table shows the humerus lengths (in centimeters) and heights
(in centimeters) of several females.
Humerus length, x 33 25 22 30 28 32 26 27
Height, y 166 142 130 154 152 159 141 145
a. Do the data show a linear relationship? If so, write an equation of a line
of fi t and use it to estimate the height of a female whose humerus is
40 centimeters long.
b. Use the linear regression feature on a graphing calculator to fi nd an equation
of the line of best fi t for the data. Estimate the height of a female whose humerus
is 40 centimeters long. Compare this height to your estimate in part (a).
ATTENDING TO PRECISIONBe sure to analyze the data values to help you select an appropriate viewing window for your graph.
humerus
femur
Int_Math3_PE_02.03.indd 59Int_Math3_PE_02.03.indd 59 1/30/15 2:05 PM1/30/15 2:05 PM
60 Chapter 2 Linear and Quadratic Functions
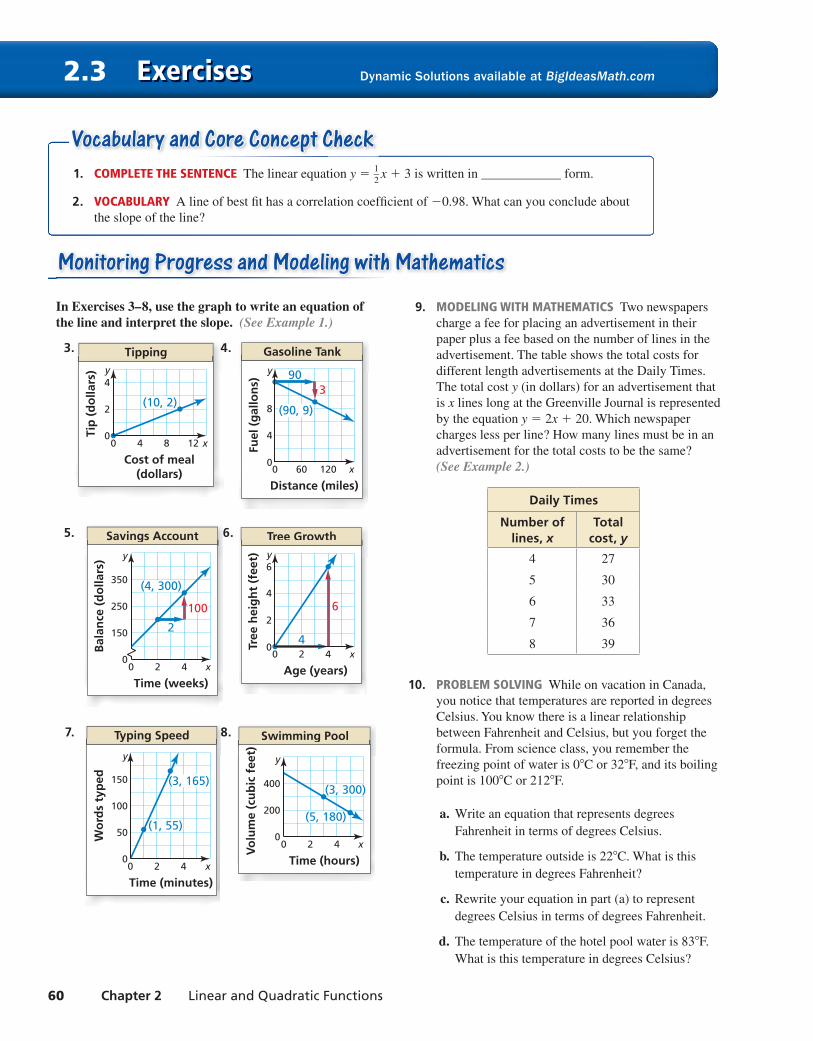
Exercises2.3 Dynamic Solutions available at BigIdeasMath.com
1. COMPLETE THE SENTENCE The linear equation y = 1 —
2 x + 3 is written in ____________ form.
2. VOCABULARY A line of best fi t has a correlation coeffi cient of −0.98. What can you conclude about
the slope of the line?
Monitoring Progress and Modeling with MathematicsMonitoring Progress and Modeling with Mathematics
In Exercises 3–8, use the graph to write an equation of the line and interpret the slope. (See Example 1.)
3. 4. Gasoline TankGasoline Tank
Fuel
(g
allo
ns)
Distance (miles)0
0
4
8
y
60 120 x
390
(90, 9)
. 4TippingTipping
Tip
(d
olla
rs)
0
2
4y
Cost of meal(dollars)
0 4 8 12 x
(10, 2)
5. Savings AccountSavings Account
Bal
ance
(d
olla
rs)
0
150
250
350
y
Time (weeks)0 2 4 x
(4, 300)
2
100
6. Tree GrowthTree Growth
Tree
hei
gh
t (f
eet)
Age (years)0
0
2
4
6y
2 4 x4
6
7. Typing SpeedTyping Speed
Wo
rds
typ
ed
Time (minutes)0
0
50
100
150
y
2 4 x
(3, 165)
(1, 55)
8.
9. MODELING WITH MATHEMATICS Two newspapers
charge a fee for placing an advertisement in their
paper plus a fee based on the number of lines in the
advertisement. The table shows the total costs for
different length advertisements at the Daily Times.
The total cost y (in dollars) for an advertisement that
is x lines long at the Greenville Journal is represented
by the equation y = 2x + 20. Which newspaper
charges less per line? How many lines must be in an
advertisement for the total costs to be the same?
(See Example 2.)
Daily Times
Number of lines, x
Total cost, y
4 27
5 30
6 33
7 36
8 39
10. PROBLEM SOLVING While on vacation in Canada,
you notice that temperatures are reported in degrees
Celsius. You know there is a linear relationship
between Fahrenheit and Celsius, but you forget the
formula. From science class, you remember the
freezing point of water is 0°C or 32°F, and its boiling
point is 100°C or 212°F.
a. Write an equation that represents degrees
Fahrenheit in terms of degrees Celsius.
b. The temperature outside is 22°C. What is this
temperature in degrees Fahrenheit?
c. Rewrite your equation in part (a) to represent
degrees Celsius in terms of degrees Fahrenheit.
d. The temperature of the hotel pool water is 83°F.
What is this temperature in degrees Celsius?
Vocabulary and Core Concept Checkpppppp
Swimming PoolSwimming Pool
Vo
lum
e (c
ub
ic f
eet)
0
200
400
y
Time (hours)0 2 4 x
(3, 300)
(5, 180)
Int_Math3_PE_02.03.indd 60Int_Math3_PE_02.03.indd 60 1/30/15 2:05 PM1/30/15 2:05 PM

Section 2.3 Modeling with Linear Functions 61
ERROR ANALYSIS In Exercises 11 and 12, describe and correct the error in interpreting the slope in the context of the situation.
11. Savings AccountSavings Account
Bal
ance
(d
olla
rs)
0
110
130
150
y
Year60 2 4 x
(0, 100)
(4, 140)
The slope of the line is 10, so after 7 years, the balance is $70.
✗
12. EarningsEarnings
Inco
me
(do
llars
)
0
20
40
60
80
y
Hours60 2 4 x
(0, 0)
(3, 33)
The slope is 3, so the income is $3 per hour.
✗
In Exercises 13–16, determine whether the data show a linear relationship. If so, write an equation of a line of fi t. Estimate y when x = 15 and explain its meaning in the context of the situation. (See Example 3.)
13. Minutes walking, x 1 6 11 13 16
Calories burned, y 6 27 50 56 70
14. Months, x 9 13 18 22 23
Hair length (in.), y 3 5 7 10 11
15. Hours, x 3 7 9 17 20
Battery life (%), y 86 61 50 26 0
16. Shoe size, x 6 8 8.5 10 13
Heart rate (bpm), y 112 94 100 132 87
17. MODELING WITH MATHEMATICS The data
pairs (x, y) represent the average annual tuition
y (in dollars) for public colleges in the United States
x years after 2005. Use the linear regression feature
on a graphing calculator to fi nd an equation of the
line of best fi t. Estimate the average annual tuition
in 2020. Interpret the slope and y-intercept in this
situation. (See Example 4.)
(0, 11,386), (1, 11,731), (2, 11,848)
(3, 12,375), (4, 12,804), (5, 13,297)
18. MODELING WITH MATHEMATICS The table shows
the numbers of tickets sold for a concert when
different prices are charged. Write an equation of a
line of fi t for the data. Does it seem reasonable to use
your model to predict the number of tickets sold when
the ticket price is $85? Explain.
Ticket price (dollars), x
17 20 22 26
Tickets sold, y 450 423 400 395
USING TOOLS In Exercises 19–24, use the linear regression feature on a graphing calculator to fi nd an equation of the line of best fi t for the data. Find and interpret the correlation coeffi cient.
19.
x
y
4
2
0420 6
20.
x
y
4
2
0420 6
21.
x
y
4
2
0420 6
22.
x
y
4
2
0420 6
23.
x
y
4
2
0420 6
24.
x
y
4
2
0420 6
25. OPEN-ENDED Give two real-life quantities that have
(a) a positive correlation, (b) a negative correlation,
and (c) approximately no correlation. Explain.
Int_Math3_PE_02.03.indd 61Int_Math3_PE_02.03.indd 61 1/30/15 2:05 PM1/30/15 2:05 PM
62 Chapter 2 Linear and Quadratic Functions
Maintaining Mathematical ProficiencyMaintaining Mathematical ProficiencySolve the system of linear equations in two variables by elimination or substitution. (Skills Review Handbook)
33. 3x + y = 7 34. 4x + 3y = 2 35. 2x + 2y = 3
−2x − y = 9 2x − 3y = 1 x = 4y − 1
36. y = 1 + x 37. 1 — 2 x + 4y = 4 38. y = x − 4
2x + y = −2 2x − y = 1 4x + y = 26
Reviewing what you learned in previous grades and lessons
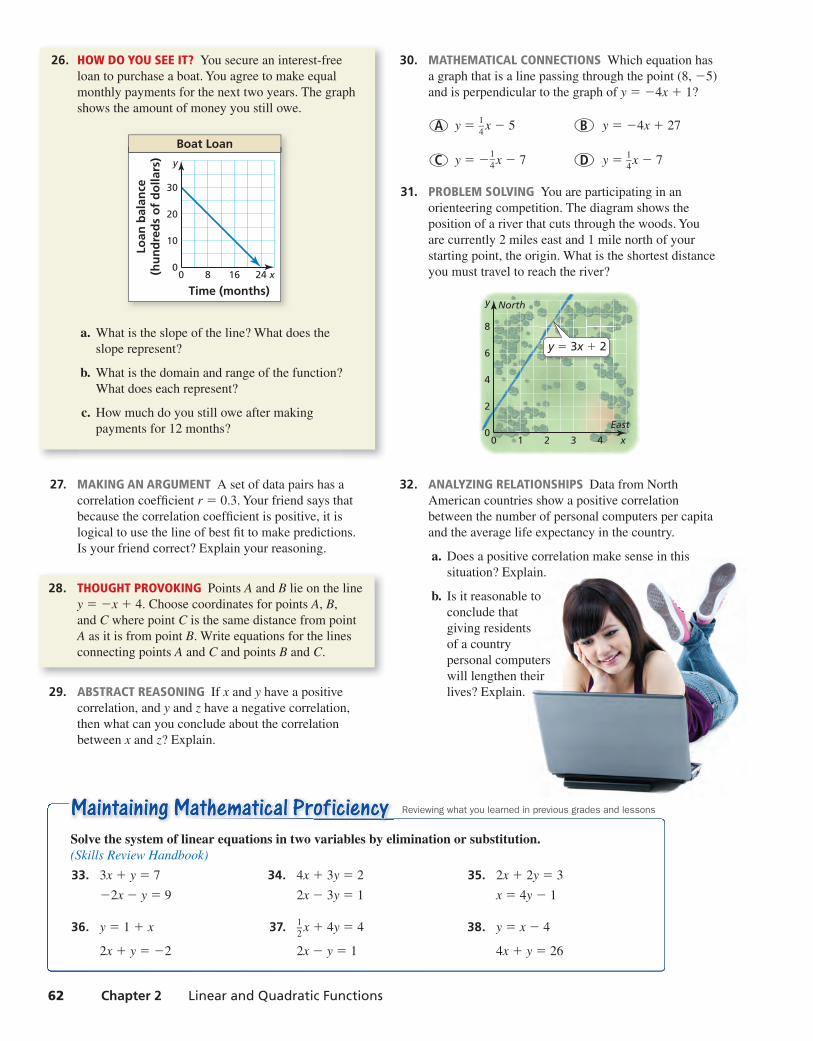
26. HOW DO YOU SEE IT? You secure an interest-free
loan to purchase a boat. You agree to make equal
monthly payments for the next two years. The graph
shows the amount of money you still owe.
Boat LoanBoat LoanLo
an b
alan
ce(h
un
dre
ds
of
do
llars
)
0
10
20
30
y
Time (months)24 x0 8 16
a. What is the slope of the line? What does the
slope represent?
b. What is the domain and range of the function?
What does each represent?
c. How much do you still owe after making
payments for 12 months?
27. MAKING AN ARGUMENT A set of data pairs has a
correlation coeffi cient r = 0.3. Your friend says that
because the correlation coeffi cient is positive, it is
logical to use the line of best fi t to make predictions.
Is your friend correct? Explain your reasoning.
28. THOUGHT PROVOKING Points A and B lie on the line
y = −x + 4. Choose coordinates for points A, B,
and C where point C is the same distance from point
A as it is from point B. Write equations for the lines
connecting points A and C and points B and C.
29. ABSTRACT REASONING If x and y have a positive
correlation, and y and z have a negative correlation,
then what can you conclude about the correlation
between x and z? Explain.
30. MATHEMATICAL CONNECTIONS Which equation has
a graph that is a line passing through the point (8, −5)
and is perpendicular to the graph of y = −4x + 1?
○A y = 1 —
4 x − 5 ○B y = −4x + 27
○C y = − 1 —
4 x − 7 ○D y =
1 —
4 x − 7
31. PROBLEM SOLVING You are participating in an
orienteering competition. The diagram shows the
position of a river that cuts through the woods. You
are currently 2 miles east and 1 mile north of your
starting point, the origin. What is the shortest distance
you must travel to reach the river?
East
North
4
2
0
8
y
6
210 4 x3
y = 3x + 2
32. ANALYZING RELATIONSHIPS Data from North
American countries show a positive correlation
between the number of personal computers per capita
and the average life expectancy in the country.
a. Does a positive correlation make sense in this
situation? Explain.
b. Is it reasonable to
conclude that
giving residents
of a country
personal computers
will lengthen their
lives? Explain.
Int_Math3_PE_02.03.indd 62Int_Math3_PE_02.03.indd 62 1/30/15 2:05 PM1/30/15 2:05 PM
Section 2.4 Solving Linear Systems 63
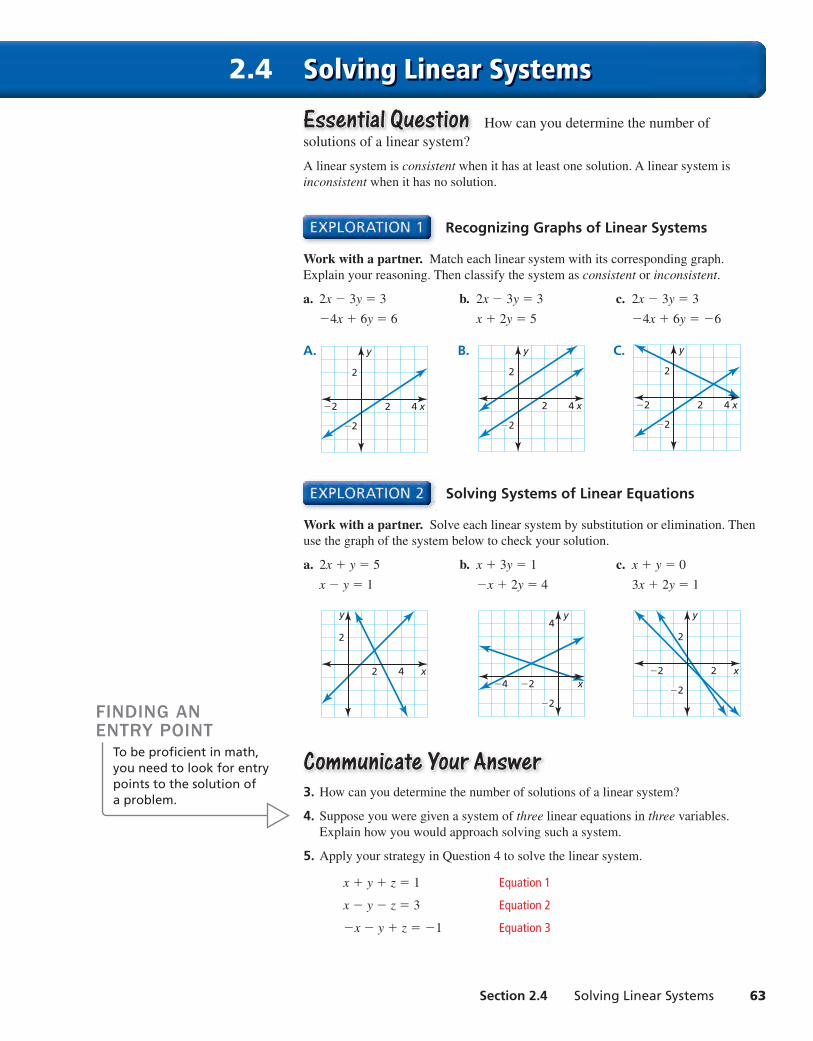
Solving Linear Systems2.4
Essential QuestionEssential Question How can you determine the number of
solutions of a linear system?
A linear system is consistent when it has at least one solution. A linear system is
inconsistent when it has no solution.
Recognizing Graphs of Linear Systems
Work with a partner. Match each linear system with its corresponding graph.
Explain your reasoning. Then classify the system as consistent or inconsistent.
a. 2x − 3y = 3 b. 2x − 3y = 3 c. 2x − 3y = 3
−4x + 6y = 6 x + 2y = 5 −4x + 6y = −6
A.
x
y
2
−2
42−2
B.
x
y
2
−2
42
C.
x
y
2
−2
42−2
Solving Systems of Linear Equations
Work with a partner. Solve each linear system by substitution or elimination. Then
use the graph of the system below to check your solution.
a. 2x + y = 5 b. x + 3y = 1 c. x + y = 0
x − y = 1 −x + 2y = 4 3x + 2y = 1
x
y
2
42x
y4
−2
−2−4x
y
2
−2
2−2
Communicate Your AnswerCommunicate Your Answer3. How can you determine the number of solutions of a linear system?
4. Suppose you were given a system of three linear equations in three variables.
Explain how you would approach solving such a system.
5. Apply your strategy in Question 4 to solve the linear system.
x + y + z = 1 Equation 1
x − y − z = 3 Equation 2
−x − y + z = −1 Equation 3
FINDING AN ENTRY POINT
To be profi cient in math, you need to look for entry points to the solution of a problem.
Int_Math3_PE_02.04.indd 63Int_Math3_PE_02.04.indd 63 1/30/15 2:08 PM1/30/15 2:08 PM

64 Chapter 2 Linear and Quadratic Functions
2.4 Lesson
linear equation in three variables, p. 64 system of three linear equations, p. 64 solution of a system of three linear equations, p. 64 ordered triple, p. 64
Previoussystem of two linear equations
Core VocabularyCore Vocabullarry
What You Will LearnWhat You Will Learn Visualize solutions of systems of linear equations in three variables.
Solve systems of linear equations in three variables algebraically.
Solve real-life problems.
Visualizing Solutions of SystemsA linear equation in three variables x, y, and z is an equation of the form
ax + by + cz = d, where a, b, and c are not all zero.
The following is an example of a system of three linear equations in
three variables.
3x + 4y − 8z = −3 Equation 1
x + y + 5z = −12 Equation 2
4x − 2y + z = 10 Equation 3
A solution of such a system is an ordered triple (x, y, z) whose coordinates make
each equation true.
The graph of a linear equation in three variables is a plane in three-dimensional
space. The graphs of three such equations that form a system are three planes whose
intersection determines the number of solutions of the system, as shown in the
diagrams below.
Exactly One SolutionThe planes intersect in a single point,
which is the solution of the system.
Infi nitely Many SolutionsThe planes intersect in a line. Every
point on the line is a solution of the system.
The planes could also be the same plane.
Every point in the plane is a solution
of the system.
No SolutionThere are no points in common with all three planes.
Int_Math3_PE_02.04.indd 64Int_Math3_PE_02.04.indd 64 1/30/15 2:08 PM1/30/15 2:08 PM
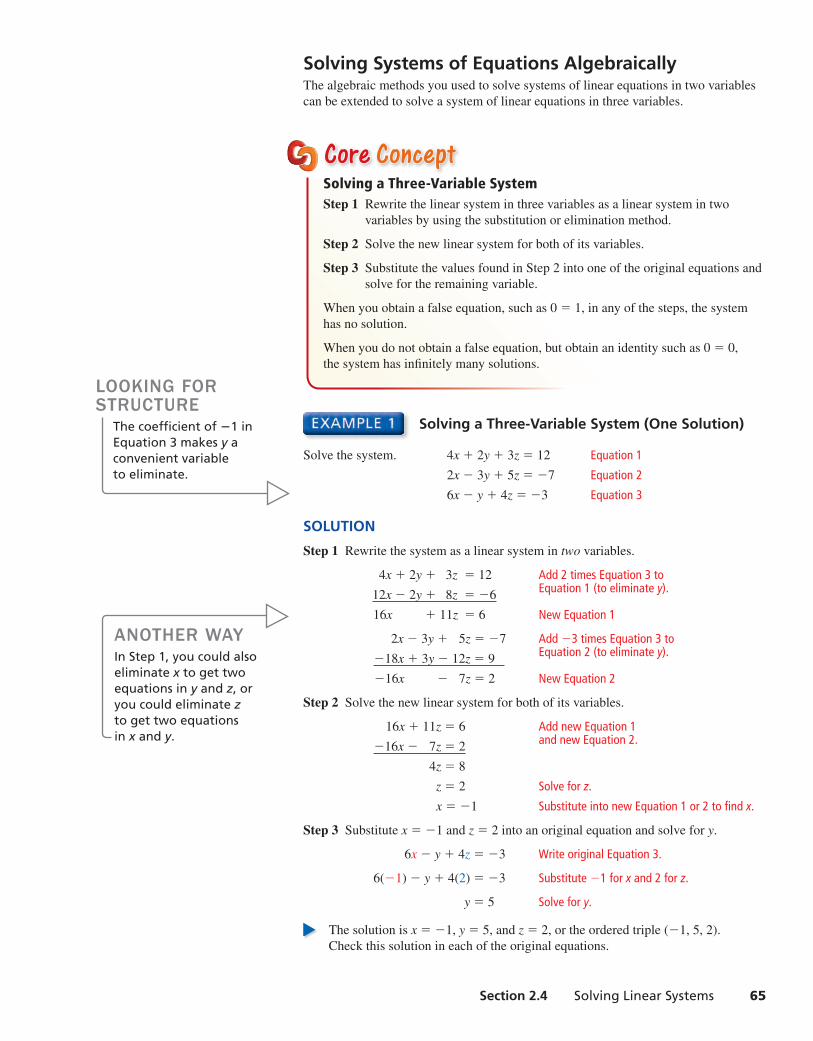
Section 2.4 Solving Linear Systems 65
Solving Systems of Equations AlgebraicallyThe algebraic methods you used to solve systems of linear equations in two variables
can be extended to solve a system of linear equations in three variables.
Solving a Three-Variable System (One Solution)
Solve the system. 4x + 2y + 3z = 12 Equation 1
2x − 3y + 5z = −7 Equation 2
6x − y + 4z = −3 Equation 3
SOLUTION
Step 1 Rewrite the system as a linear system in two variables.
4x + 2y + 3z = 12 Add 2 times Equation 3 to
12x − 2y + 8z = −6 Equation 1 (to eliminate y).
16x + 11z = 6 New Equation 1
2x − 3y + 5z = −7 Add −3 times Equation 3 to
−18x + 3y − 12z = 9 Equation 2 (to eliminate y).
−16x − 7z = 2 New Equation 2
Step 2 Solve the new linear system for both of its variables.
16x + 11z = 6 Add new Equation 1
−16x − 7z = 2 and new Equation 2.
4z = 8
z = 2 Solve for z.
x = −1 Substitute into new Equation 1 or 2 to fi nd x.
Step 3 Substitute x = −1 and z = 2 into an original equation and solve for y.
6x − y + 4z = −3 Write original Equation 3.
6(−1) − y + 4(2) = −3 Substitute −1 for x and 2 for z.
y = 5 Solve for y.
The solution is x = −1, y = 5, and z = 2, or the ordered triple (−1, 5, 2).
Check this solution in each of the original equations.
LOOKING FOR STRUCTURE
The coeffi cient of −1 in Equation 3 makes y a convenient variable to eliminate.
ANOTHER WAYIn Step 1, you could also eliminate x to get two equations in y and z, or you could eliminate z to get two equations in x and y.
Core Core ConceptConceptSolving a Three-Variable SystemStep 1 Rewrite the linear system in three variables as a linear system in two
variables by using the substitution or elimination method.
Step 2 Solve the new linear system for both of its variables.
Step 3 Substitute the values found in Step 2 into one of the original equations and
solve for the remaining variable.
When you obtain a false equation, such as 0 = 1, in any of the steps, the system
has no solution.
When you do not obtain a false equation, but obtain an identity such as 0 = 0,
the system has infi nitely many solutions.
Int_Math3_PE_02.04.indd 65Int_Math3_PE_02.04.indd 65 1/30/15 2:08 PM1/30/15 2:08 PM
66 Chapter 2 Linear and Quadratic Functions
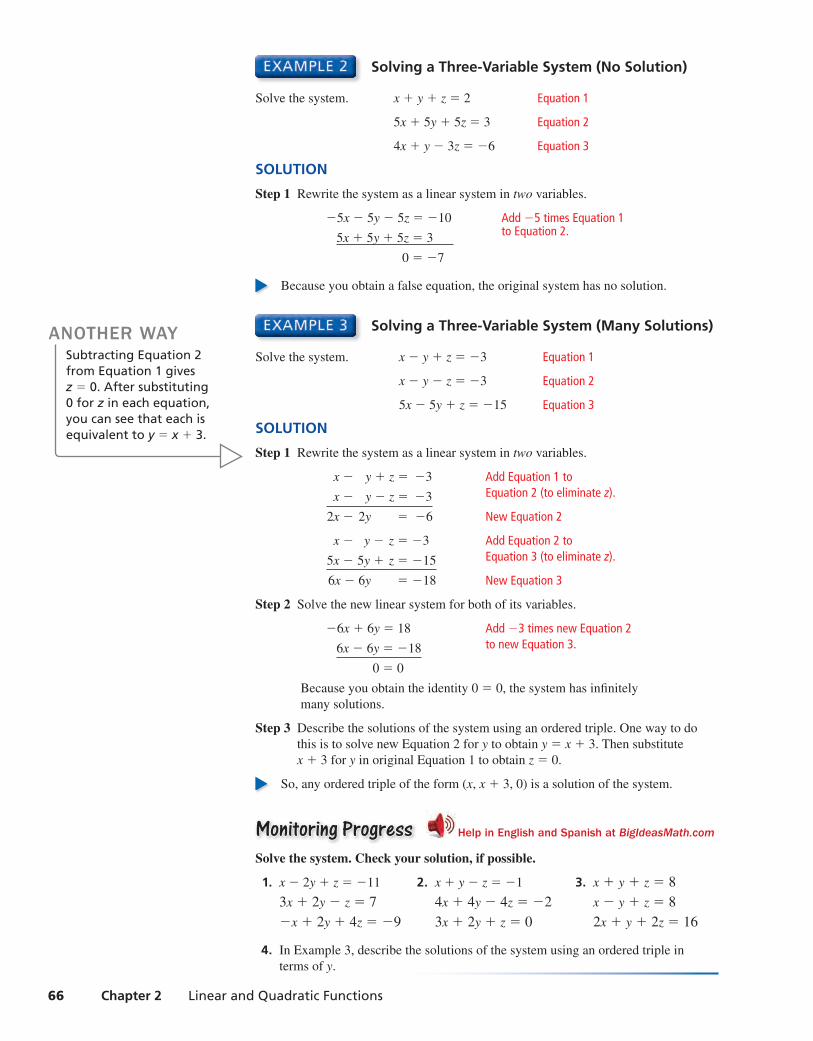
Solving a Three-Variable System (No Solution)
Solve the system. x + y + z = 2 Equation 1
5x + 5y + 5z = 3 Equation 2
4x + y − 3z = −6 Equation 3
SOLUTION
Step 1 Rewrite the system as a linear system in two variables.
−5x − 5y − 5z = −10 Add −5 times Equation 1
5x + 5y + 5z = 3 to Equation 2.
0 = −7
Because you obtain a false equation, the original system has no solution.
Solving a Three-Variable System (Many Solutions)
Solve the system. x − y + z = −3 Equation 1
x − y − z = −3 Equation 2
5x − 5y + z = −15 Equation 3
SOLUTION
Step 1 Rewrite the system as a linear system in two variables.
x − y + z = −3 Add Equation 1 to
x − y − z = −3 Equation 2 (to eliminate z).
2x − 2y = −6 New Equation 2
x − y − z = −3 Add Equation 2 to
5x − 5y + z = −15 Equation 3 (to eliminate z).
6x − 6y = −18 New Equation 3
Step 2 Solve the new linear system for both of its variables.
−6x + 6y = 18 Add −3 times new Equation 2
6x − 6y = −18 to new Equation 3.
0 = 0
Because you obtain the identity 0 = 0, the system has infi nitely
many solutions.
Step 3 Describe the solutions of the system using an ordered triple. One way to do
this is to solve new Equation 2 for y to obtain y = x + 3. Then substitute
x + 3 for y in original Equation 1 to obtain z = 0.
So, any ordered triple of the form (x, x + 3, 0) is a solution of the system.
Monitoring ProgressMonitoring Progress Help in English and Spanish at BigIdeasMath.com
Solve the system. Check your solution, if possible.
1. x − 2y + z = −11 2. x + y − z = −1 3. x + y + z = 8
3x + 2y − z = 7 4x + 4y − 4z = −2 x − y + z = 8
−x + 2y + 4z = −9 3x + 2y + z = 0 2x + y + 2z = 16
4. In Example 3, describe the solutions of the system using an ordered triple in
terms of y.
ANOTHER WAYSubtracting Equation 2 from Equation 1 gives z = 0. After substituting 0 for z in each equation, you can see that each is equivalent to y = x + 3.
Int_Math3_PE_02.04.indd 66Int_Math3_PE_02.04.indd 66 1/30/15 2:08 PM1/30/15 2:08 PM

Section 2.4 Solving Linear Systems 67
Solving Real-Life Problems
Solving a Multi-Step Problem
An amphitheater charges $75 for each seat in Section A, $55 for each seat in
Section B, and $30 for each lawn seat. There are three times as many seats in
Section B as in Section A. The revenue from selling all 23,000 seats is $870,000.
How many seats are in each section of the amphitheater?
SOLUTION
Step 1 Write a verbal model for the situation.
Number of
seats in B, y = 3 ⋅
Number of
seats in A, x
Number of
seats in A, x + Number of
seats in B, y +
Number of
lawn seats, z = Total number
of seats
75 ⋅ Number of
seats in A, x + 55 ⋅
Number of
seats in B, y + 30 ⋅
Number of
lawn seats, z =
Total
revenue
Step 2 Write a system of equations.
y = 3x Equation 1
x + y + z = 23,000 Equation 2
75x + 55y + 30z = 870,000 Equation 3
Step 3 Rewrite the system in Step 2 as a linear system in two variables by substituting
3x for y in Equations 2 and 3.
x + y + z = 23,000 Write Equation 2.
x + 3x + z = 23,000 Substitute 3x for y.
4x + z = 23,000 New Equation 2
75x + 55y + 30z = 870,000 Write Equation 3.
75x + 55(3x) + 30z = 870,000 Substitute 3x for y.
240x + 30z = 870,000 New Equation 3
Step 4 Solve the new linear system for both of its variables.
−120x − 30z = −690,000 Add −30 times new Equation 2
240x + 30z = 870,000 to new Equation 3.
120x = 180,000
x = 1500 Solve for x.
y = 4500 Substitute into Equation 1 to fi nd y.
z = 17,000 Substitute into Equation 2 to fi nd z.
The solution is x = 1500, y = 4500, and z = 17,000, or (1500, 4500, 17,000). So,
there are 1500 seats in Section A, 4500 seats in Section B, and 17,000 lawn seats.
Monitoring ProgressMonitoring Progress Help in English and Spanish at BigIdeasMath.com
5. WHAT IF? On the fi rst day, 10,000 tickets sold, generating $356,000 in revenue.
The number of seats sold in Sections A and B are the same. How many lawn seats
are still available?
STUDY TIPWhen substituting to fi nd values of other variables, choose original or new equations that are easiest to use.
STAGE
A AAB
BBBB
LAWN
Int_Math3_PE_02.04.indd 67Int_Math3_PE_02.04.indd 67 1/30/15 2:08 PM1/30/15 2:08 PM
68 Chapter 2 Linear and Quadratic Functions
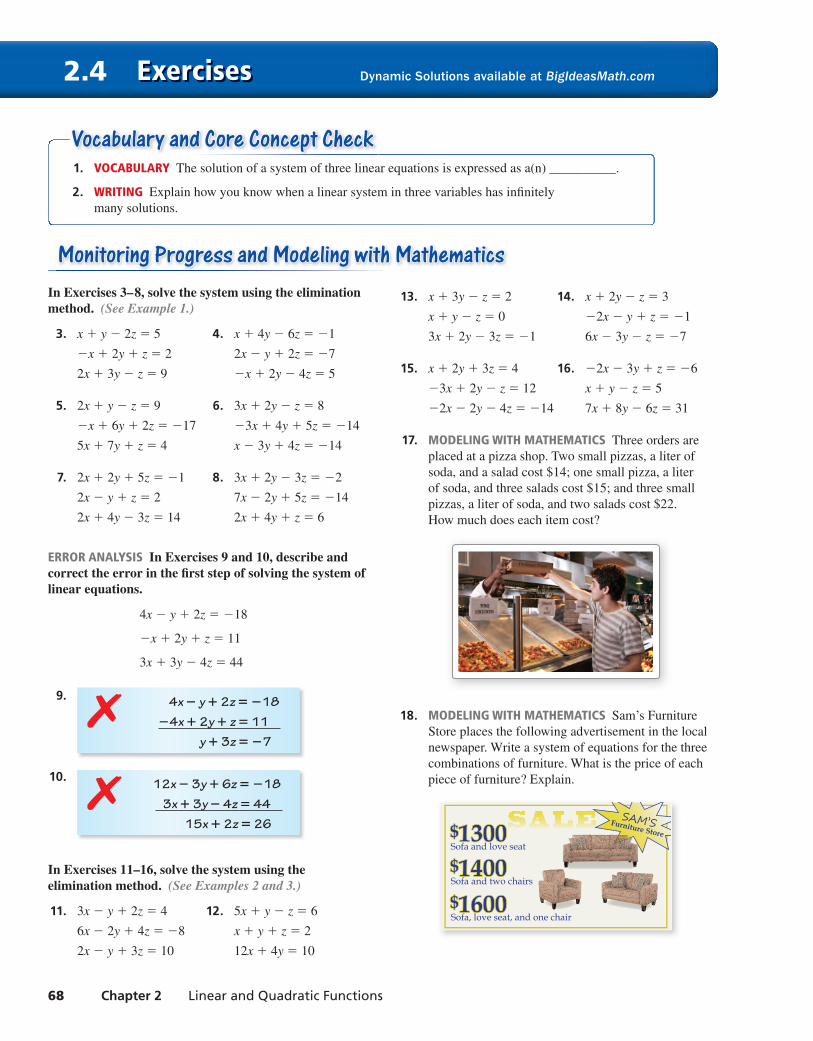
Exercises2.4 Dynamic Solutions available at BigIdeasMath.com
In Exercises 3–8, solve the system using the elimination method. (See Example 1.)
3. x + y − 2z = 5 4. x + 4y − 6z = −1
−x + 2y + z = 2 2x − y + 2z = −7
2x + 3y − z = 9 −x + 2y − 4z = 5
5. 2x + y − z = 9 6. 3x + 2y − z = 8
−x + 6y + 2z = −17 −3x + 4y + 5z = −14
5x + 7y + z = 4 x − 3y + 4z = −14
7. 2x + 2y + 5z = −1 8. 3x + 2y − 3z = −2
2x − y + z = 2 7x − 2y + 5z = −14
2x + 4y − 3z = 14 2x + 4y + z = 6
ERROR ANALYSIS In Exercises 9 and 10, describe and correct the error in the fi rst step of solving the system of linear equations.
4x − y + 2z = −18
−x + 2y + z = 11
3x + 3y − 4z = 44
9. 4x − y + 2z = −18−4x + 2y + z = 11
y + 3z = −7
✗
10. 12x − 3y + 6z = −18 3x + 3y − 4z = 44
15x + 2z = 26
✗
In Exercises 11–16, solve the system using the elimination method. (See Examples 2 and 3.)
11. 3x − y + 2z = 4 12. 5x + y − z = 6
6x − 2y + 4z = −8 x + y + z = 2
2x − y + 3z = 10 12x + 4y = 10
13. x + 3y − z = 2 14. x + 2y − z = 3
x + y − z = 0 −2x − y + z = −1
3x + 2y − 3z = −1 6x − 3y − z = −7
15. x + 2y + 3z = 4 16. −2x − 3y + z = −6
−3x + 2y − z = 12 x + y − z = 5
−2x − 2y − 4z = −14 7x + 8y − 6z = 31
17. MODELING WITH MATHEMATICS Three orders are
placed at a pizza shop. Two small pizzas, a liter of
soda, and a salad cost $14; one small pizza, a liter
of soda, and three salads cost $15; and three small
pizzas, a liter of soda, and two salads cost $22.
How much does each item cost?
18. MODELING WITH MATHEMATICS Sam’s Furniture
Store places the following advertisement in the local
newspaper. Write a system of equations for the three
combinations of furniture. What is the price of each
piece of furniture? Explain.
Sofa and love seat
Sofa and two chairs
Sofa, love seat, and one chair
SAM’SFurniture Store
Monitoring Progress and Modeling with MathematicsMonitoring Progress and Modeling with Mathematics
1. VOCABULARY The solution of a system of three linear equations is expressed as a(n) __________.
2. WRITING Explain how you know when a linear system in three variables has infi nitely
many solutions.
Vocabulary and Core Concept CheckVocabulary and Core Concept Check
Int_Math3_PE_02.04.indd 68Int_Math3_PE_02.04.indd 68 1/30/15 2:08 PM1/30/15 2:08 PM

Section 2.4 Solving Linear Systems 69
In Exercises 19–28, solve the system of linear equations using the substitution method. (See Example 4.)
19. −2x + y + 6z = 1 20. x − 6y − 2z = −8
3x + 2y + 5z = 16 −x + 5y + 3z = 2
7x + 3y − 4z = 11 3x − 2y − 4z = 18
21. x + y + z = 4 22. x + 2y = −1
5x + 5y + 5z = 12 −x + 3y + 2z = −4
x − 4y + z = 9 −x + y − 4z = 10
23. 2x − 3y + z = 10 24. x = 4
y + 2z = 13 x + y = −6
z = 5 4x − 3y + 2z = 26
25. x + y − z = 4 26. 2x − y − z = 15
3x + 2y + 4z = 17 4x + 5y + 2z = 10
−x + 5y + z = 8 −x − 4y + 3z = −20
27. 4x + y + 5z = 5 28. x + 2y − z = 3
8x + 2y + 10z = 10 2x + 4y − 2z = 6
x − y − 2z = −2 −x − 2y + z = −6
29. PROBLEM SOLVING The number of left-handed
people in the world is one-tenth the number of right-
handed people. The percent of right-handed people
is nine times the percent of left-handed people and
ambidextrous people combined. What percent of
people are ambidextrous?
30. MODELING WITH MATHEMATICS Use a system of
linear equations to model the data in the following
newspaper article. Solve the system to fi nd how many
athletes fi nished in each place.
Lawrence High prevailed in Saturday’s track meet with the help of 20 individual-event placers earning a combined 68 points. A first-place finish earns 5 points, a second-place finish earns 3 points, and a third-place finish earns 1 point. Lawrence had a strong second-place showing, with as many second place finishers as first- and third-place finishers combined.
31. WRITING Explain when it might be more convenient
to use the elimination method than the substitution
method to solve a linear system. Give an example to
support your claim.
32. REPEATED REASONING Using what you know about
solving linear systems in two and three variables, plan
a strategy for how you would solve a system that has
four linear equations in four variables.
MATHEMATICAL CONNECTIONS In Exercises 33 and 34, write and use a linear system to answer the question.
33. The triangle has a perimeter of 65 feet. What are the
lengths of sidesℓ, m, and n?
m
n = + m − 15= m1
3
34. What are the measures of angles A, B, and C?
(5A − C)°
A°
(A + B)°
A
B C
35. OPEN-ENDED Consider the system of linear
equations below. Choose nonzero values for a, b,
and c so the system satisfi es the given condition.
Explain your reasoning.
x + y + z = 2
ax + by + cz = 10
x − 2y + z = 4
a. The system has no solution.
b. The system has exactly one solution.
c. The system has infi nitely many solutions.
36. MAKING AN ARGUMENT A linear system in three
variables has no solution. Your friend concludes that it
is not possible for two of the three equations to have
any points in common. Is your friend correct? Explain
your reasoning.
Int_Math3_PE_02.04.indd 69Int_Math3_PE_02.04.indd 69 1/30/15 2:08 PM1/30/15 2:08 PM
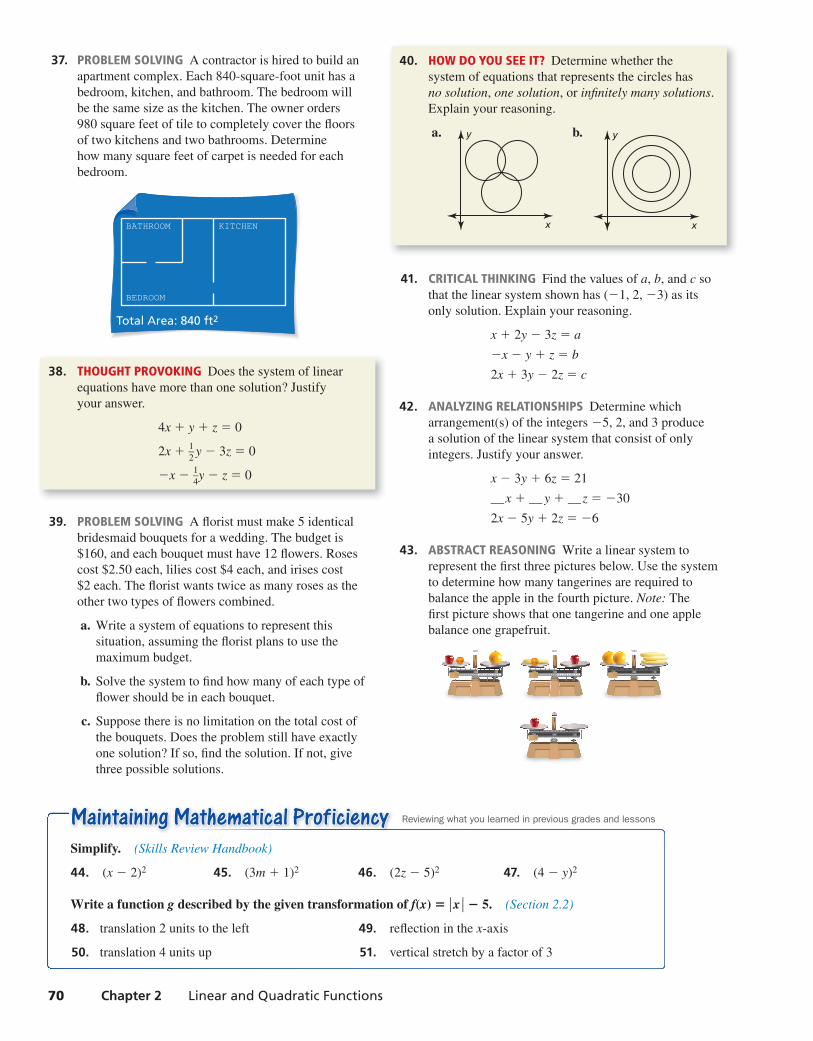
70 Chapter 2 Linear and Quadratic Functions
Maintaining Mathematical ProficiencyMaintaining Mathematical ProficiencySimplify. (Skills Review Handbook)
44. (x − 2)2 45. (3m + 1)2 46. (2z − 5)2 47. (4 − y)2
Write a function g described by the given transformation of f(x) = ∣ x ∣ − 5. (Section 2.2)
48. translation 2 units to the left 49. refl ection in the x-axis
50. translation 4 units up 51. vertical stretch by a factor of 3
Reviewing what you learned in previous grades and lessons
37. PROBLEM SOLVING A contractor is hired to build an
apartment complex. Each 840-square-foot unit has a
bedroom, kitchen, and bathroom. The bedroom will
be the same size as the kitchen. The owner orders
980 square feet of tile to completely cover the fl oors
of two kitchens and two bathrooms. Determine
how many square feet of carpet is needed for each
bedroom.
Total Area: 840 ft2
BEDROOM
BATHROOM KITCHEN
38. THOUGHT PROVOKING Does the system of linear
equations have more than one solution? Justify
your answer.
4x + y + z = 0
2x + 1 —
2 y − 3z = 0
−x − 1 —
4 y − z = 0
39. PROBLEM SOLVING A fl orist must make 5 identical
bridesmaid bouquets for a wedding. The budget is
$160, and each bouquet must have 12 fl owers. Roses
cost $2.50 each, lilies cost $4 each, and irises cost
$2 each. The fl orist wants twice as many roses as the
other two types of fl owers combined.
a. Write a system of equations to represent this
situation, assuming the fl orist plans to use the
maximum budget.
b. Solve the system to fi nd how many of each type of
fl ower should be in each bouquet.
c. Suppose there is no limitation on the total cost of
the bouquets. Does the problem still have exactly
one solution? If so, fi nd the solution. If not, give
three possible solutions.
40. HOW DO YOU SEE IT? Determine whether the
system of equations that represents the circles has
no solution, one solution, or infi nitely many solutions.
Explain your reasoning.
a.
x
y b.
x
y
41. CRITICAL THINKING Find the values of a, b, and c so
that the linear system shown has (−1, 2, −3) as its
only solution. Explain your reasoning.
x + 2y − 3z = a
−x − y + z = b
2x + 3y − 2z = c
42. ANALYZING RELATIONSHIPS Determine which
arrangement(s) of the integers −5, 2, and 3 produce
a solution of the linear system that consist of only
integers. Justify your answer.
x − 3y + 6z = 21
__x + __ y + __z = −30
2x − 5y + 2z = −6
43. ABSTRACT REASONING Write a linear system to
represent the fi rst three pictures below. Use the system
to determine how many tangerines are required to
balance the apple in the fourth picture. Note: The
fi rst picture shows that one tangerine and one apple
balance one grapefruit.
0 10 20 30 40 50 60 70 80 90 100 110 120 130 140 150 160 170 180 190 2000 120 130 140 150 160 170 180 190 200 0 10 20 30 40 50 60 70 80 90 100 110 120 130 140 150 160 170 180 190 2000 120 130 140 150 160 170 180 190 200 0 10 20 30 40 50 60 70 80 90 100 110 120 130 140 150 160 170 180 190 200
0 10 20 30 40 50 60 70 80 90 100 110 120 130 140 150 160 170 180 190 200
Int_Math3_PE_02.04.indd 70Int_Math3_PE_02.04.indd 70 1/30/15 2:09 PM1/30/15 2:09 PM
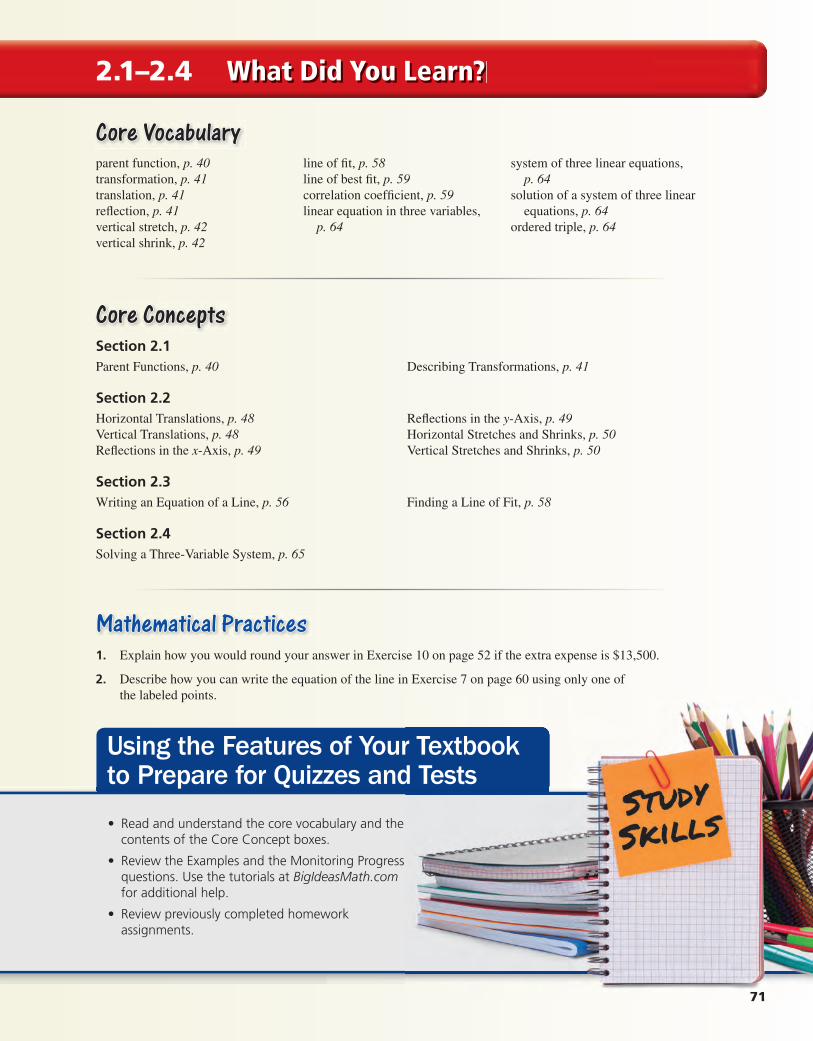
71
2.1–2.4 What Did You Learn?
Core VocabularyCore Vocabularyparent function, p. 40transformation, p. 41translation, p. 41refl ection, p. 41vertical stretch, p. 42vertical shrink, p. 42
line of fi t, p. 58line of best fi t, p. 59correlation coeffi cient, p. 59linear equation in three variables, p. 64
system of three linear equations, p. 64
solution of a system of three linear
equations, p. 64ordered triple, p. 64
Core ConceptsCore ConceptsSection 2.1Parent Functions, p. 40 Describing Transformations, p. 41
Section 2.2Horizontal Translations, p. 48Vertical Translations, p. 48Refl ections in the x-Axis, p. 49
Refl ections in the y-Axis, p. 49Horizontal Stretches and Shrinks, p. 50Vertical Stretches and Shrinks, p. 50
Section 2.3Writing an Equation of a Line, p. 56 Finding a Line of Fit, p. 58
Section 2.4Solving a Three-Variable System, p. 65
Mathematical PracticesMathematical Practices1. Explain how you would round your answer in Exercise 10 on page 52 if the extra expense is $13,500.
2. Describe how you can write the equation of the line in Exercise 7 on page 60 using only one of
the labeled points.
771111111
• Read and understand the core vocabulary and the contents of the Core Concept boxes.
• Review the Examples and the Monitoring Progress questions. Use the tutorials at BigIdeasMath.com for additional help.
• Review previously completed homework assignments.
Using the Features of Your Textbookto Prepare for Quizzes and Tests
Int_Math3_PE_02.MC.indd 71Int_Math3_PE_02.MC.indd 71 1/30/15 2:12 PM1/30/15 2:12 PM
72 Chapter 2 Linear and Quadratic Functions
2.1–2.4 Quiz
Identify the function family to which g belongs. Compare the graph of the function to the graph of its parent function. (Section 2.1)
1.
x
y
2
−2
4−2
g(x) = x − 113
2.
x
y
8
12
4
2−2−4
g(x) = 2(x + 1)2
3.
x
y4
2
2−4
g(x) = �x + 1� − 2
Graph the function and its parent function. Then describe the transformation(s). (Section 2.1)
4. f(x) = 3x 5. f(x) = − ∣ x + 2 ∣ − 7 6. f(x) = 1 —
4 x2 + 1
Write a function g whose graph represents the indicated transformation(s) of the graph of f. (Section 2.2)
7. f(x) = 2x + 1; translation 3 units up 8. f(x) = −3 ∣ x − 4 ∣ ; vertical shrink by a factor of 1 —
2
9. f (x) = ∣ x ∣ ; refl ection in the x-axis and a vertical stretch by a factor of 4 followed by a
translation 7 units down and 1 unit right
10. The total cost of an annual pass plus camping for x days in a National Park can be
modeled by the function f(x) = 20x + 80. Senior citizens pay half of this price and
receive an additional $30 discount. Describe how to transform the graph of f to model
the total cost for a senior citizen. What is the total cost for a senior citizen to go camping
for three days? (Section 2.2)
Write an equation of the line and interpret the slope and y-intercept. (Section 2.3)
11. Bank AccountBank Account
Bal
ance
(d
olla
rs)
0
200
400
600
800
y
Weeks0 2 4 x
(2, 400)
(3, 600)
12. Shoe Sales
Pric
e o
f p
air
of
sho
es (
do
llars
)
0
10
20
30
40
50y
Percent discount600 20 40 80 x
20 units
(0, 50)
10 units
13. A bakery sells doughnuts, muffi ns, and bagels. The bakery makes
three times as many doughnuts as bagels. The bakery earns a total
of $150 when all 130 baked items in stock are sold. How many of
each item are in stock? Justify your answer. (Section 2.4)Doughnuts............ $1.00Muffins ................ $1.50Bagels .................... $1.20
Int_Math3_PE_02.MC.indd 72Int_Math3_PE_02.MC.indd 72 1/30/15 2:12 PM1/30/15 2:12 PM

Section 2.5 Transformations of Quadratic Functions 73
Essential QuestionEssential Question How do the constants a, h, and k affect the
graph of the quadratic function g(x) = a(x − h)2 + k?
The parent function of the quadratic family is f(x) = x2. A transformation of the
graph of the parent function is represented by the function g(x) = a(x − h)2 + k,
where a ≠ 0.
Identifying Graphs of Quadratic Functions
Work with a partner. Match each quadratic function with its graph. Explain your
reasoning. Then use a graphing calculator to verify that your answer is correct.
a. g(x) = −(x − 2)2 b. g(x) = (x − 2)2 + 2 c. g(x) = −(x + 2)2 − 2
d. g(x) = 0.5(x − 2)2 − 2 e. g(x) = 2(x − 2)2 f. g(x) = −(x + 2)2 + 2
A.
6
−4
−6
4 B.
6
−4
−6
4
C.
6
−4
−6
4 D.
6
−4
−6
4
E.
6
−4
−6
4 F.
6
−4
−6
4
Communicate Your AnswerCommunicate Your Answer 2. How do the constants a, h, and k affect the graph of
the quadratic function g(x) = a(x − h)2 + k?
3. Write the equation of the quadratic function whose
graph is shown at the right. Explain your reasoning.
Then use a graphing calculator to verify that your
equation is correct.
LOOKING FOR STRUCTURE
To be profi cient in math, you need to look closely to discern a pattern or structure.
6
−4
−6
4
2.5 Transformations of Quadratic Functions
Int_Math3_PE_02.05.indd 73Int_Math3_PE_02.05.indd 73 1/30/15 2:09 PM1/30/15 2:09 PM
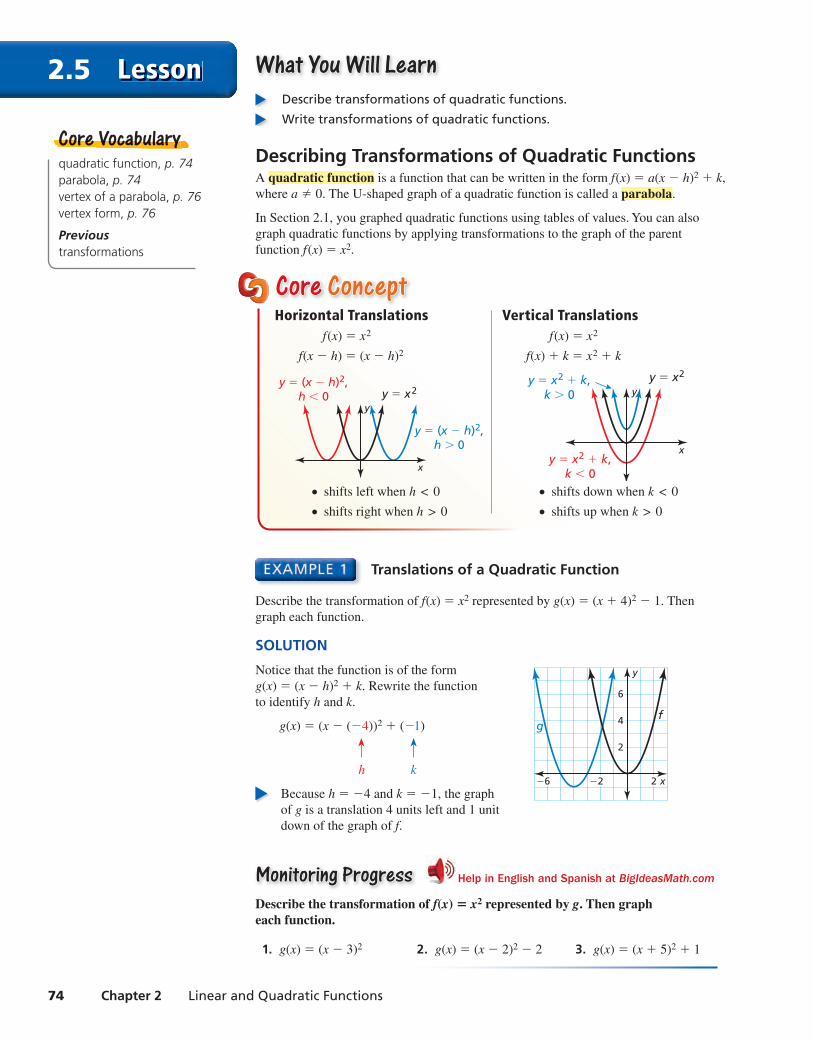
74 Chapter 2 Linear and Quadratic Functions
2.5 Lesson What You Will LearnWhat You Will Learn Describe transformations of quadratic functions.
Write transformations of quadratic functions.
Describing Transformations of Quadratic FunctionsA quadratic function is a function that can be written in the form f(x) = a(x − h)2 + k,
where a ≠ 0. The U-shaped graph of a quadratic function is called a parabola.
In Section 2.1, you graphed quadratic functions using tables of values. You can also
graph quadratic functions by applying transformations to the graph of the parent
function f(x) = x2.
quadratic function, p. 74 parabola, p. 74 vertex of a parabola, p. 76 vertex form, p. 76
Previoustransformations
Core VocabularyCore Vocabullarry
Core Core ConceptConceptHorizontal Translations f(x) = x2
f(x − h) = (x − h)2
y
y = (x − h)2,h < 0
y = (x − h)2,h > 0
y = x2
x
● shifts left when h < 0
● shifts right when h > 0
Vertical Translations f(x) = x2
f(x) + k = x2 + k
y
y = x2 + k,k < 0
y = x2 + k,k > 0
y = x2
x
● shifts down when k < 0
● shifts up when k > 0
Translations of a Quadratic Function
Describe the transformation of f(x) = x2 represented by g(x) = (x + 4)2 − 1. Then
graph each function.
SOLUTION
Notice that the function is of the form
x
y
4
6
2
−2 2−6
gf
g(x) = (x − h)2 + k. Rewrite the function
to identify h and k.
g(x) = (x − (−4))2 + (−1)
h k
Because h = −4 and k = −1, the graph
of g is a translation 4 units left and 1 unit
down of the graph of f.
Monitoring ProgressMonitoring Progress Help in English and Spanish at BigIdeasMath.com
Describe the transformation of f(x) = x2 represented by g. Then graph each function.
1. g(x) = (x − 3)2 2. g(x) = (x − 2)2 − 2 3. g(x) = (x + 5)2 + 1
Int_Math3_PE_02.05.indd 74Int_Math3_PE_02.05.indd 74 1/30/15 2:09 PM1/30/15 2:09 PM
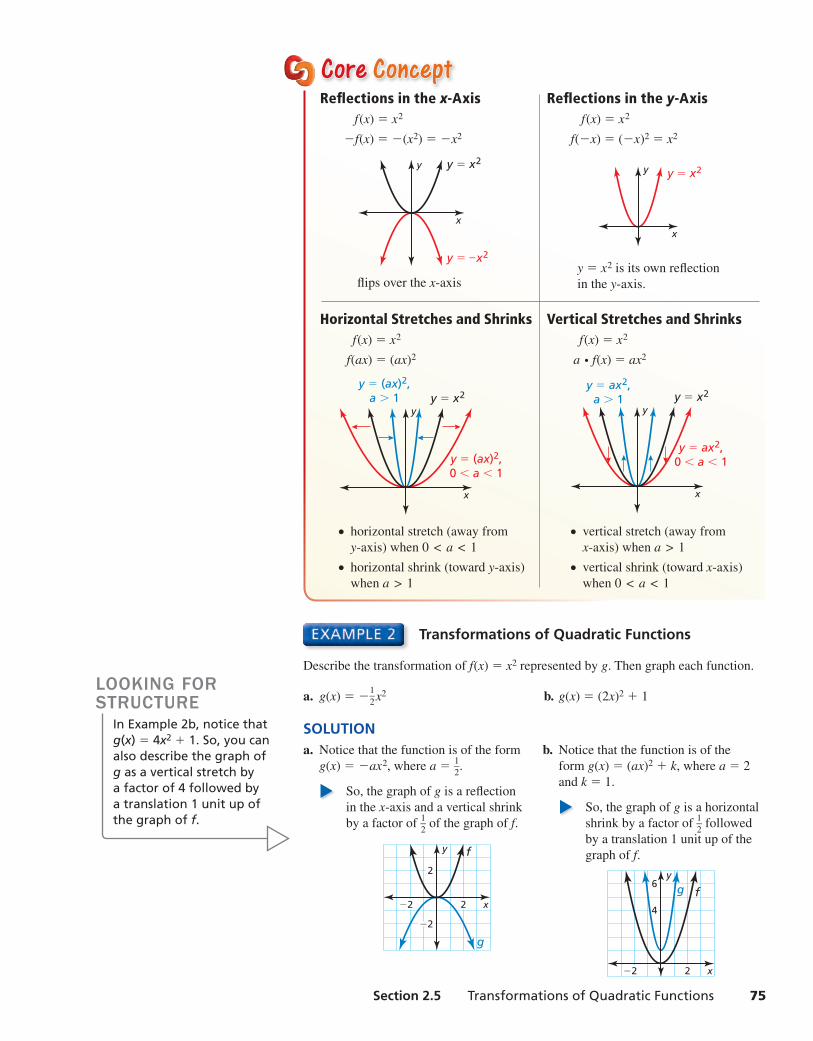
Section 2.5 Transformations of Quadratic Functions 75
Core Core ConceptConceptRefl ections in the x-Axis f(x) = x2
−f(x) = −(x2) = −x2
x
y y = x2
y = –x2
fl ips over the x-axis
Horizontal Stretches and Shrinks f(x) = x2
f(ax) = (ax)2
x
yy = x2
y = (ax)2,0 < a < 1
y = (ax)2,a > 1
● horizontal stretch (away from
y-axis) when 0 < a < 1
● horizontal shrink (toward y-axis)
when a > 1
Refl ections in the y-Axis f(x) = x2
f(−x) = (−x)2 = x2
x
y y = x2
y = x2 is its own refl ection
in the y-axis.
Vertical Stretches and Shrinks f(x) = x2
a ⋅ f(x) = ax2
x
yy = x2
y = ax2,0 < a < 1
y = ax2,a > 1
● vertical stretch (away from
x-axis) when a > 1
● vertical shrink (toward x-axis)
when 0 < a < 1
Transformations of Quadratic Functions
Describe the transformation of f(x) = x2 represented by g. Then graph each function.
a. g(x) = − 1 —
2 x2 b. g(x) = (2x)2 + 1
SOLUTIONa. Notice that the function is of the form
g(x) = −ax2, where a = 1 —
2 .
So, the graph of g is a refl ection
in the x-axis and a vertical shrink
by a factor of 1 —
2 of the graph of f.
x
y f
g
2
−2
2−2
b. Notice that the function is of the
form g(x) = (ax)2 + k, where a = 2
and k = 1.
So, the graph of g is a horizontal
shrink by a factor of 1 —
2 followed
by a translation 1 unit up of the
graph of f.
x
y
fg
4
6
2−2
LOOKING FOR STRUCTURE
In Example 2b, notice that g(x) = 4x2 + 1. So, you can also describe the graph of g as a vertical stretch by a factor of 4 followed by a translation 1 unit up of the graph of f.
Int_Math3_PE_02.05.indd 75Int_Math3_PE_02.05.indd 75 1/30/15 2:09 PM1/30/15 2:09 PM
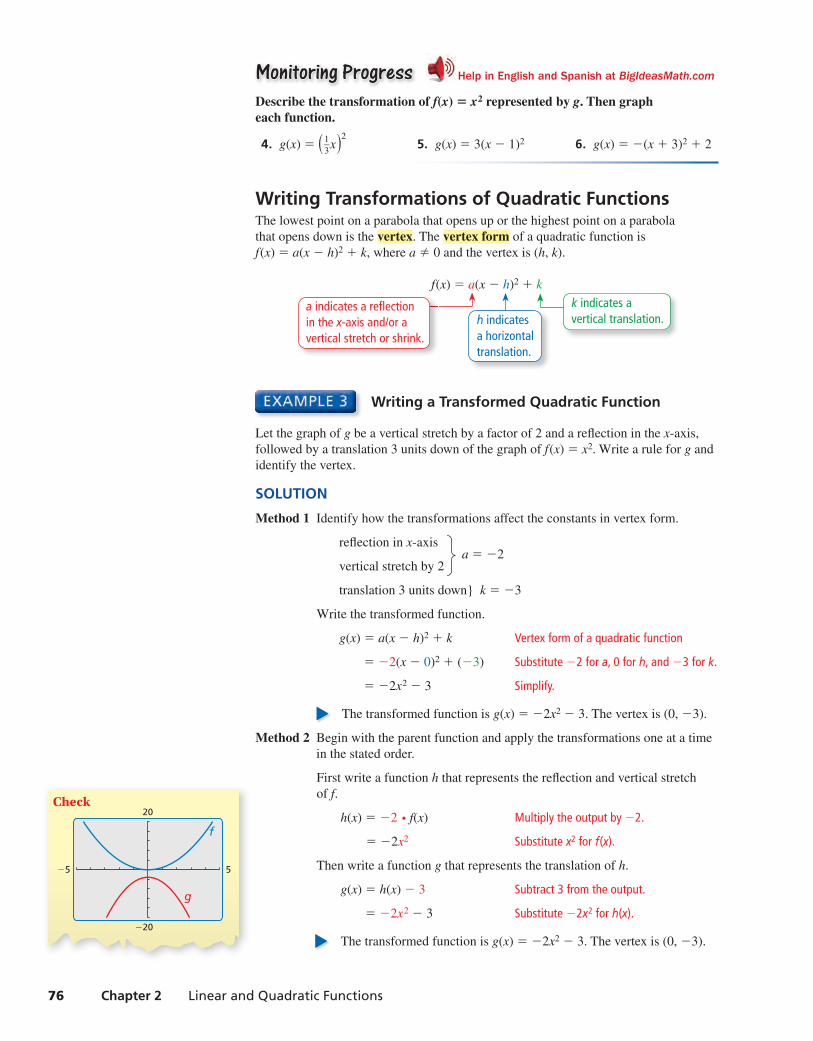
76 Chapter 2 Linear and Quadratic Functions
Monitoring ProgressMonitoring Progress Help in English and Spanish at BigIdeasMath.com
Describe the transformation of f(x) = x2 represented by g. Then graph each function.
4. g(x) = ( 1 — 3 x )
2 5. g(x) = 3(x − 1)2 6. g(x) = −(x + 3)2 + 2
Writing Transformations of Quadratic FunctionsThe lowest point on a parabola that opens up or the highest point on a parabola
that opens down is the vertex. The vertex form of a quadratic function is
f(x) = a(x − h)2 + k, where a ≠ 0 and the vertex is (h, k).
f(x) = a(x − h)2 + k
k indicates a vertical translation.
a indicates a reflection in the x-axis and/or a vertical stretch or shrink.
h indicates a horizontal translation.
Writing a Transformed Quadratic Function
Let the graph of g be a vertical stretch by a factor of 2 and a refl ection in the x-axis,
followed by a translation 3 units down of the graph of f(x) = x2. Write a rule for g and
identify the vertex.
SOLUTION
Method 1 Identify how the transformations affect the constants in vertex form.
refl ection in x-axis a = −2
vertical stretch by 2
translation 3 units down} k = −3
Write the transformed function.
g(x) = a(x − h)2 + k Vertex form of a quadratic function
= −2(x − 0)2 + (−3) Substitute −2 for a, 0 for h, and −3 for k.
= −2x2 − 3 Simplify.
The transformed function is g(x) = −2x2 − 3. The vertex is (0, −3).
Method 2 Begin with the parent function and apply the transformations one at a time
in the stated order.
First write a function h that represents the refl ection and vertical stretch
of f.
h(x) = −2 ⋅ f(x) Multiply the output by −2.
= −2x2 Substitute x2 for f(x).
Then write a function g that represents the translation of h.
g(x) = h(x) − 3 Subtract 3 from the output.
= −2x2 − 3 Substitute −2x2 for h(x).
The transformed function is g(x) = −2x2 − 3. The vertex is (0, −3).
Check
5
−20
−5
20
g
f
Int_Math3_PE_02.05.indd 76Int_Math3_PE_02.05.indd 76 1/30/15 2:09 PM1/30/15 2:09 PM

Section 2.5 Transformations of Quadratic Functions 77
Writing a Transformed Quadratic Function
Let the graph of g be a translation 3 units right and 2 units up, followed by a refl ection
in the y-axis of the graph of f(x) = x2 − 5x. Write a rule for g.
SOLUTION
Step 1 First write a function h that represents the translation of f.
h(x) = f(x − 3) + 2 Subtract 3 from the input. Add 2 to the output.
= (x − 3)2 − 5(x − 3) + 2 Replace x with x − 3 in f(x).
= x2 − 11x + 26 Simplify.
Step 2 Then write a function g that represents the refl ection of h.
g(x) = h(−x) Multiply the input by −1.
= (−x)2 − 11(−x) + 26 Replace x with −x in h(x).
= x2 + 11x + 26 Simplify.
Modeling with Mathematics
The height h (in feet) of water spraying from a fi re hose can be modeled by
h(x) = −0.03x2 + x + 25, where x is the horizontal distance (in feet) from the fi re
truck. The crew raises the ladder so that the water hits the ground 10 feet farther from
the fi re truck. Write a function that models the new path of the water.
SOLUTION
1. Understand the Problem You are given a function that represents the path of
water spraying from a fi re hose. You are asked to write a function that represents
the path of the water after the crew raises the ladder.
2. Make a Plan Analyze the graph of the function to determine the translation of the
ladder that causes water to travel 10 feet farther. Then write the function.
3. Solve the Problem Use a graphing calculator to graph the original function.
Because h(50) = 0, the water originally hits the ground 50 feet from the fi re
truck. The range of the function in this context does not include negative values.
However, by observing that h(60) = −23, you can determine that a translation
23 units (feet) up causes the water to travel 10 feet farther from the fi re truck.
g(x) = h(x) + 23 Add 23 to the output.
= −0.03x2 + x + 48 Substitute for h(x) and simplify.
The new path of the water can be modeled by g(x) = −0.03x2 + x + 48.
4. Look Back To check that your solution is correct, verify that g(60) = 0.
g(60) = −0.03(60)2 + 60 + 48 = −108 + 60 + 48 = 0 ✓
Monitoring ProgressMonitoring Progress Help in English and Spanish at BigIdeasMath.com
7. Let the graph of g be a vertical shrink by a factor of 1 —
2 followed by a translation
2 units up of the graph of f(x) = x2. Write a rule for g and identify the vertex.
8. Let the graph of g be a translation 4 units left followed by a horizontal shrink by a
factor of 1 —
3 of the graph of f(x) = x2 + x. Write a rule for g.
9. WHAT IF? In Example 5, the water hits the ground 10 feet closer to the fi re truck
after lowering the ladder. Write a function that models the new path of the water.
REMEMBERTo multiply two binomials, use the FOIL Method.
First Inner
(x + 1)(x + 2) = x2 + 2x + x + 2
Outer Last
X=50 Y=0
80
−30
0
60
y = −0.03x2 + x + 25
Int_Math3_PE_02.05.indd 77Int_Math3_PE_02.05.indd 77 1/30/15 2:09 PM1/30/15 2:09 PM
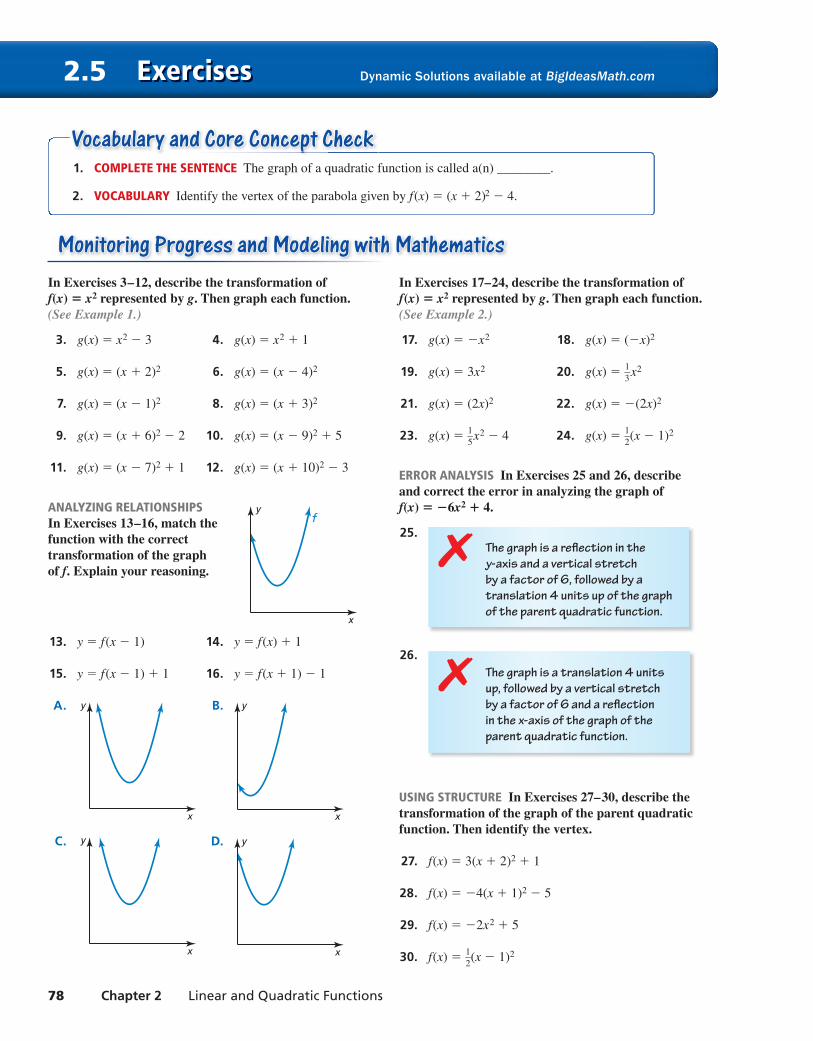
78 Chapter 2 Linear and Quadratic Functions
Exercises2.5 Dynamic Solutions available at BigIdeasMath.com
Monitoring Progress and Modeling with MathematicsMonitoring Progress and Modeling with MathematicsIn Exercises 3–12, describe the transformation of f(x) = x2 represented by g. Then graph each function. (See Example 1.)
3. g(x) = x2 − 3 4. g(x) = x2 + 1
5. g(x) = (x + 2)2 6. g(x) = (x − 4)2
7. g(x) = (x − 1)2 8. g(x) = (x + 3)2
9. g(x) = (x + 6)2 − 2 10. g(x) = (x − 9)2 + 5
11. g(x) = (x − 7)2 + 1 12. g(x) = (x + 10)2 − 3
ANALYZING RELATIONSHIPS In Exercises 13–16, match the function with the correct transformation of the graph of f. Explain your reasoning.
13. y = f(x − 1) 14. y = f(x) + 1
15. y = f(x − 1) + 1 16. y = f(x + 1) − 1
A.
x
y B.
x
y
C.
x
y D.
x
y
In Exercises 17–24, describe the transformation of f(x) = x2 represented by g. Then graph each function. (See Example 2.)
17. g(x) = −x2 18. g(x) = (−x)2
19. g(x) = 3x2 20. g(x) = 1 —
3 x2
21. g(x) = (2x)2 22. g(x) = −(2x)2
23. g(x) = 1 —
5 x2 − 4 24. g(x) =
1 —
2 (x − 1)2
ERROR ANALYSIS In Exercises 25 and 26, describe and correct the error in analyzing the graph of f(x) = −6x2 + 4.
25. The graph is a refl ection in the
y-axis and a vertical stretch
by a factor of 6, followed by a
translation 4 units up of the graph
of the parent quadratic function.
✗
26. The graph is a translation 4 units
up, followed by a vertical stretch
by a factor of 6 and a refl ection
in the x-axis of the graph of the
parent quadratic function.
✗
USING STRUCTURE In Exercises 27–30, describe the transformation of the graph of the parent quadratic function. Then identify the vertex.
27. f(x) = 3(x + 2)2 + 1
28. f(x) = −4(x + 1)2 − 5
29. f(x) = −2x2 + 5
30. f(x) = 1 —
2 (x − 1)2
1. COMPLETE THE SENTENCE The graph of a quadratic function is called a(n) ________.
2. VOCABULARY Identify the vertex of the parabola given by f(x) = (x + 2)2 − 4.
Vocabulary and Core Concept Checkpppppppp
x
yf
Int_Math3_PE_02.05.indd 78Int_Math3_PE_02.05.indd 78 1/30/15 2:09 PM1/30/15 2:09 PM
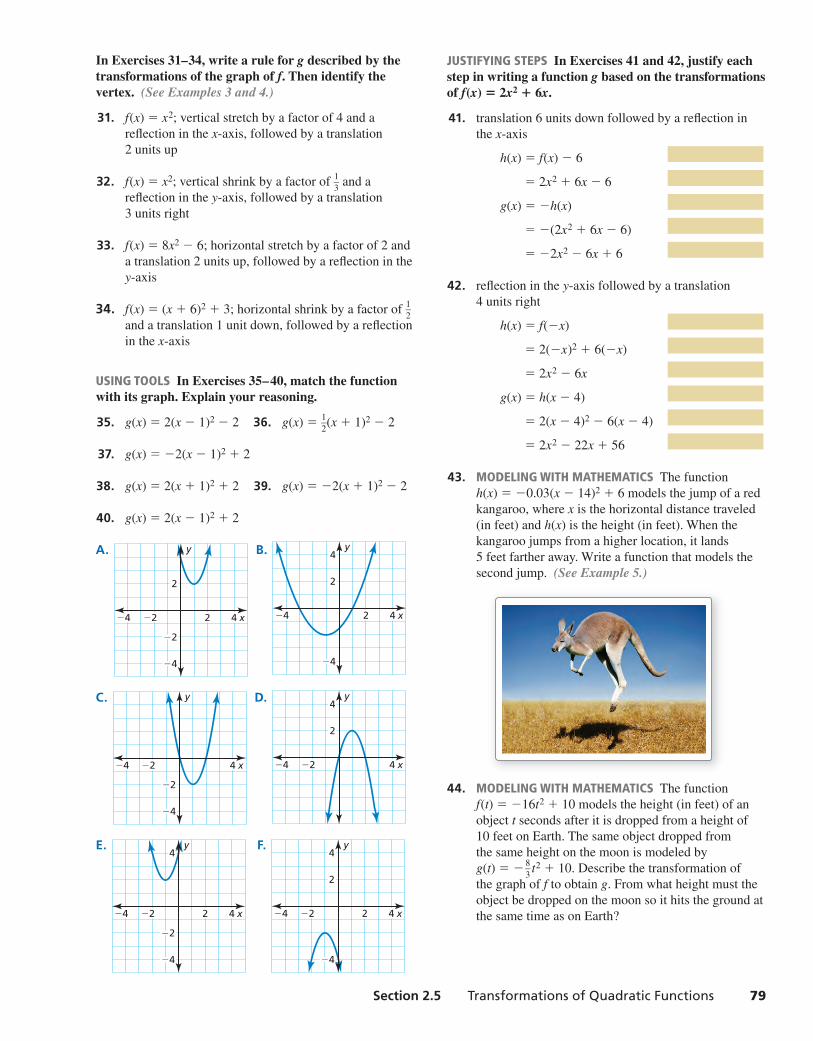
Section 2.5 Transformations of Quadratic Functions 79
In Exercises 31–34, write a rule for g described by the transformations of the graph of f. Then identify the vertex. (See Examples 3 and 4.)
31. f(x) = x2; vertical stretch by a factor of 4 and a
refl ection in the x-axis, followed by a translation
2 units up
32. f(x) = x2; vertical shrink by a factor of 1 —
3 and a
refl ection in the y-axis, followed by a translation
3 units right
33. f(x) = 8x2 − 6; horizontal stretch by a factor of 2 and
a translation 2 units up, followed by a refl ection in the
y-axis
34. f(x) = (x + 6)2 + 3; horizontal shrink by a factor of 1 —
2
and a translation 1 unit down, followed by a refl ection
in the x-axis
USING TOOLS In Exercises 35–40, match the function with its graph. Explain your reasoning.
35. g(x) = 2(x − 1)2 − 2 36. g(x) = 1 —
2 (x + 1)2 − 2
37. g(x) = −2(x − 1)2 + 2
38. g(x) = 2(x + 1)2 + 2 39. g(x) = −2(x + 1)2 − 2
40. g(x) = 2(x − 1)2 + 2
A.
x
y
2
−4
−2
42−2−4
B.
x
y4
2
−4
42−4
C.
x
y
−2
−4
4−2−4
D.
x
y4
2
4−2−4
E.
x
y4
−4
−2
42−2−4
F.
x
y4
2
−4
42−2−4
JUSTIFYING STEPS In Exercises 41 and 42, justify eachstep in writing a function g based on the transformationsof f(x) = 2x2 + 6x.
41. translation 6 units down followed by a refl ection in
the x-axis
h(x) = f(x) − 6
= 2x2 + 6x − 6
g(x) = −h(x)
= −(2x2 + 6x − 6)
= −2x2 − 6x + 6
42. refl ection in the y-axis followed by a translation
4 units right
h(x) = f(−x)
= 2(−x)2 + 6(−x)
= 2x2 − 6x
g(x) = h(x − 4)
= 2(x − 4)2 − 6(x − 4)
= 2x2 − 22x + 56
43. MODELING WITH MATHEMATICS The function
h(x) = −0.03(x − 14)2 + 6 models the jump of a red
kangaroo, where x is the horizontal distance traveled
(in feet) and h(x) is the height (in feet). When the
kangaroo jumps from a higher location, it lands
5 feet farther away. Write a function that models the
second jump. (See Example 5.)
44. MODELING WITH MATHEMATICS The function
f(t) = −16t2 + 10 models the height (in feet) of an
object t seconds after it is dropped from a height of
10 feet on Earth. The same object dropped from
the same height on the moon is modeled by
g(t) = − 8 —
3 t2 + 10. Describe the transformation of
the graph of f to obtain g. From what height must the
object be dropped on the moon so it hits the ground at
the same time as on Earth?
Int_Math3_PE_02.05.indd 79Int_Math3_PE_02.05.indd 79 1/30/15 2:09 PM1/30/15 2:09 PM
80 Chapter 2 Linear and Quadratic Functions
Maintaining Mathematical ProficiencyMaintaining Mathematical ProficiencyA line of symmetry for the fi gure is shown in red. Find the coordinates of point A. (Skills Review Handbook)
50.
x
y
(–4, 3)
A
y = 1
51.
x
y
(0, 4) A
x = 2
52.
x
y
(2, –2)
Ay = x
Reviewing what you learned in previous grades and lessons
45. MODELING WITH MATHEMATICS Flying fi sh use
their pectoral fi ns like airplane wings to glide through
the air.
a. Write an equation of the form y = a(x − h)2 + kwith vertex (33, 5) that models the fl ight path,
assuming the fi sh leaves the water at (0, 0).
b. What are the domain and range of the function?
What do they represent in this situation?
c. Does the value of a change when the fl ight path
has vertex (30, 4)? Justify your answer.
46. HOW DO YOU SEE IT? Describe the graph of g as a
transformation of the graph of f(x) = x2.
x
f
g y
4
6
2
−2
2−4−6
47. COMPARING METHODS Let the graph of g be a
translation 3 units up and 1 unit right followed by
a vertical stretch by a factor of 2 of the graph of
f(x) = x2.
a. Identify the values of a, h, and k and use vertex
form to write the transformed function.
b. Use function notation to write the transformed
function. Compare this function with your
function in part (a).
c. Suppose the vertical stretch was performed fi rst,
followed by the translations. Repeat parts (a)
and (b).
d. Which method do you prefer when writing a
transformed function? Explain.
48. THOUGHT PROVOKING A jump on a pogo stick
with a conventional spring can be modeled by
f(x) = −0.5(x − 6)2 + 18, where x is the horizontal
distance (in inches) and f(x) is the vertical distance
(in inches). Write at least one transformation of
the function and provide a possible reason for
your transformation.
49. MATHEMATICAL CONNECTIONS The area of a circle
depends on the radius, as shown in the graph. A
circular earring with a radius of r millimeters has a
circular hole with a radius of 3r
— 4 millimeters. Describe
a transformation of the graph below that models the
area of the blue portion of the earring.
Circle
Are
a (s
qu
are
un
its)
Radius (units)r
A
20
10
0
30
210 43
A = r2π
Int_Math3_PE_02.05.indd 80Int_Math3_PE_02.05.indd 80 1/30/15 2:09 PM1/30/15 2:09 PM

Section 2.6 Characteristics of Quadratic Functions 81
Essential QuestionEssential Question What type of symmetry does the graph of
f(x) = a(x − h)2 + k have and how can you describe this symmetry?
Parabolas and Symmetry
Work with a partner.
a. Complete the table. Then use the values
in the table to sketch the graph of the
function
f(x) = 1 —
2 x2 − 2x − 2
on graph paper.
b. Use the results in part (a) to identify the
vertex of the parabola.
c. Find a vertical line on your graph paper so
that when you fold the paper, the left portion of
the graph coincides with the right portion of
the graph. What is the equation of this line?
How does it relate to the vertex?
d. Show that the vertex form
f(x) = 1 —
2 (x − 2)2 − 4
is equivalent to the function given in part (a).
ATTENDING TO PRECISION
To be profi cient in math, youneed to use clear defi nitions in your reasoning and discussions with others.
Parabolas and Symmetry
Work with a partner. Repeat Exploration 1 for the function given by
f(x) = −1—3x2 + 2x + 3 = −1—
3 (x − 3)2 + 6.
Communicate Your AnswerCommunicate Your Answer 3. What type of symmetry does the graph of f(x) = a(x − h)2 + k have and how can
you describe this symmetry?
4. Describe the symmetry of each graph. Then use a graphing calculator to verify
your answer.
a. f(x) = −(x − 1)2 + 4 b. f(x) = (x + 1)2 − 2 c. f(x) = 2(x − 3)2 + 1
d. f(x) = 1—2 (x + 2)2 e. f(x) = −2x2 + 3 f. f(x) = 3(x − 5)2 + 2
x
y
4
6
2
−4
−6
−2
4 62−2−4−6
x −2 −1 0 1 2
f(x)
x
46
2
y
4
6
2
−4
−6
−2
−2−4−6
x 3 4 5 6
f(x)
2.6 Characteristics of Quadratic Functions
Int_Math3_PE_02.06.indd 81Int_Math3_PE_02.06.indd 81 1/30/15 2:10 PM1/30/15 2:10 PM
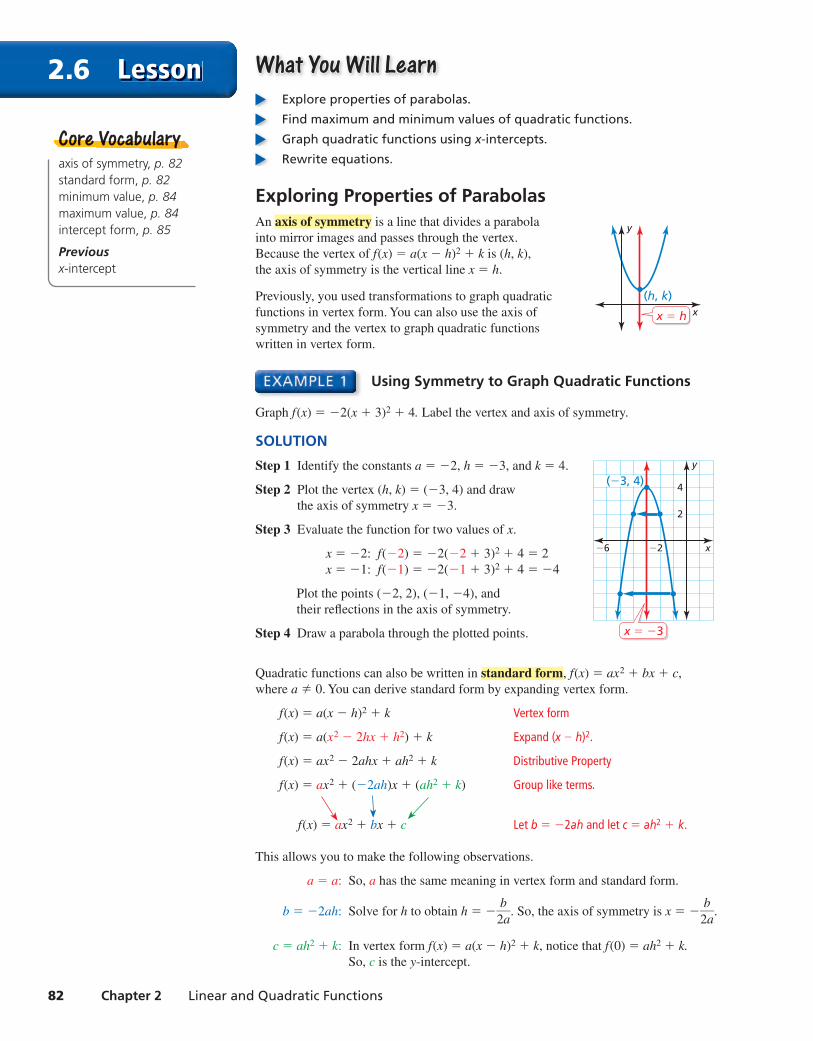
82 Chapter 2 Linear and Quadratic Functions
2.6 Lesson What You Will LearnWhat You Will Learn Explore properties of parabolas.
Find maximum and minimum values of quadratic functions.
Graph quadratic functions using x-intercepts.
Rewrite equations.
Exploring Properties of ParabolasAn axis of symmetry is a line that divides a parabola
into mirror images and passes through the vertex.
Because the vertex of f(x) = a(x − h)2 + k is (h, k),
the axis of symmetry is the vertical line x = h.
Previously, you used transformations to graph quadratic
functions in vertex form. You can also use the axis of
symmetry and the vertex to graph quadratic functions
written in vertex form.
axis of symmetry, p. 82 standard form, p. 82minimum value, p. 84 maximum value, p. 84 intercept form, p. 85
Previousx-intercept
Core VocabularyCore Vocabullarry
Using Symmetry to Graph Quadratic Functions
Graph f(x) = −2(x + 3)2 + 4. Label the vertex and axis of symmetry.
SOLUTION
Step 1 Identify the constants a = −2, h = −3, and k = 4.
Step 2 Plot the vertex (h, k) = (−3, 4) and draw
the axis of symmetry x = −3.
Step 3 Evaluate the function for two values of x.
x = −2: f(−2) = −2(−2 + 3)2 + 4 = 2
x = −1: f(−1) = −2(−1 + 3)2 + 4 = −4
Plot the points (−2, 2), (−1, −4), and
their refl ections in the axis of symmetry.
Step 4 Draw a parabola through the plotted points.
Quadratic functions can also be written in standard form, f(x) = ax2 + bx + c,
where a ≠ 0. You can derive standard form by expanding vertex form.
f(x) = a(x − h)2 + k Vertex form
f(x) = a(x2 − 2hx + h2) + k Expand (x − h)2.
f(x) = ax2 − 2ahx + ah2 + k Distributive Property
f(x) = ax2 + (−2ah)x + (ah2 + k) Group like terms.
f(x) = ax2 + bx + c Let b = −2ah and let c = ah2 + k.
This allows you to make the following observations.
a = a: So, a has the same meaning in vertex form and standard form.
b = −2ah: Solve for h to obtain h = − b —
2a . So, the axis of symmetry is x = −
b —
2a .
c = ah2 + k: In vertex form f(x) = a(x − h)2 + k, notice that f(0) = ah2 + k. So, c is the y-intercept.
x
y
(h, k)
x = h
x
y
4
2
−2
(−3, 4)
−6
x = −3
Int_Math3_PE_02.06.indd 82Int_Math3_PE_02.06.indd 82 1/30/15 2:10 PM1/30/15 2:10 PM
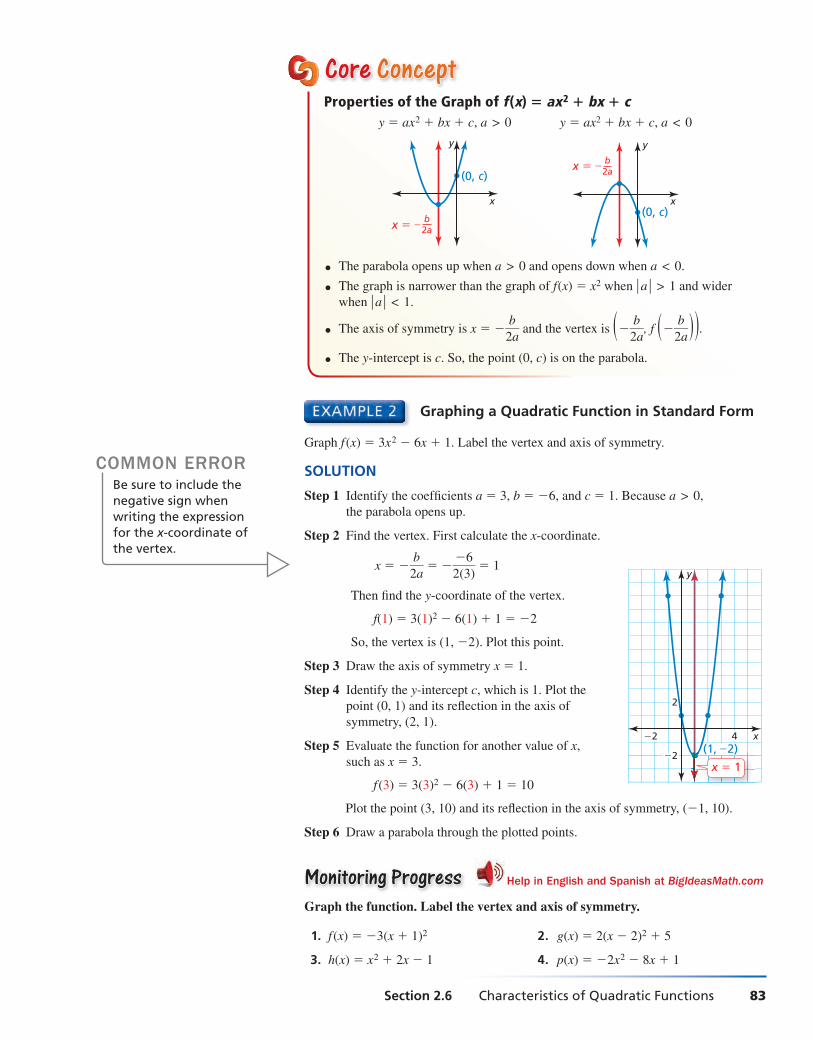
Section 2.6 Characteristics of Quadratic Functions 83
Core Core ConceptConceptProperties of the Graph of f(x) = ax2 + bx + c y = ax2 + bx + c, a > 0 y = ax2 + bx + c, a < 0
x
y
x = –
(0, c)
b2a
x
y
(0, c)
x = – b2a
● The parabola opens up when a > 0 and opens down when a < 0.
● The graph is narrower than the graph of f(x) = x2 when ∣ a ∣ > 1 and wider
when ∣ a ∣ < 1.
● The axis of symmetry is x = − b —
2a and the vertex is ( −
b —
2a , f ( −
b —
2a ) ) .
● The y-intercept is c. So, the point (0, c) is on the parabola.
Graphing a Quadratic Function in Standard Form
Graph f (x) = 3x2 − 6x + 1. Label the vertex and axis of symmetry.
SOLUTION
Step 1 Identify the coeffi cients a = 3, b = −6, and c = 1. Because a > 0,
the parabola opens up.
Step 2 Find the vertex. First calculate the x-coordinate.
x = − b —
2a = −
−6 —
2(3) = 1
Then fi nd the y-coordinate of the vertex.
f(1) = 3(1)2 − 6(1) + 1 = −2
So, the vertex is (1, −2). Plot this point.
Step 3 Draw the axis of symmetry x = 1.
Step 4 Identify the y-intercept c, which is 1. Plot the
point (0, 1) and its refl ection in the axis of
symmetry, (2, 1).
Step 5 Evaluate the function for another value of x,
such as x = 3.
f (3) = 3(3)2 − 6(3) + 1 = 10
Plot the point (3, 10) and its refl ection in the axis of symmetry, (−1, 10).
Step 6 Draw a parabola through the plotted points.
Monitoring ProgressMonitoring Progress Help in English and Spanish at BigIdeasMath.com
Graph the function. Label the vertex and axis of symmetry.
1. f (x) = −3(x + 1)2 2. g(x) = 2(x − 2)2 + 5
3. h(x) = x2 + 2x − 1 4. p(x) = −2x2 − 8x + 1
COMMON ERRORBe sure to include the negative sign when writing the expression for the x-coordinate of the vertex.
x
y
2
−2
4(1, –2)
−2( , )
x = 1
Int_Math3_PE_02.06.indd 83Int_Math3_PE_02.06.indd 83 1/30/15 2:10 PM1/30/15 2:10 PM

84 Chapter 2 Linear and Quadratic Functions
Finding Maximum and Minimum ValuesBecause the vertex is the highest or lowest point on a parabola, its y-coordinate is
the maximum value or minimum value of the function. The vertex lies on the axis of
symmetry, so the function is increasing on one side of the axis of symmetry and
decreasing on the other side.
Core Core ConceptConceptMinimum and Maximum ValuesFor the quadratic function f(x) = ax2 + bx + c, the y-coordinate of the vertex
is the minimum value of the function when a > 0 and the maximum value
when a < 0.
a > 0
x
y
minimum
increasingdecreasing
x = – b2a
● Minimum value: f ( − b —
2a )
● Domain: All real numbers
● Range: y ≥ f ( − b —
2a )
● Decreasing to the left of x = − b —
2a
● Increasing to the right of x = − b —
2a
a < 0
x
y
maximum
increasing decreasing
x = – b2a
● Maximum value: f ( − b —
2a )
● Domain: All real numbers
● Range: y ≤ f ( − b —
2a )
● Increasing to the left of x = − b —
2a
● Decreasing to the right of x = − b —
2a
Finding a Minimum or a Maximum Value
Find the minimum value or maximum value of f(x) = 1 —
2 x2 − 2x − 1. Describe the
domain and range of the function, and where the function is increasing and decreasing.
SOLUTION
Identify the coeffi cients a = 1 —
2 , b = −2, and c = −1. Because a > 0, the parabola
opens up and the function has a minimum value. To fi nd the minimum value, calculate
the coordinates of the vertex.
x = − b —
2a = −
−2 —
2 ( 1 — 2 ) = 2 f (2) =
1 —
2 (2)2 − 2(2) − 1 = −3
The minimum value is −3. So, the domain is all real numbers and the range is
y ≥ −3. The function is decreasing to the left of x = 2 and increasing to the
right of x = 2.
Monitoring ProgressMonitoring Progress Help in English and Spanish at BigIdeasMath.com
5. Find the minimum value or maximum value of (a) f(x) = 4x2 + 16x − 3 and
(b) h(x) = −x2 + 5x + 9. Describe the domain and range of each function,
and where each function is increasing and decreasing.
Check
MinimumX=2 Y=-3
10
−10
−10
10
STUDY TIPWhen a function f is written in vertex form,
you can use h = − b — 2a
and
k = f ( − b — 2a
) to state the
properties shown.
Int_Math3_PE_02.06.indd 84Int_Math3_PE_02.06.indd 84 1/30/15 2:10 PM1/30/15 2:10 PM

Section 2.6 Characteristics of Quadratic Functions 85
Graphing Quadratic Functions Using x-InterceptsWhen the graph of a quadratic function has at least one x-intercept, the function can be
written in intercept form, f(x) = a(x − p)(x − q), where a ≠ 0.REMEMBERAn x-intercept of a graph is the x-coordinate of a point where the graph intersects the x-axis. It occurs where f(x) = 0.
Graphing a Quadratic Function in Intercept Form
Graph f(x) = −2(x + 3)(x − 1). Label the x-intercepts, vertex, and axis of symmetry.
SOLUTION
Step 1 Identify the x-intercepts. The x-intercepts are
p = −3 and q = 1, so the parabola passes
through the points (−3, 0) and (1, 0).
Step 2 Find the coordinates of the vertex.
x = p + q
— 2 =
−3 + 1 —
2 = −1
f(−1) = −2(−1 + 3)(−1 − 1) = 8
So, the axis of symmetry is x = −1 and
the vertex is (−1, 8).
Step 3 Draw a parabola through the vertex and
the points where the x-intercepts occur.
Monitoring ProgressMonitoring Progress Help in English and Spanish at BigIdeasMath.com
Graph the function. Label the x-intercepts, vertex, and axis of symmetry.
6. f(x) = −(x + 1)(x + 5) 7. g(x) = 1 —
4 (x − 6)(x − 2)
COMMON ERRORRemember that the x-intercepts of the graph of f(x) = a(x − p)(x − q) are p and q, not −p and −q.
Check You can check your answer by generating a table of values for f on a
graphing calculator.
X Y1
X=-1
-10-406860-10
-3-2
012
-1
x-intercept The values showsymmetry about x = −1.So, the vertex is (−1, 8).x-intercept
Core Core ConceptConceptProperties of the Graph of f(x) = a(x − p)(x − q)● Because f(p) = 0 and f(q) = 0, p and
q are the x-intercepts of the graph of
the function.
● The axis of symmetry is halfway between
(p, 0) and (q, 0). So, the axis of symmetry
is x = p + q
— 2 .
● The parabola opens up when a > 0 and
opens down when a < 0.
x
y
(q, 0)
(p, 0)
x =
y = a(x – p)(x – q)
p + q2
x
y
2
4
6
2(1, 0)(–3, 0)
(–1, 8)
−2−4
x = –1
Int_Math3_PE_02.06.indd 85Int_Math3_PE_02.06.indd 85 1/30/15 2:10 PM1/30/15 2:10 PM

86 Chapter 2 Linear and Quadratic Functions
Rewriting EquationsYou can use completing the square to rewrite equations of the form
ax2 + by2 + cx + dy + e = 0
into forms that make it easier to identify characteristics of their graphs.
Rewriting Equations
Use completing the square to fi nd the vertex of the parabola or the center and radius
of the circle. Then graph the equation.
a. −2x2 + 8x − y + 7 = 0 b. x2 + y2 − 2x + 6y − 6 = 0
SOLUTION
a. The equation has no y2-term. So, isolate the x-terms and complete the square.
−2x2 + 8x = y − 7 Isolate the x-terms.
−2(x2 − 4x) = y − 7 Factor out −2 on the left side.
−2(x2 − 4x + 4) = y − 7 − 8 Complete the square for x2 − 4x.
−2(x − 2)2 + 15 = y Write in vertex form.
The graph of the equation is a parabola
with a vertex of (2, 15).
b. The equation has an x2-term and a y2-term. So, complete the square twice.
x2 + y2 − 2x + 6y = 6 Add 6 to each side.
(x2 − 2x) + (y2 + 6y) = 6 Group x-terms and y-terms.
(x2 − 2x + 1) + (y2 + 6y + 9) = 6 + 1 + 9 Complete the square for x2 − 2x
and y2 + 6y.
(x − 1)2 + (y + 3)2 = 16 Factor left side. Simplify right side.
The graph of the equation is a circle
with a radius of 4 and center (1, −3).
Monitoring ProgressMonitoring Progress Help in English and Spanish at BigIdeasMath.com
Use completing the square to fi nd the vertex of the parabola or the center and radius of the circle. Then graph the equation.
8. x2 − 8x − y + 15 = 0 9. x2 + y2 + 2x − 8y − 8 = 0
REMEMBERTo complete the square for an expression of the
form x2 + bx, add ( b — 2 ) 2
to the expression. In this example, you must also add −2(4) = −8 to the right side of the equation to preserve equality.
x
y
6
12
2 4
(2, 15)
(−1, −3)
(5, −3)
REMEMBERRecall that the standard equation of a circle with center (h, k) and radius r is
(x − h)2 + (y − k)2 = r2.
x
y
(h, k)
(x, y)r
x
y
−4
−6
−2
2
(1, −3)
Int_Math3_PE_02.06.indd 86Int_Math3_PE_02.06.indd 86 1/30/15 2:10 PM1/30/15 2:10 PM

Section 2.6 Characteristics of Quadratic Functions 87
Exercises2.6 Dynamic Solutions available at BigIdeasMath.com
In Exercises 3–14, graph the function. Label the vertex and axis of symmetry. (See Example 1.)
3. f(x) = (x − 3)2 4. h(x) = (x + 4)2
5. g(x) = (x + 3)2 + 5 6. y = (x − 7)2 − 1
7. y = −4(x − 2)2 + 4 8. g(x) = 2(x + 1)2 − 3
9. f(x) = −2(x − 1)2 − 5 10. h(x) = 4(x + 4)2 + 6
11. y = − 1 —
4 (x + 2)2 + 1 12. y =
1 —
2 (x − 3)2 + 2
13. f(x) = 0.4(x − 1)2 14. g(x) = 0.75x2 − 5
ANALYZING RELATIONSHIPS In Exercises 15–18, use the axis of symmetry to match the equation with its graph.
15. y = 2(x − 3)2 + 1 16. y = (x + 4)2 − 2
17. y = 1 —
2 (x + 1)2 + 3 18. y = (x − 2)2 − 1
A.
x
y
2
−2
4 6
x = 2
B.
x
y
4
6
2
−2−4 2
x = –1
C.
x
y
4
2
2 4
x = 3
D.
x
y
2
−6
−2x = −4
REASONING In Exercises 19 and 20, use the axis of symmetry to plot the refl ection of each point and complete the parabola.
19.
x
y3
1
−1 1 3 5
(2, 3)
(1, 2)
(0, –1)x = 2
20.
x
y
−2−4−6(–1, 1)
(–3, –3)
(–2, –2) −2
−4
x = –3
In Exercises 21–30, graph the function. Label the vertex and axis of symmetry. (See Example 2.)
21. y = x2 + 2x + 1 22. y = 3x2 − 6x + 4
23. y = −4x2 + 8x + 2 24. f(x) = −x2 − 6x + 3
25. g(x) = −x2 − 1 26. f(x) = 6x2 − 5
27. g(x) = −1.5x2 + 3x + 2
28. f(x) = 0.5x2 + x − 3
29. y = 3 —
2 x2 − 3x + 6 30. y = −
5 —
2 x2 − 4x − 1
31. WRITING Two quadratic functions have graphs with
vertices (2, 4) and (2, −3). Explain why you can not
use the axes of symmetry to distinguish between the
two functions.
32. WRITING A quadratic function is increasing to the left
of x = 2 and decreasing to the right of x = 2. Will the
vertex be the highest or lowest point on the graph of
the parabola? Explain.
1. WRITING Explain how to determine whether a quadratic function will have a minimum value
or a maximum value.
2. WHICH ONE DOESN’T BELONG? The graph of which function does not belong with the
other three? Explain.
f(x) = 3x2 + 6x − 24
f(x) = 3x2 + 24x − 6
f(x) = 3(x − 2)(x + 4)
f(x) = 3(x + 1)2 − 27
Vocabulary and Core Concept Checkpppppppp
Monitoring Progress and Modeling with MathematicsMonitoring Progress and Modeling with Mathematics
Int_Math3_PE_02.06.indd 87Int_Math3_PE_02.06.indd 87 1/30/15 2:10 PM1/30/15 2:10 PM
88 Chapter 2 Linear and Quadratic Functions
ERROR ANALYSIS In Exercises 33 and 34, describe and correct the error in analyzing the graph of y = 4x2 + 24x − 7.
33. The x-coordinate of the vertex is
x = b — 2a
= 24 — 2(4)
= 3.✗
34. The y-intercept of the graph is the value of c, which is 7.✗
MODELING WITH MATHEMATICS In Exercises 35 and 36, x is the horizontal distance (in feet) and y is the vertical distance (in feet). Find and interpret the coordinates of the vertex.
35. The path of a basketball thrown at an angle of 45° can
be modeled by y = −0.02x2 + x + 6.
36. The path of a shot put released at an angle of 35° can
be modeled by y = −0.01x2 + 0.7x + 6.
x
35°
y
37. ANALYZING EQUATIONS The graph of which
function has the same axis of symmetry as the graph
of y = x2 + 2x + 2?
○A y = 2x2 + 2x + 2
○B y = −3x2 − 6x + 2
○C y = x2 − 2x + 2
○D y = −5x2 + 10x + 2
38. USING STRUCTURE Which function represents
the widest parabola? Explain your reasoning.
○A y = 2(x + 3)2
○B y = x2 − 5
○C y = 0.5(x − 1)2 + 1
○D y = −x2 + 6
In Exercises 39–48, fi nd the minimum or maximum value of the function. Describe the domain and range of the function, and where the function is increasing and decreasing. (See Example 3.)
39. y = 6x2 − 1 40. y = 9x2 + 7
41. y = −x2 − 4x − 2 42. g(x) = −3x2 − 6x + 5
43. f(x) = −2x2 + 8x + 7
44. g(x) = 3x2 + 18x − 5
45. h(x) = 2x2 − 12x 46. h(x) = x2 − 4x
47. y = 1 —
4 x2 − 3x + 2 48. f(x) =
3 —
2 x2 + 6x + 4
49. PROBLEM SOLVING The path of a diver is modeled
by the function f(x) = −9x2 + 9x + 1, where f(x) is
the height of the diver (in meters) above the water and
x is the horizontal distance (in meters) from the end of
the diving board.
a. What is the height of the diving board?
b. What is the maximum height of the diver?
c. Describe where the diver is ascending and where
the diver is descending.
50. PROBLEM SOLVING The engine torque
y (in foot-pounds) of one model of car is given by
y = −3.75x2 + 23.2x + 38.8, where x is the speed
(in thousands of revolutions per minute) of the engine.
a. Find the engine speed that maximizes torque.
What is the maximum torque?
b. Explain what happens to the engine torque as the
speed of the engine increases.
MATHEMATICAL CONNECTIONS In Exercises 51 and 52, write an equation for the area of the fi gure. Then determine the maximum possible area of the fi gure.
51. 52.
w
20 – w b
6 – b
Int_Math3_PE_02.06.indd 88Int_Math3_PE_02.06.indd 88 1/30/15 2:10 PM1/30/15 2:10 PM
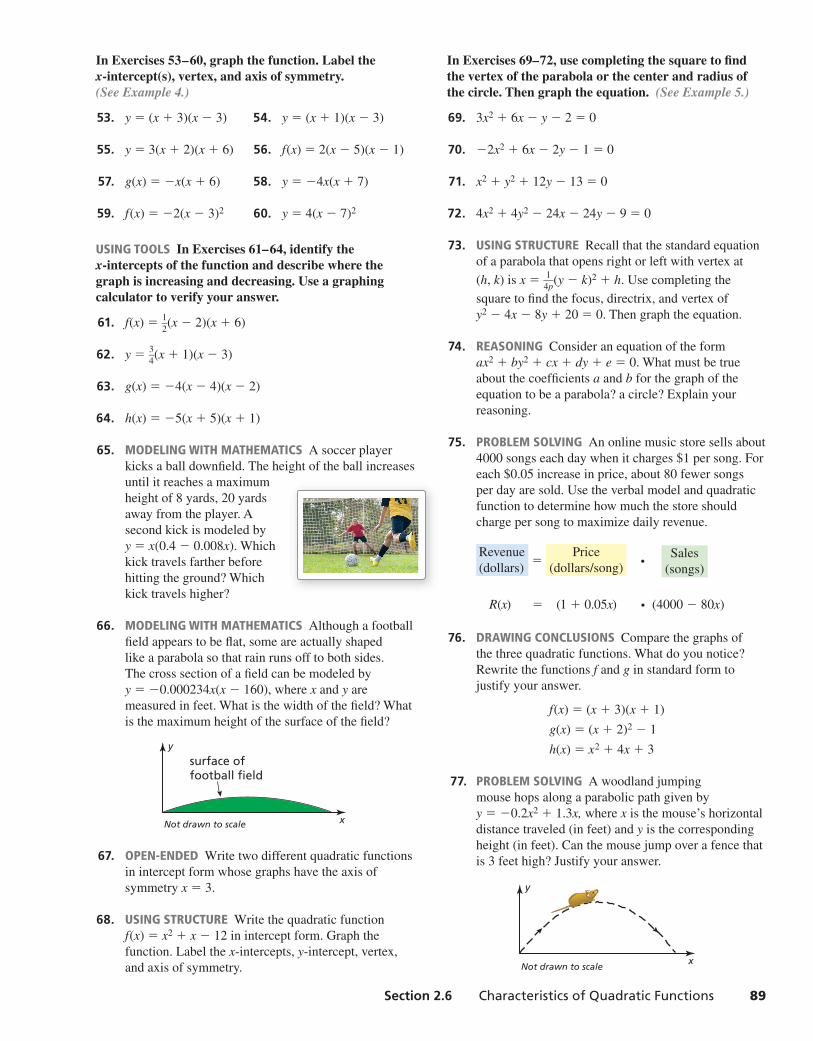
Section 2.6 Characteristics of Quadratic Functions 89
In Exercises 53–60, graph the function. Label the x-intercept(s), vertex, and axis of symmetry. (See Example 4.)
53. y = (x + 3)(x − 3) 54. y = (x + 1)(x − 3)
55. y = 3(x + 2)(x + 6) 56. f(x) = 2(x − 5)(x − 1)
57. g(x) = −x(x + 6) 58. y = −4x(x + 7)
59. f(x) = −2(x − 3)2 60. y = 4(x − 7)2
USING TOOLS In Exercises 61–64, identify the x-intercepts of the function and describe where the graph is increasing and decreasing. Use a graphing calculator to verify your answer.
61. f(x) = 1 —
2 (x − 2)(x + 6)
62. y = 3 —
4 (x + 1)(x − 3)
63. g(x) = −4(x − 4)(x − 2)
64. h(x) = −5(x + 5)(x + 1)
65. MODELING WITH MATHEMATICS A soccer player
kicks a ball downfi eld. The height of the ball increases
until it reaches a maximum
height of 8 yards, 20 yards
away from the player. A
second kick is modeled by
y = x(0.4 − 0.008x). Which
kick travels farther before
hitting the ground? Which
kick travels higher?
66. MODELING WITH MATHEMATICS Although a football
fi eld appears to be fl at, some are actually shaped
like a parabola so that rain runs off to both sides.
The cross section of a fi eld can be modeled by
y = −0.000234x(x − 160), where x and y are
measured in feet. What is the width of the fi eld? What
is the maximum height of the surface of the fi eld?
Not drawn to scale
y
surface offootball field
x
67. OPEN-ENDED Write two different quadratic functions
in intercept form whose graphs have the axis of
symmetry x = 3.
68. USING STRUCTURE Write the quadratic function
f(x) = x2 + x − 12 in intercept form. Graph the
function. Label the x-intercepts, y-intercept, vertex,
and axis of symmetry.
In Exercises 69–72, use completing the square to fi nd the vertex of the parabola or the center and radius of the circle. Then graph the equation. (See Example 5.)
69. 3x2 + 6x − y − 2 = 0
70. −2x2 + 6x − 2y − 1 = 0
71. x2 + y2 + 12y − 13 = 0
72. 4x2 + 4y2 − 24x − 24y − 9 = 0
73. USING STRUCTURE Recall that the standard equation
of a parabola that opens right or left with vertex at
(h, k) is x = 1 —
4p (y − k)2 + h. Use completing the
square to fi nd the focus, directrix, and vertex of
y2 − 4x − 8y + 20 = 0. Then graph the equation.
74. REASONING Consider an equation of the form
ax2 + by2 + cx + dy + e = 0. What must be true
about the coeffi cients a and b for the graph of the
equation to be a parabola? a circle? Explain your
reasoning.
75. PROBLEM SOLVING An online music store sells about
4000 songs each day when it charges $1 per song. For
each $0.05 increase in price, about 80 fewer songs
per day are sold. Use the verbal model and quadratic
function to determine how much the store should
charge per song to maximize daily revenue.
Revenue
(dollars) =
Price
(dollars/song) ⋅
Sales
(songs)
R(x) = (1 + 0.05x) ⋅ (4000 − 80x)
76. DRAWING CONCLUSIONS Compare the graphs of
the three quadratic functions. What do you notice?
Rewrite the functions f and g in standard form to
justify your answer.
f(x) = (x + 3)(x + 1)
g(x) = (x + 2)2 − 1
h(x) = x2 + 4x + 3
77. PROBLEM SOLVING A woodland jumping
mouse hops along a parabolic path given by
y = −0.2x2 + 1.3x, where x is the mouse’s horizontal
distance traveled (in feet) and y is the corresponding
height (in feet). Can the mouse jump over a fence that
is 3 feet high? Justify your answer.
Not drawn to scalex
y
Int_Math3_PE_02.06.indd 89Int_Math3_PE_02.06.indd 89 1/30/15 2:10 PM1/30/15 2:10 PM
90 Chapter 2 Linear and Quadratic Functions
78. HOW DO YOU SEE IT? Consider the graph of the
function f(x) = a(x − p)(x − q).
x
y
a. What does f ( p + q —
2 ) represent in the graph?
b. If a < 0, how does your answer in part (a)
change? Explain.
79. MODELING WITH MATHEMATICS The Gateshead
Millennium Bridge spans the River Tyne. The arch
of the bridge can be modeled by a parabola. The arch
reaches a maximum height of 50 meters at a point
roughly 63 meters across the river. Graph the curve
of the arch. What are the domain and range? What do
they represent in this situation?
80. THOUGHT PROVOKING You have 100 feet of
fencing to enclose a rectangular garden. Draw three
possible designs for the garden. Of these, which
has the greatest area? Make a conjecture about the
dimensions of the rectangular garden with the greatest
possible area. Explain your reasoning.
81. MAKING AN ARGUMENT The point (1, 5) lies on the
graph of a quadratic function with axis of symmetry
x = −1. Your friend says the vertex could be the point
(0, 5). Is your friend correct? Explain.
82. CRITICAL THINKING Find the y-intercept in
terms of a, p, and q for the quadratic function
f(x) = a(x − p)(x − q).
83. MODELING WITH MATHEMATICS A kernel of
popcorn contains water that expands when the
kernel is heated, causing it to pop. The equations
below represent the “popping volume” y (in cubic
centimeters per gram) of popcorn with moisture
content x (as a percent of the popcorn’s weight).
Hot-air popping: y = −0.761(x − 5.52)(x − 22.6)
Hot-oil popping: y = −0.652(x − 5.35)(x − 21.8)
a. For hot-air popping, what moisture content
maximizes popping volume? What is the
maximum volume?
b. For hot-oil popping, what moisture content
maximizes popping volume? What is the
maximum volume?
c. Use a graphing calculator to graph both functions
in the same coordinate plane. What are the domain
and range of each function in this situation?
Explain.
84. ABSTRACT REASONING A function is written in
intercept form with a > 0. What happens to the vertex
of the graph as a increases? as a approaches 0?
Maintaining Mathematical ProficiencyMaintaining Mathematical ProficiencySketch the solid of revolution. Then identify and describe the solid. (Section 1.4)
85. a right triangle with legs of length 3 and 5 rotated around its shorter leg
86. a semicircle with radius 4 rotated around its diameter
Use a graphing calculator to fi nd an equation for the line of best fi t. (Section 2.3)
87. x 0 3 6 7 11
y 4 9 24 29 46
88. x 0 5 10 12 16
y 18 15 9 7 2
Reviewing what you learned in previous grades and lessons
Int_Math3_PE_02.06.indd 90Int_Math3_PE_02.06.indd 90 1/30/15 2:10 PM1/30/15 2:10 PM
Section 2.7 Modeling with Quadratic Functions 91
Modeling with Quadratic Functions2.7
Modeling with a Quadratic Function
Work with a partner. The graph shows a
quadratic function of the form
P(t) = at2 + bt + c
which approximates the yearly profi ts for a
company, where P(t) is the profi t in year t.
a. Is the value of a positive, negative,
or zero? Explain.
b. Write an expression in terms of a and b that
represents the year t when the company
made the least profi t.
c. The company made the same yearly profi ts in 2004 and 2012. Estimate the year in
which the company made the least profi t.
d. Assume that the model is still valid today. Are the yearly profi ts currently
increasing, decreasing, or constant? Explain.
Essential QuestionEssential Question How can you use a quadratic function to model
a real-life situation?
Modeling with a Graphing Calculator
Work with a partner. The table shows the heights h (in feet) of a wrench t seconds
after it has been dropped from a building under construction.
Time, t 0 1 2 3 4
Height, h 400 384 336 256 144
a. Use a graphing calculator to create a scatter
plot of the data, as shown at the right. Explain
why the data appear to fi t a quadratic model.
b. Use the quadratic regression feature to fi nd
a quadratic model for the data.
c. Graph the quadratic function on the same screen
as the scatter plot to verify that it fi ts the data.
d. When does the wrench hit the ground? Explain.
Communicate Your AnswerCommunicate Your Answer 3. How can you use a quadratic function to model a real-life situation?
4. Use the Internet or some other reference to fi nd examples of real-life situations
that can be modeled by quadratic functions.
MODELING WITH MATHEMATICS
To be profi cient in math, you need to routinely interpret your results in the context of the situation.
t
P
Yea
rly
pro
fit
(do
llars
)
Year
P(t) = at2 + bt + c
50
0
400
Int_Math3_PE_02.07.indd 91Int_Math3_PE_02.07.indd 91 1/30/15 2:11 PM1/30/15 2:11 PM

92 Chapter 2 Linear and Quadratic Functions
2.7 Lesson What You Will LearnWhat You Will Learn Write equations of quadratic functions using vertices, points,
and x-intercepts.
Write quadratic equations to model data sets.
Writing Quadratic EquationsPreviousaverage rate of changefi rst differencessecond differencessystem of three linear equationsQuadratic Formula
Core VocabularyCore Vocabullarry
Core Core ConceptConceptWriting Quadratic EquationsGiven a point and the vertex (h, k) Use vertex form:
y = a(x − h)2 + k
Given a point and x-intercepts p and q Use intercept form:
y = a(x − p)(x − q)
Given three points Write and solve a system of three
equations in three variables.
Writing an Equation Using a Vertex and a Point
The graph shows the parabolic path of a performer who is shot out of a cannon, where
y is the height (in feet) and x is the horizontal distance traveled (in feet). Write an
equation of the parabola. The performer lands in a net 90 feet from the cannon. What
is the height of the net?
SOLUTION
From the graph, you can see that the vertex (h, k) is (50, 35) and the parabola passes
through the point (0, 15). Use the vertex and the point to solve for a in vertex form.
y = a(x − h)2 + k Vertex form
15 = a(0 − 50)2 + 35 Substitute for h, k, x, and y.
−20 = 2500a Simplify.
−0.008 = a Divide each side by 2500.
Because a = −0.008, h = 50, and k = 35, the path can be modeled by the equation
y = −0.008(x − 50)2 + 35, where 0 ≤ x ≤ 90. Find the height when x = 90.
y = −0.008(90 − 50)2 + 35 Substitute 90 for x.
= −0.008(1600) + 35 Simplify.
= 22.2 Simplify.
So, the height of the net is about 22 feet.
Monitoring ProgressMonitoring Progress Help in English and Spanish at BigIdeasMath.com
1. WHAT IF? The vertex of the parabola is (50, 37.5). What is the height of the net?
2. Write an equation of the parabola that passes through the point (−1, 2) and has
vertex (4, −9).
Human Cannonball
Hei
gh
t (f
eet)
Horizontal distance(feet)
x
y
20
10
0
40
30
4020
(50, 35)
(0,15)
0 8060
Int_Math3_PE_02.07.indd 92Int_Math3_PE_02.07.indd 92 1/30/15 2:11 PM1/30/15 2:11 PM
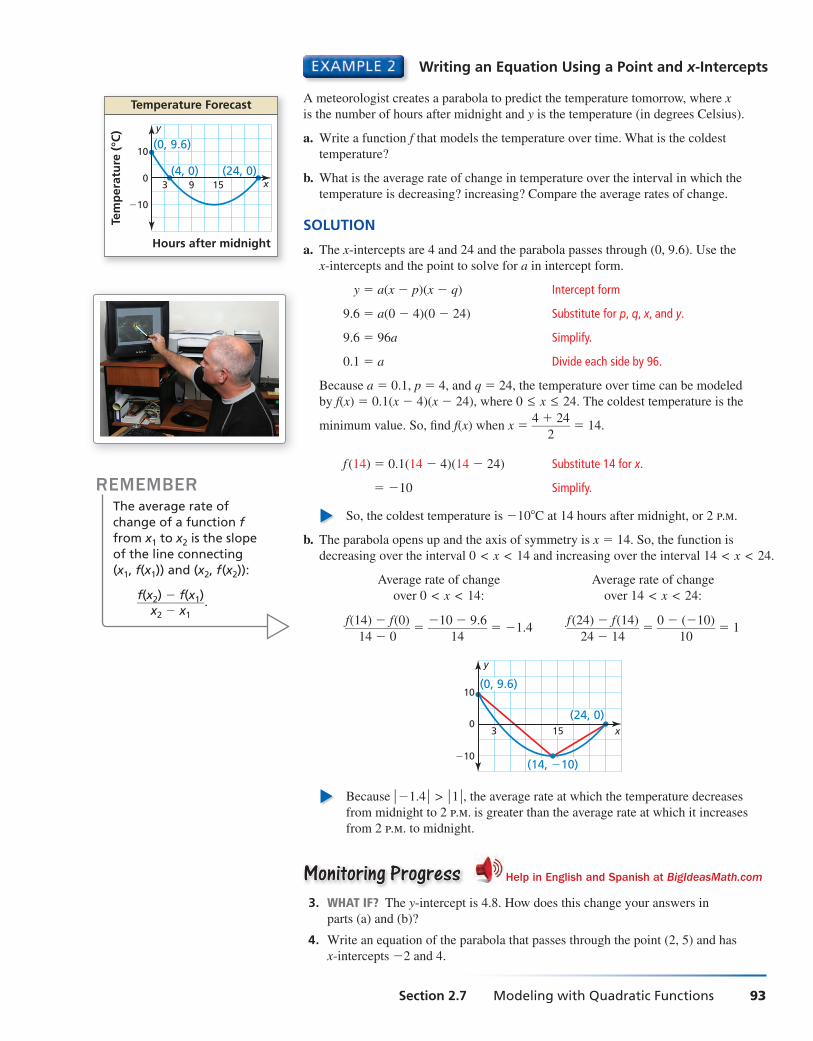
Section 2.7 Modeling with Quadratic Functions 93
Writing an Equation Using a Point and x-Intercepts
A meteorologist creates a parabola to predict the temperature tomorrow, where x
is the number of hours after midnight and y is the temperature (in degrees Celsius).
a. Write a function f that models the temperature over time. What is the coldest
temperature?
b. What is the average rate of change in temperature over the interval in which the
temperature is decreasing? increasing? Compare the average rates of change.
SOLUTION
a. The x-intercepts are 4 and 24 and the parabola passes through (0, 9.6). Use the
x-intercepts and the point to solve for a in intercept form.
y = a(x − p)(x − q) Intercept form
9.6 = a(0 − 4)(0 − 24) Substitute for p, q, x, and y.
9.6 = 96a Simplify.
0.1 = a Divide each side by 96.
Because a = 0.1, p = 4, and q = 24, the temperature over time can be modeled
by f(x) = 0.1(x − 4)(x − 24), where 0 ≤ x ≤ 24. The coldest temperature is the
minimum value. So, fi nd f(x) when x = 4 + 24
— 2 = 14.
f (14) = 0.1(14 − 4)(14 − 24) Substitute 14 for x.
= −10 Simplify.
So, the coldest temperature is −10°C at 14 hours after midnight, or 2 p.m.
b. The parabola opens up and the axis of symmetry is x = 14. So, the function is
decreasing over the interval 0 < x < 14 and increasing over the interval 14 < x < 24.
Average rate of change Average rate of change
over 0 < x < 14: over 14 < x < 24:
f(14) − f(0)
— 14 − 0
= −10 − 9.6
— 14
= −1.4 f (24) − f(14)
—— 24 − 14
= 0 − (−10)
— 10
= 1
−10
0
10
y
x3 15
(24, 0)
(0, 9.6)
(14, −10)
Because ∣ −1.4 ∣ > ∣ 1 ∣ , the average rate at which the temperature decreases
from midnight to 2 p.m. is greater than the average rate at which it increases
from 2 p.m. to midnight.
Monitoring ProgressMonitoring Progress Help in English and Spanish at BigIdeasMath.com
3. WHAT IF? The y-intercept is 4.8. How does this change your answers in
parts (a) and (b)?
4. Write an equation of the parabola that passes through the point (2, 5) and has
x-intercepts −2 and 4.
REMEMBERThe average rate of change of a function f from x1 to x2 is the slope of the line connecting (x1, f(x1)) and (x2, f(x2)):
f(x2) − f(x1) —— x2 − x1
.
Temperature ForecastTe
mp
erat
ure
(°C
)
−10
0
10
y
x
Hours after midnight
3 9 15(24, 0)(4, 0)
(0, 9.6)
Int_Math3_PE_02.07.indd 93Int_Math3_PE_02.07.indd 93 1/30/15 2:11 PM1/30/15 2:11 PM
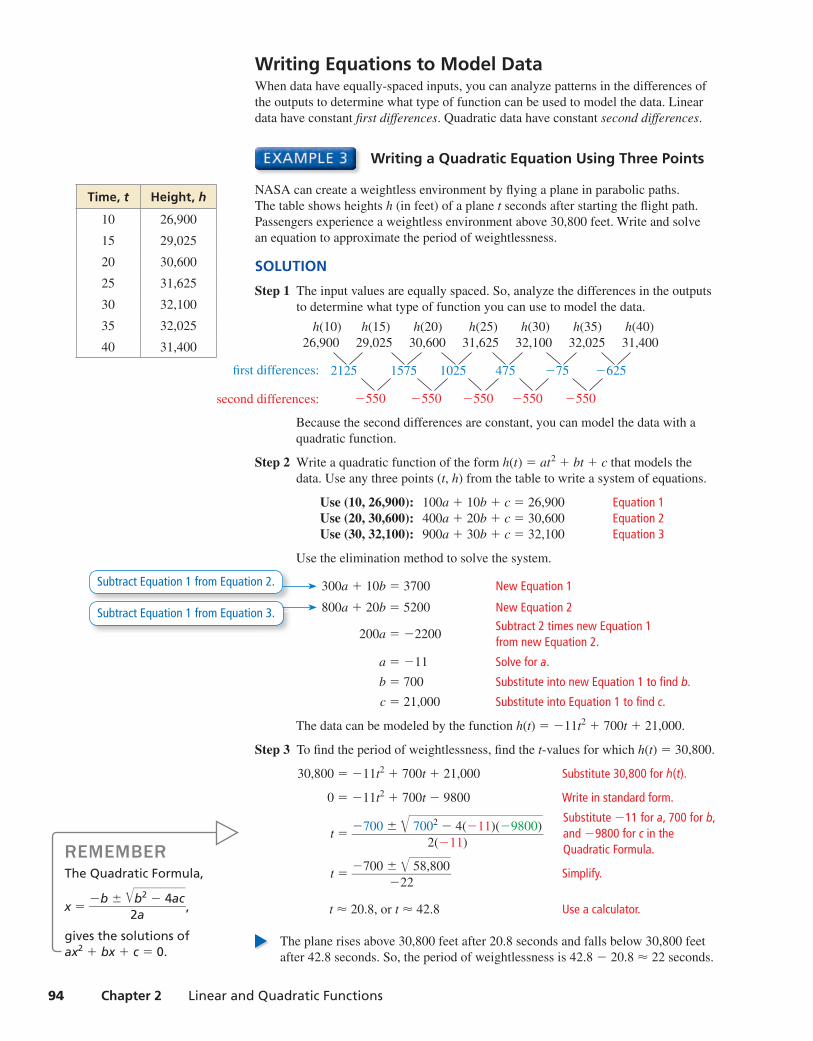
94 Chapter 2 Linear and Quadratic Functions
Writing Equations to Model DataWhen data have equally-spaced inputs, you can analyze patterns in the differences of
the outputs to determine what type of function can be used to model the data. Linear
data have constant fi rst differences. Quadratic data have constant second differences.
Writing a Quadratic Equation Using Three Points
NASA can create a weightless environment by fl ying a plane in parabolic paths.
The table shows heights h (in feet) of a plane t seconds after starting the fl ight path.
Passengers experience a weightless environment above 30,800 feet. Write and solve
an equation to approximate the period of weightlessness.
SOLUTION
Step 1 The input values are equally spaced. So, analyze the differences in the outputs
to determine what type of function you can use to model the data.
h(10) h(15) h(20) h(25) h(30) h(35) h(40)
26,900 29,025 30,600 31,625 32,100 32,025 31,400
2125 1575 1025 475 −75 −625
−550 −550 −550 −550 −550
Because the second differences are constant, you can model the data with a
quadratic function.
Step 2 Write a quadratic function of the form h(t) = at2 + bt + c that models the
data. Use any three points (t, h) from the table to write a system of equations.
Use (10, 26,900): 100a + 10b + c = 26,900 Equation 1 Use (20, 30,600): 400a + 20b + c = 30,600 Equation 2 Use (30, 32,100): 900a + 30b + c = 32,100 Equation 3
Use the elimination method to solve the system.
300a + 10b = 3700 New Equation 1
800a + 20b = 5200 New Equation 2
200a = −2200 Subtract 2 times new Equation 1 from new Equation 2.
a = −11 Solve for a.
b = 700 Substitute into new Equation 1 to fi nd b.
c = 21,000 Substitute into Equation 1 to fi nd c.
The data can be modeled by the function h(t) = −11t2 + 700t + 21,000.
Step 3 To fi nd the period of weightlessness, fi nd the t-values for which h(t) = 30,800.
30,800 = −11t2 + 700t + 21,000 Substitute 30,800 for h(t).
0 = −11t2 + 700t − 9800 Write in standard form.
t = −700 ± √
——— 7002 − 4(−11)(−9800) ———
2(−11)
t = −700 ± √
— 58,800 ——
−22 Simplify.
t ≈ 20.8, or t ≈ 42.8 Use a calculator.
The plane rises above 30,800 feet after 20.8 seconds and falls below 30,800 feet
after 42.8 seconds. So, the period of weightlessness is 42.8 − 20.8 ≈ 22 seconds.
Time, t Height, h
10 26,900
15 29,025
20 30,600
25 31,625
30 32,100
35 32,025
40 31,400
fi rst differences:
second differences:
Subtract Equation 1 from Equation 2.
Subtract Equation 1 from Equation 3.
REMEMBERThe Quadratic Formula,
x = −b ± √—
b2 − 4ac ——
2a ,
gives the solutions ofax2 + bx + c = 0.
Substitute −11 for a, 700 for b, and −9800 for c in the Quadratic Formula.
Int_Math3_PE_02.07.indd 94Int_Math3_PE_02.07.indd 94 1/30/15 2:11 PM1/30/15 2:11 PM
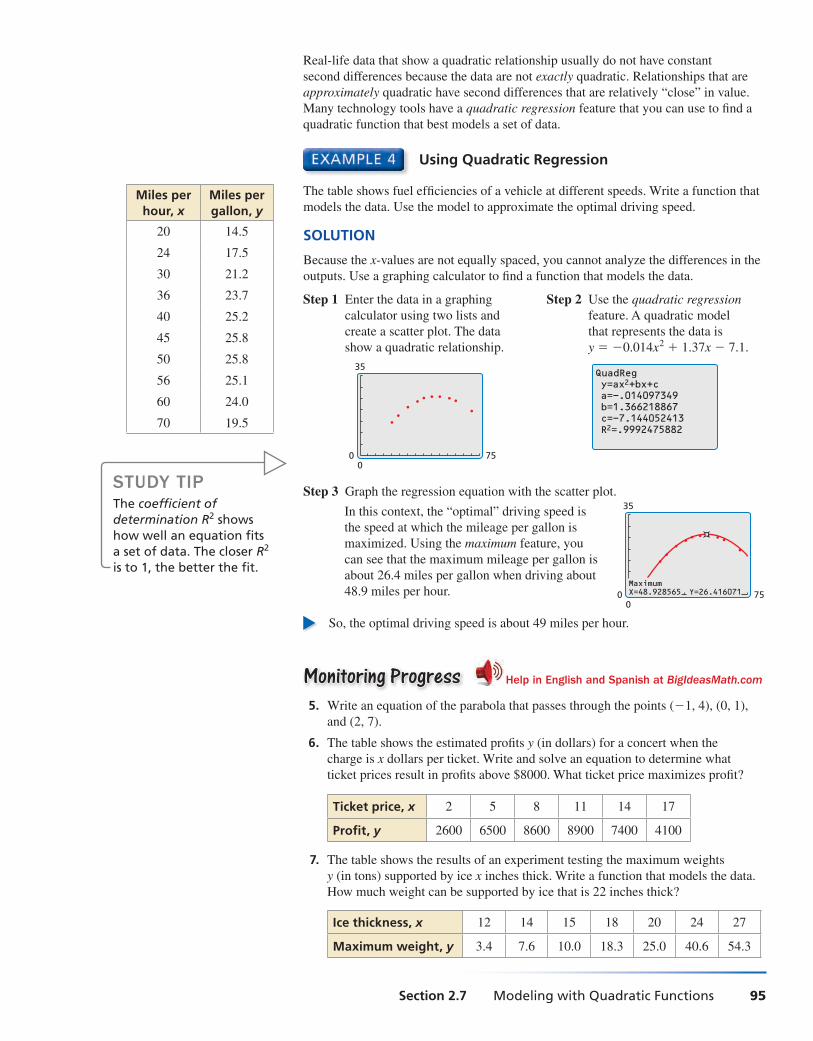
Section 2.7 Modeling with Quadratic Functions 95
Using Quadratic Regression
The table shows fuel effi ciencies of a vehicle at different speeds. Write a function that
models the data. Use the model to approximate the optimal driving speed.
SOLUTION
Because the x-values are not equally spaced, you cannot analyze the differences in the
outputs. Use a graphing calculator to fi nd a function that models the data.
Step 3 Graph the regression equation with the scatter plot.
In this context, the “optimal” driving speed is
the speed at which the mileage per gallon is
maximized. Using the maximum feature, you
can see that the maximum mileage per gallon is
about 26.4 miles per gallon when driving about
48.9 miles per hour.
So, the optimal driving speed is about 49 miles per hour.
Monitoring ProgressMonitoring Progress Help in English and Spanish at BigIdeasMath.com
5. Write an equation of the parabola that passes through the points (−1, 4), (0, 1),
and (2, 7).
6. The table shows the estimated profi ts y (in dollars) for a concert when the
charge is x dollars per ticket. Write and solve an equation to determine what
ticket prices result in profi ts above $8000. What ticket price maximizes profi t?
Ticket price, x 2 5 8 11 14 17
Profi t, y 2600 6500 8600 8900 7400 4100
7. The table shows the results of an experiment testing the maximum weights
y (in tons) supported by ice x inches thick. Write a function that models the data.
How much weight can be supported by ice that is 22 inches thick?
Ice thickness, x 12 14 15 18 20 24 27
Maximum weight, y 3.4 7.6 10.0 18.3 25.0 40.6 54.3
Real-life data that show a quadratic relationship usually do not have constant
second differences because the data are not exactly quadratic. Relationships that are
approximately quadratic have second differences that are relatively “close” in value.
Many technology tools have a quadratic regression feature that you can use to fi nd a
quadratic function that best models a set of data.
Step 1 Enter the data in a graphing
calculator using two lists and
create a scatter plot. The data
show a quadratic relationship.
750
0
35
Step 2 Use the quadratic regression
feature. A quadratic model
that represents the data is
y = −0.014x2 + 1.37x − 7.1.
QuadRegy=ax2+bx+ca=-.014097349b=1.366218867c=-7.144052413R2=.9992475882
STUDY TIPThe coeffi cient of determination R2 shows how well an equation fi ts a set of data. The closer R2 is to 1, the better the fi t.
Miles per hour, x
Miles per gallon, y
20 14.5
24 17.5
30 21.2
36 23.7
40 25.2
45 25.8
50 25.8
56 25.1
60 24.0
70 19.5
MaximumX=48.928565 Y=26.416071 750
0
35
Int_Math3_PE_02.07.indd 95Int_Math3_PE_02.07.indd 95 1/30/15 2:11 PM1/30/15 2:11 PM
96 Chapter 2 Linear and Quadratic Functions
Exercises2.7 Dynamic Solutions available at BigIdeasMath.com
Vocabulary and Core Concept CheckVocabulary and Core Concept Check
Monitoring Progress and Modeling with MathematicsMonitoring Progress and Modeling with MathematicsIn Exercises 3–8, write an equation of the parabola in vertex form. (See Example 1.)
3.
x
y
8
4
(–1, 3)(–2, 6)
4.
x
y
−4
−8
8(4, −1)
(8, 3)
5. passes through (13, 8) and has vertex (3, 2)
6. passes through (−7, −15) and has vertex (−5, 9)
7. passes through (0, −24) and has vertex (−6, −12)
8. passes through (6, 35) and has vertex (−1, 14)
In Exercises 9–14, write an equation of the parabola in intercept form. (See Example 2.)
9.
x
y
4
−4
8−4
(2, 0)
(3, 4)
(4, 0)
10. x
y
(2, 0)
(1, −2)
−4
−2(−1, 0)
11. x-intercepts of 12 and −6; passes through (14, 4)
12. x-intercepts of 9 and 1; passes through (0, −18)
13. x-intercepts of −16 and −2; passes through (−18, 72)
14. x-intercepts of −7 and −3; passes through (−2, 0.05)
15. WRITING Explain when to use intercept form and
when to use vertex form when writing an equation of
a parabola.
16. ANALYZING EQUATIONS Which of the following
equations represent the parabola?
x
y
−4
4−2(2, 0)
(0.5, −4.5)
(−1, 0)
○A y = 2(x − 2)(x + 1)
○B y = 2(x + 0.5)2 − 4.5
○C y = 2(x − 0.5)2 − 4.5
○D y = 2(x + 2)(x − 1)
In Exercises 17–20, write an equation of the parabola in vertex form or intercept form.
17. 18.
1. WRITING Explain when it is appropriate to use a quadratic model for a set of data.
2. DIFFERENT WORDS, SAME QUESTION Which is different? Find “both” answers.
What is the average rate of
change over 0 ≤ x ≤ 2?
What is the distance
from f(0) to f(2)?
What is the slope of the
line segment?
What is
f(2) − f(0) —
2 − 0 ?
x
y4
2
1
4 5321−1
f
New Ride
Hei
gh
t (f
eet)
0
80
160
Time (seconds)420
(1, 164)(0, 180)
x
y
Flare Signal
Hei
gh
t (f
eet)
0
80
160
Time (seconds)4 6 x
y
20
(1, 86)
(3, 150)
Int_Math3_PE_02.07.indd 96Int_Math3_PE_02.07.indd 96 1/30/15 2:11 PM1/30/15 2:11 PM

Section 2.7 Modeling with Quadratic Functions 97
19. 20.
21. ERROR ANALYSIS Describe and correct the error in
writing an equation of the parabola.
(2, 0)(−1, 0)
(3, 4)
x
y4
2
−2
y = a(x − p)(x − q)
4 = a(3 − 1)(3 + 2)
a = 2 — 5
y = 2 — 5 (x − 1)(x + 2)
✗
22. MATHEMATICAL CONNECTIONS The area of a
rectangle is modeled by the graph where y is the
area (in square meters) and x is the width (in meters).
Write an equation of the parabola. Find the
dimensions and corresponding area of one possible
rectangle. What dimensions result in the
maximum area?
Rectangles
Are
a(s
qu
are
met
ers)
0
4
8
12
Width (meters)84
(0, 0)
(1, 6)
(7, 0)0 x
y
23. MODELING WITH MATHEMATICS Every rope has a
safe working load. A rope should not be used to lift a
weight greater than its safe working load. The table
shows the safe working loads S (in pounds) for ropes
with circumference C (in inches). Write an equation
for the safe working load for a rope. Find the safe
working load for a rope that has a circumference of
10 inches. (See Example 3.)
Circumference, C 0 1 2 3
Safe working load, S
0 180 720 1620
24. MODELING WITH MATHEMATICS A baseball is
thrown up in the air. The table shows the heights
y (in feet) of the baseball after x seconds. Write and
solve an equation to determine how long the ball is
above 10 feet. How long is the ball in the air?
Time, x 0 2 4 6
Baseball height, y 6 22 22 6
25. COMPARING METHODS You use a system with three
variables to fi nd the equation of a parabola that passes
through the points (−8, 0), (2, −20), and (1, 0). Your
friend uses intercept form to fi nd the equation. Whose
method is easier? Justify your answer.
26. MODELING WITH MATHEMATICS The table shows the
distances y a motorcyclist is from home after x hours.
Time (hours), x 0 1 2 3
Distance (miles), y 0 45 90 135
a. Determine what type of function you can use to
model the data. Explain your reasoning.
b. Write and evaluate a function to determine the
distance the motorcyclist is from home after
6 hours.
27. USING TOOLS The table shows the heights
h (in feet) of a sponge t seconds after it was dropped
by a window cleaner on top of a skyscraper.
(See Example 4.)
Time, t 0 1 1.5 2.5 3
Height, h 280 264 244 180 136
a. Use a graphing calculator to create a scatter
plot. Which better represents the data, a line or a
parabola? Explain.
b. Use the regression feature of your calculator to
fi nd the model that best fi ts the data.
c. Use the model in part (b) to predict when the
sponge will hit the ground.
d. Identify and interpret the domain and range in
this situation.
28. MAKING AN ARGUMENT Your friend states that
quadratic functions with the same x-intercepts have
the same equations, vertex, and axis of symmetry. Is
your friend correct? Explain your reasoning.
Frog Jump
Hei
gh
t (f
eet)
0.00
0.50
1.00
Distance (feet)420
(3, 1)
1, 59( )
x
y
Human Jump
Hei
gh
t (f
eet)
0
2
4
Distance (feet)420
(4, 0)
(3, 2.25)
(0, 0)x
y
Int_Math3_PE_02.07.indd 97Int_Math3_PE_02.07.indd 97 1/30/15 2:11 PM1/30/15 2:11 PM
98 Chapter 2 Linear and Quadratic Functions
Maintaining Mathematical ProficiencyMaintaining Mathematical ProficiencyFactor the trinomial. (Skills Review Handbook)
38. x2 + 4x + 3 39. x2 − 3x + 2 40. 3x2 − 15x + 12 41. 5x2 + 5x − 30
Reviewing what you learned in previous grades and lessons
In Exercises 29–32, analyze the differences in the outputs to determine whether the data are linear, quadratic, or neither. Explain. If linear or quadratic, write an equation that fi ts the data.
29. Price decrease (dollars), x
0 5 10 15 20
Revenue ($1000s), y
470 630 690 650 510
30. Time (hours), x 0 1 2 3 4
Height (feet), y 40 42 44 46 48
31. Time (hours), x 1 2 3 4 5
Population (hundreds), y
2 4 8 16 32
32. Time (days), x 0 1 2 3 4
Height (feet), y 320 303 254 173 60
33. PROBLEM SOLVING The graph shows the number y of
students absent from school due to the fl u each day x.
Flu Epidemic
Nu
mb
er o
f st
ud
ents
0
4
8
12
16
y
Days4 6 8 10 12 x2
(0, 1)
(6, 19)
0
a. Interpret the meaning of the vertex in this
situation.
b. Write an equation for the parabola to predict the
number of students absent on day 10.
c. Compare the average rates of change in the
students with the fl u from 0 to 6 days and
6 to 11 days.
34. THOUGHT PROVOKING Describe a real-life situation
that can be modeled by a quadratic equation. Justify
your answer.
35. PROBLEM SOLVING The table shows the heights y of
a competitive water-skier x seconds after jumping off
a ramp. Write a function that models the height of the
water-skier over time. When is the water-skier 5 feet
above the water? How long is the skier in the air?
Time (seconds), x 0 0.25 0.75 1 1.1
Height (feet), y 22 22.5 17.5 12 9.24
36. HOW DO YOU SEE IT? Use the graph to determine
whether the average rate of change over each interval
is positive, negative, or zero.
x
y
4
6
8
4 62−2
a. 0 ≤ x ≤ 2 b. 2 ≤ x ≤ 5
c. 2 ≤ x ≤ 4 d. 0 ≤ x ≤ 4
37. REPEATED REASONING The table shows the number
of tiles in each fi gure. Verify that the data show a
quadratic relationship. Predict the number of tiles in
the 12th fi gure.
Figure 1 Figure 2 Figure 3 Figure 4
Figure 1 2 3 4
Number of Tiles 1 5 11 19
Int_Math3_PE_02.07.indd 98Int_Math3_PE_02.07.indd 98 1/30/15 2:11 PM1/30/15 2:11 PM

2.5–2.7 What Did You Learn?
Core VocabularyCore Vocabularyquadratic function, p. 74parabola, p. 74vertex of a parabola, p. 76
vertex form, p. 76axis of symmetry, p. 82standard form, p. 82
minimum value, p. 84maximum value, p. 84intercept form, p. 85
Core ConceptsCore ConceptsSection 2.5Horizontal Translations, p. 74Vertical Translations, p. 74Refl ections in the x-Axis, p. 75
Refl ections in the y-Axis, p. 75Horizontal Stretches and Shrinks, p. 75Vertical Stretches and Shrinks, p. 75
Section 2.6Properties of the Graph of f(x) = ax2 + bx + c, Properties of the Graph of f(x) = a(x − p)(x − q), p. 83 p. 85Minimum and Maximum Values, p. 84
Section 2.7Writing Quadratic Equations, p. 92 Writing Quadratic Equations to Model Data, p. 94
Mathematical PracticesMathematical Practices1. Why does the height you found in Exercise 44 on page 79 make sense in the context
of the situation?
2. How can you use technology to deepen your understanding of the concepts in
Exercise 83 on page 90?
3. Describe how you were able to construct a viable argument in Exercise 28 on page 97.
Performance Task:
Changing the CourseDesigners of motocross races use mathematics to create ramps and jumps for their courses. How could you modify their models so that riders will catch more air on your track?
To explore the answer to this question and more, check out the Performance Task and Real-Life STEM video at BigIdeasMath.com.
99
Int_Math3_PE_02.EC.indd 99Int_Math3_PE_02.EC.indd 99 1/30/15 2:11 PM1/30/15 2:11 PM

22 Chapter Review Dynamic Solutions available at BigIdeasMath.com
Parent Functions and Transformations (pp. 39–46)
Graph g(x) = (x − 2)2 + 1 and its parent function. Then describe the transformation.
The function g is a quadratic function.
x
y
4
2
42−2−4
f g The graph of g is a translation 2 units right and 1 unit up
of the graph of the parent quadratic function.
Graph the function and its parent function. Then describe the transformation.
1. f(x) = x + 3 2. g(x) = ∣ x ∣ − 1 3. h(x) = 1 —
2 x2
4. h(x) = 4 5. f(x) = − ∣ x ∣ − 3 6. g(x) = −3(x + 3)2
Transformations of Linear and Absolute Value Functions (pp. 47–54)
Let the graph of g be a translation 2 units to the right followed by a refl ection in the y-axis of the graph of f(x) = ∣ x ∣ . Write a rule for g.
Step 1 First write a function h that represents the translation of f.
h(x) = f(x − 2) Subtract 2 from the input.
= ∣ x − 2 ∣ Replace x with x − 2 in f(x).
Step 2 Then write a function g that represents the refl ection of h.
g(x) = h(−x) Multiply the input by −1.
= ∣ −x − 2 ∣ Replace x with −x in h(x).
= ∣ −(x + 2) ∣ Factor out −1.
= ∣ −1 ∣ ⋅ ∣ x + 2 ∣ Product Property of Absolute Value
= ∣ x + 2 ∣ Simplify.
The transformed function is g(x) = ∣ x + 2 ∣ .
Write a function g whose graph represents the indicated transformations of the graph of f. Use a graphing calculator to check your answer.
7. f(x) = ∣ x ∣ ; refl ection in the x-axis followed by a translation 4 units to the left
8. f(x) = ∣ x ∣ ; vertical shrink by a factor of 1 —
2 followed by a translation 2 units up
9. f(x) = x; translation 3 units down followed by a refl ection in the y-axis
2.1
2.2
100 Chapter 2 Linear and Quadratic Functions
Int_Math3_PE_02.EC.indd 100Int_Math3_PE_02.EC.indd 100 1/30/15 2:11 PM1/30/15 2:11 PM

Modeling with Linear Functions (pp. 55–62)
The table shows the numbers of ice cream cones sold for different outside temperatures (in degrees Fahrenheit). Do the data show a linear relationship? If so, write an equation of a line of fi t and use it to estimate how many ice cream cones are sold when the temperature is 60°F.
Temperature, x 53 62 70 82 90
Number of cones, y 90 105 117 131 147
Step 1 Create a scatter plot of the data. The data show a Ice Cream Cones Sold
Nu
mb
er o
f co
nes
Temperature (°F)x
y
40
0
80
120
160
20 40 60 800
(70, 117)
(90, 147)
linear relationship.
Step 2 Sketch the line that appears to most closely fi t the data.
One possibility is shown.
Step 3 Choose two points on the line. For the line shown,
you might choose (70, 117) and (90, 147).
Step 4 Write an equation of the line. First, fi nd the slope.
m = y2 − y1 — x2 − x1
= 147 − 117
— 90 − 70
= 30
— 20
= 1.5
Use point-slope form to write an equation.
Use (x1, y1) = (70, 117).
y − y1 = m(x − x1) Point-slope form
y − 117 = 1.5(x − 70) Substitute for m, x1, and y1.
y − 117 = 1.5x − 105 Distributive Property
y = 1.5x + 12 Add 117 to each side.
Use the equation to estimate the number of ice cream cones sold.
y = 1.5(60) + 12 Substitute 60 for x.
= 102 Simplify.
Approximately 102 ice cream cones are sold when the temperature is 60°F.
Write an equation of the line.
10. The table shows the total number y (in billions) of U.S. movie admissions each year for
x years. Use a graphing calculator to fi nd an equation of the line of best fi t for the data.
Year, x 0 2 4 6 8 10
Admissions, y 1.24 1.26 1.39 1.47 1.49 1.57
11. You ride your bike and measure how far you travel. After 10 minutes, you travel 3.5 miles.
After 30 minutes, you travel 10.5 miles. Write an equation to model your distance. How far
can you ride your bike in 45 minutes?
2.3
Chapter 2 Chapter Review 101
Int_Math3_PE_02.EC.indd 101Int_Math3_PE_02.EC.indd 101 1/30/15 2:12 PM1/30/15 2:12 PM

Solving Linear Systems (pp. 63–70)
Solve the system.
x − y + z = −3 Equation 1
2x − y + 5z = 4 Equation 2
4x + 2y − z = 2 Equation 3
Step 1 Rewrite the system as a linear system in two variables.
x − y + z = −3 Add Equation 1 toEquation 3 (to eliminate z).
4x + 2y − z = 2
5x + y = −1 New Equation 3
−5x + 5y − 5z = 15 Add −5 times Equation 1 toEquation 2 (to eliminate z).
2x − y + 5z = 4
−3x + 4y = 19 New Equation 2
Step 2 Solve the new linear system for both of its variables.
−20x − 4y = 4 Add −4 times new Equation 3to new Equation 2.−3x + 4y = 19
−23x = 23
x = −1 Solve for x.
y = 4 Substitute into new Equation 2 or 3 to fi nd y.
Step 3 Substitute x = −1 and y = 4 into an original equation and solve for z.
x − y + z = −3 Write original Equation 1.
(−1) − 4 + z = −3 Substitute −1 for x and 4 for y.
z = 2 Solve for z.
The solution is x = −1, y = 4, and z = 2, or the ordered triple (−1, 4, 2).
Solve the system. Check your solution, if possible.
12. x + y + z = 3 13. 2x − 5y − z = 17 14. x + y + z = 2
−x + 3y + 2z = −8 x + y + 3z = 19 2x − 3y + z = 11
x = 4z −4x + 6y + z = −20 −3x + 2y − 2z = −13
15. x + 4y − 2z = 3 16. x − y + 3z = 6 17. x + 2z = 4
x + 3y + 7z = 1 x − 2y = 5 x + y + z = 6
2x + 9y − 13z = 2 2x − 2y + 5z = 9 3x + 3y + 4z = 28
18. A school band performs a spring concert for a crowd of
600 people. The revenue for the concert is $3150. There
are 150 more adults at the concert than students. How
many of each type of ticket are sold?
2.4
BAND CONCERTSTUDENTS - $3 ADULTS - $7
CHILDREN UNDER 12 - $2
102 Chapter 2 Linear and Quadratic Functions
Int_Math3_PE_02.EC.indd 102Int_Math3_PE_02.EC.indd 102 1/30/15 2:12 PM1/30/15 2:12 PM

Transformations of Quadratic Functions (pp. 73–80)
Let the graph of g be a translation 1 unit left and 2 units up of the graph of f(x) = x2 + 1. Write a rule for g.
g(x) = f(x − (−1)) + 2 Subtract −1 from the input. Add 2 to the output.
= (x + 1)2 + 1 + 2 Replace x with x + 1 in f(x).
= x2 + 2x + 4 Simplify.
The transformed function is g(x) = x2 + 2x + 4.
Describe the transformation of f(x) = x2 represented by g. Then graph each function.
19. g(x) = (x + 4)2 20. g(x) = (x − 7)2 + 2 21. g(x) = −3(x + 2)2 − 1
Write a rule for g.
22. Let the graph of g be a horizontal shrink by a factor of 2 —
3 , followed by a translation
5 units left and 2 units down of the graph of f(x) = x2.
23. Let the graph of g be a translation 2 units left and 3 units up, followed by a refl ection
in the y-axis of the graph of f (x) = x2 − 2x.
Characteristics of Quadratic Functions (pp. 81–90)
Graph f(x) = 2x2 − 8x + 1. Label the vertex and axis of symmetry.
Step 1 Identify the coeffi cients a = 2, b = −8, and c = 1.
Because a > 0, the parabola opens up.
Step 2 Find the vertex. First calculate the x-coordinate.
x = − b —
2a = −
−8 —
2(2) = 2
Then fi nd the y-coordinate of the vertex.
f(2) = 2(2)2 − 8(2) + 1 = −7
So, the vertex is (2, −7). Plot this point.
Step 3 Draw the axis of symmetry x = 2.
Step 4 Identify the y-intercept c, which is 1. Plot the point (0, 1) and its refl ection
in the axis of symmetry, (4, 1).
Step 5 Evaluate the function for another value of x, such as x = 1.
f (1) = 2(1)2 − 8(1) + 1 = −5
Plot the point (1, −5) and its refl ection in the axis of symmetry, (3, −5).
Step 6 Draw a parabola through the plotted points.
Graph the function. Label the vertex and axis of symmetry. Find the minimum or maximum value of f. Describe where the function is increasing and decreasing.
24. f (x) = 3(x − 1)2 − 4 25. g(x) = −2x2 + 16x + 3 26. h(x) = (x − 3)(x + 7)
2.5
2.6
x
y
−4
−6
(2,−7)
−2
6−2
x = 2
Chapter 2 Chapter Review 103
Int_Math3_PE_02.EC.indd 103Int_Math3_PE_02.EC.indd 103 1/30/15 2:12 PM1/30/15 2:12 PM
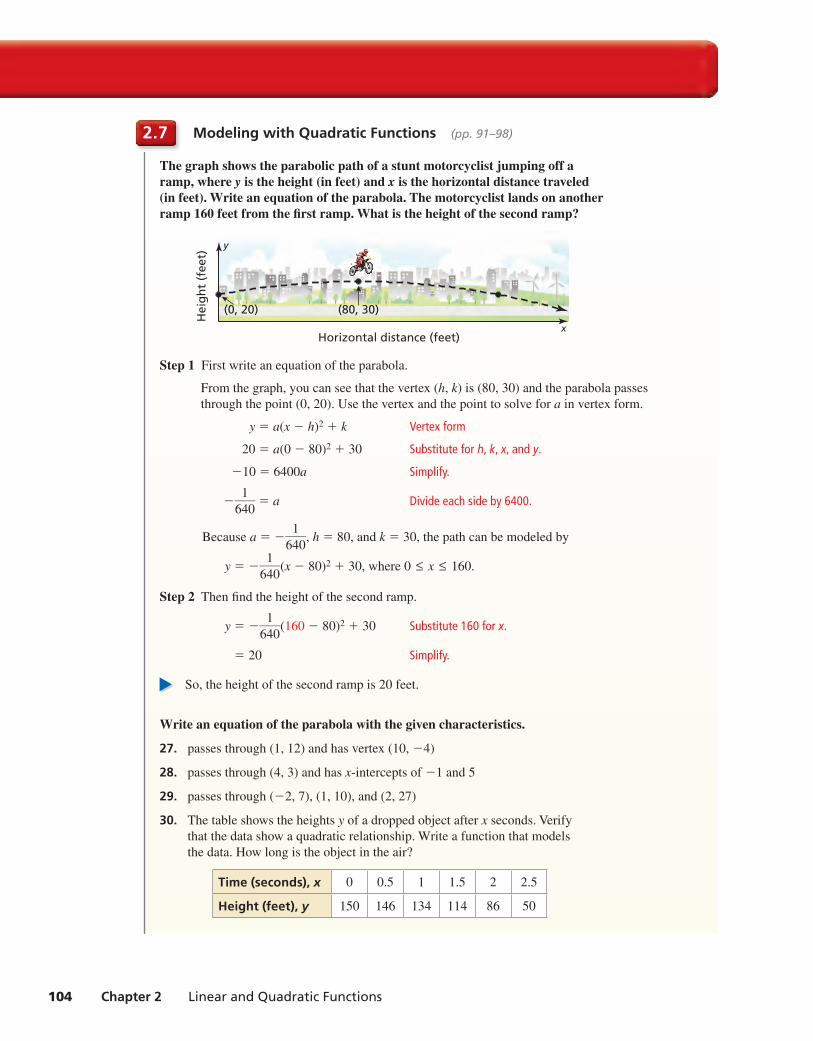
Modeling with Quadratic Functions (pp. 91–98)
The graph shows the parabolic path of a stunt motorcyclist jumping off a ramp, where y is the height (in feet) and x is the horizontal distance traveled (in feet). Write an equation of the parabola. The motorcyclist lands on another ramp 160 feet from the fi rst ramp. What is the height of the second ramp?
x
y
(0, 20) (80, 30)
Horizontal distance (feet)
Hei
gh
t (f
eet)
Step 1 First write an equation of the parabola.
From the graph, you can see that the vertex (h, k) is (80, 30) and the parabola passes
through the point (0, 20). Use the vertex and the point to solve for a in vertex form.
y = a(x − h)2 + k Vertex form
20 = a(0 − 80)2 + 30 Substitute for h, k, x, and y.
−10 = 6400a Simplify.
− 1 —
640 = a Divide each side by 6400.
Because a = − 1 —
640 , h = 80, and k = 30, the path can be modeled by
y = − 1 —
640 (x − 80)2 + 30, where 0 ≤ x ≤ 160.
Step 2 Then fi nd the height of the second ramp.
y = − 1 —
640 (160 − 80)2 + 30 Substitute 160 for x.
= 20 Simplify.
So, the height of the second ramp is 20 feet.
Write an equation of the parabola with the given characteristics.
27. passes through (1, 12) and has vertex (10, −4)
28. passes through (4, 3) and has x-intercepts of −1 and 5
29. passes through (−2, 7), (1, 10), and (2, 27)
30. The table shows the heights y of a dropped object after x seconds. Verify
that the data show a quadratic relationship. Write a function that models
the data. How long is the object in the air?
Time (seconds), x 0 0.5 1 1.5 2 2.5
Height (feet), y 150 146 134 114 86 50
2.7
104 Chapter 2 Linear and Quadratic Functions
Int_Math3_PE_02.EC.indd 104Int_Math3_PE_02.EC.indd 104 1/30/15 2:12 PM1/30/15 2:12 PM

Chapter Test22Graph the function and its parent function. Then describe the transformation.
1. f(x) = ∣ x − 1 ∣ 2. f(x) = (3x)2 3. f(x) = − 1 —
2 x − 4
Match the transformation of f(x) = x with its graph. Then write a rule for g.
4. g(x) = 2f(x) + 3 5. g(x) = 3f(x) − 2 6. g(x) = −2f(x) − 3
A.
x
y4
2
−4
42−2−4
B.
x
y4
−4
−2
42−4
C.
x
y4
2
−2
42−2−4
7. Graph f(x) = 8x2 − 4x + 3. Label the vertex and axis of symmetry. Describe where the
function is increasing and decreasing.
8. Let the graph of g be a translation 2 units left and 1 unit down, followed by a refl ection in
the y-axis of the graph of f(x) = (2x + 1)2 − 4. Write a rule for g.
Write a linear function or a quadratic function that models the data.
9. 10.
Solve the system. Check your solution, if possible.
11. −2x + y + 4z = 5 12. y = 1 —
2 z 13. x − y + 5z = 3
x + 3y − z = 2 x + 2y + 5z = 2 2x + 3y − z = 2
4x + y − 6z = 11 3x + 6y − 3z = 9 −4x − y − 9z = −8
14. The graph of a quadratic function f has an axis of symmetry x = 3 and passes through the
point (0, 6). Find another point that lies on the parabola. Then write an equation of the
parabola when the minimum value of f is −4.
15. A passenger on a stranded lifeboat shoots a distress fl are into the air. The
height (in feet) of the fl are above the water is given by f(t) = −16t(t − 8),
where t is time (in seconds) since the fl are was shot. The passenger shoots a
second fl are, whose path is modeled in the graph. Which fl are travels higher?
Which remains in the air longer? Justify your answer.
16. A surfboard shop sells 40 surfboards per month when it charges $500 per
surfboard. Each time the shop decreases the price by $10, it sells 1 additional
surfboard per month. How much should the shop charge per surfboard to
maximize the amount of money earned? What is the maximum amount the
shop can earn per month? Explain.
x −2 −1 0 1 2
f (x) −1 3 7 11 15
x 2 4 6 8 10
f (x) 0 −13 −34 −63 −100
x
y
(0, 0) (7, 0)
(3.5, 196)
Chapter 2 Chapter Test 105
Int_Math3_PE_02.EC.indd 105Int_Math3_PE_02.EC.indd 105 1/30/15 2:12 PM1/30/15 2:12 PM

22 Cumulative Assessment
1. The function g(x) = 1 —
2 ∣ x − 4 ∣ + 4 is a combination of transformations of f(x) = ∣ x ∣ .
Which combinations describe the transformation from the graph of f to the graph of g?
○A translation 4 units right and vertical shrink by a factor of 1 —
2 , followed by a translation 4 units up
○B translation 4 units right and 4 units up, followed by a vertical shrink by a factor of 1 —
2
○C vertical shrink by a factor of 1 —
2 , followed by a translation 4 units up and 4 units right
○D translation 4 units right and 8 units up, followed by a vertical shrink by a factor of 1 —
2
2. Two balls are thrown in the air. The path of the fi rst ball is represented in the graph. The
second ball is released 1.5 feet higher than the fi rst ball and after 3 seconds reaches its
maximum height 5 feet lower than the fi rst ball.
x
y
40
20
0
60
42
Time (seconds)
Hei
gh
t (f
eet)
0 6(0, 5)
(3, 56.5)
Ball Toss
a. Write an equation for the path of the second ball.
b. Do the balls hit the ground at the same time? If so, how long are the balls in the air?
If not, which ball hits the ground fi rst? Explain your reasoning.
3. The paper clip is made from cylindrical metal wire with a diameter of 1 millimeter.
The density of the metal is about 7.8 grams per cubic centimeter. Approximate the
mass of the paper clip to the nearest gram. Explain your procedure.
41 mm
8 mm6 mm7 mm
31 mm
31 mm24 mm
4. Gym A charges $10 per month plus an initiation fee of $100. Gym B charges
$30 per month, but due to a special promotion, is not currently charging an
initiation fee.
a. Write an equation for each gym modeling the total cost y for a membership
lasting x months.
b. When is it more economical for a person to choose Gym A over Gym B?
c. Gym A lowers its initiation fee to $25. Describe the transformation this change
represents and how it affects your decision in part (b).
106 Chapter 2 Linear and Quadratic Functions
Int_Math3_PE_02.EC.indd 106Int_Math3_PE_02.EC.indd 106 1/30/15 2:12 PM1/30/15 2:12 PM

5. Let the graph of g be a translation 3 units right of the graph of f. The points (−1, 6), (3, 14),
and (6, 41) lie on the graph of f. Which points lie on the graph of g?
○A (2, 6) ○B (2, 11) ○C (6, 14)
○D (6, 19) ○E (9, 41) ○F (9, 46)
6. Draw a two-dimensional fi gure and an axis that produce a cylinder with a volume of 48π
cubic feet when you rotate the fi gure around the axis.
7. You make DVDs of three types of shows: comedy, drama, and reality-based. An episode of
a comedy lasts 30 minutes, while a drama and a reality-based episode each last 60 minutes.
The DVDs can hold 360 minutes of programming.
a. You completely fi ll a DVD with seven episodes and include twice as many episodes of
a drama as a comedy. Create a system of equations that models the situation.
b. How many episodes of each type of show are on the DVD in part (a)?
c. You completely fi ll a second DVD with only six episodes. Do the two DVDs have a
different number of comedies? dramas? reality-based episodes? Explain.
8. The graphs of f and g intersect at (2, −2). Explain how you can use this point to fi nd the
solution of the equation f(x) = g(x). Extend the tables to justify your answer.
x f(x)
−5 −23
−4 −20
−3 −17
−2 −14
x g(x)
−2 −18
−1 −14
0 −10
1 −6
9. You are building a rectangular deck against a house. You want the deck to have an area
of 200 square feet. Draw a diagram of the deck including the location of the house that
minimizes the amount of railing that you need to build for the three sides of the deck not
against the house. Include a 4-foot-wide opening in the railing for stairs. How many feet
of railing do you need?
10. Order the cross sections of the planes intersecting the rectangular prism from least area to
greatest area. The length and width of the prism are equal.
A. B. C.
Chapter 2 Cumulative Assessment 107
Int_Math3_PE_02.EC.indd 107Int_Math3_PE_02.EC.indd 107 1/30/15 2:12 PM1/30/15 2:12 PM
Related Documents