12 2 How to measure pollution 2.1 Measuring pollution is more difficult than you think For effective measuring of pollution, a number of questions need to be answered. 2.1.1 Measuring – what are we going to measure? Determination the concentrations of a pollutant: The most straightforward measurements, and probably the first to be collected in every study, are concentrations of a given pollutant in the environment (the atmosphere, the soil or the seawater). Concentrations can be expressed in different ways. Determination of the half-life of a pollutant to know its persistence: - The half-life of a pollutant is the time for half of a certain quantity of the compound to disappear from the environment. - Many substances may be degraded, either chemically (due to solar radiation or heat) or biologically (mostly due to bacteria and fungi), but the molecules that are formed as intermediates or end products of this degradation process may be equally toxic for the environment. - It may be useful to know how fast a substance is degraded in this environment: this is called the persistence of a pollutant. - It is also useful to look at what is left of the original pollutant. Measuring the bioavailability of a pollutant The extent to which a pollutant exists in a form that is accessible by living tissue, is called its bioavailability ( ). However, pollutants can undergo a number of physicochemical transformations, and not every form of every substance is easily taken up by living cells. Processes influencing the availability of a chemical compound in an ecosystem Figure 2-1 gives a good overview of what may be happening with a specific amount of a pollutant in an aquatic ecosystem. - It may be adsorbed to the surface of soil or sediment particles, in solution or in a precipitate with another compound. - Lightweight compounds such as chloroform may be volatile enough to escape the water phase. - A number of substances are chemically unstable under the given conditions and break down spontaneously, or become oxidized. - Others will be broken down by the organisms in the ecosystem (biotransformation) or rendered harmless through a complexation with certain molecules of biological origin (e.g. metallothioneins, proteins that are able to form complexes with heavy metals).

Welcome message from author
This document is posted to help you gain knowledge. Please leave a comment to let me know what you think about it! Share it to your friends and learn new things together.
Transcript
12
2 How to measure pollution2.1 Measuring pollution is more difficult than you thinkFor effective measuring of pollution, a number of questions need to be answered.
2.1.1 Measuring – what are we going to measure?Determination the concentrations of a pollutant: The most straightforwardmeasurements, and probably the first to be collected in every study, areconcentrations of a given pollutant in the environment (the atmosphere, the soil orthe seawater). Concentrations can be expressed in different ways.
Determination of the half-life of a pollutant to know its persistence:− The half-life of a pollutant is the time for half of a certain quantity of the
compound to disappear from the environment.− Many substances may be degraded, either chemically (due to solar radiation or
heat) or biologically (mostly due to bacteria and fungi), but the molecules thatare formed as intermediates or end products of this degradation process may beequally toxic for the environment.
− It may be useful to know how fast a substance is degraded in this environment:this is called the persistence of a pollutant.
− It is also useful to look at what is left of the original pollutant.
Measuring the bioavailability of a pollutantThe extent to which a pollutant exists in a form that is accessible by living tissue, iscalled its bioavailability ( ). However, pollutants can undergo anumber of physicochemical transformations, and not every form of every substance iseasily taken up by living cells.
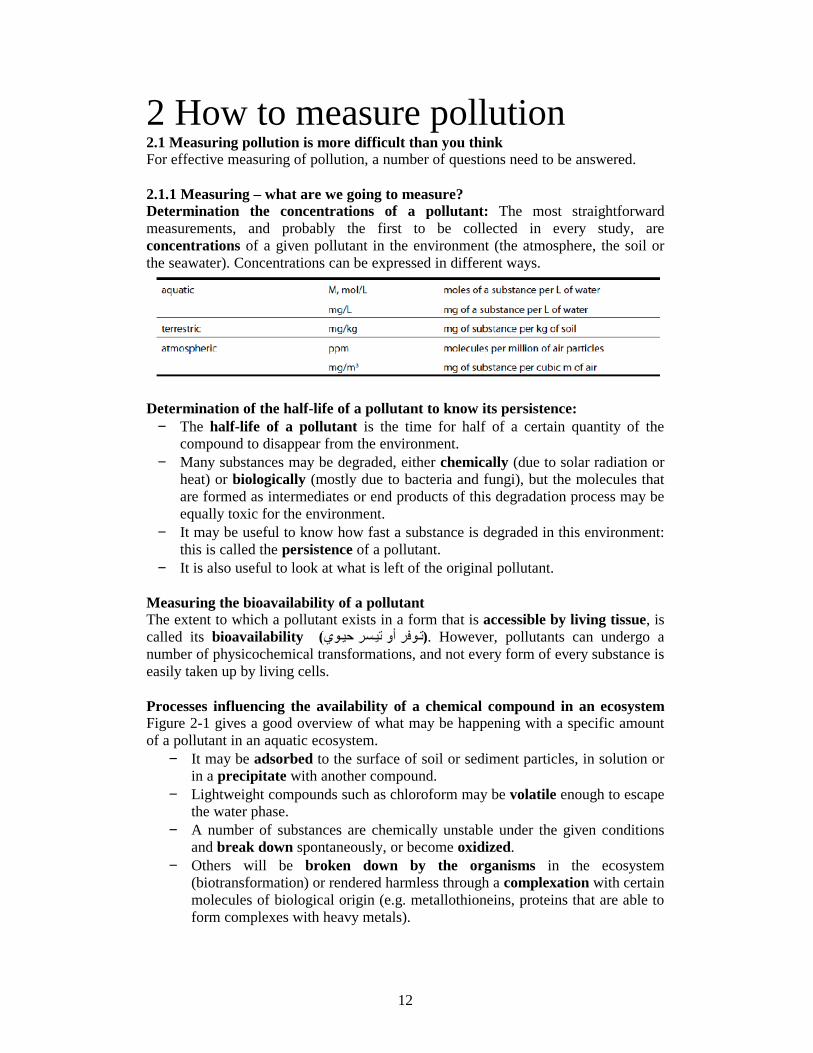
Processes influencing the availability of a chemical compound in an ecosystemFigure 2-1 gives a good overview of what may be happening with a specific amountof a pollutant in an aquatic ecosystem.
− It may be adsorbed to the surface of soil or sediment particles, in solution orin a precipitate with another compound.
− Lightweight compounds such as chloroform may be volatile enough to escapethe water phase.
− A number of substances are chemically unstable under the given conditionsand break down spontaneously, or become oxidized.
− Others will be broken down by the organisms in the ecosystem(biotransformation) or rendered harmless through a complexation with certainmolecules of biological origin (e.g. metallothioneins, proteins that are able toform complexes with heavy metals).
13
Figure 2-1. Processes influencing the availability of a chemical compound in an ecosystem.
Each of these transformations follows the laws of dynamic equilibrium. Differentconstants (specific for each individual pollutant) can be used to describe them, e.g.:solubility constant, vapor pressure, adsorption coefficient or the octanol/waterpartition coefficient for the distribution between a water phase and an organic solvent(e.g. n-octanol).
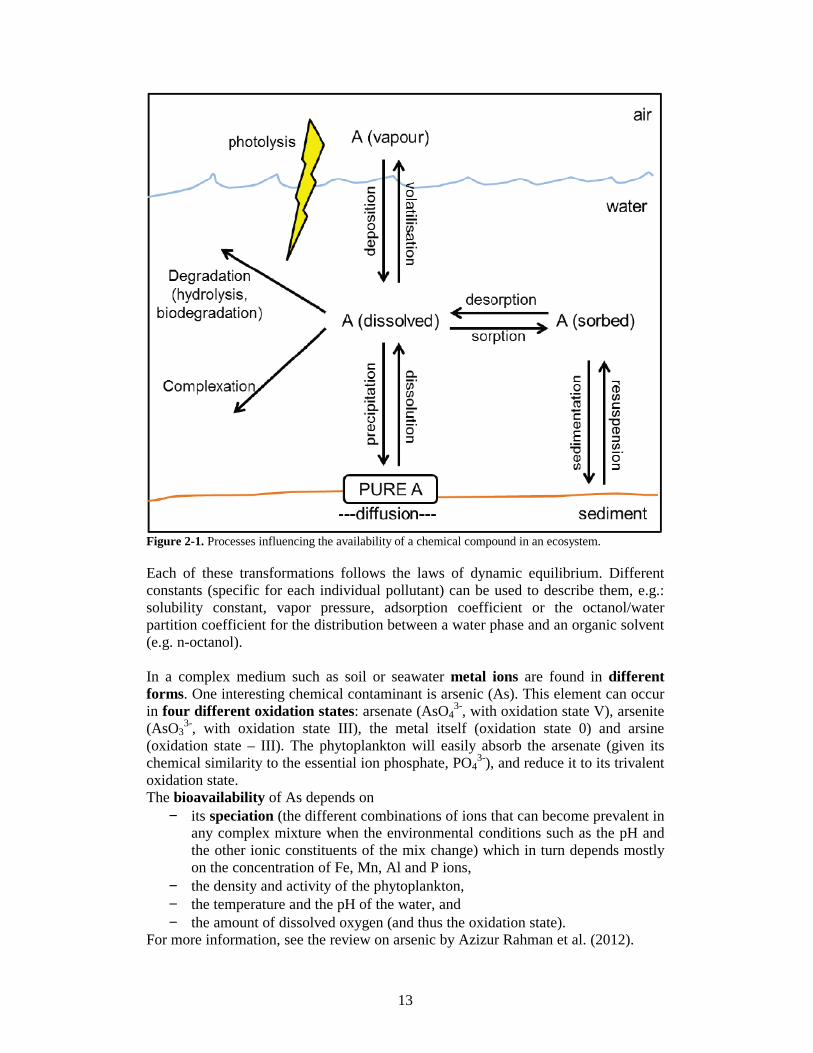
In a complex medium such as soil or seawater metal ions are found in differentforms. One interesting chemical contaminant is arsenic (As). This element can occurin four different oxidation states: arsenate (AsO4
3-, with oxidation state V), arsenite(AsO3
3-, with oxidation state III), the metal itself (oxidation state 0) and arsine(oxidation state – III). The phytoplankton will easily absorb the arsenate (given itschemical similarity to the essential ion phosphate, PO4
3-), and reduce it to its trivalentoxidation state.The bioavailability of As depends on
− its speciation (the different combinations of ions that can become prevalent inany complex mixture when the environmental conditions such as the pH andthe other ionic constituents of the mix change) which in turn depends mostlyon the concentration of Fe, Mn, Al and P ions,
− the density and activity of the phytoplankton,− the temperature and the pH of the water, and− the amount of dissolved oxygen (and thus the oxidation state).
For more information, see the review on arsenic by Azizur Rahman et al. (2012).
14
Figure 2-2. Several physicochemical and biological transformations of As in a marine ecosystem (afterAzizur Rahman et al. 2012).
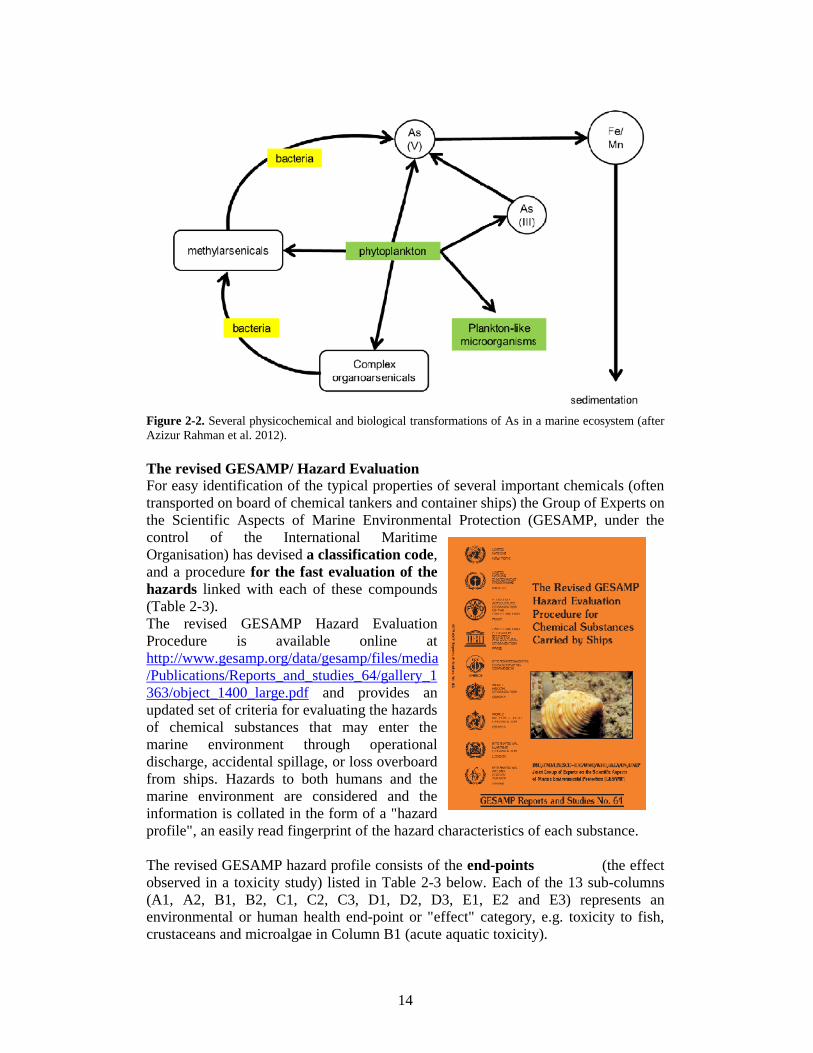
The revised GESAMP/ Hazard EvaluationFor easy identification of the typical properties of several important chemicals (oftentransported on board of chemical tankers and container ships) the Group of Experts onthe Scientific Aspects of Marine Environmental Protection (GESAMP, under thecontrol of the International MaritimeOrganisation) has devised a classification code,and a procedure for the fast evaluation of thehazards linked with each of these compounds(Table 2-3).The revised GESAMP Hazard EvaluationProcedure is available online athttp://www.gesamp.org/data/gesamp/files/media/Publications/Reports_and_studies_64/gallery_1363/object_1400_large.pdf and provides anupdated set of criteria for evaluating the hazardsof chemical substances that may enter themarine environment through operationaldischarge, accidental spillage, or loss overboardfrom ships. Hazards to both humans and themarine environment are considered and theinformation is collated in the form of a "hazardprofile", an easily read fingerprint of the hazard characteristics of each substance.
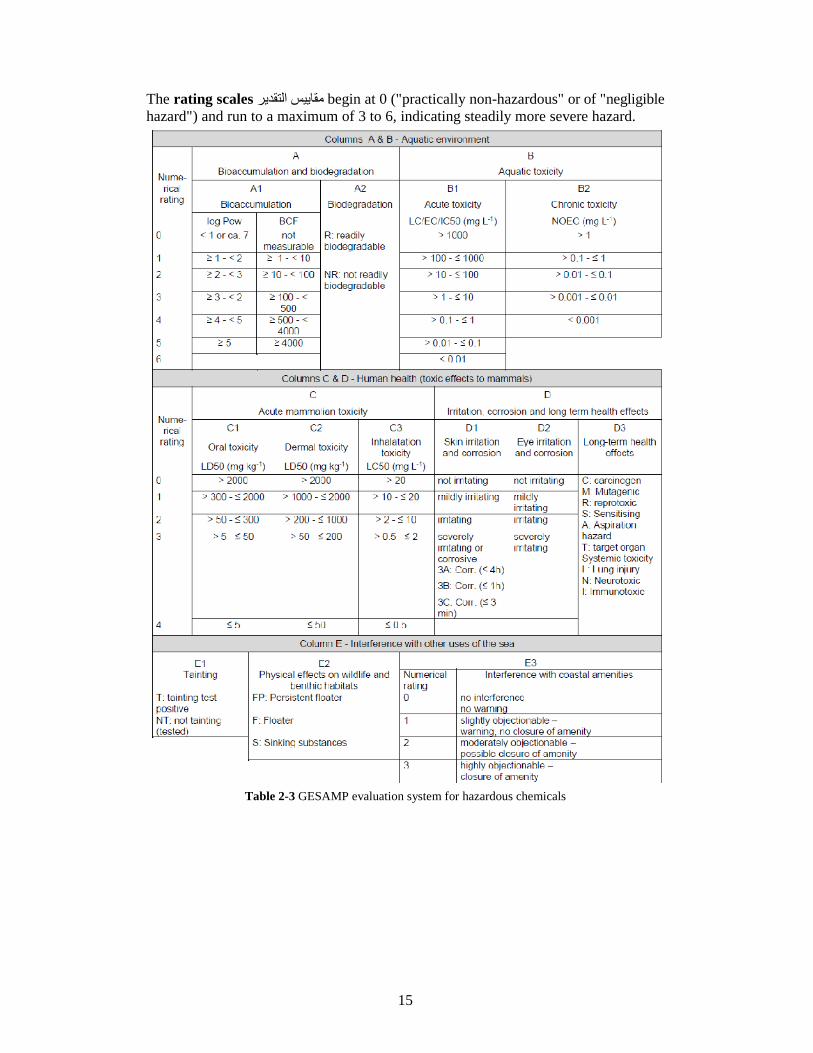
The revised GESAMP hazard profile consists of the end-points تعادل انق ط ال (the effectobserved in a toxicity study) listed in Table 2-3 below. Each of the 13 sub-columns(A1, A2, B1, B2, C1, C2, C3, D1, D2, D3, E1, E2 and E3) represents anenvironmental or human health end-point or "effect" category, e.g. toxicity to fish,crustaceans and microalgae in Column B1 (acute aquatic toxicity).
15
The rating scales تقدیرمقاییس ال begin at 0 ("practically non-hazardous" or of "negligiblehazard") and run to a maximum of 3 to 6, indicating steadily more severe hazard.
Table 2-3 GESAMP evaluation system for hazardous chemicals
16
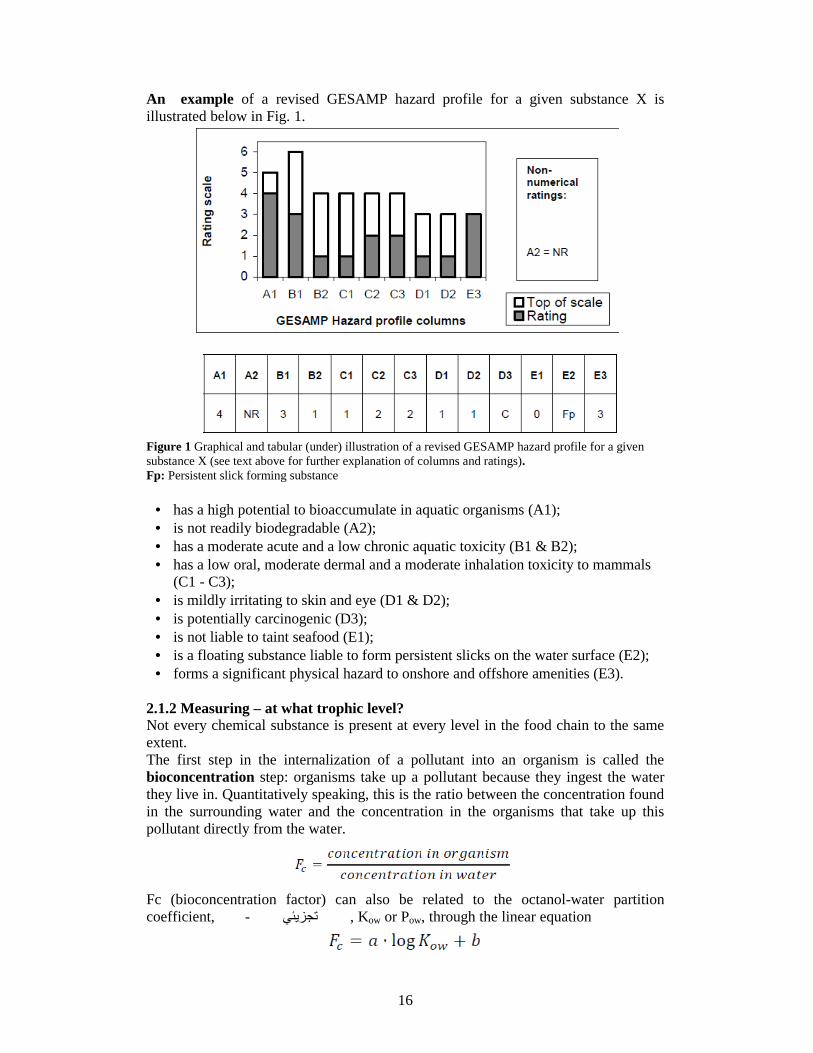
An example of a revised GESAMP hazard profile for a given substance X isillustrated below in Fig. 1.
Figure 1 Graphical and tabular (under) illustration of a revised GESAMP hazard profile for a givensubstance X (see text above for further explanation of columns and ratings).Fp: Persistent slick forming substance
• has a high potential to bioaccumulate in aquatic organisms (A1);• is not readily biodegradable (A2);• has a moderate acute and a low chronic aquatic toxicity (B1 & B2);• has a low oral, moderate dermal and a moderate inhalation toxicity to mammals
(C1 - C3);• is mildly irritating to skin and eye (D1 & D2);• is potentially carcinogenic (D3);• is not liable to taint seafood (E1);• is a floating substance liable to form persistent slicks on the water surface (E2);• forms a significant physical hazard to onshore and offshore amenities (E3).
2.1.2 Measuring – at what trophic level?Not every chemical substance is present at every level in the food chain to the sameextent.The first step in the internalization of a pollutant into an organism is called thebioconcentration step: organisms take up a pollutant because they ingest the waterthey live in. Quantitatively speaking, this is the ratio between the concentration foundin the surrounding water and the concentration in the organisms that take up thispollutant directly from the water.
Fc (bioconcentration factor) can also be related to the octanol-water partitioncoefficient, الماء-تانولأك تجزیئي ,معامل Kow or Pow, through the linear equation
17
It is the ratio of the compound's concentration in a known volume of n-octanol to itsconcentration in a known volume of water after the octanol and water have reached
equilibrium). at equilibrium
A partition coefficient, can be measured or estimated in a simple manner for organicchemicals. The living organism is replaced by n-octanol, which can be seen as representingthe fatty tissues of the fish, in particular the phospholipid bi-layers of the cell membranes.Usually, expressed as the logarithm to the base 10, it is referred to as the log Kow or log Pow. Itis one of the most important of a group of partition coefficients used to predict the behaviourof chemicals in environmental compartments. The log Pow does not apply to inorganicchemicals. It also serving as a measure for the lipophilicity of a compound
Organisms can also take up a certain pollutant by eating other organisms (their prey)which have already internalised the compound. This is called biomagnification, andis calculated as follows:
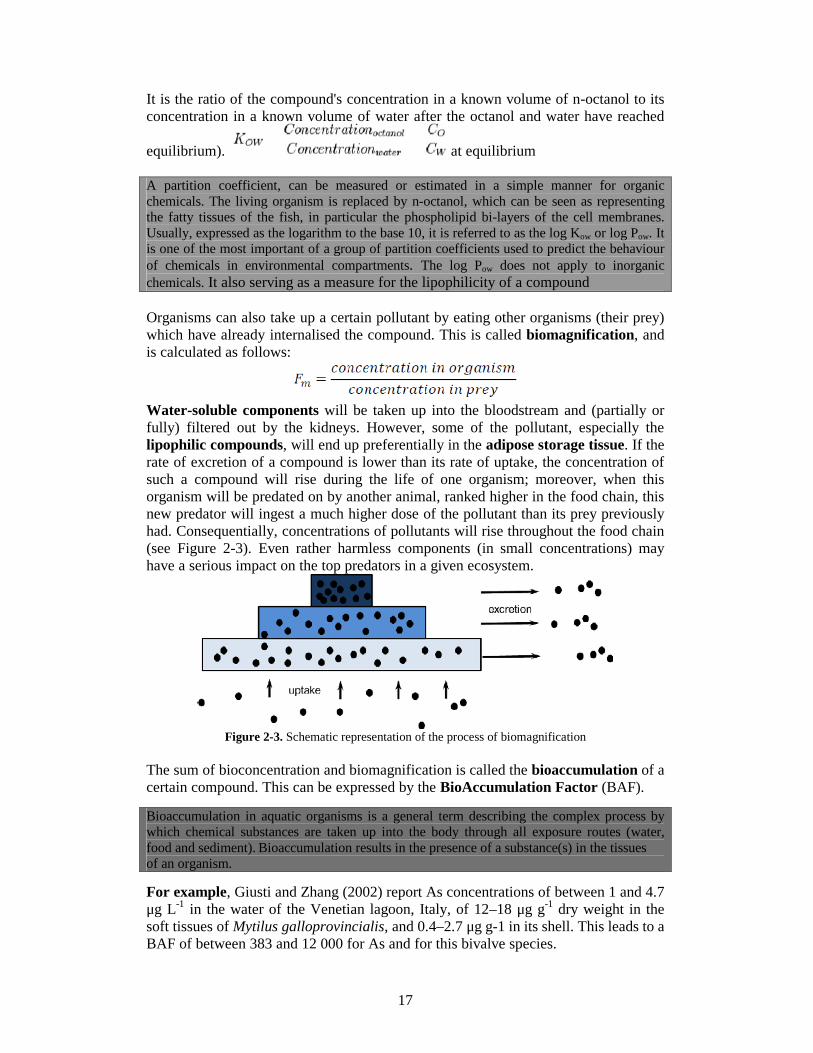
Water-soluble components will be taken up into the bloodstream and (partially orfully) filtered out by the kidneys. However, some of the pollutant, especially thelipophilic compounds, will end up preferentially in the adipose storage tissue. If therate of excretion of a compound is lower than its rate of uptake, the concentration ofsuch a compound will rise during the life of one organism; moreover, when thisorganism will be predated on by another animal, ranked higher in the food chain, thisnew predator will ingest a much higher dose of the pollutant than its prey previouslyhad. Consequentially, concentrations of pollutants will rise throughout the food chain(see Figure 2-3). Even rather harmless components (in small concentrations) mayhave a serious impact on the top predators in a given ecosystem.
Figure 2-3. Schematic representation of the process of biomagnification
The sum of bioconcentration and biomagnification is called the bioaccumulation of acertain compound. This can be expressed by the BioAccumulation Factor (BAF).
Bioaccumulation in aquatic organisms is a general term describing the complex process bywhich chemical substances are taken up into the body through all exposure routes (water,food and sediment). Bioaccumulation results in the presence of a substance(s) in the tissuesof an organism.
For example, Giusti and Zhang (2002) report As concentrations of between 1 and 4.7μg L-1 in the water of the Venetian lagoon, Italy, of 12–18 μg g-1 dry weight in thesoft tissues of Mytilus galloprovincialis, and 0.4–2.7 μg g-1 in its shell. This leads to aBAF of between 383 and 12 000 for As and for this bivalve species.
18
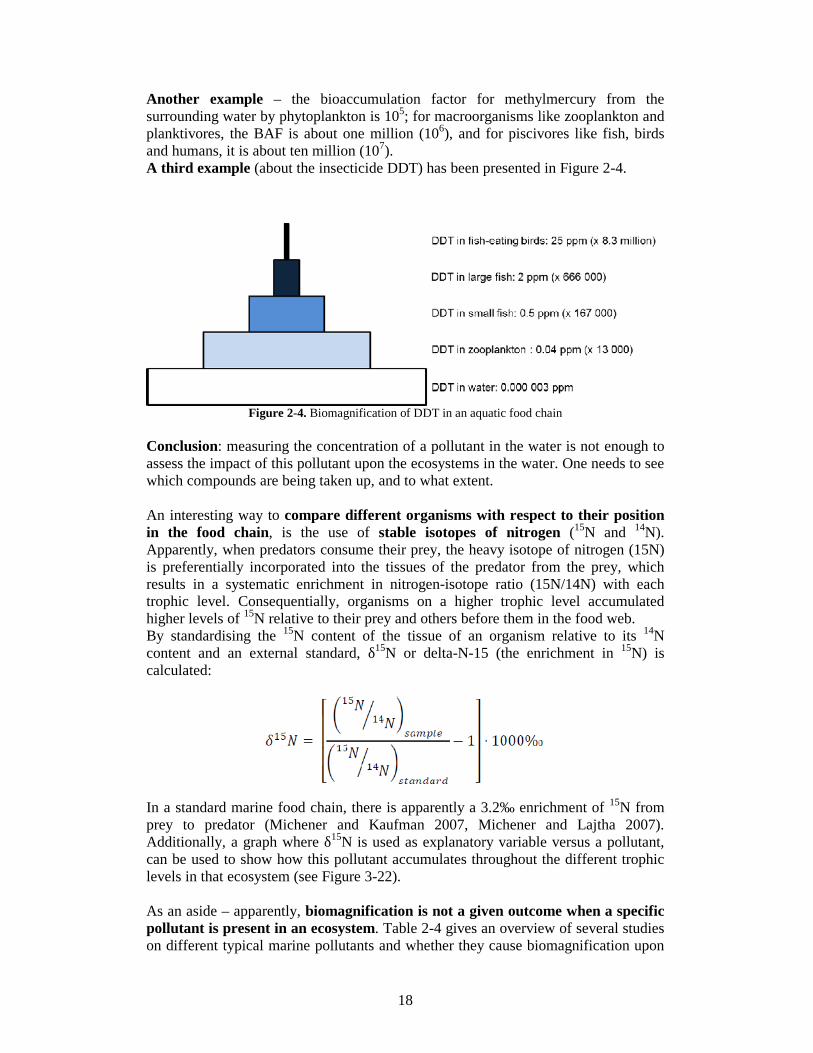
Another example – the bioaccumulation factor for methylmercury from thesurrounding water by phytoplankton is 105; for macroorganisms like zooplankton andplanktivores, the BAF is about one million (106), and for piscivores like fish, birdsand humans, it is about ten million (107).A third example (about the insecticide DDT) has been presented in Figure 2-4.
Figure 2-4. Biomagnification of DDT in an aquatic food chain
Conclusion: measuring the concentration of a pollutant in the water is not enough toassess the impact of this pollutant upon the ecosystems in the water. One needs to seewhich compounds are being taken up, and to what extent.
An interesting way to compare different organisms with respect to their positionin the food chain, is the use of stable isotopes of nitrogen (15N and 14N).Apparently, when predators consume their prey, the heavy isotope of nitrogen (15N)is preferentially incorporated into the tissues of the predator from the prey, whichresults in a systematic enrichment in nitrogen-isotope ratio (15N/14N) with eachtrophic level. Consequentially, organisms on a higher trophic level accumulatedhigher levels of 15N relative to their prey and others before them in the food web.By standardising the 15N content of the tissue of an organism relative to its 14Ncontent and an external standard, δ15N or delta-N-15 (the enrichment in 15N) iscalculated:
In a standard marine food chain, there is apparently a 3.2‰ enrichment of 15N fromprey to predator (Michener and Kaufman 2007, Michener and Lajtha 2007).Additionally, a graph where δ15N is used as explanatory variable versus a pollutant,can be used to show how this pollutant accumulates throughout the different trophiclevels in that ecosystem (see Figure 3-22).
As an aside – apparently, biomagnification is not a given outcome when a specificpollutant is present in an ecosystem. Table 2-4 gives an overview of several studieson different typical marine pollutants and whether they cause biomagnification upon
19
entrance in the food chain. For all of the pollutants, there are cases where nobiomagnification has been. How and why this is, requires further investigation.
Table 2-4. Variation in biomagnification studies Taken from Gray (2002)
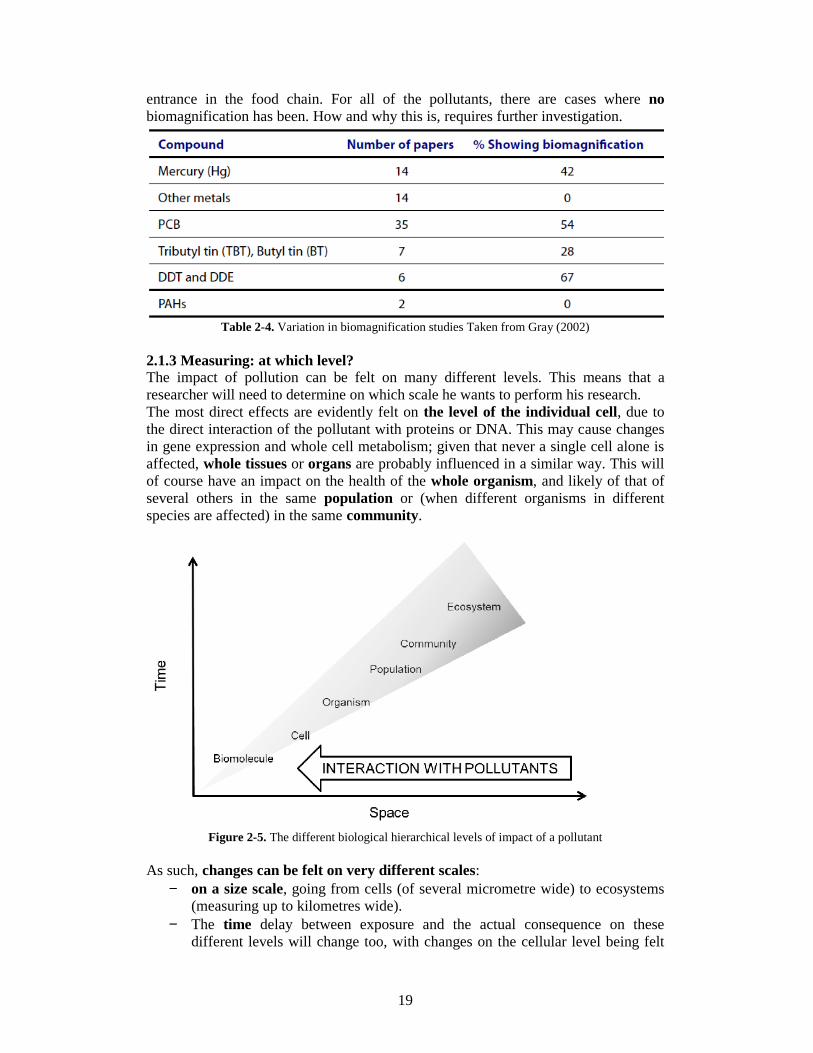
2.1.3 Measuring: at which level?The impact of pollution can be felt on many different levels. This means that aresearcher will need to determine on which scale he wants to perform his research.The most direct effects are evidently felt on the level of the individual cell, due tothe direct interaction of the pollutant with proteins or DNA. This may cause changesin gene expression and whole cell metabolism; given that never a single cell alone isaffected, whole tissues or organs are probably influenced in a similar way. This willof course have an impact on the health of the whole organism, and likely of that ofseveral others in the same population or (when different organisms in differentspecies are affected) in the same community.
Figure 2-5. The different biological hierarchical levels of impact of a pollutant
As such, changes can be felt on very different scales:− on a size scale, going from cells (of several micrometre wide) to ecosystems
(measuring up to kilometres wide).− The time delay between exposure and the actual consequence on these
different levels will change too, with changes on the cellular level being felt
20
within seconds or minutes after exposure, while it may take months or evenyears before the effect of a pollutant on ecosystems can be demonstrated.
− measuring changes at the level of cells and organs are done rather quicklyand give a lot of mechanistic biochemical information, while ecosystemchanges will have to be dealt with in a more vague way, and require moretime, effort and money to be investigated.
− it is mostly the effects on population, community and ecosystem scale that willcause the most problems on the human scale: humans will be affected bythese levels of pollution either directly or indirectly, because of the impact ofthe pollution on our land use, nature reserves, quality of life….
− The large scales may be difficult to quantify and to study, but they are themost relevant for our own wellbeing, health or possibly survival, and once wenotice the effect of a pollutant on the ecological level, a lot of damage hasalready been done.
2.2 Measuring toxicity the classical way2.2.1 It’s all in the dosageTraditionally, the impact of a chemical substance on life in an ecosystem is measuredusing toxicological tests.Toxicology is the study of poisons: their nature, the way they function, their effects,the ways to trace them, treat them or at least alleviate their symptoms,….Poisons are all kinds of chemical compounds with a toxic effect (such as benzene,arsenic or mercury); toxins are poisons produced by another organism (plants,animals, bacteria, fungi), such as cobra venom, botulism toxin and cholera toxin.Botulism is a food poisoning caused by a bacterium (botulinum) growing onimproperly sterilized canned meats and other preserved foods.
The father of the modern toxicology is Paracelsus (1493–1541). He developed the keyinsight that all chemical compounds are capable to harm the human body, and that theonly difference lies in the amount that is ingested:“Everything is a poison, and nothing is not a poison; only the dosage decides that asubstance is not poisonous in its effects”. Indeed, some toxic compounds may havebeneficial effects in small dosages (consider most medication), and even water andsugar, which are generally accepted as harmless, can kill a person.
A dosage of a compound is a quantity of this compound (expressed in g or mg per kgof body mass and per day) that is given at a specific moment to an organism.To assess the effect of a compound, one needs also to know: the number of doses an organism has been exposed to; how this organism has been exposed to this dose. how long they are in contact with the substance age and body mass of the organism that has been exposed.
2.2.2 Indicators of toxicity: LD50, NOAEL, TLVTo assess the toxic nature of a substance, we need to determine the lethality of acompound. This is expressed as the so-called median lethal dose or LD50 لجرعة ( ا)النصفیة القاتلة : the individual dose that will kill 50% of a population of test animals.o Knowing the LD50 of a number of toxic compound, we can compare their
relative toxicity:o The lower the LD50, the more toxic the compound.
21
o Typically, the LD50 is expressed as mg of the toxic compound per kg of bodyweight of the test animal (mg/kg). Alternatively, the LC50 is used, which givesthe amount of toxin (in mg) in 1 L of test solution.
Example: when a person of 80 kg ingests 3200 mg of a poison with an LD50 of 40mg/kg, he has a 50% probability to die in a short time.
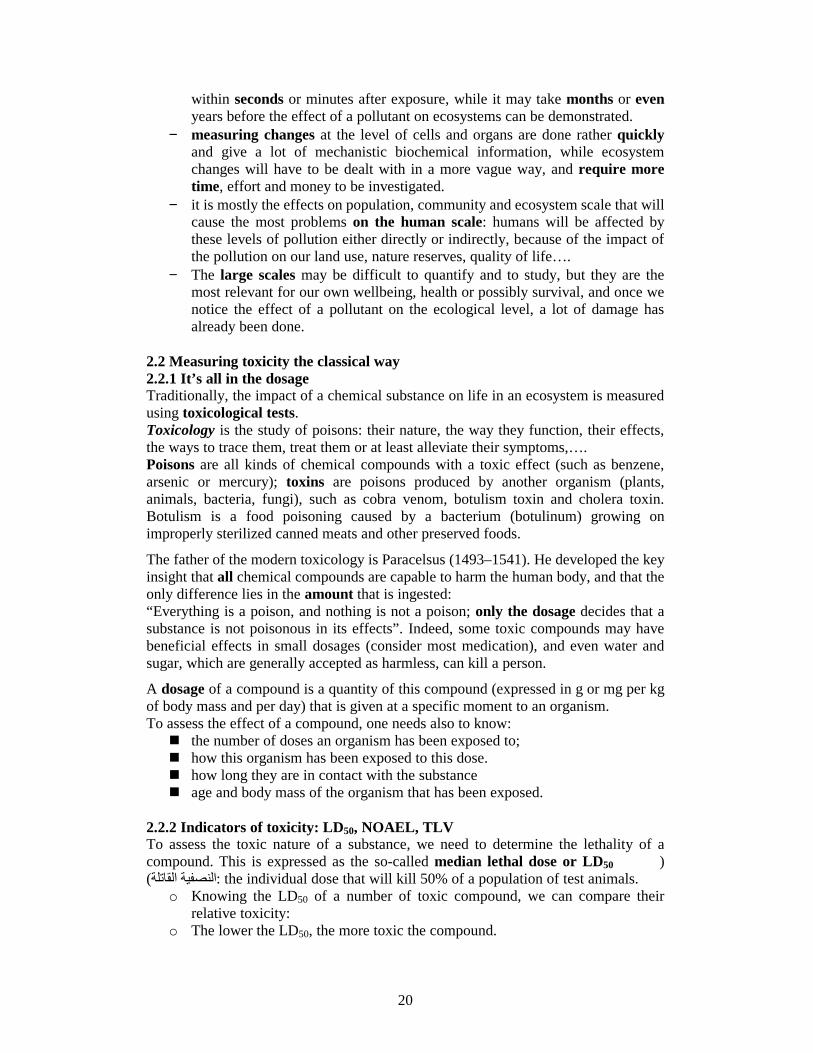
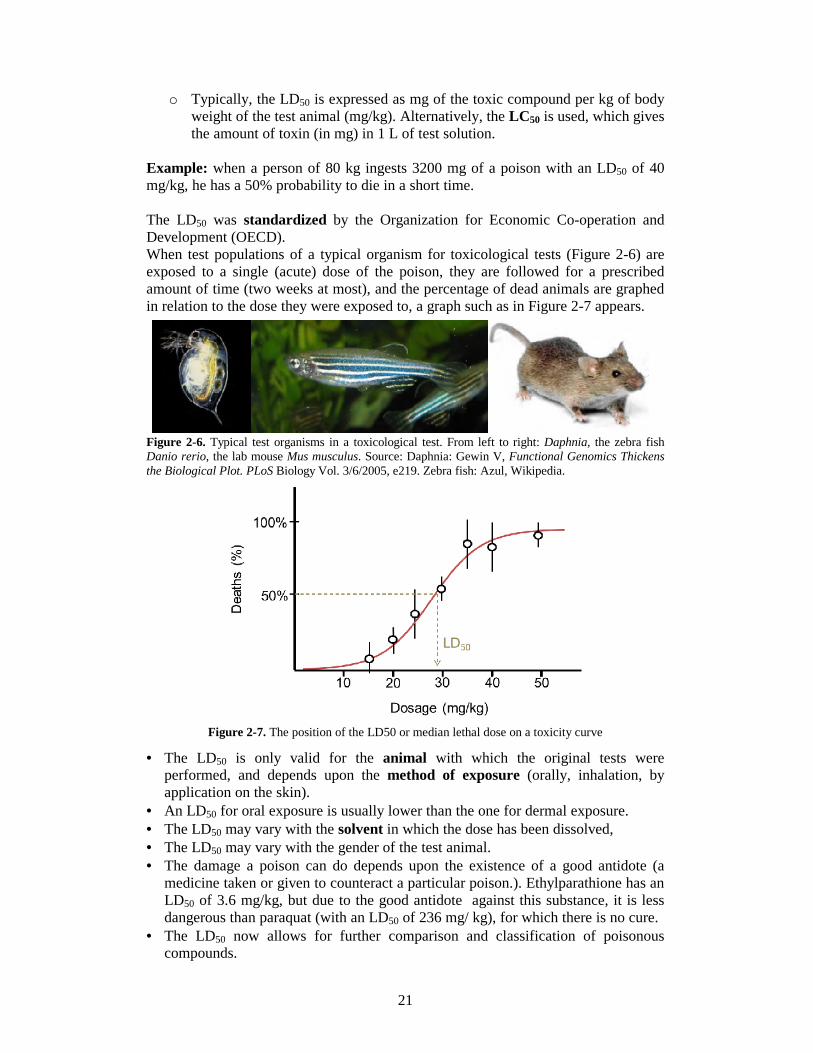
The LD50 was standardized by the Organization for Economic Co-operation andDevelopment (OECD).When test populations of a typical organism for toxicological tests (Figure 2-6) areexposed to a single (acute) dose of the poison, they are followed for a prescribedamount of time (two weeks at most), and the percentage of dead animals are graphedin relation to the dose they were exposed to, a graph such as in Figure 2-7 appears.
Figure 2-6. Typical test organisms in a toxicological test. From left to right: Daphnia, the zebra fishDanio rerio, the lab mouse Mus musculus. Source: Daphnia: Gewin V, Functional Genomics Thickensthe Biological Plot. PLoS Biology Vol. 3/6/2005, e219. Zebra fish: Azul, Wikipedia.
Figure 2-7. The position of the LD50 or median lethal dose on a toxicity curve
• The LD50 is only valid for the animal with which the original tests wereperformed, and depends upon the method of exposure (orally, inhalation, byapplication on the skin).
• An LD50 for oral exposure is usually lower than the one for dermal exposure.• The LD50 may vary with the solvent in which the dose has been dissolved,• The LD50 may vary with the gender of the test animal.• The damage a poison can do depends upon the existence of a good antidote (a
medicine taken or given to counteract a particular poison.). Ethylparathione has anLD50 of 3.6 mg/kg, but due to the good antidote against this substance, it is lessdangerous than paraquat (with an LD50 of 236 mg/ kg), for which there is no cure.
• The LD50 now allows for further comparison and classification of poisonouscompounds.
22
We already mentioned the GESAMP classification system, but there are a number ofless complicated ones. For example, there is the scale of Gosseling, Smith andHodge:Oral dosage, probably lethal for humans:Up to 5 mg/kg Super toxicFrom 5 to 50 mg/kg Extremely toxicFrom 50 to 500 mg/kg Very toxicFrom 500 to 5 000 mg/kg Moderately toxicFrom 5 000 to 15 000 mg/kg Slightly toxicFrom 15 000 mg/kg Very slightly toxic
Similar in set-up is the scale of Hodge and Sterner:LD50 for oral uptake by rats:Up to 1 mg/kg Extremely toxicFrom 1 to 50 mg/kg Highly toxicFrom 50 to 500 mg/kg Moderately toxicFrom 500 to 5 000 mg/kg Slightly toxicFrom 5 000 to 15 000 mg/kg Least toxicFrom 15 000 mg/kg (Relatively) harmless
In any case, compounds with an LD50 for oral intake lower than 50 mg/kg are usuallycalled extremely toxic for humans.Here are some figures for several well-known substances, for comparison:vitamin C: 11 900 mg/kgsodium chloride: 3 000 mg/kgtetrahydrocannabinol: 1270 mg/kgcaffeine: 192 mg/kgdigitalin: 5–10 mg/kgstrychnin: 1 mg/kgcyanide: 0,5–3,0 mg/kgdioxin: 0,02 mg/kg (0,001 mg/kg for dogs)botulism toxin: 1 ng/kg
Two other values which can be derived from the toxicity curve, are the NoObserved (Adverse) Effect Level (NOAEL/NOEL لا
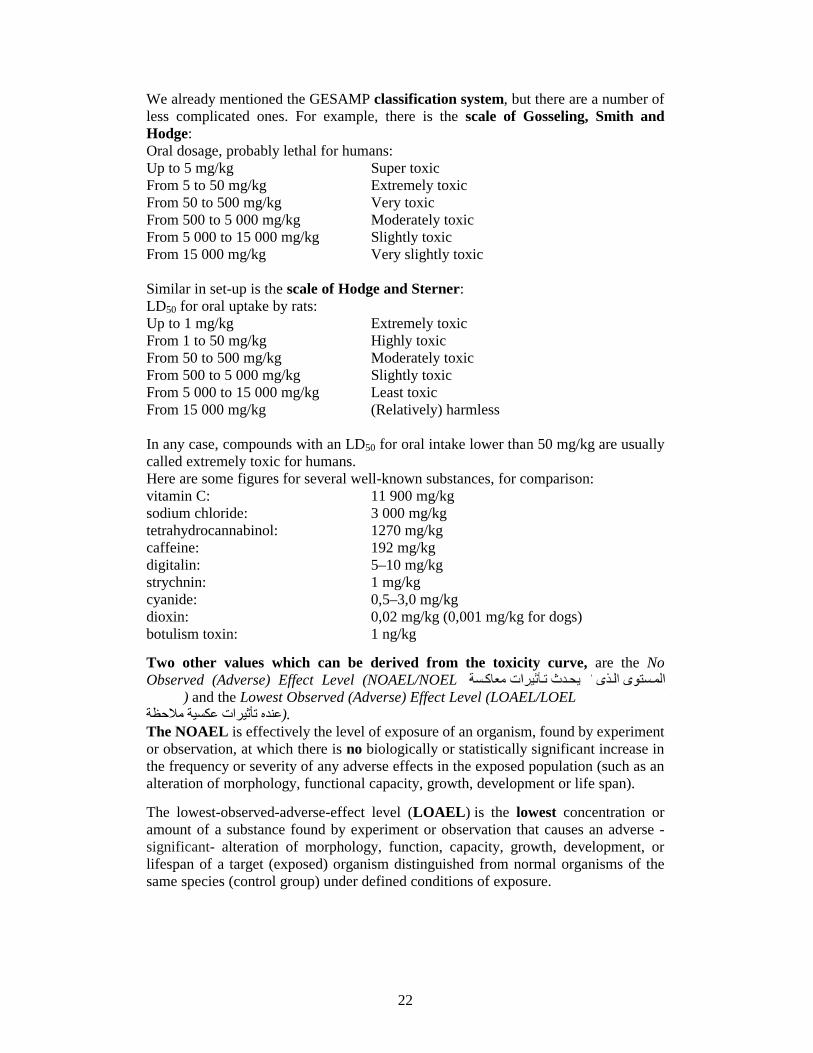
حظةلام ) and the Lowest Observed (Adverse) Effect Level (LOAEL/LOEL أقل مستوى تحدث .(عنده تأثیرات عكسیة ملاحظةThe NOAEL is effectively the level of exposure of an organism, found by experimentor observation, at which there is no biologically or statistically significant increase inthe frequency or severity of any adverse effects in the exposed population (such as analteration of morphology, functional capacity, growth, development or life span).
The lowest-observed-adverse-effect level (LOAEL) is the lowest concentration oramount of a substance found by experiment or observation that causes an adverse -significant- alteration of morphology, function, capacity, growth, development, orlifespan of a target (exposed) organism distinguished from normal organisms of thesame species (control group) under defined conditions of exposure.
23
Figure 2-8. Definition for NOAEL and LOAEL on the basis of the toxicity curve
Reference dose (RfD) الجرعة المرجعیة NOAEL in turn is used to calculate the so-called reference dose (RfD, an estimate -with uncertainty spanning perhaps an order of magnitude or greater- of the daily oralexposure humans can undergo without an appreciable risk of adverse effects during alifetime):
To account for the fact that humans may be more or less sensitive than the test animal,a 10-fold uncertainty factor is usually applied to the NOEL. Thisuncertainty factor is called the “interspecies uncertainty factor” or UFinter. Anadditional 10-fold uncertainty factor, the “intraspecies uncertainty factor” or UFintra, isusually applied to account for the fact that some humans may be substantially moresensitive to the effects of substances than others.
Threshold limit value (TLV) قیمة الحد الحرجA similar value to indicate maximal permissible human exposure is the thresholdlimit value (TLV) of a chemical substance, which serves as air quality standards andwas developed by the American Conference of Governmental Industrial Hygienists. Itis a level to which a person can be exposed day after day during his or herprofessional activities, for a working lifetime, without adverse health effects.They are usually expressed as a concentration of the possibly dangerous substance inthe air, where they can be inhaled, or come in contact with exposed skin. Its units arein parts per million (ppm) for gases and in milligrams per cubic meter (mg/m3) forparticulates such as dust, smoke and mist. Both units can be interconverted using thefollowing formula:
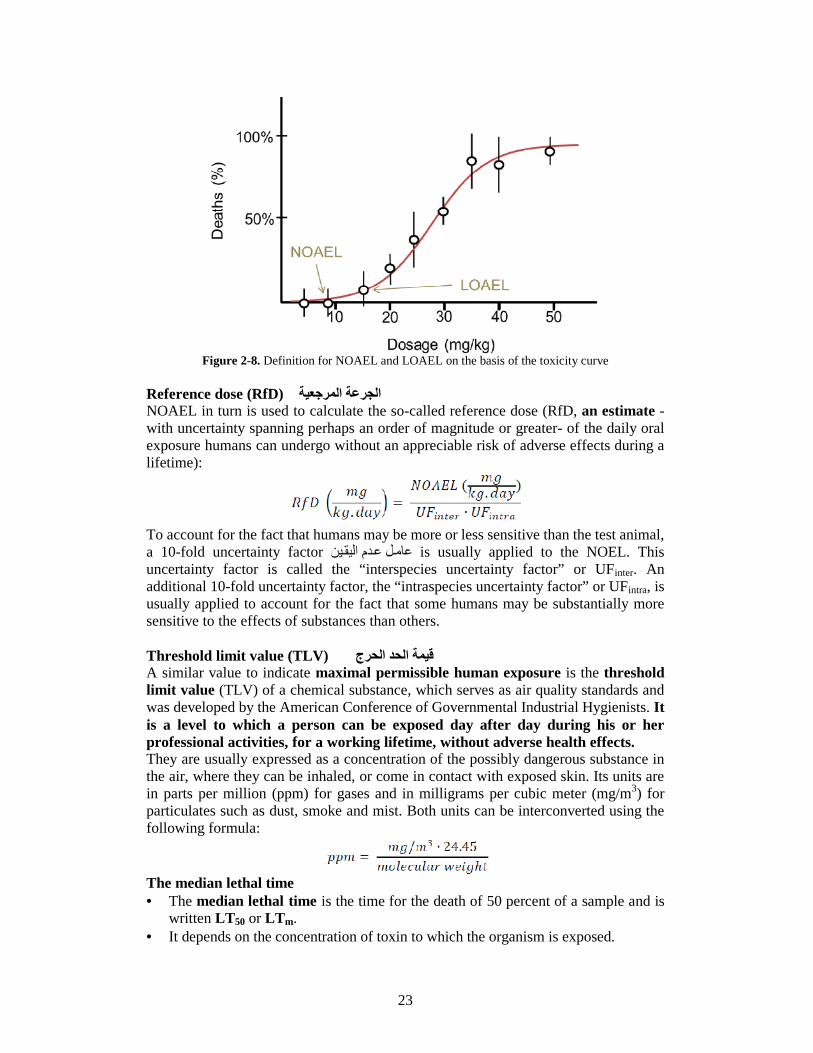
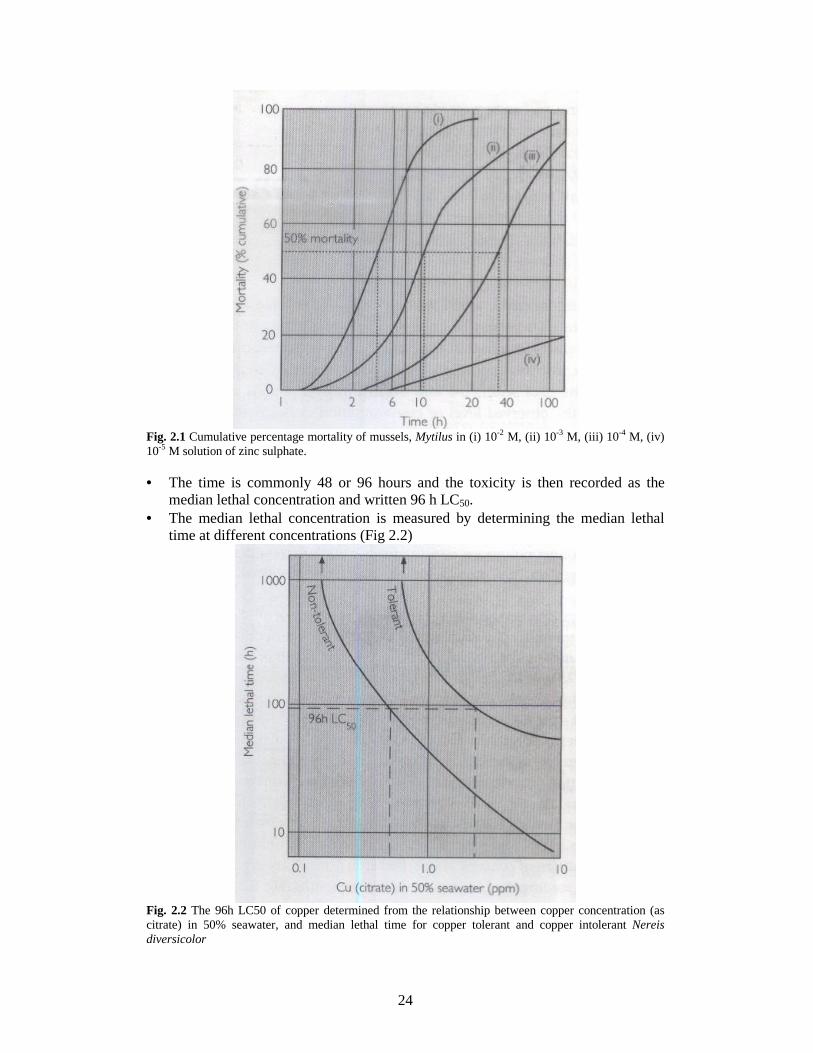
The median lethal time• The median lethal time is the time for the death of 50 percent of a sample and is
written LT50 or LTm.• It depends on the concentration of toxin to which the organism is exposed.
24
Fig. 2.1 Cumulative percentage mortality of mussels, Mytilus in (i) 10-2 M, (ii) 10-3 M, (iii) 10-4 M, (iv)10-5 M solution of zinc sulphate.
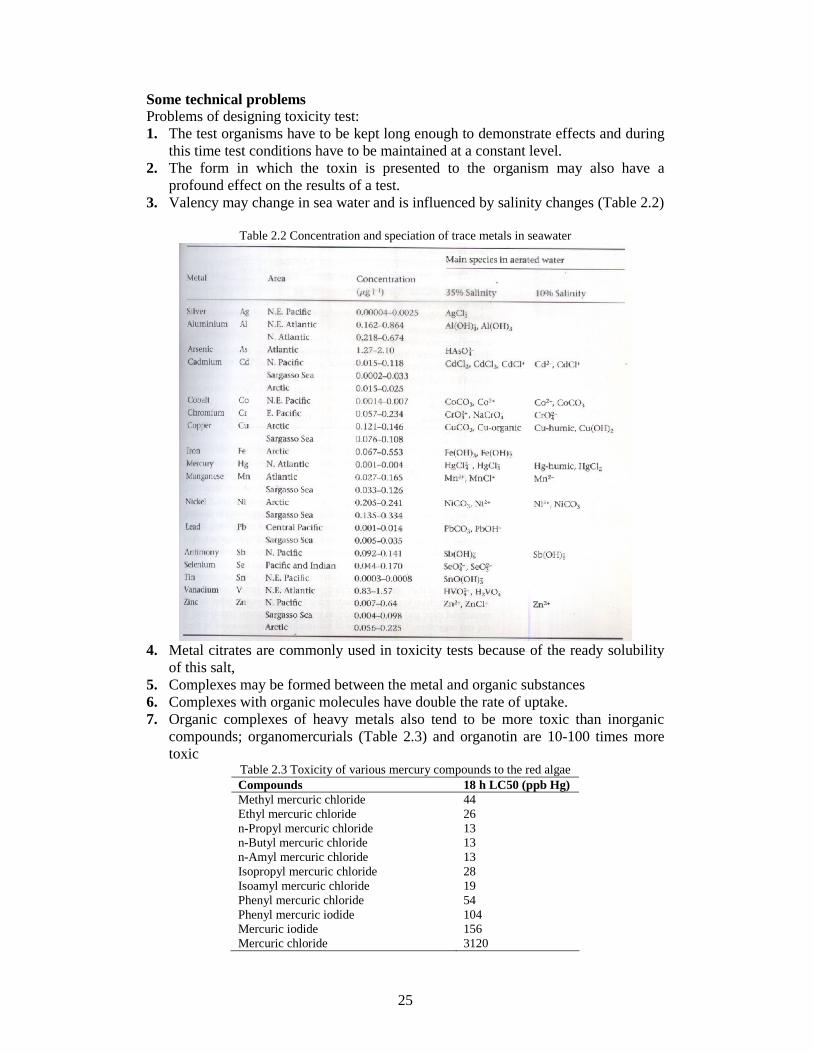
• The time is commonly 48 or 96 hours and the toxicity is then recorded as themedian lethal concentration and written 96 h LC50.
• The median lethal concentration is measured by determining the median lethaltime at different concentrations (Fig 2.2)
Fig. 2.2 The 96h LC50 of copper determined from the relationship between copper concentration (ascitrate) in 50% seawater, and median lethal time for copper tolerant and copper intolerant Nereisdiversicolor
25
Some technical problemsProblems of designing toxicity test:1. The test organisms have to be kept long enough to demonstrate effects and during
this time test conditions have to be maintained at a constant level.2. The form in which the toxin is presented to the organism may also have a
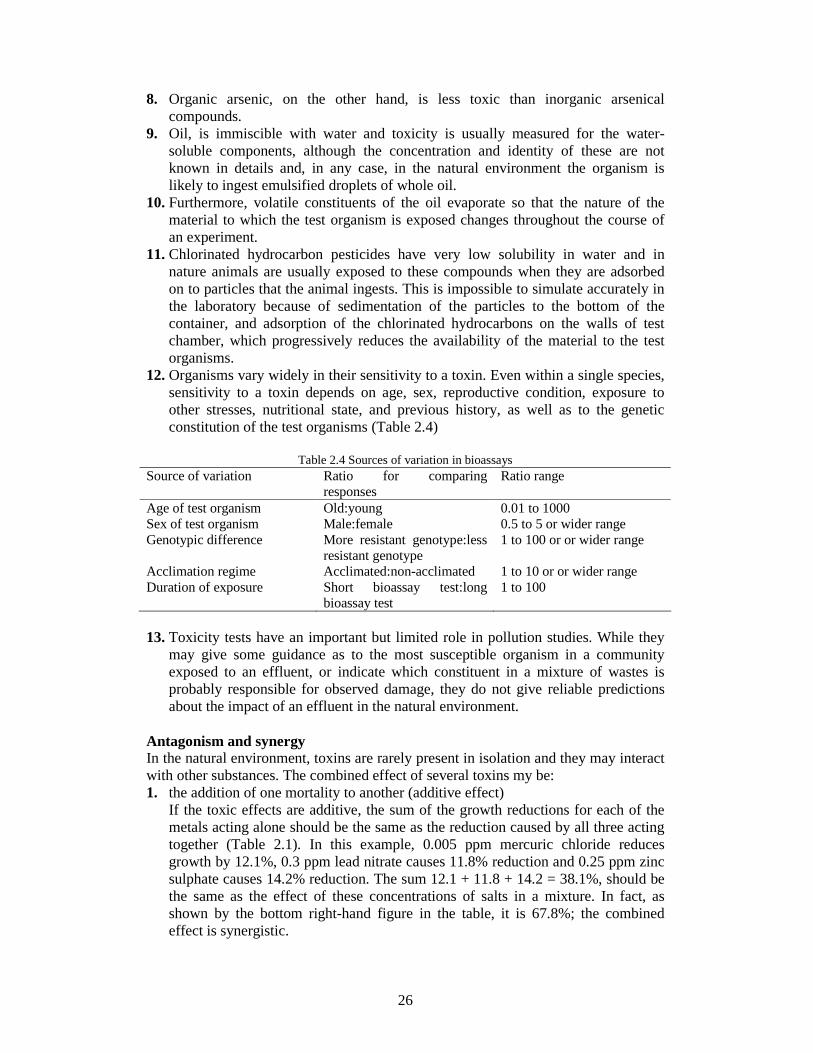
profound effect on the results of a test.3. Valency may change in sea water and is influenced by salinity changes (Table 2.2)
Table 2.2 Concentration and speciation of trace metals in seawater
4. Metal citrates are commonly used in toxicity tests because of the ready solubilityof this salt,
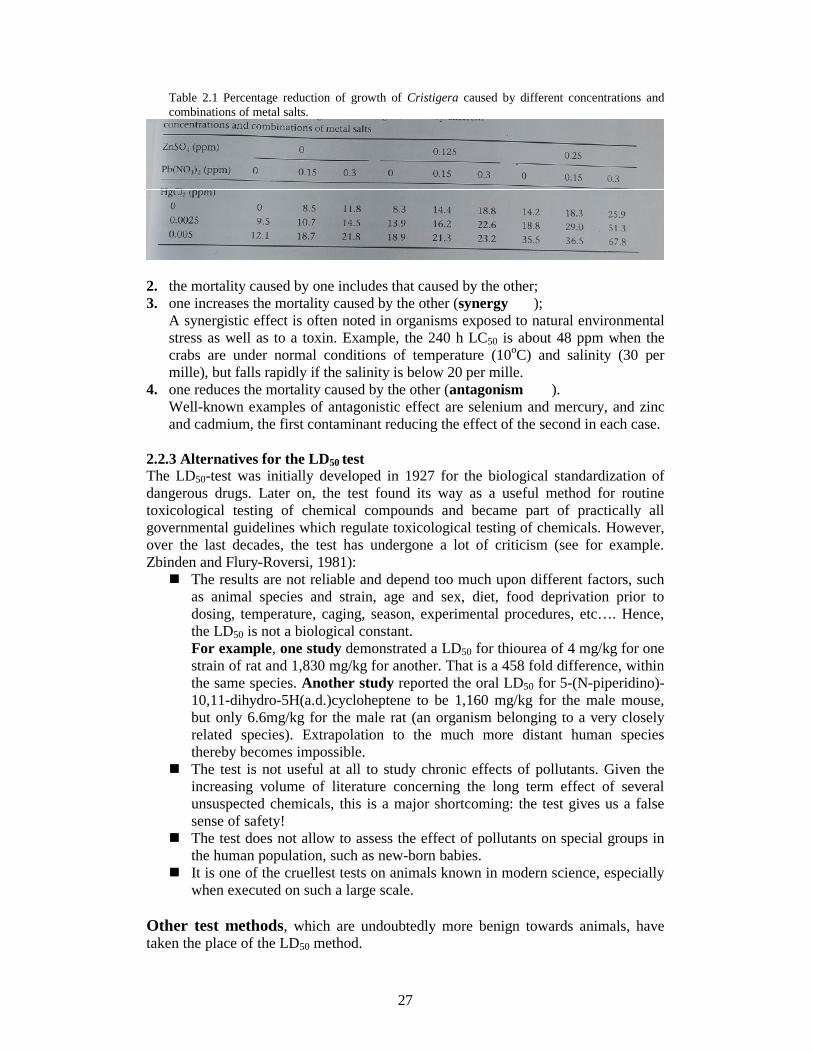
5. Complexes may be formed between the metal and organic substances6. Complexes with organic molecules have double the rate of uptake.7. Organic complexes of heavy metals also tend to be more toxic than inorganic
compounds; organomercurials (Table 2.3) and organotin are 10-100 times moretoxic
Table 2.3 Toxicity of various mercury compounds to the red algaeCompounds 18 h LC50 (ppb Hg)Methyl mercuric chlorideEthyl mercuric chloriden-Propyl mercuric chloriden-Butyl mercuric chloriden-Amyl mercuric chlorideIsopropyl mercuric chlorideIsoamyl mercuric chloridePhenyl mercuric chloridePhenyl mercuric iodideMercuric iodideMercuric chloride
44261313132819541041563120
26
8. Organic arsenic, on the other hand, is less toxic than inorganic arsenicalcompounds.
9. Oil, is immiscible with water and toxicity is usually measured for the water-soluble components, although the concentration and identity of these are notknown in details and, in any case, in the natural environment the organism islikely to ingest emulsified droplets of whole oil.
10. Furthermore, volatile constituents of the oil evaporate so that the nature of thematerial to which the test organism is exposed changes throughout the course ofan experiment.
11. Chlorinated hydrocarbon pesticides have very low solubility in water and innature animals are usually exposed to these compounds when they are adsorbedon to particles that the animal ingests. This is impossible to simulate accurately inthe laboratory because of sedimentation of the particles to the bottom of thecontainer, and adsorption of the chlorinated hydrocarbons on the walls of testchamber, which progressively reduces the availability of the material to the testorganisms.
12. Organisms vary widely in their sensitivity to a toxin. Even within a single species,sensitivity to a toxin depends on age, sex, reproductive condition, exposure toother stresses, nutritional state, and previous history, as well as to the geneticconstitution of the test organisms (Table 2.4)
Table 2.4 Sources of variation in bioassaysSource of variation Ratio for comparing
responsesRatio range
Age of test organism Old:young 0.01 to 1000Sex of test organism Male:female 0.5 to 5 or wider rangeGenotypic difference More resistant genotype:less
resistant genotype1 to 100 or or wider range
Acclimation regime Acclimated:non-acclimated 1 to 10 or or wider rangeDuration of exposure Short bioassay test:long
bioassay test1 to 100
13. Toxicity tests have an important but limited role in pollution studies. While theymay give some guidance as to the most susceptible organism in a communityexposed to an effluent, or indicate which constituent in a mixture of wastes isprobably responsible for observed damage, they do not give reliable predictionsabout the impact of an effluent in the natural environment.
Antagonism and synergyIn the natural environment, toxins are rarely present in isolation and they may interactwith other substances. The combined effect of several toxins my be:1. the addition of one mortality to another (additive effect)
If the toxic effects are additive, the sum of the growth reductions for each of themetals acting alone should be the same as the reduction caused by all three actingtogether (Table 2.1). In this example, 0.005 ppm mercuric chloride reducesgrowth by 12.1%, 0.3 ppm lead nitrate causes 11.8% reduction and 0.25 ppm zincsulphate causes 14.2% reduction. The sum 12.1 + 11.8 + 14.2 = 38.1%, should bethe same as the effect of these concentrations of salts in a mixture. In fact, asshown by the bottom right-hand figure in the table, it is 67.8%; the combinedeffect is synergistic.
27
Table 2.1 Percentage reduction of growth of Cristigera caused by different concentrations andcombinations of metal salts.
2. the mortality caused by one includes that caused by the other;3. one increases the mortality caused by the other (synergy ;(تآزر
A synergistic effect is often noted in organisms exposed to natural environmentalstress as well as to a toxin. Example, the 240 h LC50 is about 48 ppm when thecrabs are under normal conditions of temperature (10oC) and salinity (30 permille), but falls rapidly if the salinity is below 20 per mille.
4. one reduces the mortality caused by the other (antagonism .(تضادWell-known examples of antagonistic effect are selenium and mercury, and zincand cadmium, the first contaminant reducing the effect of the second in each case.
2.2.3 Alternatives for the LD50 testThe LD50-test was initially developed in 1927 for the biological standardization ofdangerous drugs. Later on, the test found its way as a useful method for routinetoxicological testing of chemical compounds and became part of practically allgovernmental guidelines which regulate toxicological testing of chemicals. However,over the last decades, the test has undergone a lot of criticism (see for example.Zbinden and Flury-Roversi, 1981): The results are not reliable and depend too much upon different factors, such
as animal species and strain, age and sex, diet, food deprivation prior todosing, temperature, caging, season, experimental procedures, etc…. Hence,the LD50 is not a biological constant.For example, one study demonstrated a LD50 for thiourea of 4 mg/kg for onestrain of rat and 1,830 mg/kg for another. That is a 458 fold difference, withinthe same species. Another study reported the oral LD50 for 5-(N-piperidino)-10,11-dihydro-5H(a.d.)cycloheptene to be 1,160 mg/kg for the male mouse,but only 6.6mg/kg for the male rat (an organism belonging to a very closelyrelated species). Extrapolation to the much more distant human speciesthereby becomes impossible.
The test is not useful at all to study chronic effects of pollutants. Given theincreasing volume of literature concerning the long term effect of severalunsuspected chemicals, this is a major shortcoming: the test gives us a falsesense of safety!
The test does not allow to assess the effect of pollutants on special groups inthe human population, such as new-born babies.
It is one of the cruellest tests on animals known in modern science, especiallywhen executed on such a large scale.
Other test methods, which are undoubtedly more benign towards animals, havetaken the place of the LD50 method.
Related Documents


