2) Cloud Radio Access Networks (C-RAN) and optical Mobile backhaul and fronthaul Dawit Hadush Hailu Master of Telematics - Communication Networks and Networked Services Supervisor: Steinar Bjørnstad, ITEM Department of Telematics Submission date: June 2016 Norwegian University of Science and Technology

Welcome message from author
This document is posted to help you gain knowledge. Please leave a comment to let me know what you think about it! Share it to your friends and learn new things together.
Transcript
2) Cloud Radio Access Networks (C-RAN)and optical Mobile backhaul andfronthaul
Dawit Hadush Hailu
Master of Telematics - Communication Networks and Networked Services
Supervisor: Steinar Bjørnstad, ITEM
Department of Telematics
Submission date: June 2016
Norwegian University of Science and Technology


Title: Cloud Radio Access Networks (C-RAN) and OpticalMobile backhaul and fronthaul networks
Student: Dawit Hadush Hailu
Problem description:
TransPacket AS (www.transpacket.com) develops the fusion networking, a packetoriented network implementing the principle of integrated hybrid optical networks/IHON, for efficiently serving both the circuit switched Guaranteed Service Transport(GST) with absolute priority and packet switched Statistically Multiplexed (SM) besteffort traffic. The company addresses the transport using optical networks betweenthe controller of the mobile network and the mobile base-stations. Due to a highdemand of bandwidth in mobile networks, the need for higher density of cell sitesis increasing to meet this demand. Along with this, a cost efficient technology isrequired for keeping the costs at the moderate level. Thus, the main objective of thisthesis is to evaluate the fusion networking as a mobile fronthaul in terms of latencyand packet delay variation (PDV). Further, the student will study the latency andpacket delay variation in radio over Ethernet mobile fronthaul networks and how wellmay this be supported in an IHON Ethernet mobile fronthaul. The thesis consists ofthe following tasks:
• Background study of different fronthaul optical solutions and the evolution ofCloud Radio Access Network (C-RAN).
• Study the fronthaul requirements of mobile networks.• Investigate the performance of IHON node and standard Ethernet switch.
The evaluation methodology used to achieve the above mentioned objective will be aSimula based on Discrete Event Modelling On Simula (DEMOS) software, a contextclass for discrete event simulation.
Responsible professor: Steinar Bjørnstad, ITEMSupervisor: Steinar Bjørnstad, ITEM

Abstract
Increasing mobile data traffic due to the rise of both smartphones andtablets has led to high-capacity demand of mobile data network. Tomeet the ever-growing capacity demand and reduce the cost of mobilenetwork components, Cloud Radio Access Network (C-RAN) has emergedas a promising solution. In this network, the mobile operator’s RemoteRadio Head (RRH) and Base Band Unit (BBU) are often separatedand the connection between them has very tight timing and latencyrequirements imposed by Common Public Radio Interface (CPRI) and3rd Generation Partnership Project (3GPP). This fronthaul connectionis not yet provided by packet based network. To employ packet-basednetwork for C-RAN fronthaul, the carried fronthaul traffic are needed toachieve the requirements of fronthaul streams. For this reason, the aimof this study was focused on investigating and evaluating the feasibilityof Integrated Hybrid Optical Networks (IHON) and Ethernet networksfor mobile fronthaul. The fronthaul requirements used to evaluate andinvestigate these networks were maximum End to End (E2E) latency,Packet Loss Ratio (PLR) and Packet Delay Variation (PDV).
TransPacket AS (www.transpacket.com) develops a fusion switchingthat efficiently serves both Guaranteed Service Transport (GST) trafficwith absolute priority and packet switched Statistical Multiplexing (SM)best effort traffic. Dedicated wavelength is used to provide a deterministiccircuit switched transport and uses the leftover capacity on the wavelengthto transport the best effort traffic without affecting the absolute prioritypackets. We verified how the leftover capacity of fusion node can beused to carry the low priority packets and how the GST traffic can havedeterministic characteristics on a single wavelength by delaying it withFixed Delay Line (FDL). For example, for LSM
1GE=0.3 the added SM trafficincreases the 10GE wavelength utilization up to 89% without any lossesand with SM PLR=1E−03 up to 92% utilization.
The simulated results and numerical analysis confirm that the PDVand PLR of GST traffic in IHON network and the PLR of High Priority(HP) traffic in Ethernet network meet the requirements of mobile fronthaulusing CPRI. However, the PDV of HP traffic meets the fronthaul networkwhen the number of nodes in the Ethernet network is at most four. Forboth IHON and Ethernet network, the number of nodes in the networklimits the maximum separation distance between BBU and RRH (linklength); for increasing the number of nodes, the link length decreases.Consequently, Radio over Ethernet (RoE) traffic should receive the priority
and Quality of Service (QoS) only GST or HP can provide. On the otherhand, SM or Low Priority (LP) classes are not sensitive to QoS metricsand should be used for transporting time insensitive applications andservices.
Furthermore, we numerically evaluated the performance of activeWavelength Division Multiplexing (WDM) when Optical TransmissionNetwork (OTN) encapsulation is employed and dedicated fronthaul net-works in terms of the maximum one-way latency and the maximumseparation distance between BBU and RRH provided that the typicalvalues of BBU are known.

Acknowledgment
The success and final outcome of this thesis required a lot of guidance,support, and motivation. I am deeply indebted to my supervisor SteinarBjørnstad who was always willing to share his deep insights, wide knowl-edge, and extensive experiences. His suggestions and mind stimulatingdiscussions, leading me to further expand and deepen my knowledge. Ina time of losing confidence and facing problems, it was his motivation,guidance, valuable feedback and support that helped me to think inseveral ways and prompted me to think beyond the obvious. Generallyspeaking, without him, the completion of this thesis would have beenimpossible.
I would also like to express my deepest gratitude to Laurent Paquereauand Mona Nordaune for their administrative assistance. My acknowledg-ment also goes to Raimena Veisllari and Norvald Stol for their supportand encouragement during the work. Moreover, I am really thankful tomy uncle Abera Hailu for the unceasing encouragement, support, andattention.


Preface
This thesis is submitted as the completion of MSc. degree in Telematicsspecialized in Networks and QoSs at the Norwegian University of Scienceand Technology (NTNU). The thesis described herein was conductedunder the supervision of Adjunct Associate Professor Steinar Bjørnstadat the Department of Telematics, NTNU and is the product of the masterperiod, between January 2016 and June 2016. It has a workload of 30European Credit Transfer System (ECTS) credits. Yours truly has abachelor degree in Electrical and Computer Engineering from MekelleUniversity (MU).


Contents
List of Figures xi
List of Tables xiii
List of Acronyms xv
1 Introduction 11.1 Introduction . . . . . . . . . . . . . . . . . . . . . . . . . . . . . . . . 11.2 Background and Motivation . . . . . . . . . . . . . . . . . . . . . . . 11.3 Statement of the Problem . . . . . . . . . . . . . . . . . . . . . . . . 61.4 Objectives of the Thesis . . . . . . . . . . . . . . . . . . . . . . . . . 61.5 Methodology . . . . . . . . . . . . . . . . . . . . . . . . . . . . . . . 71.6 Thesis Outline . . . . . . . . . . . . . . . . . . . . . . . . . . . . . . 7
2 Cloud Radio Access Network/C-RAN 92.1 Introduction . . . . . . . . . . . . . . . . . . . . . . . . . . . . . . . . 92.2 Evolution of BS Architecture . . . . . . . . . . . . . . . . . . . . . . 102.3 C-RAN Architecture . . . . . . . . . . . . . . . . . . . . . . . . . . . 11
2.3.1 C-RAN System Architecture . . . . . . . . . . . . . . . . . . 122.3.2 C-RAN Components . . . . . . . . . . . . . . . . . . . . . . . 132.3.3 Advantages of C-RAN . . . . . . . . . . . . . . . . . . . . . . 14
2.4 Optical Networks for C-RAN . . . . . . . . . . . . . . . . . . . . . . 152.5 Fronthaul Transport Options . . . . . . . . . . . . . . . . . . . . . . 16
2.5.1 Dedicated Fiber . . . . . . . . . . . . . . . . . . . . . . . . . 172.5.2 Passive WDM . . . . . . . . . . . . . . . . . . . . . . . . . . . 182.5.3 Microwave . . . . . . . . . . . . . . . . . . . . . . . . . . . . . 192.5.4 OTN . . . . . . . . . . . . . . . . . . . . . . . . . . . . . . . . 192.5.5 Ethernet . . . . . . . . . . . . . . . . . . . . . . . . . . . . . . 21
2.6 Radio over Ethernet . . . . . . . . . . . . . . . . . . . . . . . . . . . 22
3 Fronthaul Network Requirements 273.1 Requirements and Challenges of Fronthaul Networks . . . . . . . . . 28
3.1.1 Data Rate . . . . . . . . . . . . . . . . . . . . . . . . . . . . . 28
vii
3.1.2 Latency . . . . . . . . . . . . . . . . . . . . . . . . . . . . . . 293.1.3 Packet Delay Variation . . . . . . . . . . . . . . . . . . . . . 313.1.4 Synchronization and Jitter . . . . . . . . . . . . . . . . . . . 31
4 Integrated Hybrid Optical Networks/IHON 334.1 Introduction . . . . . . . . . . . . . . . . . . . . . . . . . . . . . . . . 334.2 Hybrid Optical Network Architectures . . . . . . . . . . . . . . . . . 34
4.2.1 Client-server Hybrid Optical Network . . . . . . . . . . . . . 344.2.2 Parallel Hybrid Optical Network . . . . . . . . . . . . . . . . 354.2.3 Integrated Optical Hybrid Optical Network . . . . . . . . . . 354.2.4 OpMiGua . . . . . . . . . . . . . . . . . . . . . . . . . . . . . 364.2.5 Fusion Solution/IHON Network . . . . . . . . . . . . . . . . . 37
4.3 IHON Node Design . . . . . . . . . . . . . . . . . . . . . . . . . . . . 384.3.1 IHON Node Operation . . . . . . . . . . . . . . . . . . . . . . 394.3.2 Delay and Packet Delay Variation in IHON Node . . . . . . . 404.3.3 Delay and Packet Delay Variation in Ethernet Switch . . . . 414.3.4 Inter-packet Time Gap Computation in IHON Node . . . . . 43
4.4 IHON Node Aggregation . . . . . . . . . . . . . . . . . . . . . . . . . 44
5 Analytical/ Simulation Model 475.1 Maximum End-to-End Latency . . . . . . . . . . . . . . . . . . . . . 47
5.1.1 Maximum E2E Latency and Separation Distance for ActiveWDM . . . . . . . . . . . . . . . . . . . . . . . . . . . . . . . 48
5.1.2 Maximum E2E Latency and Separation Distance for DedicatedFiber . . . . . . . . . . . . . . . . . . . . . . . . . . . . . . . 51
5.1.3 Maximum E2E Latency and PDV for Ethernet Networks . . 525.2 Simulation Model for IHON Node and Standard Ethernet Switch . . 53
5.2.1 Traffic Pattern . . . . . . . . . . . . . . . . . . . . . . . . . . 53
6 Results and Discussions 556.1 Simulation Parameters . . . . . . . . . . . . . . . . . . . . . . . . . . 556.2 IHON Node Performance . . . . . . . . . . . . . . . . . . . . . . . . 56
6.2.1 GST Traffic Performance . . . . . . . . . . . . . . . . . . . . 586.2.2 SM Traffic Performance . . . . . . . . . . . . . . . . . . . . . 596.2.3 Comparison Between GST and SM Traffic Performance in
IHON Node . . . . . . . . . . . . . . . . . . . . . . . . . . . . 626.3 Ethernet Switch Performance . . . . . . . . . . . . . . . . . . . . . . 64
6.3.1 HP Traffic Performance . . . . . . . . . . . . . . . . . . . . . 656.3.2 LP Traffic Performance . . . . . . . . . . . . . . . . . . . . . 67
6.4 Mobile Fronthaul Networks . . . . . . . . . . . . . . . . . . . . . . . 696.4.1 Evaluation of IHON Network for Mobile Fronthaul Network . 706.4.2 Evaluation of Ethernet Network for Mobile Fronthaul Network 72
6.5 Application of Ethernet streams in Fronthaul Network . . . . . . . . 75
7 Summary and Conclusion 777.1 Summary . . . . . . . . . . . . . . . . . . . . . . . . . . . . . . . . . 777.2 Conclusion . . . . . . . . . . . . . . . . . . . . . . . . . . . . . . . . 78
8 Future Work 818.1 Future Work . . . . . . . . . . . . . . . . . . . . . . . . . . . . . . . 81
References 83
AppendicesA IHON Node and Ethernet Switch Implementation 89
A.1 IHON Node Implementation . . . . . . . . . . . . . . . . . . . . . . 89A.1.1 GST_Generator Entity . . . . . . . . . . . . . . . . . . . . 89A.1.2 SMGenerator . . . . . . . . . . . . . . . . . . . . . . . . . . 89A.1.3 GSTPacket Entity . . . . . . . . . . . . . . . . . . . . . . . 90A.1.4 SMPacket Entity . . . . . . . . . . . . . . . . . . . . . . . . 90A.1.5 SM_packet_scheduler Entity . . . . . . . . . . . . . . . . . 90A.1.6 SM_Waiting bin . . . . . . . . . . . . . . . . . . . . . . . . 91A.1.7 SM_pkt_check and GST_pkt_check queues . . . . . . . . 91
A.2 Ethernet Switch Implementation . . . . . . . . . . . . . . . . . . . 91A.2.1 HP_Generator Entity . . . . . . . . . . . . . . . . . . . . . 91A.2.2 LP_Generator Entity . . . . . . . . . . . . . . . . . . . . . 91A.2.3 HPPacket Entity . . . . . . . . . . . . . . . . . . . . . . . . 92A.2.4 LPPacket Entity . . . . . . . . . . . . . . . . . . . . . . . . 92A.2.5 HP_packet_scheduler Entity . . . . . . . . . . . . . . . . . 92A.2.6 LP_packet_scheduler Entity . . . . . . . . . . . . . . . . . 92A.2.7 HP_Waiting Bin . . . . . . . . . . . . . . . . . . . . . . . . 93A.2.8 LP_Waiting Bin . . . . . . . . . . . . . . . . . . . . . . . . 93
A.3 IHON and Ethernet Source Codes . . . . . . . . . . . . . . . . . . 93A.4 Input File and Output File . . . . . . . . . . . . . . . . . . . . . . 93A.5 Simulator Validation . . . . . . . . . . . . . . . . . . . . . . . . . . 95
B QoS Targets for Reference Service Classes 98
C Example of Input File 99C.1 Input File for IHON Code: Input_IHON.txt . . . . . . . . . . . . 99C.2 Input File for Ethernet Code: Input_Ethernet.txt . . . . . . . . . 100
D Confidence Interval Calculation In the Simulator 101

List of Figures
1.1 Mobile backhaul and fronthaul network architecture in Long Term Evolu-tion (LTE), extracted from [AWP15]. . . . . . . . . . . . . . . . . . . . . 4
2.1 Base station architecture for traditional macro Base Station (BS) (noBBU hotelling), extracted from [CCY+15]. . . . . . . . . . . . . . . . . 10
2.2 Base station architecture for BS with RRH, extracted from [CCY+15]. . 112.3 Base station architecture for C-RAN with RRHs, extracted from [CCY+15]. 122.4 Options of C-RAN system architecture including the split functions of
RRH and BBU, extracted from [PWLP15]. . . . . . . . . . . . . . . . . 132.5 RRH components, adopted [LKB09]. . . . . . . . . . . . . . . . . . . . . 142.6 Point to point fiber [PMC15]. . . . . . . . . . . . . . . . . . . . . . . . . 172.7 Passive WDM [PMC15]. . . . . . . . . . . . . . . . . . . . . . . . . . . . 182.8 Active WDM [PMC15] . . . . . . . . . . . . . . . . . . . . . . . . . . . . 192.9 OTN based mobile fronthaul solution [PMC15]. . . . . . . . . . . . . . . 202.10 Ethernet packet format, extracted from [For]. . . . . . . . . . . . . . . . 212.11 Ethernet packet format to support the Radio over Ethernet(RoE), ex-
tracted from [For]. . . . . . . . . . . . . . . . . . . . . . . . . . . . . . . 232.12 Radio over Ethernet(RoE) fame structure, extracted from [For]. . . . . . 24
3.1 Packet stream synchronization. . . . . . . . . . . . . . . . . . . . . . . . 32
4.1 Client-server hybrid optical networks [GKB+06]. . . . . . . . . . . . . . 354.2 Parallel hybrid optical networks [GKB+06]. . . . . . . . . . . . . . . . . 354.3 Integrated hybrid optical networks [GKB+06]. . . . . . . . . . . . . . . . 364.4 A hybrid network model illustrating the sharing of the physical fiber layer.
The optical cross connects and optical packet switches are co-located,either as separate units or as one integrated unit. The WRON can be aStatic or a Dynamic-WRON [BNOS05]. . . . . . . . . . . . . . . . . . . 37
4.5 Fusion network: created by combining the best properties of packet andcircuit switching, extracted from [Tra12]. . . . . . . . . . . . . . . . . . 38
4.6 Schematic diagram of IHON node design, extracted from [VBB13]. . . . 394.7 Internal operation of IHON node, adopted from [VBB13]. . . . . . . . . 40
xi

4.8 a) Inter packet gap and delay experienced by GST packets, b) Schedulingin strict priority QoS in packet switches where packet delay variation(PDV) occurs on high-priority packets, c) Scheduling in fusion node whereSM packets are inserted only if there is a suitable gap between the GSTpackets, extracted from [VBB13]. . . . . . . . . . . . . . . . . . . . . . . 42
4.9 First-In First-Out (FIFO) delay on Ethernet switch . . . . . . . . . . . 424.10 Detection of free time gaps with in the time window created by the fixed
delay, extracted from [VBB13]. . . . . . . . . . . . . . . . . . . . . . . . 434.11 Aggregation of five GST streams and SM insertion. The figure explains
how GST traffic are aggregated in fusion node, and how the insertion ofSM packet is achieved [VBB+15]. . . . . . . . . . . . . . . . . . . . . . 46
5.1 The maximum end to end latency in C-RAN network. . . . . . . . . . . 485.2 Delay contribution of the BBU and RRH along the fronthaul network. . 50
6.1 Diagram illustrating how the IHON node is connected to Packet generatorsfor measuring the performance metrics. . . . . . . . . . . . . . . . . . . 57
6.2 Average latency of SM traffic as function of GST load for SM load=0.1,0.35 and 0.4(IHON node). . . . . . . . . . . . . . . . . . . . . . . . . . . 60
6.3 Packet delay variation of SM traffic as function of GST load (IHON node). 616.4 PLR of SM traffic as function of GST load (IHON node). . . . . . . . . 616.5 Average latency of SM and GST traffics as function of GST load for SM
load=0.1 (IHON node) . . . . . . . . . . . . . . . . . . . . . . . . . . . . 626.6 Packet delay variation of SM and GST traffics as function of GST load
for SM load=0.1(IHON node). . . . . . . . . . . . . . . . . . . . . . . . 636.7 Illustration of Ethernet Switch for measuring the performance of HP and
LP traffic. . . . . . . . . . . . . . . . . . . . . . . . . . . . . . . . . . . . 646.8 Average latency of HP traffic as function of HP load for LP load 0.4 and
0.45(Ethernet switch). . . . . . . . . . . . . . . . . . . . . . . . . . . . . 656.9 PDV of HP traffic as function of HP load for HP load=0.4 and 0.45
(Ethernet switch). . . . . . . . . . . . . . . . . . . . . . . . . . . . . . . 666.10 Average latency of LP traffic as function of HP load for LP load=0.4 and
0.45 (Ethernet switch). . . . . . . . . . . . . . . . . . . . . . . . . . . . . 676.11 Packet delay variation of LP traffic as function of HP load for LP load=0.4
and 0.45 (Ethernet switch). . . . . . . . . . . . . . . . . . . . . . . . . . 686.12 PLR of LP traffic as function of HP load for LP load=0.4 and 0.45
(Ethernet switch). . . . . . . . . . . . . . . . . . . . . . . . . . . . . . . 696.13 Mobile fronthaul network under study. The nodes can be either IHON
node or Ethernet switch depending on the network under evaluation. . . 69

List of Tables
2.1 Optical fronthaul/transport options. . . . . . . . . . . . . . . . . . . . . 162.2 Allocated RoE pkt_type values where TBD stands for To Be Defined (
since RoE frame structure is an ongoing work, some of the packet typevalues are not yet defined), extracted from [For]. . . . . . . . . . . . . . 24
3.1 Detailed CPRI capacity requirement and application in support of mobilebroadband where * means no information, extracted [PMC15]. . . . . . 28
3.2 Latency, PDV and synchronization requirements for Ethernet Fronthaulwith symmetry assumption. . . . . . . . . . . . . . . . . . . . . . . . . . 30
3.3 Timing requirements for BS, extracted from [CJCB15] . . . . . . . . . . 32
4.1 Definition of parameters used in the gap computation. . . . . . . . . . . 44
5.1 Delay components of each parts of Figure 5.2, extracted from [HJS]. . . 495.2 Typical values of delay components in the fronthaul network, extracted
from [HJS]. . . . . . . . . . . . . . . . . . . . . . . . . . . . . . . . . . . 49
6.1 Simulation parameters used in the analysis of performance metrics of SMand GST packets (for IHON node). . . . . . . . . . . . . . . . . . . . . . 55
6.2 Notation of parameters used in the simulation result analysis. . . . . . . 566.3 Average latency, PLR, and PDV of SM and GST traffic as function of
GST load for SM load=0.3 (IHON node). . . . . . . . . . . . . . . . . . 576.4 Average latency and PDV of LP and HP traffics as function of HP load
for HP load=0.4 (Ethernet switch). . . . . . . . . . . . . . . . . . . . . . 646.5 Maximum link length and number of nodes in IHON network to meet the
fronthaul requirements for GST traffic where Ltotal=50µsec,DT=5µsec/km,and Dnode=1.2µsec. . . . . . . . . . . . . . . . . . . . . . . . . . . . . . 71
6.6 Average latency comparison between LP and HP traffics of Ethernetswitch and fronthaul requirements for LP load=0.4. . . . . . . . . . . . 73
6.7 Maximum link length and number of nodes in Ethernet network tomeet the fronthaul requirements for HP traffic where Ltotal=50µsec,DT=5µsec/km, and Dnode=1.2µsec. . . . . . . . . . . . . . . . . . . . . 73
xiii
6.8 The Number of nodes in Ethernet network to meet the PDV fronthaulrequirements for HP traffic where PDVtotal=5µsec and PDVnode=1.2µsec. 74
6.9 PLR comparison between LP and HP traffics of Ethernet switch andFronthaul requirements for LP load=0.4. . . . . . . . . . . . . . . . . . . 75
B.1 Requirements of demanding services and applications based on ITU-Trecommendation Y.1541 [SSR11] . . . . . . . . . . . . . . . . . . . . . . 98
List of Acronyms
1G First Generation.
2G Second Generation.
3G Third Generation.
3GPP 3rd Generation Partnership Project.
5G Fifth Generation.
AWG Arrayed Wavelength Grating.
BBU Base Band Unit.
BE Best Effort.
BER Bit Error Rate.
BS Base Station.
BTS Base Transceiver Station.
C/M Control and Management functions.
CDMA Code Division Multiple Access.
CMCC China Mobile Communications Corporation.
CoMP Coordinated Multiple Point transmission and receptions.
CPRI Common Public Radio Interface.
C-RAN Cloud Radio Access Network.
CWDM Coarse Wavelength Division Multiplexing.
DA Destination Address.
xv
DL DownLink.
D-RoF Digital Radio over Fiber.
DWDM Dense Wavelength Division Multiplexing.
E2E End to End.
FCS Frame Check Sequence.
FDD Frequency Division Duplexing.
FDL Fixed Delay Line.
FDMA Frequency Division Multiple Access.
FEC Forward Error Correction.
FIFO First-In First-Out.
GE Gigabit Ethernet.
GPS Global Positioning System.
GSM Global System for Mobile Communication.
GST Guaranteed Service Transport.
HARQ Hybrid Automatic Retransmit reQuest.
HetNet Heterogeneous Network.
HP High Priority.
HSDPA High Speed-Downlink Packet Access.
HSPA High Speed Packet Access.
HSUPA Enhanced High-Speed Uplink Packet Access.
IEEE Institute of Electrical and Electronics Engineers.
IETF Internet Engineering Task Force.
IHON Integrated Hybrid Optical Networks.
IT Information Technology.
ITU International Telecommunication Union.
ITU-T International Telecommunication Union - Telecommunication.
LAN Local Area Network.
LNA Low Noise Amplifier.
LP Low Priority.
LTE Long Term Evolution.
LTE-A Long Term Evolution-Advanced.
MAC Medium Access Control.
MBH Mobile Backhaul.
MFH Mobile Fronthaul.
MIMO Multiple Input Multiple Output.
MU Mekelle University.
NMT Nordic Mobile Telephone.
NTNU Norwegian University of Science and Technology.
OADM Optical Add/Drop Multiplexer.
OAM Operation Administration and Maintenance.
OBS Optical Burst Switched.
OBSAI Open Base Station Architecture Initiative.
OCS Optical Circuit Switched.
ODF Optical Distribution Frame.
OFDMA Orthogonal Frequency Division Multiple Access.
OpEx Operational Expense.
OpMiGua Optical packet-switched Migration-capable networks with service Guar-antees.
OPS Optical Packet Switched.
OTN Optical Transmission Network.
OXC Optical Cross Connect.
PDV Packet Delay Variation.
PLR Packet Loss Ratio.
PON Passive Optical Network.
PTP Precision Time Protocol.
PtP Point to Point.
QoS Quality of Service.
RAN Radio Access Network.
RAT Radio Access Technology.
RF Radio Frequency.
RoE Radio over Ethernet.
RRH Remote Radio Head.
RTT Round Trip Time.
RU Radio Unit.
SA Source Address.
SDH Synchronous Digital Hierarchy.
SDR Software Defined Radio.
SFP Small Form-factor Pluggable.
SM Statistical Multiplexing.
SOF Start of Frame.
SONET Synchronous Optical Network.
TACS Total Access Communication System.
TCO Total Cost of Ownership.
TDM Time Division Multiplexing.
TDMA Time Division Multiple Access.
TSN Time-Sensitive Networking.

UDWDM Ultra Dense Wavelength Division Multiplexing.
UE User Equipment.
UL UpLink.
UMTS Universal Mobile Telecommunications System.
VLAN Virtual Local Area Network.
VLSI Very Large-Scale Integration.
WCDMA Wideband Code Division Multiple Access.
WDM Wavelength Division Multiplexing.
WiMAX Worldwide Interoperability for Microwave Access.
WRON Wavelength Routed Optical Network.

Chapter1Introduction
1.1 Introduction
Mobile network architectures are usually split into three parts: Radio Access Network(RAN), backhaul network and core network [Gro]. The RAN consists of systemsand technologies performing radio-access related functions such as managing radiotransmission and reception to/from mobile devices. There is a standard called RadioAccess Technology (RAT) that defines the interfaces, protocols, and the architectureand specific functions. An example of RAT includes Wideband Code DivisionMultiple Access (WCDMA)/High Speed Packet Access (HSPA), LTE, WorldwideInteroperability for Microwave Access (WiMAX) · · · etc. Traffic aggregation andtransport between the core network and the RAN is performed by the backhaulnetwork. Since the architecture and implementation of the backhaul networks arealmost agnostic with respect to RAN and core architectures, they are not definedby RAT standards. Eventually, the core network performs all non-radio accessrelated functions and used as the gateway towards all fixed and mobile networks,mainly towards Internet. In most cases, functions and interfaces of core networks arestandardized according to the adopted RAT. The User Equipment (UE) are directlyconnected to the BS of RAN via the radio link, and evolution of this BS undergoesseveral changes and leads to the new RAN network, C-RAN. The terms BS (forC-RAN) and Base Transceiver Station (BTS) (for traditional network LTE network)are used interchangeably in this context as they are referring to the same concept.
1.2 Background and Motivation
BSs for mobile communication have been evolved from a bulky rack-full of equipmentto multiple form factors aimed at different deployment scenarios. Traditionally,the collection of these multiple stand-alone BSs/BTSs has been treated as RANsor cellular networks [LPHL14]. A single BTS had multiple transceivers to serveseveral different frequencies and different sectors of a cell when a sectorized BS
1
2 1. INTRODUCTION
is considered and covers a small geographical area, whereas a group of BTS maycover a large continuous geographical area. Each BTS was responsible for processingand transmitting its own signal to and from UE, and forwards the data payload toand from the UE and out to the core network through the mobile backhaul. Thecellular network has evolved through a series of innovations aimed at unified targets:performance and efficiency in high mobile environment [Msh12], beginning with theanalog First Generation (1G) cellular networks to Fifth Generation (5G) (which isexpected to be deployed initially in 2020 to provide about 1000 times higher wirelessarea capacity and save up to 90% of energy consumption per service compared withthe current 4G system [ABC+14] [PLJ+14]). The 1G system provided the basicmobile voice service based on analog radio transmission techniques. It employedFrequency Division Multiple Access (FDMA) to multiplex traffic flows. Nordic MobileTelephones (NMTs) and Total Access Communication Systems (TACSs) were thetwo most popular analog systems, offered handover and roaming capabilities, butthey were unable to interoperate between countries.
Second Generation (2G) mobile systems provided an increased voice capacitydelivering mobile to the masses. They are characterized by digitization and com-pression which allowed the accommodation of many more mobile users in the radiospectrum through either time (Global System for Mobile Communication (GSM)) orcode (Code Division Multiple Access (CDMA)) multiplexing [Msh12]. Compared to1G system, 2G system offered higher spectrum, higher efficiency, better data services,and more advanced roaming. GSM was deployed to provide a single unified standardand enable seamless services throughout Europe by means of international roam-ing. To support multiple users, GSM uses Time Division Multiple Access (TDMA)technology, and it has been contentiously improved to offer better services. Thedevelopment of new technologies based on the original GSM technology leads toadvanced systems.
In 1G and 2G cellular networks, the BTSs were equipped with its own coolingsystem, battery backup, monitoring system, and so on. It implies that the BTShad an all-in-one architecture, an architecture where all power, analog, and digitalfunctions are housed in a single container as large as a refrigerator and is commonlyfound in large cell deployments. Since each BTS is working on its own, it doesn’treduce the interference with other BTSs by using collaboration algorithms such asgenetic algorithm [GKB+06]. In addition, it is hard to upgrade and repair becauseof the all in one BS.
In addition to the shortcoming of the BS architecture, increasing network trafficdemand, limited bandwidth availability and mass adoption of mobile broadbandwere the major challenges of traditional cellular networks. As a consequence, telecomoperators were seeking new ways to increase network capacity and coverage while
1.2. BACKGROUND AND MOTIVATION 3
reducing time to market for new services and achieving lower Total Cost of Ownership(TCO) [Eri15]. To achieve these goals, they needed a cost effective combinationof several standards (GSM, LTE, and others), transport technologies, frequencyband and cell layers while handling the substantial high capacity demand. Toaccommodate the substantial high capacity demand in cellular systems, reducingcell size to increase the network capacity by improving the spatial reuse of radioresources could be one possible solution. However, it causes an increased system costto provide coverage areas with small cells due to construction and operation relatedproblems. As a result, a new RAN architecture based on distributed BS , C-RAN,has been proposed [Ins11] [NMW+12] to address the above mentioned challenges.And the 3GPP has been taken the evolution of radio access technology through HighSpeed-Downlink Packet Access (HSDPA) and Enhanced High-Speed Uplink PacketAccess (HSUPA).
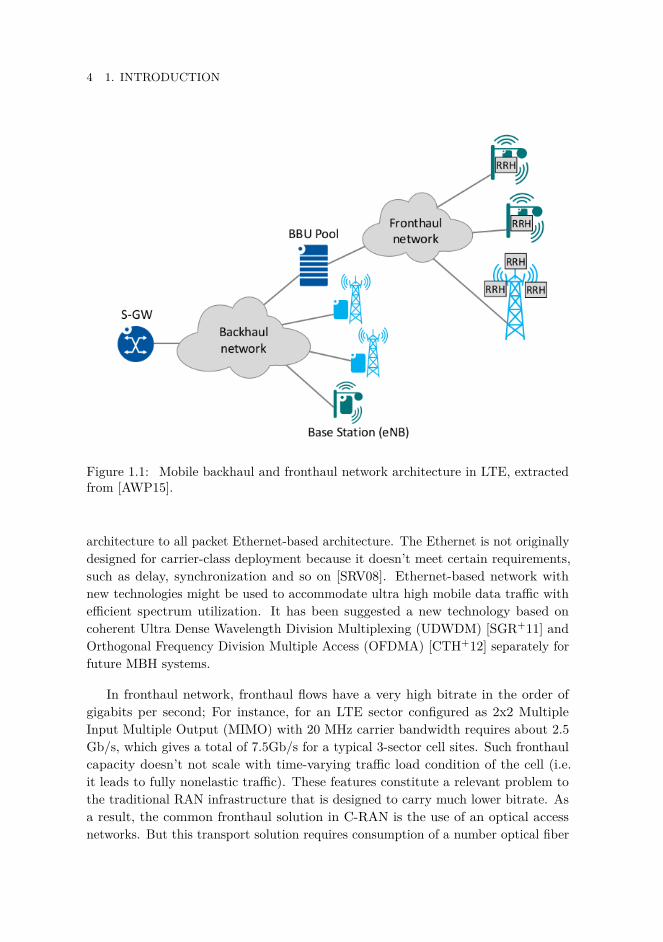
Later, in Third Generation (3G) deployment, a distributed BS was introducedwhere the RRHs and BBUs are separated using fiber links with digital basebandinterfaces, such as CPRI and Open Base Station Architecture Initiative (OBSAI).At this stage, the concept of fronthaul was introduced. Unlike traditional cellularnetworks that are built with many all-in-one BS architectures, C-RAN can be viewedas an architecture evolution based on distributed BSs. To enable flexible deployment,C-RAN or C-RAN architecture divide the BS into BBU and RRHs. Figure 1.1illustrates the segment where fronthaul and backhaul are located in the overallmobile network. Fronthaul is a segment that connects RRH and BBU, whereasbackhaul accounts for the segment between the core network and the edge of theentire telecommunication network, and the physical medium can be fiber, copper,and microwave. As seen from Figure 1.1, C-RAN is a fronthaul architecture thataddresses capacity and coverage issues while supporting mobile xHaul (x can beFronthaul or Backhaul) solutions. It also provides great benefits in controlling ongoingoperational costs, improving network security, network controllability, network agilityand flexibility [CPLC+13] [Ins11]. The detailed description of C-RAN is presentedin Chapter 2.
As previously mentioned, Mobile Backhaul (MBH) network comprises any of thethree listed physical mediums: optical fiber, copper, and microwave radio. Oldergeneration networks rely on leased E1/T1 copper line for backhaul connectionbetween cell sites and BS controller [TZJ11] [ZBJ08]. Because of its low latency,deterministic QoS, and synchronization ability, T1/E1 lines are highly suitable forvoice service [TZJ11]. Due to mass adoption of mobile broadband and increasingdemand of bandwidth per subscriber, operators must build large numbers of newcell sites. As a result, the leased copper lines would cost a high Operational Expense(OpEx) and is no longer suitable for future MBH. To combat these challenges, carriersare working on transforming from the Time Division Multiplexing (TDM) based
4 1. INTRODUCTION
Figure 1.1: Mobile backhaul and fronthaul network architecture in LTE, extractedfrom [AWP15].
architecture to all packet Ethernet-based architecture. The Ethernet is not originallydesigned for carrier-class deployment because it doesn’t meet certain requirements,such as delay, synchronization and so on [SRV08]. Ethernet-based network withnew technologies might be used to accommodate ultra high mobile data traffic withefficient spectrum utilization. It has been suggested a new technology based oncoherent Ultra Dense Wavelength Division Multiplexing (UDWDM) [SGR+11] andOrthogonal Frequency Division Multiple Access (OFDMA) [CTH+12] separately forfuture MBH systems.
In fronthaul network, fronthaul flows have a very high bitrate in the order ofgigabits per second; For instance, for an LTE sector configured as 2x2 MultipleInput Multiple Output (MIMO) with 20 MHz carrier bandwidth requires about 2.5Gb/s, which gives a total of 7.5Gb/s for a typical 3-sector cell sites. Such fronthaulcapacity doesn’t not scale with time-varying traffic load condition of the cell (i.e.it leads to fully nonelastic traffic). These features constitute a relevant problem tothe traditional RAN infrastructure that is designed to carry much lower bitrate. Asa result, the common fronthaul solution in C-RAN is the use of an optical accessnetworks. But this transport solution requires consumption of a number optical fiber
1.2. BACKGROUND AND MOTIVATION 5
links, which are scarce and needs huge investment by operators. For example, inareas where there is dynamic user expectation like clients are engaged in mobile-savvyactivities-from texting to video phone calls such as in ultra-modern stadium anddense population area (like China), requires a new emerging technology: the C-RAN.In such scenarios, using fiber as full fronthaul network may not be economicallyavailable to the rooftop where the RRH needs to be deployed [Ler14]. In other cases,installing fiber in existing tower may prove to be a challenging problem. And alsodeploying traditional small cell sites in suburban and road areas (where more capacityis needed to meet fast growing traffic demand) are not realistic solutions for theseareas that form a high percentage of an operator’s footprint. As a complement to theboth traditional small cell and fiber, a new fronthaul network that can extend theexisting traditional small sites and enable quick deployment of cell site with muchlower TCO is needed. Another technology such as WDM and OTN could save fiberconsumption, however, the cost of introducing these additional transport equipmentmakes economically not viable for operators. Hence, the current Mobile Fronthaul(MFH) solutions are rather short-term approaches and needs improvement in boththe topology and technology. As an attempt to address this issue, some of the recentresearch is focusing on Ethernet-based fronthaul transport network pushed by theirlower costs, ability to employ statistical multiplexing, and improved performance.
Using Ethernet in the fronthaul [GCT+15] has been proposed to take some ad-vantages: lower cost equipment, shared use of lower-cost infrastructure with fixedaccess networks, obtaining statistical multiplexing, and optimized performance. De-spite of their attractive advantages, Ethernet also comes with their own challenges:achieving low latency and jitter to meet delay requirements, and ultra high bitrate requirements for transporting radio streams for multiple antennas in increasedbandwidth [GCT+15]. For the above reasons, the current fronthaul networks areincreasingly integrating more cost-effective packet switched technology, especially Eth-ernet/Internet technologies. The former disadvantage will be explored in this study,while the latter is studied in detailed in [GCT+15]. In addition to standard Ethernetswitch used by Ethernet, there is another node, H1, developed by transpacket [Tra13]employed in IHON fusion solution. Fusion solution/IHON that uses standard Eth-ernet technology rather than all-optical switching technology provides the fusionproperties of circuit and packet switching network in packet network [Tra13]. Itenables Ethernet transport and ensures strict QoS for GST traffic, and optimizeresource utilization by introducing SM traffic in the unused capacity.
Moving from this background, we intend to study the transport of radio signalsover Ethernet technology using the two types nodes: standard switches and IHONnodes, H1. In particular, we focus on three performance metrics to evaluate the radioover Ethernet IHON mobile fronthaul networks ( latency, PLR, and PDV) with relatedtarget compared to the standard Ethernet network. The main motivation of this

6 1. INTRODUCTION
thesis is dealing with the level of timing performance required and studying on howwell this timing be supported in an IHON Ethernet mobile fronthaul. Furthermore,It is targeted to find how the IHON hybrid principle may be applied and how it willperform in a network containing only a few, or only a single wavelength channel.
With packet-based C-RAN realization, the MFH issue has been one of thebiggest challenges. As a result, several continuous studies/efforts towards an MFHhave been made even though they haven’t touched the root of the MFH itself.Institute of Electrical and Electronics Engineers (IEEE) 802.1CM [Gro] has begunthe development of a potential new work item on Time-Sensitive Networking (TSN)for MFH. ORI [ETS] is studying how to reduce the CPRI data rate using compressiontechnology. In addition, the use of Ethernet to transport the CPRI data traffic isunder discussion by the CPRI Forum, while the design of CPRI encapsulation onEthernet packets has begun by the IEEE 1904.3 Task Force [For].
1.3 Statement of the Problem
Fronthaul network, between BBU pool and RRHs, needs tight requirement of latency,PDV, PLR, jitter, and time and frequency synchronization. To meet these require-ments, several transport options have been used and proposed; optical access networks(such as dedicated fiber, passive WDM, active WDM, and OTN), microwave, andEthernet as a fronthaul solution. Using optical access network requires consumptionof a number of optical fiber links which needs a huge investment by operators. Infact, it may employ multiplexing technique to reduce the number of fiber used fortransporting the high bit rate fronthaul flows, but still it doesn’t apply the concept ofstatistical multiplexing to further reduce the cost. On the other hand, a microwaveis an emerging fronthaul solution for short distance RAN architecture.
In this thesis work, we are motivated to investigate the feasibility of fronthaulnetworks over IHON network. We believe that the use of these fronthaul transportoptions can bring several advantages: use of statistical multiplexing, reduced cost,and optimized performance. Given the tight fronthaul requirements, this thesisfocuses on the evaluation of IHON networks for fronthaul solution or not. The thesisis further extended to validate and evaluate whether the Ethernet network can fulfillthe requirements of fronthaul network. In general, this project will evaluate theEthernet technology and IHON network for C-RAN fronthaul network. Furthermore,the requirements of fronthaul network are checked against the evaluated results ofthis work.
1.4 Objectives of the Thesis
The objective of this work is to perform and analyze the following goals:-
1.5. METHODOLOGY 7
• Investigate and identify the possible fronthaul solutions for C-RAN in mobilenetworks.
• Collect the fronthual requirements for mobile networks with respect to differentperformance metrics.
• Study the latency and timing required for transporting RoE packets.• Examine the Ethernet frame format supporting radio signals in mobile networks.• Study the potential benefits that brings into Ethernet mobile fronthaul.• Identify the challenges/ parameters difficult to achieve in mobile networkfronthaul.
• Evaluation of fusion/IHON network for fronthaul networks in terms of latency,PLR, and PDV.
• Investigate the performance of Ethernet network for fronthaul networks em-phasizing on measuring PLR, latency, and PDV.
1.5 Methodology
To achieve the above mentioned objectives, a list of methods were set up: research ofscientific papers relevant to this topic and analytical/simulation method were used.
Research methodology
Background research, conference papers, white papers, International Telecommuni-cation Union - Telecommunication (ITU-T), IEEE 1904.3, IEEE 802.1CM (TSN),and Internet Engineering Task Force (IETF) standard recommendations were usedto collect the fronthaul requirements and study the overview of CRAN. Differenttransport options other than Ethernet were studied in order to get acquainted theprinciples of fronthaul networks.
Analytical and Simulation methods
An analytical model designed to mathematically model the performance metrics hasbeen used to numerically present our results. The programming language chosen toconstruct the simulation model is Simula based on Discrete Event Modelling OnSimula (DEMOS) software, a context class for discrete event simulation. Moreover,Matlab has been used for post processing of raw data’s from the simulator andplotting the data’s with error bars. The simulations were ran 10 times by varyingsimulation seeds for each data points, and the results were reported with 95%confidence interval.
1.6 Thesis Outline
The rest of this thesis is organized as follows:

8 1. INTRODUCTION
Chapter 2: Cloud Radio Access Network(C-RAN) describes the evolution,architectural background, component, advantage, and challenges of C-RAN em-phasizing on the BBU and RRHs detail. Several fronthual transport options arealso given and discussed. At the end, an overview of Ethernet packet frame formatfor transporting RoE packets is presented.
Chapter 3: Fronthaul Requirements presents the requirements and challengesof fronthaul networks focusing on the key performance elements: data rate, latency,packet delay variation. It also presents the synchronization of baseband radiosignals.
Chapter 4: Integrated Hybrid Optical Network(IHON) describes the threetypes of hybrid optical network architectures and principle of Optical packet-switched Migration-capable networks with service Guarantees (OpMiGua). Itemphasis on the principles, properties and main characterstic of IHON or fusionnetworking. A detailed insight on the delay and PDV of IHON and Ethernetstandard switch, IHON node aggregation, and an algorithm to compute the interpacket gap are also given.
Chapter 5: Analytical/Simulation Model presents the numerical analysis ofthe different fronthaul options described in Chapter 2. The simulation model forIHON and Ethernet Switch is also described thoroughly.
Chapter 6: Results and Discussions present the results obtained from thesimulator. A comparison of the performance of IHON and Ethernet switch is givenwith the help of figures and tables. A more comprehensive discussion based on theobtained results is dealt. This chapter also presents the latency, PLR, and PDVrequirements to achieve the mobile fronthaul requirements.
Chapter 7: Conclusion and Summary wraps up and summarizes the wholethesis work.
Chapter 8: Future work presents some suggestions and ideas for further inves-tigation that weren’t covered in this work.

Chapter2Cloud Radio AccessNetwork/C-RAN
In this chapter, the focus is on the role of C-RAN architecture in today’s mobilenetworks. In addition, the evolution of BS architecture is discussed, and the criticaldrawbacks of the fronthaul network transport option are detailed. A clarificationof C-RAN architecture, a various component of C-RAN, and the use of an opticalnetwork for C-RAN network is described. The motivation behind the use of Ethernetand framing of data’s for Ethernet is also explained.
2.1 Introduction
An inevitable use of mobile devices (e.g. smartphones and tablets), which are thesource of an explosion traffic, requires some radical changes to the existing mobilenetwork technologies and architecture. A novel LTE RAN is one of the changes whichis already introduced, and it is adopted to increase spectrum efficiency and serve hightraffic density areas by deploying additional micro-cells in the cell cites. Several otherimprovements are being performed by academic and industrial research. C-RAN canbe regard as one of the ways to evolve the mobile networks and architectures.
C-RAN is a proposed architecture for future cellular networks, which has the po-tential of combining emerging technologies from both the wireless and the InformationTechnology (IT) industries by incorporating cloud computing into RANs. Since it wasfirst proposed by China Mobile Communications Corporation (CMCC) in 2011, fur-ther research and development have been pursued [Ins11]. The letter ’C’s in C-RANcomes from the four main characteristics of C-RAN: Cloud, Centralized processing,Cooperative, and Collaborative or Clean. The main idea in C-RAN is basebandunits from multiple BS are pooled into centralized BBU pool so that they can beshared between BSs of several cell sites, statistical multiplexing gains [CCY+15].This implies that the network architecture is able to adapt to non-uniform traffic andutilizes the pooled BSs more efficiently. Compared to traditional cellular architecture,C-RAN needs fewer BBUs which directly reduces the cost of network operation. In
9

10 2. CLOUD RADIO ACCESS NETWORK/C-RAN
the following sections, we present the evolution of BS.
2.2 Evolution of BS Architecture
Based on the placement and implementation of BS, the BS has evolved through threemain steps. Figure 2.1 illustrates the first traditional generation macro base station,mobile network infrastructure based on all in one BS architecture, in which all BShardware is located in a radio cite cabinet, and the antennas are driven throughcoaxial cables. BS hardware like the BBU, Radio Unit (RU), power unit, and batterybackup were located at the base of a tower. It doesn’t employ the BBU hotelling,also called BBU hostelling. Hence, the BBU is implemented as a single form factordevice. As it is seen from Figure 2.1, there is no fronthaul network as both BBU andRRH are located in the same cell site cabinet. The length of the separation betweenRRH and their respective transmission and reception antenna can be up to somemeters or ten meters depending on the topology of the cell site. Consequently, theyexperience a negligible power loss.
Figure 2.1: Base station architecture for traditional macro BS (no BBU hotelling),extracted from [CCY+15].
In the second step, Figure 2.2, with fiber based interconnection the RRH containingthe Radio Frequency (RF) transmit and receive components is collocated with theantenna at the top of the cell site thus only short coaxial jumper are used for theconnection to the antennas. The RRH is linked to the BBU in the cabinet using aDigital Radio over Fiber (D-RoF) protocol such as either the CPRI [Int16] or theOBSAI [OBS16]. Using an optical interface allows a much lower power consumptionapproach at higher data rates within the cell. Thus, this is a first preliminary

2.3. C-RAN ARCHITECTURE 11
step for all BBU hotelling solutions, where BBU an RRHs are separated. RRHsare implemented as a stand-alone devices embedding their own power and coolingsubsystems. Since the RRH is placed close to antennas, the power consumption iscomparatively (to all-in.one BS) is reduced. This is because the power margin forthe coaxial cable connecting RRH and antenna loss is much lower.
Figure 2.2: Base station architecture for BS with RRH, extracted from [CCY+15].
2.3 C-RAN Architecture
Figure 2.3 shows the third step of mobile network evolution, C-RAN. The conceptfrom which C-RAN moves is the splitting of traditional BSs into RRH and BBU. Itintroduces centralized, collaborative, and cloud and clean system, to optimize cost andenergy consumption in the field of mobile networks [HDCCL14] [WZZ14]. Figure 2.3presents a simplified overall C-RAN architecture. Furthermore, it centralizes theBBU processing resource together so that the resource could be managed andallocated dynamically on demand. Moving some part the radio network controlfunction from being collocated with the antenna at the cell site to the location deeperinto the network introduces a new transmission network into the overall networkinfrastructure-rMobile Fronthaul. This new C-RAN architecture offers many benefitsto operators such as in controlling operational cost, energy saving, improved spectralefficiency and resource efficiency, greatly increases the flexibility of the network, andfacilitation of service on edge.

12 2. CLOUD RADIO ACCESS NETWORK/C-RAN
Figure 2.3: Base station architecture for C-RAN with RRHs, extractedfrom [CCY+15].
2.3.1 C-RAN System Architecture
In [PWLP15], three different architectures are defined according to the constraintson fronthaul and the distribution functions between RRHs and BBUs.
•Full centralization: In this system structure, BBU is responsible for baseband pro-cessing (i.e., physical layer, layer 1), the Medium Access Control (MAC)(layer2), and the network layer (layer 3) functions. Due to the high bandwidth ofthe baseband radio signals, this option has higher requirements in transmittingsignals between RRH and BBU [Ins11]. As shown in Figure 2.4, the BBUcontains all processing and managing functions of the conventional BS. Thisstructure incurs a high burden on fronthaul. Nonetheless, it makes it clear andsimple, benefits in terms of operation and maintenance, and has capabilitiesto support multi-standards. Thus, the focus of this thesis will be in this kindarchitecture.
The RRH, on the other hand, deals with up/down conversions, amplificationof RF signals, filtering and interface adaptions.
•Partial centralization: In this sort of architecture, the RRH is responsible forRF related baseband processing and integrating RF functions while BBU areresponsible for all other functions of layer 1 and the upper layers (layer 1and layer 2) functions, as shown Figure 2.4. It greatly reduces the burden offronthaul and the RRH-BBU overhead. Some advanced features; for examplein LTE system such as Coordinated Multiple Point transmission and receptions(CoMP) and MIMO, however, can not be efficiently supported [PWLP15]. Itcreates a complex interaction between layer 1 and layer 2 functions.

2.3. C-RAN ARCHITECTURE 13
•Hybrid centralization: Some functions of layer 1 such as the cell-specific sig-nal processing functions and the user specific are removed from BBU andappended into a separate unit. The separate unit can be part of the BBUpool or not [PWLP15]. This structure can be regard as a special case of fullcentralization and has some benefits: support resource sharing and is capableof reducing energy consumption in BBUs.
Figure 2.4: Options of C-RAN system architecture including the split functions ofRRH and BBU, extracted from [PWLP15].
2.3.2 C-RAN Components
The general architecture of C-RAN consists of three main parts, namely (i) aRRH consisted of antenna system, (ii) a BBU pool, real-time cloud for centralizedprocessing, and (iii) a fronthaul network/transport infrastructure that connects RRHand BBU.
•RRH: In [MS12], Figure 2.5, RRH consists of antennas system, power amplifier,A/D converter, and Low Noise Amplifier (LNA) which basically perform analogprocessing can be mounted on the tower near the antenna. By conducting mostbaseband processing in BBU pool, these modules have much less complexity andenergy consumption which directly lowers their price. RRHs can be distributedin certain areas, first of all in urban areas with high traffic loads with a costefficient manner. They are mainly used to transmit high data rate RF signalsto mobile terminal in the downlink and forward the baseband signals from themobile terminal to the central processing unit, BBU in the uplink.
•BBU pool: The baseband signal processing is conducted in BBU that is linked bymeans of an optical fiber to RRH by using D-RoF technology. It consists ofan element whose purpose would be scheduling and processing the incomingsignals from different cell sites to virtual base station and optimizing radioresource allocation. Based on traffic aware scheduling of UEs and time varying

14 2. CLOUD RADIO ACCESS NETWORK/C-RAN
Figure 2.5: RRH components, adopted [LKB09].
channels, the processing capability is adaptively configured and the signalprocessing resources are dynamically allocated in the software defined BBU.This capability together with its modular design optimizes available space anddeployment time.
• Fronthaul/transport network: Fronthaul network is a segment which in differ-ent topological solutions to provide a connection between RRHs and BBUs withhigh capacity and low time latency [HDDM13] [PWLP15]. The link betweenRRHs and BBUs is realized through via different technologies, such as opticalfiber networks, cellular communication, and even wave communication. Andalso, the transmission can be done using two different protocols; CPRI andOBSAI. Both the standards employ radio signal digitisation or D-RoF.
2.3.3 Advantages of C-RAN
In this subsection, the major advantage of C-RAN is given based on [Ins11].
• Resource pooling
• Energy efficient with a centralized processing of the C-RAN, the number of BSand other site equipment’s power consumption can be largely reduced. Due tosharing of BBU pool among a large number of virtual BS, higher utilizationof processing resources and lower power consumption is achieved by severalmechanisms. For instance, an idle virtual BS can be selectively turned offwithout affecting the service commitment, especially at night where there is nomuch traffic, to reduce the processing power. Hence, C-RAN is an eco-friendlyinfrastructure.
• BS visualization: As a result of the visualization of BS in BBU pool, thecapacity of the RAN is improved. It also provides an easy sharing channel

2.4. OPTICAL NETWORKS FOR C-RAN 15
information, signaling and traffic data about the active UE in the system. Andalso, the visualization allows an easy implementation of joint processing andscheduling; for example, CoMP in Long Term Evolution-Advanced (LTE-A),to mitigate inter-cell interference and improved spectral efficiency.
• Adaptability to non-uniform Traffic
Depending on the movement of UEs, the traffic that can be supported by theserving RRH dynamically changes. Nonetheless, the serving BBU is still inthe same BBU pool. The non-uniform traffic generated from the UE can bedistributed in a BS of the sameBBU pool because the coverage area of BBUpool is larger than the traditional BS. Hence, the distributed BBU pool has aload balancing capability to adapt the dynamic traffic change.
• Coordination for interference mitigation(ICIC)
• Multi-technology support
C-RAN supports the multiple access technologies such as GSM, UniversalMobile Telecommunications System (UMTS) and LTE in the same BBU cloudso as to share the BBU. Though the implementation of these technologiesdiffers in their detailed function, the BBU designers should integrate them intoa single device for multiple RATs support. Software Defined Radio (SDR)based BBU is one of the possible schemes to process any protocols.
• No Global Positioning System (GPS) in each remote site
2.4 Optical Networks for C-RAN
The new connectivity segment between the centralized BBU and multiple RRHs isbased on D-RoF technology over fiber resources. WDM technology can be employedto deal with the high number of digital radio over fiber links per antenna site. Becauseof its lower cost, Coarse Wavelength Division Multiplexing (CWDM) could be thefirst approach. Table 2.1 summarizes the several existing optical solutions to achievetransport of fronthaul traffics in C-RAN and are detailed in Section 2.5.
16 2. CLOUD RADIO ACCESS NETWORK/C-RAN
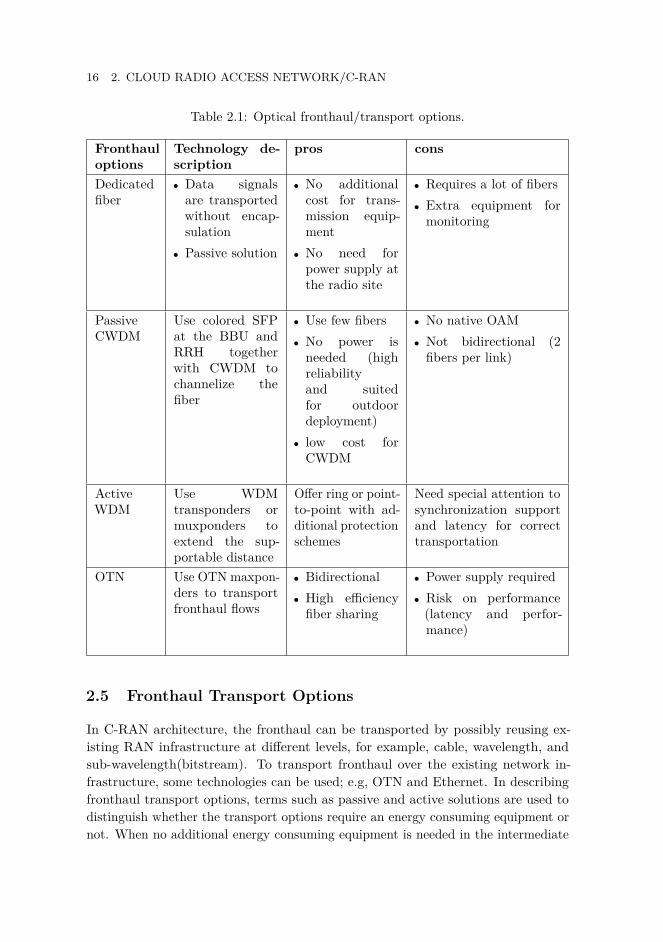
Table 2.1: Optical fronthaul/transport options.
Fronthauloptions
Technology de-scription
pros cons
Dedicatedfiber
• Data signalsare transportedwithout encap-sulation
• Passive solution
• No additionalcost for trans-mission equip-ment
• No need forpower supply atthe radio site
• Requires a lot of fibers• Extra equipment formonitoring
PassiveCWDM
Use colored SFPat the BBU andRRH togetherwith CWDM tochannelize thefiber
• Use few fibers• No power isneeded (highreliabilityand suitedfor outdoordeployment)
• low cost forCWDM
• No native OAM• Not bidirectional (2fibers per link)
ActiveWDM
Use WDMtransponders ormuxponders toextend the sup-portable distance
Offer ring or point-to-point with ad-ditional protectionschemes
Need special attention tosynchronization supportand latency for correcttransportation
OTN Use OTN maxpon-ders to transportfronthaul flows
• Bidirectional• High efficiencyfiber sharing
• Power supply required• Risk on performance(latency and perfor-mance)
2.5 Fronthaul Transport Options
In C-RAN architecture, the fronthaul can be transported by possibly reusing ex-isting RAN infrastructure at different levels, for example, cable, wavelength, andsub-wavelength(bitstream). To transport fronthaul over the existing network in-frastructure, some technologies can be used; e.g, OTN and Ethernet. In describingfronthaul transport options, terms such as passive and active solutions are used todistinguish whether the transport options require an energy consuming equipment ornot. When no additional energy consuming equipment is needed in the intermediate
2.5. FRONTHAUL TRANSPORT OPTIONS 17
nodes or end points of the fronthaul network which in turn leads to lower operationalcost and less maintenance, it is called a passive solution. On the other hand, anactive solution requires an energy consuming intermediate nodes or end points andis less robust than passive solutions.
The following subsections describe the transport options which are potentialcandidates for CPRI transport, but it is implied that several cases can be obtainedby combining some of the transport options.
2.5.1 Dedicated Fiber
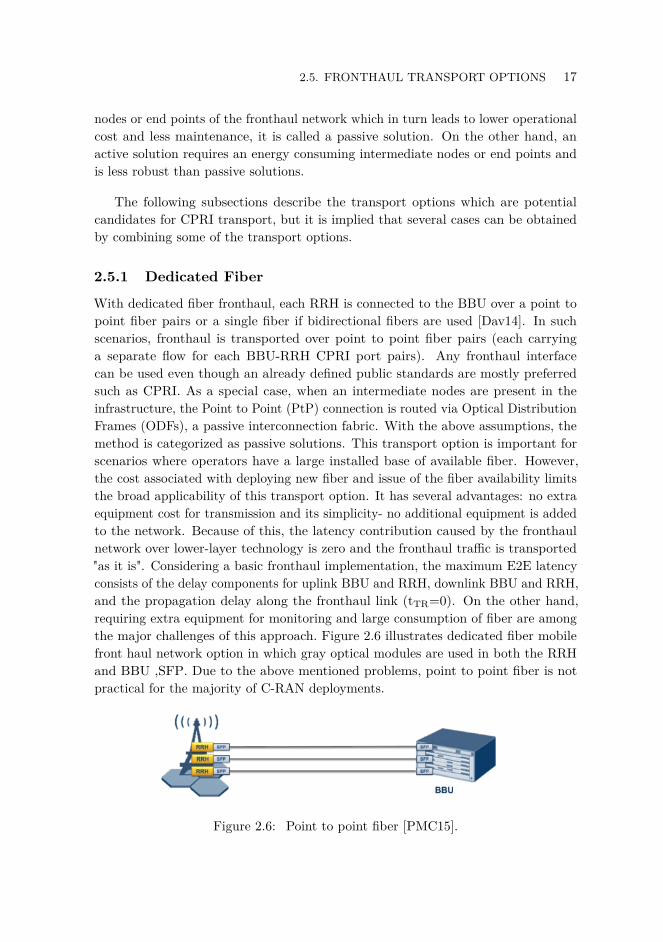
With dedicated fiber fronthaul, each RRH is connected to the BBU over a point topoint fiber pairs or a single fiber if bidirectional fibers are used [Dav14]. In suchscenarios, fronthaul is transported over point to point fiber pairs (each carryinga separate flow for each BBU-RRH CPRI port pairs). Any fronthaul interfacecan be used even though an already defined public standards are mostly preferredsuch as CPRI. As a special case, when an intermediate nodes are present in theinfrastructure, the Point to Point (PtP) connection is routed via Optical DistributionFrames (ODFs), a passive interconnection fabric. With the above assumptions, themethod is categorized as passive solutions. This transport option is important forscenarios where operators have a large installed base of available fiber. However,the cost associated with deploying new fiber and issue of the fiber availability limitsthe broad applicability of this transport option. It has several advantages: no extraequipment cost for transmission and its simplicity- no additional equipment is addedto the network. Because of this, the latency contribution caused by the fronthaulnetwork over lower-layer technology is zero and the fronthaul traffic is transported"as it is". Considering a basic fronthaul implementation, the maximum E2E latencyconsists of the delay components for uplink BBU and RRH, downlink BBU and RRH,and the propagation delay along the fronthaul link (tTR=0). On the other hand,requiring extra equipment for monitoring and large consumption of fiber are amongthe major challenges of this approach. Figure 2.6 illustrates dedicated fiber mobilefront haul network option in which gray optical modules are used in both the RRHand BBU ,SFP. Due to the above mentioned problems, point to point fiber is notpractical for the majority of C-RAN deployments.
Figure 2.6: Point to point fiber [PMC15].

18 2. CLOUD RADIO ACCESS NETWORK/C-RAN
2.5.2 Passive WDM
Passive WDM-based fronthaul deploys WDM networking to a fronthaul network [TMC14].Traffic flows in the fronthaul network are transmitted on separate wavelength channelsusing WDM transceivers operating according to WDM technology. This enables mul-tiplexing of several wavelengths into fewer fibers using a passive WDM multiplexer ineach cell sites. Figure 2.7 presents a passive WDM in which the incoming wavelengthsare split by means of passive demultiplexers and is sent to separate CPRI ports ofBBUs. Depending on the specific requirement of the network, CWDM or DenseWavelength Division Multiplexing (DWDM) technologies are directly deployed in theRRH and BBU with a passive Optical Add/Drop Multiplexer (OADM) to multiplexthe colored wavelength onto a single fiber pair. CWDM technology is best suited foroutdoor equipment because it doesn’t require temperature control and is capable ofmultiplexing about 16 wavelength channels into a single fiber. In most cases, themaximum number of RRH in cell site (assuming several sectors, RATs, and antennas)is less than this number of wavelengths. Hence, it is possible to aggregate all trafficflows of the whole cell site fronthaul into a single fiber. Comparing to dedicated fiber,this solution is more relevant because it greatly reduces the amount of fiber withoutaffecting the energy consumption. Below is a list of the major drawback and meritsof passive based Mobil fronthaul.
Figure 2.7: Passive WDM [PMC15].
Passive WDM-based fronthaul has the following advantages:
• Potential low cost for CWDM technology. Hence, it is the most practical one.• No need of active components on the passive multiplexer.Thus, it offers highreliability and is suitable for outdoor deployment.
• Reduce significant use of fiber.• Provide 16-channels per fiber (CWDM).
Despite their attractive advantages, passive WDM also comes with their owndisadvantages:
• Not bidirectional (It requires 2 fibers per link).• Inventory management required to align optics color with RRH-BBU link.
2.5. FRONTHAUL TRANSPORT OPTIONS 19
• Lack of native OAM: fault isolation is operationally challenging and expensive.• Lack of clear demarcation points between wireless access point and fronthaulequipment.
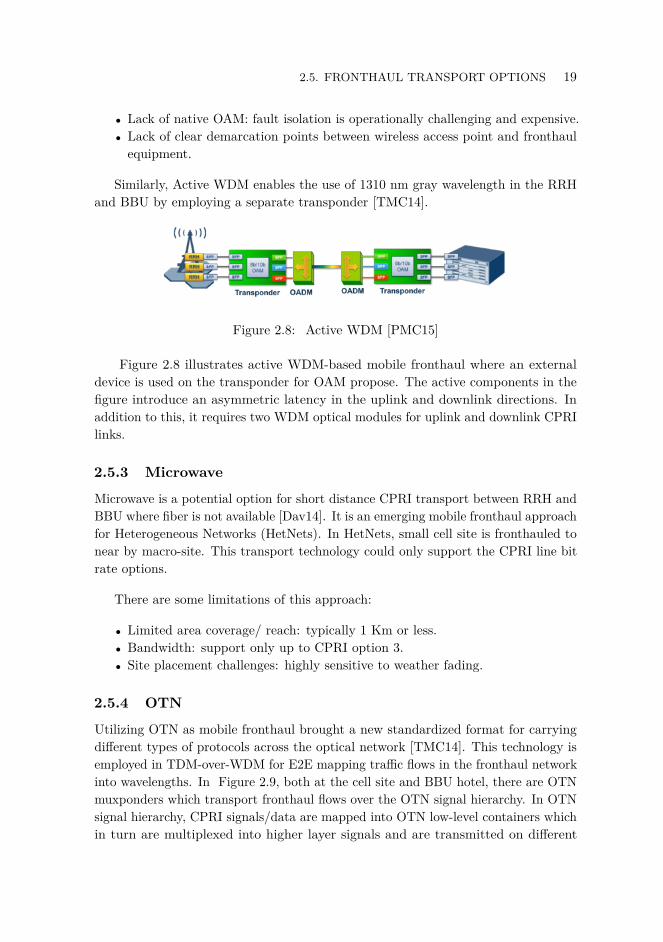
Similarly, Active WDM enables the use of 1310 nm gray wavelength in the RRHand BBU by employing a separate transponder [TMC14].
Figure 2.8: Active WDM [PMC15]
Figure 2.8 illustrates active WDM-based mobile fronthaul where an externaldevice is used on the transponder for OAM propose. The active components in thefigure introduce an asymmetric latency in the uplink and downlink directions. Inaddition to this, it requires two WDM optical modules for uplink and downlink CPRIlinks.
2.5.3 Microwave
Microwave is a potential option for short distance CPRI transport between RRH andBBU where fiber is not available [Dav14]. It is an emerging mobile fronthaul approachfor Heterogeneous Networks (HetNets). In HetNets, small cell site is fronthauled tonear by macro-site. This transport technology could only support the CPRI line bitrate options.
There are some limitations of this approach:
• Limited area coverage/ reach: typically 1 Km or less.• Bandwidth: support only up to CPRI option 3.• Site placement challenges: highly sensitive to weather fading.
2.5.4 OTN
Utilizing OTN as mobile fronthaul brought a new standardized format for carryingdifferent types of protocols across the optical network [TMC14]. This technology isemployed in TDM-over-WDM for E2E mapping traffic flows in the fronthaul networkinto wavelengths. In Figure 2.9, both at the cell site and BBU hotel, there are OTNmuxponders which transport fronthaul flows over the OTN signal hierarchy. In OTNsignal hierarchy, CPRI signals/data are mapped into OTN low-level containers whichin turn are multiplexed into higher layer signals and are transmitted on different
20 2. CLOUD RADIO ACCESS NETWORK/C-RAN
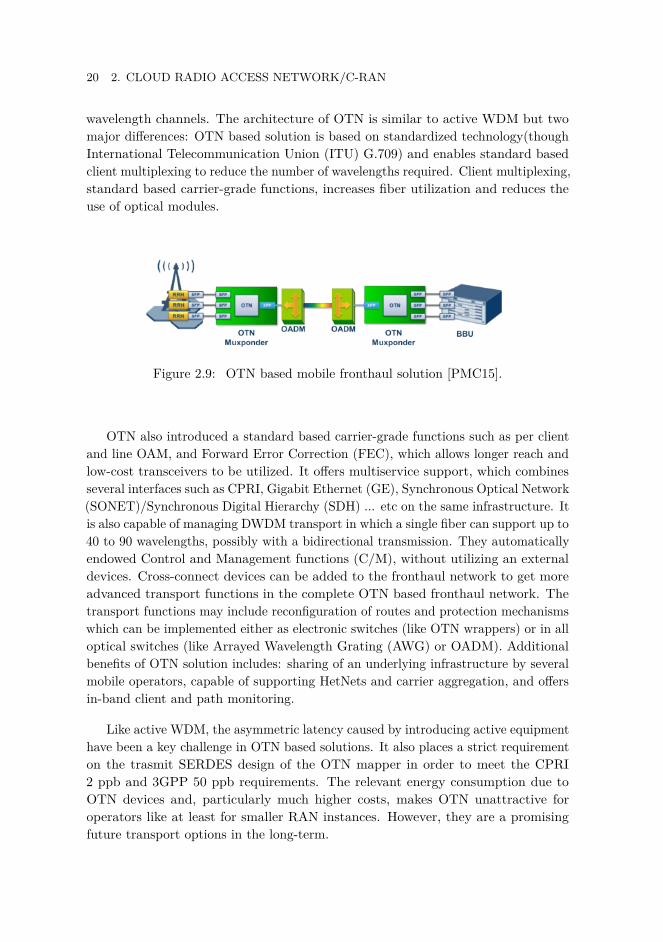
wavelength channels. The architecture of OTN is similar to active WDM but twomajor differences: OTN based solution is based on standardized technology(thoughInternational Telecommunication Union (ITU) G.709) and enables standard basedclient multiplexing to reduce the number of wavelengths required. Client multiplexing,standard based carrier-grade functions, increases fiber utilization and reduces theuse of optical modules.
Figure 2.9: OTN based mobile fronthaul solution [PMC15].
OTN also introduced a standard based carrier-grade functions such as per clientand line OAM, and Forward Error Correction (FEC), which allows longer reach andlow-cost transceivers to be utilized. It offers multiservice support, which combinesseveral interfaces such as CPRI, Gigabit Ethernet (GE), Synchronous Optical Network(SONET)/Synchronous Digital Hierarchy (SDH) ... etc on the same infrastructure. Itis also capable of managing DWDM transport in which a single fiber can support up to40 to 90 wavelengths, possibly with a bidirectional transmission. They automaticallyendowed Control and Management functions (C/M), without utilizing an externaldevices. Cross-connect devices can be added to the fronthaul network to get moreadvanced transport functions in the complete OTN based fronthaul network. Thetransport functions may include reconfiguration of routes and protection mechanismswhich can be implemented either as electronic switches (like OTN wrappers) or in alloptical switches (like Arrayed Wavelength Grating (AWG) or OADM). Additionalbenefits of OTN solution includes: sharing of an underlying infrastructure by severalmobile operators, capable of supporting HetNets and carrier aggregation, and offersin-band client and path monitoring.
Like active WDM, the asymmetric latency caused by introducing active equipmenthave been a key challenge in OTN based solutions. It also places a strict requirementon the trasmit SERDES design of the OTN mapper in order to meet the CPRI2 ppb and 3GPP 50 ppb requirements. The relevant energy consumption due toOTN devices and, particularly much higher costs, makes OTN unattractive foroperators like at least for smaller RAN instances. However, they are a promisingfuture transport options in the long-term.
2.5. FRONTHAUL TRANSPORT OPTIONS 21
2.5.5 Ethernet
Ethernet is the most widely deployed Local Area Network (LAN) technology andnearly ubiquitous standard technology in which frames arrive asynchronously becauseof their burstiness [Gro]. By asynchronously it means that when a frame is completelyprocessed, it is not deterministic when the next frame will arrive. With Ethernet,data are transmitted intermittently rather than in a steady data stream. During thedata transmission, an Ethernet link can be idle when there no frame to be processed.Thus, synchronizing nodes over Ethernet link in order to take the advantage of anidle period is more challenging in fronthaul mobile network.
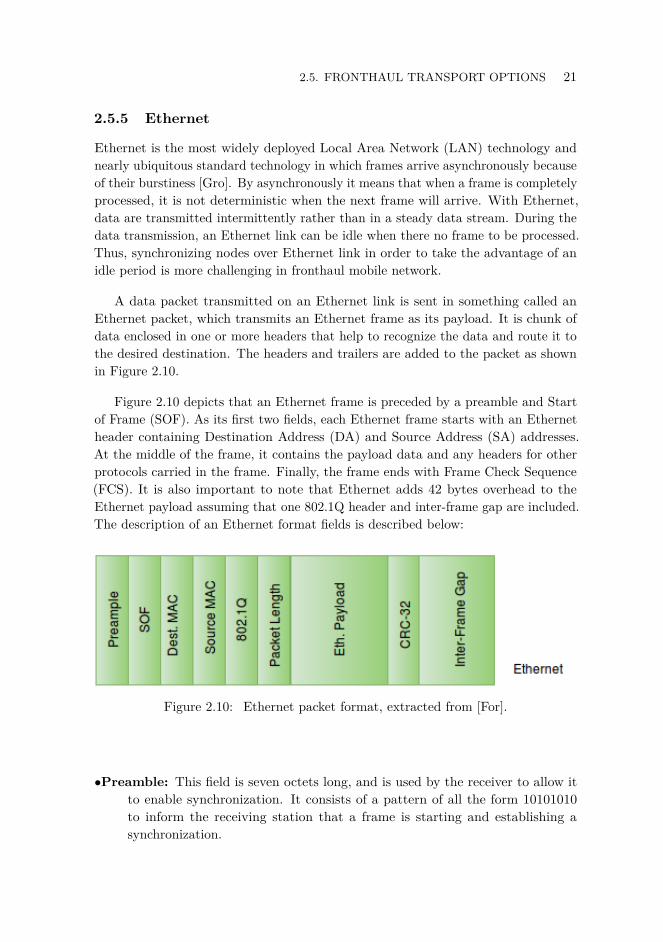
A data packet transmitted on an Ethernet link is sent in something called anEthernet packet, which transmits an Ethernet frame as its payload. It is chunk ofdata enclosed in one or more headers that help to recognize the data and route it tothe desired destination. The headers and trailers are added to the packet as shownin Figure 2.10.
Figure 2.10 depicts that an Ethernet frame is preceded by a preamble and Startof Frame (SOF). As its first two fields, each Ethernet frame starts with an Ethernetheader containing Destination Address (DA) and Source Address (SA) addresses.At the middle of the frame, it contains the payload data and any headers for otherprotocols carried in the frame. Finally, the frame ends with Frame Check Sequence(FCS). It is also important to note that Ethernet adds 42 bytes overhead to theEthernet payload assuming that one 802.1Q header and inter-frame gap are included.The description of an Ethernet format fields is described below:
Figure 2.10: Ethernet packet format, extracted from [For].
•Preamble: This field is seven octets long, and is used by the receiver to allow itto enable synchronization. It consists of a pattern of all the form 10101010to inform the receiving station that a frame is starting and establishing asynchronization.
22 2. CLOUD RADIO ACCESS NETWORK/C-RAN
•SOF: The SOF delimiter is one byte filed, and it consists of a pattern of alternatingones and zeros but ending in two ones. The purpose of this field is to indicatethe start of the frame.
•Dest. MAC: This field is a six bytes long which contains the address of station forwhich the data is intended. By convention, Ethernet addresses are quoted as asequence of six bytes in hexadecimal. The left most significant bit determineswhether the destination is an individual (individual addresses have a mostsignificant bit of 0) or a group address (multicast addresses have a mostsignificant bit of 1). An interesting feature is that the next bit in the destinationaddress indicates whether the address is globally or locally administered. Ifthe bit is zero, the address is globally administered otherwise it is locallyadministered. Note that the remaining 46 bits are used for the destinationaddress.
•Src. MAC: This address contains the address of the sending station. It consistsof the address of six bytes and is always an individual address, hence, the leftmost bit is always zero.
•802.1Q: If present, it is a four byte field that indicates Virtual Local Area Network(VLAN) membership. 802.1Q uses an internal tagging mechanism to insertthe 4-byte tag field between the SA and length fields in the original Ethernetframe.
•Packet Length: This consists of two bytes field to provide the mac informationand indicate the number of data types contained in the payload field of theframe.
•Inter-Frame Gap: Inter-frame gap is idle time between frames. Before transmit-ting a new frame, a minimum of 12 bytes of idle line is required.
•Ethernet Payload: contains the payload and can be up to 46 bytes payload.
2.6 Radio over Ethernet
In order to enjoy the potential flexibility of BBU-RRH fronthaul, a traffic dependentand packet based topology and an interface is required. The main motivation behindRoE is that it allows mixing of several type of traffics such as radio signal for mobilecommunication , TV ...etc. Current fronthaul standards like CPRI was originallydefined as an internal BS interface to provide dedicated transport protocols forsampled radio waveform transport. In this case, the framing is carried out at theregular intervals by matching the length of frames to the specific slice of the wirelesssystem frames [GCT+15].
2.6. RADIO OVER ETHERNET 23
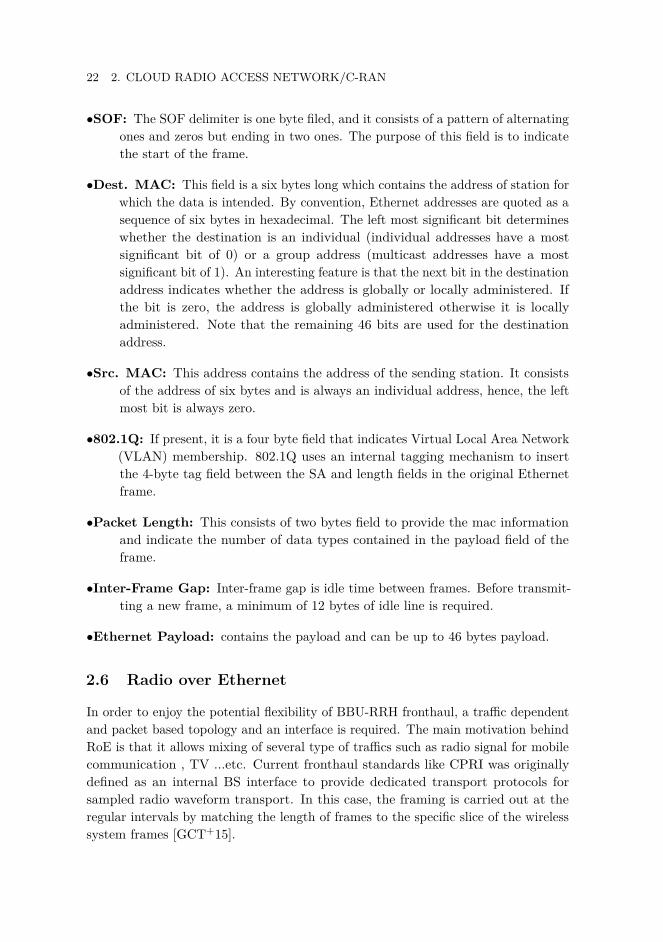
According to IEEE 1904.3 Task force, for transporting radio signals betweenRRH and BBU, either structure-agnostic or structure-aware encapsulation modecan be utilized, and the task group is developing a standard for encapsulating fron-thaul digitilized radio samples into Ethernet frames. Structure-agnostic encapsulatesdigitalized radio sample or data blob without know how about the transportedstream/flow whereas structure-aware encapsulates and knows the type of the trans-ported flows. In both modes, the encapsulation header is the same. In this subsection,we present the structure agnostic encapsulation format. Let us consider a fronthauldownlink, a data is encapsulated with the Ethernet header in the BBU pool and theheader is decapsulated in the RRH. Conversely, in the uplink, an Ethernet header isencapsulated to the data in the RRH and decapsulated from the Ethernet in BBU.As depicted in Figure 2.11, the structure of Ethernet packet for supporting digitalizedradio signal is shown. The Ethernet packet includes the traditional Ethernet headerand RoE or Ethernet payload which also contains the RoE header and RoE payload.
Figure 2.11: Ethernet packet format to support the Radio over Ethernet(RoE),extracted from [For].
RoE added a minimum of 6 bytes to the Ethernet packet. Figure 2.12 illustratesthe native RoE encapsulation format with minimal header of 32 bits (it can also beup to 6 octets) per Ethernet packet. The number of frame per Ethernet packetshighly affects the size of overhead (i.e when the number of basic frames per packet isgreater than small Ethernet packets, there will be a large overhead). Consideringboth the header added by Ethernet and RoE, a total of 48-98 bytes (depends on theoverhead added by RoE) is likely to occur per packet.
Below describes the fields shown in the Figure 2.12.
•Version(ver): The version field indicates the version of the RoE header being used.

24 2. CLOUD RADIO ACCESS NETWORK/C-RAN
Figure 2.12: Radio over Ethernet(RoE) fame structure, extracted from [For].
This specification defines the value to zero(0b00) as shown in the Figure 2.12from bit 31 to bit 28. However, new versions of the header may be defined inthe future specification.
•Packet type(pkt_type): This field contains the RoE packet subtype information.For example, the packet type 0X00 is reserved for control packets of RoE. Bits27 to 23, in Figure 2.12 shows the packet type in which one value is reservedfor future extension and one value for structure agnostic payload. There are 32types available and some of the types may include additional headers. Of the 32types, some of the packet types and their functions are mentioned in Table 2.2.
Table 2.2: Allocated RoE pkt_type values where TBD stands for To Be Defined (since RoE frame structure is an ongoing work, some of the packet type values arenot yet defined), extracted from [For].
pkt_type(inhexadecimal)
Function Meaning
0x00 Control packet Payload carrier TLVs for controlpurpose
0x01 Structure agnostic packet Content of the payload is unknownat the RoE protocol
0x02 Antenna flow TBD0x03 Vendor specific flow TBD0x04 Antenna control TBD0x05 Slow C and M TBD
•Flow ID(flow_id): The flow identifier field contains an identifier number for the
2.6. RADIO OVER ETHERNET 25
RoE packet flow. It is represented as unassigned integer between 0x0) and 0x7f.Hence, there are 128 flow id available in the RoE header and is indicated inthe bit 15 to 0. The benefit of having this field is for multiplexing individualRoE flows between source and destination address pair: For instance, multipleantennas behind one MAC address. The identifier basically allows splitting themultiplexed RoE flows from the underlying network provided that multiplexingmechanism is used. It has no "routing information" at the Ethernet layerand only interpreted by the end point applications. This means that eachSA/DA pair has their corresponding flow id number space. According to [For]discussion, the flow_id can identify two types of flows: a single AxC; or agroup of AxC. And also, the flow id assignment can be done either out of boundor be using the RoE control channel or protocol.
•Sequence number(seqnum): This consists of a 32 bits packets sequence numberfield. It is initialized to 0 (it would eliminate the need for a start of frame bit)and incremented by one on every sent packet irrespective of the contents ofthe packet. This implies that the sequence numbers do not hold informationabout the location of the data within the flow or stream but it would carry theinformation within the frame. A typical way of defining sequence number is abyte counter in which the counter value relates to the first byte in the packet.Thus, it is a generic way of understanding the data within the frame.
•Payload: The content of this field varies depending on the RoE subtype. Its formatand the control packet content relies on the control packet type.


Chapter3Fronthaul Network Requirements
This chapter presents dimensioning the mobile fronthaul requirements. In orderto meet the expected QoS for the end users, mobile fronthaul dimensioning playsan important role. Dimensioning requirement for C-RAN architectures featuring afronthaul network depends on the BBU and RRH separation distance. Thus, theamount of latency introduced to the fronthaul network must carfully be considered,and the actual timing performance also needs to be accuratly determined. As a result,the fronthaul network of C-RAN architecture imposes very stringent requirements.In the following sections, we focus on the four fronthaul network requirements1: datarate, latency, jitter & synchronization, and PDV.
Before moving on, there are various metrics which should be understood beforestudying the mobile fronthaul requirements which include;
1. Delay/Latency: It is the measure of the time taken for traffic to arrive atthe destination. This performance metrics consists of processing delay, queuingdelay, propagation delay and transmission delay.
2. Packet loss ratio: measures the ratio of the number of lost packets to thenumber of transmitted packets.
3. PDV: measures the difference in packet delay between selected packet in aflow.
4. Queue length: measures the length of a queue.5. Capacity: refers to the amount of traffic that can be accommodated by the
system (in bits/s or other units).6. Throughput: measures the quantity of successful traffic that reaches at the
destination.
1The requirements discussed in this chapter are based on symmetrical assumptions; the uplinkand downlink transmission occupy the same bandwidth.
27

28 3. FRONTHAUL NETWORK REQUIREMENTS
3.1 Requirements and Challenges of Fronthaul Networks
Enabling the open interoperability between BBU and RRH elements in fronthaulnetwork highly depends on the performance and synchronization requirements. Andalso, there are a number of challenges when a single BBU is shared by a number ofRRH. In the following subsections, the fronthaul requirements and challenges aredescribed throughly.
3.1.1 Data Rate
Traffic flows in the fronthaul network have a very high bitrate, usually on the orderof units to tens Gbit/s for a cell site, resulting from the aggregation of flows from oneor more antennas. The CPRI data rate depends on the RAT, carrier bandwidth, andMIMO implementation [PCDS14]. It can go from 614.4Mbits/s up to 10.17Gbit/secand are summarized in Table 3.1 with examples and their corresponding applications.For instance, for LTE-A with 4x4 MIMO and 20MHz carrier require approximately4.915Gbit/s CPRI rate per sector. Similarly, for one sector LTE with 20MHz and2x2 MIMO the CPRI rate is 2.457Gbits/s.
Table 3.1: Detailed CPRI capacity requirement and application in support of mobilebroadband where * means no information, extracted [PMC15].
CPRI CPRI Rate ExampleData Ca-pacity
Application
Option 1 614.4 Mbps 37.5 Mbps – 2G/3G Radios– 10 MHz 1T1R LTEConfiguration
Option 2 1,228.8 Mpbs 75 Mbps – 10 MHz LTE, 2T2RLTE Configuration
– 20 MHz LTE 1T1RLTE Configuration
– Small Cells

3.1. REQUIREMENTS AND CHALLENGES OF FRONTHAUL NETWORKS 29
Option 3 2,457.6 Mpbs 150 Mbps – 10MHz 4T4R LTE Con-figuration
– 20MHz 2T2R LTE Con-figuration
– Majority of LTE MacroMarket
– Small Cells
Option 4 3,072.0 Mpbs * *Option 5 4,915.2 Mpbs 300 Mbps – 10MHz 8T8R LTE Con-
figuration– 20MHz 4T4R
Option 6 6144Gpbs * *Option 7 9,830.4 Mpbs 600 Mbps 20MHz 8T8R LTE Con-
figurationOption 8 10,137.6 Mpbs 750 Mbps Carrier aggregation of
5x20MHz 2T2R LTE
Such very high data rates results in a fully non elastic traffic when time varyingtraffic load condition of a cell is considered. For traditional RAN, these features arethe major challengs as they are designed to transport much lower bitrates.
3.1.2 Latency
The fronthaul and CPRI/OBSAI protocols requires very stringent latency requirementwhich is often the overall limiting factors how far the fronthaul network can extend.It is a key factor that also depends on heavily on the MFH technology to be used.Specifically, this is a case for fast transportation and high capacity mobile networkswith the higher speed CPRI/OBSAI options. Hence, the designing RAN and addingfunctionality to the MFH needs special consideration such as selection of MFHtechnology.
As a consequence of decoupling the traditional BS functions into a centralizedBS that will be shared among multiple RRHs (i.e. fronthaul network), strict timingconditions between BS and RRH have been specified by RAT standards. Delaycontributions due to the transportation of fronthaul signals along RAN network,
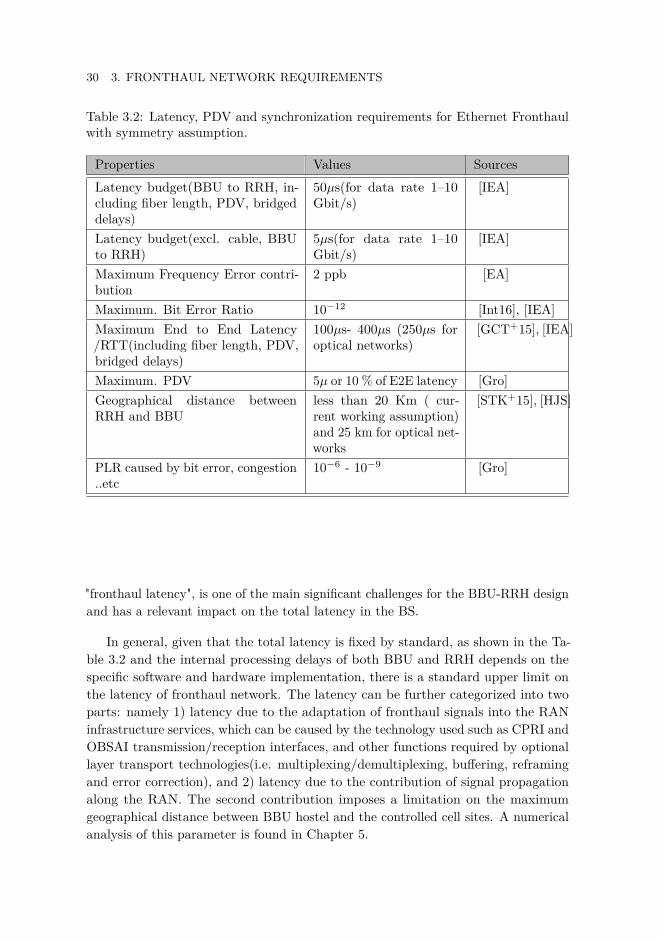
30 3. FRONTHAUL NETWORK REQUIREMENTS
Table 3.2: Latency, PDV and synchronization requirements for Ethernet Fronthaulwith symmetry assumption.
Properties Values SourcesLatency budget(BBU to RRH, in-cluding fiber length, PDV, bridgeddelays)
50µs(for data rate 1–10Gbit/s)
[IEA]
Latency budget(excl. cable, BBUto RRH)
5µs(for data rate 1–10Gbit/s)
[IEA]
Maximum Frequency Error contri-bution
2 ppb [EA]
Maximum. Bit Error Ratio 10−12 [Int16], [IEA]Maximum End to End Latency/RTT(including fiber length, PDV,bridged delays)
100µs- 400µs (250µs foroptical networks)
[GCT+15], [IEA]
Maximum. PDV 5µ or 10 % of E2E latency [Gro]Geographical distance betweenRRH and BBU
less than 20 Km ( cur-rent working assumption)and 25 km for optical net-works
[STK+15], [HJS]
PLR caused by bit error, congestion..etc
10−6 - 10−9 [Gro]
"fronthaul latency", is one of the main significant challenges for the BBU-RRH designand has a relevant impact on the total latency in the BS.
In general, given that the total latency is fixed by standard, as shown in the Ta-ble 3.2 and the internal processing delays of both BBU and RRH depends on thespecific software and hardware implementation, there is a standard upper limit onthe latency of fronthaul network. The latency can be further categorized into twoparts: namely 1) latency due to the adaptation of fronthaul signals into the RANinfrastructure services, which can be caused by the technology used such as CPRI andOBSAI transmission/reception interfaces, and other functions required by optionallayer transport technologies(i.e. multiplexing/demultiplexing, buffering, reframingand error correction), and 2) latency due to the contribution of signal propagationalong the RAN. The second contribution imposes a limitation on the maximumgeographical distance between BBU hostel and the controlled cell sites. A numericalanalysis of this parameter is found in Chapter 5.
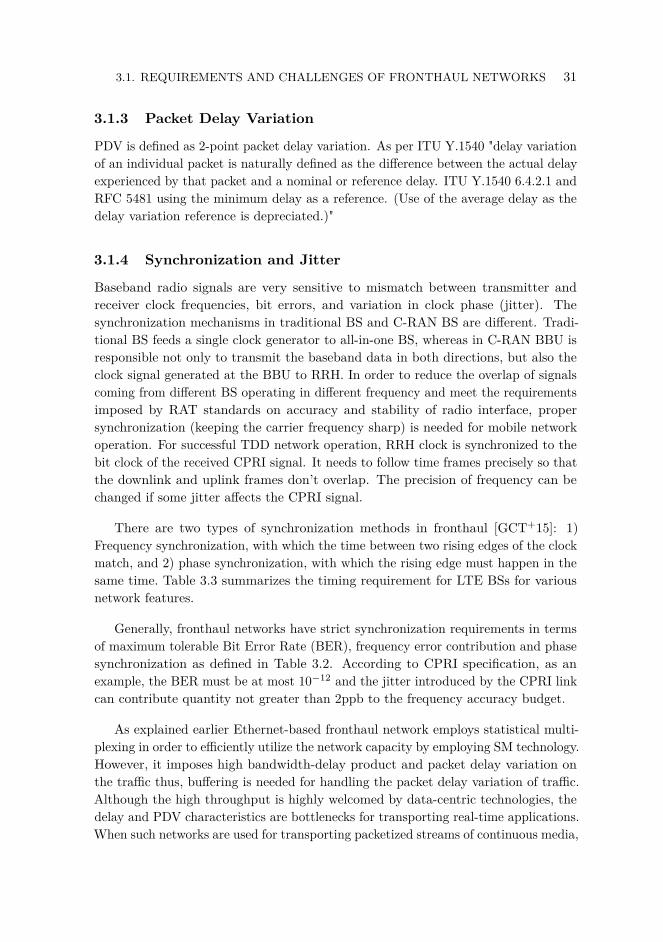
3.1. REQUIREMENTS AND CHALLENGES OF FRONTHAUL NETWORKS 31
3.1.3 Packet Delay Variation
PDV is defined as 2-point packet delay variation. As per ITU Y.1540 "delay variationof an individual packet is naturally defined as the difference between the actual delayexperienced by that packet and a nominal or reference delay. ITU Y.1540 6.4.2.1 andRFC 5481 using the minimum delay as a reference. (Use of the average delay as thedelay variation reference is depreciated.)"
3.1.4 Synchronization and Jitter
Baseband radio signals are very sensitive to mismatch between transmitter andreceiver clock frequencies, bit errors, and variation in clock phase (jitter). Thesynchronization mechanisms in traditional BS and C-RAN BS are different. Tradi-tional BS feeds a single clock generator to all-in-one BS, whereas in C-RAN BBU isresponsible not only to transmit the baseband data in both directions, but also theclock signal generated at the BBU to RRH. In order to reduce the overlap of signalscoming from different BS operating in different frequency and meet the requirementsimposed by RAT standards on accuracy and stability of radio interface, propersynchronization (keeping the carrier frequency sharp) is needed for mobile networkoperation. For successful TDD network operation, RRH clock is synchronized to thebit clock of the received CPRI signal. It needs to follow time frames precisely so thatthe downlink and uplink frames don’t overlap. The precision of frequency can bechanged if some jitter affects the CPRI signal.
There are two types of synchronization methods in fronthaul [GCT+15]: 1)Frequency synchronization, with which the time between two rising edges of the clockmatch, and 2) phase synchronization, with which the rising edge must happen in thesame time. Table 3.3 summarizes the timing requirement for LTE BSs for variousnetwork features.
Generally, fronthaul networks have strict synchronization requirements in termsof maximum tolerable Bit Error Rate (BER), frequency error contribution and phasesynchronization as defined in Table 3.2. According to CPRI specification, as anexample, the BER must be at most 10−12 and the jitter introduced by the CPRI linkcan contribute quantity not greater than 2ppb to the frequency accuracy budget.
As explained earlier Ethernet-based fronthaul network employs statistical multi-plexing in order to efficiently utilize the network capacity by employing SM technology.However, it imposes high bandwidth-delay product and packet delay variation onthe traffic thus, buffering is needed for handling the packet delay variation of traffic.Although the high throughput is highly welcomed by data-centric technologies, thedelay and PDV characteristics are bottlenecks for transporting real-time applications.When such networks are used for transporting packetized streams of continuous media,
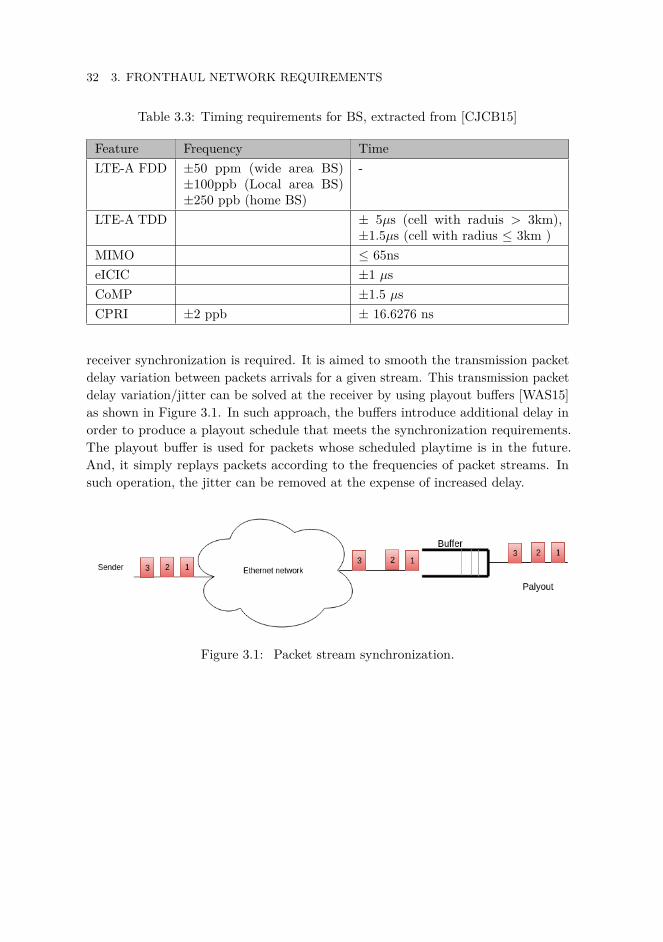
32 3. FRONTHAUL NETWORK REQUIREMENTS
Table 3.3: Timing requirements for BS, extracted from [CJCB15]
Feature Frequency TimeLTE-A FDD ±50 ppm (wide area BS)
±100ppb (Local area BS)±250 ppb (home BS)
-
LTE-A TDD ± 5µs (cell with raduis > 3km),±1.5µs (cell with radius ≤ 3km )
MIMO ≤ 65nseICIC ±1 µsCoMP ±1.5 µsCPRI ±2 ppb ± 16.6276 ns
receiver synchronization is required. It is aimed to smooth the transmission packetdelay variation between packets arrivals for a given stream. This transmission packetdelay variation/jitter can be solved at the receiver by using playout buffers [WAS15]as shown in Figure 3.1. In such approach, the buffers introduce additional delay inorder to produce a playout schedule that meets the synchronization requirements.The playout buffer is used for packets whose scheduled playtime is in the future.And, it simply replays packets according to the frequencies of packet streams. Insuch operation, the jitter can be removed at the expense of increased delay.
Figure 3.1: Packet stream synchronization.
Chapter4Integrated Hybrid OpticalNetworks/IHON
In this chapter, IHON network (also called fusion solution), a proposed solutionfor combining the best properties of circuit switching and packet switching intoa single architecture is described thoroughly. An overveiw of Optical MigrationCapable Networks with Service Guarantees (OpMiGua) networks and an algorithmto compute the free gap between GST packets in IHON node are also explained.Furthermore, the chapter focuses on the concept of aggregation of GST traffics inIHON node, how SM packets are inserted in the computed free gap, and the IHONnode design.
4.1 Introduction
Traditionally, infromation have been transported from one place to another placeusing circuit switched fiber optic networks. Even though guaranteed QoS, low latecnyvariation, low latency, and synchronization support are the essential and vital featuresof Optical Circuit Switched (OCS) networks, they are not bandwidth efficient forbursty IP traffic [Bay01]. As a result, the ever increasing IP traffic volume withthe resulting demand for capacity leads to the migration of the networks fromoptical circuit switched networks to optical packet based networks. This inevitableshift brings better bandwidth utilization and lowers cost by introducing statisticalmultiplexing; however, the low lateny, low PDV, and guaranteed QoS are only offeredby OCS technologies and are still essential for mobile fronthaul, backhaul, metro, andtransport networks. Both Optical Packet Switched (OPS) [OSHT01] and OpticalBurst Switched (OBS) [QY99] networks introduce SM to overcome the inefficientutilization of bandwidth.
In order to support and satisfy the above requirements in multi-service networksimultaneously, impovements have been made to the optical packet switched networksto accommodate high throughput and effective QoS capability. The improvementshave introduced hardware and software complexity which in turn result in expensive
33

34 4. INTEGRATED HYBRID OPTICAL NETWORKS/IHON
operational and capital cost of the techniques. Thus, a new concept of hybrid switchnetworks integrating both OCS and OPS technologies is introduced. It is proposedto provide support for various service requirements and efficiently utilize the bulkcapacity of optical networks. In the following sections, the variants of hybrid opticalnetwork architecture are detailed.
4.2 Hybrid Optical Network Architectures
Hybrid Optical Network Architectures employ two or more technologies simultane-ously to improve the overall network performance by combining the advantage ofdifferent network technologies while avoiding their disadvantage [GKB+06]. Accord-ing to the author [GKB+06], the network architecture combines two or more basicswitching technologies at the same time to transport all traffic.
Depending on the degree of interaction and integration of the network technologies,hybrid optical networks can be divided into three [GKB+06]:
1. Client-server optical hybrid optical network2. Parallel optical hybrid optical network3. Integrated optical hybrid optical network
In the following subsections, the key characteristics, performance benefits, andthe realization complexity of hybrid networks are discussed according to the arti-cle [GKB+06].
4.2.1 Client-server Hybrid Optical Network
As shown in Figure 4.1, this class employs a hierarchy of optical networks, where thewavelength-switched server layer (the lower layer) serves as a server layer setting upa virtual topology for the upper client layer. Since the client layer is an OBS or OPSnetwork, it consists of several OBS or OPS nodes. The nodes at the ingress of thecore network are responsible for aggregating traffic, and are connected via the directlight path to the server layer. Hence, packets or bursts transparently flow in lightpaths established in the lower layer and can only be switched at the upper layer. Toallow transparent flow of the payloads the server layer allocates lightpaths, where asclient-layer performs switching of optical bursts/packets [GKB+06].
Since this particular hybrid archieture uses a virtual topology which only yieldsless traffic per link, the multiplexing gain is reduced.

4.2. HYBRID OPTICAL NETWORK ARCHITECTURES 35
Figure 4.1: Client-server hybrid optical networks [GKB+06].
4.2.2 Parallel Hybrid Optical Network
This class uses two or more optical layer networks side by side, offering differenttransport services in parallel. Depending on the decision made by an intelligent node,the parallel optical layer networks offers various transport services individually or incombination. Figure 4.2 shows a parallel hybrid optical network in which the serviceedge node makes the selection for arriving traffic to be transmitted either as burstsor continuous byte stream/ inside the light path. Based on the traffic nature such asQoS requirement, bandwidth, and user request, the service edge selects the arrivingtraffic transport nature either as optical burst or byte stream.
Figure 4.2: Parallel hybrid optical networks [GKB+06].
4.2.3 Integrated Optical Hybrid Optical Network
Unlike both client-server and parallel, integrated hybrid optical networks, integratestwo or more network technologies into a single network to share the same bandwidthresources on the same network simultaneously [KOS09]. Hence, the traffic can betransported either in wavelength switched or packet switched mode. Figure 4.3 illus-
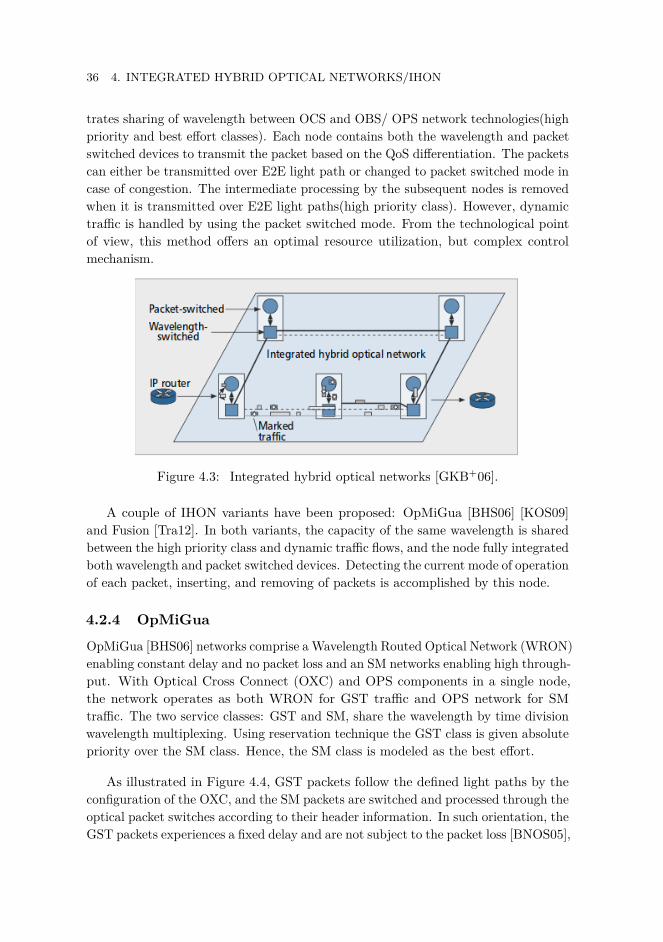
36 4. INTEGRATED HYBRID OPTICAL NETWORKS/IHON
trates sharing of wavelength between OCS and OBS/ OPS network technologies(highpriority and best effort classes). Each node contains both the wavelength and packetswitched devices to transmit the packet based on the QoS differentiation. The packetscan either be transmitted over E2E light path or changed to packet switched mode incase of congestion. The intermediate processing by the subsequent nodes is removedwhen it is transmitted over E2E light paths(high priority class). However, dynamictraffic is handled by using the packet switched mode. From the technological pointof view, this method offers an optimal resource utilization, but complex controlmechanism.
Figure 4.3: Integrated hybrid optical networks [GKB+06].
A couple of IHON variants have been proposed: OpMiGua [BHS06] [KOS09]and Fusion [Tra12]. In both variants, the capacity of the same wavelength is sharedbetween the high priority class and dynamic traffic flows, and the node fully integratedboth wavelength and packet switched devices. Detecting the current mode of operationof each packet, inserting, and removing of packets is accomplished by this node.
4.2.4 OpMiGua
OpMiGua [BHS06] networks comprise a Wavelength Routed Optical Network (WRON)enabling constant delay and no packet loss and an SM networks enabling high through-put. With Optical Cross Connect (OXC) and OPS components in a single node,the network operates as both WRON for GST traffic and OPS network for SMtraffic. The two service classes: GST and SM, share the wavelength by time divisionwavelength multiplexing. Using reservation technique the GST class is given absolutepriority over the SM class. Hence, the SM class is modeled as the best effort.
As illustrated in Figure 4.4, GST packets follow the defined light paths by theconfiguration of the OXC, and the SM packets are switched and processed through theoptical packet switches according to their header information. In such orientation, theGST packets experiences a fixed delay and are not subject to the packet loss [BNOS05],
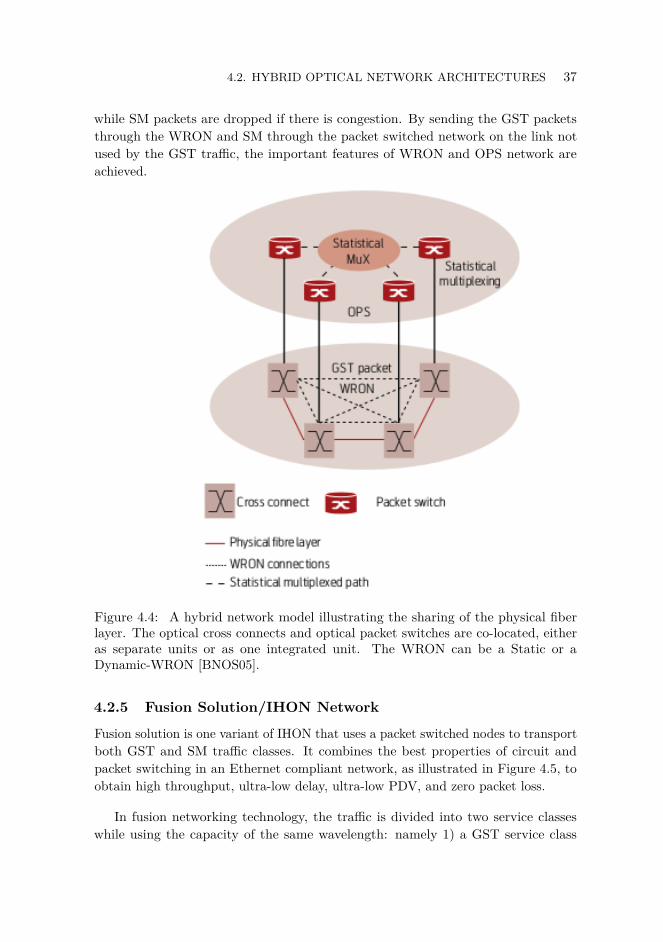
4.2. HYBRID OPTICAL NETWORK ARCHITECTURES 37
while SM packets are dropped if there is congestion. By sending the GST packetsthrough the WRON and SM through the packet switched network on the link notused by the GST traffic, the important features of WRON and OPS network areachieved.
Figure 4.4: A hybrid network model illustrating the sharing of the physical fiberlayer. The optical cross connects and optical packet switches are co-located, eitheras separate units or as one integrated unit. The WRON can be a Static or aDynamic-WRON [BNOS05].
4.2.5 Fusion Solution/IHON Network
Fusion solution is one variant of IHON that uses a packet switched nodes to transportboth GST and SM traffic classes. It combines the best properties of circuit andpacket switching in an Ethernet compliant network, as illustrated in Figure 4.5, toobtain high throughput, ultra-low delay, ultra-low PDV, and zero packet loss.
In fusion networking technology, the traffic is divided into two service classeswhile using the capacity of the same wavelength: namely 1) a GST service class
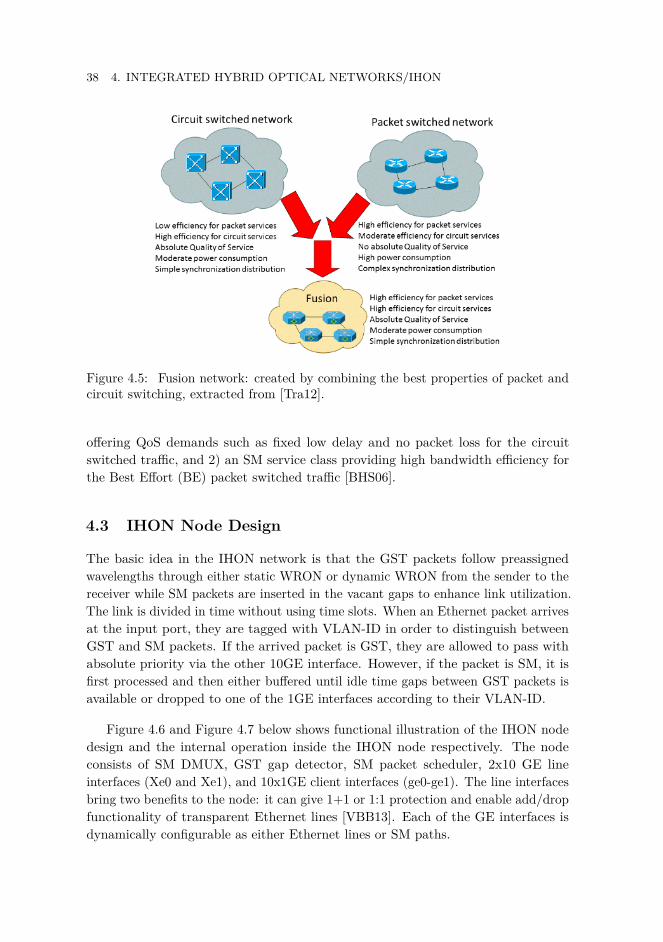
38 4. INTEGRATED HYBRID OPTICAL NETWORKS/IHON
Figure 4.5: Fusion network: created by combining the best properties of packet andcircuit switching, extracted from [Tra12].
offering QoS demands such as fixed low delay and no packet loss for the circuitswitched traffic, and 2) an SM service class providing high bandwidth efficiency forthe Best Effort (BE) packet switched traffic [BHS06].
4.3 IHON Node Design
The basic idea in the IHON network is that the GST packets follow preassignedwavelengths through either static WRON or dynamic WRON from the sender to thereceiver while SM packets are inserted in the vacant gaps to enhance link utilization.The link is divided in time without using time slots. When an Ethernet packet arrivesat the input port, they are tagged with VLAN-ID in order to distinguish betweenGST and SM packets. If the arrived packet is GST, they are allowed to pass withabsolute priority via the other 10GE interface. However, if the packet is SM, it isfirst processed and then either buffered until idle time gaps between GST packets isavailable or dropped to one of the 1GE interfaces according to their VLAN-ID.
Figure 4.6 and Figure 4.7 below shows functional illustration of the IHON nodedesign and the internal operation inside the IHON node respectively. The nodeconsists of SM DMUX, GST gap detector, SM packet scheduler, 2x10 GE lineinterfaces (Xe0 and Xe1), and 10x1GE client interfaces (ge0-ge1). The line interfacesbring two benefits to the node: it can give 1+1 or 1:1 protection and enable add/dropfunctionality of transparent Ethernet lines [VBB13]. Each of the GE interfaces isdynamically configurable as either Ethernet lines or SM paths.
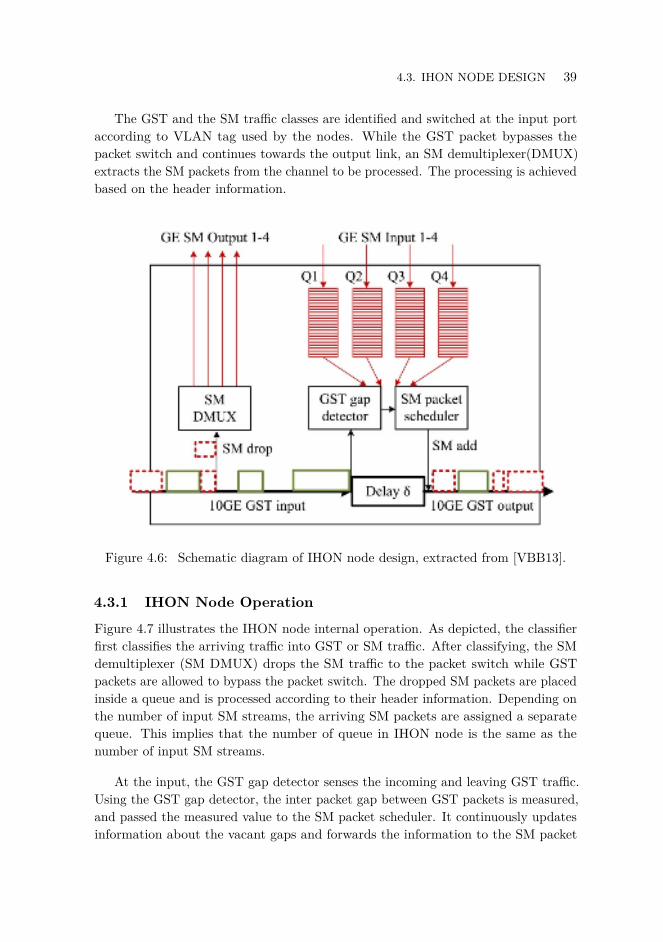
4.3. IHON NODE DESIGN 39
The GST and the SM traffic classes are identified and switched at the input portaccording to VLAN tag used by the nodes. While the GST packet bypasses thepacket switch and continues towards the output link, an SM demultiplexer(DMUX)extracts the SM packets from the channel to be processed. The processing is achievedbased on the header information.
Figure 4.6: Schematic diagram of IHON node design, extracted from [VBB13].
4.3.1 IHON Node Operation
Figure 4.7 illustrates the IHON node internal operation. As depicted, the classifierfirst classifies the arriving traffic into GST or SM traffic. After classifying, the SMdemultiplexer (SM DMUX) drops the SM traffic to the packet switch while GSTpackets are allowed to bypass the packet switch. The dropped SM packets are placedinside a queue and is processed according to their header information. Depending onthe number of input SM streams, the arriving SM packets are assigned a separatequeue. This implies that the number of queue in IHON node is the same as thenumber of input SM streams.
At the input, the GST gap detector senses the incoming and leaving GST traffic.Using the GST gap detector, the inter packet gap between GST packets is measured,and passed the measured value to the SM packet scheduler. It continuously updatesinformation about the vacant gaps and forwards the information to the SM packet
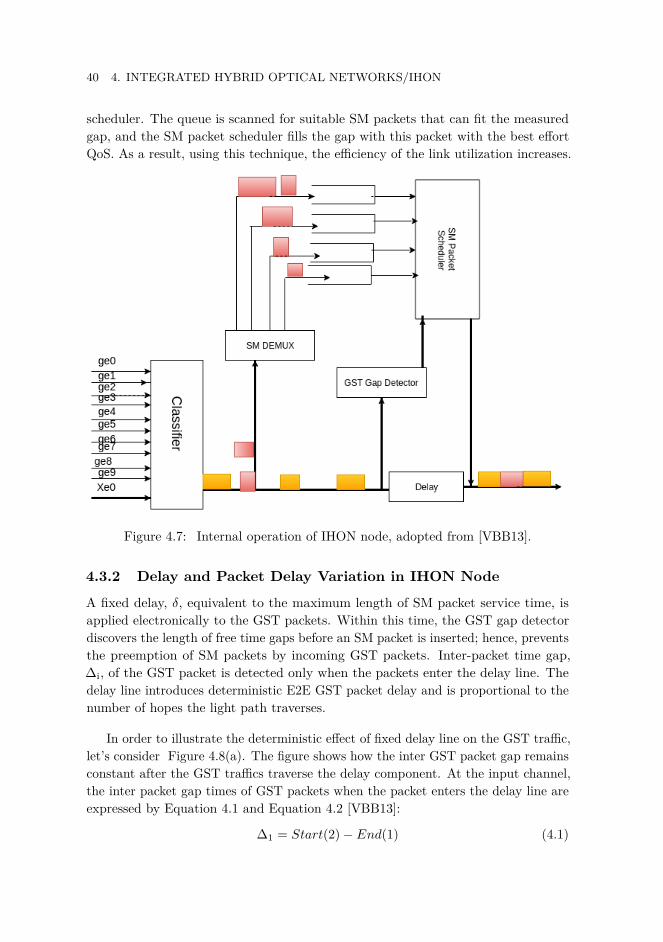
40 4. INTEGRATED HYBRID OPTICAL NETWORKS/IHON
scheduler. The queue is scanned for suitable SM packets that can fit the measuredgap, and the SM packet scheduler fills the gap with this packet with the best effortQoS. As a result, using this technique, the efficiency of the link utilization increases.
Figure 4.7: Internal operation of IHON node, adopted from [VBB13].
4.3.2 Delay and Packet Delay Variation in IHON Node
A fixed delay, δ, equivalent to the maximum length of SM packet service time, isapplied electronically to the GST packets. Within this time, the GST gap detectordiscovers the length of free time gaps before an SM packet is inserted; hence, preventsthe preemption of SM packets by incoming GST packets. Inter-packet time gap,∆i, of the GST packet is detected only when the packets enter the delay line. Thedelay line introduces deterministic E2E GST packet delay and is proportional to thenumber of hopes the light path traverses.
In order to illustrate the deterministic effect of fixed delay line on the GST traffic,let’s consider Figure 4.8(a). The figure shows how the inter GST packet gap remainsconstant after the GST traffics traverse the delay component. At the input channel,the inter packet gap times of GST packets when the packet enters the delay line areexpressed by Equation 4.1 and Equation 4.2 [VBB13]:
∆1 = Start(2)− End(1) (4.1)

4.3. IHON NODE DESIGN 41
∆2 = Start(3)− End(2) (4.2)
After the delay component (t+ δ), at the output channel, the gaps of GST packetsare given by Equation 4.3 and Equation 4.3 and are kept unchanged [VBB13].
∆′
1 = [Start(2) + σ]− [End(1) + σ] = ∆1 (4.3)
∆′
2 = [Start(3) + σ]− [End(2) + σ] = ∆2 (4.4)
Since all packets undergo the same fixed delay δ, inter-packet time gaps ∆i1 are
remained the same at the output channel, ∆’i=∆i. Thus, the IHON network doesn’t
introduce PDV to the circuit traffic.
4.3.3 Delay and Packet Delay Variation in Ethernet Switch
Figure 4.8(b) and (c) depicts the scheduling techinque used in packet switches withthe non-preemptive priority and in IHON node respectively. Unlike non-preemptiveGST scheduling in IHON node, electronic packet switches transmit packet with lowerpriority only if no packets with higher priority is available at the input queue. Whena higher priority class arrives (packet 3) while lower class priority packets are beingserved(packet 2), the packet will be queued till the lower priority packet has finished,as illustrated in Figure 4.8(b). Hence, PDV is introduced in high priority stream.
Figure 4.9 presents the diagram of Ethernet switch, and how the delay of a packetin an Ethernet switch be measured. The delay is measured by starting a timer whenthe first bit of the packet gets into the Ethernet switch and stopping when the firstbit of the packet leaves the switch. The time it takes the switch to transmit a packetdepends the speed of the switch. It means that the faster the switch, the quickerthe packets can be sent to the destination which in turn the less time the packetsneeds to say in the queue (lower delay). It is also important to note that the delayaccuracy of the packet depends on the traffic rate and pattern.
1∆i represents the inter packet gap time between GST packets
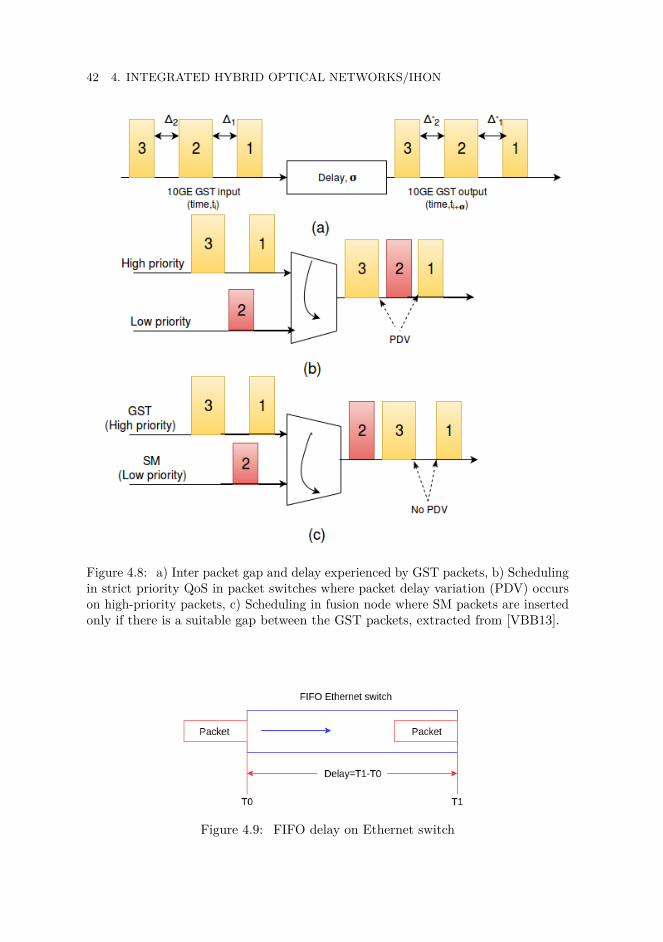
42 4. INTEGRATED HYBRID OPTICAL NETWORKS/IHON
Figure 4.8: a) Inter packet gap and delay experienced by GST packets, b) Schedulingin strict priority QoS in packet switches where packet delay variation (PDV) occurson high-priority packets, c) Scheduling in fusion node where SM packets are insertedonly if there is a suitable gap between the GST packets, extracted from [VBB13].
Figure 4.9: FIFO delay on Ethernet switch
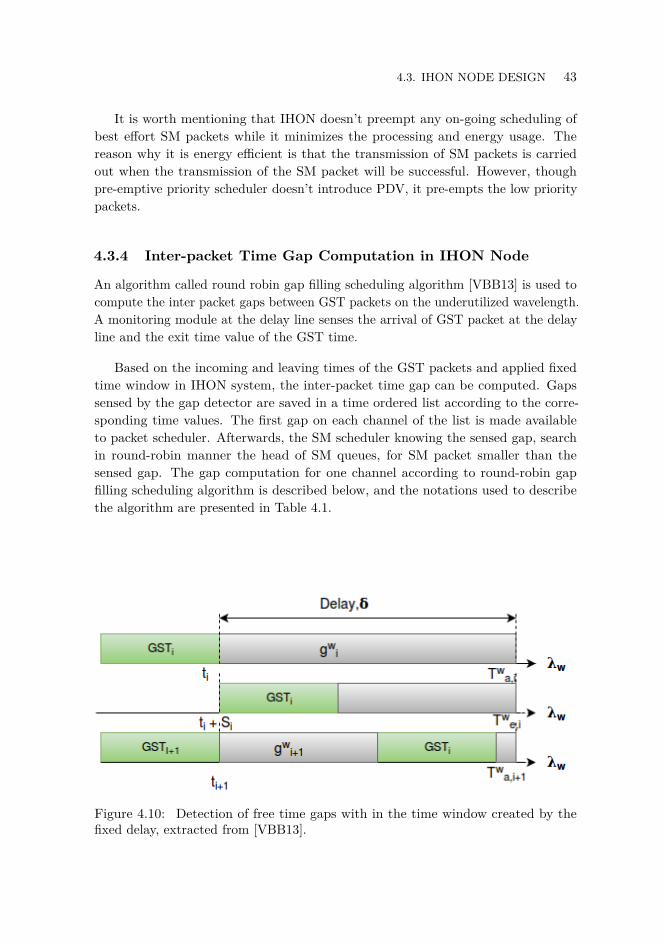
4.3. IHON NODE DESIGN 43
It is worth mentioning that IHON doesn’t preempt any on-going scheduling ofbest effort SM packets while it minimizes the processing and energy usage. Thereason why it is energy efficient is that the transmission of SM packets is carriedout when the transmission of the SM packet will be successful. However, thoughpre-emptive priority scheduler doesn’t introduce PDV, it pre-empts the low prioritypackets.
4.3.4 Inter-packet Time Gap Computation in IHON Node
An algorithm called round robin gap filling scheduling algorithm [VBB13] is used tocompute the inter packet gaps between GST packets on the underutilized wavelength.A monitoring module at the delay line senses the arrival of GST packet at the delayline and the exit time value of the GST time.
Based on the incoming and leaving times of the GST packets and applied fixedtime window in IHON system, the inter-packet time gap can be computed. Gapssensed by the gap detector are saved in a time ordered list according to the corre-sponding time values. The first gap on each channel of the list is made availableto packet scheduler. Afterwards, the SM scheduler knowing the sensed gap, searchin round-robin manner the head of SM queues, for SM packet smaller than thesensed gap. The gap computation for one channel according to round-robin gapfilling scheduling algorithm is described below, and the notations used to describethe algorithm are presented in Table 4.1.
Figure 4.10: Detection of free time gaps with in the time window created by thefixed delay, extracted from [VBB13].

44 4. INTEGRATED HYBRID OPTICAL NETWORKS/IHON
Table 4.1: Definition of parameters used in the gap computation.
Parameters DefinitionTw
a,i The incoming time of GST packet i to the delay line of output channel λw
Twe,i The leaving time of GST packet i to the delay line of output channel λw
δ Fixed delaygw
i The gap on the channel w of packet iSi Service time of packet i
In Figure 4.10, two GST packets, GSTi and GSTi+1, are considered in order todescribe round robin algorithm, where GSTi is the first packet arrived at the delayline and GSTi+1 is the packet arrived after GSTi.
• When the GST packet i arrives the delay line at time ti, the arrival time ofpacket i is updated to the output channel λw( busy time starts): Tw
a,i=ti + σ.The inter-packet gap is gw
i=δ if only packet i is available in the delay line andthe previous GST packet(i-1) has already left the delay line (i.e. Tw
a,i ≥ Twe,i-1
+ δ); else the gap is given by gwi=Tw
a,i-Twe,i-1. Where Tw
e,i-1 is the exit time ofprevious packet, i-1.
• After the last bit of GST packet i enters the delay line at ti + Si, the exit timeof packet i is updated and the output channel w is released (end of busy time):Tw
e,i-1=(ti + Si)+ δ.• The current gap value that is given to the scheduler is updated at Tw
e,i-1: Forinstance, the current gap value is gw
i+1 computed as illustrated above if the nextGST packet exist. Otherwise, it is equals to the maximum packet length, δ.
4.4 IHON Node Aggregation
In optical circuit switching, packet traffic between ingress and egress nodes may haveone or more paths with one or more intermediate nodes. Each path has its ownwavelength. However, in fusion node by scheduling each GST stream on differenttime-slots, one or more GST streams can be aggregated on a single wavelength.While the GST streams are transmitted from the source to destination on light path,the SM packets can be added to the intermediate nodes if there is a vacant gap onthe wavelength. The quality of service of GST packets is not affected by the insertionof SM packets.
With the help of data containers, one or more GST packets are aggregatedtogether with container control information in fusion node. Figure 4.11 illustrates theaggregation of five GST 1Gb/s Ethernet input streams into one 10 Gb/s Ethernet

4.4. IHON NODE AGGREGATION 45
output link. The basic idea behind this aggregation scheme is to transfer informationregarding the inter-packet gap of GST packets arrived at a port, like GE port assignedto the GST stream. As a result, the aggregator uses this information when readingpackets from the buffer and transmitting them in the wavelength channel with thesame number of bytes in between packets. The GST packets arrived at the 1Gb/sEthernet input are tagged and aggregated into their corresponding container whilethe inter-packet gap is maintained, then SM traffic is dropped at the SM DMUX forprocessing. Depending on the maximum expected GST packet size and the number ofports being aggregated, the time period reserved for each port varies [VBB+15]. TheGST packet bypasses the packet switch, while SM packet is queued and processed inaccordance with their header information. With a compression factor of 1Gb/sec to10Gb/sec, the GST packets will be compressed in time in order to be sent out via10Gb/sec. Synchronization packets are used to identify the aggregation containers.According to [VBB+15], because of the added overhead, the fusion node is capable ofaggregating a maximum of nine 1 GEports where 1 GE port is used for the overheads.
The GST gap detector computes the gap between GST packets and containers topass it to the SM packet scheduler when GST packet arrives at the delay line. Afterthat, SM packet scheduler scans for the suitable SM packet inside the queue, andinsert the SM packets in the computed gaps which greatly optimizes the utilizationof the wavelength.
At the egress node, the inverse time compression factor is used to the aggregatedGST packets, and the streams are precisely reconstructed using the inter-packet gaps.In every node, the GST stream passes through a fixed delay which depends on themaximum SM length and capacity of the link. This allows preventing of pre-emptionSM packets. However, it has a deterministic effect on the end to end delay of thestream.
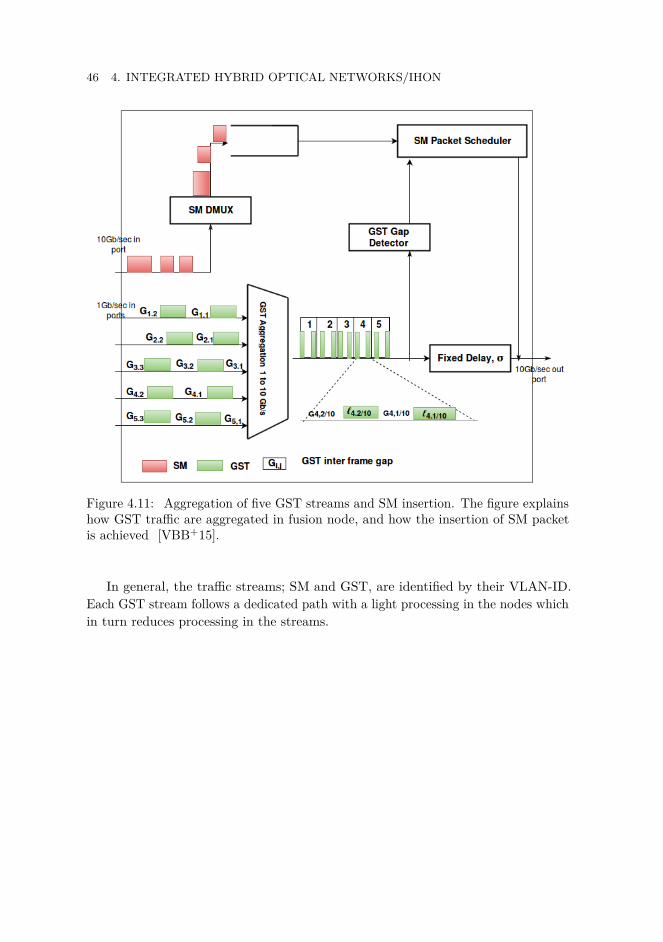
46 4. INTEGRATED HYBRID OPTICAL NETWORKS/IHON
Figure 4.11: Aggregation of five GST streams and SM insertion. The figure explainshow GST traffic are aggregated in fusion node, and how the insertion of SM packetis achieved [VBB+15].
In general, the traffic streams; SM and GST, are identified by their VLAN-ID.Each GST stream follows a dedicated path with a light processing in the nodes whichin turn reduces processing in the streams.

Chapter5Analytical/ Simulation Model
In this chapter, we present the analytical models of the key elements of performancemetric, and the simulation model of IHON nodes and Ethernet switches. The endto end latency, maximum separation distance between RRH and BBU, and PDVof several fronthaul solutions with emphasis on Ethernet and IHON networks arediscussed.
5.1 Maximum End-to-End Latency
The maximum E2E latency is the maximum time taken for a signal or packet tobe transported across a network from source to destination. To illustrate how itis computed in a network, let us consider an LTE Frequency Division Duplexing(FDD) radio interface with C-RAN RAN infrastructure where Hybrid AutomaticRetransmit reQuest (HARQ) is processed between UE and BBU at the central office.In such cases, the maximum E2E latency and the maximum separation distancebetween RRH and BBU are limited due to the timing requirement of the synchronousHARQ protocol used as a retransmission mechanism. Specifically, when the UpLink(UL) data packet is received at the radio frame number i, the BBU or eNB(in LTEnetwork) must send back the corresponding ACK/NACK indication at the radioframe number (i+3) in DownLink (DL) as illustrated in Figure 5.2. This impliesthat the latency budget for the BBU-RRH1 is exactly 3ms. Hence, it must hold thefollowing inequality for RTT:
RTTBBU−RRH = 2τ + tRRH,UL + tBBU,UL + tBBU,DL + tRRH,DL ≤ 3ms (5.1)
Where τ may refers the processioning time fronthaul nodes and any other activecomponents in the fronthaul network.
1The time difference between the complete reception of the data frame and the start oftransmision of the ACK/NACK indication.
47
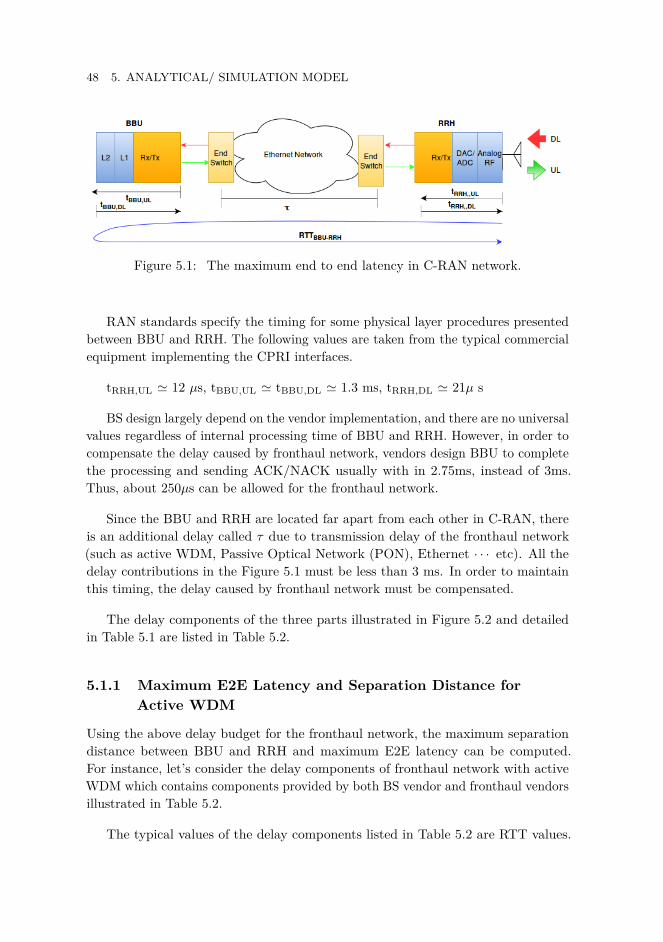
48 5. ANALYTICAL/ SIMULATION MODEL
Figure 5.1: The maximum end to end latency in C-RAN network.
RAN standards specify the timing for some physical layer procedures presentedbetween BBU and RRH. The following values are taken from the typical commercialequipment implementing the CPRI interfaces.
tRRH,UL ' 12 µs, tBBU,UL ' tBBU,DL ' 1.3 ms, tRRH,DL ' 21µ s
BS design largely depend on the vendor implementation, and there are no universalvalues regardless of internal processing time of BBU and RRH. However, in order tocompensate the delay caused by fronthaul network, vendors design BBU to completethe processing and sending ACK/NACK usually with in 2.75ms, instead of 3ms.Thus, about 250µs can be allowed for the fronthaul network.
Since the BBU and RRH are located far apart from each other in C-RAN, thereis an additional delay called τ due to transmission delay of the fronthaul network(such as active WDM, Passive Optical Network (PON), Ethernet · · · etc). All thedelay contributions in the Figure 5.1 must be less than 3 ms. In order to maintainthis timing, the delay caused by fronthaul network must be compensated.
The delay components of the three parts illustrated in Figure 5.2 and detailedin Table 5.1 are listed in Table 5.2.
5.1.1 Maximum E2E Latency and Separation Distance forActive WDM
Using the above delay budget for the fronthaul network, the maximum separationdistance between BBU and RRH and maximum E2E latency can be computed.For instance, let’s consider the delay components of fronthaul network with activeWDM which contains components provided by both BS vendor and fronthaul vendorsillustrated in Table 5.2.
The typical values of the delay components listed in Table 5.2 are RTT values.
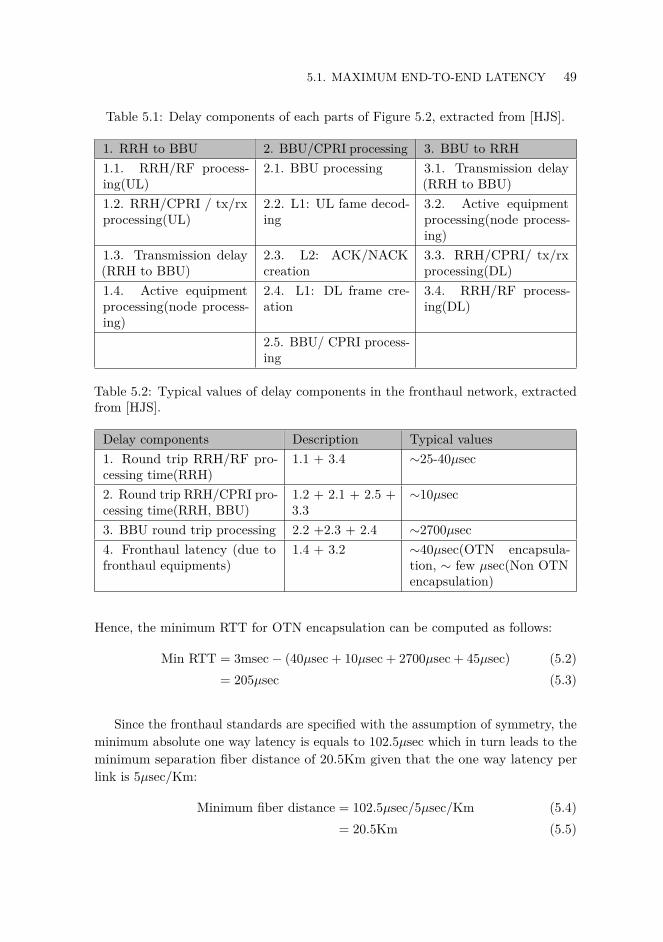
5.1. MAXIMUM END-TO-END LATENCY 49
Table 5.1: Delay components of each parts of Figure 5.2, extracted from [HJS].
1. RRH to BBU 2. BBU/CPRI processing 3. BBU to RRH1.1. RRH/RF process-ing(UL)
2.1. BBU processing 3.1. Transmission delay(RRH to BBU)
1.2. RRH/CPRI / tx/rxprocessing(UL)
2.2. L1: UL fame decod-ing
3.2. Active equipmentprocessing(node process-ing)
1.3. Transmission delay(RRH to BBU)
2.3. L2: ACK/NACKcreation
3.3. RRH/CPRI/ tx/rxprocessing(DL)
1.4. Active equipmentprocessing(node process-ing)
2.4. L1: DL frame cre-ation
3.4. RRH/RF process-ing(DL)
2.5. BBU/ CPRI process-ing
Table 5.2: Typical values of delay components in the fronthaul network, extractedfrom [HJS].
Delay components Description Typical values1. Round trip RRH/RF pro-cessing time(RRH)
1.1 + 3.4 ∼25-40µsec
2. Round trip RRH/CPRI pro-cessing time(RRH, BBU)
1.2 + 2.1 + 2.5 +3.3
∼10µsec
3. BBU round trip processing 2.2 +2.3 + 2.4 ∼2700µsec4. Fronthaul latency (due tofronthaul equipments)
1.4 + 3.2 ∼40µsec(OTN encapsula-tion, ∼ few µsec(Non OTNencapsulation)
Hence, the minimum RTT for OTN encapsulation can be computed as follows:
Min RTT = 3msec− (40µsec + 10µsec + 2700µsec + 45µsec) (5.2)= 205µsec (5.3)
Since the fronthaul standards are specified with the assumption of symmetry, theminimum absolute one way latency is equals to 102.5µsec which in turn leads to theminimum separation fiber distance of 20.5Km given that the one way latency perlink is 5µsec/Km:
Minimum fiber distance = 102.5µsec/5µsec/Km (5.4)= 20.5Km (5.5)

50 5. ANALYTICAL/ SIMULATION MODEL
Figure 5.2: Delay contribution of the BBU and RRH along the fronthaul network.
Similarly, the maximum E2E latency that could be supported by active WDMwhen OTN encapsulation is considered is given by the following expression:
Max RTT = 3msec− (25µsec + 10µsec + 2700µsec + 45µsec) (5.6)= 248µsec (5.7)
Therefore, the maximum one way E2E latency is 124µsec, and the maximumseparation fiber distance is calculated as:
Maximum fiber distance = 124µsec/5µsec/Km (5.8)= 24.8Km (5.9)

5.1. MAXIMUM END-TO-END LATENCY 51
According to the above calculations, in OTN transport the value of one-wayfronthaul latency is in the range of 102.5 to 124µsec, which correspond to fronthaullink distance of a range 20.5 to 24.8km (assuming the classical value of 5µs/km forone way fiber propagation delay). These calculated values are in accord with thefronthaul requirements, Table 3.2.
5.1.2 Maximum E2E Latency and Separation Distance forDedicated Fiber
As previously mentioned, the processing time for fronthaul transport (tTR) dependson the specific transport technology. For example, the typical values for OTNencapsulation can be in the range 28 to 41µs (∼40µsec in Table 5.2) and for dedicatedlinks, there is no latency contribution caused by the fronthaul transport over a lower-layer technology(tTR = 0). The fronthaul is transported “as it is” in dedicatedfiber resulting in zero processing time at the nodes. Hence, the maximum RTT fordedicated fiber can be calculated as:
Max.RTT = 3msec− (40µsec + 10µsec + 2700µsec + 0µsec) (5.10)= 250µsec (5.11)
Considering the symmetry assumption in fronthaul standard specification, themaximum one way E2E latency is 125µsec, and the maximum separation fiberdistance is:
Max. fiber distance = 125µsec/5µsec/Km (5.12)= 25Km (5.13)
Hence, the previous numbers lead to a value of maximum one-way fronthaullatency equal to about 125µsec, which is equiva-lent to a maximum fronthaul linkdistance about 25km(assuming the classical value of 5µs/km for one-way fiberpropagation delay).
The values calculated in Section 5.1.1 and Section 5.1.1 are in accord with thetypical range of 20 to 25km reported in [STK+15], [HJS], and fronthaul requirementslisted in Table 3.2.
52 5. ANALYTICAL/ SIMULATION MODEL
5.1.3 Maximum E2E Latency and PDV for Ethernet Networks
The maximum E2E latency calculation in Ethernet network depends on depends onthe following parameters [For]:
• Propagation delay: Finite amount of time taken by packet to propagateover a link and is constant for a given link length; depends on link length(5usec/km).
• Packet processing delay: The delay introduced by typical Ingress/Egress (onpassed bridg) processing functions such as decapsulation/encapsulation, routelookup, packet classification for marking/remarking etc; depends on bridgeimplementation (non-blocking!), For switches/routers the value is constant.
• Playout buffer delay( store & forward delay for store and forwardEthernet switch): Delay experienced by packet waiting at an egress queue,waiting for one or more packets to be sent out; depends on configuration thequeue and number of packets, which are present in various egress queues. Hence,delay is variable.
Since PDV is variation in the E2E delay experienced by that packet and a nominalor reference delay (ITU Y.1540 6.4.2.1 and RFC 5481 using the minimum delay as areference), it is important to compute the minimum and maximum delay as follows:
Min.and Max. Delay
Minimum delay in a network is expected when a packet never encounters even asingle packet in front of it on egress link when it passes through all the links [Chh13].Thus,
Delaymin =∑j
dLink_propagation_j +∑j
dPacket_processing (5.14)
As seen from the equation 5.14, the lowest delay is simple addition of linkpropagation delay & packet processing delay.
Maximum delay in a network is encountered when the packet encounters one ormore packets in front of it at egress link of each & every node [Chh13]. Thus,
Delaymax =∑j
dLink_propagation_j +∑j
dPacket_processing+∑j
dstore&fwd (5.15)
5.2. SIMULATION MODEL FOR IHON NODE AND STANDARD ETHERNETSWITCH 53
Also note that packet delay would vary between lowest & highest delay. So themaximum amplitude of packet delay variation would be:
Delaymax −Delaymin =∑j
dstore&fwd (5.16)
5.2 Simulation Model for IHON Node and StandardEthernet Switch
In this work, we simulate IHON node and Ethernet switch based on non preemptivescheduling using the programming language called simula. Simula/DEMOS is de-signed and implemented as a full scale general purpose programming. As its nameimplies, it is an object-oriented simulation language developed at the NorwegianComputing Center in Norway for designing of simulation entities. It has also beenused in simulating Very Large-Scale Integration (VLSI) designs, process modeling,and other applications [OJDN70]. In Appendix A, the implementation of IHONnode, Ethernet switch, and characterization of the packets used in the simulation arepresented.
5.2.1 Traffic Pattern
In the IHON node implementation, the arrival processes of GST and SM traffic aredescribed by negative exponential distributions, where as their packet length’s aredescribed by deterministic and uniform distributions respectively. The GST packetsare allowed to travel into a network following reserved wavelength available so thatthey do not experience any packet loss. The rate of GST traffic source is definedusing negative exponential distribution with a mean value which is a function ofcapacity of the output port and the length of GST packet. Hence, it ensures thewanted load from GST traffic on single wavelength. Unlike GST packets, since SMtraffic have no pre-established path it may experience a packet loss and is inserted insuitable gaps between GST packets. And its mean value is a function of the channelcapacity and length of SM packets drawn from the distribution.
Similarly, negative exponential distributions are used to describe the arrivalprocesses for HP and LP traffic in Ethernet switch implementation. The packetlength distribution used to describe the length of HP and LP packet is deterministicdistribution. HP traffic are given highest priority, and LP traffic are given low priority.The mean value for HP and LP traffic in Ethernet switch follow the same pattern asGST and SM traffic in IHON node.

Chapter6Results and Discussions
In this chapter, the obtained simulation results are presented and analyzed, and themost comprehensive discussion of the results is given. We considered PDV, PLR, andaverage latency as a performance metrics to evaluate performance of IHON node andEthernet switch. With analysis of each metrics, an identification of parameter thatrestricts the overall performance is conducted. The evaluation of IHON and Ethernetnetwork in RoE mobile fronthaul setting is also conducted. From this evaluation,we find how such networks can be dimensioned with respect to: fiber link length,number of nodes, technology · · · etc.
6.1 Simulation Parameters
Table 6.1 and Table 6.2 presents the set of parameters which have been used duringthe simulation and the list of notations used for different traffic loads on differentinterfaces respectively. The value of the total system load used by the GST and SMtraffic have been varied throughout the simulation. In this work, system load refersto the sum of SM and GST traffic loads, i.e. LT
10GE=n*LSM1GE + LGST
10GE, where n isthe number of SM input streams. And also, we assume that the wavelength has thesame transmission rate of 10 Gbps and the fixed delay is given by the duration ofthe maximum sized SM packet being scheduled to the output wavelength.
Table 6.1: Simulation parameters used in the analysis of performance metrics of SMand GST packets (for IHON node).
Parameters ValueSeed values 907 234 326 104
711 523 883 113417 656
Output link capacity 10 Gb/secMinimum SM length 40 Bytes
55
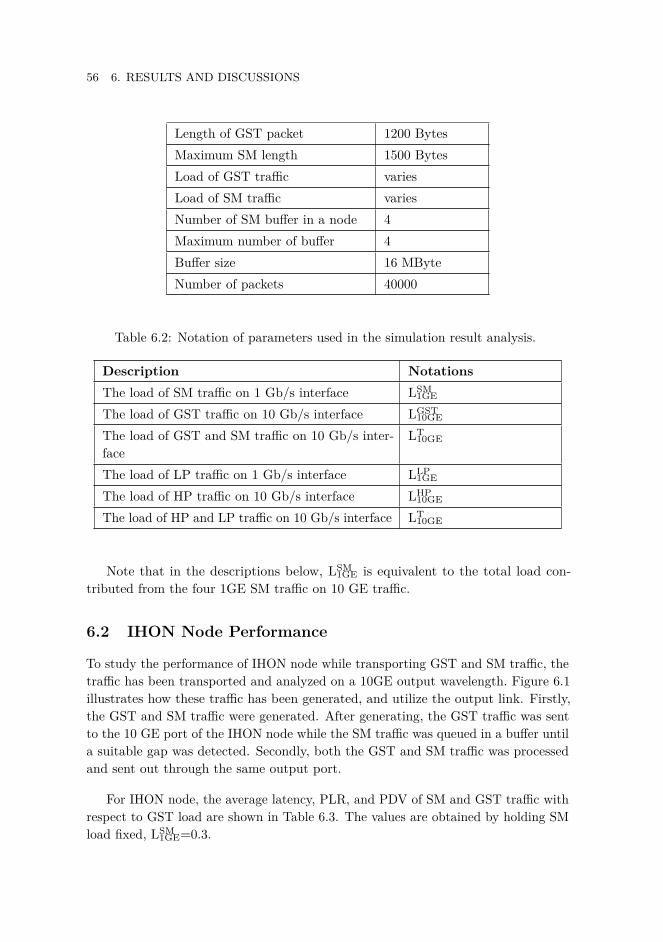
56 6. RESULTS AND DISCUSSIONS
Length of GST packet 1200 BytesMaximum SM length 1500 BytesLoad of GST traffic variesLoad of SM traffic variesNumber of SM buffer in a node 4Maximum number of buffer 4Buffer size 16 MByteNumber of packets 40000
Table 6.2: Notation of parameters used in the simulation result analysis.
Description NotationsThe load of SM traffic on 1 Gb/s interface LSM
1GE
The load of GST traffic on 10 Gb/s interface LGST10GE
The load of GST and SM traffic on 10 Gb/s inter-face
LT10GE
The load of LP traffic on 1 Gb/s interface LLP1GE
The load of HP traffic on 10 Gb/s interface LHP10GE
The load of HP and LP traffic on 10 Gb/s interface LT10GE
Note that in the descriptions below, LSM1GE is equivalent to the total load con-
tributed from the four 1GE SM traffic on 10 GE traffic.
6.2 IHON Node Performance
To study the performance of IHON node while transporting GST and SM traffic, thetraffic has been transported and analyzed on a 10GE output wavelength. Figure 6.1illustrates how these traffic has been generated, and utilize the output link. Firstly,the GST and SM traffic were generated. After generating, the GST traffic was sentto the 10 GE port of the IHON node while the SM traffic was queued in a buffer untila suitable gap was detected. Secondly, both the GST and SM traffic was processedand sent out through the same output port.
For IHON node, the average latency, PLR, and PDV of SM and GST traffic withrespect to GST load are shown in Table 6.3. The values are obtained by holding SMload fixed, LSM
1GE=0.3.

6.2. IHON NODE PERFORMANCE 57
Figure 6.1: Diagram illustrating how the IHON node is connected to Packetgenerators for measuring the performance metrics.
Table 6.3: Average latency, PLR, and PDV of SM and GST traffic as function ofGST load for SM load=0.3 (IHON node).
SN. TotalLSM
1GE
LGST10GE Average
GST latency(µsec)
Average SM la-tency(sec)
PDVofGST(msec)
PDV ofSM(µsec)
PLR ofSM
1 0.3 0.1 1.2 0.014±1.37×10⁻⁴ 0.0 0.35 0.02 0.3 0.2 1.2 0.021±1.69×10⁻⁴ 0.0 0.37 0.03 0.3 0.3 1.2 0.027±1.70×10⁻⁴ 0.0 0.372 0.04 0.3 0.4 1.2 0.034±1.77×10⁻⁴ 0.0 0.281 0.05 0.3 0.5 1.2 0.039±1.70×10⁻⁴ 0.0 0.55 0.06 0.3 0.6 1.2 0.0417 ± 1.41 ×
10−40.0 0.76 0.0005
7 0.3 0.63 1.2 0.0422 ± 1.14 ×10⁻⁴
0.0 1.62 0.0026
8 0.3 0.64 1.2 0.0424 ± 1.20 ×10⁻⁴
0.0 1.96 0.0033
9 0.3 0.65 1.2 0.043±1.28×10⁻⁴ 0.0 3.9 0.0039810 0.3 0.67 1.2 0.048±1.01×10⁻⁴ 0.0 2.89 0.0053
58 6. RESULTS AND DISCUSSIONS
6.2.1 GST Traffic Performance
The following results have been obtained by using Table 6.1 as a simulation parameter,and loading the output wavelength with packet length distribution and with theinter-packet gap between GST packets as described in Chapter 5.
The average latency, PLR, and PDV of GST traffic are discussed in the followingsubsections.
Average Latency
In IHON node, latency refers to the delay when the first bit of the packet gets intothe IHON node until the first bit of the packet leaves the FDL. This parametergreatly affects how usable the nodes as well as communication are.
Every sub-simulation returns an average value for latency of GST packet, obtainedby averaging all the delays experienced by every single GST packet during the sub-simulation. By varying the system load (n*LSM
1GE + LGST10GE), we observed the average
latency of GST traffic. The simulated average latency of GST traffic was constantwith a value of 1.2µsec, which equals to the FDL time. It shows that the 10GE GSTtraffic was shown to be independent of the added SM traffic and its load. This isdue to the fact that the GST traffic is transmitted with absolute priority. Note thatthe FDL time was set to the service time of maximum packet length of SM packet,δ=1.2µsec.
The average latency of GST traffic isn’t affected by the system load and insertionof SM traffic. Thus, the result reveals that its average latency is constant regardlessof the node congestion.
Packet Delay Variation
As per ITU Y.1540, "PDV is the variation in packet delay with respect to somereference metrics (minimum delay in this work)". The service quality and PDVtolerability of an application are highly influenced by PDV.
By recording the time when the first bit of GST packets arrived at the delay line,and when the last bit of the packet left the start of the FDL, the maximum andminimum delay of GST packet is computed. Using this concept, the result of thesimulator showed that the packet delay variation of GST packets was zero. Thisis because the traffic aggregation of SM traffic on the top a 10 Gb/s wavelengthis done without introducing PDV to the GST traffic of following the wavelength.Furthermore, the inter-packet gap between the GST stream is preserved, and theGST streams are sent out precisely as it arrived. Consequently, it results in zero
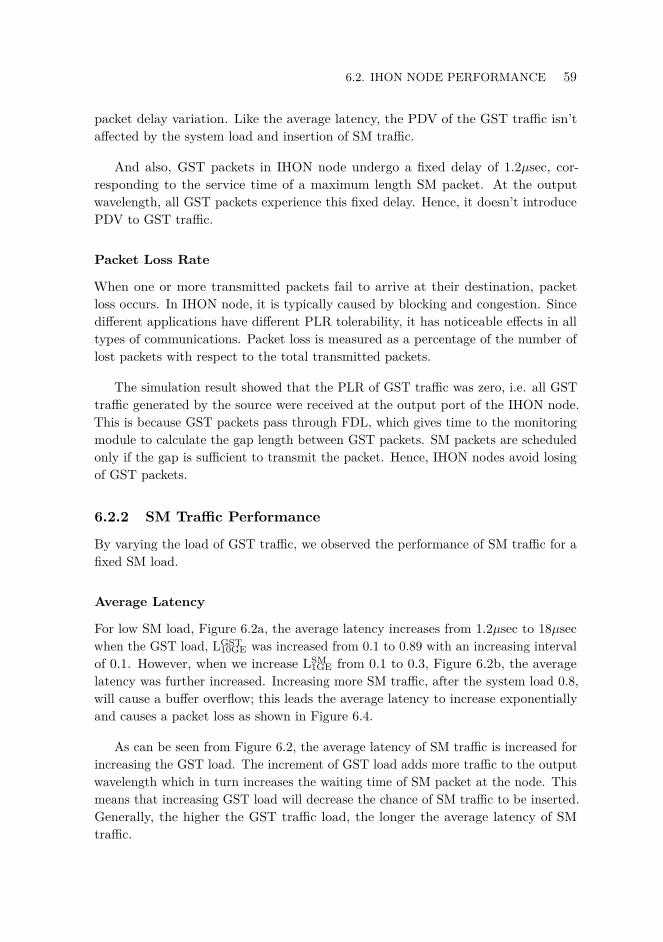
6.2. IHON NODE PERFORMANCE 59
packet delay variation. Like the average latency, the PDV of the GST traffic isn’taffected by the system load and insertion of SM traffic.
And also, GST packets in IHON node undergo a fixed delay of 1.2µsec, cor-responding to the service time of a maximum length SM packet. At the outputwavelength, all GST packets experience this fixed delay. Hence, it doesn’t introducePDV to GST traffic.
Packet Loss Rate
When one or more transmitted packets fail to arrive at their destination, packetloss occurs. In IHON node, it is typically caused by blocking and congestion. Sincedifferent applications have different PLR tolerability, it has noticeable effects in alltypes of communications. Packet loss is measured as a percentage of the number oflost packets with respect to the total transmitted packets.
The simulation result showed that the PLR of GST traffic was zero, i.e. all GSTtraffic generated by the source were received at the output port of the IHON node.This is because GST packets pass through FDL, which gives time to the monitoringmodule to calculate the gap length between GST packets. SM packets are scheduledonly if the gap is sufficient to transmit the packet. Hence, IHON nodes avoid losingof GST packets.
6.2.2 SM Traffic Performance
By varying the load of GST traffic, we observed the performance of SM traffic for afixed SM load.
Average Latency
For low SM load, Figure 6.2a, the average latency increases from 1.2µsec to 18µsecwhen the GST load, LGST
10GE was increased from 0.1 to 0.89 with an increasing intervalof 0.1. However, when we increase LSM
1GE from 0.1 to 0.3, Figure 6.2b, the averagelatency was further increased. Increasing more SM traffic, after the system load 0.8,will cause a buffer overflow; this leads the average latency to increase exponentiallyand causes a packet loss as shown in Figure 6.4.
As can be seen from Figure 6.2, the average latency of SM traffic is increased forincreasing the GST load. The increment of GST load adds more traffic to the outputwavelength which in turn increases the waiting time of SM packet at the node. Thismeans that increasing GST load will decrease the chance of SM traffic to be inserted.Generally, the higher the GST traffic load, the longer the average latency of SMtraffic.
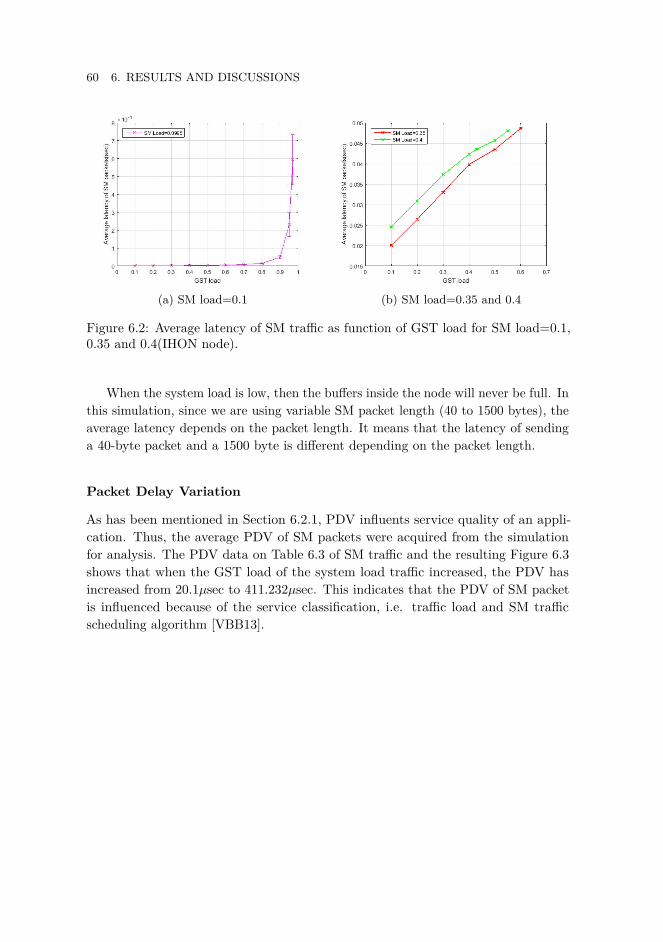
60 6. RESULTS AND DISCUSSIONS
(a) SM load=0.1 (b) SM load=0.35 and 0.4
Figure 6.2: Average latency of SM traffic as function of GST load for SM load=0.1,0.35 and 0.4(IHON node).
When the system load is low, then the buffers inside the node will never be full. Inthis simulation, since we are using variable SM packet length (40 to 1500 bytes), theaverage latency depends on the packet length. It means that the latency of sendinga 40-byte packet and a 1500 byte is different depending on the packet length.
Packet Delay Variation
As has been mentioned in Section 6.2.1, PDV influents service quality of an appli-cation. Thus, the average PDV of SM packets were acquired from the simulationfor analysis. The PDV data on Table 6.3 of SM traffic and the resulting Figure 6.3shows that when the GST load of the system load traffic increased, the PDV hasincreased from 20.1µsec to 411.232µsec. This indicates that the PDV of SM packetis influenced because of the service classification, i.e. traffic load and SM trafficscheduling algorithm [VBB13].

6.2. IHON NODE PERFORMANCE 61
Figure 6.3: Packet delay variation of SM traffic as function of GST load (IHONnode).
Packet Loss Ratio
One of the most important factors in the analysis of IHON node performance for SMtraffic is illustrated in Figure 6.4. Based on the figure, no PLR was observed withinsystem load interval [0,0.89]. When the system load reaches 0.89, SM packets startgetting dropped. From that point onward buffer overflow causes the loss to increaseexponentially.
(a) SM load=0.3 (b) SM load=0.4
Figure 6.4: PLR of SM traffic as function of GST load (IHON node).

62 6. RESULTS AND DISCUSSIONS
For LSM1GE=0.3, the added SM traffic increases the 10GE wavelength utilization
up to 89% without any losses and with SM PLR=1E−03 up to 92% utilization.
6.2.3 Comparison Between GST and SM Traffic Performance inIHON Node
Based on the results, Table 6.3, the average latency, PLR, and PDV of GST and SMtraffic were analyzed and compared. The exploration of these parameters helpedus to deeply understand the performance of IHON node towards traffic of differentpriority.
Average Latency
Figure 6.5 shows the average latency of GST and SM traffic for SM load=0.1. Fromthe figure, it is observed that the average latency of SM traffic increases when theGST load is increased from 0.1 to 0.89. This is because IHON node has a buffer tostore SM traffic when suitable gap between GST packets is not found, which resultsin longer delay. When the GST load is low, the buffer’s queue length will be shortand SM packets will pass through IHON node with a shorter delay. On the otherhand, when the GST load is increased, the chance of getting suitable gap is low andthe SM packet will stay a longer time in the buffer.
Figure 6.5: Average latency of SM and GST traffics as function of GST load for SMload=0.1 (IHON node)
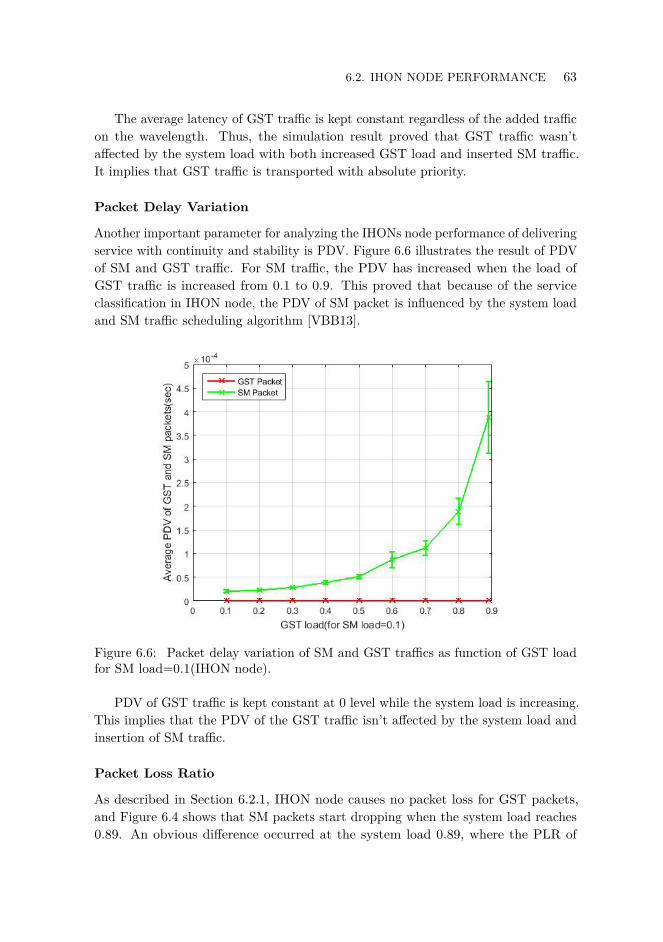
6.2. IHON NODE PERFORMANCE 63
The average latency of GST traffic is kept constant regardless of the added trafficon the wavelength. Thus, the simulation result proved that GST traffic wasn’taffected by the system load with both increased GST load and inserted SM traffic.It implies that GST traffic is transported with absolute priority.
Packet Delay Variation
Another important parameter for analyzing the IHONs node performance of deliveringservice with continuity and stability is PDV. Figure 6.6 illustrates the result of PDVof SM and GST traffic. For SM traffic, the PDV has increased when the load ofGST traffic is increased from 0.1 to 0.9. This proved that because of the serviceclassification in IHON node, the PDV of SM packet is influenced by the system loadand SM traffic scheduling algorithm [VBB13].
Figure 6.6: Packet delay variation of SM and GST traffics as function of GST loadfor SM load=0.1(IHON node).
PDV of GST traffic is kept constant at 0 level while the system load is increasing.This implies that the PDV of the GST traffic isn’t affected by the system load andinsertion of SM traffic.
Packet Loss Ratio
As described in Section 6.2.1, IHON node causes no packet loss for GST packets,and Figure 6.4 shows that SM packets start dropping when the system load reaches0.89. An obvious difference occurred at the system load 0.89, where the PLR of
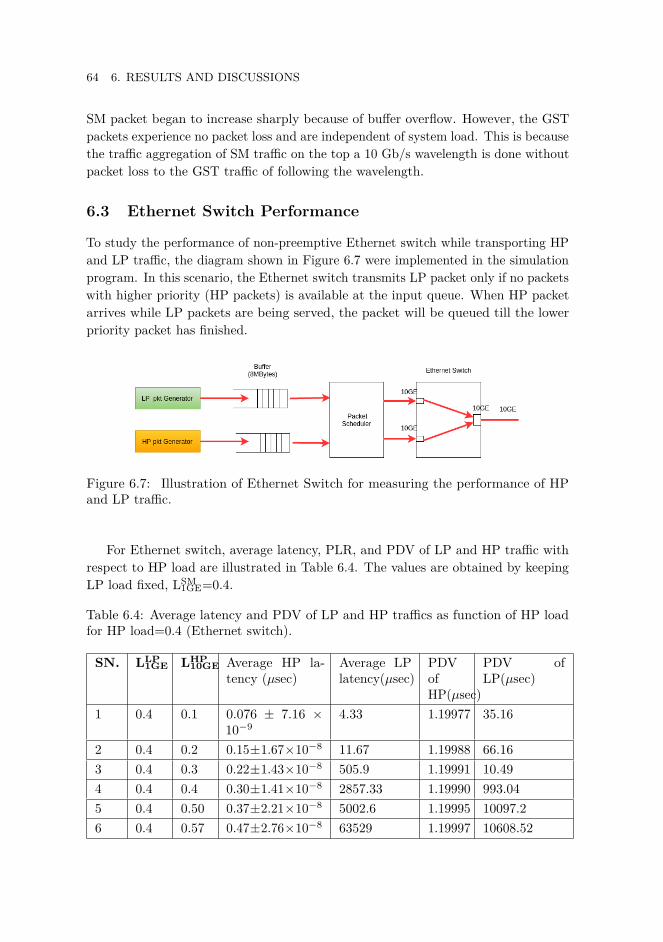
64 6. RESULTS AND DISCUSSIONS
SM packet began to increase sharply because of buffer overflow. However, the GSTpackets experience no packet loss and are independent of system load. This is becausethe traffic aggregation of SM traffic on the top a 10 Gb/s wavelength is done withoutpacket loss to the GST traffic of following the wavelength.
6.3 Ethernet Switch Performance
To study the performance of non-preemptive Ethernet switch while transporting HPand LP traffic, the diagram shown in Figure 6.7 were implemented in the simulationprogram. In this scenario, the Ethernet switch transmits LP packet only if no packetswith higher priority (HP packets) is available at the input queue. When HP packetarrives while LP packets are being served, the packet will be queued till the lowerpriority packet has finished.
Figure 6.7: Illustration of Ethernet Switch for measuring the performance of HPand LP traffic.
For Ethernet switch, average latency, PLR, and PDV of LP and HP traffic withrespect to HP load are illustrated in Table 6.4. The values are obtained by keepingLP load fixed, LSM
1GE=0.4.
Table 6.4: Average latency and PDV of LP and HP traffics as function of HP loadfor HP load=0.4 (Ethernet switch).
SN. LLP1GE LHP
10GE Average HP la-tency (µsec)
Average LPlatency(µsec)
PDVofHP(µsec)
PDV ofLP(µsec)
1 0.4 0.1 0.076 ± 7.16 ×10⁻⁹
4.33 1.19977 35.16
2 0.4 0.2 0.15±1.67×10⁻⁸ 11.67 1.19988 66.163 0.4 0.3 0.22±1.43×10⁻⁸ 505.9 1.19991 10.494 0.4 0.4 0.30±1.41×10⁻⁸ 2857.33 1.19990 993.045 0.4 0.50 0.37±2.21×10⁻⁸ 5002.6 1.19995 10097.26 0.4 0.57 0.47±2.76×10⁻⁸ 63529 1.19997 10608.52

6.3. ETHERNET SWITCH PERFORMANCE 65
6.3.1 HP Traffic Performance
In this part, the performance of HP traffic is presented with respect to: averagelatency, PLR, and PDV.
Average Latency
Figure 6.8 presents the average latency of HP traffic with respect to HP load forLLP
1GE=0.4 and 0.45. Form the figure, we see that the average latency is increasingwith increasing value of HP load. This is because HP packets have to wait in aqueue when they arrive while the LP packets are serving. When the system loadincreases, the probability of getting the output wavelength free is low. As a result,the latency of HP packet increases. The maximum latency experienced by HP packetwas 1.2µsec.
Figure 6.8: Average latency of HP traffic as function of HP load for LP load 0.4 and0.45(Ethernet switch).
From Section 6.2.1 and Figure 6.8 we see that the average latency of GST trafficin IHON node is higher than the average latency of LP traffic in Ethernet switch.The average latency of GST packet is constant with a value of 1.2µsec, whereas the
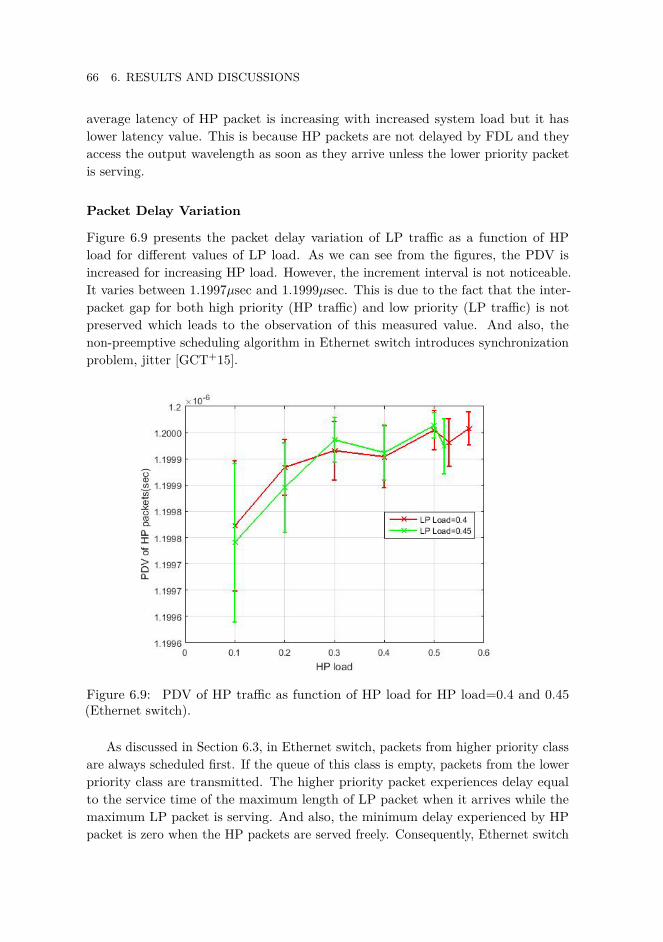
66 6. RESULTS AND DISCUSSIONS
average latency of HP packet is increasing with increased system load but it haslower latency value. This is because HP packets are not delayed by FDL and theyaccess the output wavelength as soon as they arrive unless the lower priority packetis serving.
Packet Delay Variation
Figure 6.9 presents the packet delay variation of LP traffic as a function of HPload for different values of LP load. As we can see from the figures, the PDV isincreased for increasing HP load. However, the increment interval is not noticeable.It varies between 1.1997µsec and 1.1999µsec. This is due to the fact that the inter-packet gap for both high priority (HP traffic) and low priority (LP traffic) is notpreserved which leads to the observation of this measured value. And also, thenon-preemptive scheduling algorithm in Ethernet switch introduces synchronizationproblem, jitter [GCT+15].
Figure 6.9: PDV of HP traffic as function of HP load for HP load=0.4 and 0.45(Ethernet switch).
As discussed in Section 6.3, in Ethernet switch, packets from higher priority classare always scheduled first. If the queue of this class is empty, packets from the lowerpriority class are transmitted. The higher priority packet experiences delay equalto the service time of the maximum length of LP packet when it arrives while themaximum LP packet is serving. And also, the minimum delay experienced by HPpacket is zero when the HP packets are served freely. Consequently, Ethernet switch

6.3. ETHERNET SWITCH PERFORMANCE 67
introduces PDV equals to the duration of maximum length of LP packet to HPtraffic. The measured PDV value was approximately 1.2µsec.
Packet Loss Ratio
Like the PLR of GST traffic in IHON node, the PLR of HP traffic was zero, i.e. allHP packet generated in the source were received at the output port of the Ethernetswitch. This shows that the HP traffic is given higher priority.
6.3.2 LP Traffic Performance
The performance of LP traffics in Ethernet switch is described below.
Average Latency
As shown in Figure 6.10, the LP packet latency increases slowly as the 10GE HPload increases. The average Latency increases exponentially from 1msec to 8msec forLLP
1GE=0.4 and 0.45. This is because packets with low priority are transmitted only ifthe higher priority input queue has no available packet to transmit. As the HP loadincreases, the low priority queue begins to fill up due to the arriving LP traffic whilethe output wavelength is not free. As a result, the amount of latency the LP packetexperiences going through the queue increases.
Figure 6.10: Average latency of LP traffic as function of HP load for LP load=0.4and 0.45 (Ethernet switch).
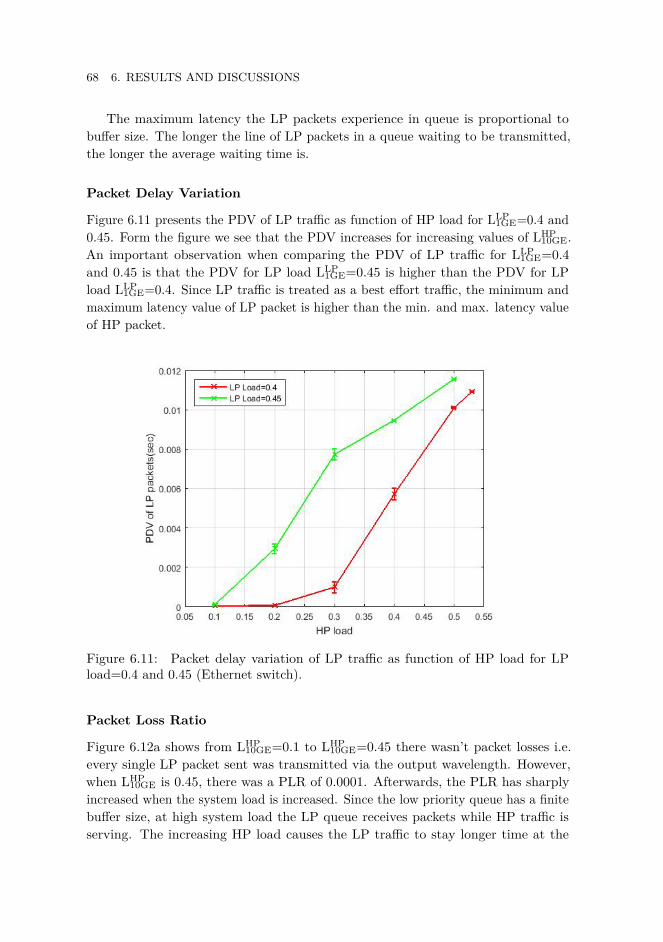
68 6. RESULTS AND DISCUSSIONS
The maximum latency the LP packets experience in queue is proportional tobuffer size. The longer the line of LP packets in a queue waiting to be transmitted,the longer the average waiting time is.
Packet Delay Variation
Figure 6.11 presents the PDV of LP traffic as function of HP load for LLP1GE=0.4 and
0.45. Form the figure we see that the PDV increases for increasing values of LHP10GE.
An important observation when comparing the PDV of LP traffic for LLP1GE=0.4
and 0.45 is that the PDV for LP load LLP1GE=0.45 is higher than the PDV for LP
load LLP1GE=0.4. Since LP traffic is treated as a best effort traffic, the minimum and
maximum latency value of LP packet is higher than the min. and max. latency valueof HP packet.
Figure 6.11: Packet delay variation of LP traffic as function of HP load for LPload=0.4 and 0.45 (Ethernet switch).
Packet Loss Ratio
Figure 6.12a shows from LHP10GE=0.1 to LHP
10GE=0.45 there wasn’t packet losses i.e.every single LP packet sent was transmitted via the output wavelength. However,when LHP
10GE is 0.45, there was a PLR of 0.0001. Afterwards, the PLR has sharplyincreased when the system load is increased. Since the low priority queue has a finitebuffer size, at high system load the LP queue receives packets while HP traffic isserving. The increasing HP load causes the LP traffic to stay longer time at the
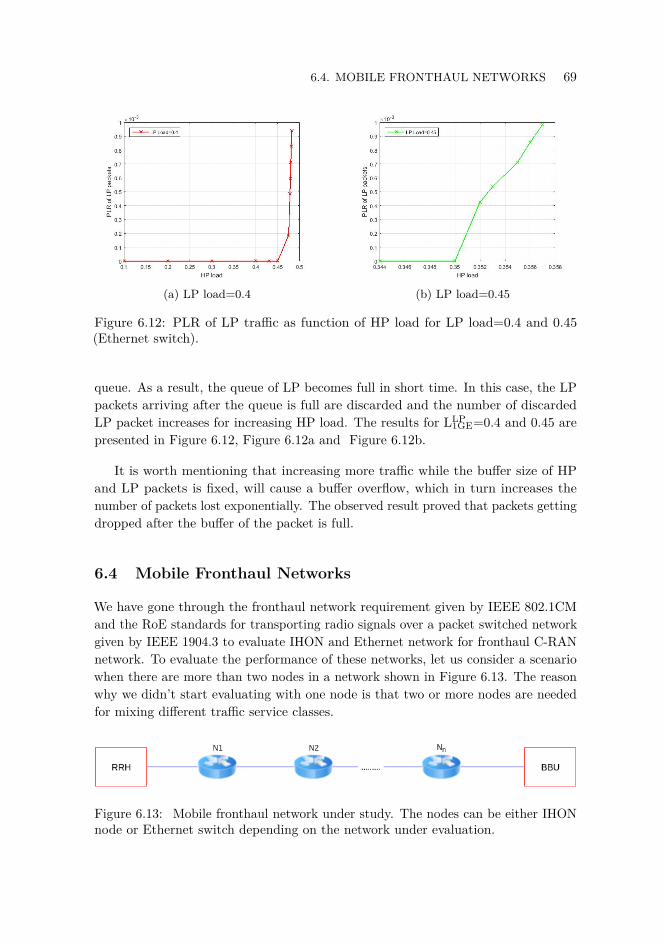
6.4. MOBILE FRONTHAUL NETWORKS 69
(a) LP load=0.4 (b) LP load=0.45
Figure 6.12: PLR of LP traffic as function of HP load for LP load=0.4 and 0.45(Ethernet switch).
queue. As a result, the queue of LP becomes full in short time. In this case, the LPpackets arriving after the queue is full are discarded and the number of discardedLP packet increases for increasing HP load. The results for LLP
1GE=0.4 and 0.45 arepresented in Figure 6.12, Figure 6.12a and Figure 6.12b.
It is worth mentioning that increasing more traffic while the buffer size of HPand LP packets is fixed, will cause a buffer overflow, which in turn increases thenumber of packets lost exponentially. The observed result proved that packets gettingdropped after the buffer of the packet is full.
6.4 Mobile Fronthaul Networks
We have gone through the fronthaul network requirement given by IEEE 802.1CMand the RoE standards for transporting radio signals over a packet switched networkgiven by IEEE 1904.3 to evaluate IHON and Ethernet network for fronthaul C-RANnetwork. To evaluate the performance of these networks, let us consider a scenariowhen there are more than two nodes in a network shown in Figure 6.13. The reasonwhy we didn’t start evaluating with one node is that two or more nodes are neededfor mixing different traffic service classes.
Figure 6.13: Mobile fronthaul network under study. The nodes can be either IHONnode or Ethernet switch depending on the network under evaluation.

70 6. RESULTS AND DISCUSSIONS
In the following sections, we evaluate the different parameters of the IHON nodesin a RoE mobile fronthaul setting. Our aim is to find how such a network can bedimensioned with respect to: technology, fiber length, and number of nodes. Itis important to note that the latency results described below represent only thequeuing and transmission delays; but the nodal delay, which depends entirely on theimplementation of the node, has not been taken into account.
6.4.1 Evaluation of IHON Network for Mobile FronthaulNetwork
The overall fronthaul requirements are listed in Table 3.1, Table 3.2, and Table 3.3.They are mainly focused on performance metrics: PLR, average latency, and PDV.In Section 6.2, we have measured the result of these performance metrics in IHONnode when transporting one 10GE GST traffic and four 1GE SM traffics aggregatedon a single 10 Gb/s wavelength. The results were measured by changing the totalload of aggregated SM traffic, total LSM
1GE on 10 GE, from 0.1 – 0.4, and the numberof SM streams (n) used to supply the total load were four; for each load size, eachSM stream contributes an equal amount of load. The measured values are used toevaluate the performance of IHON network for mobile fronthaul network.
Average Latency
The first performance metric used for evaluation of IHON network for fronthualC-RAN is average latency. According to IEEE 802.1CM and Table 3.2, the maximumE2E latency between BBU and RRH required for mobile fronthaul is specified as50µsec( including fiber length and PDV), and the latency budget is 5µsec whencable propagation is excluded. Within this 50µsec latency, the maximum separationdistance between BBU and RRH (link length) is limited and depends on the numberof nodes in the network. To calculate the link length as function of number of nodes(N), the following equation has been used:
Maximum E2E latency (Ltotal):
Ltotal = N ×Dnode +DT × Linklength (6.1)
where,N = Number of nodes.Dnode= Latency in a single node, 1.2µsec (obtained from our simulation).Delay_PDVnode=PDV in a single node, 0µsec (obtained from our simulation).DT=Transmission latency, 5µsec/km.

6.4. MOBILE FRONTHAUL NETWORKS 71
Ltotal= Maximum E2E latency, 50µsec.Linklength= Maximum link length.
Table 6.5: Maximum link length and number of nodes in IHON network to meetthe fronthaul requirements for GST traffic where Ltotal=50µsec, DT=5µsec/km, andDnode=1.2µsec.
N Total Dnode(µsec) Linklength(Km)2 2.4 9.523 3.6 9.284 4.8 9.045 6 8.86 7.2 8.56
Table 6.5 presents the relationship between the number of nodes in IHON fronthaulnetwork and the maximum separation distance between BBU and RRH for GSTtraffic. In the table, the second column indicates the overall delay in the nodes,whereas the third column is the link length between BBU and RRH in the network.The table shows that for increasing the number of nodes in the network, the linklength decreases. For instance, for IHON network with 3 nodes require 9.28 Km fiberlink length. Similarly, for IHON network with 4 nodes require 9.04 Km fiber linklength.
The simulation results and Table 6.5 proved that IHON networks are capableof carrying radio signals over packet-based fronthaul network provided that thenumber of nodes in the table corresponds to its respective link length. Unfortunately,obtaining the average latency of BE or SM traffic that meets fronthaul requirementis not so straightforward, since this traffic depends on a load of GST traffic.
Packet Delay Variation
Another performance used for evaluation of IHON network for a fronthaul networkis PDV. In Table 3.2, the maximum PDV specified is 5µsec or 10% of E2E latency.The simulated result of PDV for GST traffic was zero. Thus, the GST traffic classmeets the fronthaul requirement in PDV comparison.
The fronthaul requirement is higher than peak PDV of GST traffic for any systemload in the interval [0,0.99]. Consequently, of the three performance metrics (averagelatency, PDV, PLR), the IHON network performs best in PDV for GST traffic. Ithas no restriction in wavelength utilization of IHON network.
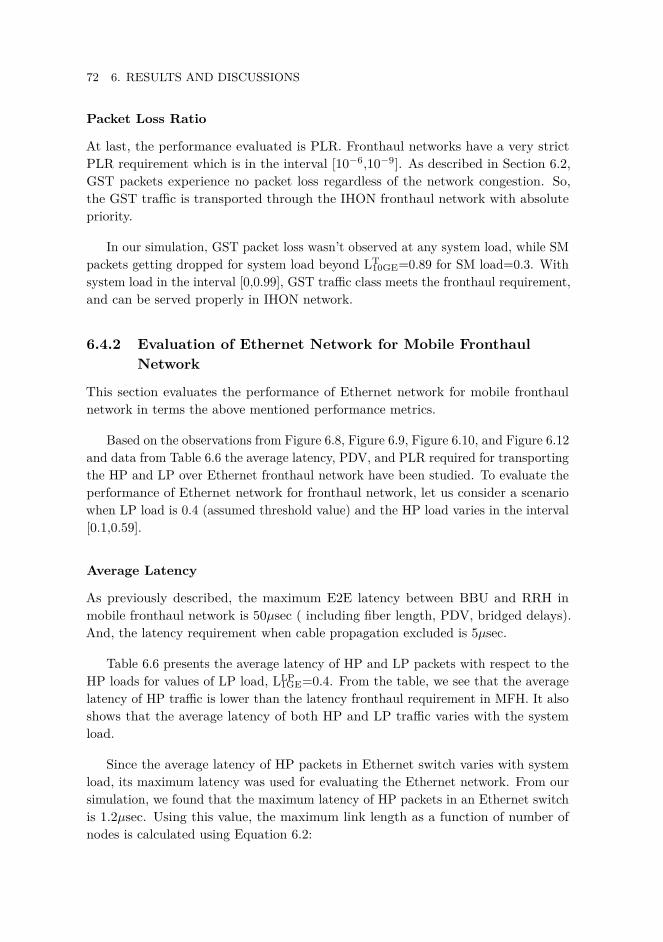
72 6. RESULTS AND DISCUSSIONS
Packet Loss Ratio
At last, the performance evaluated is PLR. Fronthaul networks have a very strictPLR requirement which is in the interval [10−6,10−9]. As described in Section 6.2,GST packets experience no packet loss regardless of the network congestion. So,the GST traffic is transported through the IHON fronthaul network with absolutepriority.
In our simulation, GST packet loss wasn’t observed at any system load, while SMpackets getting dropped for system load beyond LT
10GE=0.89 for SM load=0.3. Withsystem load in the interval [0,0.99], GST traffic class meets the fronthaul requirement,and can be served properly in IHON network.
6.4.2 Evaluation of Ethernet Network for Mobile FronthaulNetwork
This section evaluates the performance of Ethernet network for mobile fronthaulnetwork in terms the above mentioned performance metrics.
Based on the observations from Figure 6.8, Figure 6.9, Figure 6.10, and Figure 6.12and data from Table 6.6 the average latency, PDV, and PLR required for transportingthe HP and LP over Ethernet fronthaul network have been studied. To evaluate theperformance of Ethernet network for fronthaul network, let us consider a scenariowhen LP load is 0.4 (assumed threshold value) and the HP load varies in the interval[0.1,0.59].
Average Latency
As previously described, the maximum E2E latency between BBU and RRH inmobile fronthaul network is 50µsec ( including fiber length, PDV, bridged delays).And, the latency requirement when cable propagation excluded is 5µsec.
Table 6.6 presents the average latency of HP and LP packets with respect to theHP loads for values of LP load, LLP
1GE=0.4. From the table, we see that the averagelatency of HP traffic is lower than the latency fronthaul requirement in MFH. It alsoshows that the average latency of both HP and LP traffic varies with the systemload.
Since the average latency of HP packets in Ethernet switch varies with systemload, its maximum latency was used for evaluating the Ethernet network. From oursimulation, we found that the maximum latency of HP packets in an Ethernet switchis 1.2µsec. Using this value, the maximum link length as a function of number ofnodes is calculated using Equation 6.2:
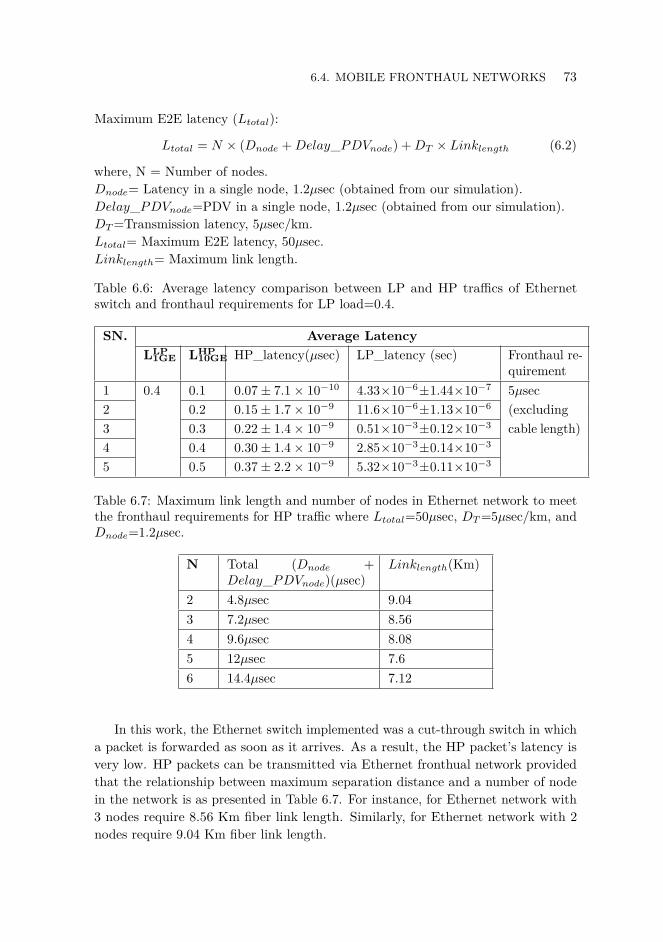
6.4. MOBILE FRONTHAUL NETWORKS 73
Maximum E2E latency (Ltotal):
Ltotal = N × (Dnode +Delay_PDVnode) +DT × Linklength (6.2)
where, N = Number of nodes.Dnode= Latency in a single node, 1.2µsec (obtained from our simulation).Delay_PDVnode=PDV in a single node, 1.2µsec (obtained from our simulation).DT=Transmission latency, 5µsec/km.Ltotal= Maximum E2E latency, 50µsec.Linklength= Maximum link length.
Table 6.6: Average latency comparison between LP and HP traffics of Ethernetswitch and fronthaul requirements for LP load=0.4.
SN. Average LatencyLLP
1GE LHP10GE HP_latency(µsec) LP_latency (sec) Fronthaul re-
quirement1 0.4 0.1 0.07± 7.1× 10⁻¹⁰ 4.33×10⁻⁶±1.44×10⁻⁷ 5µsec2 0.2 0.15± 1.7× 10⁻⁹ 11.6×10⁻⁶±1.13×10⁻⁶ (excluding3 0.3 0.22± 1.4× 10⁻⁹ 0.51×10⁻³±0.12×10⁻³ cable length)4 0.4 0.30± 1.4× 10⁻⁹ 2.85×10⁻³±0.14×10⁻³
5 0.5 0.37± 2.2× 10⁻⁹ 5.32×10⁻³±0.11×10⁻³
Table 6.7: Maximum link length and number of nodes in Ethernet network to meetthe fronthaul requirements for HP traffic where Ltotal=50µsec, DT=5µsec/km, andDnode=1.2µsec.
N Total (Dnode +Delay_PDVnode)(µsec)
Linklength(Km)
2 4.8µsec 9.043 7.2µsec 8.564 9.6µsec 8.085 12µsec 7.66 14.4µsec 7.12
In this work, the Ethernet switch implemented was a cut-through switch in whicha packet is forwarded as soon as it arrives. As a result, the HP packet’s latency isvery low. HP packets can be transmitted via Ethernet fronthual network providedthat the relationship between maximum separation distance and a number of nodein the network is as presented in Table 6.7. For instance, for Ethernet network with3 nodes require 8.56 Km fiber link length. Similarly, for Ethernet network with 2nodes require 9.04 Km fiber link length.

74 6. RESULTS AND DISCUSSIONS
Packet Delay Variation
In Table 3.2, the maximum PDV specified for fronthaul network is 5µsec or 10% ofE2E latency. For HP traffic, the PDV of a single node was approximately 1.2µsecregardless of the system load. To evaluate Ethernet network for fronthaul with regardto PDV, the following equation has been used:Maximum PDV (PDVtotal):
PDVtotal = N × PDVnode (6.3)
where,N = Number of nodes.PDVnode=PDV in a single node, 1.2µsec (obtained from our simulation).PDVtotal= Maximum PDV, 5µsec.
Table 6.8: The Number of nodes in Ethernet network to meet the PDV fronthaulrequirements for HP traffic where PDVtotal=5µsec and PDVnode=1.2µsec.
N PDVnode(µsec)PDVtotal(µsec)2 2.43 1.2 3.64 4.8
As shown in Table 6.8, the HP traffic in Ethernet network meets the PDVfronthaul requirement as long as the number of nodes in the Ethernet network is atmost 4. This implies that HP packets can be transmitted via Ethernet fronthualnetwork when the number of nodes in the network is at most 4.
Packet Loss Ratio
Like GST traffic, HP packet loss wasn’t observed at any system load. Table 6.9depicts that the PLR of HP and LP packets with respect to the HP loads for LPload=0.4. The table shows that the observed PLR of HP is lower than the PLRrequirement in mobile fronthaul requirements.
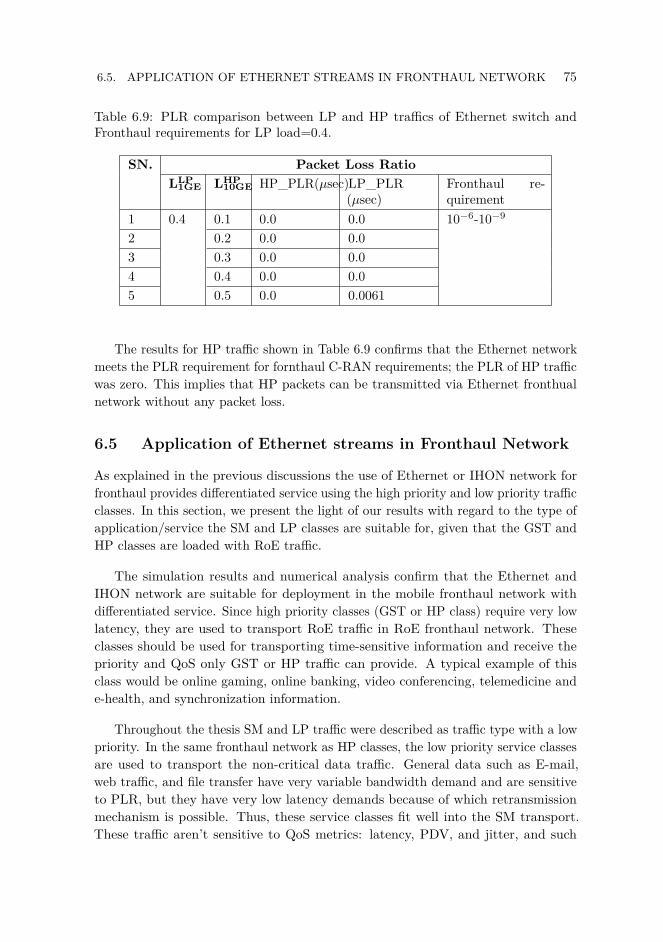
6.5. APPLICATION OF ETHERNET STREAMS IN FRONTHAUL NETWORK 75
Table 6.9: PLR comparison between LP and HP traffics of Ethernet switch andFronthaul requirements for LP load=0.4.
SN. Packet Loss RatioLLP
1GE LHP10GE HP_PLR(µsec)LP_PLR
(µsec)Fronthaul re-quirement
1 0.4 0.1 0.0 0.0 10−6-10−9
2 0.2 0.0 0.03 0.3 0.0 0.04 0.4 0.0 0.05 0.5 0.0 0.0061
The results for HP traffic shown in Table 6.9 confirms that the Ethernet networkmeets the PLR requirement for fornthaul C-RAN requirements; the PLR of HP trafficwas zero. This implies that HP packets can be transmitted via Ethernet fronthualnetwork without any packet loss.
6.5 Application of Ethernet streams in Fronthaul Network
As explained in the previous discussions the use of Ethernet or IHON network forfronthaul provides differentiated service using the high priority and low priority trafficclasses. In this section, we present the light of our results with regard to the type ofapplication/service the SM and LP classes are suitable for, given that the GST andHP classes are loaded with RoE traffic.
The simulation results and numerical analysis confirm that the Ethernet andIHON network are suitable for deployment in the mobile fronthaul network withdifferentiated service. Since high priority classes (GST or HP class) require very lowlatency, they are used to transport RoE traffic in RoE fronthaul network. Theseclasses should be used for transporting time-sensitive information and receive thepriority and QoS only GST or HP traffic can provide. A typical example of thisclass would be online gaming, online banking, video conferencing, telemedicine ande-health, and synchronization information.
Throughout the thesis SM and LP traffic were described as traffic type with a lowpriority. In the same fronthaul network as HP classes, the low priority service classesare used to transport the non-critical data traffic. General data such as E-mail,web traffic, and file transfer have very variable bandwidth demand and are sensitiveto PLR, but they have very low latency demands because of which retransmissionmechanism is possible. Thus, these service classes fit well into the SM transport.These traffic aren’t sensitive to QoS metrics: latency, PDV, and jitter, and such
76 6. RESULTS AND DISCUSSIONS
traffic class get what is left after high priority traffic. Within the low priority classes,they might be further differentiated across a range of applications with different QoS;different QoS differentiation mechanism is possible to implement.
To illustrate the share of HP class traffic with the lower priority traffic, let usconsider an IHON node loaded with SM load=0.3 and GST load that varies withinthe interval [0,0.69] shown in Figure 6.4. As discussed above, the results have proventhat the GST class can be loaded with RoE traffic to transport it with absolutetransfer guarantees and circuit switched QoS. While achieving a high throughputefficiency of 89.0%, the SM classes can transport the rest data with no packet loss.However, SM packets start getting dropped at LGST
10GE=0.59. Thus, we can concludethat inserting SM in the gap increases the 10GE wavelength utilization up to 89.0%without any packet losses, and with SM PLR=1E−03 up to LT
10GE=0.92 or 92%utilization. The IHON node enables transport of SM packet network with highutilization up to 92%.

Chapter7Summary and Conclusion
7.1 Summary
Due to the ever-increasing demand for network traffic and application, the networkcapacity has to grow to match this demand. Newer technologies both in the opticaland electrical fields allow greater capacity to cope with the huge data, but this isat the expense of the cost of the new equipment. Power consumption in cell sitesand the switching devices to offer greater speed are becoming a greater and greaterportion of the overall network cost. To increase the performance of the switch andreduce the power consumption in the cell sites (in mobile networks), the resourceshave to be used efficiently. Thus, the operators have been looking for methods toaddress this growing cost. As a result, a C-RAN featuring a fronthaul network isproposed by [Ins11]. This work basically connects the performance of IHON andEthernet network to the fronthaul network requirements of C-RAN.
Firstly, we studied the background and motivation of the mobile fronthaul networkand deeply exploited the need of packed based fronthaul networks. The evolutionof these networks from the first stage up to the current stage have been studied.Moreover, several mobile fronthaul solution for the transportation of traffic wereconcretely studied. Ethernet frame format for transporting radio signals with thehelp of RoE header was also discussed.
Secondly, the fronthaul requirements from the IEEE 802.1CM standard andother references (listed in Chapter 3) were deeply studied. For mobile fronthaulnetwork, the PLR, PDV, average latency, and synchronization requirements havebeen discussed. Furthermore, the maximum distance between BBU and RRH thatcan be supported by a specific latency value has also been discussed.
Thirdly, numerical and simulation method of our scenarios were discussed. Nu-merical analysis for the different fronthaul transport options has been discussed andcompared with the fronthaul requirements described in Chapter 3. The implementa-
77
78 7. SUMMARY AND CONCLUSION
tion of IHON nodes with one 10GE GST port and four 1GE SM port and standardEthernet switches is explained in Appendix A.
Finally, we have evaluated the different performance parameters of the switchesin a RoE mobile frontal setting and dimensioned with respect to: technology, fiberlength, and number of nodes. We presented the light of our results with regard tothe type of application/service the SM and LP classes are suitable for, given thatthe GST and HP classes are loaded with RoE traffic.
Demos programming was used to achieve the objective of this work. Two gen-erators, one GST packet generator, and SM packet generator have been used togenerate the two traffics of IHON network. In order to get an accurate result, severalvalidation techniques, starting from a trace up to analytical analysis, have been used.Moreover, results such as the PDV, PLR, average latency, and other related metricswere obtained from the simulator. All the necessary results have been presented with95% confidence interval.
7.2 Conclusion
In this thesis work, the overall performance of IHON node and standard Ethernetswitch were analyzed. We measured average latency, PDV, and PLR for both GSTand SM traffic in IHON node, and for both HP and LP traffic in Ethernet switch.With regard to IHON node, the performance of delivering high quality of service wasapproved and reflected on GST and fits the technical specification of fusion node.Similarly, the high quality of service was reflected on HP traffic in Ethernet switch.Both SM and LP traffic are suitable for transporting time insensitive information.
The recommendation from the IEEE 802.1CM standard and other articles wereconsidered for examining and investigating how IHON and Ethernet fronthaul net-works should provide the required quality of service. The results obtained from thesimulator was compared with these recommendation standards and are presented asfollows:
Scenario I: In this scenario, one 10GE GST stream and four 1GE sub-wavelengthSM injected on the leftover capacity, was considered. The measured average latencyfor GST packet in a single node was approximately 1.2µsec. Using this value, themaximum separation distance between BBU and RRH (link length) is limited anddepends on the number of nodes given that the maximum E2E fronthaul latencyis as presented in Table 3.2. The results in Table 6.5 show that for increasing thenumber of nodes in the network, the link length decreases.
Maximum PDV of GST traffic was measured as zero, and no GST packet loss wasregistered, which shows us a better performance than the recommended fronthaul

7.2. CONCLUSION 79
requirement. Hence, we conclude that fusion network performs better than what isrecommended in IEEE 802.1CM standard in PDV and PLR comparison. Since theGST traffic met the fronthaul requirement, they can be used for transporting RoEtraffic while SM traffic can used for transporting time insensitive application.
Scenario II: For a scenario where there is high priority class traffic (HP traffic)and lower priority class traffic (LP) on 10GE wavelength, the measured averagelatency for the higher priority class was approximately between 0.01µsec and 0.55µsecfor LP load=0.3, and the measured maximum latency was 1.2µsec. However, wetook the maximum latency value for evaluating the performance of Ethernet networkfor fronthaul network. Like GST traffic in IHON network,the maximum separationdistance between BBU and RRH (link length) is limited and depends on the numberof nodes. The relation between the number of nodes and link length is tabulatedin Table 6.7. However, the measured PDV of HP traffic in Ethernet switch limitsthe Ethernet fronthaul network to have a maximum of four nodes in order to thePDV fronthaul requirement.
The measured PLR of HP traffic in Ethernet switch was zero. Comparing thisvalue with fronthaul requirement, Ethernet network performs better than what isrecommended in IEEE 802.1CM standard. Hence, the performance of Ethernetswitch fits into C-RAN fronthaul requirement in PLR comparison. As a result, theHP classes can be used for transporting RoE traffic.
Additionally, the measured performance metrics of HP and GST classes are muchlower than what is recommended in ITU-T recommendation for the most sensitiveapplications, see Appendix B.
Other important points that this thesis work has measured and evaluated:
1. The important design concepts of fusion node have been confirmed.2. The fusion node aggregation of multiple 1GE SM traffic and 10GE on a single
wavelength has been achieved without affecting the deterministic nature ofcircuit switching.
3. The simulation result confirms that the average latency of GST packet isindependent of the system load and experiences a zero packet delay variationin a node.
4. The efficient utilization of bandwidth has been achieved by inserting suitableSM traffic in the computed gap between GST packets.
5. HP traffic experiences a PDV equals to the duration of maximum sized LPtraffic in Ethernet switch.

Chapter8Future Work
8.1 Future Work
This chapter presents some suggestions to consider and further investigate in futurework. The following points are suggested for improved performance and accurateevaluation of packet switched mobile fronthaul network:
• As previously mentioned in Chapter 3 and Chapter 6, the evaluation of IHONand Ethernet network was made based on the maximum absolute one way latency,50µsec (including PDV, cable length· · · etc), and maximum latency per link, 5µsec(excluding cable propagation). However, the 5µsec delay may no longer dominatethe total link latency as the distance and network complexity increases. Multimediatraffic services in mobile network occupy asymmetric bandwidth in uplink anddownlink. Thus, the specifications and the fronthaul standards may need to berevisited as they were specified with the assumption of symmetry.
• In this work, we have evaluated the performance of Ethernet network withoutconsidering synchronization effect. The thesis can further be extended to includethis important feature of mobile networks. Furthermore, we considered packet lossonly when the buffer is full. In a large packet-switched network, packets can belost because of a node failure, contention between two packets arriving at the sametime at the same port and synchronization problem. Therefore, for the accurateevaluation Ethernet network, the above points would be necessary to take theminto consideration.
• The simulation model for Ethernet switch was based on the cut-through mode inwhich the Ethernet frame is forwarded as soon as the destination address has beenread. The thesis can then be extended to evaluate the store-and-forward switch inwhich the entire Ethernet frame is stored and checked before forwarding on theappropriate output port.
81
82 8. FUTURE WORK
• We focused on the latency, PLR, and PDV requirements of fronthual transportoptions. However, they are not the only time-related performance metrics offronthaul networks. A complete fronthaul network must provide phase, time,and frequency synchronization between the BBU unit and one or more RRHunits. These synchronizations can be quantified using fractional frequency offset,jitter/wander, and phase/time error parameters.
• The simulation presented in this work is asynchronous. It is important to includesynchronization feature in the simulation. In synchronous Ethernet, a referenceclock is extracted from the received data in each node. In order to gain precisefrequency, time, and phase synchronization, mechanisms such as IEEE 1588 orPrecision Time Protocol (PTP) is required to achieve synchronsim through theexchange of time-stamped packet [IS].
References
[ABC+14] J.G. Andrews, S. Buzzi, Wan Choi, S.V. Hanly, A. Lozano, A.C.K. Soong, andJ.C. Zhang. What will 5g be? Selected Areas in Communications, IEEE Journalon, 32(6):1065–1082, June 2014.
[AWP15] N. P. Anthapadmanabhan, A. Walid, and T. Pfeiffer. Mobile fronthaul overlatency-optimized time division multiplexed passive optical networks. In 2015IEEE International Conference on Communication Workshop (ICCW), pages62–67, June 2015.
[Bay01] P. Bayvel. Wavelength routing and optical burst switching in the design of futureoptical network architectures. In Optical Communication, 2001. ECOC ’01. 27thEuropean Conference on, volume 4, pages 616–619 vol.4, 2001.
[BHS06] S. Bjornstad, D. R. Hjelme, and N. Stol. A packet-switched hybrid optical networkwith service guarantees. IEEE Journal on Selected Areas in Communications,24(8):107, Aug 2006.
[BNOS05] Steinar Bjørnstad, Martin Nord, Torodd Olsen, and Norvald Stol. Burst, packetand hybrid switching in the optical core network, 2005.
[CCY+15] A. Checko, H.L. Christiansen, Ying Yan, L. Scolari, G. Kardaras, M.S. Berger,and L. Dittmann. Cloud ran for mobile networks #x2014;a technology overview.Communications Surveys Tutorials, IEEE, 17(1):405–426, Firstquarter 2015.
[Chh13] J. Chhapekar. Mathematical analysis amp; model of packet delay variationexperienced by ieee 1588 packets. In Advance Computing Conference (IACC),2013 IEEE 3rd International, pages 347–350, Feb 2013.
[CJCB15] A. Checko, A. C. Juul, H. L. Christiansen, and M. S. Berger. Synchronizationchallenges in packet-based cloud-ran fronthaul for mobile networks. In Com-munication Workshop (ICCW), 2015 IEEE International Conference on, pages2721–2726, June 2015.
[CPLC+13] P. Chanclou, A. Pizzinat, F. Le Clech, T.-L. Reedeker, Y. Lagadec, F. Saliou,B. Le Guyader, L. Guillo, Q. Deniel, S. Gosselin, S.D. Le, T. Diallo, R. Brenot,F. Lelarge, L. Marazzi, P. Parolari, M. Martinelli, S. O’Dull, S.A. Gebrewold,D. Hillerkuss, J. Leuthold, G. Gavioli, and P. Galli. Optical fiber solution for
83
84 REFERENCES
mobile fronthaul to achieve cloud radio access network. In Future Network andMobile Summit (FutureNetworkSummit), 2013, pages 1–11, July 2013.
[CTH+12] N. Cvijetic, A. Tanaka, Yue-Kai Huang, M. Cvijetic, E. Ip, Yin Shao, andTing Wang. 4 #x002b;g mobile backhaul over ofdma/tdma-pon to 200 cell sitesper fiber with 10gb/s upstream burst-mode operation enabling #x003c; 1mstransmission latency. In Optical Fiber Communication Conference and Exposition(OFC/NFOEC), 2012 and the National Fiber Optic Engineers Conference, pages1–3, March 2012.
[Dav14] John Davies. Mobile fronthaul optimized for cloud ran. https://techzine.alcatel-lucent.com/mobile-fronthaul-optimized-cloud-ran, April 2014. [Online;accessed 13-February-2016].
[EA] NEC Corporation Nokia Networks Alcatel-Lucent CPRI Specification Ericsson AB,Huawei Technologies Co. Ltd. Common public radio interface (cpri); interfacespecification. http://www.cpri.info. [Online; accessed 07-March-2016].
[EHHP14] Emstad, Heegaard, Helvik, and Paruereau. TTM4110-Dependability and perfor-mance with discrete event simulation. 2014.
[Eri15] Ericsson. Cloud ran: the benefits of virtualization, centralization andcoordination. http://www.ericsson.com/news?categoryFilter=white_papers_1270673222_c, September 2015. [Online; accessed 08-February-2016].
[ETS] ETSI. Open radio equipment interface. https://www.etsi.org/technologies-clusters/technologies/ori. [Online; accessed 05-March-2016].
[For] IEEE 1904.3 Task Force. Radio over ethernet. http://www.ieee1904.org/3/meeting_archive/2015/02/tf3_mtg_files.shtml. [Online; accessed 05-March-2016].
[GCT+15] Nathan J. Gomes, Philippe Chanclou, Peter Turnbull, Anthony Magee, andVolker Jungnickel. Fronthaul evolution: From {CPRI} to ethernet. Optical FiberTechnology, 26, Part A:50 – 58, 2015. Next Generation Access Networks.
[GKB+06] C.M. Gauger, P.J. Kuhn, E.V. Breusegem, M. Pickavet, and P. Demeester.Hybrid optical network architectures: bringing packets and circuits together.Communications Magazine, IEEE, 44(8):36–42, Aug 2006.
[Gro] TSN Group. Time-sensitive networking for fronthaul:ieee802.1cm. http://www.ieee802.org/1/pages/802.1cm.html. [Online; accessed 12-February-2016].
[HDCCL14] Jinri Huang, Ran Duan, Chunfeng Cui, and I. Chih-Lin. Overview of cloud ran.In General Assembly and Scientific Symposium (URSI GASS), 2014 XXXIthURSI, pages 1–4, Aug 2014.
[HDDM13] M. Hadzialic, B. Dosenovic, M. Dzaferagic, and J. Musovic. Cloud-ran: Innovativeradio access network architecture. In ELMAR, 2013 55th International Symposium,pages 115–120, Sept 2013.
REFERENCES 85
[HJS] S M Shin H J Son. Fronthaul size: calculation of maximum distance betweenrrh and bbu. http://www.netmanias.com/en/?m=view&id=blog&lm=simple&page=4&no=6276. [Online; accessed 01-March-2016].
[IEA] Mobile Networks Irvine (Ericson AB). Transport impacts. http://www.ieee802.org/1/files/public/docs2014/new-irvine-mobile-networks-fronthaul-0914.pdf.[Online; accessed 05-March-2016].
[Ins11] China Mobile Research Institute. C-ran: The road towards green ran. Whitepaper, pages 1–48, October 2011. [Online; accessed 08-February-2016].
[Int16] Common Public Radio Interface(CPRI). Interface specification. http://www.cpri.info/, 2016. [Online; accessed 27-January-2016].
[IS] IEEE-SA. 1588-2002 - ieee standard for a precision clock synchronization protocolfor networked measurement and control systems. https://standards.ieee.org/findstds/standard/1588-2002.html. [Online; accessed 17-May-2016].
[KOS09] A. Kimsas, H. Overby, and N. Stol. Analysis of a bufferless opmigua node. InTelecommunications, 2009. AICT ’09. Fifth Advanced International Conferenceon, pages 381–388, May 2009.
[Ler14] Frédéric Leroudier. Fronthaul: Small cells’ new best friend. http://www.ospmag.com/issue/article/Fronthaul-Small-Cells-New-Best-Friend-Part-2, April 2014.[Online; accessed 29-February-2016].
[LKB09] Christian Lanzani, Georgios Kardaras, and Deepak Boppana. Remote radio headsand the evolution towards 4g networks, 2009.
[LPHL14] Bin Lin, Xiaoying Pan, Rongxi He, and Sen Li. Joint wireless-optical infras-tructure deployment and layout planning for cloud-radio access networks. InWireless Communications and Mobile Computing Conference (IWCMC), 2014International, pages 1027–1032, Aug 2014.
[MS12] P. McClusky and J.L. Schroeder. Fiber-to-the-antenna: Benefits and protectionrequirements. In Telecommunications Energy Conference (INTELEC), 2012IEEE 34th International, pages 1–6, Sept 2012.
[Msh12] T. Mshvidobadze. Evolution mobile wireless communication and lte networks. InApplication of Information and Communication Technologies (AICT), 2012 6thInternational Conference on, pages 1–7, Oct 2012.
[NMW+12] S. Namba, T. Matsunaka, T. Warabino, S. Kaneko, and Y. Kishi. Colony-ranarchitecture for future cellular network. In Future Network Mobile Summit(FutureNetw), 2012, pages 1–8, July 2012.
[OBS16] OBSAI. Open base station architecture. http://www.obsai.com/, 2016. [Online;accessed 27-January-2016].
86 REFERENCES
[OJDN70] Bjørn Myhrhaug Ole-Johan Dahl and Kristen Nygaard. Common base language,norwegian computing center. http://www.edelweb.fr/Simula/#7, 1970. [Online;accessed 28-May-2016].
[OSHT01] M. J. O’Mahony, D. Simeonidou, D. K. Hunter, and A. Tzanakaki. The ap-plication of optical packet switching in future communication networks. IEEECommunications Magazine, 39(3):128–135, Mar 2001.
[PCDS14] A. Pizzinat, P. Chanclou, T. Diallo, and F. Saliou. Things you should know aboutfronthaul. In Optical Communication (ECOC), 2014 European Conference on,pages 1–3, Sept 2014.
[PLJ+14] Mugen Peng, Yuan Li, Jiamo Jiang, Jian Li, and Chonggang Wang. Heterogeneouscloud radio access networks: a new perspective for enhancing spectral and energyefficiencies. Wireless Communications, IEEE, 21(6):126–135, December 2014.
[PMC15] PMC. Enabling c-ran: The case for otn mobile fronthaul, 2015. [Online; accessed05-March-2016].
[PWLP15] Mugen Peng, Chonggang Wang, V. Lau, and H.V. Poor. Fronthaul-constrainedcloud radio access networks: insights and challenges. Wireless Communications,IEEE, 22(2):152–160, April 2015.
[QY99] Chunming Qiao and Myungsik Yoo. Optical burst switching (obs) - a newparadigm for an optical internet. J. High Speed Netw., 8(1):69–84, March 1999.
[SGR+11] S. Smolorz, E. Gottwald, H. Rohde, D. Smith, and A. Poustie. Demonstration of acoherent udwdm-pon with real-time processing. In Optical Fiber CommunicationConference and Exposition (OFC/NFOEC), 2011 and the National Fiber OpticEngineers Conference, pages 1–3, March 2011.
[SRV08] R. Sanchez, L. Raptis, and K. Vaxevanakis. Ethernet as a carrier grade technology:developments and innovations. Communications Magazine, IEEE, 46(9):88–94,September 2008.
[SSR11] N. Stol, M. Savi, and C. Raffaelli. 3-level integrated hybrid optical network (3lihon)to meet future qos requirements. In Global Telecommunications Conference(GLOBECOM 2011), 2011 IEEE, pages 1–6, Dec 2011.
[STK+15] N. Shibata, T. Tashiro, S. Kuwano, N. Yuki, Y. Fukada, J. Terada, and A. Otaka.Performance evaluation of mobile front-haul employing ethernet- based tdm-ponwith iq data compression [invited]. IEEE/OSA Journal of Optical Communicationsand Networking, 7(11):B16–B22, November 2015.
[TMC14] TMCnet. Mobile fronthaul for cloud-ran deployment. http://www.tmcnet.com/tmc/whitepapers/documents/whitepapers/2014/10051-mobile-fronthaul-cloud-ran-deployment.pdf, April 2014. [Online;accessed 14-February-2016].
REFERENCES 87
[Tra12] TransPacket. Fusion networking explained: Bringing true circuit and packetproperties to the packet network. http://www.transpacket.com/wp-content/uploads/2012/06/White_paper_fusion_intro_12062012.pdf, July 2012. [Online;accessed 08-February-2016].
[Tra13] TransPacket. a fusion networking add-drop muxponder. http://www.transpacket.com/wp-content/uploads/2011/12/TransPacket-H1-Product-overview-v1.pdf,April 2013. [Online; accessed 08-February-2016].
[TZJ11] O. Tipmongkolsilp, S. Zaghloul, and A. Jukan. The evolution of cellular backhaultechnologies: Current issues and future trends. Communications Surveys Tutorials,IEEE, 13(1):97–113, First 2011.
[VBB13] R. Veisllari, S. Bjornstad, and K. Bozorgebrahimi. Integrated packet/circuithybrid network field trial with production traffic [invited]. IEEE/OSA Journalof Optical Communications and Networking, 5(10):A257–A266, Oct 2013.
[VBB+15] R. Veisllari, S. Bjornstad, J. P. Braute, K. Bozorgebrahimi, and C. Raffaelli.Field-trial demonstration of cost efficient sub-wavelength service through inte-grated packet/circuit hybrid network[invited]. IEEE/OSA Journal of OpticalCommunications and Networking, 7(3):A379–A387, March 2015.
[WAS15] T. Wan and P. Ashwood-Smith. A performance study of cpri over ethernet withieee 802.1qbu and 802.1qbv enhancements. In 2015 IEEE Global CommunicationsConference (GLOBECOM), pages 1–6, Dec 2015.
[WZZ14] Kaiwei Wang, Ming Zhao, and Wuyang Zhou. Traffic-aware graph-based dy-namic frequency reuse for heterogeneous cloud-ran. In Global CommunicationsConference (GLOBECOM), 2014 IEEE, pages 2308–2313, Dec 2014.
[ZBJ08] S. Zaghloul, W. Bziuk, and A. Jukan. A scalable billing architecture for futurewireless mesh backhauls. In Communications, 2008. ICC ’08. IEEE InternationalConference on, pages 2974–2978, May 2008.


AppendixAIHON Node and Ethernet SwitchImplementation
A.1 IHON Node Implementation
The simulation model for IHON node consists of two different kind of generatorentities in order to simulate the arrival of GST and SM traffic. These entities arecalled GST_Generator and SMGenerator. Moreover, the simulation model consistsof three additional entities: GSTPacket, SMPacket, and SM_packet_scheduler, andthree queues: SM_Waiting, SM_pkt_check, and GST_pkt_check.
All entities are modeled based on the entity-entity synchronization with waitq’s.The waitq’s queues doesn’t introduce any delay to the node, but it is used forsynchronizing purpose.
A.1.1 GST_Generator Entity
The "GST_Generator" entity generates "GSTPacket" entities in a loop with meanarrivals per second defined by the poisson "GST_pkt_". Since GST packets have theabsolute priority, they are not interrupted by SM packets. As soon as a GST packetis generated, it is scheduled immediately, and the output wavelength is acquired untilthe packet is completely transmitted.
Packets generated per simulation time from this source are fixed using a FOR-loop.
A.1.2 SMGenerator
The "SMGenerator" entity generates "SMPacket" entities in a loop with mean arrivalsper second defined by the poisson "SM_pkt_". This entity check a queue called"SM_pkt_check" for the number of SM objects before scheduling a new SM packet.If the number of SM packet object exceeds 0, the SM packets from SM_pkt_checkqueues are scheduled before scheduling a new SM packet.
89
90 A. IHON NODE AND ETHERNET SWITCH IMPLEMENTATION
The number of packets generated by this type of source is fixed per simulationtime. It operates in looped-manner with For-loop to generate fixed number of SMpackets.
A.1.3 GSTPacket Entity
Every time a GST packet is generated and scheduled, the corresponding outputwavelength is marked as busy(acquired) and fixed delay line as not empty to guaranteethat it is being used to carry a GST packet. Hence, the GST source is directlylinked to the output wavelength. Inside this entity, a bin called "Fixed_delay_line"is used to check if there is already a GST packet inline to find out when to changethe pointer of the current GST packet. When the last bit of the GST packet arrivesat FDL, it will be delayed for an FDL time. Until the last bit of the GST packet hasleft the start of the FDL, it is busy and release it for further use. After holding forthe FDL length(in time), the GST packet take the resource and hold it for servicetime of GST, then release both the fixed delay line and output wavelength.
When GST packets arrives at the output link, the arrival, service and exit timeof this packet is registered. And, after traversing the FDL, the arrival, service andexit times are reset again for another new packet. The booking for each GST packetssuch as average latency, PDV, the minimum and maximum latency is collected insidethis entity.
A.1.4 SMPacket Entity
SMPacket entity has one parameter called "input" to itself. This parameter definesthe number of SM input stream to the IHON node, and each input channel has adedicated queue on the output wavelength. When a SM packet is generated from itsrespective source, the queue associated to this source is checked whether it exceededthe maximum buffer size or not. SM packets scheduled at the SM generator arestored in their respective buffer index upon their arrival if the buffer size at the indexis less than the maximum buffer size. SM packet arrived when the buffer is full aremarked as dropped. In side this entity, latency and packet delay variation of the SMtraffic statistics are measured and collected. Moreover, the dropped SM traffic aremeasured for calculating the PLR.
A.1.5 SM_packet_scheduler Entity
The SM_packet_scheduler entity takes SM packets from the "SM_Waiting" queues.At the beginning, the buffer length of each input SM packets are checked. When abuffer with SM packets are found, the packets are taken with service time equivalentto service time of their length.
A.2. ETHERNET SWITCH IMPLEMENTATION 91
Inside this entity, the status of output wavelength and FDL is checked. If boththe output wavelength and FDL are free, the SM packet taken from any of the bufferis served freely. However, if the delay line is not available, and there is an availablegap, the length of the gap is computed according to the round robin filling gapdiscussed in Chapter 4 of Section 4.3.4.
If the computed gap is less than the minimum length of SM packet, hold thisentity for the gap and recheck after GST has been scheduled.
A.1.6 SM_Waiting bin
This bin is used to inform "SM_packet_scheduler" entity that there is a packet in"SMPacket" entity for serving if it is arrived.
A.1.7 SM_pkt_check and GST_pkt_check queues
The use of these two queues avoids the excessive number of unprocessed SM packetand GST packet objects so that the processing time of the simula programming isgreatly reduced.
A.2 Ethernet Switch Implementation
Like IHON node, the simulation model for Ethernet switch consists of two differentkind of generator entities in order to simulate the arrival of HP and LP packets. Theseentities are called HP_Generator and LPGenerator. Moreover, the simulation modelconsists of four additional entities: HPPacket, LPPacket, HP_packet_scheduler, andLP_packet_scheduler and four queues: LP_Waiting, HP_Waiting, HP_pkt_check,and LP_pkt_check.
A.2.1 HP_Generator Entity
A single "HP_Generator" entity generates "HPPacket" in a loop with mean arrivalsper second defined by the poisson "HP_pkt_". The packet length distribution ispresented in Section 5.2.1.
A.2.2 LP_Generator Entity
The "LPGenerator" entity generates "LPPacket" entities in a loop with mean arrivalsper second defined by the poisson "LP_pkt_". The distribution that governs thearrival of the next packet is presented in Section 5.2.1. As soon as a LP packet isgenerated, it is scheduled immediately.

92 A. IHON NODE AND ETHERNET SWITCH IMPLEMENTATION
The number of packets generated by this entity is fixed per simulation time. Itoperates in looped-manner to generate fixed number of SM packets.
A.2.3 HPPacket Entity
This entity class works with the entity class "HP_packet_scheduler" to transmit theHP packets in the system. All HP packets generated by the "HP_Generator" entitygo to a buffer, called "Buffer_HP". After that, the packets are served one by one inFIFO basis. This entity always acquire the output wavelength if HP buffer is notempty.
A.2.4 LPPacket Entity
The "LPPacket" entity behaves close to the behaviour of "HPPacket" entity. It is oneof the entities that has entity-entity cooperation with "LP_packet_scheduler". Theentity waits for cooperation to to this scheduler and operates in a looped-manner.When LP packets are generated, they are queued in buffer upon their arrival if thebuffer size at the index is less than the maximum buffer size. LP packet arrived whenthe buffer is full are marked as dropped. It is important to note that LP packetswill never be served unless the HP buffer is empty. Once the HP buffer is empty.the system allows this entity to be served by the output wavelength. HP packetsarriving when the LP packets are being served will wait for the time equivalent tothe length of LP packet.
All the necessary computations such as the number of dropped packets, latency,and PDV of the LP traffic are done inside this entity.
A.2.5 HP_packet_scheduler Entity
The HP_packet_scheduler entity coops "HPPacket" entity from the "Buffer_HP"queues. Before serving the LP packets, the buffer length of HP packets is checked.When the buffer is not empty,then HP packets are served with time equivalent tothe service time of the HP packet length to be served by the output wavelength.
A.2.6 LP_packet_scheduler Entity
The behaviour of this entity is almost exact to the behaviour of "HP_packet_scheduler"entity. This entity schedules the "LPPacket" entity only if the buffer of HP pack-ets is empty; this is the only difference between the "HP_packet_scheduler" and"LP_packet_scheduler " entity. When the HP buffer is empty and LP buffer is not,then packets from the LP buffer are served by the output wavelength for a timeequivalent to the service time of the LP packet.

A.3. IHON AND ETHERNET SOURCE CODES 93
However, if a LP packet is generated when the buffer is full and the outputwavelength is occupied, the LP packet will be dropped. HP packets will not bedropped because they are given highest priority.
A.2.7 HP_Waiting Bin
"HP_Waiting" object is introduced to synchronize and inform all the system class’sthat the "Buffer_HP" is empty or the output wavelength is busy. This specificbin object is used to realize the cooperation between "HP_packet_scheduler" and"HPPacket" entity.
A.2.8 LP_Waiting Bin
Like "HP_Waiting", "LP_Waiting" object is introduced to synchronized and informall the system class’s the status of the "Buffer_LP" or output wavelength. And, itrealizes realizes the cooperation between "LP_packet_scheduler" and "LPPacket"entity.
A.3 IHON and Ethernet Source Codes
Both IHON and Ethernet source codes are provided in the attached Zip file.
A.4 Input File and Output File
All input parameters required for the simulator are inserted through an input file,which allows us to run the simulation code by simply changing only the necessaryinformation. Thus, it possible to perform different simulations without changing thebody of simulation code. For instance, the input file for IHON code contains thefollowing parametrs:
• Capacity of the wavelength;
• Length of the GST packet;
• The number of SM buffers in a single node;
• The minimum and maximum length of SM packets.
A typical example of an input file is found in the appendix Chapter C, Section C.1and Section C.2.
After the required processing in the IHON node, ten output files are generated tokeep track easily of the results:

94 A. IHON NODE AND ETHERNET SWITCH IMPLEMENTATION
• Input.txt, which has all the parameters required for this simulation, such ascapacity, minimum SM packet length and so on.
• Average_latency_GST_plot.txt, which has GST latency results of the simulatorof different GST loads.
• PDV_GST_plot.txt, which has GST PDV results of the simulator for differentGST loads.
• ConfInte95_latency_gst.txt, which has the 95% confidence interval of GSTlatency results of the simulator for different GST loads.
• ConfInte95_PDV_gst.txt, which has the 95% confidence interval of GST PDVresults of the simulator for different GST loads.
• Average_latency_SM_plot.txt, which has SM latency results of the simulatorof different GST loads.
• PDV_SM_plot.txt, which has SM PDV results of the simulator for differentGST loads.
• ConfInte95_latency_sm.txt, which has the 95% confidence interval of SMlatency results of the simulator for different GST loads.
• ConfInte95_PDV_sm.txt, which has the 95% confidence interval of SM PDVresults of the simulator for different GST loads.
• ConfInte95_PLR_sm.txt, which has the 95% confidence interval of SM PLRresults of the simulator for different GST loads.
• PLR_SM_plot.txt, which has SM PLR results of the simulator of differentGST loads.
At the end of the simulation, all the above output files are generated to presentresults of the implemented algorithm.
Similarly, the Ethernet code generates ten output files for the sake of analysis:
• Input_Ethernet.txt, which has all the parameters required for this simulation,such as buffer size, capacity, minimum LP packet length and so on.
• Average_latency_HP_plot.txt, which has HP latency results of the simulatorof different HP loads.
• PDV_HP_plot.txt, which has HP PDV results of the simulator for differentHP loads.
• ConfInte95_latency_HP.txt, which has the 95% confidence interval of HPlatency results of the simulator for different HP loads.

A.5. SIMULATOR VALIDATION 95
• ConfInte95_PDV_HP.txt, which has the 95% confidence interval of HP PDVresults of the simulator for different HP loads.
• Average_latency_LP_plot.txt, which has LP latency results of the simulatorof different HP loads.
• PDV_LP_plot.txt, which has LP PDV results of the simulator for differentHP loads.
• ConfInte95_latency_LP.txt, which has the 95% confidence interval of LPlatency results of the simulator for different HP loads.
• ConfInte95_PDV_LP.txt, which has the 95% confidence interval of LP PDVresults of the simulator for different HP loads.
• ConfInte95_PLR_LP.txt, which has the 95% confidence interval of LP PLRresults of the simulator for different HP loads.
• PLR_LP_plot.txt, which has LP PLR results of the simulator of different HPloads.
A.5 Simulator Validation
The developed simulator is validated using two different approaches. The firstapproach is to trace the output of simulation for each event with the use of built-inDEMOS library function called trace. In this way, the report generated by Demosafter the simulation testing ensures that the entities in the simulator behaves asintended at the right instance of time and/or in response to the events they aremeant to. By doing so, the simulator is found to be working as intended.
The other approach used for validating the simulator is to compare the results ofthe simulator with the fronthaul requirement and ITU-T recommendation.


97

98 B. QOS TARGETS FOR REFERENCE SERVICE CLASSES
AppendixBQoS Targets for Reference ServiceClasses
Table B.1: Requirements of demanding services and applications based on ITU-Trecommendation Y.1541 [SSR11]
ServiceClasses
Y.1541QoSClass
UpperboundPLR
UpperboundDelay
Upper boundjitter
Band-widthneeded
i. Videostream-ing
6 or 7 10−5 100ms or400ms
50ms High
ii.VideoConver-sational
0 or 1 10−3 100ms or400ms
50ms High
iii.Musicstream-ing
6 or 7 10−5 100ms or400ms
50ms Low tomedium
iv.Voiceconver-sational
0 or 1 10−3 100ms or400ms
50ms Low
v. In-terativemessag-ing
3 (or2) 10−3 400ms or100ms
undef. Low
vi. Con-trol traf-fic
2 10−3 100ms undef. Low
vii.Generaldatatransfer
4 or 5 10−3orundef.1s or undef. undef. Low toHigh

AppendixCExample of Input File
Note that since our simulation code uses a lot of wait queues, the simulation is slowerand cim -m<tall> filename must be used to compile with increased memory. Forexample: cim -m100 IHON.sim will allow the simulator to use 100 Mbytes of memory.
Sample of an input file for the simulator of both IHON and Ethernet are givenin Section C.1 and in Section C.2.
C.1 Input File for IHON Code: Input_IHON.txt
Seeds907 234 326 104 711 523 883 113 417 656capacity(in Gb/sec):10minlength(minmum length)(in Byte):40lengthGST(in Byte):1200maxlength(maximum length)(in Byte):1500load_GST0.607load_SM0.3Number_packet_Generated40000Number_of_SM_buffer4maxNobuffer4
99
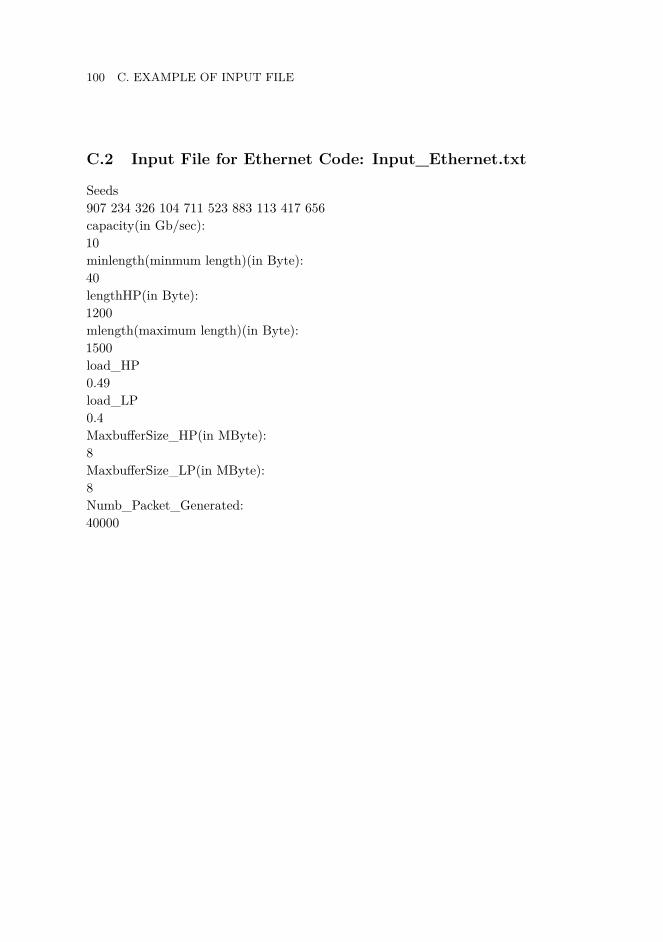
100 C. EXAMPLE OF INPUT FILE
C.2 Input File for Ethernet Code: Input_Ethernet.txt
Seeds907 234 326 104 711 523 883 113 417 656capacity(in Gb/sec):10minlength(minmum length)(in Byte):40lengthHP(in Byte):1200mlength(maximum length)(in Byte):1500load_HP0.49load_LP0.4MaxbufferSize_HP(in MByte):8MaxbufferSize_LP(in MByte):8Numb_Packet_Generated:40000

AppendixDConfidence Interval Calculation Inthe Simulator
All the results in Chapter 6 are presented with 95% confidence interval accuracylevel. The confidence interval of all parameter discussed in this work is calculatedbased on the formula given in [EHHP14].
Let Θ be unbaised and consistent estimator of a parameter ξ, i.e. E(Θ) = ξ andVar(Θ(n))→ 0 when n→∞. Let X1,X2,X3,. . . ,Xn be n independent and identicallydistributed observations, and E(Xi) = ξ and var(Xi)= δ2, i = 1,2,. . . ,n.
Time Average
X̄ = 1T
∫ T
0x(t)dt (D.1)
Sample mean
X̂ = 1n
n∑i=1
Xi (D.2)
Sample variance
S2 = 1n− 1
n∑i=1
(Xi − X̂)2 = 1n− 1
n∑i=1
X2i −
n
n− 1X̂2 (D.3)
Variance of the sample mean
S2X̂
= S2
n(D.4)
Standard error of the sample mean
SX̂
= S√n
(D.5)
101

102 D. CONFIDENCE INTERVAL CALCULATION IN THE SIMULATOR
1 - α confidence interval for X̂ (with unknown variance)
(X̂ − tα/2,n−1S√n, X̂ + tα/2,n−1
S√n
) (D.6)
(tα/2,n−1 is the α quantile of the Student’s t-distribution with n-1 degrees offreedom).
Related Documents