
2 Agenda I. Introduction to the Global Solar Market II. Solar in India III. Proposed Solutions IV. Policy and Costs V. Appendix.
Dec 16, 2015
Welcome message from author
This document is posted to help you gain knowledge. Please leave a comment to let me know what you think about it! Share it to your friends and learn new things together.
Transcript

2
Agenda
I. Introduction to the Global Solar Market
II. Solar in India
III. Proposed Solutions
IV. Policy and Costs
V. Appendix

3
Introduction to the Solar Market

4
Global Electricity Demand
$9 Trillion in investments expected globally in the power sector from 2005-2030, led by Asia at $4T, US/South America at $1.5T, Africa at $0.5T
5
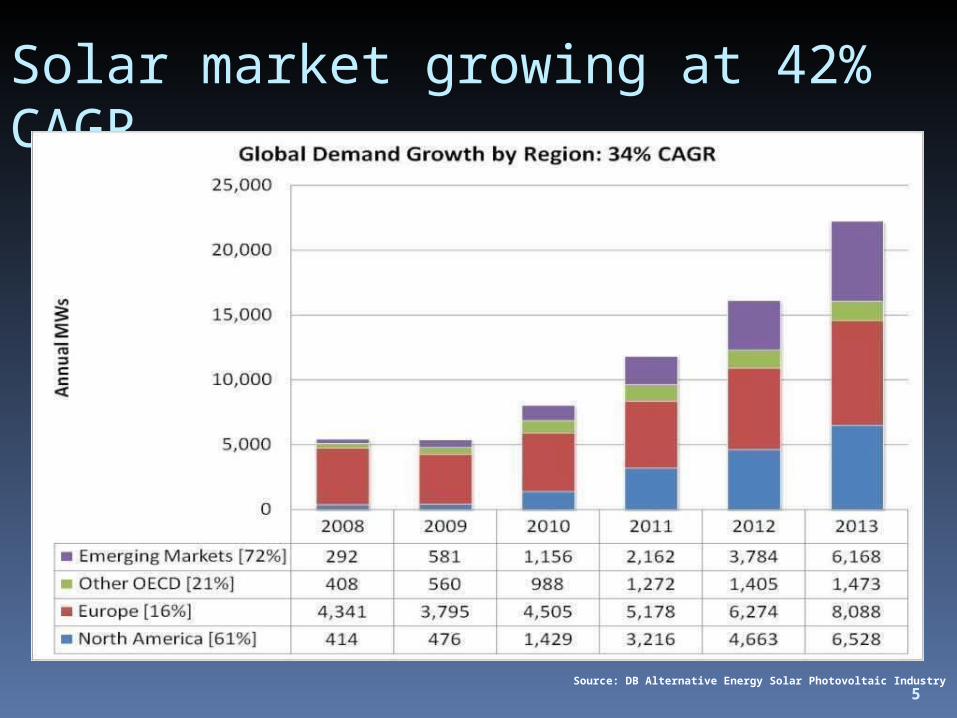
Solar market growing at 42% CAGR
Source: DB Alternative Energy Solar Photovoltaic Industry

6
What is the addressable market?In 2010, $100 billion (approximately 5%) of global retail electricity demand
could be competitively addressed with solar power…
~600 GWs ($2 Trillion of Solar)
1
10
100
1000
10000
100000
1000000
2 3 4 5 6 7 8 9 10 11 12 13 14 15 16 17 18 19 20 21 22 23 24 25 26
>27
MW
h
US Cents per kWh
# of MWh sold at each price point
201020152020
Area of solar competitiveness
Electricity Price Rising
7
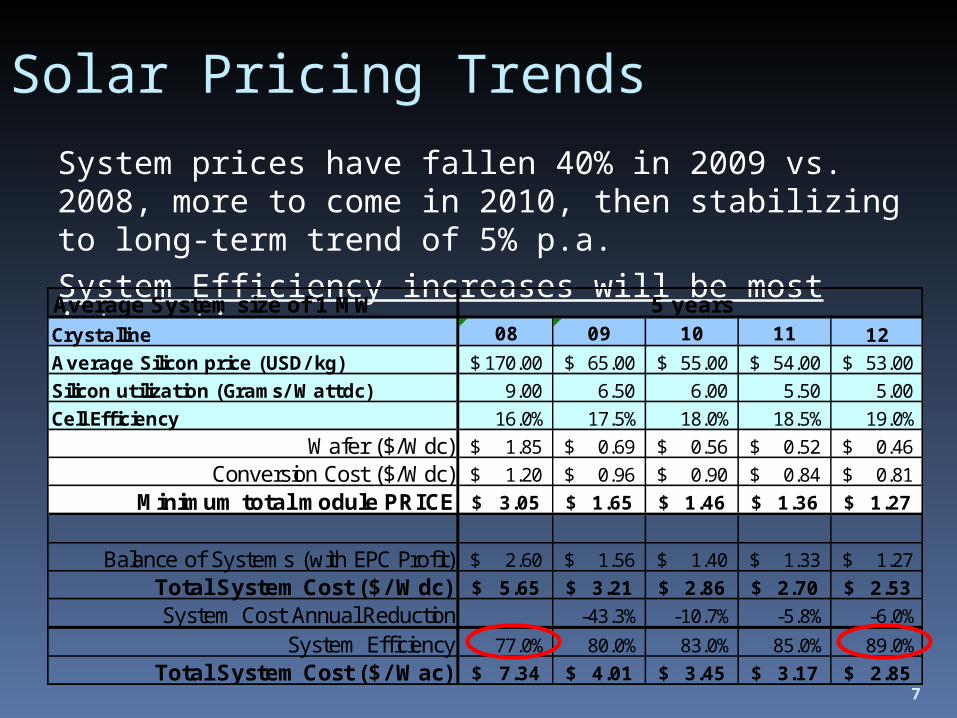
Solar Pricing Trends
System prices have fallen 40% in 2009 vs. 2008, more to come in 2010, then stabilizing to long-term trend of 5% p.a.
System Efficiency increases will be most interesting
Average System size of 1 MWCrystalline 08 09 10 11 12
Average Silicon price (USD/ kg) 170.00$ 65.00$ 55.00$ 54.00$ 53.00$
Silicon utilization (Grams/ Wattdc) 9.00 6.50 6.00 5.50 5.00
Cell Efficiency 16.0% 17.5% 18.0% 18.5% 19.0%Wafer ($/Wdc) 1.85$ 0.69$ 0.56$ 0.52$ 0.46$
Conversion Cost ($/Wdc) 1.20$ 0.96$ 0.90$ 0.84$ 0.81$ Minimum total module PRICE 3.05$ 1.65$ 1.46$ 1.36$ 1.27$
Balance of Systems (with EPC Profit) 2.60$ 1.56$ 1.40$ 1.33$ 1.27$ Total System Cost ($/ Wdc) 5.65$ 3.21$ 2.86$ 2.70$ 2.53$ System Cost Annual Reduction -43.3% -10.7% -5.8% -6.0%
System Efficiency 77.0% 80.0% 83.0% 85.0% 89.0%Total System Cost ($/ Wac) 7.34$ 4.01$ 3.45$ 3.17$ 2.85$
5 years
8
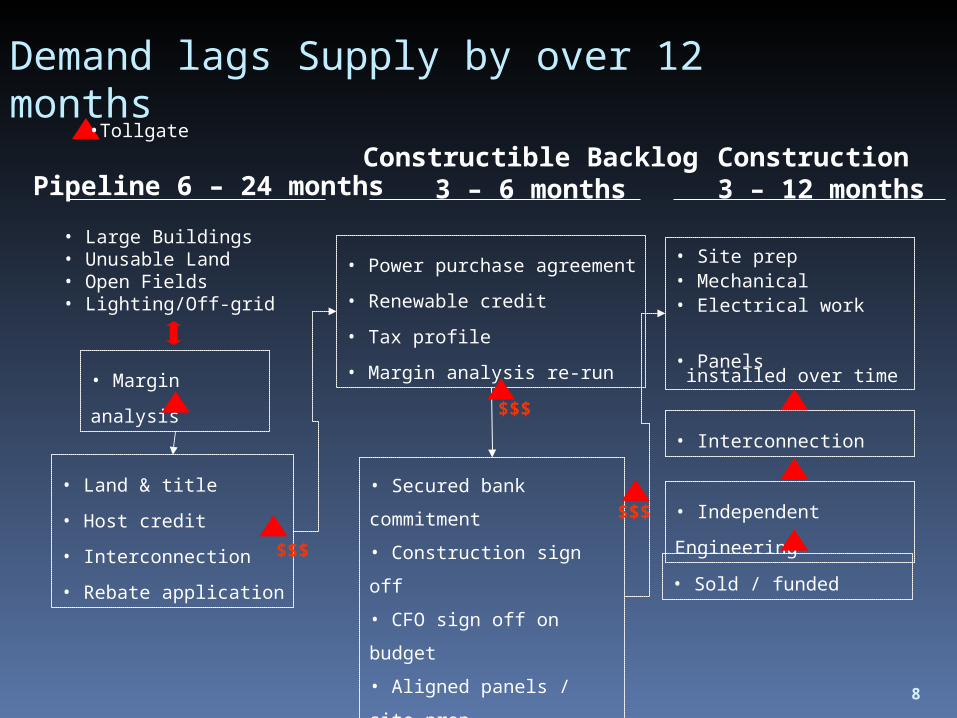
Demand lags Supply by over 12 months
Pipeline 6 – 24 monthsConstructible Backlog
3 – 6 monthsConstruction 3 – 12 months
• Land & title
• Host credit
• Interconnection
• Rebate application
• Large Buildings• Unusable Land• Open Fields• Lighting/Off-grid
• Power purchase agreement
• Renewable credit
• Tax profile
• Margin analysis re-run
• Secured bank commitment
• Construction sign off
• CFO sign off on budget
• Aligned panels / site prep
• Margin analysis
• Site prep• Mechanical• Electrical work
• Panels installed over time
• Interconnection
• Independent Engineering
• Sold / funded
•Tollgate
$$$
$$$
$$$
9
Solar in India
10
Global Solar Resource
Source: Global Green USA
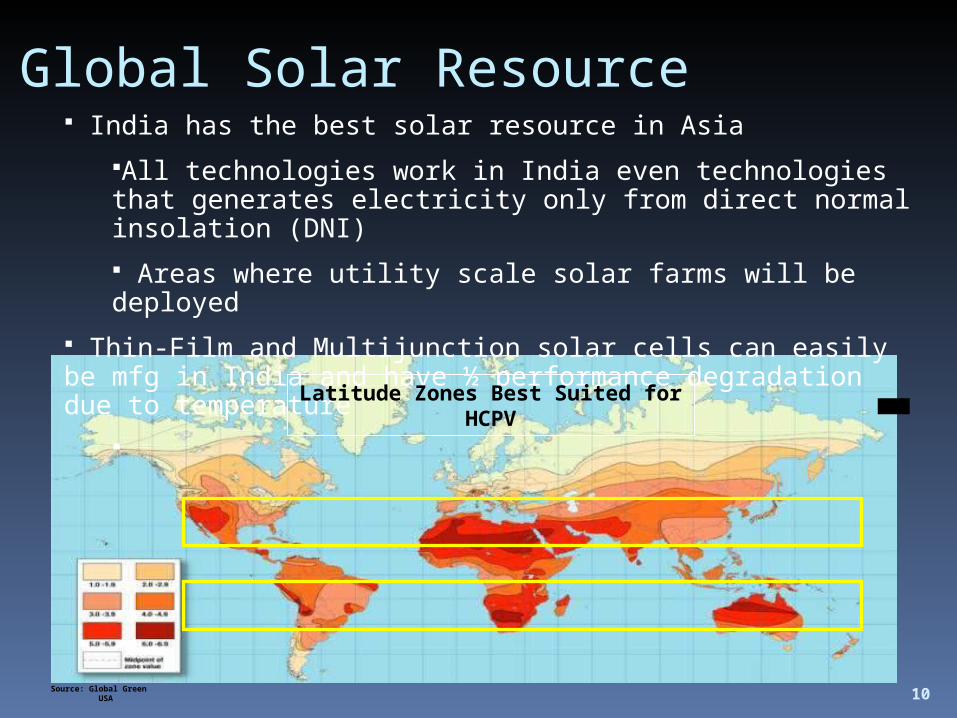
India has the best solar resource in Asia
All technologies work in India even technologies that generates electricity only from direct normal insolation (DNI)
Areas where utility scale solar farms will be deployed
Thin-Film and Multijunction solar cells can easily be mfg in India and have ½ performance degradation due to temperature
Latitude Zones Best Suited for HCPV

CPV is a technology well suited for India
Industry Leading LCOEIndustry Leading LCOE
Low Cost Reliability
Small Footprint
Built-in Tracking
Most cost-effective through highest performance PV
technology available
Design hardened through 15 years of
real-world utility experience
>40% higher energy generation than fixed flat plate PV systems
4- 6 acres/MW of installed capacity
Low Environmental
ImpactWater is not required to operate HCPV, pedestal
mount requires little excavation
Solid Path to Bankability
Nearly 13 MW installed worldwide in the utility scale
installations
Extended system life through field
replaceable/upgradeable solar cell
Reduced Risk
Visible
Systems make highly visible
statement of clean energy production
Complete 53kWComplete 53kW(AC) (AC) Solar GeneratorSolar Generator
Easily Replicable and Scalable Easily Replicable and Scalable
One to Hundreds of MegawattsOne to Hundreds of Megawatts
12
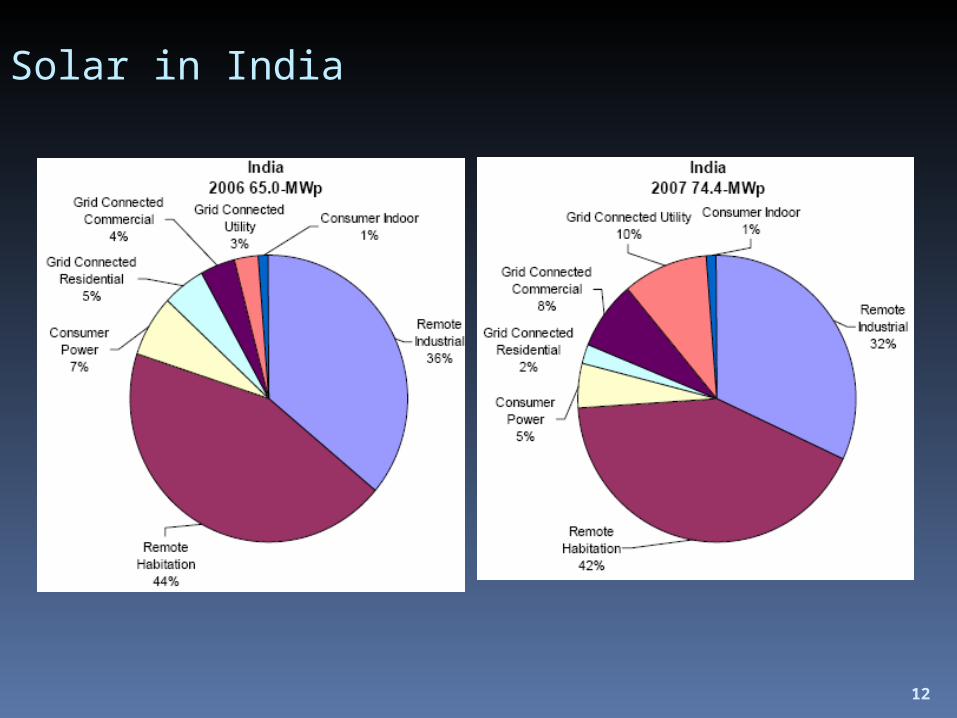
Solar in India
14
Defining Utility 2.0
• The main challenge is that Utilities do not know how to profit under the coming financial model “2.0”
• Energy Efficiency
• Self Generation
• Independent Power Producers

15
Utility 2.0
Control
Generation
LoadStorage
Storage• Energy Storage• Thermal Storage
(Ice Storage)
Load• Demand Reduction• Solar Load Controllers• Storage Based Load• Load Shifting (Ice Energy)
Control• DG Operations Center• 24 Hour irradiance • Forecasting• SCADA• Monitor, Analyze, Report & Control• Tariff Optimization
Generation• Point of Load DG • Substation Level DG

18
Module and system price trends
Global financial crisis is accelerating the price reductions above
- Liquidity is available from multilateral organizations
- India has created solar projects over the last 18 months and is ready for deployment
» Distributed Generation is fast but still takes 12 months
» Central Station plants take 2 years from signing to construction Prices are collapsing – question is brand, liquidity, warehousing
19
Proposed Solutions

20
India Solar Programs
India has been a leader in Solar Energy for over 20 years Rural Electrification Program
Solar Home Systems Water Pumping
Public Facility Solar Projects Government should lead with its buildings and
land PV in Communications, Weather, Long-Distance
Pipelines, Railways and Highways Large-scale PV & Solar Thermal Power Stations
50 MW MNRE program with other State programs

21
Suggested Grid Connected Solar program New Goal: 20,000 MW program by 2020, starting
with 100 MW in 2010 Grow at 50% annually to meet ~2% of India’s
needs by 2020 Allow for 80% depreciation on all systems Encourage State Electricity Boards to provide the
full tariff without incremental support from MNRE Encourage construction of integrated solar
manufacturing Creates 1,000,000 direct job-years of
employment Target is that solar should reach ~2% of grid by
2020 India becomes the most important World Market
by 2012
22
Policy and Costs
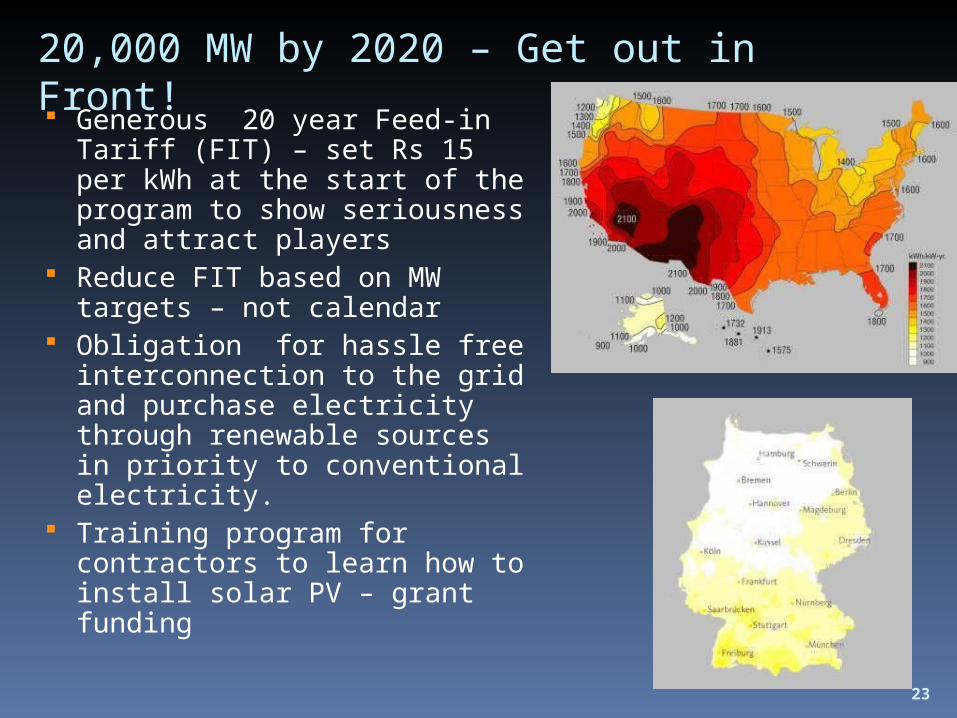
20,000 MW by 2020 – Get out in Front! Generous 20 year Feed-in
Tariff (FIT) – set Rs 15 per kWh at the start of the program to show seriousness and attract players
Reduce FIT based on MW targets – not calendar
Obligation for hassle free interconnection to the grid and purchase electricity through renewable sources in priority to conventional electricity.
Training program for contractors to learn how to install solar PV – grant funding
23

24
Suggested Policy Changes
Incentives A 20,000 MW program across India,
example: Tier MW (% of
grid)Total FIT Price – Utility
plus Central (20-25 yr)
% of Grid
Jobs Years
1600 $ 0.30/kWh 0.1%
18,000
2800 $ 0.25/kWh 0.2%
24,000
31,200 $ 0.23/kWh 0.3%
36,000
41,500 $ 0.21/kWh 0.5%
45,000
51,900 $ 0.19/kWh 0.6%
57,000
62,300 $ 0.17/kWh 0.8%
69,000
73,000 $ 0.15/kWh 1.0%
90,000
84,000 $ 0.14/kWh 1.3%
120,000
94,700 $ 0.13/kWh 1.6%
141,000
Total 20,000MW $0.30/kWh 1.6% ~600,000

25

26
Suggested Policy Changes
Utility Rates and Revenue Policies Charge customers real cost of electricity – peak and off-
peak Subsidize rates for the poor: tiered rate structure, lowest
price for the first 150 kWh used per month, higher after that to encourage middle-class and wealthy people to conserve
Interconnection Allow consumers to interconnect without interference,
hassle Streamline process for projects up to 10% of distribution
feeder capacity Accept all internationally recognized standards with which
local manufacturers are already comfortable (UL, TUV, IEC)
27
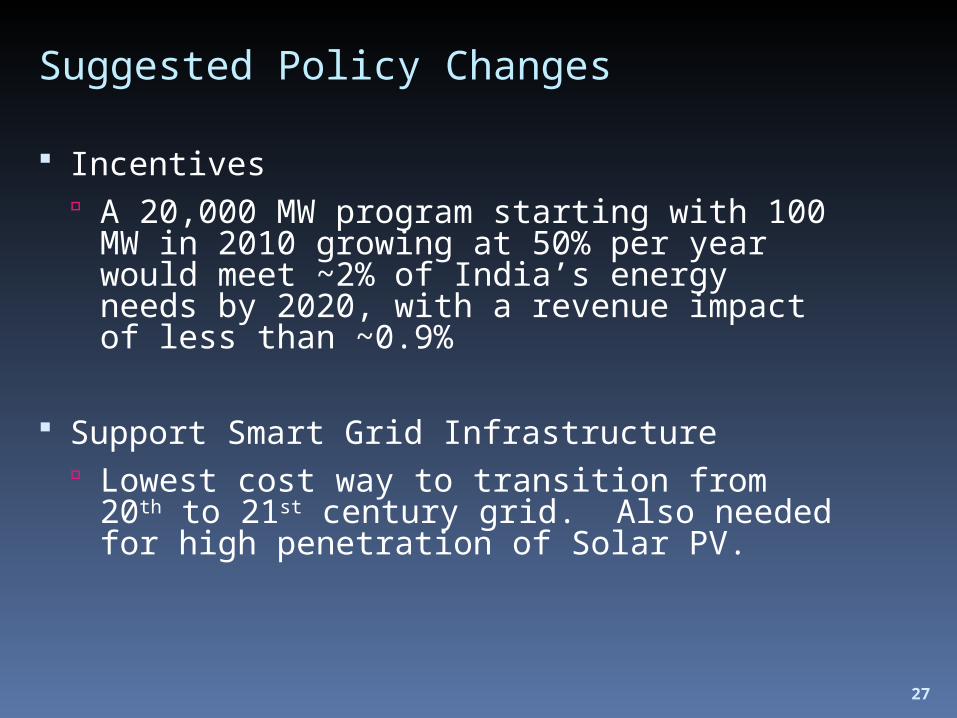
Suggested Policy Changes
Incentives A 20,000 MW program starting with
100 MW in 2010 growing at 50% per year would meet ~2% of India’s energy needs by 2020, with a revenue impact of less than ~0.9%
Support Smart Grid Infrastructure Lowest cost way to transition from 20th
to 21st century grid. Also needed for high penetration of Solar PV.

28
Utility 2.0
Control
Generation
LoadStorage
Storage• Energy Storage• Thermal Storage
(Ice Storage)
Load• Demand Reduction• Solar Load Controllers• Storage Based Load• Load Shifting (Ice Energy)
Control• PV Operations Center• 24 Hour irradiance • Forecasting• SCADA• Monitor, Analyze, Report & Control• Tariff Optimization
Generation• Point of Load PV • Substation Level PV
Related Documents


