2 Academic Achievement Ross E. Mitchell of Deaf Students The National Research Council (2001) identifies the practice of educational assess- ment as that which “seeks to determine how well students are learning and is an integral part of the quest for improved education. It provides feedback to stu- dents, educators, parents, policymakers, and the public about the effectiveness of educational services” (p. 1). Especially relevant to assessing the academic achieve- ment of deaf students, this perspective assumes that the scores attained on stan- dardized tests of academic achievement are valid and reliable indicators of what these students have learned; that the assessment results allow students as well as their families, teachers, and other interested parties to recognize their strengths and weaknesses; and that by identifying these strengths and weaknesses, families and schools have information that assists in designing and implementing pro- grams and services that may improve the academic performance of these deaf students. The latest reauthorizations of the two major federal education laws, namely, the No Child Left Behind Act of 2001 (hereafter NCLB) and the Individuals With Disabilities Education Improvement Act of 2004 (hereafter IDEA 2004), substan- tially incorporate the National Research Council’s views on assessment. 1 That is, in addition to mandating a regime for school-based accountability that depends on the results of student test performance, current federal law encourages high- quality assessment practices that would provide detailed information about stu- dent academic performance and would be valuable for planning instruction and educational programming. ACADEMIC ACHIEVEMENT RECORD Two recent national studies provide important updates on the performance of deaf students on standardized assessments of academic achievement. The Gal- laudet Research Institute established national norms for deaf and hard of hearing student performance on the Stanford Achievement Test Series, 10th edition (the National Deaf and Hard of Hearing Student Norms Project is described in Gal- laudet Research Institute, 2004; Mitchell, Qi, & Traxler, 2008, in press), the fifth such study undertaken by the Gallaudet Research Institute over the last four de- cades (see also, e.g., Allen, 1986; Holt, Traxler, & Allen, 1992, 1997; Office of 1. For example, NCLB §1001.1; NCLB §§1111.b.3.C.ii, iii, xii, xv; and IDEA 2004 §614.b.3.A. 38

Welcome message from author
This document is posted to help you gain knowledge. Please leave a comment to let me know what you think about it! Share it to your friends and learn new things together.
Transcript

2Academic Achievement Ross E. Mitchell
of Deaf Students
The National Research Council (2001) identifies the practice of educational assess-
ment as that which “seeks to determine how well students are learning and is an
integral part of the quest for improved education. It provides feedback to stu-
dents, educators, parents, policymakers, and the public about the effectiveness of
educational services” (p. 1). Especially relevant to assessing the academic achieve-
ment of deaf students, this perspective assumes that the scores attained on stan-
dardized tests of academic achievement are valid and reliable indicators of what
these students have learned; that the assessment results allow students as well as
their families, teachers, and other interested parties to recognize their strengths
and weaknesses; and that by identifying these strengths and weaknesses, families
and schools have information that assists in designing and implementing pro-
grams and services that may improve the academic performance of these deaf
students.
The latest reauthorizations of the two major federal education laws, namely, the
No Child Left Behind Act of 2001 (hereafter NCLB) and the Individuals With
Disabilities Education Improvement Act of 2004 (hereafter IDEA 2004), substan-
tially incorporate the National Research Council’s views on assessment.1 That is,
in addition to mandating a regime for school-based accountability that depends
on the results of student test performance, current federal law encourages high-
quality assessment practices that would provide detailed information about stu-
dent academic performance and would be valuable for planning instruction and
educational programming.
ACADEMIC ACHIEVEMENT RECORD
Two recent national studies provide important updates on the performance of
deaf students on standardized assessments of academic achievement. The Gal-
laudet Research Institute established national norms for deaf and hard of hearing
student performance on the Stanford Achievement Test Series, 10th edition (the
National Deaf and Hard of Hearing Student Norms Project is described in Gal-
laudet Research Institute, 2004; Mitchell, Qi, & Traxler, 2008, in press), the fifth
such study undertaken by the Gallaudet Research Institute over the last four de-
cades (see also, e.g., Allen, 1986; Holt, Traxler, & Allen, 1992, 1997; Office of
1. For example, NCLB §1001.1; NCLB §§1111.b.3.C.ii, iii, xii, xv; and IDEA 2004 §614.b.3.A.
3 8

Demographic Studies, 1969; Traxler, 2000). At about the same time, SRI Interna-
tional conducted a similar study of deaf students’ academic achievement as part
of a comprehensive evaluation of the Individuals With Disabilities Education Act
Amendments of 1997 (hereafter IDEA 1997) overseen by the Office of Special
Education Programs (OSEP) within the U.S. Department of Education (e.g., see
Blackorby et al., 2005; Wagner et al., 2003; Wagner, Newman, Cameto, & Levine,
2006; focusing solely on students with hearing impairment, see Blackorby & Kno-
key, 2006). These two studies are not identical in design, nor do they report
achievement results from the same assessment instrument, but they are comple-
mentary. Together, the results of these studies highlight serious concerns about
the academic achievement levels of deaf students.
Before presenting mathematics and reading achievement profiles for deaf stu-
dents from the Gallaudet Research Institute and OSEP studies, two critical design
differences need to be highlighted. First, the OSEP study did not specifically sam-
ple schools that enrolled students with hearing impairments (the applicable IDEA
classification) whereas the Gallaudet Research Institute study used for its sampling
frame a limited registry of schools and programs known to be serving deaf stu-
dents. The consequence of this difference is that the Gallaudet Research Institute
study is likely to overrepresent (a) deaf students with more severe hearing loss
and (b) deaf students who attend schools for the deaf and other special programs
that have relatively large numbers of deaf students (for a description of biases in
the Gallaudet Research Institute study sampling frame, see Mitchell, 2004). An-
other way to look at this difference is that the OSEP study is likely to have a
greater proportion of students who are hard of hearing compared with the Gal-
laudet Research Institute study. These prevalence differences between the two
studies in severity of hearing loss and instructional program setting placement
mean that achievement levels are expected to be higher for the OSEP study partic-
ipants than for those in the Gallaudet Research Institute study (for a discussion
of the relationship between achievement and deaf students’ characteristics, see
Karchmer & Mitchell, 2003).
Second, the OSEP study is longitudinal in its design whereas the Gallaudet Re-
search Institute study is cross-sectional. As a result, except for replacements re-
cruited because of attrition, the OSEP study is focused on a specific cohort of
students identified for special education in 2000 regardless of their current eligi-
bility for special education whereas the Gallaudet Research Institute study per-
tains to students tested in 2003, including students who were not identified until
after 2000, had not entered the country until after 2000, or possibly had not
become deaf until after 2000, but not including students who had exited special
education before 2003. Moreover, the data from the OSEP study analyzed here
are those collected during the second wave of data collection, which was closest
in time to the Gallaudet Research Institute data collection activity. Because of
study attrition and the difficulty of recruiting replacements, the achievement lev-
els measured in the OSEP study are likely to be higher because, on average, more
high-performing students remain in longitudinal studies. The cross-sectional Gal-
laudet Research Institute study is more likely to capture low-performing and mo-
Academic Achievement of Deaf Students 39

bile students. Despite these two important study design differences, certainly,
there is significant overlap between the two study populations and, possibly, even
identical participants. Nonetheless, there is no reason to expect the results of
these studies to be identical.
Another important difference to highlight before presenting data summaries
from the OSEP and Gallaudet Research Institute studies is that of the assessment
instruments. The OSEP study used the Woodcock-Johnson III, which provides
age-based norms. That is, the performance distribution is referenced to the age
of the child taking the test batteries, not the child’s grade in school. However, the
Gallaudet Research Institute study used the Stanford Achievement Test Series,
which provides grade-based norms. One has to assume an age-grade correlation
to work with grade-based norms. In other words, Grade 2 norms are used for 8-
year-olds, Grade 3 for 9-year-olds, Grade 4 for 10-year-olds, etc. With this very
strong correlation, age-grade-based norms can then be used to compare the two
groups of students on the two tests. The metric being used is the percentile rank
collapsed into quartiles (i.e., 1st quartile is 1st–25th percentile, 2nd quartile is
26th–50th percentile, 2nd quartile is 51st–75th percentile, and 4th quartile is
76th–99th percentile).
OSEP Study
Two named studies within OSEP’s IDEA 1997 evaluation measured academic
achievement among deaf students identified for special education: the Special
Education Elementary Longitudinal Study (SEELS) and the National Longitudinal
Transition Study-2 (NLTS-2). Independent analyses of data from SEELS are sum-
marized here. Data from the NLTS-2, which captures the high school age popula-
tion and follows it beyond graduation, are not analyzed here, but published re-
ports are summarized below. Analysis of data from the second wave of SEELS,
which were collected in 2002, is reported here because the data were collected up
to within a year preceding the Gallaudet Research Institute study and because the
students were at the right ages for comparison purposes (i.e., at least age 8 years,
specifically, ages 8 to 15 years).2 The distributions of mathematics and reading
achievement among these students with hearing impairment who were participat-
ing in SEELS in 2002 are summarized in Figure 2.1.
Each vertical bar in Figure 2.1 has four stacked segments, which represent the
proportion of students whose scores correspond to each of the four quartiles of
the general (hearing) population norms. If the score distribution of the deaf stu-
dent population (more precisely, population of students with hearing impairment)
were identical to the score distribution of the general population, then each of
the four stacked segments would be exactly the same size, breaking at 25%, 50%,
and 75% of students tested. However, the distributions differ dramatically. For
2. The data analyses reported here were run using SPSS Complex Samples 15.0 for Windows (SPSS,
2007) with the February 2007 release of the SEELS Waves 1, 2, and 3 public-use data file (U.S. Depart-
ment of Education, 2007), Wave 2 data only. Analyses of the same data by SRI International were
reported by Blackorby and Knokey (2006).
40 Ross E. Mitchell
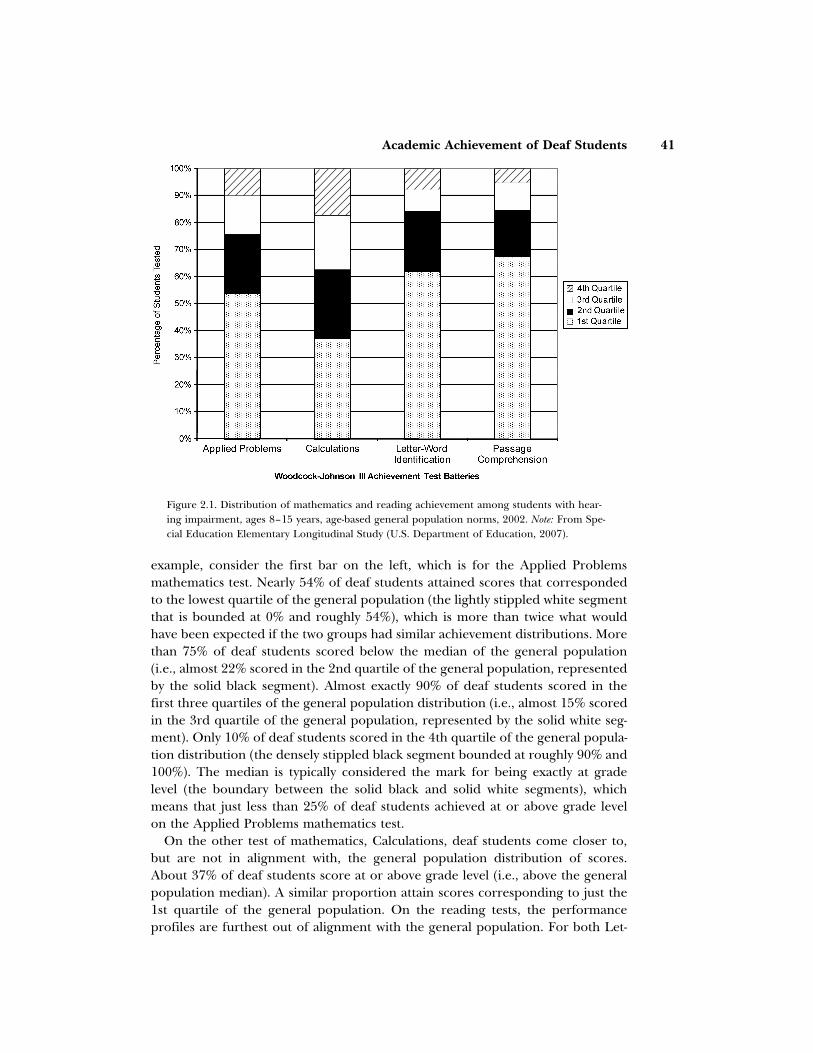
Figure 2.1. Distribution of mathematics and reading achievement among students with hear-
ing impairment, ages 8–15 years, age-based general population norms, 2002. Note: From Spe-
cial Education Elementary Longitudinal Study (U.S. Department of Education, 2007).
example, consider the first bar on the left, which is for the Applied Problems
mathematics test. Nearly 54% of deaf students attained scores that corresponded
to the lowest quartile of the general population (the lightly stippled white segment
that is bounded at 0% and roughly 54%), which is more than twice what would
have been expected if the two groups had similar achievement distributions. More
than 75% of deaf students scored below the median of the general population
(i.e., almost 22% scored in the 2nd quartile of the general population, represented
by the solid black segment). Almost exactly 90% of deaf students scored in the
first three quartiles of the general population distribution (i.e., almost 15% scored
in the 3rd quartile of the general population, represented by the solid white seg-
ment). Only 10% of deaf students scored in the 4th quartile of the general popula-
tion distribution (the densely stippled black segment bounded at roughly 90% and
100%). The median is typically considered the mark for being exactly at grade
level (the boundary between the solid black and solid white segments), which
means that just less than 25% of deaf students achieved at or above grade level
on the Applied Problems mathematics test.
On the other test of mathematics, Calculations, deaf students come closer to,
but are not in alignment with, the general population distribution of scores.
About 37% of deaf students score at or above grade level (i.e., above the general
population median). A similar proportion attain scores corresponding to just the
1st quartile of the general population. On the reading tests, the performance
profiles are furthest out of alignment with the general population. For both Let-
Academic Achievement of Deaf Students 41

ter-Word Identification and Passage Comprehension, less than 16% of deaf stu-
dents scored above the general population median. Slightly less than two-thirds
achieved in the 1st quartile of the general population on Letter-Word Identifica-
tion, and slightly more than two-thirds are in the 1st quartile on Passage Compre-
hension. These measures demonstrate a dramatic “achievement gap” between
deaf students and their nondisabled peers.
For high school age students in the NLTS-2, Wagner and colleagues (2003)
report that, on average, deaf students were 3.6 grades below grade level on tests
of reading and 3.0 grades below grade level on tests of mathematics at the time
of their most recent assessment. Just less than 20% of these students scored within
one grade of grade level or better in reading while nearly 33% scored at least five
grades below grade level. Almost 22% of the NLTS-2 sample of deaf students
scored within one grade of grade level or better in mathematics while nearly 23%
scored at least five grades below grade level.
Gallaudet Research Institute Study
From the Gallaudet Research Institute study, the most current deaf and hard of
hearing student national norms for tests of reading and mathematics on the Stan-
ford Achievement Test Series (hereafter referred to as the Stanford) are summa-
rized in Figure 2.2.3 Again, consider the first bar on the left, which is for the test
of mathematics problem solving. Slightly more than 82% of deaf students attained
scores that corresponded to the lowest quartile of the general population, which
is more than three times what would have been expected if the two groups had
similar achievement distributions. About 90% of deaf students scored below the
median (50th percentile) of the general population (i.e., 8% scored in the 2nd
quartile). Nearly 97% of deaf students scored in the first three quartiles of the
general population distribution (i.e., 6% scored in the 3rd quartile). Only 3% of
deaf students scored in the 4th quartile of the general population distribution.
The median is typically considered the mark for being exactly at grade level, which
means that just less than 10% of deaf students achieved at grade level on the test
of mathematics problem solving. As expected, compared with the OSEP study,
the results of the Gallaudet Research Institute study paint a more dismal picture
of deaf students’ academic achievement.
On the other test of mathematics, Procedures, deaf students come closer to,
but are still quite far from alignment with, the general population distribution of
scores. Less than 15% of deaf students are achieving at or above grade level (i.e.,
above the general population median). Almost 72% are in the 1st quartile of the
general population score distribution. The performance profiles for the tests of
reading vocabulary and reading comprehension are more profoundly skewed than
that observed for mathematics problem solving. Well less than 10% of deaf stu-
3. The data analyses reported here were run using SPSS Complex Samples 15.0 for Windows (SPSS,
2007) with the unpublished data from the Stanford Achievement Test, 10th Edition, National Deaf
and Hard of Hearing Student Norms Project (Gallaudet Research Institute, 2003).
42 Ross E. Mitchell

Figure 2.2. Distribution of mathematics and reading achievement among deaf students, ages
8–15 years, age-grade-based general population norms, 2003. Note: From National Deaf and
Hard of Hearing Student Norms Project (Gallaudet Research Institute, 2003).
dents are at or above grade level on reading vocabulary and reading comprehen-
sion (less than 6% and 8%, respectively). Roughly seven of every eight students
scores in the 1st quartile of the general population distribution (i.e., 88% on read-
ing vocabulary and 85% on reading comprehension). The disparity between deaf
students and their nondisabled peers is magnified by the selection biases of the
Gallaudet Research Institute study. That is, by having a sample that amplifies the
severity of disability and need for special programs, the Gallaudet Research Insti-
tute study emphasizes the dramatic achievement gap between this special popula-
tion and the general population.
For high school age students taking the Stanford, on average, deaf students
were 7.4 grades below grade level on tests of reading and 5.4 grades below grade
level on tests of mathematics. Less than 10% of these students scored within 1.0
grade of grade level or better in reading while nearly 77% scored at least 5.0
grades below grade level. Almost 10% of the Gallaudet Research Institute study
sample of deaf students scored within 1.0 grade of grade level or better in mathe-
matics while nearly 53% scored at least 5.0 grades below grade level. Again, the
sampling biases of the Gallaudet Research Institute sample draw attention to an
even larger achievement gap between the general student population and deaf
students with the greatest degrees of hearing loss or who are placed in programs
designed to provide more specialized instructional services.
Academic Achievement of Deaf Students 43

Historical Perspective
Putting these recent results into context, one can compare the current norms
from the Gallaudet Research Institute study with those of deaf student perfor-
mance on the Stanford over the last few decades. Karchmer and Mitchell (2003)
note several studies that offer findings consistent with results from research using
the Stanford; however, except for the Gallaudet Research Institute investigations
using the Stanford, there are no other data that allow for historical comparison
across multiple decades. Qi and Mitchell (2007) reviewed the distribution of
scores relative to the general population and found that it has been nearly con-
stant for both reading and mathematics. They found that performance in reading
comprehension has held steady and has been quite low relative to the general
population. The same is true for the type of content found on the current test
of mathematics procedures. There are indications that there has been relative
improvement in mathematics problem solving among older (high school age) deaf
students since the 1990s, but part of the most recent (2003 norms for the 10th
edition) improvement may be a consequence of eliminating an artificial ceiling in
attainable scores that had been imposed on the design of earlier studies. In other
words, the achievement gap between deaf students and the general population on
the Stanford has remained large and effectively unchanged for more than three
decades.
Another important historical perspective on the academic achievements of deaf
students can be obtained by examining the two national longitudinal transition
studies of special education students moving from their high school years to post-
secondary education, employment, or other activities. These studies allow direct
comparison among the groups of students identified by their disability categories.
The relative performance of students with various disabilities can be assessed as
well as any changes that have occurred over the intervening years. Explicit aca-
demic performance comparisons are made in a report by Wagner, Newman, and
Cameto (2004) between the NLTS (data collected between 1985 and 1987) and
NLTS-2 (data collected between 2001 and 2002) cohorts. These investigators
found that “students with visual or hearing impairments tended to have the best
grades overall, as well as among the largest increases over time in receiving mostly
A’s” (p. 4–8). Among students with disabilities, review of the NLTS and NLTS-2
studies leads to the conclusion that deaf students have been among the academi-
cally higher performing groups in both special education cohorts (though always
exceeded by students with visual impairments) as measured by achievement test-
ing (especially tests of mathematics), high school completion, and attendance at
postsecondary educational institutions (National Research Council, 1997; Wagner
et al., 2003; Wagner, Newman, Cameto, & Levine, 2005, 2006). That is, students
with low-incidence disabilities have tended to outperform students identified by
other, more prevalent primary disability categories. Moreover, students with low-
incidence disabilities appear to have made tremendous gains among several indi-
cators of academic achievement. However, this comparison is favorable only
among students with disabilities. As discussed above, deaf students continue to
44 Ross E. Mitchell

lag far behind their nondisabled peers, especially on the recently elevated, if not
decisive, indicator of academic achievement test scores.
CRITIQUE OF ASSESSMENT ASSUMPTIONS
Given the substantial achievement gap estimates from the OSEP and Gallaudet
Research Institute studies, some discussion of assessment of deaf students is nec-
essary. The accurate measurement of academic achievement depends on a num-
ber of considerations. In the case of deaf students, these considerations include
important issues of language use and comprehension (see, e.g., Allen, White, &
Karchmer, 1983; Baker, 1991; Chamberlain & Mayberry, 2000; Marschark, 2001;
Paul & Quigley, 1990; Qi & Mitchell, 2007). Whether for the purpose of instruc-
tional feedback and program evaluation or punitive consequences of test-based
accountability, accurately knowing what deaf students know presents a greater
challenge than the demands placed on a system of assessment for their nondisa-
bled, English-fluent peers.
As cited at the outset, the National Research Council (2001) emphasizes that
educational assessment “seeks to determine how well students are learning.” Else-
where, however, the National Research Council (2004) highlights the challenges
associated with testing students with disabilities and English language learners:
“Many of these students have attributes—such as physical, emotional, or learning
disabilities or limited fluency in English—that may prevent them from readily dem-
onstrating what they know or can do on a test” (p. 1). In other words, when it
comes to deaf students, test results may not accurately indicate how well they are
learning. In a test-based accountability regime, this threat to validity undermines
the entire enterprise. Unfortunately, “the existing base of research about the ef-
fects of accommodations on test performance and the comparability of scores
obtained under standard and accommodated conditions is insufficient to provide
empirical support for many of the decisions that must be made with respect to
the testing of these students” (National Research Council, 2004, p. 2). There are
some serious questions about just what causes the achievement gap identified in
the recent Gallaudet Research Institute and OSEP studies and no unequivocal
answers.
There are at least two clear directions for research that may lead to more accu-
rate inferences from the assessment of academic achievement among deaf stu-
dents. The first has nothing to do with test development, but has everything to
do with valid inferences in a system of test-based school accountability. The first
question raised by the National Research Council (2006, p. 145) for the purpose
of examining systems for statewide assessment of science is whether any informa-
tion is collected that establishes whether students have sufficient opportunity to
learn. This question is an essential one, regardless of content area. Student attri-
butes that may interfere with accurate assessment are not necessary to consider if
the instructional program does not deliver the assessed content in a manner that
can be learned.
Accommodating disabilities, including deafness, will not matter if the students
Academic Achievement of Deaf Students 45

do not or cannot know the material being tested. Given that federal special educa-
tion law mandated access to the general curriculum only a decade ago, and many
schools and programs serving students in special education did not take assess-
ment participation seriously until after the passage of NCLB, a systematic ap-
proach to verifying adequate opportunity to learn would significantly improve the
validity of inferences from statewide accountability assessments. If students do not
have the opportunity to learn the content that an accountability exam attempts to
assess (which assumes, correctly or not, that such exams can assess that learning)
then results from such a test will provide little insight into what students actually
have been learning in the classroom.
The second area for further research is language-based test accommodations
(for an extended discussion of this topic, see Qi & Mitchell, 2007). For both stu-
dents with disabilities and English language learners, “the assumption underlying
the accommodation is that every student has a true level of competence in each
tested subject area, and that a perfectly reliable and valid assessment will reveal
that true performance. The accommodation is intended only to compensate for
factors that prevent the student from demonstrating his or her true competence,
and not to improve his or her performance beyond that level” (National Research
Council, 2004, p. 35). In addition to being classified as one of several categories of
students with disabilities, deaf students may be thought of, imperfectly, as English
language learners because they may enter school either with prior proficiency in
a signed language (see, e.g., Johnson, Liddell, & Erting, 1989; Meadow-Orlans,
Mertens, & Sass-Lehrer, 2003; Mitchell & Karchmer, 2005; Mitchell, Young, Bach-
leda, & Karchmer, 2006; Padden & Humphries, 1988) or with delays in learning
any language (see, e.g., Emmorey, Bellugi, Frederici, & Horn, 1995; Mayberry &
Lock, 1998; Morford & Mayberry, 2000). Regardless of either the specific lan-
guages acquired or the timing of their acquisition, deaf students have limited
access to spoken English language environments and receive instructional accom-
modations that do not depend on spoken English (e.g., teachers may interact with
students directly through American Sign Language or through an interpreter us-
ing American Sign Language or some system of manual communication repre-
senting English). Typically, this limited access to spoken English negatively affects
deaf students’ abilities to respond effectively to written English tests.
Systematic investigation of tests that offer language simplification or translation
into the discourse mode of the classroom would determine the efficacy of these
accommodations and help eliminate any confoundedness between access to the
assessment and other possible explanations of poor test performance (such as
opportunity to learn). In other words, the assumption that students fully under-
stand (a) the tasks they are asked to perform and (b) the nature of the responses
requested is not necessarily a safe one. Appropriate language-based accommoda-
tions would improve the validity of inferences about learning by deaf students.
Without answers to questions of opportunity to learn and the efficacy of test
accommodations, the National Research Council’s (2001) remaining ambitions for
educational assessment cannot be achieved with deaf students. In other words,
validity and reliability remain to be determined; identifying students’ strengths
46 Ross E. Mitchell

and weaknesses is more difficult; and feedback to program design and implemen-
tation, not to mention stakeholders (i.e., students, educators, parents, policymak-
ers, and the public) will be more equivocal. Until high-quality assessment practices
are brought to deaf education, it is going to be difficult to know what deaf stu-
dents know. Or, at a minimum, schools serving deaf students will have great diffi-
culty being responsive to a system of test-based accountability.
CONCLUSION
Current standardized assessment results indicate that there is a large achievement
gap between deaf students and their nondisabled peers. This disparity has existed
for decades and has changed little if at all. At the same time, performance indica-
tors from other measures of academic achievement would suggest that deaf stu-
dents are more successful in school and have translated that success into greater
postsecondary education and employment opportunities. Either more deaf stu-
dents are receiving inflated grades and easy passes to graduation and postsecond-
ary opportunities or standardized assessments are failing to accurately measure
the improved academic achievements of deaf students.
As discussed in this chapter’s brief critique of assessment assumptions, there is
good reason to believe that current standardized assessment practices may result
in low-quality information about deaf students’ learning, though the degree of
disconnect between what deaf students know and their performance on tests of
academic achievement is uncertain. Certainly, many students with low scores
would continue to perform poorly even with appropriate accommodations be-
cause delayed language development or insufficient opportunity to learn have
interfered with their ability to know the material being tested. Many other deaf
students, however, may in fact know more than their test performances reveal.
Valid inferences based on the test scores of students who have developed their
academic proficiency through signed language rather than English language dis-
course are limited by the use of written English tests.
In the current era of test-based accountability, especially with the NCLB man-
date that all students achieve proficient status on statewide accountability assess-
ments by 2014, there is great reason to be concerned. Without some dramatic
intervention that transforms the achievement profile of deaf students, eventually,
these and others students in special education are likely to prevent schools from
achieving 100% proficiency. Even with special allowances for students with severe
cognitive disabilities (which is a category that applies to some but not all deaf
students) and narrowing of the domain for which students will be held account-
able for a larger share of students in special education, tremendous change is
needed before all remaining deaf students achieve at the proficient level. Given
the findings from the national longitudinal transition studies showing that signifi-
cant progress has been made with deaf students over the last two decades, the
central and elevated importance of performance on standardized tests of aca-
demic achievement is quite troubling. And though there is room for advancing
the opportunity to learn, without fair and balanced consideration of multiple indi-
Academic Achievement of Deaf Students 47

cators of academic achievement, it is unclear whether test quality, assessment prac-
tices, and student performance will improve in time to prevent serious and poten-
tially harmful disruption to the education of deaf students.
REFERENCES
Allen, T. E. (1986). Patterns of academic achievement among hearing impaired students:
1974 and 1983. In A. N. Schildroth & M. A. Karchmer (Eds.), Deaf children in America
(pp.161–206). San Diego, CA: College-Hill Press.
Allen, T. E., White, C. S., & Karchmer, M. A. (1983). Issues in the development of a special
edition for hearing-impaired students of the seventh edition of the Stanford Achieve-
ment Test. American Annals of the Deaf, 128 (1), 34–39.
Baker, R. M. (1991). Evaluation of hearing-impaired children. In K. E. Green (Ed.), Educa-
tional testing: Issues and applications (pp. 77–107). New York: Garland.
Blackorby, J., & Knokey, A.-M. (2006). A national profile of students with hearing impairments
in elementary and middle school: A special topic report from the Special Education Elemen-
tary Longitudinal Study. Menlo Park, CA: SRI International.
Blackorby, J., Wagner, M., Cameto, R., Davies, E., Levine, P., Newman, L., et al. (2005).
Engagement, academics, social adjustment, and independence: The achievements of elemen-
tary and middle school students with disabilities. Menlo Park, CA: SRI International.
Chamberlain, C., & Mayberry, R. I. (2000). Theorizing about the relation between Ameri-
can Sign Language and reading. In C. Chamberlain, J. P. Morford, & R. I. Mayberry
(Eds.), Language acquisition by eye. (pp. 221–259). Mahwah, NJ: Lawrence Erlbaum.
Emmorey, K., Bellugi, U., Frederici, A., & Horn, P. (1995). Effects of age of acquisition on
grammatical sensitivity: Evidence from on-line and off-line tasks. Applied Psycholinguis-
tics, 16, 1–23.
Gallaudet Research Institute. (2003). Stanford Achievement Test, 10th Edition, National
Deaf and Hard of Hearing Student Norms Project, non-public data file. Washington,
DC: Gallaudet Research Institute, Gallaudet University.
Gallaudet Research Institute. (2004). Norms booklet for deaf and hard-of-hearing students: Stan-
ford Achievement Test, 10th Edition, Form A. Washington, DC: Gallaudet University.
Holt, J. A., Traxler, C. B., & Allen, T. E. (1992). Interpreting the scores: A user’s guide to the
8th Edition Stanford Achievement Test for educators of deaf and hard of hearing students.
(Gallaudet Research Institute Technical Report No. 92-1). Washington, DC: Gal-
laudet University.
Holt, J. A., Traxler, C. B., & Allen, T. E. (1997). Interpreting the scores: A user’s guide to the
9th Edition Stanford Achievement Test for educators of deaf and hard-of-hearing students.
(Technical Report No. 97-1). Washington, DC: Gallaudet University, Gallaudet Re-
search Institute.
Individuals With Disabilities Education Act Amendments of 1997, Pub. L. No. 105-17, 20
U.S.C. § 1400 et seq.
Individuals With Disabilities Education Improvement Act of 2004, Pub. L. No. 108-446, 20
U.S.C. § 1400 et seq.
Johnson, R. E., Liddell, S. K., & Erting, C. J. (1989). Unlocking the curriculum: Principles for
achieving access in deaf education. (Working Paper No. 89-3). Washington, DC: Gal-
laudet Research Institute, Gallaudet University.
Karchmer, M. A. & Mitchell, R. E. (2003). Demographic and achievement characteristics
of deaf and hard of hearing students. In M. Marschark & P. E. Spencer (Eds.), Oxford
48 Ross E. Mitchell

handbook of deaf studies, language, and education, (pp. 21–37). New York: Oxford Uni-
versity Press.
Marschark, M. (2001). Language development in children who are deaf: A research synthesis.
Alexandria, VA: National Association of State Directors of Special Education. (ERIC
Document Reproduction Service No. ED455620)
Mayberry, R. I., & Lock, E. (1998, May). Critical period effects on grammatical processing: Privi-
leged status of the first language. Paper presented at the American Psychological Society
Convention, Washington, DC.
Meadow-Orlans, K. P., Mertens, D. M., & Sass-Lehrer, M. A. (2003). Parents and their deaf
children: The early years. Washington, DC: Gallaudet University Press.
Mitchell, R. E. (2004). National profile of deaf and hard of hearing students in special
education from weighted survey results. American Annals of the Deaf, 149 (4), 336–
349.
Mitchell, R. E., & Karchmer, M. A. (2005). Parental hearing status and signing among deaf
and hard-of-hearing students. Sign Language Studies, 5 (2), 83–96.
Mitchell, R. E., Qi, S., & Traxler, C. B. (2008, in press). Stanford Achievement Test, 10th
Edition, national performance norms for deaf and hard of hearing students: A technical
report. Washington, DC: Gallaudet Research Institute, Gallaudet University.
Mitchell, R. E., Young, T. A., Bachleda, B., & Karchmer, M. A. (2006). How many people
use ASL in the United States? Why estimates need updating. Sign Language Studies,
6 (3), 306–335.
Morford, J. P., & Mayberry, R. I. (2000). A reexamination of “early exposure” and its impli-
cations for language acquisition by eye. In C. Chamberlain, J. P. Morford, & R. I.
Mayberry (Eds.), Language acquisition by eye, (pp. 111–127). Mahwah, NJ: Lawrence
Erlbaum.
National Research Council. (1997). Educating one and all: Students with disabilities and stan-
dards-based reform. L. M. McDonnell, M. J. McLaughlin, & P. Morison (Eds.), Commit-
tee on Goals 2000 and the Inclusion of Students with Disabilities, Board on Testing
and Assessment, Commission on Behavioral and Social Sciences and Education.
Washington, DC: National Academies Press.
National Research Council. (2001). Knowing what students know: The science and design of
educational assessment. Committee on the Foundations of Assessment, J. Pelligrino, N.
Chudowsky, & R. Glaser (Eds.), Board on Testing and Assessment, Center for Educa-
tion. Division of Behavioral and Social Sciences and Education. Washington, DC:
National Academies Press.
National Research Council. (2004). Keeping score for all: The effects of inclusion and accom-
modation policies on large-scale educational assessments. Committee on Participation of
English Language Learners and Students with Disabilities in NAEP and Other Large-
Scale Assessments, J. A. Koenig & L. F. Bachman (Eds.), Board on Testing and As-
sessment, Center for Education, Division of Behavioral and Social Sciences and Edu-
cation. Washington, DC: The National Academies Press.
National Research Council. (2006). Systems for state science assessment. Committee on Test
Design for K–12 Science Achievement, M. R. Wilson and M. W. Bertenthal (Eds.),
Board on Testing and Assessment, Center for Education, Division of Behavioral and
Social Sciences and Education. Washington, DC: The National Academies Press.
No Child Left Behind Act of 2001, Pub. L. No. 107-110, 115 Stat. 1425 (2002).
Office of Demographic Studies. (1969). Academic achievement test performance of hearing im-
paired students. Washington, DC: Gallaudet College.
Academic Achievement of Deaf Students 49

Padden, C. A., & Humphries, T. (1988). Deaf in America: Voices from a culture. Cambridge,
MA: Harvard University Press.
Paul, P. V., & Quigley, S. P. (1990). Education and deafness. New York: Longman.
Qi, S., & Mitchell, R. E. (2007, April 10). Large-scale academic achievement testing of deaf and
hard-of-hearing students: Past, present, and future. Paper presented at the annual meeting
of the American Educational Research Association, Chicago, Illinois.
Traxler, C. B. (2000). The Stanford Achievement Test, 9th Edition: National norming and
performance standards for deaf and hard-of-hearing students. Journal of Deaf Studies
& Deaf Education, 5 (4), 337–348.
U.S. Department of Education. (2007, February). Special Education Elementary Longitudi-
nal Study, Waves 1, 2, and 3 public-use data file. Washington, DC: Office of Special
Education Programs, U.S. Department of Education.
Wagner, M., Marder, C., Blackorby, J., Cameto, R., Newman, L., Levine, P., et al. (2003).
The achievements of youth with disabilities during secondary school. A report from the Na-
tional Longitudinal Transition Study-2 (NLTS2). Menlo Park, CA: SRI International.
Wagner, M., Newman, L., & Cameto, R. (2004). Changes over time in the secondary school
programs of students with disabilities. A report of findings from the National Longitudinal
Transition Study and the National Longitudinal Transition Study-2 (NLTS2).Menlo Park,
CA: SRI International.
Wagner, M., Newman, L., Cameto, R., & Levine, P. (2005). Changes over time in the early
postschool outcomes of youth with disabilities. A report of findings from the National Longitu-
dinal Transition Study (NLTS) and the National Longitudinal Transition Study-2
(NLTS2). Menlo Park, CA: SRI International.
Wagner, M., Newman, L., Cameto, R., & Levine, P. (2006). The academic achievement and
functional performance of youth with disabilities. A report from the National Longitudinal
Transition Study-2 (NLTS2). (NCSER 2006-3000). Menlo Park, CA: SRI International.
50 Ross E. Mitchell
Related Documents