1 23 Environmental Earth Sciences ISSN 1866-6280 Environ Earth Sci DOI 10.1007/s12665-012-2038-8 Heavy metal contamination in water and sediment of the Port Klang coastal area, Selangor, Malaysia Seyedeh Belin Tavakoly Sany, Aishah Salleh, Abdul Halim Sulaiman, A. Sasekumar, Majid Rezayi & Ghazaleh Monazami Tehrani

Welcome message from author
This document is posted to help you gain knowledge. Please leave a comment to let me know what you think about it! Share it to your friends and learn new things together.
Transcript
1 23
Environmental Earth Sciences ISSN 1866-6280 Environ Earth SciDOI 10.1007/s12665-012-2038-8
Heavy metal contamination in water andsediment of the Port Klang coastal area,Selangor, Malaysia
Seyedeh Belin Tavakoly Sany, AishahSalleh, Abdul Halim Sulaiman,A. Sasekumar, Majid Rezayi & GhazalehMonazami Tehrani
1 23
Your article is protected by copyright and
all rights are held exclusively by Springer-
Verlag Berlin Heidelberg. This e-offprint is
for personal use only and shall not be self-
archived in electronic repositories. If you
wish to self-archive your work, please use the
accepted author’s version for posting to your
own website or your institution’s repository.
You may further deposit the accepted author’s
version on a funder’s repository at a funder’s
request, provided it is not made publicly
available until 12 months after publication.
ORIGINAL ARTICLE
Heavy metal contamination in water and sediment of the Port
Klang coastal area, Selangor, Malaysia
Seyedeh Belin Tavakoly Sany • Aishah Salleh •
Abdul Halim Sulaiman • A. Sasekumar •
Majid Rezayi • Ghazaleh Monazami Tehrani
Received: 17 January 2012 / Accepted: 1 October 2012
� Springer-Verlag Berlin Heidelberg 2012
Abstract This investigation presents the temporal and
spatial distribution of heavy metals (As, Cd, Cr, Cu, Ni, Pb,
Hg, and Zn), in water and in sediments of Port Klang,
Malaysia. Water and sediment samples were collected from
21 stations at 3-month intervals, and contamination factor
ðCfÞ and contamination degree ðCdÞ were calculated to
estimate the contamination status at the sampling stations.
Cluster analysis was used to classify the stations based on
the contamination sources. Results show that concentra-
tions of As, Cd, Hg, and Pb in sediment and As, Cd, Hg,
Pb, Cr, and Zn in water were significantly higher than the
background values at which these metals are considered
hazardous. The main sources of heavy metal contamination
in Port Klang were industrial wastewater and port
activities.
Keywords Heavy metals �Water and sediment pollution �
Port Klang � Malaysia
Introduction
The main goal of most contamination-oriented studies of
water and sediments is to describe or assess existing con-
ditions and to estimate whether the aquatic systems have
been anthropogenically or naturally affected. Low con-
centrations of many elements occur naturally in the earth’s
crust and are mined widely for use. Great amounts of
several elements like toxic heavy metals (cadmium, lead,
chromium and mercury) are discharged into marine envi-
ronments as contaminants by anthropogenic activities (Gao
et al. 2009; Nduka and Orisakwe 2011; Kassim et al. 2011).
Historically, water and sediment quality have been
monitored based on the collection and laboratory analysis
of samples. Several researches showed that concentrations
of heavy metals in sediment are far higher than the con-
centration of dissolved metals in the water bodies (Sultan
and Shazili 2009). Marine sediment acts as both sink and
source for heavy metals (Nobi et al. 2010; Gao et al. 2009;
Gleyzes et al. 2002). The main pathways of heavy metals
partitioning include adsorption, complexation, precipita-
tion and biological uptake. Adsorption is usually the pre-
dominant process, because metals have strong affinities for
iron and manganese hydroxides, particulate organic matter,
and a lesser extent to clay minerals. Consequently, metals
tend to accumulate in bottom sediments (Nobi et al. 2010;
He et al. 2009; Rezayi et al. 2011).
In aquatic systems, monitoring of the dissolved phase is
not sufficient to evaluate distribution, concentration, bio-
accumulation, and availability of these elements. It is nec-
essary to estimate heavy metal concentrations in the
dissolved and solid phases to monitor accurately the metal
contamination in temporal and spatial scales. Heavy metal
cycling in the marine environment is a serious problem as
these metals are stable and a majority of them have toxic
S. B. T. Sany (&) � A. Salleh �A. H. Sulaiman � A. Sasekumar � G. M. Tehrani
Institute of Biological Sciences, University of Malaya,
50603 Kuala Lumpur, Malaysia
e-mail: [email protected]
S. B. T. Sany � M. Rezayi
Food Science and Technology Research Institute,
ACECR Mashhad Branch, Mashhad, Iran
M. Rezayi
School of Chemical Sciences and Food Technology,
Faculty of Science and Technology,
Universiti Kebangsaan Malaysia,
43600 Bangi, Selangor, Malaysia
123
Environ Earth Sci
DOI 10.1007/s12665-012-2038-8
Author's personal copy
effects on living organisms (Nobi et al. 2010; He et al. 2009;
Pekey 2006; Ismail and Beddri 2009). Bioavailability,
mobility, and toxicity of metals depend on their specific
chemical form or binding, which are changed by several
physical and chemical factors, such as pH, temperature,
redox potential, and organic ligand concentrations. These
factors can convert metals from a solid phase to a liquid
phase and sometimes cause pollution of surrounding water
bodies (Sahuquillo et al. 2003; Nobi et al. 2010).
The Port Klang is located in the west coast of Peninsular
Malaysia, in the narrow Klang Strait; this area is important
for fisheries, tourism, navigation, and transportation. After
1981, Klang Strait experienced rapid commercial and
industrial development, which caused an increase in pop-
ulation, leading to contamination and deterioration of the
marine environment quality. This rapid deterioration of the
Port Klang marine environment drew international atten-
tion. Thus, several regulations, guidelines and international
agreements were ratified by research organizations (Asso-
ciation of Southeast Asian Nations and Department of
Environment) to reduce and remedy contamination caused
by several anthropogenic activities, such as harbors, in-
dustrials sites, and tourism, that released high amounts of
contaminants into the marine environment. Nevertheless,
the current information on concentration of contaminants
in Port Klang’s environment is inadequate.
The major objectives of this study are to estimate the
concentration levels of metals including As, Cu, Cr, Cd, Ni,
Pb, Hg and Zn, in the surface waters and sediments, and to
provide baseline data of these metals to assess the responses
of the Port Klang marine environment to anthropogenic
pollution in future.
Materials and methods
Study area and sample collection
The Klang Strait covers an area of about 573 km2 and is
located in the western tropical coastal region (03�00 N to
101�240E) of Malaysia (Fig. 1). This port is divided into
three subsidiary commercial ports (North, South, and West
Port) that are sheltered by surrounding mangrove forests.
Several notable activities in this area include farming,
industrial factories (palm oil, cement, food, and electrical),
and shipping.
Klang Strait is located within the tropics experiencing
two seasons within the year, the northeast (November to
March) and the southeast monsoons (April to October) (Yap
2005). Heavy rainfall, annual flooding and high river flows
are commonly experienced during the northeast monsoon or
wet season, while dry periods occur later during the season.
The mean annual water temperature is 30.04 �C, whereas
the mean salinity has been reported to be 30.25 %. The
annual mean surface and bottom pH values vary between
7.58 and 8.25, and the mean surface dissolved oxygen (DO)
was recorded as 5.38 mg/l (Yap 2005). This area is marked
by a semi-diurnal tide, which ranges from 2 m during neaps
to 5.5 m during spring (Chong et al. 1990).
Assessment of the heavy metal status in Klang Strait
coastal water is a difficult task due to the great variability
in environment conditions. This area is affected extensively
by nonpoint sources, different depth, tidal condition and
strong marine current, due to the northeast monsoon. These
limitations have effect on metals concentration, although
the sediment situation in this area is independent of tidal
influence (Yap 2005). Several concepts have been used to
reduce the impacts of these limitations, such as increasing
number of stations, temporal assessment, and multiple
sediment samplings during the north and south monsoon.
Sediment samples were collected from November 2009
to October 2010 in 21 locations at the three subsidiary ports
and this included six stations in North Port, six stations in
South Port, and nine stations in West Port. These stations
were arranged into three parallel transects from the coast-
line at three different distances (Fig. 1). A multi-parameter
probe (YSI 556 MPS) was used to measure physical
parameters namely, temperature, salinity, dissolved oxygen
and pH from the surface water layer at a depth of 50 cm
(Table 1).
The samples were collected every 3 months in triplicate
from 2 cm depth of the sediment during low tides. Poly-
ethylene bags were used to store the sediment samples,
which were kept in an icebox at 4 �C to reduce biochem-
ical reactions. In the laboratory, the sediment samples were
kept in a freezer at -20 �C until further analysis. The water
samples were collected from surface water and stored in
500 ml polyethylene bottles that were pre-cleaned with
deionized water and rinsed with ambient water before
collection of the samples. Water samples were filtered
through 0.45 lm millipore filters and acidified to pH\ 2
using concentrated nitric acid, and then stored in the dark at
4 �C. The metal concentrations were measured by ICP-MS.
Analytical procedures
Sediment samples were oven dried (60 �C) over the night,
and passed through a 2 mm mesh sieve to remove coarser
particles. The sediment granulometry was analyzed using a
multi-wavelength particle size analyzer (model LS 13 320)
from Beckman Coulter company. The percentages of three
fractions of grain sizes were estimated: Clay (\2 lm), silt
(2 lm\ size\ 64 lm) and sand ([64 lm). A carbon
analyzer (Horiba Model 8210) was used to estimate the total
organic carbon (TOC) following the specific procedure of
Fang and Hong (1999). About 0.5 g of the dried sediment
Environ Earth Sci
123
Author's personal copy
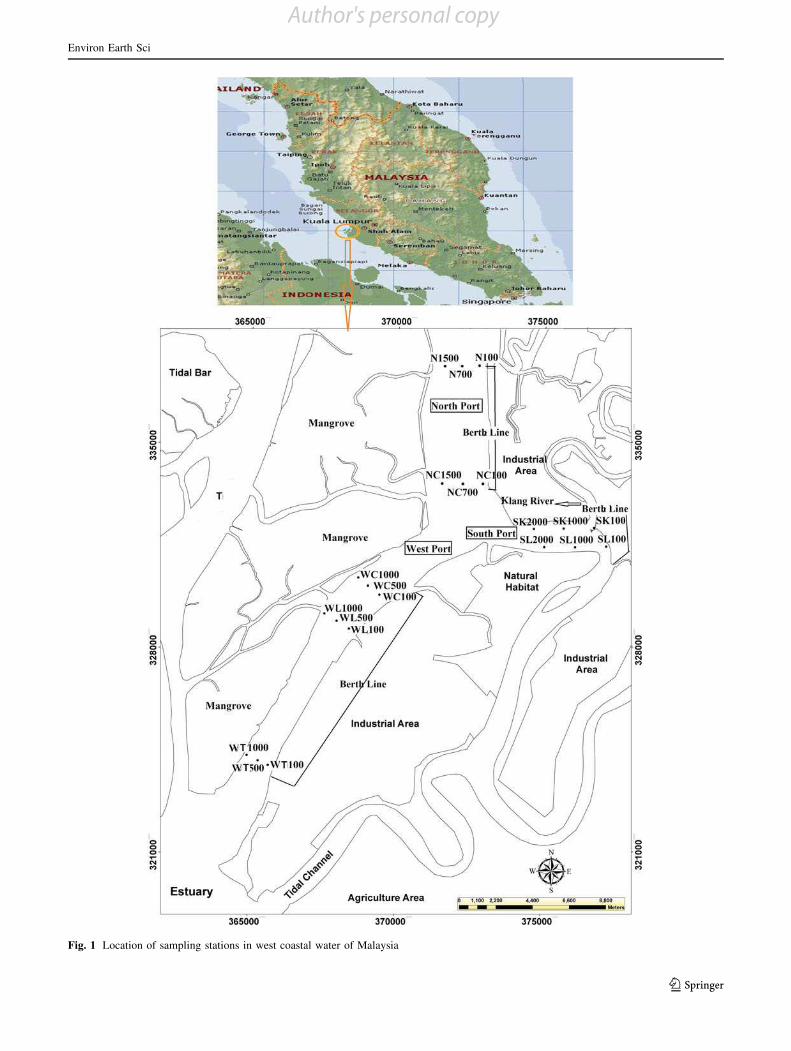
Fig. 1 Location of sampling stations in west coastal water of Malaysia
Environ Earth Sci
123
Author's personal copy
was digested in 9 ml nitric acid (HNO3), 3 ml hydrofluoric
acid (HF) and 3 ml hydrochloric acid (HCl) in a teflon
vessel, and heated in a microwave.
After cooling, 18 ml of 5 % boric acid was added to the
vessel content to remove the fluoride residue. The vessel
content was centrifuged, followed by filtration into 50 ml
volumetric flasks, and volume was brought to 50 ml by the
double deionized water for measuring the heavy metals
(Yap 2005). Heavy metals (As, Cd, Cr, Cu, Ni, Pb, and Zn)
were measured by plasma mass spectrometry (ICP-MS) at
the department of chemistry and geology of the University
of Malaya. Most of the metals measured had levels above
detectable limits. ICP-MS was calibrated by external
standard solutions to measure metals and the calibration
was improved using Re and In as internal standards.
Stock reference solutions of 1000 mg/l were diluted to
prepare working standards and the matrix matched with
similar acidity, both procedures being important to make
various concentration ranges. The entire chemical com-
pound used had the actual quality and soap was applied to
wash and rinse the crystal material and teflon bottles prior
to analysis. Laboratory blanks, field duplicates, and stan-
dard reference materials (SRM) 2702 were applied to
improve quality assurance during laboratory analysis.
SRM 2702 is a natural standard reference of inorganic
material collected from marine sediment with the certified
concentration. In this study, the percentage of recovery
varied between 91 and 104. The standard methods indi-
cated warning limits for matrix spike recoveries from 87 to
113 %; thus, the range of recovery was reasonable in this
study (EPA 1996; Ilander and Vaisanen 2007). Potential
contamination was detected by reagent blanks, during the
analytical and digestion procedure.
Contamination factor and contamination degree
To describe the contamination of a toxic compound, a
contamination factor ðCifÞ was defined according to Eqs. 1
and 2 (IDEM 2002; Parris et al. 1998; Schantz et al. 2005).
Cif ¼
Xn
i¼1
Ci0 � 1
Cif
ð1Þ
Cd ¼Xn
i¼1
Cif : ð2Þ
Where, Cif = the contamination factor, Ci
0�1 = the
average content of the compound in question (i) from
surface sediment (0–1 cm) at the accumulation area. The
value should be estimated in lg g-1 ds (ppm), Cin = the
background value of the compound, n = the number of
heavy metals, Cd = the contamination degree
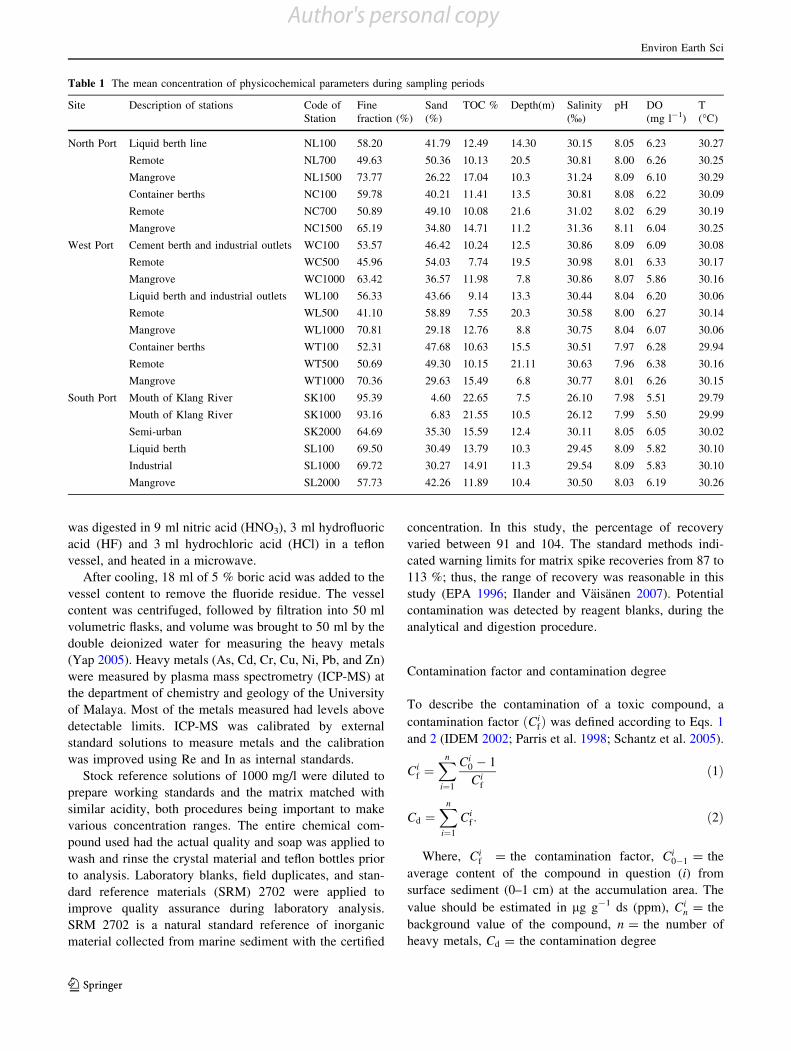
Table 1 The mean concentration of physicochemical parameters during sampling periods
Site Description of stations Code of
Station
Fine
fraction (%)
Sand
(%)
TOC % Depth(m) Salinity
(%)
pH DO
(mg l-1)
T
(�C)
North Port Liquid berth line NL100 58.20 41.79 12.49 14.30 30.15 8.05 6.23 30.27
Remote NL700 49.63 50.36 10.13 20.5 30.81 8.00 6.26 30.25
Mangrove NL1500 73.77 26.22 17.04 10.3 31.24 8.09 6.10 30.29
Container berths NC100 59.78 40.21 11.41 13.5 30.81 8.08 6.22 30.09
Remote NC700 50.89 49.10 10.08 21.6 31.02 8.02 6.29 30.19
Mangrove NC1500 65.19 34.80 14.71 11.2 31.36 8.11 6.04 30.25
West Port Cement berth and industrial outlets WC100 53.57 46.42 10.24 12.5 30.86 8.09 6.09 30.08
Remote WC500 45.96 54.03 7.74 19.5 30.98 8.01 6.33 30.17
Mangrove WC1000 63.42 36.57 11.98 7.8 30.86 8.07 5.86 30.16
Liquid berth and industrial outlets WL100 56.33 43.66 9.14 13.3 30.44 8.04 6.20 30.06
Remote WL500 41.10 58.89 7.55 20.3 30.58 8.00 6.27 30.14
Mangrove WL1000 70.81 29.18 12.76 8.8 30.75 8.04 6.07 30.06
Container berths WT100 52.31 47.68 10.63 15.5 30.51 7.97 6.28 29.94
Remote WT500 50.69 49.30 10.15 21.11 30.63 7.96 6.38 30.16
Mangrove WT1000 70.36 29.63 15.49 6.8 30.77 8.01 6.26 30.15
South Port Mouth of Klang River SK100 95.39 4.60 22.65 7.5 26.10 7.98 5.51 29.79
Mouth of Klang River SK1000 93.16 6.83 21.55 10.5 26.12 7.99 5.50 29.99
Semi-urban SK2000 64.69 35.30 15.59 12.4 30.11 8.05 6.05 30.02
Liquid berth SL100 69.50 30.49 13.79 10.3 29.45 8.09 5.82 30.10
Industrial SL1000 69.72 30.27 14.91 11.3 29.54 8.09 5.83 30.10
Mangrove SL2000 57.73 42.26 11.89 10.4 30.50 8.03 6.19 30.26
Environ Earth Sci
123
Author's personal copy
There are several approaches to estimate an accurate
natural background level in all projects. This discussion
can be treated in different methods: one is to use a general
geological reference value such as an element’s concen-
tration in the earth crust, which was introduced by Ture-
kian and Wedepohl in 1961. The other way is to use data
older than 10 years as equivalent to pre-industrial or pre-
civilization values. In the first method, all local variations
are ignored, and in the second method, all local differences
are emphasized. Hakanson (1980) proposed a method to
estimate a natural background value based on the second
approach. In this study, the background value for sediment
was measured based on the Eq. 3 because there were pre-
vious data of sediment quality in west coast area of Pen-
insular Malaysia from 1992 until 2006. Water quality was
assessed based on marine water background value pre-
sented by Hakanson (1980).
Cin ¼ xþ sx: ð3Þ
Where, Cin is the natural background value, x is the mean
of pre-industrial data or old previous studies, and sx is one
(1) standard deviation. This contamination factor ranged as
low ðCif\1Þ, moderate ð1�Ci
f\3Þ, considerable ð3�Cif
\6Þ, and very high ðCif � 6Þ. The contamination degree
ðCdÞwas estimated based on the sum of all contamination
factors. The specific terminology is used to describe the
contamination degree of sediment—low contamination
degree ðCd\8Þ, moderate contamination degree ð8�Cd
\16Þ, considerable contamination degree ð16�Cd\32Þ,
and a very high contamination degree ðCif � 32Þ.
Microsoft Excel and SPSS 17 software were used to
perform statistical analyses. The two-way ANOVA test
(level of significance is 0.05) was employed to understand
the variation of the heavy metal concentration with respect
to different seasons and stations. Kendall’s tau-b correla-
tion analysis was constructed to understand the relationship
between heavy metals in sediment and other parameters.
Standard deviation was estimated to evaluate variation or
dispersion from the average of physicochemical parameters
based on repeating the analyses 16 times over the four
separate months.
Results and discussion
Some physicochemical parameters of water and surface
sediment have been determined to evaluate a possible
relationship between these parameters (Table 1). The pH is
a main indicator to assess water quality and pollution in
marine and coastal systems. According to the guidelines,
the acceptable range for pH is 6.5–8.5. In this study, pH
ranged 7.96–8.11, which indicates the alkaline nature of the
Port Klang coastal waters where mainly influenced by
Klang River discharge and land based runoff. Temperature
and dissolved oxygen ranged 29.79–30.29 �C and
5.50–33 mg l-1, respectively. There were no significant
differences in temperature and dissolved oxygen at all
stations. Salinity ranged between 26.10 and 31.36 %, the
lowest salinity value was recorded at stations SK100 and
SK1000, because of their location close to the fresh water
flow of the Klang River.
In the present study, according to reports of the
Malaysian Metrological Service (MMS) between 2009 and
2011, the monthly average rainfall ranged from a minimum
of 190 mm in August to a maximum of 410 mm in April
and May; the average was 266.91 mm. November, April
and May were the months with the greatest number of
raining days (400–410 mm). Other researchers have
reported that the river discharge at Klang Strait is highly
correlated with rainfall patterns, and as expected, the
maximum river discharges were measured in November
2009 and April and May 2010.
Analysis of sediment grain size demonstrated that fine-
grained sediment (\64 lm) predominated at almost all
stations (41.1–95.39 %). The maximum of fine fractions
were measured at stations close to the mangrove line and
mouth of Klang River, while the highest portion of the sand
fraction was recorded at stations WC500 (54.03) and
WL500 (58.89). According to the two-way ANOVA, there
are significant differences (p\ 0.05, df = 21, f = 8.82,
sig = 0.00) between distribution of fine-grained sediment
at different stations; however, there is no significant dif-
ference (p\ 0.05, df = 3, f = 0.82, sig = 0.66) between
its concentration at different seasons.
Several factors affect grain size variation in a marine
system, such as sediment transportation and sedimentary
process (Bowen 1966; Hakanson 1980). In this study, areas
with high percentage of fine sediment were found near the
mangrove forest. This may be due to the land-based runoff
and sedimentary process of mangrove forests. Several
studies showed that mangrove forests can increase the
suspended solid deposition by decreasing the water
dynamic energy and provide enough time for deposition of
fine grain sediment (Qin et al. 1989). Moreover, the high
percentage of fine-grained sediment was at stations close to
the Klang River, which is good evidence to confirm the
effect of the river transport mode on the distribution of
sediment particles.
The TOC content of sediment ranged between 5.35
and 24.88 % and its concentrations were significantly dif-
ferent either at stations (p\ 0.05, df = 21, f = 10.10,
sig = 0.00) or in seasons (p\ 0.05, df = 3, f = 3.62,
sig = 0.018). The distribution of TOC follows the same
pattern as fine-grained sediment in most parts of Port Klang
with high concentrations of TOC recorded at stations
SK100 and SK1000 near the mouth of Klang River and the
Environ Earth Sci
123
Author's personal copy
lower percentage at stations WC500 and WL500. There
was high correlation (0.716) between the TOC and fine-
grained sediment in study area. In November 2009, the
TOC percentage increases with decreasing mean grain size
because the fine particle size, particularly the clay colloid,
has a high tendency to adsorb TOC.
Spatial and temporal variation of heavy metals
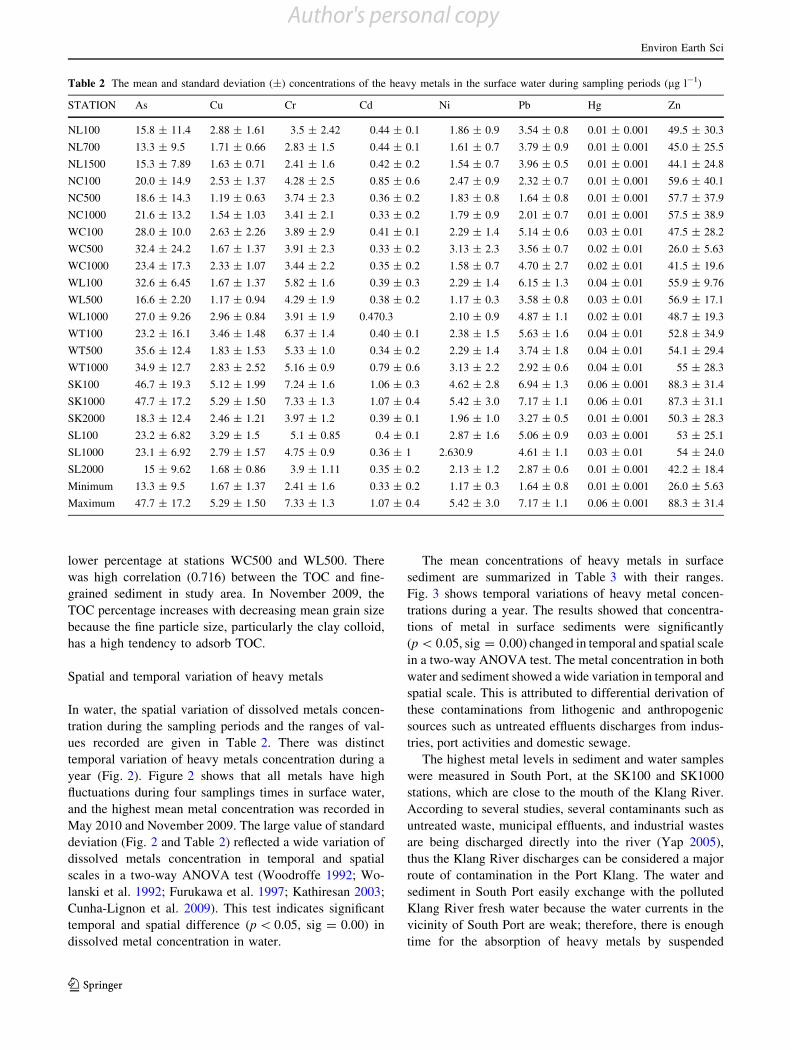
In water, the spatial variation of dissolved metals concen-
tration during the sampling periods and the ranges of val-
ues recorded are given in Table 2. There was distinct
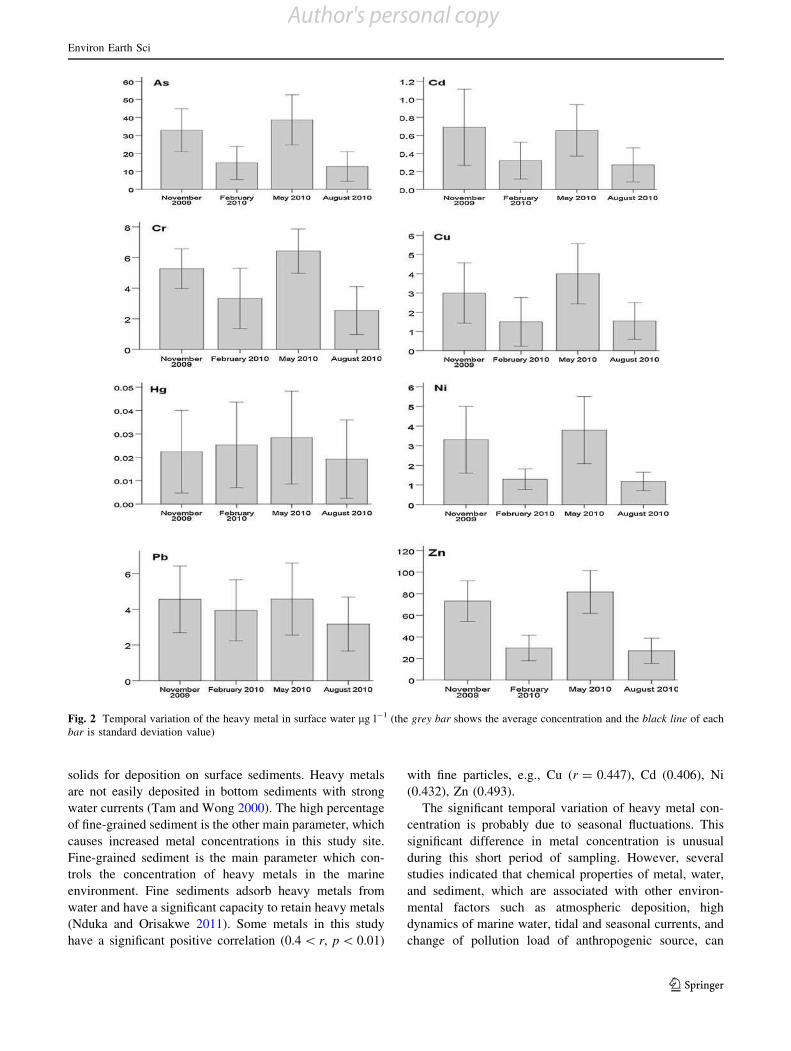
temporal variation of heavy metals concentration during a
year (Fig. 2). Figure 2 shows that all metals have high
fluctuations during four samplings times in surface water,
and the highest mean metal concentration was recorded in
May 2010 and November 2009. The large value of standard
deviation (Fig. 2 and Table 2) reflected a wide variation of
dissolved metals concentration in temporal and spatial
scales in a two-way ANOVA test (Woodroffe 1992; Wo-
lanski et al. 1992; Furukawa et al. 1997; Kathiresan 2003;
Cunha-Lignon et al. 2009). This test indicates significant
temporal and spatial difference (p\ 0.05, sig = 0.00) in
dissolved metal concentration in water.
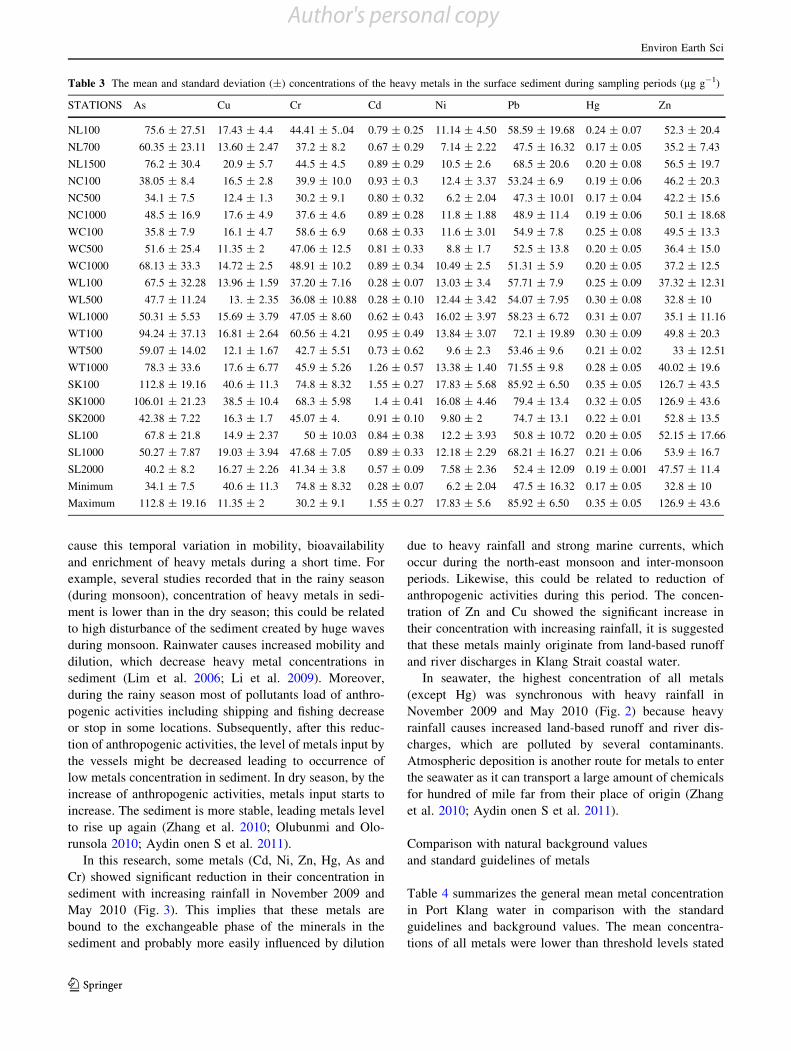
The mean concentrations of heavy metals in surface
sediment are summarized in Table 3 with their ranges.
Fig. 3 shows temporal variations of heavy metal concen-
trations during a year. The results showed that concentra-
tions of metal in surface sediments were significantly
(p\ 0.05, sig = 0.00) changed in temporal and spatial scale
in a two-way ANOVA test. The metal concentration in both
water and sediment showed a wide variation in temporal and
spatial scale. This is attributed to differential derivation of
these contaminations from lithogenic and anthropogenic
sources such as untreated effluents discharges from indus-
tries, port activities and domestic sewage.
The highest metal levels in sediment and water samples
were measured in South Port, at the SK100 and SK1000
stations, which are close to the mouth of the Klang River.
According to several studies, several contaminants such as
untreated waste, municipal effluents, and industrial wastes
are being discharged directly into the river (Yap 2005),
thus the Klang River discharges can be considered a major
route of contamination in the Port Klang. The water and
sediment in South Port easily exchange with the polluted
Klang River fresh water because the water currents in the
vicinity of South Port are weak; therefore, there is enough
time for the absorption of heavy metals by suspended
Table 2 The mean and standard deviation (±) concentrations of the heavy metals in the surface water during sampling periods (lg l-1)
STATION As Cu Cr Cd Ni Pb Hg Zn
NL100 15.8 ± 11.4 2.88 ± 1.61 3.5 ± 2.42 0.44 ± 0.1 1.86 ± 0.9 3.54 ± 0.8 0.01 ± 0.001 49.5 ± 30.3
NL700 13.3 ± 9.5 1.71 ± 0.66 2.83 ± 1.5 0.44 ± 0.1 1.61 ± 0.7 3.79 ± 0.9 0.01 ± 0.001 45.0 ± 25.5
NL1500 15.3 ± 7.89 1.63 ± 0.71 2.41 ± 1.6 0.42 ± 0.2 1.54 ± 0.7 3.96 ± 0.5 0.01 ± 0.001 44.1 ± 24.8
NC100 20.0 ± 14.9 2.53 ± 1.37 4.28 ± 2.5 0.85 ± 0.6 2.47 ± 0.9 2.32 ± 0.7 0.01 ± 0.001 59.6 ± 40.1
NC500 18.6 ± 14.3 1.19 ± 0.63 3.74 ± 2.3 0.36 ± 0.2 1.83 ± 0.8 1.64 ± 0.8 0.01 ± 0.001 57.7 ± 37.9
NC1000 21.6 ± 13.2 1.54 ± 1.03 3.41 ± 2.1 0.33 ± 0.2 1.79 ± 0.9 2.01 ± 0.7 0.01 ± 0.001 57.5 ± 38.9
WC100 28.0 ± 10.0 2.63 ± 2.26 3.89 ± 2.9 0.41 ± 0.1 2.29 ± 1.4 5.14 ± 0.6 0.03 ± 0.01 47.5 ± 28.2
WC500 32.4 ± 24.2 1.67 ± 1.37 3.91 ± 2.3 0.33 ± 0.2 3.13 ± 2.3 3.56 ± 0.7 0.02 ± 0.01 26.0 ± 5.63
WC1000 23.4 ± 17.3 2.33 ± 1.07 3.44 ± 2.2 0.35 ± 0.2 1.58 ± 0.7 4.70 ± 2.7 0.02 ± 0.01 41.5 ± 19.6
WL100 32.6 ± 6.45 1.67 ± 1.37 5.82 ± 1.6 0.39 ± 0.3 2.29 ± 1.4 6.15 ± 1.3 0.04 ± 0.01 55.9 ± 9.76
WL500 16.6 ± 2.20 1.17 ± 0.94 4.29 ± 1.9 0.38 ± 0.2 1.17 ± 0.3 3.58 ± 0.8 0.03 ± 0.01 56.9 ± 17.1
WL1000 27.0 ± 9.26 2.96 ± 0.84 3.91 ± 1.9 0.470.3 2.10 ± 0.9 4.87 ± 1.1 0.02 ± 0.01 48.7 ± 19.3
WT100 23.2 ± 16.1 3.46 ± 1.48 6.37 ± 1.4 0.40 ± 0.1 2.38 ± 1.5 5.63 ± 1.6 0.04 ± 0.01 52.8 ± 34.9
WT500 35.6 ± 12.4 1.83 ± 1.53 5.33 ± 1.0 0.34 ± 0.2 2.29 ± 1.4 3.74 ± 1.8 0.04 ± 0.01 54.1 ± 29.4
WT1000 34.9 ± 12.7 2.83 ± 2.52 5.16 ± 0.9 0.79 ± 0.6 3.13 ± 2.2 2.92 ± 0.6 0.04 ± 0.01 55 ± 28.3
SK100 46.7 ± 19.3 5.12 ± 1.99 7.24 ± 1.6 1.06 ± 0.3 4.62 ± 2.8 6.94 ± 1.3 0.06 ± 0.001 88.3 ± 31.4
SK1000 47.7 ± 17.2 5.29 ± 1.50 7.33 ± 1.3 1.07 ± 0.4 5.42 ± 3.0 7.17 ± 1.1 0.06 ± 0.01 87.3 ± 31.1
SK2000 18.3 ± 12.4 2.46 ± 1.21 3.97 ± 1.2 0.39 ± 0.1 1.96 ± 1.0 3.27 ± 0.5 0.01 ± 0.001 50.3 ± 28.3
SL100 23.2 ± 6.82 3.29 ± 1.5 5.1 ± 0.85 0.4 ± 0.1 2.87 ± 1.6 5.06 ± 0.9 0.03 ± 0.001 53 ± 25.1
SL1000 23.1 ± 6.92 2.79 ± 1.57 4.75 ± 0.9 0.36 ± 1 2.630.9 4.61 ± 1.1 0.03 ± 0.01 54 ± 24.0
SL2000 15 ± 9.62 1.68 ± 0.86 3.9 ± 1.11 0.35 ± 0.2 2.13 ± 1.2 2.87 ± 0.6 0.01 ± 0.001 42.2 ± 18.4
Minimum 13.3 ± 9.5 1.67 ± 1.37 2.41 ± 1.6 0.33 ± 0.2 1.17 ± 0.3 1.64 ± 0.8 0.01 ± 0.001 26.0 ± 5.63
Maximum 47.7 ± 17.2 5.29 ± 1.50 7.33 ± 1.3 1.07 ± 0.4 5.42 ± 3.0 7.17 ± 1.1 0.06 ± 0.001 88.3 ± 31.4
Environ Earth Sci
123
Author's personal copy
solids for deposition on surface sediments. Heavy metals
are not easily deposited in bottom sediments with strong
water currents (Tam and Wong 2000). The high percentage
of fine-grained sediment is the other main parameter, which
causes increased metal concentrations in this study site.
Fine-grained sediment is the main parameter which con-
trols the concentration of heavy metals in the marine
environment. Fine sediments adsorb heavy metals from
water and have a significant capacity to retain heavy metals
(Nduka and Orisakwe 2011). Some metals in this study
have a significant positive correlation (0.4\ r, p\ 0.01)
with fine particles, e.g., Cu (r = 0.447), Cd (0.406), Ni
(0.432), Zn (0.493).
The significant temporal variation of heavy metal con-
centration is probably due to seasonal fluctuations. This
significant difference in metal concentration is unusual
during this short period of sampling. However, several
studies indicated that chemical properties of metal, water,
and sediment, which are associated with other environ-
mental factors such as atmospheric deposition, high
dynamics of marine water, tidal and seasonal currents, and
change of pollution load of anthropogenic source, can
Fig. 2 Temporal variation of the heavy metal in surface water lg l-1 (the grey bar shows the average concentration and the black line of each
bar is standard deviation value)
Environ Earth Sci
123
Author's personal copy
cause this temporal variation in mobility, bioavailability
and enrichment of heavy metals during a short time. For
example, several studies recorded that in the rainy season
(during monsoon), concentration of heavy metals in sedi-
ment is lower than in the dry season; this could be related
to high disturbance of the sediment created by huge waves
during monsoon. Rainwater causes increased mobility and
dilution, which decrease heavy metal concentrations in
sediment (Lim et al. 2006; Li et al. 2009). Moreover,
during the rainy season most of pollutants load of anthro-
pogenic activities including shipping and fishing decrease
or stop in some locations. Subsequently, after this reduc-
tion of anthropogenic activities, the level of metals input by
the vessels might be decreased leading to occurrence of
low metals concentration in sediment. In dry season, by the
increase of anthropogenic activities, metals input starts to
increase. The sediment is more stable, leading metals level
to rise up again (Zhang et al. 2010; Olubunmi and Olo-
runsola 2010; Aydin onen S et al. 2011).
In this research, some metals (Cd, Ni, Zn, Hg, As and
Cr) showed significant reduction in their concentration in
sediment with increasing rainfall in November 2009 and
May 2010 (Fig. 3). This implies that these metals are
bound to the exchangeable phase of the minerals in the
sediment and probably more easily influenced by dilution
due to heavy rainfall and strong marine currents, which
occur during the north-east monsoon and inter-monsoon
periods. Likewise, this could be related to reduction of
anthropogenic activities during this period. The concen-
tration of Zn and Cu showed the significant increase in
their concentration with increasing rainfall, it is suggested
that these metals mainly originate from land-based runoff
and river discharges in Klang Strait coastal water.
In seawater, the highest concentration of all metals
(except Hg) was synchronous with heavy rainfall in
November 2009 and May 2010 (Fig. 2) because heavy
rainfall causes increased land-based runoff and river dis-
charges, which are polluted by several contaminants.
Atmospheric deposition is another route for metals to enter
the seawater as it can transport a large amount of chemicals
for hundred of mile far from their place of origin (Zhang
et al. 2010; Aydin onen S et al. 2011).
Comparison with natural background values
and standard guidelines of metals
Table 4 summarizes the general mean metal concentration
in Port Klang water in comparison with the standard
guidelines and background values. The mean concentra-
tions of all metals were lower than threshold levels stated
Table 3 The mean and standard deviation (±) concentrations of the heavy metals in the surface sediment during sampling periods (lg g-1)
STATIONS As Cu Cr Cd Ni Pb Hg Zn
NL100 75.6 ± 27.51 17.43 ± 4.4 44.41 ± 5..04 0.79 ± 0.25 11.14 ± 4.50 58.59 ± 19.68 0.24 ± 0.07 52.3 ± 20.4
NL700 60.35 ± 23.11 13.60 ± 2.47 37.2 ± 8.2 0.67 ± 0.29 7.14 ± 2.22 47.5 ± 16.32 0.17 ± 0.05 35.2 ± 7.43
NL1500 76.2 ± 30.4 20.9 ± 5.7 44.5 ± 4.5 0.89 ± 0.29 10.5 ± 2.6 68.5 ± 20.6 0.20 ± 0.08 56.5 ± 19.7
NC100 38.05 ± 8.4 16.5 ± 2.8 39.9 ± 10.0 0.93 ± 0.3 12.4 ± 3.37 53.24 ± 6.9 0.19 ± 0.06 46.2 ± 20.3
NC500 34.1 ± 7.5 12.4 ± 1.3 30.2 ± 9.1 0.80 ± 0.32 6.2 ± 2.04 47.3 ± 10.01 0.17 ± 0.04 42.2 ± 15.6
NC1000 48.5 ± 16.9 17.6 ± 4.9 37.6 ± 4.6 0.89 ± 0.28 11.8 ± 1.88 48.9 ± 11.4 0.19 ± 0.06 50.1 ± 18.68
WC100 35.8 ± 7.9 16.1 ± 4.7 58.6 ± 6.9 0.68 ± 0.33 11.6 ± 3.01 54.9 ± 7.8 0.25 ± 0.08 49.5 ± 13.3
WC500 51.6 ± 25.4 11.35 ± 2 47.06 ± 12.5 0.81 ± 0.33 8.8 ± 1.7 52.5 ± 13.8 0.20 ± 0.05 36.4 ± 15.0
WC1000 68.13 ± 33.3 14.72 ± 2.5 48.91 ± 10.2 0.89 ± 0.34 10.49 ± 2.5 51.31 ± 5.9 0.20 ± 0.05 37.2 ± 12.5
WL100 67.5 ± 32.28 13.96 ± 1.59 37.20 ± 7.16 0.28 ± 0.07 13.03 ± 3.4 57.71 ± 7.9 0.25 ± 0.09 37.32 ± 12.31
WL500 47.7 ± 11.24 13. ± 2.35 36.08 ± 10.88 0.28 ± 0.10 12.44 ± 3.42 54.07 ± 7.95 0.30 ± 0.08 32.8 ± 10
WL1000 50.31 ± 5.53 15.69 ± 3.79 47.05 ± 8.60 0.62 ± 0.43 16.02 ± 3.97 58.23 ± 6.72 0.31 ± 0.07 35.1 ± 11.16
WT100 94.24 ± 37.13 16.81 ± 2.64 60.56 ± 4.21 0.95 ± 0.49 13.84 ± 3.07 72.1 ± 19.89 0.30 ± 0.09 49.8 ± 20.3
WT500 59.07 ± 14.02 12.1 ± 1.67 42.7 ± 5.51 0.73 ± 0.62 9.6 ± 2.3 53.46 ± 9.6 0.21 ± 0.02 33 ± 12.51
WT1000 78.3 ± 33.6 17.6 ± 6.77 45.9 ± 5.26 1.26 ± 0.57 13.38 ± 1.40 71.55 ± 9.8 0.28 ± 0.05 40.02 ± 19.6
SK100 112.8 ± 19.16 40.6 ± 11.3 74.8 ± 8.32 1.55 ± 0.27 17.83 ± 5.68 85.92 ± 6.50 0.35 ± 0.05 126.7 ± 43.5
SK1000 106.01 ± 21.23 38.5 ± 10.4 68.3 ± 5.98 1.4 ± 0.41 16.08 ± 4.46 79.4 ± 13.4 0.32 ± 0.05 126.9 ± 43.6
SK2000 42.38 ± 7.22 16.3 ± 1.7 45.07 ± 4. 0.91 ± 0.10 9.80 ± 2 74.7 ± 13.1 0.22 ± 0.01 52.8 ± 13.5
SL100 67.8 ± 21.8 14.9 ± 2.37 50 ± 10.03 0.84 ± 0.38 12.2 ± 3.93 50.8 ± 10.72 0.20 ± 0.05 52.15 ± 17.66
SL1000 50.27 ± 7.87 19.03 ± 3.94 47.68 ± 7.05 0.89 ± 0.33 12.18 ± 2.29 68.21 ± 16.27 0.21 ± 0.06 53.9 ± 16.7
SL2000 40.2 ± 8.2 16.27 ± 2.26 41.34 ± 3.8 0.57 ± 0.09 7.58 ± 2.36 52.4 ± 12.09 0.19 ± 0.001 47.57 ± 11.4
Minimum 34.1 ± 7.5 40.6 ± 11.3 74.8 ± 8.32 0.28 ± 0.07 6.2 ± 2.04 47.5 ± 16.32 0.17 ± 0.05 32.8 ± 10
Maximum 112.8 ± 19.16 11.35 ± 2 30.2 ± 9.1 1.55 ± 0.27 17.83 ± 5.6 85.92 ± 6.50 0.35 ± 0.05 126.9 ± 43.6
Environ Earth Sci
123
Author's personal copy
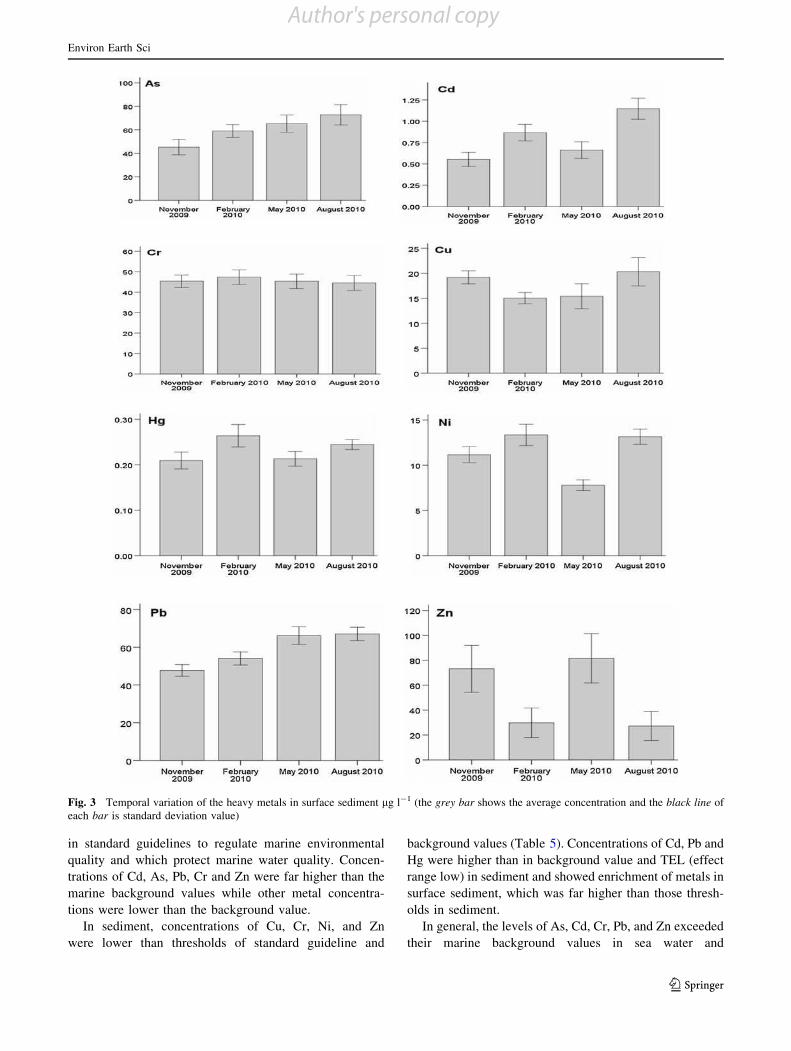
in standard guidelines to regulate marine environmental
quality and which protect marine water quality. Concen-
trations of Cd, As, Pb, Cr and Zn were far higher than the
marine background values while other metal concentra-
tions were lower than the background value.
In sediment, concentrations of Cu, Cr, Ni, and Zn
were lower than thresholds of standard guideline and
background values (Table 5). Concentrations of Cd, Pb and
Hg were higher than in background value and TEL (effect
range low) in sediment and showed enrichment of metals in
surface sediment, which was far higher than those thresh-
olds in sediment.
In general, the levels of As, Cd, Cr, Pb, and Zn exceeded
their marine background values in sea water and
Fig. 3 Temporal variation of the heavy metals in surface sediment lg l-1 (the grey bar shows the average concentration and the black line of
each bar is standard deviation value)
Environ Earth Sci
123
Author's personal copy
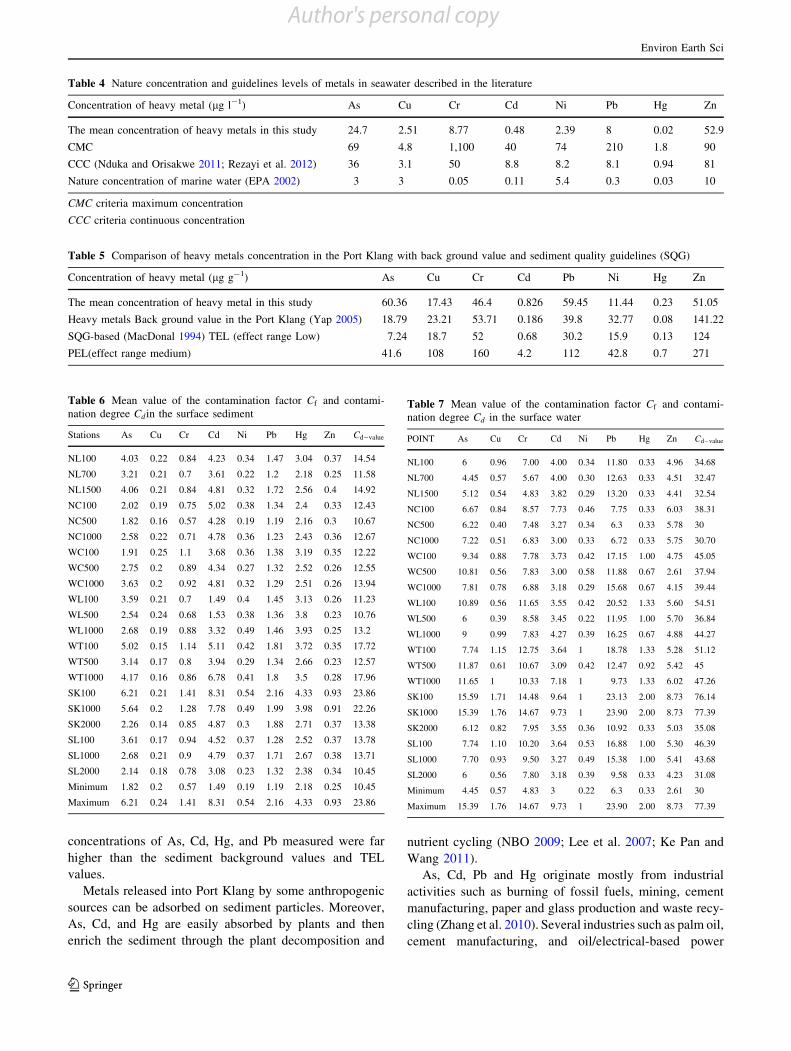
concentrations of As, Cd, Hg, and Pb measured were far
higher than the sediment background values and TEL
values.
Metals released into Port Klang by some anthropogenic
sources can be adsorbed on sediment particles. Moreover,
As, Cd, and Hg are easily absorbed by plants and then
enrich the sediment through the plant decomposition and
nutrient cycling (NBO 2009; Lee et al. 2007; Ke Pan and
Wang 2011).
As, Cd, Pb and Hg originate mostly from industrial
activities such as burning of fossil fuels, mining, cement
manufacturing, paper and glass production and waste recy-
cling (Zhang et al. 2010). Several industries such as palm oil,
cement manufacturing, and oil/electrical-based power
Table 4 Nature concentration and guidelines levels of metals in seawater described in the literature
Concentration of heavy metal (lg l-1) As Cu Cr Cd Ni Pb Hg Zn
The mean concentration of heavy metals in this study 24.7 2.51 8.77 0.48 2.39 8 0.02 52.9
CMC 69 4.8 1,100 40 74 210 1.8 90
CCC (Nduka and Orisakwe 2011; Rezayi et al. 2012) 36 3.1 50 8.8 8.2 8.1 0.94 81
Nature concentration of marine water (EPA 2002) 3 3 0.05 0.11 5.4 0.3 0.03 10
CMC criteria maximum concentration
CCC criteria continuous concentration
Table 5 Comparison of heavy metals concentration in the Port Klang with back ground value and sediment quality guidelines (SQG)
Concentration of heavy metal (lg g-1) As Cu Cr Cd Pb Ni Hg Zn
The mean concentration of heavy metal in this study 60.36 17.43 46.4 0.826 59.45 11.44 0.23 51.05
Heavy metals Back ground value in the Port Klang (Yap 2005) 18.79 23.21 53.71 0.186 39.8 32.77 0.08 141.22
SQG-based (MacDonal 1994) TEL (effect range Low) 7.24 18.7 52 0.68 30.2 15.9 0.13 124
PEL(effect range medium) 41.6 108 160 4.2 112 42.8 0.7 271
Table 6 Mean value of the contamination factor Cf and contami-
nation degree Cdin the surface sediment
Stations As Cu Cr Cd Ni Pb Hg Zn Cd�value
NL100 4.03 0.22 0.84 4.23 0.34 1.47 3.04 0.37 14.54
NL700 3.21 0.21 0.7 3.61 0.22 1.2 2.18 0.25 11.58
NL1500 4.06 0.21 0.84 4.81 0.32 1.72 2.56 0.4 14.92
NC100 2.02 0.19 0.75 5.02 0.38 1.34 2.4 0.33 12.43
NC500 1.82 0.16 0.57 4.28 0.19 1.19 2.16 0.3 10.67
NC1000 2.58 0.22 0.71 4.78 0.36 1.23 2.43 0.36 12.67
WC100 1.91 0.25 1.1 3.68 0.36 1.38 3.19 0.35 12.22
WC500 2.75 0.2 0.89 4.34 0.27 1.32 2.52 0.26 12.55
WC1000 3.63 0.2 0.92 4.81 0.32 1.29 2.51 0.26 13.94
WL100 3.59 0.21 0.7 1.49 0.4 1.45 3.13 0.26 11.23
WL500 2.54 0.24 0.68 1.53 0.38 1.36 3.8 0.23 10.76
WL1000 2.68 0.19 0.88 3.32 0.49 1.46 3.93 0.25 13.2
WT100 5.02 0.15 1.14 5.11 0.42 1.81 3.72 0.35 17.72
WT500 3.14 0.17 0.8 3.94 0.29 1.34 2.66 0.23 12.57
WT1000 4.17 0.16 0.86 6.78 0.41 1.8 3.5 0.28 17.96
SK100 6.21 0.21 1.41 8.31 0.54 2.16 4.33 0.93 23.86
SK1000 5.64 0.2 1.28 7.78 0.49 1.99 3.98 0.91 22.26
SK2000 2.26 0.14 0.85 4.87 0.3 1.88 2.71 0.37 13.38
SL100 3.61 0.17 0.94 4.52 0.37 1.28 2.52 0.37 13.78
SL1000 2.68 0.21 0.9 4.79 0.37 1.71 2.67 0.38 13.71
SL2000 2.14 0.18 0.78 3.08 0.23 1.32 2.38 0.34 10.45
Minimum 1.82 0.2 0.57 1.49 0.19 1.19 2.18 0.25 10.45
Maximum 6.21 0.24 1.41 8.31 0.54 2.16 4.33 0.93 23.86
Table 7 Mean value of the contamination factor Cf and contami-
nation degree Cd in the surface water
POINT As Cu Cr Cd Ni Pb Hg Zn Cd�value
NL100 6 0.96 7.00 4.00 0.34 11.80 0.33 4.96 34.68
NL700 4.45 0.57 5.67 4.00 0.30 12.63 0.33 4.51 32.47
NL1500 5.12 0.54 4.83 3.82 0.29 13.20 0.33 4.41 32.54
NC100 6.67 0.84 8.57 7.73 0.46 7.75 0.33 6.03 38.31
NC500 6.22 0.40 7.48 3.27 0.34 6.3 0.33 5.78 30
NC1000 7.22 0.51 6.83 3.00 0.33 6.72 0.33 5.75 30.70
WC100 9.34 0.88 7.78 3.73 0.42 17.15 1.00 4.75 45.05
WC500 10.81 0.56 7.83 3.00 0.58 11.88 0.67 2.61 37.94
WC1000 7.81 0.78 6.88 3.18 0.29 15.68 0.67 4.15 39.44
WL100 10.89 0.56 11.65 3.55 0.42 20.52 1.33 5.60 54.51
WL500 6 0.39 8.58 3.45 0.22 11.95 1.00 5.70 36.84
WL1000 9 0.99 7.83 4.27 0.39 16.25 0.67 4.88 44.27
WT100 7.74 1.15 12.75 3.64 1 18.78 1.33 5.28 51.12
WT500 11.87 0.61 10.67 3.09 0.42 12.47 0.92 5.42 45
WT1000 11.65 1 10.33 7.18 1 9.73 1.33 6.02 47.26
SK100 15.59 1.71 14.48 9.64 1 23.13 2.00 8.73 76.14
SK1000 15.39 1.76 14.67 9.73 1 23.90 2.00 8.73 77.39
SK2000 6.12 0.82 7.95 3.55 0.36 10.92 0.33 5.03 35.08
SL100 7.74 1.10 10.20 3.64 0.53 16.88 1.00 5.30 46.39
SL1000 7.70 0.93 9.50 3.27 0.49 15.38 1.00 5.41 43.68
SL2000 6 0.56 7.80 3.18 0.39 9.58 0.33 4.23 31.08
Minimum 4.45 0.57 4.83 3 0.22 6.3 0.33 2.61 30
Maximum 15.39 1.76 14.67 9.73 1 23.90 2.00 8.73 77.39
Environ Earth Sci
123
Author's personal copy
generation release waste into Port Klang. Moreover, these
metals might be released by atmospheric deposition, terres-
trial runoffs, and tsunami sediment deposition, which are the
main routes of metal into marine environment. Boat docking
and corrosion of ships, organic insecticides (lead-arsenate),
pesticides, and fertilizers applied in agriculture activities are
other sources of pollution in the Port Klang coastal waters.
Metal contamination level in water and sediment
Contamination factor Cf and contamination degree Cd are
applied to assess the state of conservation of an environ-
ment and to monitor its condition (Fishbein 1981; Jennings
and Rainbow 1979; Cossa et al. 2010; Ke Pan and Wang
2011; Davis et al. 2009). Tables 6 and 7 show variations of
contamination factor and contamination degree in water
and sediment. In general, the highest values of contami-
nation degree and contamination factor were estimated at
stations SK100 and SK1000 in water and sediment. The
Cf values for all metals follow this sequences in the sedi-
ment: Cu\Ni\Zn\Cr\Pb\Hg\As\Cd while
the sequence of Cf-value in water was Ni\Hg\Cu\
Cd\Zn\As\Cr\ Pb.
The differences between contamination factor sequences
of water and sediment can be related to physicochemical
parameters, which control the rate of adsorption and
desorption of heavy metals. All heavy metals exist in
surface waters in particulate colloidal, and dissolved pha-
ses, but the dissolved concentration are generally low. The
particulate and colloidal metal can be found in hydroxides,
silicates oxides, or adsorbed to silica, clay, or organic
material. Adsorption removes the heavy metal from the
water and stores the metal in the sediment. Desorption
sends back the metal to the water column where recircu-
lation and bio-assimilation may take place (Conti and
Cecchetti 2001). Several researches showed that salinity,
pH and solubility product (Ksp) of each metal are main
parameters to control concentration of dissolved metals in
water column. For example, increased metal concentration
may be affected by increase in salinity, decrease in redox
potential, and decrease in pH. Elevated salt concentrations
create increased competition between cations and metals
for binding sites (Nduka and Orisakwe 2011). This is
typical in coastal regions and estuaries because of fluctu-
ating river flow inputs and land-based discharges, as seen
in Klang Strait coastal water. From this study, the acidity
(pH) level seemed to have no effect on the metal concen-
tration because the pH is within acceptable international
standard for surface water. Fluctuation of salinity espe-
cially in South Port may have affected rate of adsorption
and desorption of metals to and from sediments, and have
caused the different sequence of contamination factor in
water and sediment.
In sediment, the Cf values for Cu, Cr, Ni, and Zn were
less than 1 and were found at an unpolluted level at all
stations. The contamination factor for Pb appeared mod-
erate at all stations and Cf-value for Hg and As were on the
borderline between moderately polluted to high level pol-
luted. The contamination factor for Cd at all stations
(except at stations WL100, WL500) was found between
high and very highly polluted. Contamination degrees at
the WT100, WT1000, SK100 and SK1000 stations were
high whereas Cd-value indicates moderate pollution in
other stations in the Port Klang.
In water, based on the data shown in Table 7, the Cf-
value for Cu, Ni and Hg was lower than 1, and was
observed in unpolluted levels at all stations except at the
SK100, SK1000, WT100, and WT1000, which showed
moderate pollution. Contamination factors for As, Cr, Cd,
and Zn were between considerably polluted to very high
level of pollution, while Pb was at a very highly polluted
level at all stations. Contamination degrees for stations
SL2000, NC1500, and NC700 showed considerable con-
tamination whereas it was in a very high degree of con-
tamination at other stations.
In general, the highest contamination degree of all of the
metals (except for Mn) were determined at South Port at
stations SK100 and SK1000, which are parallel to the
mouth of the Klang River, and at station WT100 around the
container terminal in the West Port. As a result, the sig-
nificant contamination degree showed that multiple sources
greatly contributed to the contaminant loads in Klang
Strait. These sources included industrial inflow, such as the
palm oil, cement and food manufacturers that are located
along the coastline of North and West Port, vessel-based
discharges and Klang River. The contamination factor (Cf)
also indicated that all of the metal concentration were
influenced by anthropogenic inputs, especially very toxic
elements, such as As, Cd, Hg and Pb, which were enriched
at high levels at stations close to the berth line and the
mouth of the Klang River.
Conclusion
Heavy metal pollution in Port Klang water and sediments
has increased because of the rapid industrialization and
urbanization in recent decades. The study area was divided
into different stations, with different metal contamination
degrees. The results indicate that in South Port, stations are
located in the riparian zone of the Klang River which
predominantly flowed through South Port. It could be an
indication that the high level contamination of metals in
these stations comes from an anthropogenic source because
high concentrations of metals were released continuously
into the Klang River from chemical factories, urban
Environ Earth Sci
123
Author's personal copy
effluents due to high density of human settlements, and
agriculture activities. Moreover, in West Port, stations
close to container terminal showed the high level of con-
tamination because these stations are influenced by indus-
trial discharge along the coastline, leakage or emissions of
petrol due to busy marine transport, and atmospheric
depositions.
The study indicates that the potential contamination of
Cd, As, Pb, and Hg were between moderate and high
contamination in sediments while the rest of the metals
were at an unpolluted level in the sediments at all stations.
Metals with above normal concentrations in sediments can
be considered as a serious threat to marine organisms and
human health, especially As, because its concentration is
significantly greater than effect range medium value. In
addition, these data revealed that some elements such as
As, Cd, Cr, Zn, and Pb, were enriched in water and their
level of contamination varied between considerable and
very high levels at all stations. In summary, the present
study provides baseline data for interpretation of variations
in heavy metal concentration in water and sediment and
traces contamination routes of metal in the Port Klang.
These data can also be used as a contribution to long-term
monitoring of heavy metal pollutants in Port Klang.
Acknowledgments This study was supported by the University
Malaya Research grant (UMRG) with project number RG174/12SUS
and by the University Malaya Postgraduate Research Grant (PPP).
References
Aydin OnenS, Kucuksezgin F, Kocak F (2011) Temporal and spatial
biomonitoring of heavy metals in eastern Aegean coastal waters
using Amphibalanus amphitrite. Mar Pollut Bull 62:2548–2556
Bowen H. J. M. (1966) Trace element in biochemistry. Academic
press, London
Chong VC, Sasekumar A, Leh MUC, D’Cruz R (1990) The fish and
prawn communities of a Malaysian coastal mangrove system.
With comparisons to adjacent mudflats and inshore waters. Est
Coasta Shelf Science 31:703–722
Conti ME, Cecchetti G (2001) Biological monitoring: lichens as
bioindicators of air pollution assessment—a review. Environ
Pollut 114:471–492
Cossa D, Radakovitch O, Bouloubassi I, Bancon-Montigny C, Cadiou
J, Charmasson S, Dachs J, Elbaz-Poulichet F, Fowler S, Gonzalez
J (2010) Marine Ecosystems Responses to climatic and anthro-
pogenic forcings in the Mediterranean. Docteur en Sciences
Cunha-Lignon M, Coelho-Jr C, Almeida R, Menghini R, Correa F,
Schaeffer-Novelli Y, Cintron-Molero G, Dahdouhguebas F
(2009) Mangrove forests and sedimentary processes on the
south coast of Sao Paulo State (Brazil). J coast Res 56 (Special)
Davis HT, Marjorie Aelion C, McDermott S, Lawson AB (2009)
Identifying natural and anthropogenic sources of metals in urban
and rural soils using GIS-based data, PCA, and spatial interpo-
lation. Environ Pollut 157(8–9):2378–2385
EPA (1996) EPA method 3052 microwave assisted acid, digestion of
siliceous and organically based matrices. Report number sw
846-ch 3.2
EPA U (2002) (United States Environmental Protection Agency)
National Recommended Water Quality Criteria EPA-822-R-02-
047, Office of Science and Technology
Fishbein L (1981) Sources, transport and alterations of metal
compounds: an overview. I. Arsenic, beryllium, cadmium,
chromium, and nickel. Environ Health Perspect 40:43
Furukawa K, Wolanski E, Mueller H (1997) Currents and sediment
transport in mangrove forests. Estuar Coast Shelf Sci 44(3):301–
310
Gao X, Chen C-TA, Wang G, Xue Q, Tang C, Chen S (2009)
Environmental status of day a bay surface sediments inferred
from a sequential extraction technique. Estuar Coast Shelf Sci
86:369–378
Gleyzes C, Tellier S, Astruc M (2002) Fractionation studies of trace
elements in contaminated soils and sediments: a review of
sequential extraction procedures. Trends Anal Chem 21:451–567
Hakanson L (1980) An ecological risk index for aquatic pollution
control. A sedimentological approach. Water Res 14(8):975–
1001
He Z, Song J, Zhang N, Zhang P, Xu Y (2009) Variation
characteristics and ecological risk of heavy metals in the south
Yellow Sea surface sediments. Environ Monit Assess 157:515–
528
IDEM (2002) Quality assurance manual Indiana waste water labo-
ratories 91: 20–29
Ilander A, Vaisanen A (2007) An ultrasound-assisted digestion
method for the determination of toxic element concentrations in
ash samples by inductively coupled plasma optical emission
spectrometry. Anal Chim Acta 602(2):195–201
Ismail Z, Beddri A (2009) Potential of water hyacinth as a removal
agent for heavy metals from petroleum refinery effluents. Water
Air Soil Pollut 199(1):57–65
Jennings J, Rainbow P (1979) Studies on the uptake of cadmium by
the crab Carcinus maenas in the laboratory I. Accumulation from
seawater and a food source. Mar Biol 50(2):131–139
Kassim A, Rezayi M, Ahmadzadeh S, Rounaghi G, Mohajeri M,
Yusof NA, Tee TW, Heng LY., Abdullah AH (2011) A novel
ion–selective polymeric membrane sensor for determining
thallium (I) with high selectivity. Vol. 17, 012010: IOP
Publishing
Kathiresan K (2003) How do mangrove forests induce sedimentation?
Rev Biol Trop 51(2):355–360
Ke Pan, Wang WX (2011) Trace metal contamination in estuarine
and coastal environment in china. Sci total environ
Lee CSL, Li XD, Zhang G, Li J, Ding AJ, Wang T (2007) Heavy
metals and Pb isotopic composition of aerosols in urban and
suburban areas of Hong Kong and Guangzhou, South China–
Evidence of the long-range transport of air contaminants. Atmos
Environ 41(2):432–447
Li J, He M, Sun S, Han W, Zhang Y, Mao X, Gu Y (2009) Effect of
the behavior and availability of heavy metals on the character-
istics of the coastal soils developed from alluvial deposits.
Environ Monit Assess 156(1):91–98
Lim D, Jung H, Choi J, Yang S, Ahn K (2006) Geochemical
compositions of river and shelf sediments in the Yellow Sea:
grain-size normalization and sediment provenance. Cont Shelf
Res 26(1):15–24
MacDonal (1994) Approach to the assessment of sediment quality in
florida coastal water. Volum 5-derivation of numerical sediment
quality assessment guideline for florida coastal water using the
weight of evidence approch. Florida department of environment
protection. Ladysmith
NBO (2009) National Bureau of Oceanography of China. Bulletin of
marine environment quality 2008–2009
Nduka JK, Orisakwe OE (2011) Water-quality issues in the Niger
Delta of Nigeria: a look at heavy metal levels and some
Environ Earth Sci
123
Author's personal copy
physicochemical properties. Environ Sci Pollut Res 18(2):237–
246
Nobi EP, Dilipan E, Thangaradjou T, Sivakumar K, Kannan L (2010)
Geochemical and geo-statistical assessment of heavy metal
concentration in the sediments of different coastal ecosystems of
Andaman Islands, India. Estuar Coast Shelf Sci 87:253–264
Olubunmi FE, Olorunsola OE (2010) Evaluation of the status of
heavy metal pollution of sediment of Agbabu Bitumen deposit
area, Nigeria. Eur j Sci res: 373–382
Parris RM, Schantz MM, Wise SA (1998) NIST/NOAA NS and
T/EPA EMAP intercomparison exercise program for organic
contaminants in the marine environment: description and results
of 1997 organic intercomparison exercises. National status and
trends program for marine environmental quality: technical
memo. National Ocean Service, Office of Ocean Resources
Conservation and Assessment, Silver Spring, MD (United
States); National Inst. of Standards and Technology, Analytical
Chemistry Div., Gaithersburg, MD (United States)
Pekey H (2006) Heavy metal pollution assessment in sediments of the
Izmit bay, Turkey. Environ Monit Assess 123:219–231
Qin YS, Zhao YY, Chen LR (1989) The geography southern yellow
sea. Beijing marine: 20–28
Rezayi M, Ahmadzadeh S, Kassim A, Heng LY (2011) Thermody-
namic Studies of Complex Formation Between Co (SALEN)
Ionophore with Chromate (II) Ions in AN-H2O Binary Solutions
by The Conductometric Method. Int J Electrochem Sci 6:6350–
6359
Rezayi M, Lee YH, Kassim A, Ahmadzadeh S, Abdollahi Y,
Jahangirian H (2012) Immobilization of tris (2 pyridyl)
methylamine in PVC-membrane sensor and characterization of
the membrane properties. Chem Cent J 6(1):40
Sahuquillo A, Rigol A, Rauret G (2003) Overview of the use of
leaching/extraction tests for risk assessment of trace metals in
contaminated soils and sediments. Trends Anal Chem 22:
152–159
Schantz MM, Kucklick JR, Parris RM, Poster DL, Wise SA (2005)
NIST intercomparison exercise program for organic contami-
nants in the marine environment: description and results of 2005
organic intercomparison exercises. National Institute of Standard
and Technology
Sultan K, Shazili NA (2009) Distribution and geochemical baselines
of major, minor and trace elements in tropical topsoils of the
Terengganu Riverbasin. Malaysia J Geochem Explor 103:57–68
Tam N, Wong Y (2000) Spatial variation of heavy metals in surface
sediments of Hong Kong mangrove swamps. Environ Pollut
110(2):195–205
Wolanski E, Mazda Y, Ridd P (1992) Mangrove hydrodynamics.
Tropical mangrove ecosystems: 43–62
Woodroffe C (1992) Mangrove sediments and geomorphology.
Tropical mangrove ecosystems: 7–42
Yap SY (2005) Pollution. In: Sasekumar A, Chong VC (eds) Ecology
of Klang Strait. Faculty of Science, University of Malaya, 50603
Kuala Lumpur. pp 225–235
Zhang H, Cui B, Xiao R, Zhao H (2010) Heavy metals in water, soils
and plants in riparian wetlands in the Pearl River Estuary, South
China. Procedia Environ Sci 2:1344–1354
Environ Earth Sci
123
Author's personal copy
Related Documents