1 23 Journal of Medical Toxicology ISSN 1556-9039 Volume 7 Number 1 J. Med. Toxicol. (2011) 7:24-32 DOI 10.1007/ s13181-010-0113-7 A Bland–Altman Comparison of the Lead Care® System and Inductively Coupled Plasma Mass Spectrometry for Detecting Low-Level Lead in Child Whole Blood Samples

Welcome message from author
This document is posted to help you gain knowledge. Please leave a comment to let me know what you think about it! Share it to your friends and learn new things together.
Transcript
1 23
Journal of MedicalToxicology ISSN 1556-9039Volume 7Number 1 J. Med. Toxicol. (2011) 7:24-32DOI 10.1007/s13181-010-0113-7
A Bland–Altman Comparison of the LeadCare® System and Inductively CoupledPlasma Mass Spectrometry for DetectingLow-Level Lead in Child Whole BloodSamples
1 23
Your article is protected by copyright and
all rights are held exclusively by American
College of Medical Toxicology. This e-offprint
is for personal use only and shall not be self-
archived in electronic repositories. If you
wish to self-archive your work, please use the
accepted author’s version for posting to your
own website or your institution’s repository.
You may further deposit the accepted author’s
version on a funder’s repository at a funder’s
request, provided it is not made publicly
available until 12 months after publication.
TOXICOLOGY INVESTIGATION
A Bland–Altman Comparison of the Lead Care® Systemand Inductively Coupled Plasma Mass Spectrometryfor Detecting Low-Level Lead in Child Whole Blood Samples
Christina Sobin & Natali Parisi & Tanner Schaub &
Eva de la Riva
Published online: 1 October 2010# American College of Medical Toxicology 2010
Abstract Chronic childhood lead exposure, yielding bloodlead levels consistently below 10 μg/dL, remains a majorpublic health concern. Low neurotoxic effect thresholdshave not yet been established. Progress requires accurate,efficient, and cost-effective methods for testing largenumbers of children. The LeadCare® System (LCS) mayprovide one ready option. The comparability of this systemto the “gold standard” method of inductively coupledplasma mass spectrometry (ICP-MS) for the purpose ofdetecting blood lead levels below 10 μg/dL has not yetbeen examined. Paired blood samples from 177 childrenages 5.2–12.8 years were tested with LCS and ICP-MS.Triplicate repeat tests confirmed that LCS and ICP-MS hadcomparable repeatability. As compared with ICP-MS, LCShad a negative bias of 0.457 μg/dL with an averagevariability of 1.0 μg/dL. The reproducibility and precision
of the LCS is appropriate for the evaluation and monitoringof blood lead levels of individual children in a clinicalsetting. Recent research however has suggested that incre-ments as small as 0.5 μg/dL may distinguish those at risk oflow-level lead-induced neurotoxicity. Thus, we also con-clude that the LCS is not useful for research applicationsattempting to identify neurotoxic effect thresholds forchronic lowest level lead exposure in children. For thesetypes of research applications, a convenient and low-costdevice is needed for the precise detection of child bloodlead levels below 10 μg/dL.
Keywords Pb . Inductively coupled plasma massspectrometry . Blood lead analysis . Bland–Altman .
Pediatric neurotoxicology
Introduction
Over 10,000 facilities across the USA emit from 1 to10,000 lb of lead particulates annually [1] contaminatinglocal air and soil. The current blood lead threshold fortoxicity is 10 μg/dL; however, increasing numbers ofstudies suggest that low-level environmental lead expo-sure yielding child blood lead levels consistently below10 μg/dL are associated with neurocognitive and motordeficits [2]. Children living in lower socio-economicconditions are at exponentially higher risk of leadexposure [3] suggesting a major health disparity withlife-long implications [4].
Understanding neurotoxic risk in cases of chronic low-level lead exposure requires wide-scale testing and moni-toring. Convenient, cost-effective devices that can providerapid, valid, and reliable low-level blood lead quantitationare needed. The portable LeadCare® System (LCS) anodic
C. Sobin (*)Border Biomedical Research Center, Toxicology Project,University of Texas,500 West University,El Paso, TX 79968, USAe-mail: [email protected]
C. Sobin : E. de la RivaDepartment of Psychology, Laboratory of NeurocognitiveGenetics and Developmental Neurocognition,University of Texas,El Paso, TX, USA
C. SobinLaboratory of Neuroendocrinology, The Rockefeller University,New York, NY, USA
N. Parisi : T. SchaubChemical Analysis and Instrumentation Laboratory,College of Agricultural, Consumer and Environmental Sciences,New Mexico State University,Las Cruces, NM, USA
J. Med. Toxicol. (2011) 7:24–32DOI 10.1007/s13181-010-0113-7
Author's personal copy
stripping voltammetry-based point-of-care device providesone option (ESA, Inc., Chelmsford, MA, USA). With alower detection limit of 1.4 μg/dL, this convenient low-costdevice offers an attractive possibility for studies of chroniclow-level lead exposure.
In clinical field trials conducted by ESA Biosciences(product insert information), the correlation of the LCSdevice and graphite furnace atomic absorption spectroscopy(GFAAS) reference method was 0.979 overall.
Results from independent studies comparing LCS toGFAAS have varied. In a study of 208 paired bloodsamples obtained from lead-exposed industry employees[5], LCS values indicated a positive bias. For values≤10 μg/dL (16/208) the mean difference was 3.41 μg/dL(±7.61); for values >10 μg/dL, the difference was substan-tially less (mean difference=0.57, SD ±5.35). When methoddifferences were plotted against GFAAS mean values, 95% ofdifferences fell within ±11 μg/dL; linear regression yielded anr2=0.67. Another study of 76 paired samples comparingLCS to GFAAS [6], reported r=0.95 (r2=0.90) overall forblood lead levels between 1.3 and 55 μg/dL; for blood leadvalues between 0 and 15 μg/dL (n=31) the correlation wassubstantially lower, r=0.697 (r2=0.486). In addition, overallthe 76 blood lead levels determined by LCS were signifi-cantly lower than those obtained via GFAAS (t=−7.73, p<0.001). These results were noted to be consistent with anearlier study that reported overall lower mean blood leadlevels for LCS as compared with GFAAS [7]. In anotherstudy of pregnant women and neonates comparing LCS toGFAAS [8], 95% of whom had blood lead levels below10 μg/dL; no correlation between methods was found.
Thus, comparison studies have used GFAAS as the “gold-standard” method. ICP-MS, a relatively newer detectionmethod, may offer several advantages over GFAAS. ICP-MS has greater dynamic range and sample throughput isapproximately twice that of GFAAS. Additionally, matrixinterference is reduced in ICP-MS, reproducibility is dramat-ically improved, and less sample is required for analyses.
Moreover, most past comparison studies relied oncorrelation and group comparison methods. The limitationsof these statistical approaches for examining the compara-bility of methods have been described [9]. For example, acomparison of means (e.g., paired t test or Wilcoxin non-parametric test) may suggest that the method means do notdiffer significantly; however, similar mean values can resultfrom pairs of measurements that differ broadly. For thisreason, a non-significant difference between method meansdoes not provide a measure of method comparability. Acorrelation coefficient is also problematic for comparison ofmethods. A correlation coefficient indicates only the amountof numeric agreement between two groups of numbers, notthe amount of difference between pairs of values. Correlationcannot reveal bias; and the magnitude of the correlation
coefficient (r) is strongly influenced by the range of valuesunder consideration, that is, smaller ranges tend to producesmaller r values. Moreover, the significance test forcorrelation is based on the hypothesis that the population ris zero; this hypothesis is irrelevant to the question ofwhether methods have sufficient agreement [9].
The Bland–Altman approach is a recommended alterna-tive to regression and group comparison methods [10]. TheBland–Altman approach plots the difference betweenmethod values (y-axis) against the average of methodvalues (x-axis), to provide an assessment of the level ofagreement between two methods. (The definition of asuitable level of agreement varies between clinical applica-tions.) Instrument bias is readily detected. The accuracy andprecision of the LCS system as compared to ICP-MS forthe detection of child blood lead levels below 10 μg/dLhave not yet been examined using this approach. Here, weapply the Bland–Altman approach to examine whether theLCS and ICP-MS agree sufficiently closely for thepurposes of detecting lead exposure below 10 μg/dL inchildren.
Materials and Methods
Blood Collection Procedures
Permission to conduct these studies was obtained from theEl Paso Independent School District Research Board andthis project was approved by the Institutional Review Boardof the University of Texas in El Paso. The sample wasdrawn from one elementary school located in downtown ElPaso, Texas. Participation was on a volunteer basis. Thechildren tested in this sample represented 34% of the totalnumber of enrolled children. Parents completed informedconsent prior to study initiation and all children completedinformed assent prior to blood draws.
Testers cleaned their hands with antiseptic foam soap andwore personal protective equipment during blood collection.At the start of the procedure, each child washed their handswith antiseptic foam soap and the fingers of the left hand werewiped clean with chelating towelettes specially formulated forindustry use to remove lead, and also nickel, silver, cadmium,and arsenic from the skin surface (D-Wipe™, Esca-Tech, Inc.Milwaukee, WI, USA). Saf-T-Pro™ 1.8 mm lancets wereused to prick the forth finger of the left hand. Blood collectedfrom the same draw was used to analyze the level ofcirculating blood lead by both the LCS and ICP-MS.
For LCS device analysis, blood was collected into a pre-measured 50 μl glass capillary, plunged into an ID labeledreagent vial, mixed by tipping the bottle ten times, andtested within 3 h of initial collection. For ICP-MS, anadditional 100 μl of blood was collected into a micro-vial
J. Med. Toxicol. (2011) 7:24–32 25
Author's personal copy
Mean (SD) (range) or %
Age 8.25 (±1.86)
(5.2–12.8)
Females 53.6
Right handed 94.3
Diagnosed learning disability 4.3
Attention problems 7.3
Annual family income
<10 K 52.9
10–20 K 39.5
20–30 K 3.8
>30 K 3.8
Size of household 5.0 (±1.7) (2–10)
Exposed to second-hand smoke in household 8.5
Parent level of education Mother Father
Completed grades 1–6 23.5 33.4
Some high school 25.9 22.2
High school graduate 26.5 27.8
Attended college 16.9 8.7
Attended Graduate School 7.2 7.9
Parent ethnicity
Mexican/Mexican-American 42.8 48.1
Hispanic 54.7 45.1
Latino 1.9 3.7
African-American 0.6 2.3
Anglo-American 0 0.8
Parent race
White 99.99 99.98
Black 00.01 00.02
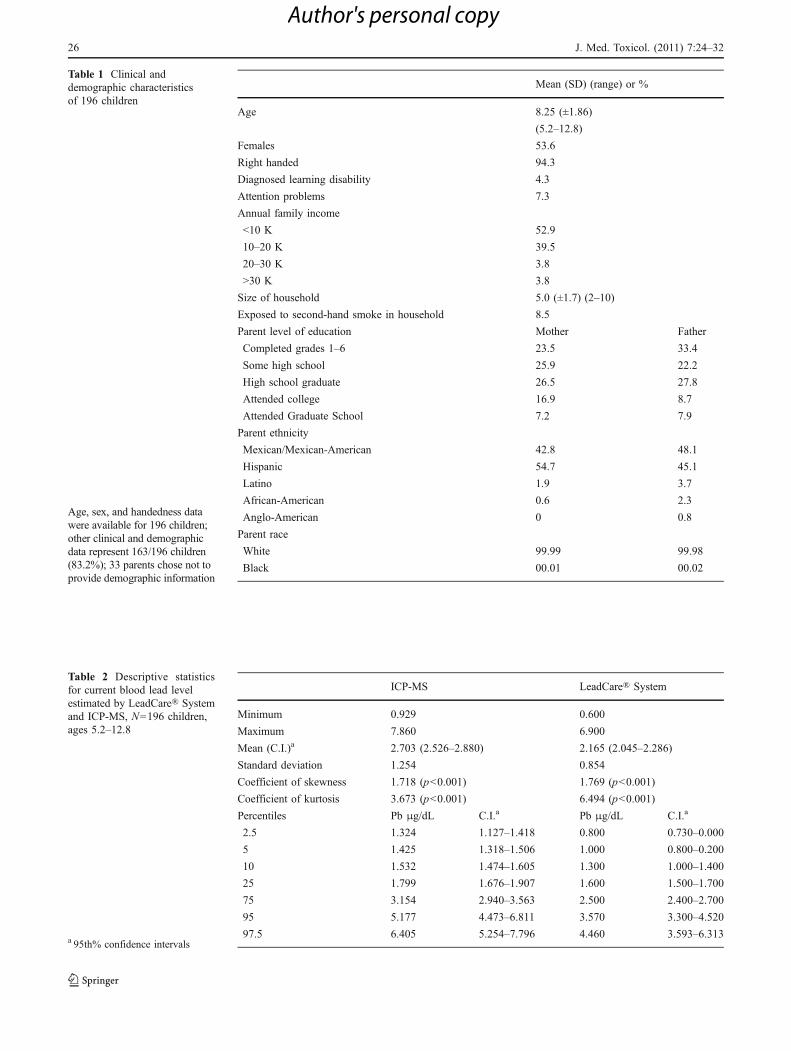
Table 1 Clinical anddemographic characteristicsof 196 children
Age, sex, and handedness datawere available for 196 children;other clinical and demographicdata represent 163/196 children(83.2%); 33 parents chose not toprovide demographic information
ICP-MS LeadCare® System
Minimum 0.929 0.600
Maximum 7.860 6.900
Mean (C.I.)a 2.703 (2.526–2.880) 2.165 (2.045–2.286)
Standard deviation 1.254 0.854
Coefficient of skewness 1.718 (p<0.001) 1.769 (p<0.001)
Coefficient of kurtosis 3.673 (p<0.001) 6.494 (p<0.001)
Percentiles Pb μg/dL C.I.a Pb μg/dL C.I.a
2.5 1.324 1.127–1.418 0.800 0.730–0.000
5 1.425 1.318–1.506 1.000 0.800–0.200
10 1.532 1.474–1.605 1.300 1.000–1.400
25 1.799 1.676–1.907 1.600 1.500–1.700
75 3.154 2.940–3.563 2.500 2.400–2.700
95 5.177 4.473–6.811 3.570 3.300–4.520
97.5 6.405 5.254–7.796 4.460 3.593–6.313
Table 2 Descriptive statisticsfor current blood lead levelestimated by LeadCare® Systemand ICP-MS, N=196 children,ages 5.2–12.8
a 95th% confidence intervals
26 J. Med. Toxicol. (2011) 7:24–32
Author's personal copy
and refrigerated until transfer to the ICP-MS laboratory,typically within 72 h.
LeadCare® System Analysis
Instrumentation
The LeadCare® System device is a hand-held instrument withan operational range of 0.0–65.0 μg/dL, and a lower detectionlimit of 1.4 μg/dL. (The LeadCare II®, released to market in2006, has a lower detection limit of 3.2 μg/dL). TheLeadCare® System (ESAMagellan Biosciences, Chelmsford,MA, USA) product information suggests that the instrument isreliable for the detection of blood lead levels up to 65.0 μg/dLand reports that in clinical field trials the correlation of theLCS device and GFAAS reference method was 0.979 overall.The LCS testing device electrochemically measures theamount of lead in whole blood via a 1.4×4.2 cm colloidalgold electrode [11] onto which a drop of the mixed sample isapplied. Two identical devices were used for this study. Theinstruments were calibrated at ESA, Inc. prior to shipment,
and low and high control samples (target ranges of 7.0±3.0and 28.5±4.0 μg/dL) were used for quality control at thebeginning and end of each test day. Calibration buttons,included with each reagent kit, were checked to confirm thatthe lot code detected by the device matched the codes on thereagent containers.
Sample Treatment and Analysis
All recommended procedures for use of the LCS devicewere followed. For each individual sample, 50 μl of fresh-drawn blood was plunged into the proprietary reagentwhich digests the red blood cells in the pre-measuredmatrix, thus releasing lead atoms for analysis. One drop ofthe mix was applied to the appropriate spot on the test strip,a push of the start button initiated the 3-min testing periodafter which the lead value was displayed on the electronicdisplay. Each value was immediately recorded on the vialand in a laboratory record book. All values were simulta-neously entered into an electronic database and laterchecked for accuracy. For test–retest comparability, three
ICP-MS LeadCare® System
Minimum 1.249 1.400
Maximum 7.860 6.900
Mean (C.I.)a 2.777 (2.584–2.971) 2.320 (2.200–2.439)
Standard deviation 1.286 0.793
Coefficient of Skewness 1.688 (p<0.001) 2.348 (p<0.001)
Coefficient of Kurtosis 3.400 (p<0.001) 8.827 (p<0.001)
Percentiles Pb μg/dL C.I.a Pb μg/dL C.I.a
2.5 1.348 1.267–1.485 1.400 1.400–1.500
5 1.482 1.327–1.573 1.500 1.400–1.508
10 1.587 1.514–1.658 1.600 1.500–1.600
25 1.833 1.706–1.951 1.800 1.700–2.000
75 3.275 3.000–3.669 2.600 2.500–2.737
95 5.282 4.629–6.831 3.690 3.300–4.604
97.5 6.811 5.281–7.827 4.520 3.680–6.604
Table 3 Current bloodlead level estimated byLeadCare® System andICP-MS, N=172 children,ages 5.2–12.8 (24 excludedfor values below LOD)
a 95th% confidence intervals
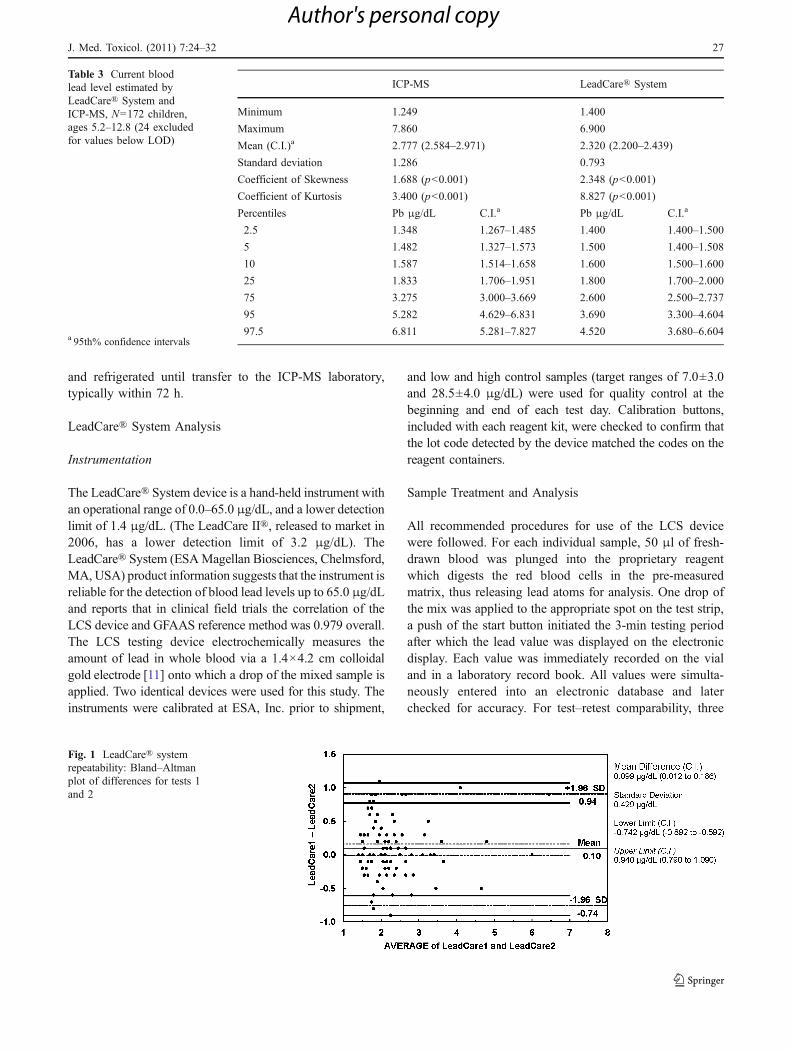
Fig. 1 LeadCare® systemrepeatability: Bland–Altmanplot of differences for tests 1and 2
J. Med. Toxicol. (2011) 7:24–32 27
Author's personal copy
consecutive tests of the same sample (i.e., three test stripsper child) were performed. All test–retest values wererecorded in the laboratory record book and in an electronicdatabase.
ICP-MS Analysis
Instrumentation
ICP-MS analyses were performed with an Agilent 7500ce ICP/MS equipped with an octopole reaction system and a CETACASX-520 autosampler. Detection of 208Pb was performedwithout the use of collision gas. Samples were introduced intothe plasma through a MicroMist U-series nebulizer (GlassExpansion, Australia) and a double-pass quartz spray chamber(Agilent, Santa Clara, CA, USA). Instrument parameterswere: carrier gas, 0.78 L/min; makeup gas, 0.15 L/min; RFpower, 1,420 W; spray chamber temperature, 2°C.
Sample Treatment and Analysis
Triplicate ICP-MS measurement requires more sample thancould be drawn from one child at a time using the finger-stickmethod. Therefore, certified whole blood standards (Le Centre
de Toxicologie du Quebec) were analyzed to determineinstrument reproducibility. Specifically, ten solutions wereprepared (see below) for each of two standards (4.00 and6.59 μg/dL) and each of those were analyzed three times byICP-MS. Standard concentrations were chosen to approximatethe low-level lead values of children.
Blood standards were prepared as previously described.(Agilent technical note #5988-0533EN) Briefly, 5.58 mL ofwater (18 MΩ DI, Labconco WaterPro® PS Station, KansasCity, MO, USA) was placed in a polypropylene tube intowhich 300 μL of whole blood was added, followed byaddition of 60 μL of aqueous internal standard solution(100 ppb each germanium, yttrium, and terbium in 5%nitric acid, Fisher Optima) and 60 μL of aqueous 10 ppmgold in 3% hydrochloric acid (EMD Chemicals) solution.The final dilution was 20-fold, the final internal standardconcentration was 1 ppb and the final gold concentrationwas 100 ppb. A six-point external calibration curve wasprepared from a lead stock solution in 1% nitric acid. ICP-MSstandard solutions containing the elements in 2% nitric acidwere obtained from Inorganic Ventures (Christiansburg, VA,USA). Samples were vortexed for a few seconds prior to a1 min centrifugation at 2,000 rcf and the supernatant analyzedby ICP-MS.
Fig. 2 LeadCare® systemrepeatability: Bland–Altmanplot of differences for tests 1and 3
-1.5
-1.0
-0.5
0.0
0.5
1.0
1 2 3 4 5 6 7
+1.96 SD
-1.96 SD
0.80
- 0.06
-0.92
Mean
AVERAGE of LeadCare2 and LeadCare3
Lea
dC
are2
- L
ead
Car
e3
Mean Difference (C.I.) -0.064 µg/dL (-0.154 to 0.025)
Standard Deviation 0.439 µg/dL
Lower Limit (C.I.) -0.924 µg/dL (-1.077 to -0.771)
Upper Limit (C.I.) 0.795 µg/dL (0.642 to 0.949)
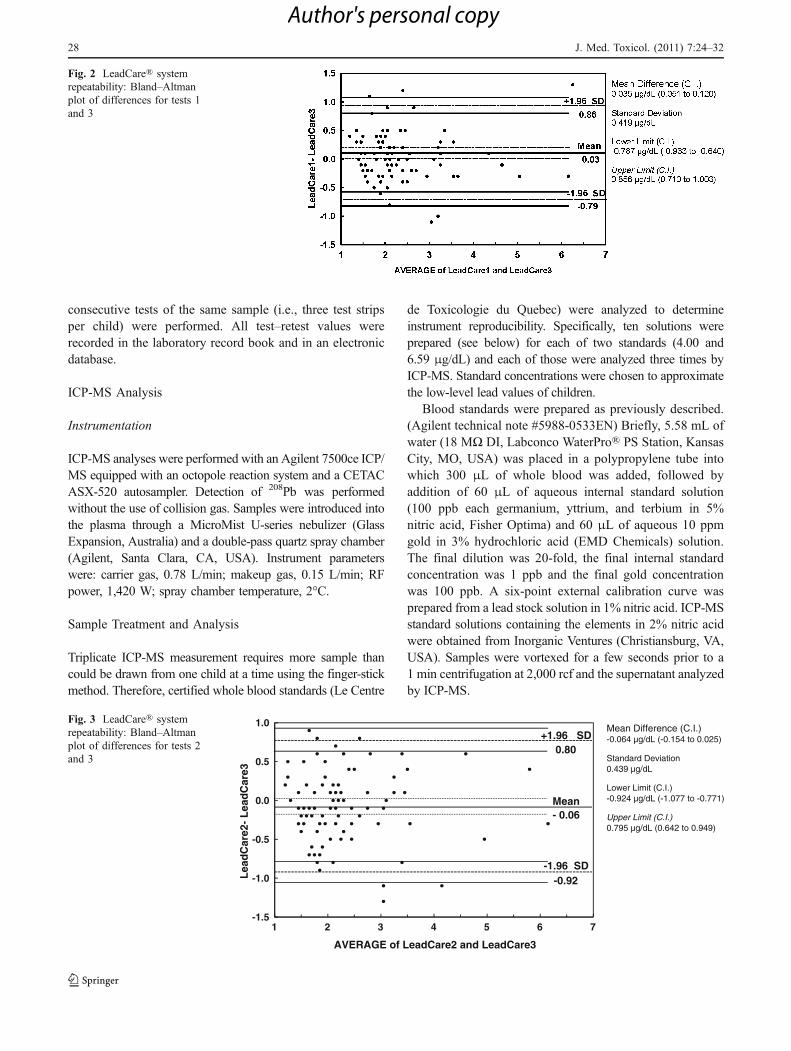
Fig. 3 LeadCare® systemrepeatability: Bland–Altmanplot of differences for tests 2and 3
28 J. Med. Toxicol. (2011) 7:24–32
Author's personal copy
Data Analysis
All data were combined into a single electronic databaseand checked for accuracy and outliers. MedCalc™ softwarewas used to conduct Bland–Altman tests of repeatabilitywithin methods, and comparability across methods. Thestatistical methods used in this study followed acceptedreporting standards for Bland–Altman analysis of methodcomparability [12] as summarized below.
Repeatability
The Bland–Altman approach assumes that the measure-ments to be compared have comparable repeatability(measurement error) given the units of measure examined.Measurement error for each instrument was assessed usingBland–Altman plots comparing differences between tripli-cate repeat measurements of the same sample for LCS andICP-MS. Because triplicate repeats were used, threedifference scores were calculated and then averaged. Forthis application a priori comparable repeatability wasdefined ≤0.1000 μg/dL average difference (for three runs).
A Priori Limits of Agreement
The limits of agreement between measurement approacheswere set before analyses were conducted and were based onthe clinical significance of the proposed variation. Thespecific blood lead level thresholds above which changes incognition and behavior can be expected to occur in a majorityof children are not yet known, thus the variation limitssurrounding these thresholds are also unknown. In the absenceof other knowledge, the previous approach to diagnosing“toxicity”was used as a logical benchmark. Lead “toxicity” isdefined in whole number values; most recently that thresholdwas set at 10 μg/dL [13, 14]. A clinical “worst case scenario”would be a false negative, that is, a child at risk of lead-induced neurotoxicity is not detected because of a negativebias in the instrumentation. Thus, using a 1 μg/dL interval asa differentiating threshold, in order to ensure that 95% ofchildren (i.e., ±2 SDs) are accurately detected, the meandifference should be less than 1 μg/dL; the standarddeviation of method differences should be non-significantand no greater than 0.5 μg/dL (2 SDs=±1.0 μg/dL); and biasshould be non-significant.
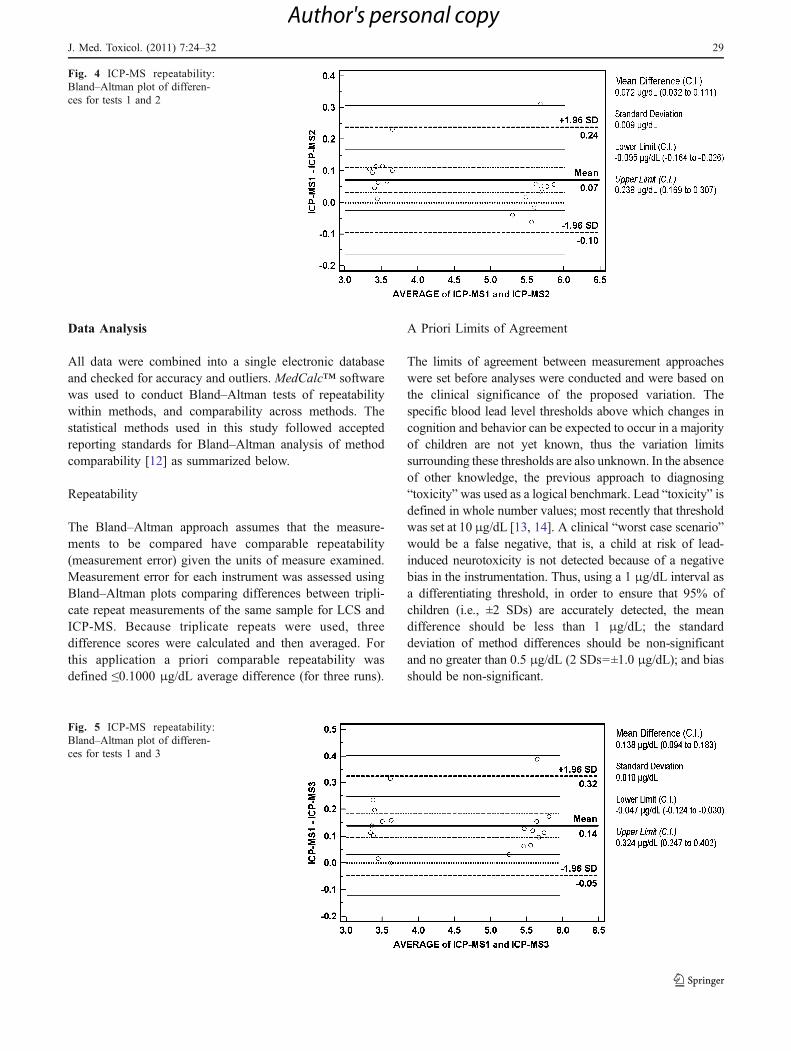
Fig. 4 ICP-MS repeatability:Bland–Altman plot of differen-ces for tests 1 and 2
Fig. 5 ICP-MS repeatability:Bland–Altman plot of differen-ces for tests 1 and 3
J. Med. Toxicol. (2011) 7:24–32 29
Author's personal copy
Plot of Difference Values
The x-axis values against which differences were plotted,equaled the average value of the two methods. Therelationship between measurement error and averagedifference values was determined, and confidence intervalswere calculated [15].
Results
Blood lead levels were measured in 196 children (91 males,105 females, mean age=8.25, ±1.86, range 5.2–12.8 years).Demographic characteristics of the sample are provided inTable 1. The LCS returned blood lead levels below itsreported lower limit of detection (1.4 μg/dL) for 24 children(12%) and these cases were excluded from comparabilityanalyses; 172 cases were analyzed for comparability (77males, 95 females, mean age=8.20±1.87, 5.2–12.8 years).
The distribution properties of blood lead levels obtained,including and excluding cases with LCS values below 1.4 μg/dL, are shown in Tables 2 and 3, respectively. Blood leadlevels determined by ICP-MS were higher. Both methods
yielded distributions that were positively skewed; significantkurtosis (peaking) was also apparent for both detectionsystems. The exaggerated skew and kurtosis noted for theLCS values resulted from truncating the lowest values.
Repeatability
Triplicate repeat analyses were examined for each deviceby plotting the differences (returned by each pair of testruns) against the mean. For the LCS, 107 triplicate repeatswere completed; 95 of these yielded blood lead levelsabove 1.4 μg/dL. The LCS system repeatability for test run1 vs. 2, 1 vs. 3, and 2 vs. 3 are illustrated in Figs. 1, 2, and3, respectively. The mean of differences for three runs was0.066 (CI=−0.064 to 0.111). The average standard devia-tion of differences was 0.429 μg/dL.
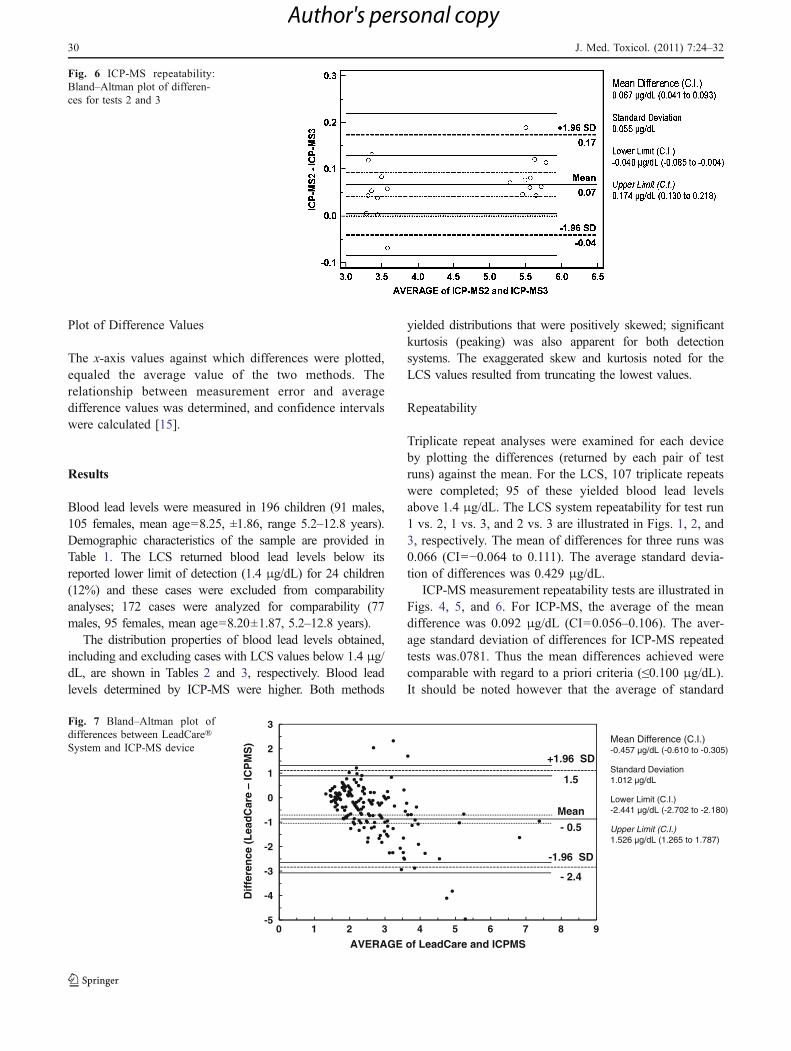
ICP-MS measurement repeatability tests are illustrated inFigs. 4, 5, and 6. For ICP-MS, the average of the meandifference was 0.092 μg/dL (CI=0.056–0.106). The aver-age standard deviation of differences for ICP-MS repeatedtests was.0781. Thus the mean differences achieved werecomparable with regard to a priori criteria (≤0.100 μg/dL).It should be noted however that the average of standard
Fig. 6 ICP-MS repeatability:Bland–Altman plot of differen-ces for tests 2 and 3
-5
-4
-3
-2
-1
0
1
2
3
0 1 2 3 4 5 6 7 8 9
+1.96 SD
-1.96 SD
1.5
- 0.5
- 2.4
Mean
AVERAGE of LeadCare and ICPMS
Dif
fere
nce
(L
ead
Car
e –
ICP
MS
) Mean Difference (C.I.) -0.457 µg/dL (-0.610 to -0.305)
Standard Deviation 1.012 µg/dL
Lower Limit (C.I.) -2.441 µg/dL (-2.702 to -2.180)
Upper Limit (C.I.) 1.526 µg/dL (1.265 to 1.787)
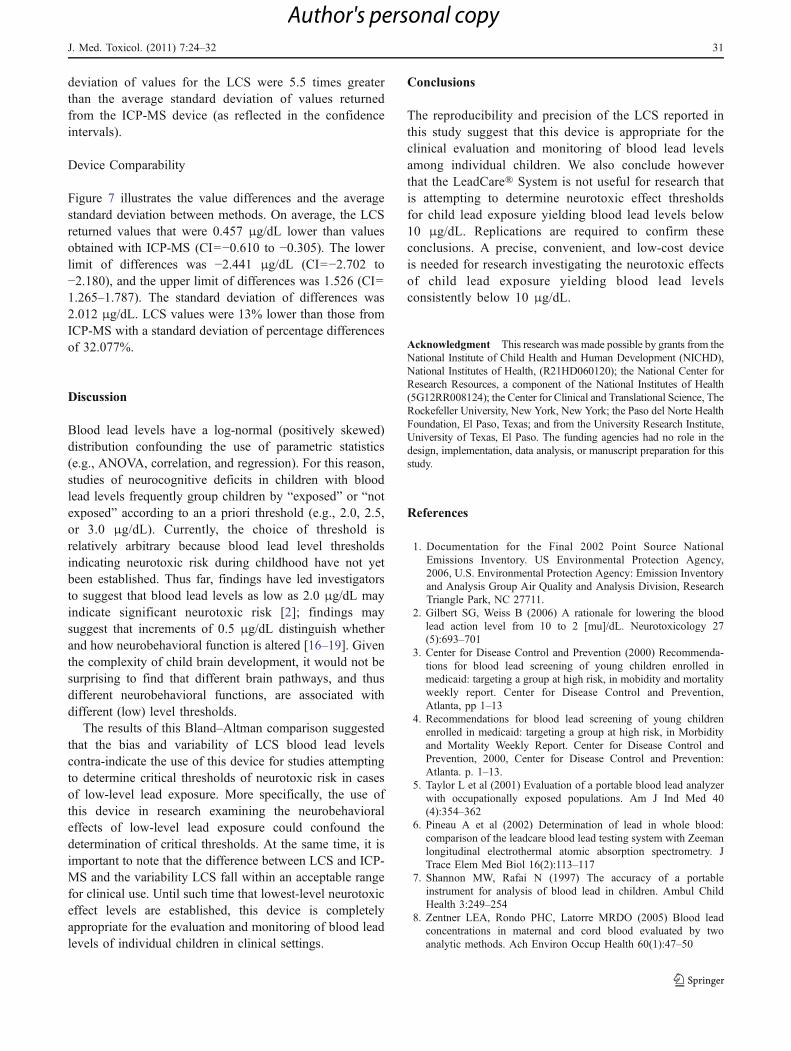
Fig. 7 Bland–Altman plot ofdifferences between LeadCare®System and ICP-MS device
30 J. Med. Toxicol. (2011) 7:24–32
Author's personal copy
deviation of values for the LCS were 5.5 times greaterthan the average standard deviation of values returnedfrom the ICP-MS device (as reflected in the confidenceintervals).
Device Comparability
Figure 7 illustrates the value differences and the averagestandard deviation between methods. On average, the LCSreturned values that were 0.457 μg/dL lower than valuesobtained with ICP-MS (CI=−0.610 to −0.305). The lowerlimit of differences was −2.441 μg/dL (CI=−2.702 to−2.180), and the upper limit of differences was 1.526 (CI=1.265–1.787). The standard deviation of differences was2.012 μg/dL. LCS values were 13% lower than those fromICP-MS with a standard deviation of percentage differencesof 32.077%.
Discussion
Blood lead levels have a log-normal (positively skewed)distribution confounding the use of parametric statistics(e.g., ANOVA, correlation, and regression). For this reason,studies of neurocognitive deficits in children with bloodlead levels frequently group children by “exposed” or “notexposed” according to an a priori threshold (e.g., 2.0, 2.5,or 3.0 μg/dL). Currently, the choice of threshold isrelatively arbitrary because blood lead level thresholdsindicating neurotoxic risk during childhood have not yetbeen established. Thus far, findings have led investigatorsto suggest that blood lead levels as low as 2.0 μg/dL mayindicate significant neurotoxic risk [2]; findings maysuggest that increments of 0.5 μg/dL distinguish whetherand how neurobehavioral function is altered [16–19]. Giventhe complexity of child brain development, it would not besurprising to find that different brain pathways, and thusdifferent neurobehavioral functions, are associated withdifferent (low) level thresholds.
The results of this Bland–Altman comparison suggestedthat the bias and variability of LCS blood lead levelscontra-indicate the use of this device for studies attemptingto determine critical thresholds of neurotoxic risk in casesof low-level lead exposure. More specifically, the use ofthis device in research examining the neurobehavioraleffects of low-level lead exposure could confound thedetermination of critical thresholds. At the same time, it isimportant to note that the difference between LCS and ICP-MS and the variability LCS fall within an acceptable rangefor clinical use. Until such time that lowest-level neurotoxiceffect levels are established, this device is completelyappropriate for the evaluation and monitoring of blood leadlevels of individual children in clinical settings.
Conclusions
The reproducibility and precision of the LCS reported inthis study suggest that this device is appropriate for theclinical evaluation and monitoring of blood lead levelsamong individual children. We also conclude howeverthat the LeadCare® System is not useful for research thatis attempting to determine neurotoxic effect thresholdsfor child lead exposure yielding blood lead levels below10 μg/dL. Replications are required to confirm theseconclusions. A precise, convenient, and low-cost deviceis needed for research investigating the neurotoxic effectsof child lead exposure yielding blood lead levelsconsistently below 10 μg/dL.
Acknowledgment This research was made possible by grants from theNational Institute of Child Health and Human Development (NICHD),National Institutes of Health, (R21HD060120); the National Center forResearch Resources, a component of the National Institutes of Health(5G12RR008124); the Center for Clinical and Translational Science, TheRockefeller University, New York, New York; the Paso del Norte HealthFoundation, El Paso, Texas; and from the University Research Institute,University of Texas, El Paso. The funding agencies had no role in thedesign, implementation, data analysis, or manuscript preparation for thisstudy.
References
1. Documentation for the Final 2002 Point Source NationalEmissions Inventory. US Environmental Protection Agency,2006, U.S. Environmental Protection Agency: Emission Inventoryand Analysis Group Air Quality and Analysis Division, ResearchTriangle Park, NC 27711.
2. Gilbert SG, Weiss B (2006) A rationale for lowering the bloodlead action level from 10 to 2 [mu]/dL. Neurotoxicology 27(5):693–701
3. Center for Disease Control and Prevention (2000) Recommenda-tions for blood lead screening of young children enrolled inmedicaid: targeting a group at high risk, in mobidity and mortalityweekly report. Center for Disease Control and Prevention,Atlanta, pp 1–13
4. Recommendations for blood lead screening of young childrenenrolled in medicaid: targeting a group at high risk, in Morbidityand Mortality Weekly Report. Center for Disease Control andPrevention, 2000, Center for Disease Control and Prevention:Atlanta. p. 1–13.
5. Taylor L et al (2001) Evaluation of a portable blood lead analyzerwith occupationally exposed populations. Am J Ind Med 40(4):354–362
6. Pineau A et al (2002) Determination of lead in whole blood:comparison of the leadcare blood lead testing system with Zeemanlongitudinal electrothermal atomic absorption spectrometry. JTrace Elem Med Biol 16(2):113–117
7. Shannon MW, Rafai N (1997) The accuracy of a portableinstrument for analysis of blood lead in children. Ambul ChildHealth 3:249–254
8. Zentner LEA, Rondo PHC, Latorre MRDO (2005) Blood leadconcentrations in maternal and cord blood evaluated by twoanalytic methods. Ach Environ Occup Health 60(1):47–50
J. Med. Toxicol. (2011) 7:24–32 31
Author's personal copy
9. Bland, J.M., Altman, D.G. Statistical methods for assessingagreement between two methods of clinical measurement. Lancet,1986. i: p. 307–310.
10. Dewitte K et al (2002) Application of the Bland–Altman plot forinterpretation of method–comparison studies: a critical investiga-tion of its practice. Clin Chem 48(5):799–801
11. Wang J, Tian B (1992) Screen-printed stripping voltammetric/potentiometric electrodes for decentralized testing of trace lead.Anal Chem 64(15):1706–1709
12. Mantha S et al (2000) Comparing methods of clinical measure-ment: reporting standards for Bland and Altman analysis. AnesthAnalg 90(3):593–602
13. US Department of Health and Human Services (1991) Preventinglead poisoning in young children: a statement by the Centers forDisease Control, in Report No. 99-2230. Centers for DiseaseControl and Prevention. US Department of Health and HumanServices: Atlanta, GA.
14. Centers for Disease Control and Prevention (CDC) (1991)Preventing lead poisoning in young children: A statement by theUS Department of Health and Human Services. US GovernmentPrinting Office, Atlanta (No. 537).
15. Hamilton C, Stamey J (2007) Using Bland−Altman to assessagreement between two medical devices—don’t forget theconfidence intervals! J Clin Monit Computing 21(6):331–333
16. Chiodo LM et al (2007) Blood lead levels and specific attentioneffects in young children. Neurotoxicol Teratol 29(5):538–546
17. Chiodo LM, Jacobson SW, Jacobson JL (2004) Neurodevelop-mental effects of postnatal lead exposure at very low levels.Neurotoxicol Teratol 26(3):359–371
18. Min J-Y et al (2007) Neurobehavioral function in children withlow blood lead concentrations. Neurotoxicology 28(2):421–425
19. Surkan PJ et al (2007) Neuropsychological function in childrenwith blood lead levels <10 [mu]g/dL. Neurotoxicology 28(6):1170–1177
32 J. Med. Toxicol. (2011) 7:24–32
Author's personal copy
Related Documents