1 Foreword For many years, NICT has carried out calibration ser- vice for power meters with 75 Ω input impedance Type-N coaxial connectors as input terminals. NICT has con- ducted this for 10W calibration power, and frequency range from 1 to 500 MHz. Recent years have brought progress in higher frequency band usage in systems using 75 Ω char- acteristic impedance transmission lines, such as 4K and 8K TV broadcasts. To meet increasing demand for power measurement, we developed a calibration system for low power meters with a 75 Ω input impedance Type-N co- axial connector input, compatible with 1 mW calibration power and wider bands (100 kHz to 2 GHz). is paper describes the calibration method, advan- tages, calibration results, and calibration uncertainties of the calibration system developed. 2 Definitions of calibration factors Generally, terminal type high frequency power meters are divided into a sensor part and indicator part, as shown in Figure 1, and these parts are connected by a dedicated cable. Calibration of a power meter seeks the calibration factor K, which is the ratio of the indicator value displayed on the power meter (PM) vs. the power incident into the sensor part (Pin). e value of K is defined in the following equation. in M P P K (1) For example, in the case where PM is 0.99 mW and Pin is 1 mW, the calibration factor K is 0.99. If we know K, then PM/K = 0.99/0.99 = 1 mW, so we can obtain the inci- dent power from the indicator value and the calibration factor. 3 Calibration method 3.1 Calibration principles Figure 2 shows the configuration of the comparison method, which is the simplest method for calibrating high frequency power meters. In this method, the same signal input from the signal source is measured by a standard power meter for which the calibration factor (KSTD) is al- ready known. Aſter the indicator value ( M P STD ) is obtained, the standard power meter is replaced with the power meter to be calibrated (“Device Under Test” (DUT)), for which the calibration factor (KDUT) is unknown.) and measured. By obtaining the indicator value ( DUT M P ), we can then obtain the unknown KDUT by Equation (2). Incident power DUT DUT M STD STD M K P K P STD M DUT M STD DUT P P K K (2) Here, Equation (2) is for ideal conditions where the reference plane in Figure 2 has a reflection coefficient of 0. Actually, it is affected by the reflection coefficients of the power meter (ΓSTD, ΓDUT) and the reflection coefficient of Fig F 1 Configuration of high frequency power meter P in P M K Incident power Sensor part Indicator part 2-2-2 Power Meter Calibration 2 (1 mW, 75 Ω) Kojiro SAKAI, Tsutomu SUGIYAMA, Kouichi SEBATA, Iwao NISHIAYMA, and Katsumi FUJII NICT performs power meter calibration services in accordance with the Radio Law. Recently, a new power meter calibration system has been developed realizing a wide frequency range (from 100 kHz to 2 GHz) for 75-ohm (Type-N75) coaxial sensors with a typical power for calibration of 1 mW. In order to conduct accurate calibration, the simultaneous comparison method is adopted. The newly developed system has the expanded uncertainties (coverage factor k=2) of 2.5 % below 10 MHz and 1.2 % from 10 MHz to 2 GHz. 23 2 Research and Development of Calibration Technology

Welcome message from author
This document is posted to help you gain knowledge. Please leave a comment to let me know what you think about it! Share it to your friends and learn new things together.
Transcript
1 Foreword
For many years, NICT has carried out calibration ser-vice for power meters with 75 Ω input impedance Type-N coaxial connectors as input terminals. NICT has con-ducted this for 10W calibration power, and frequency range from 1 to 500 MHz. Recent years have brought progress in higher frequency band usage in systems using 75 Ω char-acteristic impedance transmission lines, such as 4K and 8K TV broadcasts. To meet increasing demand for power measurement, we developed a calibration system for low power meters with a 75 Ω input impedance Type-N co-axial connector input, compatible with 1 mW calibration power and wider bands (100 kHz to 2 GHz).
This paper describes the calibration method, advan-tages, calibration results, and calibration uncertainties of the calibration system developed.
2 Definitions of calibration factors
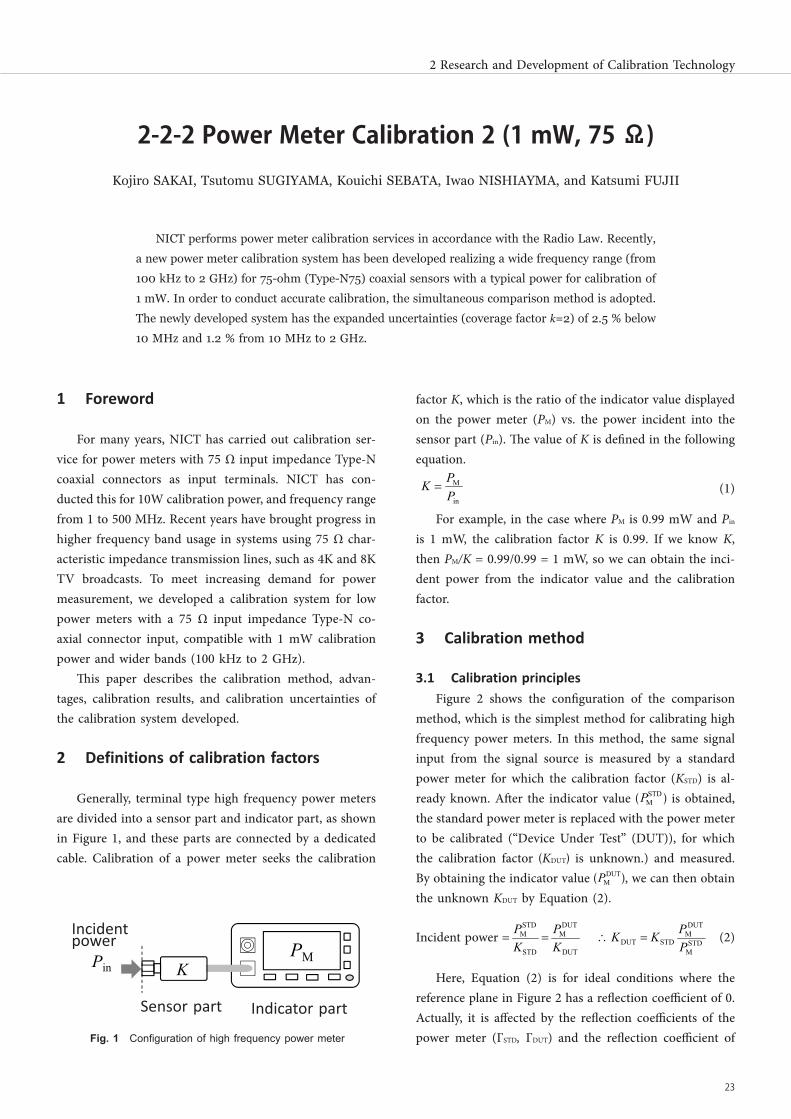
Generally, terminal type high frequency power meters are divided into a sensor part and indicator part, as shown in Figure 1, and these parts are connected by a dedicated cable. Calibration of a power meter seeks the calibration
factor K, which is the ratio of the indicator value displayed on the power meter (PM) vs. the power incident into the sensor part (Pin). The value of K is defined in the following equation.
1
2-2 高周波電力計の校正
2-2-2 高周波電力計の校正 2(1 mW, 75 )
酒井孝次郎 杉山 功 瀬端好一 西山 巌 藤井勝巳 要旨
NICT では電波法に基づき高周波電力計の校正を行っているが、入力インピーダンスが
75 の N 型同軸コネクタを入力端子とした高周波電力計のための広帯域(100 kHz から 2 GHz まで)小電力(1 mW)用校正システムを新たに開発した。校正は同時比較法を用い
て、その拡張不確かさ(包含係数k=2)は 10 MHz 未満で 2.5 %、10 MHz 以上で 1.2 %
である。
1 まえがき
NICT では、長年にわたり入力インピーダンス 75 の N 型同軸コネクタを入力端子とし
た電力計の校正業務を、校正電力 10 W、周波数 1 MHz~500 MHz の範囲で実施してきた。
近年、4K/8K テレビジョン放送をはじめとして、特性インピーダンス 75 の伝送線路を用
いたシステムの使用周波数帯域の高周波化が進み、電力測定の需要が高まってきているこ
とから、校正電力 1 mW かつ広帯域化(100 kHz~2 GHz)に対応した入力インピーダンス
75 の N 型同軸コネクタ入力の小電力電力計校正システムを開発した。 本稿では開発した校正システムの校正方法、特長、校正結果及び校正の不確かさについ
て述べる。 2 校正係数の定義
一般に、終端型の高周波電力計は、図 1 に示すようにセンサ部と指示部に分かれ、その
間を専用ケーブルにより接続される構成となっている。電力計の校正で求めるものは、セ
ンサ部に入射する電力P↓inと電力計に表示される指示値P↓Mの比である校正係
数Kであり、次式で定義される値である。
in
M
PPK (1)
例えば、Pin が 1 mW、P↓Mが 0.99 mW の場合、校正係数Kは 0.99 となる。
Kが分かっていれば、P↓M/K = 0.99/0.99 = 1 mW となり、指示値と校正係数よ
り入射電力が求めることができる。
(1)
For example, in the case where PM is 0.99 mW and Pin is 1 mW, the calibration factor K is 0.99. If we know K, then PM/K = 0.99/0.99 = 1 mW, so we can obtain the inci-dent power from the indicator value and the calibration factor.
3 Calibration method
3.1 Calibration principlesFigure 2 shows the configuration of the comparison
method, which is the simplest method for calibrating high frequency power meters. In this method, the same signal input from the signal source is measured by a standard power meter for which the calibration factor (KSTD) is al-ready known. After the indicator value (
2
図 1 高周波電力計の構成
3 校正方法 3.1 校正の原理
高周波電力計の最も簡易な校正方法として、図 2 の構成による比較法がある。この方法
は、信号源から出力された同一の信号を校正係数(K↓STD)が既知の標準電力計で測
MPSTD
置き換えて測定し、指示値(DUT
MP )を取得することにより、式(2)のとおり未知の
K↓DUT を求めることができる。
DUT
DUTM
STD
STDM
KP
KP
入射電力 STDM
DUTM
STDDUT PPKK (2)
↓
図 2 比較法による電力計校正
但し、式(2)は図 2 の基準面において反射係数が 0 の理想的な条件の場合であり、実
際は電力計の反射係数(Γ↓STD、Γ↓DUT)及び信号源の反射係数(Γ↓G)の影響を受け
) is obtained, the standard power meter is replaced with the power meter to be calibrated (“Device Under Test” (DUT)), for which the calibration factor (KDUT) is unknown.) and measured. By obtaining the indicator value (
2
図 1 高周波電力計の構成
3 校正方法 3.1 校正の原理
高周波電力計の最も簡易な校正方法として、図 2 の構成による比較法がある。この方法
は、信号源から出力された同一の信号を校正係数(K↓STD)が既知の標準電力計で測
定し、指示値(STD
MP )を取得した後、校正係数(K↓DUT)が未知の被校正電力計に
置き換えて測定し、指示値(DUT
MP )を取得することにより、式(2)のとおり未知の
K↓DUT を求めることができる。
DUT
DUTM
STD
STDM
KP
KP
入射電力 STDM
DUTM
STDDUT PPKK (2)
↓
図 2 比較法による電力計校正
但し、式(2)は図 2 の基準面において反射係数が 0 の理想的な条件の場合であり、実
際は電力計の反射係数(Γ↓STD、Γ↓DUT)及び信号源の反射係数(Γ↓G)の影響を受け
), we can then obtain the unknown KDUT by Equation (2).
Incident power
DUT
DUTM
STD
STDM
KP
KP
STDM
DUTM
STDDUT PPKK
(2)
Here, Equation (2) is for ideal conditions where the reference plane in Figure 2 has a reflection coefficient of 0. Actually, it is affected by the reflection coefficients of the power meter (ΓSTD, ΓDUT) and the reflection coefficient of Fig.F 1 Configuration of high frequency power meter
PinPM
K
Incident power
Sensor part Indicator part
2-2-2 Power Meter Calibration 2 (1 mW, 75 Ω)
Kojiro SAKAI, Tsutomu SUGIYAMA, Kouichi SEBATA, Iwao NISHIAYMA, and Katsumi FUJII
NICT performs power meter calibration services in accordance with the Radio Law. Recently, a new power meter calibration system has been developed realizing a wide frequency range (from 100 kHz to 2 GHz) for 75-ohm (Type-N75) coaxial sensors with a typical power for calibration of 1 mW. In order to conduct accurate calibration, the simultaneous comparison method is adopted. The newly developed system has the expanded uncertainties (coverage factor k=2) of 2.5 % below 10 MHz and 1.2 % from 10 MHz to 2 GHz.
Title:J2016E-02-02-02.indd p23 2017/03/01/ 水 10:22:57
23
2 Research and Development of Calibration Technology

the signal source (ΓG), so it becomes Equation (3).
3
るため式(3)のようになる。
2
STDG
DUTGSTD
M
DUTM
STDDUT 11
PPKK (3)
比較法では、特性インピーダンスが同じ同軸コネクタを有する電力計同士を直接比較す
る必要がある。しかしながら、高周波電力 1 mW の国家標準は、50 の同軸線路に対して
のみ供給され、75 の同軸線路を用いては供給されていない。そのため、NICT が持つ国
家標準にトレーサブルな標準電力計も入力インピーダンスが 50 であり、入力インピーダ
ンスが 75 のコネクタを有する電力計を校正することはできない。 この問題を解決するために、図 3 のように被校正電力計の前段に 50 と 75 の特性イ
ンピーダンスを変換する機器(以下「50 /75 変換器」という。)を挿入して校正を行う
ことを考えた場合、50 /75 変換器自体の電気的特性(Sパラメータ)を別途測定し、
補正する必要がある。また、比較法では、式(3)のとおり測定が困難な信号源の反射係数
(Γ↓G)も求めなければならない。加えて、標準電力計の測定時と被校正電力計の測定時
の信号源の出力が一定である必要がある。
図 3 インピーダンス変換器を使った比較法
そこで、新たに開発した校正システムでは信号源の出力変動が校正結果に影響を与えず、
かつ信号源の反射係数(Γ↓G)の測定が不要な同時比較法[1]を適用した。 通常、同時比較法においても標準電力計と被校正電力計は入力インピーダンスが同じで
ある必要があるが、図 4 のように 50 /75 変換器及びその変換器のロス分を補正する固
定減衰器をパワー・スプリッタと組み合わせた構成とすることにより、入力インピーダン
ス 50 の標準電力計による 75 の被校正電力計の校正を可能とした。
(3)
In the comparison method, one must directly compare power meters that have coaxial connectors with the same characteristic impedance. However, Japan’s national stan-dard 1 mW high frequency power is only provided for 50 Ω coaxial lines, not provided using 75 Ω coaxial lines. Therefore, input impedance is also 50 Ω in the national standard traceable standard power meters that NICT has, so power meters that have connectors with 75 Ω input impedance cannot be calibrated.
To solve this problem, as shown in Figure 3, if we consider inserting a device that transforms characteristic impedance from 50 Ω to 75 Ω (hereinafter referred to as a “50 Ω/75 Ω Transformer”) at the point before the DUT, then we must separately measure and correct for the electrical characteristics (S parameters) of the 50 Ω/75 Ω Transformer itself. And in the comparison method, Equation (3) also requires the signal source reflection coef-ficient (ΓG), which is difficult to measure. In addition, the output of the signal source while measuring a standard
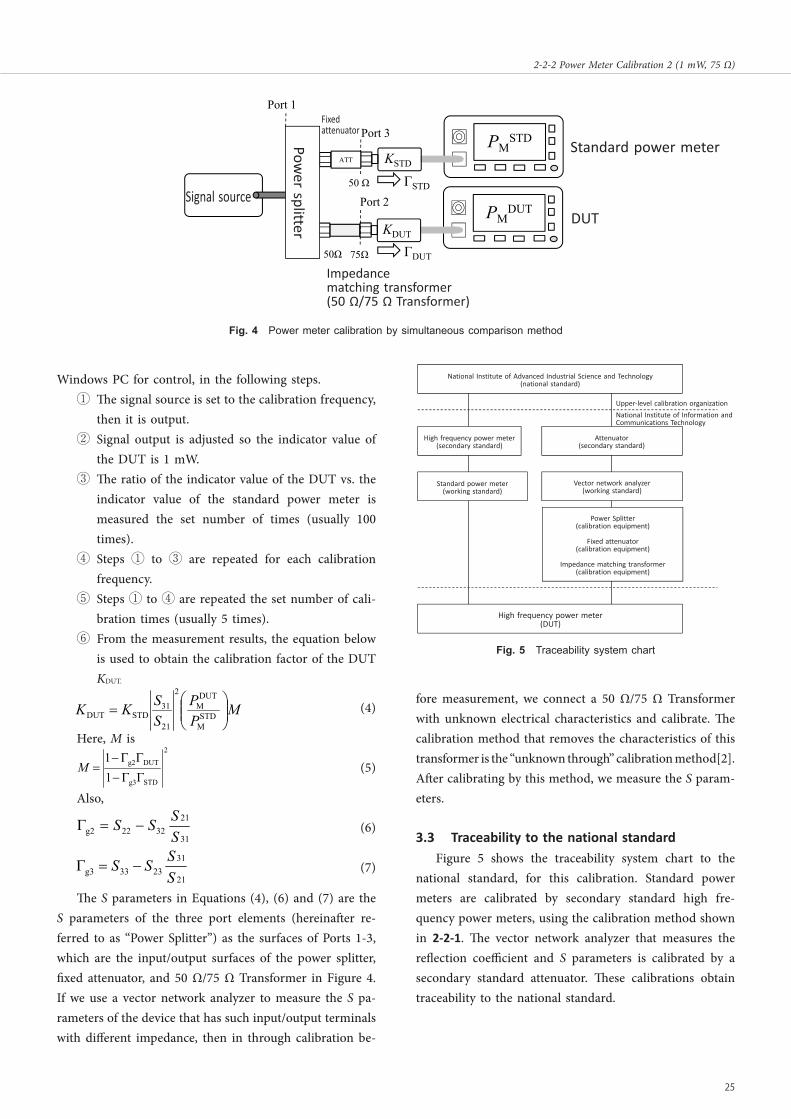
power meter must be the same as while measuring the DUT. Therefore, the newly developed calibration system applies the simultaneous comparison method[1], in which output fluctuations of the signal source do not affect the calibration results, and measurement of the signal source reflection coefficient (ΓG) is not necessary. Usually, even in the simultaneous comparison method, the standard power meter and DUT must have the same input impedance. But as shown in Figure 4, by combining a power splitter with a 50 Ω/75 Ω Transformer and fixed attenuator that corrects for that transformer’s losses, one can calibrate a 75 Ω input impedance DUT by using a 50 Ω input impedance standard power meter.
In the system we developed, high frequency signal output from the signal source is input into the power split-ter, and distributed. Part of the distributed output signal goes via the 50 Ω/75 Ω Transformer to the DUT. The other output signal goes via a fixed attenuator to the standard power meter.
3.2 Calibration stepsCalibration is done by a calibration program on a
Fig.F 2 Power meter calibration by comparison method
PMSTD
KSTD
PMDUT
KDUT
Standard power meter
DUT
Signal source
Compare
Reference plane
Reference plane
Fig.F 3 Comparison method using an impedance matching transformer (50 Ω/75 Ω)
PMSTD
KSTD
PMDUT
KDUT
50 Ω
75 Ω50 Ω
Standard power meter
DUT
Signal source
Compare
Impedance matching transformer (50 Ω/75 Ω Transformer)
24 Journal of the National Institute of Information and Communications Technology Vol. 63 No. 1 (2016)
Title:J2016E-02-02-02.indd p24 2017/03/01/ 水 10:22:57
2 Research and Development of Calibration Technology
Windows PC for control, in the following steps.① The signal source is set to the calibration frequency,
then it is output.② Signal output is adjusted so the indicator value of
the DUT is 1 mW.③ The ratio of the indicator value of the DUT vs. the
indicator value of the standard power meter is measured the set number of times (usually 100 times).
④ Steps ① to ③ are repeated for each calibration frequency.
⑤ Steps ① to ④ are repeated the set number of cali-bration times (usually 5 times).
⑥ From the measurement results, the equation below is used to obtain the calibration factor of the DUT KDUT.
4
開発した校正システムでは、信号源から出力される高周波信号は、パワー・スプリッタ
に入力、分配される。分配された一方の出力信号は 50 /75 変換器を経由して被校正電
力計に入力される。また、他方の出力信号は固定減衰器を経由して標準電力計に入力され
る。
図 4 同時比較法による電力計校正
3.2 校正手順
校正は制御用 PC(Windows)の校正プログラムにより以下の手順で行われる。 ① 信号源(SG)を校正周波数に設定、出力する。 ② 被校正電力計の指示値が 1 mW となるよう SG 出力を調整する。 ③ 標準電力計の指示値と被校正電力計の指示値の比を設定回数(通常 100 回)分、測定
する。 ④ 校正周波数毎に①~③を繰り返す。 ⑤ 設定された校正回数(通常 5 回)分 ①~④を繰り返す。 ⑥ 測定結果から次式を用いて被校正電力計の校正係数K↓DUTを求める。
MPP
SSKK
STD
M
DUTM
2
21
31STDDUT (4)
ここで、Mは、
2
STDg3
DUTg2
11
M (5)
また、
(4)
Here, M is
4
開発した校正システムでは、信号源から出力される高周波信号は、パワー・スプリッタ
に入力、分配される。分配された一方の出力信号は 50 /75 変換器を経由して被校正電
力計に入力される。また、他方の出力信号は固定減衰器を経由して標準電力計に入力され
る。
図 4 同時比較法による電力計校正
3.2 校正手順
校正は制御用 PC(Windows)の校正プログラムにより以下の手順で行われる。 ① 信号源(SG)を校正周波数に設定、出力する。 ② 被校正電力計の指示値が 1 mW となるよう SG 出力を調整する。 ③ 標準電力計の指示値と被校正電力計の指示値の比を設定回数(通常 100 回)分、測定
する。 ④ 校正周波数毎に①~③を繰り返す。 ⑤ 設定された校正回数(通常 5 回)分 ①~④を繰り返す。 ⑥ 測定結果から次式を用いて被校正電力計の校正係数K↓DUTを求める。
MPP
SSKK
STD
M
DUTM
2
21
31STDDUT (4)
ここで、Mは、
2
STDg3
DUTg2
11
M (5)
また、
(5)
Also,
(6)
5
31
213222g2 SSSS (6)
21
312333g3 SSSS (7)
式(4)、式(6)、式(7)におけるSパラメータは、図 4 におけるパワー・スプリッ
タ、固定減衰器、50 /75 変換器の入出力面である Port1,2,3 を開口面とした 3 開口素子
(以下「パワー・スプリッタ」という。)のSパラメータである。このようなインピー
ダンスが異なる入出力端子を有するデバイスの S パラメータをベクトル・ネットワーク・
アナライザで測定する場合、測定前のスルー校正において、電気的特性が未知の 50 /75
変換器を接続して校正を行うことになるが、この変換器の特性を除去する校正法として
「Unknown Through による校正法」[3]があり、この方法による校正を行った後に Sパラメータの測定を行う。 3.3 国家標準とのトレーサビリティ 本校正に関する国家標準とのトレーサビリティ体系を図 5 に示す。標準電力計は、特定
二次標準の高周波電力計により 2-2-1に示す方法により校正され、反射係数、Sパラメ
ータを測定するベクトル・ネットワーク・アナライザは特定二次標準の減衰器により校正
されることにより、国家標準とのトレーサビリティが確保されている。
(7)
The S parameters in Equations (4), (6) and (7) are the S parameters of the three port elements (hereinafter re-ferred to as “Power Splitter”) as the surfaces of Ports 1-3, which are the input/output surfaces of the power splitter, fixed attenuator, and 50 Ω/75 Ω Transformer in Figure 4. If we use a vector network analyzer to measure the S pa-rameters of the device that has such input/output terminals with different impedance, then in through calibration be-
fore measurement, we connect a 50 Ω/75 Ω Transformer with unknown electrical characteristics and calibrate. The calibration method that removes the characteristics of this transformer is the “unknown through” calibration method[2]. After calibrating by this method, we measure the S param-eters.
3.3 Traceability to the national standardFigure 5 shows the traceability system chart to the
national standard, for this calibration. Standard power meters are calibrated by secondary standard high fre-quency power meters, using the calibration method shown in 2-2-1. The vector network analyzer that measures the reflection coefficient and S parameters is calibrated by a secondary standard attenuator. These calibrations obtain traceability to the national standard.
5
31
213222g2 SSSS (6)
21
312333g3 SSSS (7)
式(4)、式(6)、式(7)におけるSパラメータは、図 4 におけるパワー・スプリッ
タ、固定減衰器、50 /75 変換器の入出力面である Port1,2,3 を開口面とした 3 開口素子
(以下「パワー・スプリッタ」という。)のSパラメータである。このようなインピー
ダンスが異なる入出力端子を有するデバイスの S パラメータをベクトル・ネットワーク・
アナライザで測定する場合、測定前のスルー校正において、電気的特性が未知の 50 /75
変換器を接続して校正を行うことになるが、この変換器の特性を除去する校正法として
「Unknown Through による校正法」[3]があり、この方法による校正を行った後に Sパラメータの測定を行う。 3.3 国家標準とのトレーサビリティ 本校正に関する国家標準とのトレーサビリティ体系を図 5 に示す。標準電力計は、特定
二次標準の高周波電力計により 2-2-1に示す方法により校正され、反射係数、Sパラメ
ータを測定するベクトル・ネットワーク・アナライザは特定二次標準の減衰器により校正
されることにより、国家標準とのトレーサビリティが確保されている。
Fig.F 4 Power meter calibration by simultaneous comparison method
National Institute of Advanced Industrial Science and Technology(national standard)
Upper-level calibration organizationNational Institute of Information and Communications Technology
High frequency power meter(secondary standard)
Attenuator(secondary standard)
Standard power meter(working standard)
High frequency power meter(DUT)
Power Splitter(calibration equipment)
Fixed attenuator(calibration equipment)
Impedance matching transformer(calibration equipment)
Vector network analyzer(working standard)
PMDUT
KDUT
PMSTD
KSTD
50Ω
50 Ω
75Ω
ATT
Port 1
Port 2
Port 3
ΓDUT
ΓSTD
Standard power meter
DUT
Impedance matching transformer (50 Ω/75 Ω Transformer)
Signal source
Fixed attenuator
Power splitter
Fig.F 5 Traceability system chart
Title:J2016E-02-02-02.indd p25 2017/03/01/ 水 10:22:57
25
2-2-2 Power Meter Calibration 2 (1 mW, 75 Ω)

4 Advantages
Figure 6 is a photo of the calibration system developed. The greatest advantage of this calibration system is that it can calibrate a 75 Ω DUT by using a standard power meter with 50 Ω input impedance. Other than this point, we describe points to consider when developing this system, calibration technology to obtain high quality calibration results, and maintenance items required to maintain per-formance.
(1) Considering workability and maintainability, as seen in Figure 6, all is stored in a small 19-inch (13 U) rack, including the DUT, to save space.
(2) For the connection plane (Ports 2 and 3 in Figure 4) between the standard power meter and DUT, in order to make uniform the effects on connection plane due to the power meter’s sensor part’s own weight, we arranged to vertically connect the sensor parts, as seen in Figure 6.
(3) To assess the variability due to connection of the connector of the sensor part of the DUT, after finish-ing calibration each time (performed 5 times), the sensor section is rotated roughly 72-degrees (360 degrees divided by five), then reconnected and measured. To prevent connector connection plane wear due to rotation, one should make sure to detach the connector before rotating and reconnecting it.
(4) When connecting the connectors, use a torque
wrench and tighten to the specified torque, for re-producibility of measurements.
(5) The connection plane of the standard power meter (50 Ω) and DUT (75 Ω) are both Type-N coaxial connectors, as shown in Figure 7. Other than the diameter sizes of the center conductors (arrows point to them in Figure 7), they have the same dimensions, so it is very difficult to tell them apart. If someone mistakenly connects the standard power sensor (50 Ω male) to Port 2 (75 Ω female) of Figure 4, then the diameter of the center conduc-tor will differ, which will damage the center conduc-tor of Port 2 (75 Ω female). To prevent such mistakes, we write a warning note on the side of the connection to Port 2, so calibrator check again that the connector they want to connect is a “75 Ω Type-N connector.”
(6) Maintenance Items(a) To check normalcy of this calibration system,
once each year, we calibrate a DUT to check validity, confirm that the system is working normally, and check changes of calibration results over the years and validity.
(b) To check traceability, once each half year, we use a vector network analyzer to measure the attenu-ation amount of a high frequency attenuator (secondary standard device), and compare vs. an upper-level calibration value, to check changes over the years and validity. We also use this vec-tor network analyzer to measure the S parameters
Fig.F 7 Shapes of type-N coaxial connectors
Type-N connectors50 Ω male
50 Ω female
75 Ω male
75 Ω female
Difference in diameters of center conductors
Difference in diameters of center conductors
Fig.F 6 High frequency power meter calibration system (1 mW, 75 Ω) photo
26 Journal of the National Institute of Information and Communications Technology Vol. 63 No. 1 (2016)
Title:J2016E-02-02-02.indd p26 2017/03/01/ 水 10:22:57
2 Research and Development of Calibration Technology

of the Power Splitter, and check changes over the years and validity. Figure 8 shows an example of S parameters measurement results. The difference between S21 and S31 (about 0.2 dB) is the differ-ence between attenuation amounts of a fixed at-tenuator vs. a 50 Ω/75 Ω Transformer. This difference is corrected by |S31/S21|2 in Equation (4), so it does not affect calibration results.
5 Calibration results
We used the calibration system we developed to cali-brate a 75 Ω input impedance sensor part (made by Keysight Technologies: 8483 A) and indicator part (also by Keysight: E4418 B) as the DUT.
Figure 9 shows an example of calibration results. The solid line () is calibration results by the calibration system now developed by NICT. The dashed line () is the cali-
Fig.F 8 Power splitter’s S parameters measurement results example
Ampl
itude
s of
S p
aram
eter
s
National Institute of Information and Communications Technology
9
図8のグラフの中の図50/75Ω変換器
固定減衰器
Port 1Port 3
パワー・
スプリッタ
S21
S31
Port 2
Frequency (MHz)
Pow
er S
plitt
er Fixed attenuator
50/75 Ω transformer
Fig.F 9 Calibration results example
Calib
ratio
n fa
ctor
Frequency (MHz)
Title:J2016E-02-02-02.indd p27 2017/03/01/ 水 10:22:57
27
2-2-2 Power Meter Calibration 2 (1 mW, 75 Ω)
bration factors by Keysight Technologies; these calibration factors are traceable to the U.S. National Institute of Standards and Technology (NIST). In all frequencies, they match within the range of uncertainty described below, so the calibration results can be considered good.
6 Uncertainty of calibration
Uncertainty u (KDUT) attached to calibration results by the calibration system developed is in the following equa-tion, according to the law of propagation of uncertainty [3].
10
図 9 校正結果の例
6 校正の不確かさ 開発した校正システムによる校正結果に付随する不確かさu(K↓DUT)は、不
確かさの伝播則より次式となる [2] 。
2
DUT
DUT2
22
2
STDM
STDM2
2
DUTM
DUTM2
2
21
212
2
31
3122
STD
STD2
DUT
DUT
1
111
2 21
KKs
MMu
PPu
PPu
S
Su
S
SuKKu
KKu
(5)
不確かさの各要因は、式(5)右辺第 1 項より順に①標準電力計の校正不確かさ、②パワ
ー・スプリッタ Port1–Port3 間の減衰量(Sパラメータ)の不確かさ、③パワー・スプ
リッタ Port1–Port2 間の減衰量(Sパラメータ)の不確かさ、④被校正電力計の測定分
解能、⑤標準電力計の測定分解能、⑥標準電力計とパワー・スプリッタ及び被校正電力計
とパワー・スプリッタ間の不整合、⑦測定のばらつきがある。ただし、式(5)右辺の中括
弧の直前の括弧内の値は、各要因に対する感度係数c(x)を表す。 ①については、上位校正の不確かさを用いる(正規分布)。②③については、国家標準に
トレーサブルな仲介高周波減衰器により校正されたベクトル・ネットワーク・アナライザ
(8)
In Equation (8), looking at each source of uncertainty one by one, starting from the first item on the right side, they are: ① Calibration uncertainty of standard power meter, ② Uncertainty of attenuation amount between Power Splitter Ports 1–3 (S parameters), ③ Uncertainty of attenuation amount between Power Splitter Ports 1–2 (S parameters), ④ Measurement resolution of DUT, ⑤ Measurement resolution of standard power meter, ⑥ Mismatch between the standard power meter and Power Splitter, and between DUT and Power Splitter, ⑦ Variability
of measurements. Here, the value in the parentheses di-rectly before the brackets on the right expresses the sensi-tivity coefficient c(x) for each factor in Equation (8).
① uses the uncertainty of upper-level calibration (normal distribution). ② and ③ use the uncer-tainty when measuring by a vector network ana-lyzer calibrated by a mediation high frequency attenuator that is traceable to national standard (normal distribution). ④ and ⑤ are determined from the displayed digits of the standard power meter and DUT (uniform distribution). ⑥ is mea-sured and calculated reflection coefficients of the standard power meter and DUT, and S parameters of the Power Splitter (U distribution). ⑦ is mea-surements repeated five times to obtain the vari-ability (normal distribution).
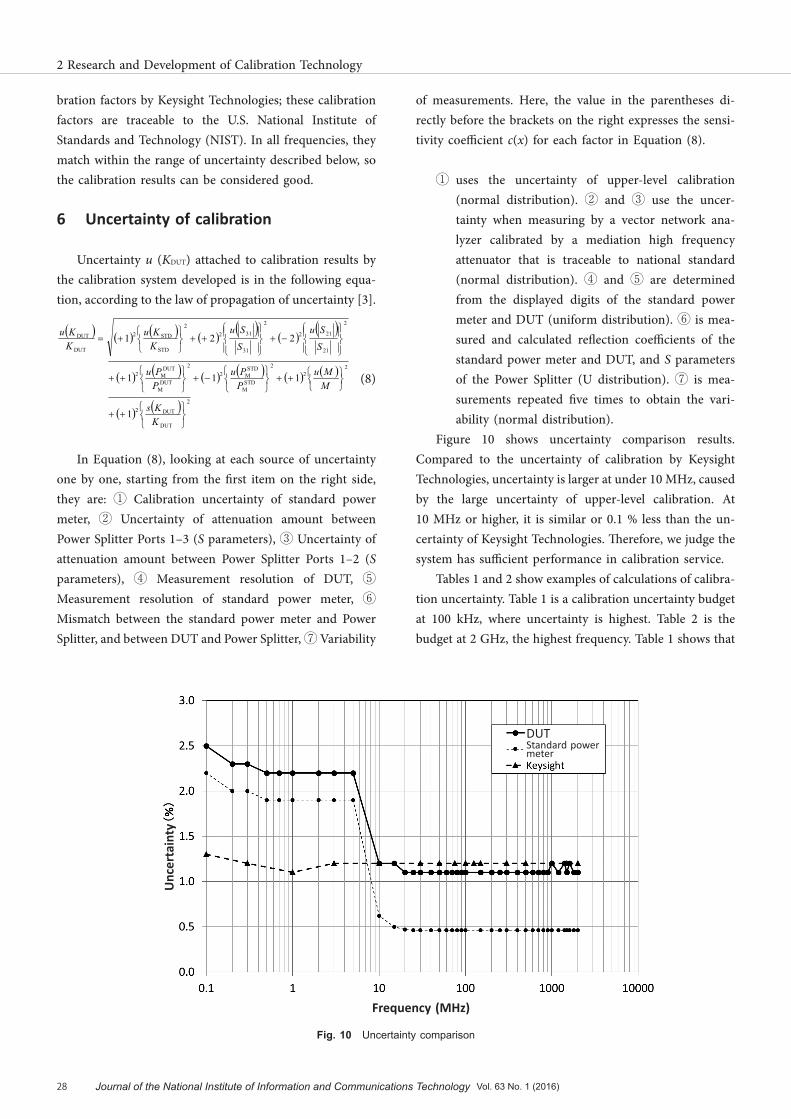
Figure 10 shows uncertainty comparison results. Compared to the uncertainty of calibration by Keysight Technologies, uncertainty is larger at under 10 MHz, caused by the large uncertainty of upper-level calibration. At 10 MHz or higher, it is similar or 0.1 % less than the un-certainty of Keysight Technologies. Therefore, we judge the system has sufficient performance in calibration service.
Tables 1 and 2 show examples of calculations of calibra-tion uncertainty. Table 1 is a calibration uncertainty budget at 100 kHz, where uncertainty is highest. Table 2 is the budget at 2 GHz, the highest frequency. Table 1 shows that
Unc
erta
inty
Frequency (MHz)
Standard power meter
DUT
Fig.F 10 Uncertainty comparison
28 Journal of the National Institute of Information and Communications Technology Vol. 63 No. 1 (2016)
Title:J2016E-02-02-02.indd p28 2017/03/01/ 水 10:22:57
2 Research and Development of Calibration Technology

calibration uncertainty u (KSTD) of the standard power meter is the main factor that increases uncertainty. This is the uncertainty attached to calibration results at an upper-level calibration organization (National Institute of Advanced Industrial Science and Technology), so it is difficult for us to improve that ourselves. Other than that, uncertainty of S parameters u (¦S31¦)and u (¦S21¦) are factors. We will investigate methods to reduce the uncertainty of these attenuation amount measurements in the future.
7 Conclusion
For the 100 kHz to 2 GHz frequency range, we devel-oped a low power (1 mW) power meter calibration system for 75 Ω input impedance Type-N coaxial connectors. We
did actual calibrations, and sought the system’s calibration uncertainties.
We found that power meter calibration is possible with 2.5 % expanded uncertainty at less than 10 MHz, or 1.2 % at 10 MHz or higher.
An issue for the future is how to maintain and improve calibration quality, including investigation of methods to reduce uncertainty of S parameters of the Power Splitter.
Appendix. Derivation of Equation (4)In the simultaneous comparison method calibration
system shown in Fig. 4, if we use S parameters to express the status, with the signal source connected to Port #1, DUT to Port #2, and standard power meter to Port #3, we obtain the following equations.
TableT 1 Uncertainty budget example (100 kHz, 1 mW)
TableT 2 Uncertainty budget example (2 GHz, 1 mW)
Sources of uncertainty Uncertainty Distribution DivisorStandard
uncertaintyu(x)
Sensitivity coefficient
c(x)
Contribution to uncertainty|c(x)|u(x)
KSTD Standard0.46 %(k=2)
Normal 2 0.23 % 1 0.23 %
S31Attenuation
0.015 dB Normal 1 0.17 % 2 0.35 %
S21 0.015 dB Normal 1 0.17 % -2 0.35 %
P DUT Power meterresolution
4 digits
0.05 % Uniform √3 0.03 % 1 0.03 %
P STD 0.05 % Uniform √3 0.03 % -1 0.03 %
M Mismatch 0.07 % U √2 0.05 % 1 0.05 %
s(KDUT) Repeatability 0.11 % Normal √5 0.05 % 1 0.05 %
Combined standard uncertainty 0.55 %
Extended uncertainty (k = 2) 1.1 %
M
M
Sources of uncertainty Uncertainty Distribution DivisorStandard
uncertaintyu(x)
Sensitivity coefficient
c(x)
Contribution to uncertainty|c(x)|u(x)
KSTD Standard2.20 %(k=2)
Normal 2 1.10 % 1 1.10 %
S31Attenuation
0.015 dB Normal 1 0.17 % 2 0.35 %
S21 0.015 dB Normal 1 0.17 % -2 0.35 %
P DUT Power meterresolution
4 digits
0.05 % Uniform √3 0.03 % 1 0.03 %
P STD 0.05 % Uniform √3 0.03 % -1 0.03 %
M Mismatch 0.06 % U √2 0.04 % 1 0.04 %
s(KDUT) Repeatability 0.09 % Normal √5 0.04 % 1 0.04 %
Combined standard uncertainty 1.21 %
Extended uncertainty (k = 2) 2.5 %
M
M
Title:J2016E-02-02-02.indd p29 2017/03/01/ 水 10:22:57
29
2-2-2 Power Meter Calibration 2 (1 mW, 75 Ω)
13
P
↑STD
0.05 % 一様 √3 0.03 % -1 0.03 %
M 不整合 0.07 % U √2 0.05 % 1 0.05 % s(K↓DUT
)
再現性 0.11 % 正規 √5 0.05 % 1 0.05 %
合成標準不確かさ 0.55 % 拡張不確かさ(k=2) 1.1 %
7 あとがき
周波数範囲が 100 kHz~2 GHz において、入力インピーダンスが 75 の N 型同軸コネク
タ入力の小電力(1 mW)電力計校正システムを開発し、実際に校正を行い校正システムが
持つ校正の不確かさを求めた。10 MHz 未満で 2.5 %、10 MHz 以上で 1.2 %の拡張不確かさ
で電力計の校正が可能であることが分かった。今後の課題としては、パワー・スプリッタ
のSパラメータの不確かさを小さくする方法の検討を含めた校正品質の維持・向上であ
る。 付録 式(4)の導出
図 4 に示す同時比較法の校正装置において、ポート#1 に信号源、ポート#2 に被校正電力
計、ポート#3 に標準電力計が接続された状態を、S パラメータを用いて表すと、次式が得
られる。
3
2
1
332331
232221
131211
3
2
1
aaa
SSSSSSSSS
bbb
(A.1)
11 baa GG (A.2)
2DUT2 ba (A.3)
3STD3 ba (A.4)
ただし、S 行列はパワー・スプリッタを含む点線で示した 3 ポート回路の特性を表してお
り、 Ga は信号源の出射波、 G は信号源の反射係数、 DUT は被校正電力計の反射係数、 STD
M
(A.1)
13
P
↑STD
0.05 % 一様 √3 0.03 % -1 0.03 %
M 不整合 0.07 % U √2 0.05 % 1 0.05 % s(K↓DUT
)
再現性 0.11 % 正規 √5 0.05 % 1 0.05 %
合成標準不確かさ 0.55 % 拡張不確かさ(k=2) 1.1 %
7 あとがき
周波数範囲が 100 kHz~2 GHz において、入力インピーダンスが 75 の N 型同軸コネク
タ入力の小電力(1 mW)電力計校正システムを開発し、実際に校正を行い校正システムが
持つ校正の不確かさを求めた。10 MHz 未満で 2.5 %、10 MHz 以上で 1.2 %の拡張不確かさ
で電力計の校正が可能であることが分かった。今後の課題としては、パワー・スプリッタ
のSパラメータの不確かさを小さくする方法の検討を含めた校正品質の維持・向上であ
る。 付録 式(4)の導出
図 4 に示す同時比較法の校正装置において、ポート#1 に信号源、ポート#2 に被校正電力
計、ポート#3 に標準電力計が接続された状態を、S パラメータを用いて表すと、次式が得
られる。
3
2
1
332331
232221
131211
3
2
1
aaa
SSSSSSSSS
bbb
(A.1)
11 baa GG (A.2)
2DUT2 ba (A.3)
3STD3 ba (A.4)
ただし、S 行列はパワー・スプリッタを含む点線で示した 3 ポート回路の特性を表してお
り、 Ga は信号源の出射波、 G は信号源の反射係数、 DUT は被校正電力計の反射係数、 STD
M
(A.2)
13
P
↑STD
0.05 % 一様 √3 0.03 % -1 0.03 %
M 不整合 0.07 % U √2 0.05 % 1 0.05 % s(K↓DUT
)
再現性 0.11 % 正規 √5 0.05 % 1 0.05 %
合成標準不確かさ 0.55 % 拡張不確かさ(k=2) 1.1 %
7 あとがき
周波数範囲が 100 kHz~2 GHz において、入力インピーダンスが 75 の N 型同軸コネク
タ入力の小電力(1 mW)電力計校正システムを開発し、実際に校正を行い校正システムが
持つ校正の不確かさを求めた。10 MHz 未満で 2.5 %、10 MHz 以上で 1.2 %の拡張不確かさ
で電力計の校正が可能であることが分かった。今後の課題としては、パワー・スプリッタ
のSパラメータの不確かさを小さくする方法の検討を含めた校正品質の維持・向上であ
る。 付録 式(4)の導出
図 4 に示す同時比較法の校正装置において、ポート#1 に信号源、ポート#2 に被校正電力
計、ポート#3 に標準電力計が接続された状態を、S パラメータを用いて表すと、次式が得
られる。
3
2
1
332331
232221
131211
3
2
1
aaa
SSSSSSSSS
bbb
(A.1)
11 baa GG (A.2)
2DUT2 ba (A.3)
3STD3 ba (A.4)
ただし、S 行列はパワー・スプリッタを含む点線で示した 3 ポート回路の特性を表してお
り、 Ga は信号源の出射波、 G は信号源の反射係数、 DUT は被校正電力計の反射係数、 STD
M
(A.3)
13
P
↑STD
0.05 % 一様 √3 0.03 % -1 0.03 %
M 不整合 0.07 % U √2 0.05 % 1 0.05 % s(K↓DUT
)
再現性 0.11 % 正規 √5 0.05 % 1 0.05 %
合成標準不確かさ 0.55 % 拡張不確かさ(k=2) 1.1 %
7 あとがき
周波数範囲が 100 kHz~2 GHz において、入力インピーダンスが 75 の N 型同軸コネク
タ入力の小電力(1 mW)電力計校正システムを開発し、実際に校正を行い校正システムが
持つ校正の不確かさを求めた。10 MHz 未満で 2.5 %、10 MHz 以上で 1.2 %の拡張不確かさ
で電力計の校正が可能であることが分かった。今後の課題としては、パワー・スプリッタ
のSパラメータの不確かさを小さくする方法の検討を含めた校正品質の維持・向上であ
る。 付録 式(4)の導出
図 4 に示す同時比較法の校正装置において、ポート#1 に信号源、ポート#2 に被校正電力
計、ポート#3 に標準電力計が接続された状態を、S パラメータを用いて表すと、次式が得
られる。
3
2
1
332331
232221
131211
3
2
1
aaa
SSSSSSSSS
bbb
(A.1)
11 baa GG (A.2)
2DUT2 ba (A.3)
3STD3 ba (A.4)
ただし、S 行列はパワー・スプリッタを含む点線で示した 3 ポート回路の特性を表してお
り、 Ga は信号源の出射波、 G は信号源の反射係数、 DUT は被校正電力計の反射係数、 STD
M
(A.4)
Here, the S matrix expresses characteristics of the 3 port circuit shown in the dashed lines containing the Power Splitter.
13
P
↑STD
0.05 % 一様 √3 0.03 % -1 0.03 %
M 不整合 0.07 % U √2 0.05 % 1 0.05 % s(K↓DUT
)
再現性 0.11 % 正規 √5 0.05 % 1 0.05 %
合成標準不確かさ 0.55 % 拡張不確かさ(k=2) 1.1 %
7 あとがき
周波数範囲が 100 kHz~2 GHz において、入力インピーダンスが 75 の N 型同軸コネク
タ入力の小電力(1 mW)電力計校正システムを開発し、実際に校正を行い校正システムが
持つ校正の不確かさを求めた。10 MHz 未満で 2.5 %、10 MHz 以上で 1.2 %の拡張不確かさ
で電力計の校正が可能であることが分かった。今後の課題としては、パワー・スプリッタ
のSパラメータの不確かさを小さくする方法の検討を含めた校正品質の維持・向上であ
る。 付録 式(4)の導出
図 4 に示す同時比較法の校正装置において、ポート#1 に信号源、ポート#2 に被校正電力
計、ポート#3 に標準電力計が接続された状態を、S パラメータを用いて表すと、次式が得
られる。
3
2
1
332331
232221
131211
3
2
1
aaa
SSSSSSSSS
bbb
(A.1)
11 baa GG (A.2)
2DUT2 ba (A.3)
3STD3 ba (A.4)
ただし、S 行列はパワー・スプリッタを含む点線で示した 3 ポート回路の特性を表してお
り、 Ga は信号源の出射波、 G は信号源の反射係数、 DUT は被校正電力計の反射係数、 STD
M
is the source power from the signal source, ΓG is the reflection coefficient of the signal source, ΓDUT is the reflection coefficient of the DUT, and ΓSTD is the reflection coefficient of the standard power meter.
From these equations, we obtain below the power
14
は標準電力計の反射係数である。これらの式から、被校正電力計に入射する電力DUT
inP 及
び標準電力計に入射する電力STD
inP を求めると、それぞれ、
22
)11)(12(22
DUTin G
S aD
DbP (A.5)
22
)11)(13(23
STDin G
S aD
DbP (A.6)
ただし、
STD33DUT3231
STD23DUT2221
STD13DUT1211
11
1det
SSSSSSSSS
D
G
G
G
(A.7)
STD21
31233321
STD3331
STD2321)11)(12( 1
1det
SSSSS
SSSS
D S (A.8)
DUT31
21322231
31DUT32
21DUT22)11)(13( 1
1det
SSSSS
SSSS
D S (A.9)
である。ここで、 Adet は、行列Aの行列式を表す。
いま、2 つの入射電力を同時に測定して比を求めると、式(A.5)、(A.6)より、
2
DUT31
213222
STD21
3123332
31
21
STD
DUT
2
)11)(13(
)11)(12(
STD
DUTSTD
in
DUTin
STD
DUTSTD
M
DUTM
1
1
SSSS
SSSS
SS
KK
DD
KK
PP
KK
PP
S
S
(A.10)
を得る。ここで、 DUTDUT
MDUT
in KPP 及び STDSTD
MSTD
in KPP の関係を用いた。式変形す
れば、以下のとおり、式(4)が得られる。
incident into the DUT and power
14
は標準電力計の反射係数である。これらの式から、被校正電力計に入射する電力DUT
inP 及
び標準電力計に入射する電力STD
inP を求めると、それぞれ、
22
)11)(12(22
DUTin G
S aD
DbP (A.5)
22
)11)(13(23
STDin G
S aD
DbP (A.6)
ただし、
STD33DUT3231
STD23DUT2221
STD13DUT1211
11
1det
SSSSSSSSS
D
G
G
G
(A.7)
STD21
31233321
STD3331
STD2321)11)(12( 1
1det
SSSSS
SSSS
D S (A.8)
DUT31
21322231
31DUT32
21DUT22)11)(13( 1
1det
SSSSS
SSSS
D S (A.9)
である。ここで、 Adet は、行列Aの行列式を表す。
いま、2 つの入射電力を同時に測定して比を求めると、式(A.5)、(A.6)より、
2
DUT31
213222
STD21
3123332
31
21
STD
DUT
2
)11)(13(
)11)(12(
STD
DUTSTD
in
DUTin
STD
DUTSTD
M
DUTM
1
1
SSSS
SSSS
SS
KK
DD
KK
PP
KK
PP
S
S
(A.10)
を得る。ここで、 DUTDUT
MDUT
in KPP 及び STDSTD
MSTD
in KPP の関係を用いた。式変形す
れば、以下のとおり、式(4)が得られる。
incident into the standard power system
14
は標準電力計の反射係数である。これらの式から、被校正電力計に入射する電力DUT
inP 及
び標準電力計に入射する電力STD
inP を求めると、それぞれ、
22
)11)(12(22
DUTin G
S aD
DbP (A.5)
22
)11)(13(23
STDin G
S aD
DbP (A.6)
ただし、
STD33DUT3231
STD23DUT2221
STD13DUT1211
11
1det
SSSSSSSSS
D
G
G
G
(A.7)
STD21
31233321
STD3331
STD2321)11)(12( 1
1det
SSSSS
SSSS
D S (A.8)
DUT31
21322231
31DUT32
21DUT22)11)(13( 1
1det
SSSSS
SSSS
D S (A.9)
である。ここで、 Adet は、行列Aの行列式を表す。
いま、2 つの入射電力を同時に測定して比を求めると、式(A.5)、(A.6)より、
2
DUT31
213222
STD21
3123332
31
21
STD
DUT
2
)11)(13(
)11)(12(
STD
DUTSTD
in
DUTin
STD
DUTSTD
M
DUTM
1
1
SSSS
SSSS
SS
KK
DD
KK
PP
KK
PP
S
S
(A.10)
を得る。ここで、 DUTDUT
MDUT
in KPP 及び STDSTD
MSTD
in KPP の関係を用いた。式変形す
れば、以下のとおり、式(4)が得られる。
(A.5)
14
は標準電力計の反射係数である。これらの式から、被校正電力計に入射する電力DUT
inP 及
び標準電力計に入射する電力STD
inP を求めると、それぞれ、
22
)11)(12(22
DUTin G
S aD
DbP (A.5)
22
)11)(13(23
STDin G
S aD
DbP (A.6)
ただし、
STD33DUT3231
STD23DUT2221
STD13DUT1211
11
1det
SSSSSSSSS
D
G
G
G
(A.7)
STD21
31233321
STD3331
STD2321)11)(12( 1
1det
SSSSS
SSSS
D S (A.8)
DUT31
21322231
31DUT32
21DUT22)11)(13( 1
1det
SSSSS
SSSS
D S (A.9)
である。ここで、 Adet は、行列Aの行列式を表す。
いま、2 つの入射電力を同時に測定して比を求めると、式(A.5)、(A.6)より、
2
DUT31
213222
STD21
3123332
31
21
STD
DUT
2
)11)(13(
)11)(12(
STD
DUTSTD
in
DUTin
STD
DUTSTD
M
DUTM
1
1
SSSS
SSSS
SS
KK
DD
KK
PP
KK
PP
S
S
(A.10)
を得る。ここで、 DUTDUT
MDUT
in KPP 及び STDSTD
MSTD
in KPP の関係を用いた。式変形す
れば、以下のとおり、式(4)が得られる。
(A.6)
Where,
14
は標準電力計の反射係数である。これらの式から、被校正電力計に入射する電力DUT
inP 及
び標準電力計に入射する電力STD
inP を求めると、それぞれ、
22
)11)(12(22
DUTin G
S aD
DbP (A.5)
22
)11)(13(23
STDin G
S aD
DbP (A.6)
ただし、
STD33DUT3231
STD23DUT2221
STD13DUT1211
11
1det
SSSSSSSSS
D
G
G
G
(A.7)
STD21
31233321
STD3331
STD2321)11)(12( 1
1det
SSSSS
SSSS
D S (A.8)
DUT31
21322231
31DUT32
21DUT22)11)(13( 1
1det
SSSSS
SSSS
D S (A.9)
である。ここで、 Adet は、行列Aの行列式を表す。
いま、2 つの入射電力を同時に測定して比を求めると、式(A.5)、(A.6)より、
2
DUT31
213222
STD21
3123332
31
21
STD
DUT
2
)11)(13(
)11)(12(
STD
DUTSTD
in
DUTin
STD
DUTSTD
M
DUTM
1
1
SSSS
SSSS
SS
KK
DD
KK
PP
KK
PP
S
S
(A.10)
を得る。ここで、 DUTDUT
MDUT
in KPP 及び STDSTD
MSTD
in KPP の関係を用いた。式変形す
れば、以下のとおり、式(4)が得られる。
(A.7)
14
は標準電力計の反射係数である。これらの式から、被校正電力計に入射する電力DUT
inP 及
び標準電力計に入射する電力STD
inP を求めると、それぞれ、
22
)11)(12(22
DUTin G
S aD
DbP (A.5)
22
)11)(13(23
STDin G
S aD
DbP (A.6)
ただし、
STD33DUT3231
STD23DUT2221
STD13DUT1211
11
1det
SSSSSSSSS
D
G
G
G
(A.7)
STD21
31233321
STD3331
STD2321)11)(12( 1
1det
SSSSS
SSSS
D S (A.8)
DUT31
21322231
31DUT32
21DUT22)11)(13( 1
1det
SSSSS
SSSS
D S (A.9)
である。ここで、 Adet は、行列Aの行列式を表す。
いま、2 つの入射電力を同時に測定して比を求めると、式(A.5)、(A.6)より、
2
DUT31
213222
STD21
3123332
31
21
STD
DUT
2
)11)(13(
)11)(12(
STD
DUTSTD
in
DUTin
STD
DUTSTD
M
DUTM
1
1
SSSS
SSSS
SS
KK
DD
KK
PP
KK
PP
S
S
(A.10)
を得る。ここで、 DUTDUT
MDUT
in KPP 及び STDSTD
MSTD
in KPP の関係を用いた。式変形す
れば、以下のとおり、式(4)が得られる。
(A.8)
14
は標準電力計の反射係数である。これらの式から、被校正電力計に入射する電力DUT
inP 及
び標準電力計に入射する電力STD
inP を求めると、それぞれ、
22
)11)(12(22
DUTin G
S aD
DbP (A.5)
22
)11)(13(23
STDin G
S aD
DbP (A.6)
ただし、
STD33DUT3231
STD23DUT2221
STD13DUT1211
11
1det
SSSSSSSSS
D
G
G
G
(A.7)
STD21
31233321
STD3331
STD2321)11)(12( 1
1det
SSSSS
SSSS
D S (A.8)
DUT31
21322231
31DUT32
21DUT22)11)(13( 1
1det
SSSSS
SSSS
D S (A.9)
である。ここで、 Adet は、行列Aの行列式を表す。
いま、2 つの入射電力を同時に測定して比を求めると、式(A.5)、(A.6)より、
2
DUT31
213222
STD21
3123332
31
21
STD
DUT
2
)11)(13(
)11)(12(
STD
DUTSTD
in
DUTin
STD
DUTSTD
M
DUTM
1
1
SSSS
SSSS
SS
KK
DD
KK
PP
KK
PP
S
S
(A.10)
を得る。ここで、 DUTDUT
MDUT
in KPP 及び STDSTD
MSTD
in KPP の関係を用いた。式変形す
れば、以下のとおり、式(4)が得られる。
(A.9)
Here, det[A] expresses the matrix equation of matrix A.Now, if we measure and compare two incident powers
at the same time, from equations (A.5) and (A.6), we obtain
14
は標準電力計の反射係数である。これらの式から、被校正電力計に入射する電力DUT
inP 及
び標準電力計に入射する電力STD
inP を求めると、それぞれ、
22
)11)(12(22
DUTin G
S aD
DbP (A.5)
22
)11)(13(23
STDin G
S aD
DbP (A.6)
ただし、
STD33DUT3231
STD23DUT2221
STD13DUT1211
11
1det
SSSSSSSSS
D
G
G
G
(A.7)
STD21
31233321
STD3331
STD2321)11)(12( 1
1det
SSSSS
SSSS
D S (A.8)
DUT31
21322231
31DUT32
21DUT22)11)(13( 1
1det
SSSSS
SSSS
D S (A.9)
である。ここで、 Adet は、行列Aの行列式を表す。
いま、2 つの入射電力を同時に測定して比を求めると、式(A.5)、(A.6)より、
2
DUT31
213222
STD21
3123332
31
21
STD
DUT
2
)11)(13(
)11)(12(
STD
DUTSTD
in
DUTin
STD
DUTSTD
M
DUTM
1
1
SSSS
SSSS
SS
KK
DD
KK
PP
KK
PP
S
S
(A.10)
を得る。ここで、 DUTDUT
MDUT
in KPP 及び STDSTD
MSTD
in KPP の関係を用いた。式変形す
れば、以下のとおり、式(4)が得られる。
(A.10)Here, we used the relationship
14
は標準電力計の反射係数である。これらの式から、被校正電力計に入射する電力DUT
inP 及
び標準電力計に入射する電力STD
inP を求めると、それぞれ、
22
)11)(12(22
DUTin G
S aD
DbP (A.5)
22
)11)(13(23
STDin G
S aD
DbP (A.6)
ただし、
STD33DUT3231
STD23DUT2221
STD13DUT1211
11
1det
SSSSSSSSS
D
G
G
G
(A.7)
STD21
31233321
STD3331
STD2321)11)(12( 1
1det
SSSSS
SSSS
D S (A.8)
DUT31
21322231
31DUT32
21DUT22)11)(13( 1
1det
SSSSS
SSSS
D S (A.9)
である。ここで、 Adet は、行列Aの行列式を表す。
いま、2 つの入射電力を同時に測定して比を求めると、式(A.5)、(A.6)より、
2
DUT31
213222
STD21
3123332
31
21
STD
DUT
2
)11)(13(
)11)(12(
STD
DUTSTD
in
DUTin
STD
DUTSTD
M
DUTM
1
1
SSSS
SSSS
SS
KK
DD
KK
PP
KK
PP
S
S
(A.10)
を得る。ここで、 DUTDUT
MDUT
in KPP 及び STDSTD
MSTD
in KPP の関係を用いた。式変形す
れば、以下のとおり、式(4)が得られる。
and
14
は標準電力計の反射係数である。これらの式から、被校正電力計に入射する電力DUT
inP 及
び標準電力計に入射する電力STD
inP を求めると、それぞれ、
22
)11)(12(22
DUTin G
S aD
DbP (A.5)
22
)11)(13(23
STDin G
S aD
DbP (A.6)
ただし、
STD33DUT3231
STD23DUT2221
STD13DUT1211
11
1det
SSSSSSSSS
D
G
G
G
(A.7)
STD21
31233321
STD3331
STD2321)11)(12( 1
1det
SSSSS
SSSS
D S (A.8)
DUT31
21322231
31DUT32
21DUT22)11)(13( 1
1det
SSSSS
SSSS
D S (A.9)
である。ここで、 Adet は、行列Aの行列式を表す。
いま、2 つの入射電力を同時に測定して比を求めると、式(A.5)、(A.6)より、
2
DUT31
213222
STD21
3123332
31
21
STD
DUT
2
)11)(13(
)11)(12(
STD
DUTSTD
in
DUTin
STD
DUTSTD
M
DUTM
1
1
SSSS
SSSS
SS
KK
DD
KK
PP
KK
PP
S
S
(A.10)
を得る。ここで、 DUTDUT
MDUT
in KPP 及び STDSTD
MSTD
in KPP の関係を用いた。式変形す
れば、以下のとおり、式(4)が得られる。 If we transform the equation, we obtain Equation (4) as shown below.
15
2
STD21
312333
DUT31
213222
STDM
DUTM
2
21
31STDDUT
1
1
SSSS
SSSS
PP
SSKK (A.11)
式の導出過程において、式(A.7)で示した行列式Dは消去されるため、実際に求める
必要はない。このことは、信号源の反射係数(Γ↓G)が未知でよいことを意味しており、
同時比較法の大きな特長である。 参考文献 [1] 島岡一博,“ 高周波電力計の比較校正方法におけるモデル式の理論解説, “ 第 17 回高
周波クラブ会合,産業技術総合研究所計量標準総合センター, Feb. 2014
[2] 飯塚幸三 監修,“計測における不確かさの表現ガイド,” 日本規格協会, Nov. 1996.
[3] 岩崎俊, “電磁波計測 —ネットワークアナライザとアンテナ—, ” コロナ社, Oct. 2007
(A.11)
In the equation’s derivation process, matrix equation D shown in Equation (A.7) was eliminated, so there is no need to actually obtain it. This means that the signal source reflection coefficient (ΓG) can be unknown, which is a great advantage of the simultaneous comparison method.
ReReRenReR 1 K. SHIMAOKA, “Kousyuha denryokukei no hikaku kousei houhou niokeru
moderu-siki no riron-kaisetsu,” National Metrology Institute of Japan, National Institute of Advanced Industrial Science and Technology, Feb. 2014. (in Japanese)
2 K. IIZUKA, “Guide to the expression of uncertainty in measurement,” Japanese Standards Association, Nov. 1996. (in Japanese)
3 T. IWASAKI, “Electromagnetic Wave Measurements - Network Analyzer and Antenna - ,” CORONA PUBLISHING CO., LTD. Oct. 2007. (in Japanese)
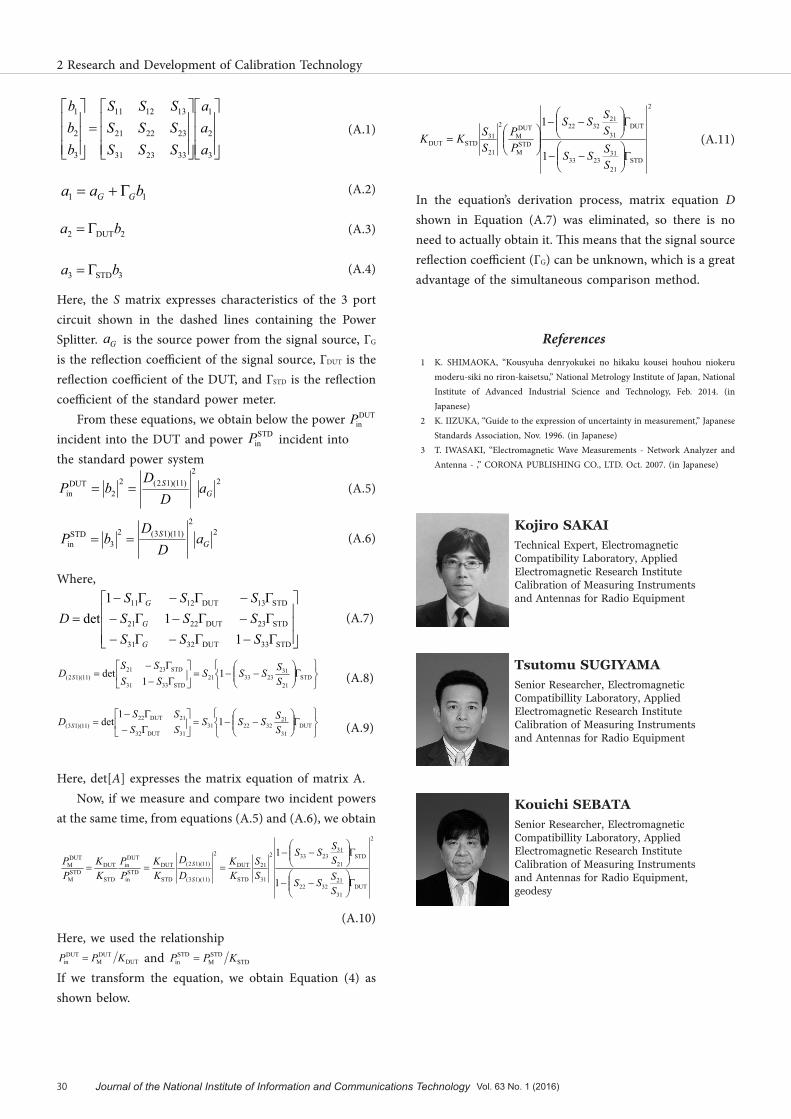
Kojiro SAKAITechnical Expert, Electromagnetic Compatibility Laboratory, Applied Electromagnetic Research InstituteCalibration of Measuring Instruments and Antennas for Radio Equipment
Tsutomu SUGIYAMASenior Researcher, Electromagnetic Compatibillity Laboratory, Applied Electromagnetic Research InstituteCalibration of Measuring Instruments and Antennas for Radio Equipment
Kouichi SEBATASenior Researcher, Electromagnetic Compatibillity Laboratory, Applied Electromagnetic Research InstituteCalibration of Measuring Instruments and Antennas for Radio Equipment, geodesy
30 Journal of the National Institute of Information and Communications Technology Vol. 63 No. 1 (2016)
Title:J2016E-02-02-02.indd p30 2017/03/01/ 水 10:22:57
2 Research and Development of Calibration Technology

Iwao NISHIYAMAElectromagnetic Compatibillity Laboratory, Applied Electromagnetic Research InstituteCalibration of Measuring Instruments and Antennas for Radio Equipment
Katsumi FUJII, Dr. Eng.Research Manager, Electromagnetic Compatibility Laboratory, Applied Electromagnetic Research InstituteCalibration of Measuring Instruments and Antennas for Radio Equipment, Electromagnetic Compatibility
Title:J2016E-02-02-02.indd p31 2017/03/01/ 水 10:22:57
31
2-2-2 Power Meter Calibration 2 (1 mW, 75 Ω)
Related Documents