MagnetoHydroDynamics (MHD) • MHD consists in solving Maxwell’s and fluid dynamics equations for conducting fluids. • Every day’s examples of MHD – Earth’s magnetic field, the Riga dynamo experiment – Plasma physics, magnetosphere, stars (sun’s spots) – Metallurgy (flow control and steering of molten metals) Hannes Alfvén, received the Nobel Prize in Physics in 1970 for his contribution to MHD Forces on charged particles: Electrostatic q E Electrodynamics q dB/dt Lorentz q V×B

Welcome message from author
This document is posted to help you gain knowledge. Please leave a comment to let me know what you think about it! Share it to your friends and learn new things together.
Transcript

MagnetoHydroDynamics (MHD)• MHD consists in solving Maxwell’s and fluid
dynamics equations for conducting fluids.• Every day’s examples of MHD
– Earth’s magnetic field, the Riga dynamo experiment– Plasma physics, magnetosphere, stars (sun’s spots)– Metallurgy (flow control and steering of molten
metals)
Hannes Alfvén, received the Nobel Prize in Physics in 1970 for his contribution to MHD
Forces on charged particles:Electrostatic q EElectrodynamics q dB/dtLorentz q V×B

The Riga Dynamo Experiment

References, further reading
• Alfvén, H., "Existence of electromagnetic-hydrodynamic waves" (1942) Nature, Vol. 150, pp. 405.
• The Riga Dynamo Experiment, A. Gailitis et.al, Surveys in Geophysics 24: 247–267, 2003.
• An Introduction to Magntohydrodynamics, P.A. Davidson, Cambridge 2001.

Numerical example: propagation of shock waves due to external energy deposition
Evolution of a hydro shock. MHD effects reduce the velocity of the shock and the impact of the energy deposition.
Density PressureDensity Pressure Density PressureDensity Pressure
R. Samulyak

MHD in Nufact targetry
• Injection of the High velocity Hg jet into a 20 T dc-magnetic field• Nozzle, MHD enhanced corrosion (Hartmann Layer)
J.P-A 17/05/2001
Observation Box
External Horn
Internal Horn
Hg Injection
Hg Evacuation
Interchangeable
DN 630 Valve
Solenoid Decay Channel
Chamber
Hg Jet ø1cm
Protons
Protons
J. Pier AmauryCERN Nufact team

Setup of the observation chamber in the M9 magnet
Hg‐dynamic pressure in the pipe between pump and valve
Air activatedHg‐pump
Pneumatic valve trigger signal
SS‐vessel
B(z)
Nozzles
Viewingspots
Injectors0° & 6°
Hg‐jets
1 mW Laserlight guide
Mirrors
Valve

22 September 2005 J. Lettry AB‐ATB7
Jet velocities and shapes, injection at 6°, P(Hg) = 64 bar
0 T 10 T 19.3 T
0
2
4
6
8
10
12
0 5 10 15 20
Bmax [Tesla]
V [m
/s]
P(Hb = 64 barP(Hb = 32 bar
0
1
2
3
4
5
6
7
8
9
0 5 10 15 20
Bmax [Tesla]
V [m
/s]
Colinear6 deg.~10ms after the tip of the Hg-jet
Ref: A. FabichPhD. thesis TUV

22 September 2005 J. Lettry AB‐ATB 8
Simulation:R. Samulyak BNL
10 T
Bmax

22 September 2005 J. Lettry AB‐ATB 9
MHD damping of the instabilities of a 11 m/sHg-jet successfully injected into a 19.3 T
magnetic fieldThe radius is measured at a fixed position
Ref: A. FabichPhD. thesis TUV

Materials properties
• Fatigue,• Embrittlement• Heat conductivity• Modulus of elasticity • Rupture• Corrosion, metals compatibility
13‐14 June 08 1Nufact‐school Targetry Bernasque 2008

Meeting on the broken cable in CNGS horn strip lines, 20/09/07
2
Fatigue. • Fatigue behavior is described by Wöler (S-N) diagram and Manson–Coffin
law for low-cycle fatigue• The curve depends on
– Material, state, surface, environment, …• It is an statistical phenomenon, with considerable scattering• It follows initiation – propagation – final fracture
S. Sgobba, JM Dalin, A. Gonzalo

Meeting on the broken cable in CNGS horn strip lines, 20/09/07
3
Fatigue failure • Beach marks• Striations• Secondary cracks
S. Sgobba, JM Dalin, A. Gonzalo

Vertical Section through the Wire Test Apparatus
Current
Inner conductor of co-axial insulator feed-through.
Stainless steel split sphere
Copper “nut”
Current
Two graphite (copper) wedges
Tungsten wire
Spring clips
Fixed connection
Sliding connection
R. Bennett et.al
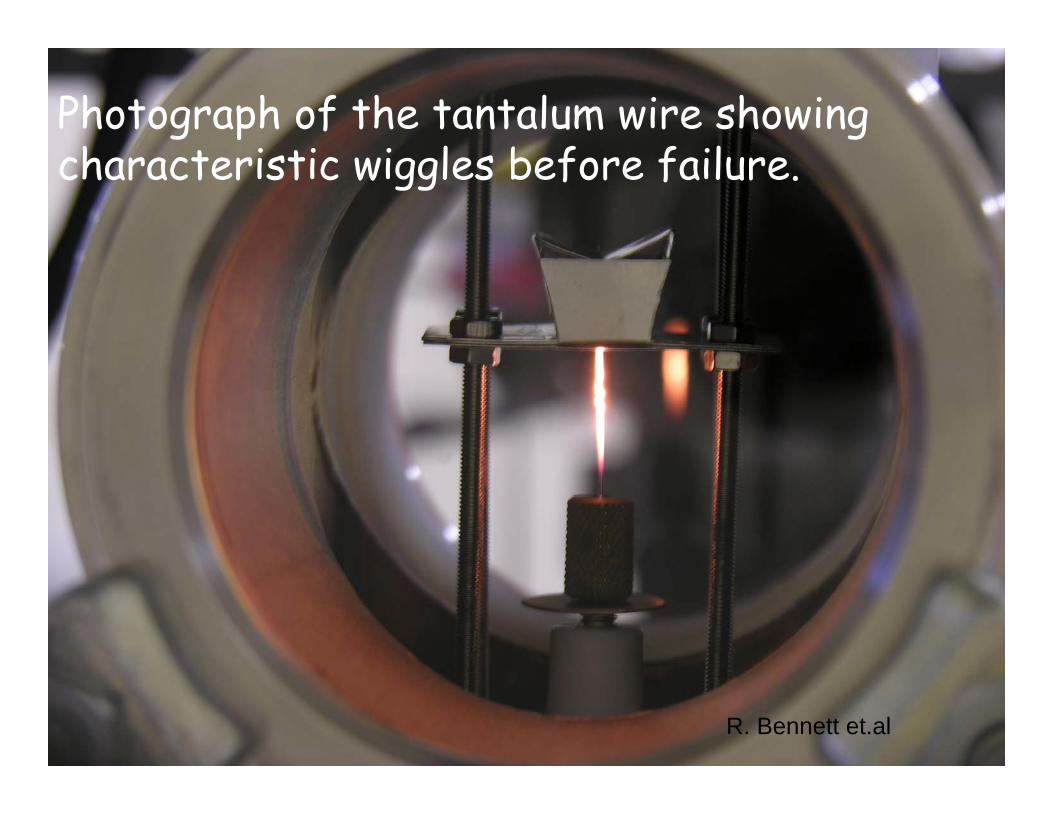
Photograph of the tantalum wire showing characteristic wiggles before failure.
R. Bennett et.al

W3 Tungsten Wire, after operating at 4900 A, peak temperature 1800 K, for 3.3x10⁶ pulses and then a few pulses
at 7200 A at >2000 K.
W5 Tungsten Wire showing “wiggles”: 6200 A, >2000 K peak temperature, 5625 pulses.
R. Bennett et.al

Solid target tests
3h (1Mcycle) test passed~12 days Nufact @1Hz
3d‐code for shock propagation ?
2100°

22 September 2005 J. Lettry AB‐ATB 8
Material tests after irradiation
Few dpas (displacement per atom) expected in materials surrounding
the target
Ref: N.Simos et.at BNL

22 September 2005 J. Lettry AB‐ATB 9
C-composite
Th‐expansion
Ref: N.Simos et.at BNL
Th‐conductivity
Ref: J.P. Bonal et C.H. Wu Nucl. Mat. 277 (2000)

ZrPb‐Canneloni
SINQ-Target Mark 4:Solid target: Lead clad in steel tubes, partly clad in Zircaloy
in service since end of April 2004

Next step for SINQ along the development curve

Few resultsFew resultsFracture toughness of FM steels irradiated in STIP-I
Jia & Dai, IWSMT-7, Thun, 2005, to be published in JNM.
-1 0 1 2 3 4 5 6 7 8 9 100
50
100
150
200
250
300 T91 Ttest=RT T91 Ttest=250°C F82H Ttest=Tirr
Optimax Ttest=Tirr
T91, Maloy
Tirr=250oC
Tirr=170oC
K JQ
(MPa
/m1/
2 )
Dose (dpa)
Tirr=100oC

Few resultsFew results
Inspection on STIPInspection on STIP--II II PbPb--Bi RodBi Rod
Before irradiation
After irradiation ( max dose: 19 dpa)
Target Rod B:It contains a PbBi (about 38 g) filled T91 capsule. Inside PbBi there are about 50 test samples for studying irradiation assisted corrosion effects of PbBi on different kinds of materials.

STIP-II Hg Rod
Hg level
316 L Capsule(0.375 mm thick)
Hg
Ag coil
316 L TubeHe
316 L Capsule (0.375 mm thick)
316L or 9Cr-2W steel capsule
Al
Steel sample
Before irradiation
After irradiation ( max dose: 20 dpa)
Target Rod A:It contains three Hg (about 19 g in total) filled capsules and one steel sample package. There is about 25% free space in each Hg filled capsule.

50 mm
-2 0 2 4 6 8 10 12 14 16 18 20 22 240
50
100
150
200
250
300
350
2.4x1025 p/m23.1x1025 p/m2
2.9x1025 p/m2
1.0x1025 p/m2
Unirr.
Strain (%)
Stre
ss [M
Pa]
SINQ Target Safety Hull:
0
9
18
27
36
45
54
63
72
81
90
99
108
117
126
135
144
153
0 9 18 27 36 45 54 63 72 81 90 99 108
117
126
135
144
153
0 16 32 48 64 80 96 112128144 160
Counts (1/mm^3
)
Distance X (mm)
Distance Y (mm)
Na-22 counts per unit volum (1/mm^3)
144-160128-144112-12896-11280-9664-8048-6432-4816-320-16
0
9
18
27
36
45
54
63
72
81
90
99
108
117
126
135
144
153
0 9 18 27 36 45 54 63 72 81 90 99 108
117
126
135
144
153
0 16 32 48 64 80 96 112128144 160
Counts (1/mm^3
)
Distance X (mm)
Distance Y (mm)
Na-22 counts per unit volum (1/mm^3)
144-160128-144112-12896-11280-9664-8048-6432-4816-320-16
γ-mapping of the beam footprint
Tensile tests after one year of irradiation

Conclusion • The materials of the target area will evolve along with the
irradiation time – The Displacement per atom (dpa) is the (time) scale to measure
this evolution– This evolution shall be included in the engineering design.
• Metal chemistry under high dpas is starting, radiogenic H and He trapped in metals will affect their properties.
• Fatigue is a key element that is not yet fully investigated (experimental challenge) under irradiation– Annealing of the parts kept at elevated temperature may be
beneficial.

22 November 2005 n‐ToF11 MERIT‐collaboration, J. Lettry 1
MERIT will:• Produce benchmarks for Neutrino Factory targetry design tools
– Study MHD of the Hg jet with nominal size and velocity – Study the origin of jet disruption by varying PS spill structure “Pump /
Probe”• Validate the Neutrino Factory targetry concept
– Effects of single beam pulses with realistic proton energy, timing, intensity and energy density
– Influence of solenoid field strength on Hg jet dispersal (MHD shock damping)
– Information on the 50 Hz operations scenario by recording 2 pulses at 20 ms interval.
• Define potential issues and open the path to engineering study• Set a milestone towards 1-4 MW pion production target

April 2008 I.Efthymiopoulos, CERN
The MERcury Intense Target Experiment – or nTOF11
I. Efthymiopoulos – CERN, AB Dept.
(for the MERIT collaboration)
MUTAC ReviewLNBL – April 9, 2008
Beam jet interaction @ MERIT 14 GeV/c beam, 12TP, 10T field

April 2008 I.Efthymiopoulos, CERNApril 2008 I.Efthymiopoulos, CERN 3
MERIT Experiment – The apparatus
Target chamberSolenoid
Hg container
Hg-jet hydraulic system
Proton Beam

13th February 2008 J. Lettry
Optical diagnostics

22 November 2005 n‐ToF11 MERIT‐collaboration, J. Lettry 5
Observation chamber
Deflector
Hg Jet HgPlenum
Hg Exit
Beam Windows
Z=0 Viewport
ProtonBeam
Beam TubeWindow
Nozzle under R&D

Nozzle Configuration
A : Reduction after 180 degree bend with 44 mrad angle with respect to magnet axis.
B : Reduction before 180 degree bend with 44 mrad angle with respect to magnet axis.
C : Reduction after 180 degree bend, but straight nozzle withno tilted angle with respect to magnet axis.
D : Nozzle A is reamed through the nozzle flange.
Nozzle A
Nozzle B

22 November 2005 n‐ToF11 MERIT‐collaboration, J. Lettry 7
MHD + shock Simulations BNL (Samulyak)
B = 0T
B = 2T
B = 4T
B = 6T
B = 10T
T = 80 μs, Emax = 100 J/g, B = 0 T
T = 80 μs
T = 90 μs
T = 118 μs
T = 134 μs
Gaussian energy deposition profilePeaked at 100 J/g. Times run from
0 to 124 μs, B = 0 TJet dispersal at t = 100 μs with magneticField varying from 0 to 10 Tesla
Axial symmetric splashes amped by MHD forces

April 2008 I.Efthymiopoulos, CERNApril 2008 I.Efthymiopoulos, CERN 8
MERIT Experiment – Scientific Goals
1. Study MHD effects on Hg-jet with normal target size and velocity
2. Study jet disruption (cavitation?) by varying the PS spill structureMERIT: 180 J/g
28TP@24GeV protons1cm diam. Hg-jet1.2×1.2 mm2 beam size rms
Important milestone towards the production of 1-4MW pion production targets
Jet dispersed by 3 bunches, existence of cavitation bubble reducing the nominal density probed by the 4th bunch
R.S
amul
yak-
BNL

April 2008 I.Efthymiopoulos, CERNApril 2008 I.Efthymiopoulos, CERN 9
MERIT Experiment – Layout
Solenoid & Hg loop
Upstream beam elements (new)Quadrupoles for final focusingCollimatorBeam profile measurementBeam intensity measurement
Beam dump
Racks & electronics
N2 Exhaust lineMaterial access shaft
Personnel access

April 2008 I.Efthymiopoulos, CERNApril 2008 I.Efthymiopoulos, CERN 10
Particle fluxes Particle fluxes -- 3×10¹³ protons (MARS Simulation)
Particle Detectors
Measure particle production per bunch in “pump-probe” runs for cavitationstudiesPlace detectors around the target at various locations
Detectors: pCVD diamonds, pin diodes, ACEM detectorsMonitor the beam-target interaction
charged hadrons (E>200 KeV)
neutrons (E>100 KeV)
S.Striganov - FNAL
Particle Detectors

April 2008 I.Efthymiopoulos, CERNApril 2008 I.Efthymiopoulos, CERN 11
Particle Detectors
pCVD Diamond7.5×7.5 mm2 active area, 300 um thick
PIN diode~1cm2 active area, 200 um thick bypass capacitor: 100 nF/500V
Final packaging
ACEM detector
pCVDdiamond + PIN diode
Detector assembly unit

April 2008 I.Efthymiopoulos, CERNApril 2008 I.Efthymiopoulos, CERN 12
Cryogenics – Surface tests
Commissioning tests of the cryogenics system with the solenoid at surface
~25m full cycle

April 2008 I.Efthymiopoulos, CERNApril 2008 I.Efthymiopoulos, CERN 13
Operation with beam
The repair work was finally made on October 5th
At the end of the intervention three of the four viewports were operational although with some compromised image quality
Since then, the rest of the run was very smooth without major issues.
The run took place between October 22nd to November 12th (21 days)
We managed to fully exploit the capabilities of the PS machine: 14 and 24 GeV/c of extracted beam, variable bunch structure and timing.

April 2008 I.Efthymiopoulos, CERNApril 2008 I.Efthymiopoulos, CERN 14
Beam setup for cavitation studies
Setup the PS machine in harmonic-16 fill the machine in bunch pairs
PossibleChosen
PUMP: 6 bunches, 15*1012 protons
PROBE: 2 bunches, 5*1012 protons
dn
n=1
dnexperiment = 0,2,4,6,8, 16,18,20,22,24, 32,40, 48,56, …
switching between harmonic-8 and harmonic-16 was possible allowed us to study the target disruption length vs beam structure

April 2008 I.Efthymiopoulos, CERN
Beam shots summary
Beam envelop – (1σ)
30 TP shot @ 24 GeV/c• 115 kJ of beam power• a PS machine record !
Beam Horiz. Vert. Spot Beam Density[GeV/c] [mm] [mm] [mm2] [J/gr @ 30 TP]
14 4.45 0.87 12.18 80.4
24 2.94 0.66 6.13 160
April 2008 15I.Efthymiopoulos, CERN

April 2008 I.Efthymiopoulos, CERN
Interaction – 8,12 Tp – 14 GeV/c – 0,5,10 T
8 Tp beam, 0T field 8Tp beam, 5T field 12 Tp beam, 10T field
April 2008 16I.Efthymiopoulos, CERN

April 2008 I.Efthymiopoulos, CERN
Jet observations
Summary-I
The splash begins at the bottom of jet and ends at the top, which seems to be consistent with the beam trajectory.
The breakup is consistent with the beam trajectory and could be the by-product of cavitation caused by the energy deposition of the proton beam.
April 2008 17I.Efthymiopoulos, CERN

April 2008 I.Efthymiopoulos, CERN
6TP, 5T
t=0 t=0.175 ms t=0.375 mst=0.050 ms
V = 47 m/s
Splash velocity - 24 GeV beam: ~7 m/s/Tp
t=0 t=0.175 ms t=0.375 mst=0.150 ms
3.8TP, 10T V = 24 m/s
April 2008 18I.Efthymiopoulos, CERN

April 2008 I.Efthymiopoulos, CERN
0.4 T
10 T
5 T
15 T
Hg-jet vs Magnetic field
Jet velocity : 15 m/s
April 2008 19I.Efthymiopoulos, CERN

April 2008 I.Efthymiopoulos, CERN
0 2 4 6 8 10 12 14 1602468
1012141618202224262830
Distance from nozzle, 30cmDistance from nozzle, 45cmDistance from nozzle, 60cm
Jet w
idth
, mm
Magnetic induction field, T
Jet width vs magnet axis
0 2 4 6 8 10 12 14 16-300
-250
-200
-150
-100
-50
0
50
100
150
200
250
300
Distance from nozzle, 30cmDistance from nozzle, 60cm
Jet a
ngle
, mra
d
Magnetic induction field, T
Jet angle vs magnetic field
0 1 2 3 4 50
1
2
3
4
5
Distance from nozzle, 30cm, top surface Distance from nozzle, 45cm, top surfaceDistance from nozzle, 60cm, top surfaceDistance from nozzle, 30cm, bottom surfaceDistance from nozzle, 45cm, bottom surfaceDistance from nozzle, 60cm, bottom surface
Surf
ace
fluct
uatio
n of
jet,
mm
RM
S
Magnetic induction field, T
Jet width fluctuation vs magnetic field
Hg-jet properties – 15m/s jet
-2 0 2 4 6 8 10 12 14 160
2
4
6
8
10
12
14
16
18
20
22
24
Long
itudi
nal j
et v
eloc
ity, m
/s
Magnetic induction field, T
Jet speed vs magnetic field
April 2008 20I.Efthymiopoulos, CERN
April 2008 I.Efthymiopoulos, CERN
0 2 4 6 8 10 12 14 16 18 20 22 24 26 28 30 32
0.000
0.025
0.050
0.075
0.100
0.125
0.150
0.175
0.200
0.225
0.250
0.275
0.300
B=0TB=5TB=10TB=15T
Dis
rupt
ion
leng
th, m
Beam intensity, TP
0 2 4 6 8 10 12 14 16 18 20 22 24 26 28 30 32
0.000
0.025
0.050
0.075
0.100
0.125
0.150
0.175
0.200
0.225
0.250
0.275
0.300
B=0TB=5TB=10TB=15T
Dis
rupt
ion
leng
th, m
Beam intensity, TP
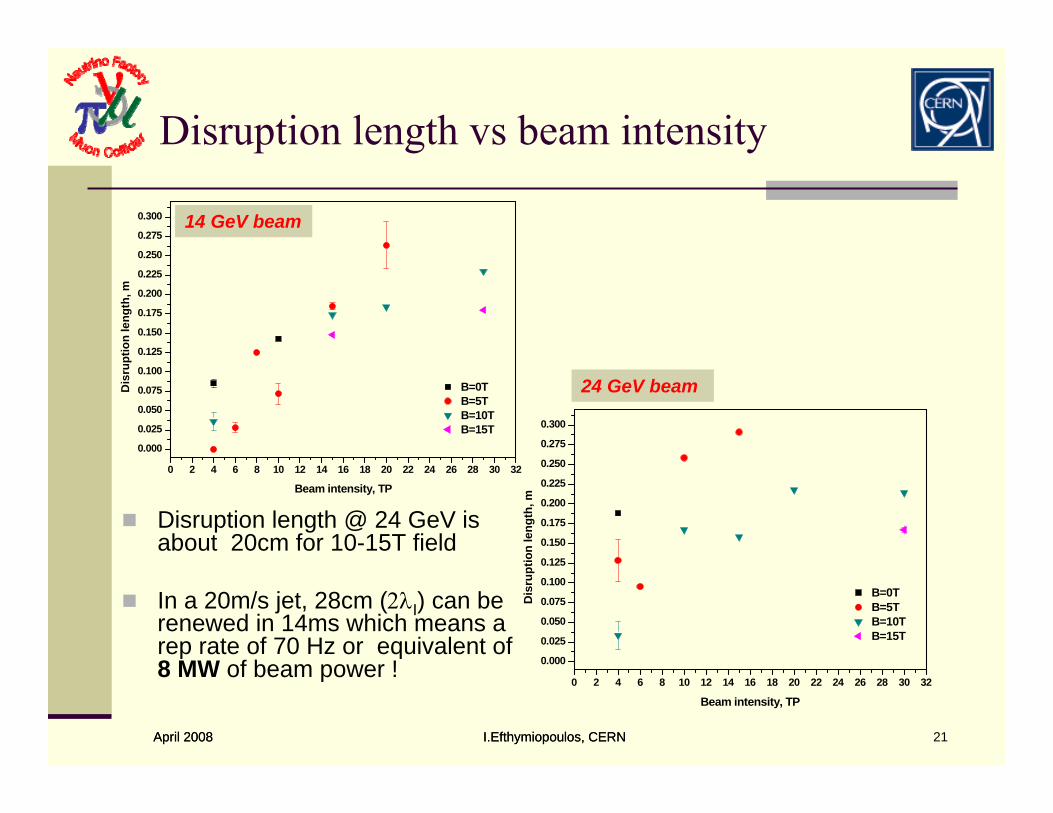
14 GeV beam
24 GeV beam
Disruption length vs beam intensity
Disruption length @ 24 GeV is about 20cm for 10-15T field
In a 20m/s jet, 28cm (2λI) can be renewed in 14ms which means a rep rate of 70 Hz or equivalent of 8 MW of beam power !
April 2008 21I.Efthymiopoulos, CERN

April 2008 I.Efthymiopoulos, CERN
Jet observations
Summary-II
The break up of the Hg jet is influenced by the magnetic field. The splash velocity increases as the beam intensity increases, however, magnetic field reduces the effectThe Hg jet disruption length is suppressed by magnetic field.
The 24GeV proton beam results in a longer disruption length than the 14GeV proton beam. The intensity threshold for the 24GeV beam is lower than the 14GeV beam.
The magnetic field stabilizes the Hg jet flow. The fluctuations on the jet surface decreases as the magnetic field increases.
The jet size increases as it moves to downstream and it was same up to 10T but increases at 15T.
The jet size at 10T was smaller than that for a 15T field, which might have varied between the major and minor axis of an elliptical core.
The longitudinal Hg jet velocity was not affected by the magnetic field.
April 2008 22I.Efthymiopoulos, CERN

April 2008 I.Efthymiopoulos, CERN
0 200 400 600 800 1000 1200time �ns�
0
0.2
0.4
0.6
0.8
1
Normalized
intensity
Run 12028
Proton beam intensity measurement
Current transformer data analysisNon-trivial analysis due to internal noise in the device
April 2008 I.Efthymiopoulos, CERN 23

April 2008 I.Efthymiopoulos, CERN
Particle detector data
pCVD diamond detector (left 20-deg location)
14 GeV beam4TP10T Field15m/s Hg Jet
131 ns
Good performanceAble to identify individual bunches event at the highest intensities
Needs to be combined with the beam intensity per bunch to normalize
Data analysis ongoing…
April 2008 24I.Efthymiopoulos, CERN

April 2008 I.Efthymiopoulos, CERN
Particle detector - flux measurement
Good agreement with MC simulation for target-out dataLarge discrepancy for target-in case
needs further understanding, along with further simulation studies and beam spot analysis
April 2008 I.Efthymiopoulos, CERN 25

April 2008 I.Efthymiopoulos, CERN
Summary
After facing successfully several challenges, the MERIT experiment took beam as scheduled for three weeks in autumn 2007 at CERN PS
All systems performed well, the run with beam was very smooth and the whole scientific program was completed
The experiment was dismantled in winter 2008 with its componentsput in temporary storage for cool-down at CERN waiting to be shipped back to US
The primary objective to conduct a successful and safe experiment at CERN was amply fulfilled
Important results validating the liquid metal target concept are already available, more to come as the analysis progresses
The MERIT experiment represents a big step forward in the targetryR&D for high power targets.
April 2008 I.Efthymiopoulos, CERN 26

22 November 2005 n‐ToF11 MERIT‐collaboration, J. Lettry 27
The MERIT Experiment do closely match the nominal parameters of the ν-factory
• 24 GeV Proton beam• Up to 28 x 1012 Protons (TP) per 2 μs spill• Proton beam spot with r ≤ 1.5 mm rms• 1 cm diameter Hg Jet• Hg Jet/Proton beam off solenoid axis
– Hg Jet 100 mrad– Proton beam 67 mrad
• Test 50 Hz operations– 20 m/s Hg Jet– 2 spills separated by 20 ms

13th February 2008 J. Lettry
View on mercury jet
Run 103• 14 GeV/c• 1.6*1013 protons/pulse• B‐field 5 T
Run 119• 14 GeV/c• 1.6*1013 protons/pulse• B‐field 5 T
Run 214• 14 GeV/c• 1.2*1013 protons/pulse• B‐field 10 T
• Images were recorded at 2000 frames/second.• Play‐back is about 400 times slower.• Splash velocities up to 60 m/s observed.
1 cm

To be presented at Nufact 08

The Beam dump of a 4 MW proton beam, activation, radioactive waste and target handling issues
Examples of CNGS (doserate) and T2K (Dump)
EURISOL-DS (Activation of concrete)
13‐14 June 08 1Nufact‐school Targetry Bernasque 2008

28th‐30th June 2004 CNGS target 2
Total remanent dose rate (mSv/h) (200 days irradiation)1 day cooling 1 week cooling
3 mSv/h
10 mSv/h 3 mSv/h
50 μSv/h
CNGS-Remanent dose rates … well shielded ~1/500
All possible human interventions needs description, timing and training

14/06/2008
T2K graphite Hadron Absorber
4,6
94,6
9
3,153,15
BeamBeam
2.32.3
Graphite BlocksGraphite Blocks+ cooling module + cooling module
layoutlayout
C. Densham et.al

14/06/2008
Thermal Model for 4 MW proton beam at 30 GeV
Realistic thermal (He) links between blocks
Maximum temperature 829ºC (too hot)
0.1 mm He gap (x)
1 mm He gap (y)
2 mm He gap (z)C. Densham et.al

14/06/2008
Cooling module temperatures
Maximum temperature = 135 C
Cross‐section through cooling
module at shower maximum
3,000 W/m2/KWater cooling
C. Densham et.al

14/06/2008
Conclusions
• Graphite temperatures acceptable for up to 3 MW beam operation• Single point connection for each graphite block to cooling module is
preferable to multi-point connections• Splitting graphite blocks along centreline reduces stresses to
acceptable level• Downstream copper core planned to be replaced with iron and plate
coil water cooling. More work needed to reduce stresses
C. Densham et.al

EURISOL 4MW Hg beam dump09Shielding specific activity
Concrete, 0 degree, at 1m70
Ca41
Ar39
H3
Fe55
Ca45Ar37
Total
Activity profile (Bq/g) as a function of shielding coordinates (r, z) of the MMW target station, located at (0,0): on the top – after 1 year of cooling. The time evolution of the activity of the shielding concrete after forty years of operations is also shown. In this simulation, 2.3 MW are deposited in the Hg neutron spallation source out of the 4 MW average beam power.
D. Ridikas

H. Ravn CERN High‐power Targetry for Future Accelerators 7/9/2003
1
β-ν-beam baseline scenario 2003
PS
SPS
ISOL target & Ion source
SPL
CyclotronsStorage ring and fast cycling synchrotron
Decay
Ring
Decay ring
Brho = 1500 Tm
B = 5 T
Lss = 2500 m
MeV 86.1 Average
MeV 937.1 Average
189
1810
63
62
=→
=→
+
−
cms
cms
EeFNe
EeLiHe
ν
ν
Why not solve the muon production and cooling problem by deriving neutrinos beams from stored short‐lived beta emitters (P. Zuchelli)
Beta‐decay νe‐beams

Louvain la neuvecyclotron
Typical intensities
After
post‐acceleration
and
isobaric separation
on experimenter’s target
10Carbon 19.3 s 1+ 5.6 - 11 2·105
7Beryllium 53 days 1+ 5.3 – 12.9 2·107
2+ 25 – 62 4·106
Element T1/2 q Energy Range [MeV]
Intensity[pps]*
6Helium 0.8 s 1+ 5.3 – 18 1·107
2+ 30 – 73 3·105
2+ 7.5 – 9.5 5·109 (CYC44)
11Carbon 20 min 1+ 6.2 – 10 1·107
13Nitrogen 10 min 1+ 7.3 – 8.5 4·108
2+ 11 – 34 3·108
3+ 45 – 70 1·108
15Oxygen 2 min 2+ 10 – 29 6·107
18Fluorine 110 min 2+ 11 – 2418Neon 1.7 s 2+ 11 – 24 1·107
3+ 24 – 33, 45 – 55 4·106
19Neon 17 s 2+ 11 – 23 2·109
3+ 23 – 35, 45 – 50 1.5·109
4+ 60 – 93 8·108
35Argon 1.8 s 3+ 20 – 28 2·106
5+ 50 – 79 1·105
1·1065·106
2+ 24 - 44 1 104
M. Loiselet

H. Ravn CERN High‐power Targetry for Future Accelerators 7/9/2003
3
6He production by 9Be(n,α)
Ref:
Ulli Köster
U

4
RIB-Ion-sources efficiencies+ ARC-ECRIS charge state breeder ?
0
5
10
15
20
25
0 20 40 60 80 100Z
Ioni
zatio
n po
tent
ial
[eV
]
ECR ?NegativePlasmaSurface
0.1%
1.0%
10.0%
100.0%
0 4 8 12 16 20 24
Ionisation potential [4-25 eV]
Ioni
satio
n ef
ficie
ncy RILIS
ECR FEBIAD
W-surface
LaB6-surfaceKENIS
Electron Affinity [0-4 eV]
RILIS
EURORIB‐08 Giens, June 9th 2008

5
“Thick” target ISOL
Protons
+/- 8V500A
+/- 9V1000A
*
Experiment & Post acceleration
Pre‐Separation, SeparationExtraction, beam optics
Ionisation
Molecular transportEffusion
DiffusionDiffusion
~1 GeV p‐driver Nucl. reaction
Target material 5‐200 g/cm2
“Oven ‐ Radiator” (Ta,Mo,Nb, C …)
Ion‐source & Transfer line (Ta,Mo,Nb, C …)
EURORIB‐08 Giens, June 9th 2008
Noble gases
ions

6
Release of noble gases from UCx target and MK7 ion-source
Noble gases released from UC2-159
0
2000
4000
6000
8000
10000
1 10 100 1000 10000 100000
time [ms]
Nor
mal
ized
cou
ntra
te [
a.u.
]
13-May 220Rn13-May Xe 13913-May Kr 9018-May 43Ar17-May 23Ne13-May 6He
Scaling and parameterization of release Vs. Temperature, masses, diffusion coefficients,
and desorption enthalpiesTrapped Mother in the target (i.e. 224Ra – 220Rn)
EURORIB‐08 Giens, June 9th 2008

H. Ravn CERN High‐power Targetry for Future Accelerators 7/9/2003
7
Mercury-jet p-n converter surrounded by a Uranium carbide target
75% of the protons continues to the beam dump
Fission target
kept at 2200 C

H. Ravn CERN High‐power Targetry for Future Accelerators 7/9/2003
8
6He production by 9Be(n,α)
0
20
40
60
80
100
120
0 2 4 6 8 10 12 14 16En (MeV)
(mb)
9Be(n,α)6He reaction favorable:
•Threshold: 0.6 MeV
•Peak cross-section 105 mb
•Good overlap with evaporation part of spallation neutron spectrum: n(E)∼√E*exp(-E/Ee)
•Ee: 2.06 MeV for 2 GeV p on Pb G.S. Bauer, NIM A463 (2001) 505
•BeO very refractory

Targetry Challenges & tools, a Conclusion
• Proton beam– Energy and time structure– Pion-Cross sections
• Molten metal targets (cooling & transport)– Hight pressure high velocity molten metal fluid dynamics
• Cavitation in the piping, Corrosion• Recuperation of high velocity splashes, Phase transition
– Purification of the molten metal circuits– MHD of molten metal jets
• Solid targets (cooling & transport)– Effect of dpa and radiogenic chemical impurities on material properties– High velocity mechanics under vacuum– Compaction of Ta-beads, powders
• Component reliability or life time of pion-optics vs. exchange time– Horns & Solenoids
• Simulation codes – Detailled Energy deposition (MARS, GEANT, FLUKA)– Shock transport elastic-plastic (LS-Dyna, Autodyn,…)– 3d-Shocks in liquids with MHD
• Activation of components, inventory of specific activities vs. time– Radioactive waste handling– Internal transport, intermediate storage– End disposal
• Experimental areas dedicated to target tests (highest radiotoxicity)– Optical measurement techniques in high radiation environment
Related Documents