1 Rio de Janeiro, May 15, 2014. Distribution Company’s consumption grew 7.8% in 1Q14 Consolidated net income increased 129.5% Total energy consumption came to 7,374 GWh in 1Q14, 7.8% up from 1Q13 driven by increased consumption in the residential and commercial segments, which rised by 13.6% and 8.3%, respectively; Consolidated net revenue, excluding revenue from construction, totaled R$2,118.7 million in 1Q14, 20.1% up from 1Q13. Despite the growth in all segments, the comercialization and generation activities stood out in the quarter, posting revenue growth of 87.1% and 45.4%, respectively, when compared with the same period last year; Consolidated EBITDA 1 amounted to R$452.9 million in the quarter, 27.5% higher than in 1Q13, impacted by spot market energy sales by the generation company. When adjusted for the CVA, EBITDA came to R$434.7 million in 1Q14, 4.7% down from 1Q13 Adjusted EBITDA . Net income totaled R$180.5 million in the quarter, 129.5% up from 1Q13, due to the operational performace in the generation segment and the improved financial result. When adjusted for the CVA, net income totaled R$168.5 million, 15.9% above the figure reported in 1Q13. Non-technical energy losses in the last 12 months, as a percentage of billed energy in the low-voltage market (ANEEL criterion), due to high temperatures in the quarter, recorded a slight increase of 0.2 p.p. in relation to the previous quarter, reaching 42.4% in March 2014. Collections stood at 94.6% of billed consumption in 1Q14, 6.4 p.p. down on the same quarter last year. Provisions for Past Due Accounts (PCLD) represented 1.0% of gross billed energy, totaling R$25.3 million, an improvement of 12.8% over 1Q13. The Company closed 1Q14 with net debt of R$5,341.8 million, 1.8% up from December 2013 net debt, adjusted by the pension fund, which was fully settled in February 2014. The net debt/EBITDA ratio stood at 2.90x. BM&FBOVESPA: LIGT3 Conference Call: IR Contacts: OTC: LGSXY Date: 16/05/2014 Phone: +55 (21) 2211-2828/7392 Total shares: 203,934,060 shares Time: 3:00 p.m. (Brazil) // 2:00 p.m.( US ET) Fax: +55 (21) 2211-2787 Free Float: 76,264,255 shares (37.57%) Phone numbers: +55 (11) 2188 0155 // +1 (646) 843 6054 Email: [email protected] Market Cap (05/14/14): R$ 4.079 million Webcast: ri.light.com.br Website: ri.light.com.br 1 EBITDA is calculated in accordance with CVM Instruction 527/2012 and represents net income +income and social contribution tax + net financial expenses + depreciation and amortization. 1Q14 1Q13 Var. % Grid Load* 10,944 9,910 10.4% Billed Energy - Captive Market 6,117 5,572 9.8% Consumption in the concession area 7,374 6,841 7.8% Transported Energy - TUSD 1,257 1,269 -0.9% Sold Energy - Generation 1,264 1,267 -0.2% Commercializated Energy (Esco) 1,338 1,031 29.8% 1Q14 1Q13 Var. % Net Revenue** 2,119 1,765 20.1% EBITDA 453 355 27.5% EBITDA Margin** 21.4% 20.1% 1,3 p.p. Net Income 181 79 129.5% Net Debt 5,342 4,031 32.5% Capex 176 163 7.9% * Own Load + network use ** Does not consider construction revenue Operational Highlights (GWh) Financial Highlights (R$ MN)

Welcome message from author
This document is posted to help you gain knowledge. Please leave a comment to let me know what you think about it! Share it to your friends and learn new things together.
Transcript
1
Rio de Janeiro, May 15, 2014.
Distribution Company’s consumption grew 7.8% in 1Q14
Consolidated net income increased 129.5%
Total energy consumption came to 7,374 GWh in 1Q14, 7.8% up from 1Q13 driven by increased consumption in
the residential and commercial segments, which rised by 13.6% and 8.3%, respectively;
Consolidated net revenue, excluding revenue from construction, totaled R$2,118.7 million in 1Q14, 20.1% up from
1Q13. Despite the growth in all segments, the comercialization and generation activities stood out in the quarter,
posting revenue growth of 87.1% and 45.4%, respectively, when compared with the same period last year;
Consolidated EBITDA1 amounted to R$452.9 million in the quarter, 27.5% higher than in 1Q13, impacted by spot
market energy sales by the generation company. When adjusted for the CVA, EBITDA came to R$434.7 million in
1Q14, 4.7% down from 1Q13 Adjusted EBITDA .
Net income totaled R$180.5 million in the quarter, 129.5% up from 1Q13, due to the operational performace in the
generation segment and the improved financial result. When adjusted for the CVA, net income totaled R$168.5
million, 15.9% above the figure reported in
1Q13.
Non-technical energy losses in the last 12
months, as a percentage of billed energy in the
low-voltage market (ANEEL criterion), due to
high temperatures in the quarter, recorded a
slight increase of 0.2 p.p. in relation to the
previous quarter, reaching 42.4% in March 2014.
Collections stood at 94.6% of billed consumption
in 1Q14, 6.4 p.p. down on the same quarter last
year. Provisions for Past Due Accounts (PCLD)
represented 1.0% of gross billed energy, totaling
R$25.3 million, an improvement of 12.8% over
1Q13.
The Company closed 1Q14 with net debt of
R$5,341.8 million, 1.8% up from December 2013
net debt, adjusted by the pension fund, which was fully settled in February 2014. The net debt/EBITDA ratio stood
at 2.90x.
BM&FBOVESPA: LIGT3 Conference Call: IR Contacts: OTC: LGSXY Date: 16/05/2014 Phone: +55 (21) 2211-2828/7392 Total shares: 203,934,060 shares Time: 3:00 p.m. (Brazil) // 2:00 p.m.( US ET) Fax: +55 (21) 2211-2787 Free Float: 76,264,255 shares (37.57%) Phone numbers: +55 (11) 2188 0155 // +1 (646) 843 6054 Email: [email protected] Market Cap (05/14/14): R$ 4.079 million Webcast: ri.light.com.br Website: ri.light.com.br
1 EBITDA is calculated in accordance with CVM Instruction 527/2012 and represents net income +income and social contribution tax + net
financial expenses + depreciation and amortization.
1Q14 1Q13 Var. %
Grid Load* 10,944 9,910 10.4%Billed Energy - Captive Market 6,117 5,572 9.8%Consumption in the concession area 7,374 6,841 7.8%Transported Energy - TUSD 1,257 1,269 -0.9%Sold Energy - Generation 1,264 1,267 -0.2%Commercializated Energy (Esco) 1,338 1,031 29.8%
1Q14 1Q13 Var. %
Net Revenue** 2,119 1,765 20.1%EBITDA 453 355 27.5%EBITDA Margin** 21.4% 20.1% 1,3 p.p.Net Income 181 79 129.5%
Net Debt 5,342 4,031 32.5%
Capex 176 163 7.9%* Own Load + network use
** Does not consider construction revenue
Operational Highlights (GWh)
Financial Highlights (R$ MN)
2
Presentation of 1Q13 results
The Company’s 1Q13 results were reclassified due to the decision of the Management to present PIS and COFINS tax
credits on purchased energy as a reduction factor for purchased energy costs instead of presenting them as a
reduction in PIS and COFINS on revenue. The purpose of this reclassification was to align the presentation criterion
with the best practices of companies in the same sector.
The reclassification affected net revenue and non-manageable costs, but it did not affect EBITDA and net income.
The Administration also reviewed the criteria for the presentation of contractual debt amortization with the pension
plan in the statement of cash flows, providing only a reclassification for the period of 2013 for comparison purposes.
For further information, see Exhibit VI attached to this release.
3
Table of Contents
1. The Company............................................................................................................................................... 4
2. Operating Performance ............................................................................................................................... 5
2.1 Distribution ........................................................................................................................................ 5
Energy Balance .................................................................................................................... 6
Energy Losses ...................................................................................................................... 7
Collection ............................................................................................................................ 9
Operating Quality .............................................................................................................. 11
2.2 Generation ....................................................................................................................................... 12
2.3 Commercialization and Services ...................................................................................................... 12
3. Financial Performance ............................................................................................................................... 13
3.1 Net Revenue .................................................................................................................................... 13
Consolidated ..................................................................................................................... 13
Distribution ....................................................................................................................... 13
Generation ........................................................................................................................ 14
Commercialization and Services ......................................................................................... 14
3.2 Costs and Expenses ......................................................................................................................... 15
Consolidated ..................................................................................................................... 15
Distribution ....................................................................................................................... 15
Generation ........................................................................................................................ 18
Commercialization and Services ......................................................................................... 18
3.3 EBITDA ............................................................................................................................................ 19
Consolidated ..................................................................................................................... 19
Distribution ....................................................................................................................... 20
Generation ........................................................................................................................ 20
Commercialization and Services ......................................................................................... 20
3.4 Consolidated Financial Result .......................................................................................................... 21
3.5 Debt ................................................................................................................................................. 22
3.6 Net Income ...................................................................................................................................... 24
3.7 Investments ..................................................................................................................................... 25
Generation Capacity Expansion Projects ................................................................................... 26
4. Cash Flow .................................................................................................................................................. 29
5. Corporate Governance .............................................................................................................................. 30
6. Capital Markets ......................................................................................................................................... 31
7. Recent Events ............................................................................................................................................ 34
8. Disclosure Program ................................................................................................................................... 35
4
1. The Company
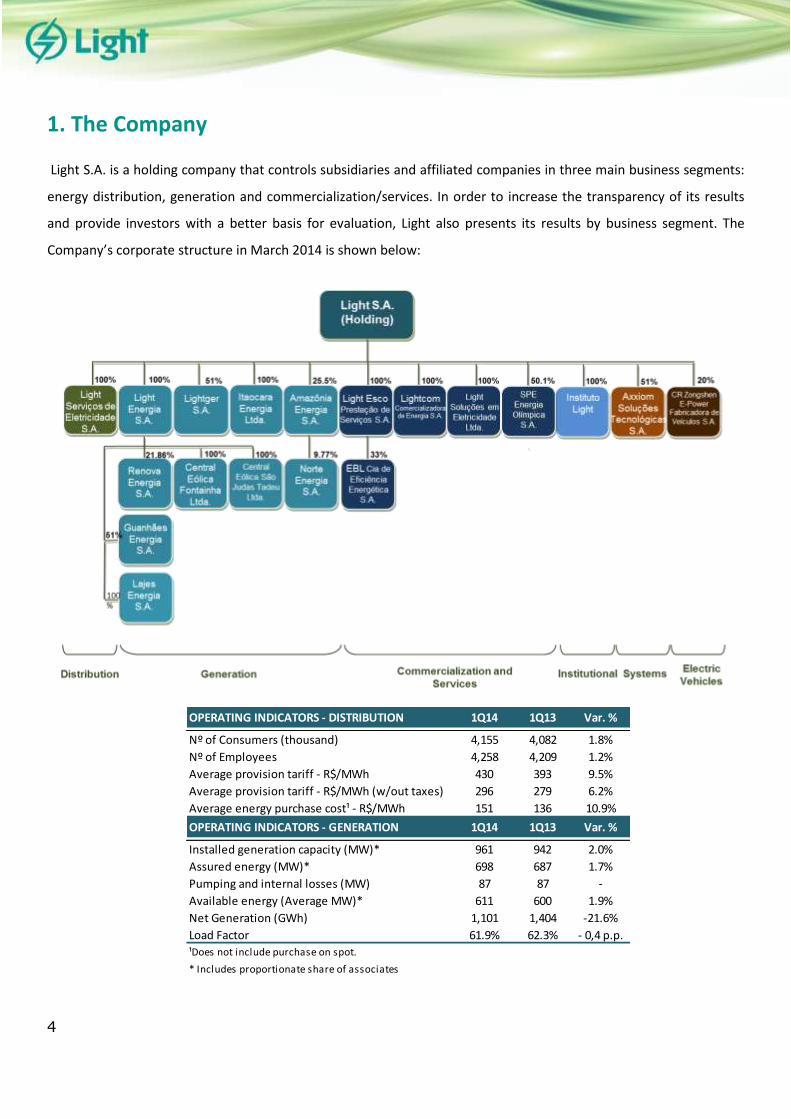
Light S.A. is a holding company that controls subsidiaries and affiliated companies in three main business segments:
energy distribution, generation and commercialization/services. In order to increase the transparency of its results
and provide investors with a better basis for evaluation, Light also presents its results by business segment. The
Company’s corporate structure in March 2014 is shown below:
OPERATING INDICATORS - DISTRIBUTION 1Q14 1Q13 Var. %
Nº of Consumers (thousand) 4,155 4,082 1.8%
Nº of Employees 4,258 4,209 1.2%
Average provision tariff - R$/MWh 430 393 9.5%
Average provision tariff - R$/MWh (w/out taxes) 296 279 6.2%
Average energy purchase cost¹ - R$/MWh 151 136 10.9%
OPERATING INDICATORS - GENERATION 1Q14 1Q13 Var. %
Installed generation capacity (MW)* 961 942 2.0%
Assured energy (MW)* 698 687 1.7%
Pumping and internal losses (MW) 87 87 -
Available energy (Average MW)* 611 600 1.9%
Net Generation (GWh) 1,101 1,404 -21.6%
Load Factor 61.9% 62.3% - 0,4 p.p.
¹Does not include purchase on spot.
* Includes proportionate share of associates
5
2. Operating Performance
2.1 Distribution
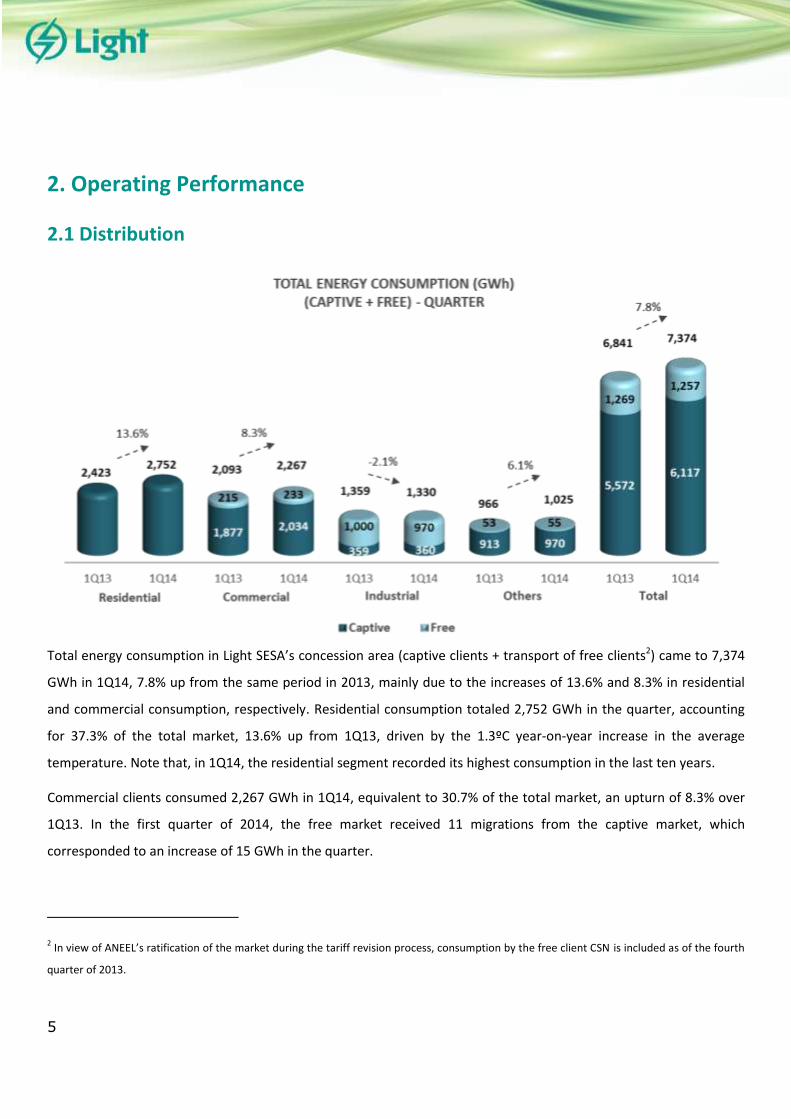
Total energy consumption in Light SESA’s concession area (captive clients + transport of free clients2) came to 7,374
GWh in 1Q14, 7.8% up from the same period in 2013, mainly due to the increases of 13.6% and 8.3% in residential
and commercial consumption, respectively. Residential consumption totaled 2,752 GWh in the quarter, accounting
for 37.3% of the total market, 13.6% up from 1Q13, driven by the 1.3ºC year-on-year increase in the average
temperature. Note that, in 1Q14, the residential segment recorded its highest consumption in the last ten years.
Commercial clients consumed 2,267 GWh in 1Q14, equivalent to 30.7% of the total market, an upturn of 8.3% over
1Q13. In the first quarter of 2014, the free market received 11 migrations from the captive market, which
corresponded to an increase of 15 GWh in the quarter.
2 In view of ANEEL’s ratification of the market during the tariff revision process, consumption by the free client CSN is included as of the fourth
quarter of 2013.
6
Industrial consumption amounted to 1,330 GWh in 1Q14, representing 18.0% of the total market, a decline of 2.1%
in relation to the same period last year, due to weaker performance of electro-intensive industries, with activities of
manufacture of steel/alumnium and in the chemical sector. Excluding this effect, industrial consumption posted an
increase of 4.4% over 1Q13.
In the “others” category, which accounted for 13.9% of the total market, consumption increased by 6.1% in 1Q14
over 1Q13. The rural, government and public utility categories reported respective increases of 42.9%, 7,1% and
5.0% over 1Q13, representing 0.3%, 6.2% and 4.8%, respectively, of the total market.
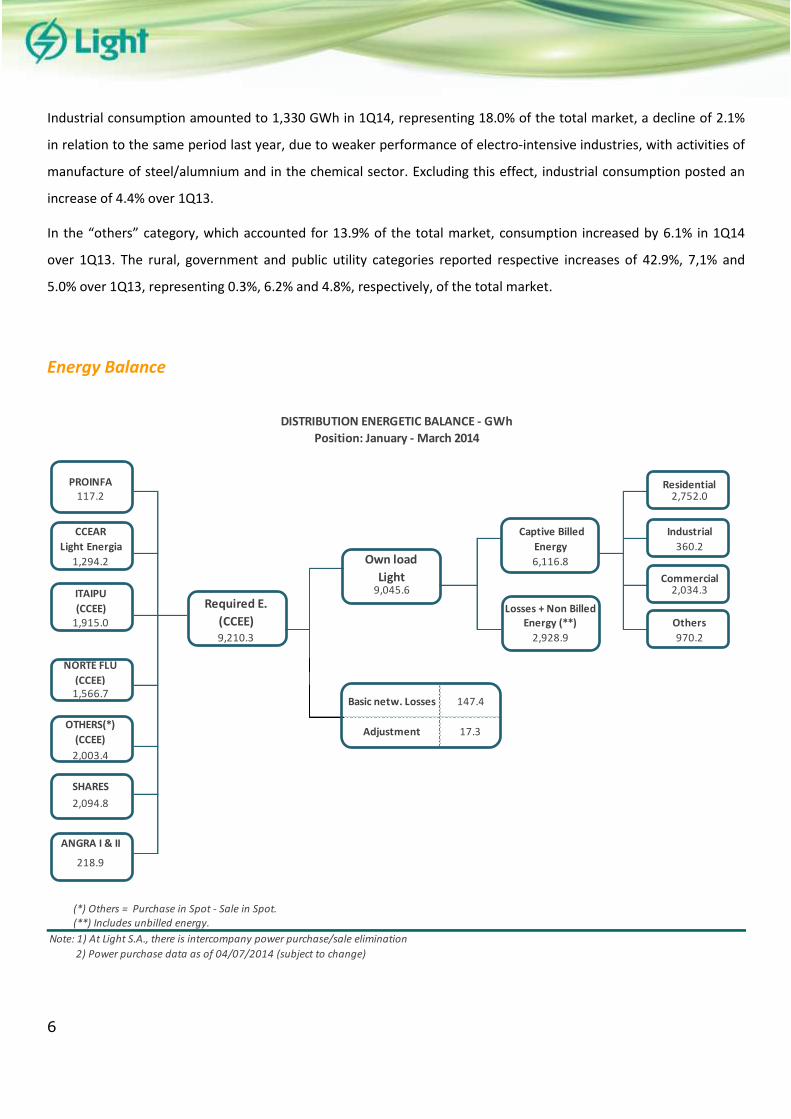
Energy Balance
117.2 2,752.0
CCEAR Captive Billed Industrial
Light Energia Energy 360.2
1,294.2 6,116.8
Commercial9,045.6 2,034.3
Losses + Non Billed1,915.0 Energy (**) Others
9,210.3 2,928.9 970.2
1,566.7
2,003.4
SHARES
2,094.8
218.9
(*) Others = Purchase in Spot - Sale in Spot.(**) Includes unbilled energy.
Note: 1) At Light S.A., there is intercompany power purchase/sale elimination
2) Power purchase data as of 04/07/2014 (subject to change)
DISTRIBUTION ENERGETIC BALANCE - GWh
PROINFA
ITAIPU
(CCEE) Required E.
(CCEE)
Residential
Position: January - March 2014
ANGRA I & II
NORTE FLU
(CCEE)
OTHERS(*)
(CCEE)
Own load
Light
Basic netw. Losses 147.4
Adjustment 17.3
7
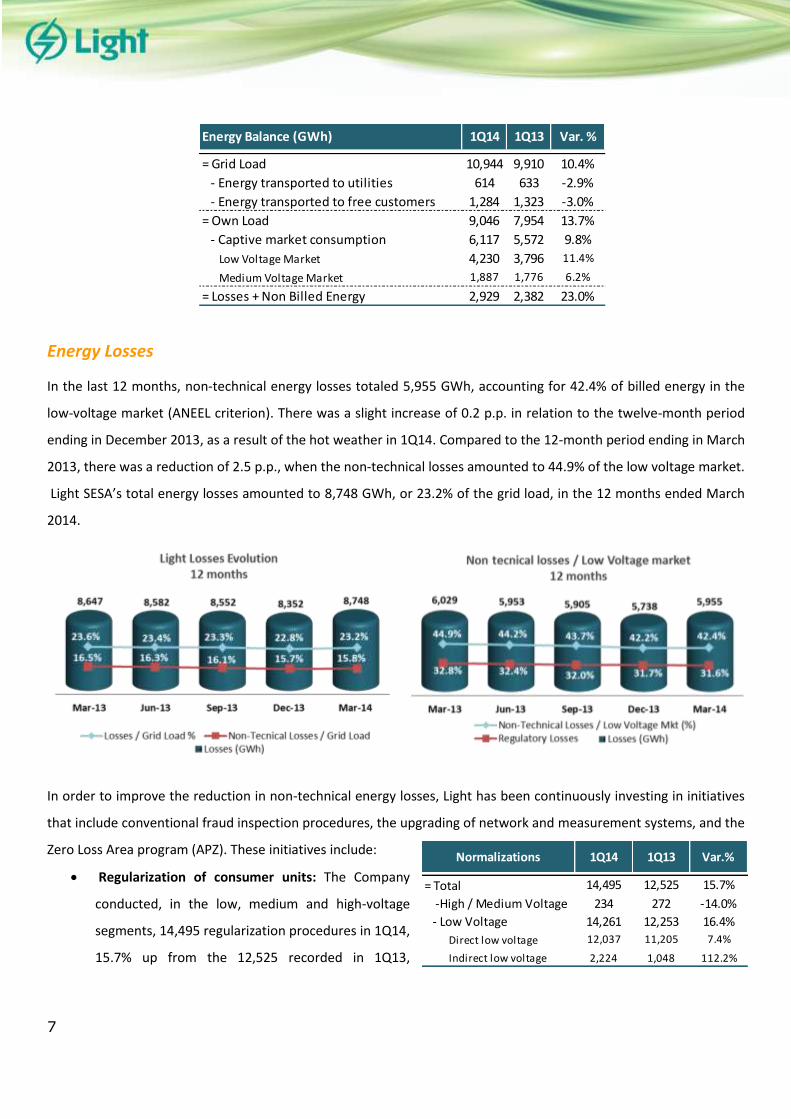
Energy Losses
In the last 12 months, non-technical energy losses totaled 5,955 GWh, accounting for 42.4% of billed energy in the
low-voltage market (ANEEL criterion). There was a slight increase of 0.2 p.p. in relation to the twelve-month period
ending in December 2013, as a result of the hot weather in 1Q14. Compared to the 12-month period ending in March
2013, there was a reduction of 2.5 p.p., when the non-technical losses amounted to 44.9% of the low voltage market.
Light SESA’s total energy losses amounted to 8,748 GWh, or 23.2% of the grid load, in the 12 months ended March
2014.
In order to improve the reduction in non-technical energy losses, Light has been continuously investing in initiatives
that include conventional fraud inspection procedures, the upgrading of network and measurement systems, and the
Zero Loss Area program (APZ). These initiatives include:
Regularization of consumer units: The Company
conducted, in the low, medium and high-voltage
segments, 14,495 regularization procedures in 1Q14,
15.7% up from the 12,525 recorded in 1Q13,
Energy Balance (GWh) 1Q14 1Q13 Var. %
= Grid Load 10,944 9,910 10.4%
- Energy transported to utilities 614 633 -2.9%
- Energy transported to free customers 1,284 1,323 -3.0%
= Own Load 9,046 7,954 13.7%
- Captive market consumption 6,117 5,572 9.8%
Low Voltage Market 4,230 3,796 11.4%
Medium Voltage Market 1,887 1,776 6.2%
= Losses + Non Billed Energy 2,929 2,382 23.0%
Normalizations 1Q14 1Q13 Var.%
= Total 14,495 12,525 15.7%
-High / Medium Voltage 234 272 -14.0%
- Low Voltage 14,261 12,253 16.4%
Direct low voltage 12,037 11,205 7.4%
Indirect low voltage 2,224 1,048 112.2%
8
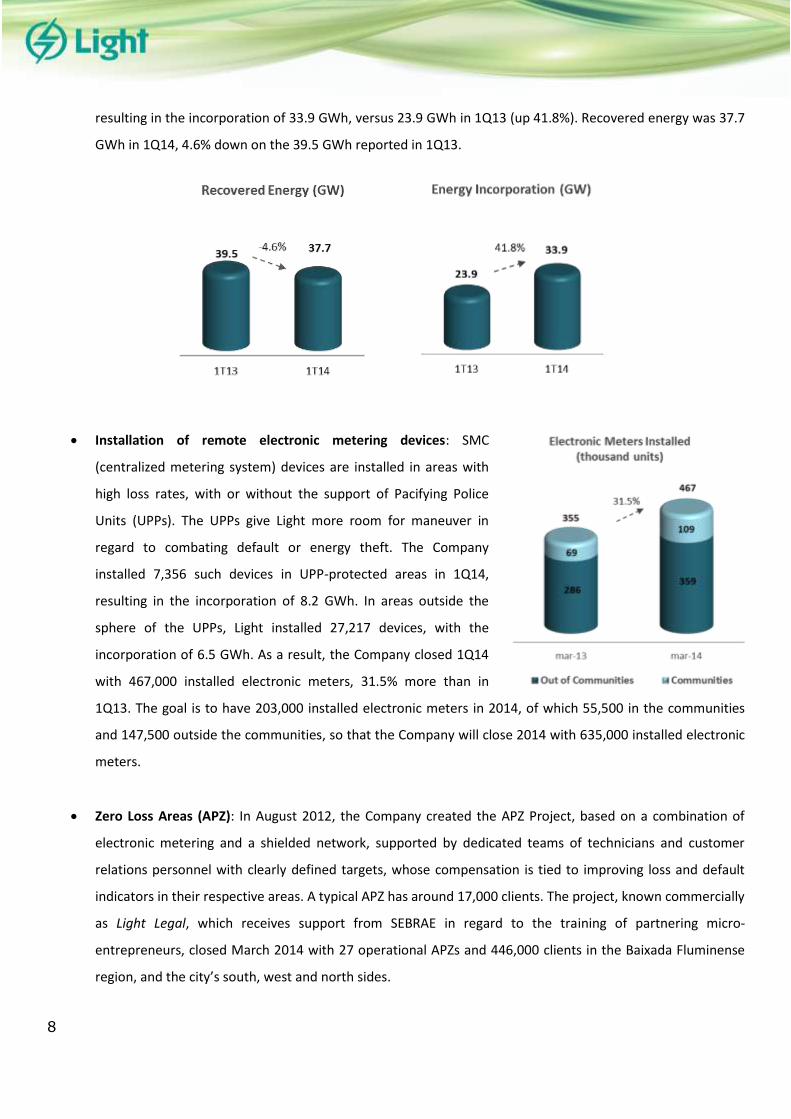
resulting in the incorporation of 33.9 GWh, versus 23.9 GWh in 1Q13 (up 41.8%). Recovered energy was 37.7
GWh in 1Q14, 4.6% down on the 39.5 GWh reported in 1Q13.
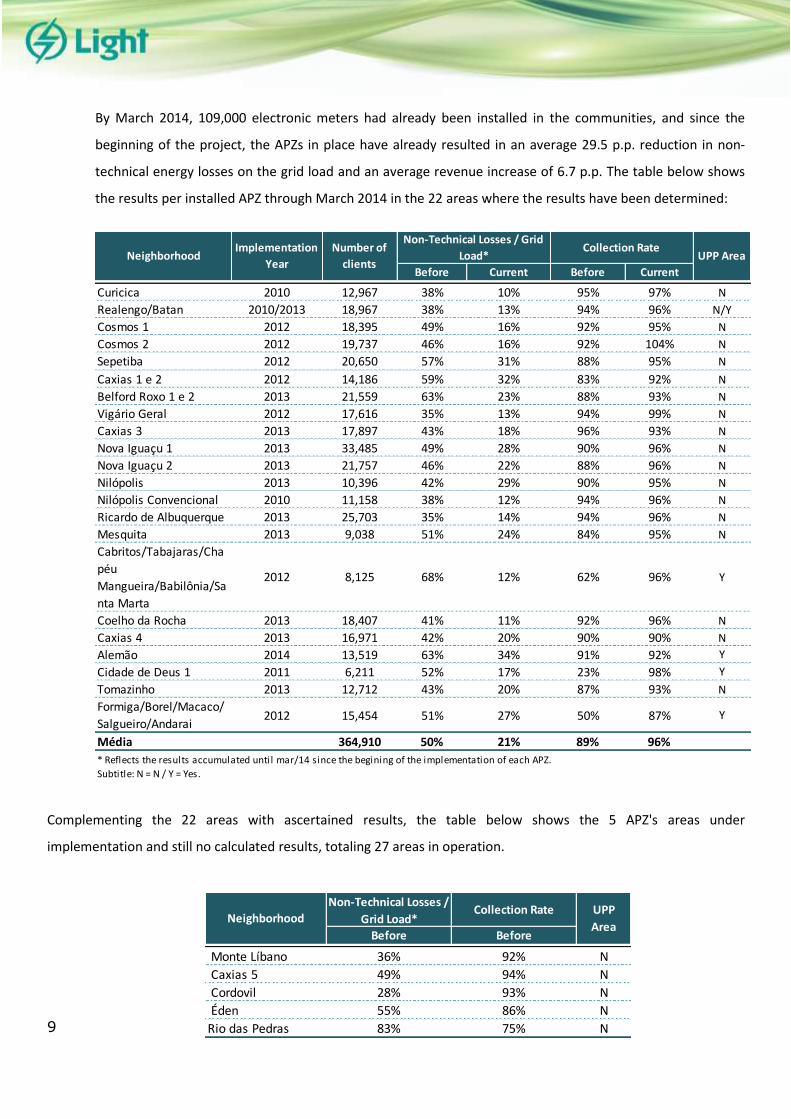
Installation of remote electronic metering devices: SMC
(centralized metering system) devices are installed in areas with
high loss rates, with or without the support of Pacifying Police
Units (UPPs). The UPPs give Light more room for maneuver in
regard to combating default or energy theft. The Company
installed 7,356 such devices in UPP-protected areas in 1Q14,
resulting in the incorporation of 8.2 GWh. In areas outside the
sphere of the UPPs, Light installed 27,217 devices, with the
incorporation of 6.5 GWh. As a result, the Company closed 1Q14
with 467,000 installed electronic meters, 31.5% more than in
1Q13. The goal is to have 203,000 installed electronic meters in 2014, of which 55,500 in the communities
and 147,500 outside the communities, so that the Company will close 2014 with 635,000 installed electronic
meters.
Zero Loss Areas (APZ): In August 2012, the Company created the APZ Project, based on a combination of
electronic metering and a shielded network, supported by dedicated teams of technicians and customer
relations personnel with clearly defined targets, whose compensation is tied to improving loss and default
indicators in their respective areas. A typical APZ has around 17,000 clients. The project, known commercially
as Light Legal, which receives support from SEBRAE in regard to the training of partnering micro-
entrepreneurs, closed March 2014 with 27 operational APZs and 446,000 clients in the Baixada Fluminense
region, and the city’s south, west and north sides.
9
By March 2014, 109,000 electronic meters had already been installed in the communities, and since the
beginning of the project, the APZs in place have already resulted in an average 29.5 p.p. reduction in non-
technical energy losses on the grid load and an average revenue increase of 6.7 p.p. The table below shows
the results per installed APZ through March 2014 in the 22 areas where the results have been determined:
Complementing the 22 areas with ascertained results, the table below shows the 5 APZ's areas under
implementation and still no calculated results, totaling 27 areas in operation.
Non-Technical Losses /
Grid Load*Collection Rate
Before Before
Monte Líbano 36% 92% N
Caxias 5 49% 94% N
Cordovil 28% 93% N
Éden 55% 86% N
Rio das Pedras 83% 75% N
NeighborhoodUPP
Area
Before Current Before Current
Curicica 2010 12,967 38% 10% 95% 97% N
Realengo/Batan 2010/2013 18,967 38% 13% 94% 96% N/Y
Cosmos 1 2012 18,395 49% 16% 92% 95% N
Cosmos 2 2012 19,737 46% 16% 92% 104% N
Sepetiba 2012 20,650 57% 31% 88% 95% N
Caxias 1 e 2 2012 14,186 59% 32% 83% 92% N
Belford Roxo 1 e 2 2013 21,559 63% 23% 88% 93% N
Vigário Geral 2012 17,616 35% 13% 94% 99% N
Caxias 3 2013 17,897 43% 18% 96% 93% N
Nova Iguaçu 1 2013 33,485 49% 28% 90% 96% N
Nova Iguaçu 2 2013 21,757 46% 22% 88% 96% N
Nilópolis 2013 10,396 42% 29% 90% 95% N
Nilópolis Convencional 2010 11,158 38% 12% 94% 96% N
Ricardo de Albuquerque 2013 25,703 35% 14% 94% 96% N
Mesquita 2013 9,038 51% 24% 84% 95% N
Cabritos/Tabajaras/Cha
péu
Mangueira/Babilônia/Sa
nta Marta
2012 8,125 68% 12% 62% 96% Y
Coelho da Rocha 2013 18,407 41% 11% 92% 96% N
Caxias 4 2013 16,971 42% 20% 90% 90% N
Alemão 2014 13,519 63% 34% 91% 92% Y
Cidade de Deus 1 2011 6,211 52% 17% 23% 98% Y
Tomazinho 2013 12,712 43% 20% 87% 93% N
Formiga/Borel/Macaco/
Salgueiro/Andarai2012 15,454 51% 27% 50% 87% Y
Média 364,910 50% 21% 89% 96%
UPP Area
* Reflects the results accumulated until mar/14 since the begining of the implementation of each APZ.
Subtitle: N = N / Y = Yes.
NeighborhoodImplementation
Year
Number of
clients
Non-Technical Losses / Grid
Load*Collection Rate
10
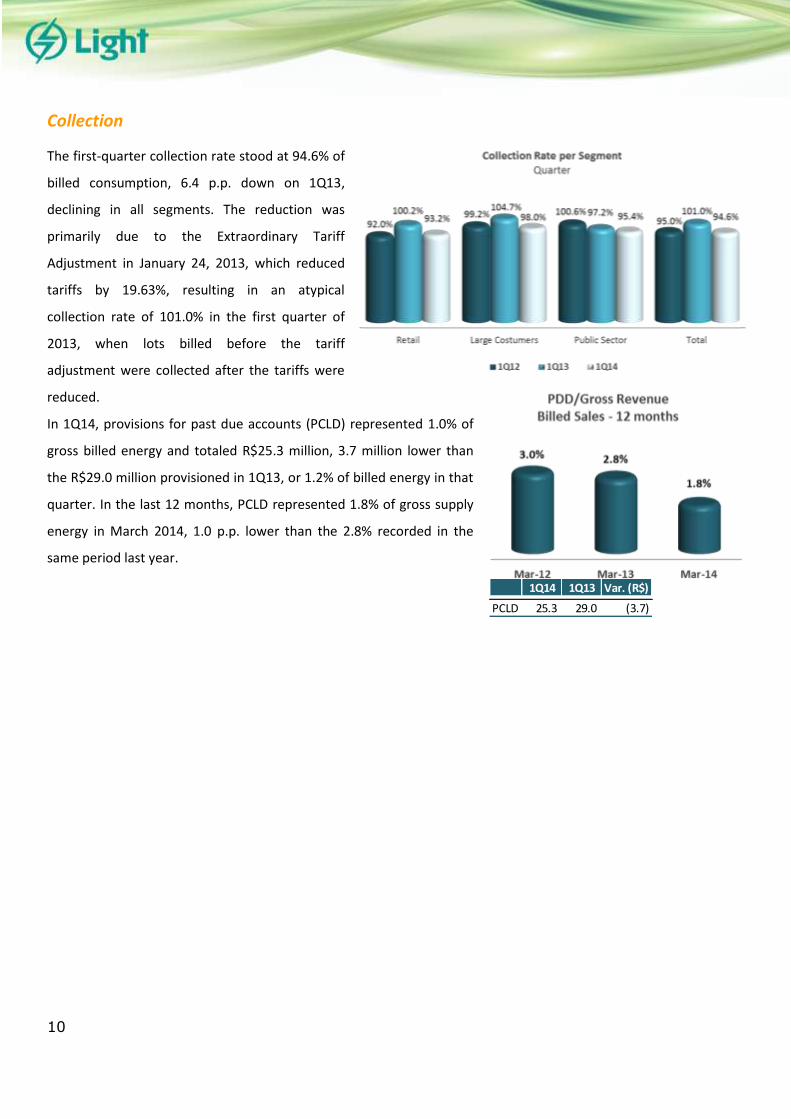
Collection
The first-quarter collection rate stood at 94.6% of
billed consumption, 6.4 p.p. down on 1Q13,
declining in all segments. The reduction was
primarily due to the Extraordinary Tariff
Adjustment in January 24, 2013, which reduced
tariffs by 19.63%, resulting in an atypical
collection rate of 101.0% in the first quarter of
2013, when lots billed before the tariff
adjustment were collected after the tariffs were
reduced.
In 1Q14, provisions for past due accounts (PCLD) represented 1.0% of
gross billed energy and totaled R$25.3 million, 3.7 million lower than
the R$29.0 million provisioned in 1Q13, or 1.2% of billed energy in that
quarter. In the last 12 months, PCLD represented 1.8% of gross supply
energy in March 2014, 1.0 p.p. lower than the 2.8% recorded in the
same period last year.
1Q14 1Q13 Var. (R$)
PCLD 25.3 29.0 (3.7)
11
Operating Quality
In 1Q14, in the overhead distribution network, 388 medium-voltage distribution circuits were inspected/maintained,
1,733 transformers were replaced and 38,048 trees were pruned. In the underground distribution network, 5,420
transformer vaults and 15,022 manholes were inspected. In addition, 32 transformers, 30 switches and 894
protectors were maintained.
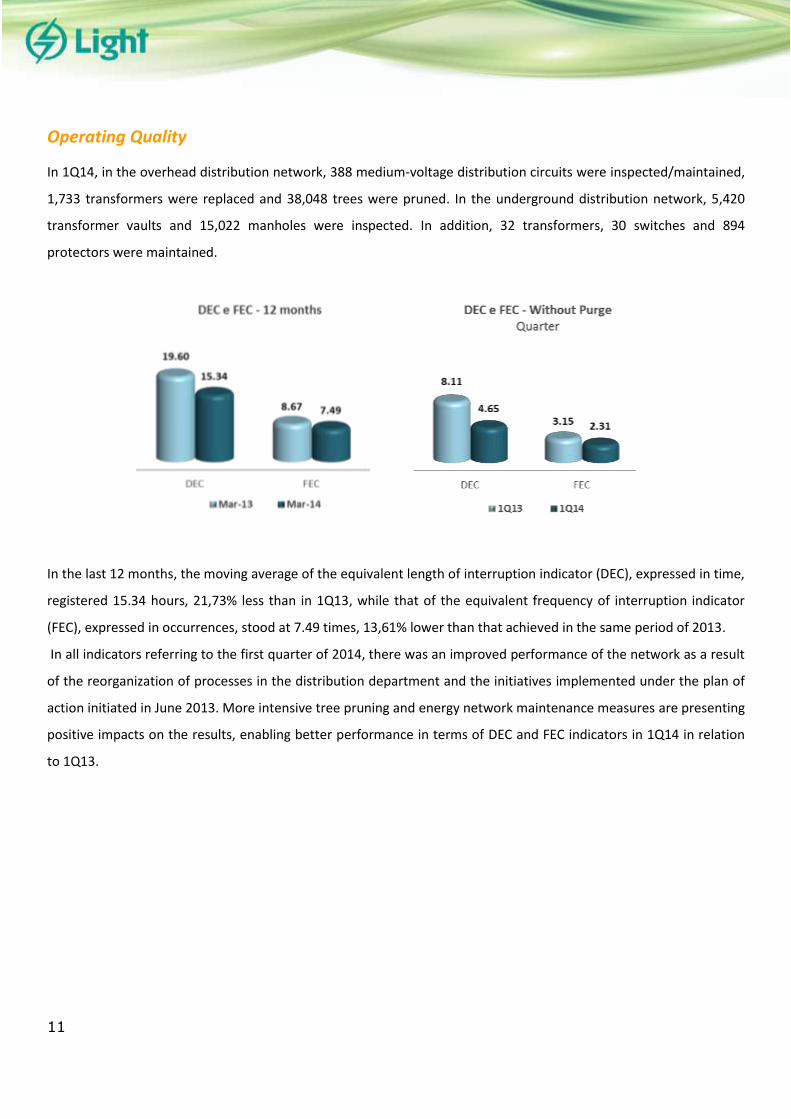
In the last 12 months, the moving average of the equivalent length of interruption indicator (DEC), expressed in time,
registered 15.34 hours, 21,73% less than in 1Q13, while that of the equivalent frequency of interruption indicator
(FEC), expressed in occurrences, stood at 7.49 times, 13,61% lower than that achieved in the same period of 2013.
In all indicators referring to the first quarter of 2014, there was an improved performance of the network as a result
of the reorganization of processes in the distribution department and the initiatives implemented under the plan of
action initiated in June 2013. More intensive tree pruning and energy network maintenance measures are presenting
positive impacts on the results, enabling better performance in terms of DEC and FEC indicators in 1Q14 in relation
to 1Q13.
12
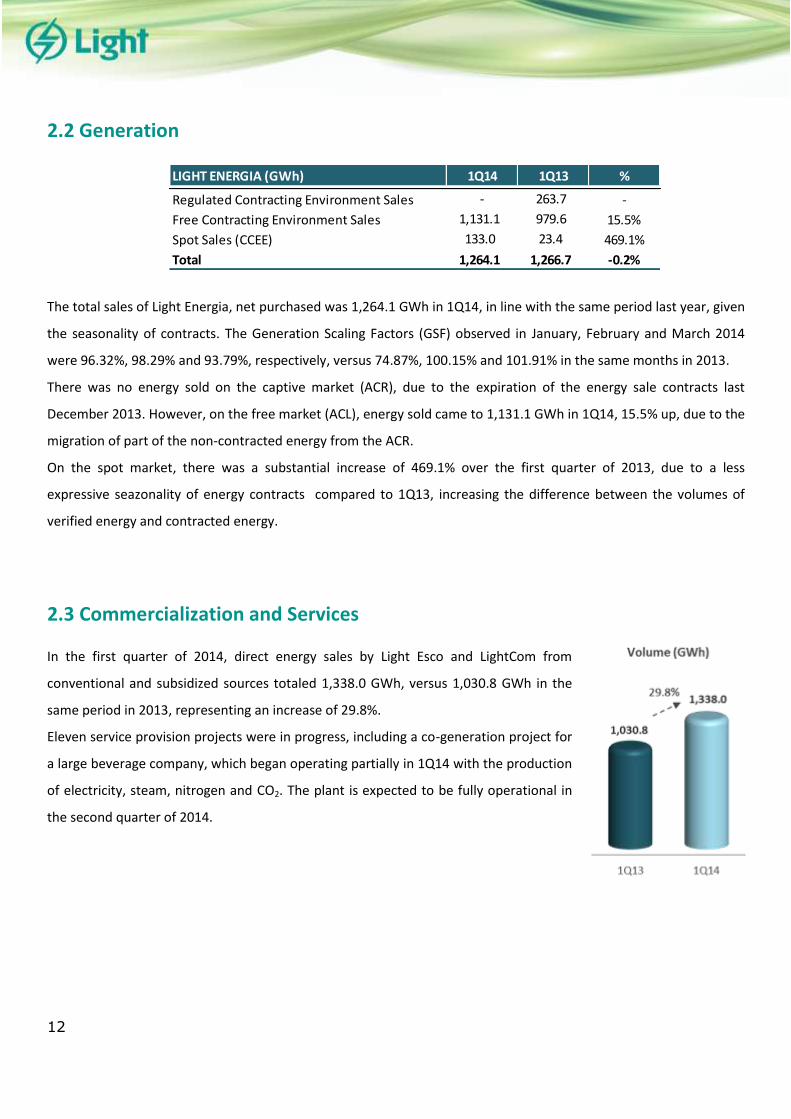
2.2 Generation
The total sales of Light Energia, net purchased was 1,264.1 GWh in 1Q14, in line with the same period last year, given
the seasonality of contracts. The Generation Scaling Factors (GSF) observed in January, February and March 2014
were 96.32%, 98.29% and 93.79%, respectively, versus 74.87%, 100.15% and 101.91% in the same months in 2013.
There was no energy sold on the captive market (ACR), due to the expiration of the energy sale contracts last
December 2013. However, on the free market (ACL), energy sold came to 1,131.1 GWh in 1Q14, 15.5% up, due to the
migration of part of the non-contracted energy from the ACR.
On the spot market, there was a substantial increase of 469.1% over the first quarter of 2013, due to a less
expressive seazonality of energy contracts compared to 1Q13, increasing the difference between the volumes of
verified energy and contracted energy.
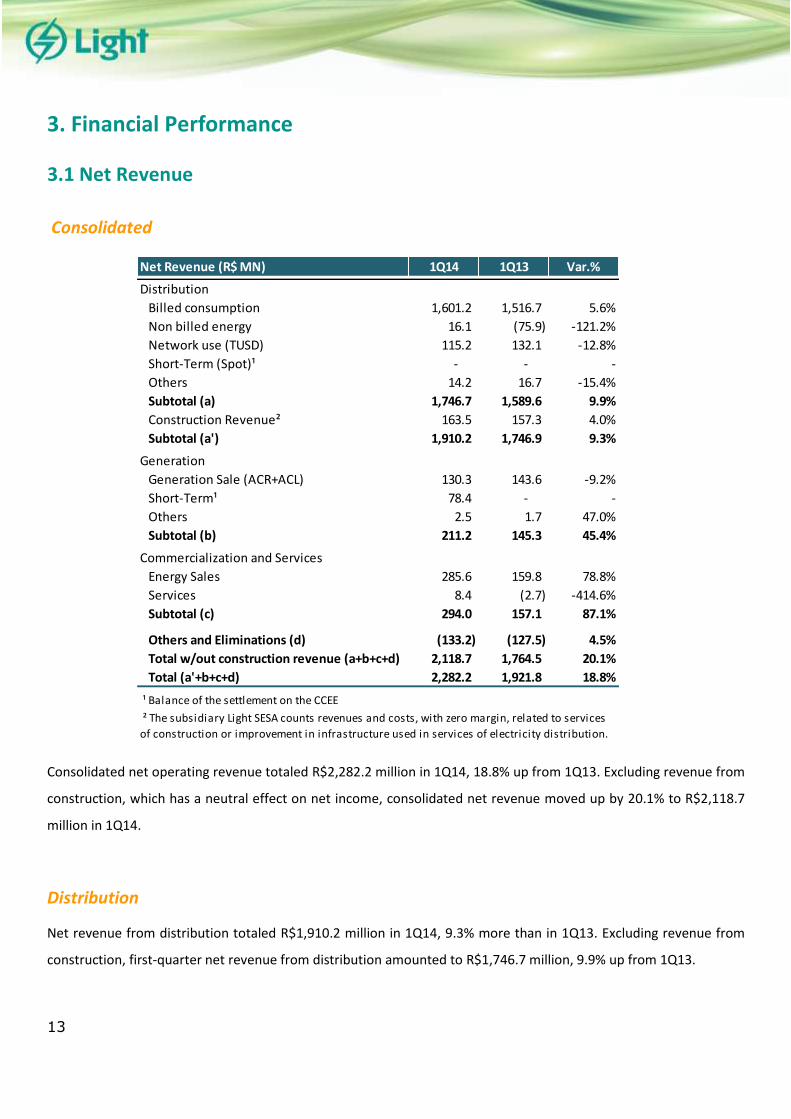
2.3 Commercialization and Services
In the first quarter of 2014, direct energy sales by Light Esco and LightCom from
conventional and subsidized sources totaled 1,338.0 GWh, versus 1,030.8 GWh in the
same period in 2013, representing an increase of 29.8%.
Eleven service provision projects were in progress, including a co-generation project for
a large beverage company, which began operating partially in 1Q14 with the production
of electricity, steam, nitrogen and CO2. The plant is expected to be fully operational in
the second quarter of 2014.
LIGHT ENERGIA (GWh) 1Q14 1Q13 %
Regulated Contracting Environment Sales - 263.7 -
Free Contracting Environment Sales 1,131.1 979.6 15.5%
Spot Sales (CCEE) 133.0 23.4 469.1%
Total 1,264.1 1,266.7 -0.2%
13
3. Financial Performance
3.1 Net Revenue
Consolidated
Consolidated net operating revenue totaled R$2,282.2 million in 1Q14, 18.8% up from 1Q13. Excluding revenue from
construction, which has a neutral effect on net income, consolidated net revenue moved up by 20.1% to R$2,118.7
million in 1Q14.
Distribution
Net revenue from distribution totaled R$1,910.2 million in 1Q14, 9.3% more than in 1Q13. Excluding revenue from
construction, first-quarter net revenue from distribution amounted to R$1,746.7 million, 9.9% up from 1Q13.
Net Revenue (R$ MN) 1Q14 1Q13 Var.%
Distribution
Billed consumption 1,601.2 1,516.7 5.6%
Non billed energy 16.1 (75.9) -121.2%
Network use (TUSD) 115.2 132.1 -12.8%
Short-Term (Spot)¹ - - -
Others 14.2 16.7 -15.4%
Subtotal (a) 1,746.7 1,589.6 9.9%
Construction Revenue² 163.5 157.3 4.0%
Subtotal (a') 1,910.2 1,746.9 9.3%- -
Generation
Generation Sale (ACR+ACL) 130.3 143.6 -9.2%
Short-Term¹ 78.4 - -
Others 2.5 1.7 47.0%
Subtotal (b) 211.2 145.3 45.4%- -
Commercialization and Services
Energy Sales 285.6 159.8 78.8%
Services 8.4 (2.7) -414.6%
Subtotal (c) 294.0 157.1 87.1%- -
Others and Eliminations (d) (133.2) (127.5) 4.5%
Total w/out construction revenue (a+b+c+d) 2,118.7 1,764.5 20.1%
Total (a'+b+c+d) 2,282.2 1,921.8 18.8%
¹ Balance of the settlement on the CCEE
² The subsidiary Light SESA counts revenues and costs, with zero margin, related to services
of construction or improvement in infrastructure used in services of electricity distribution.
14
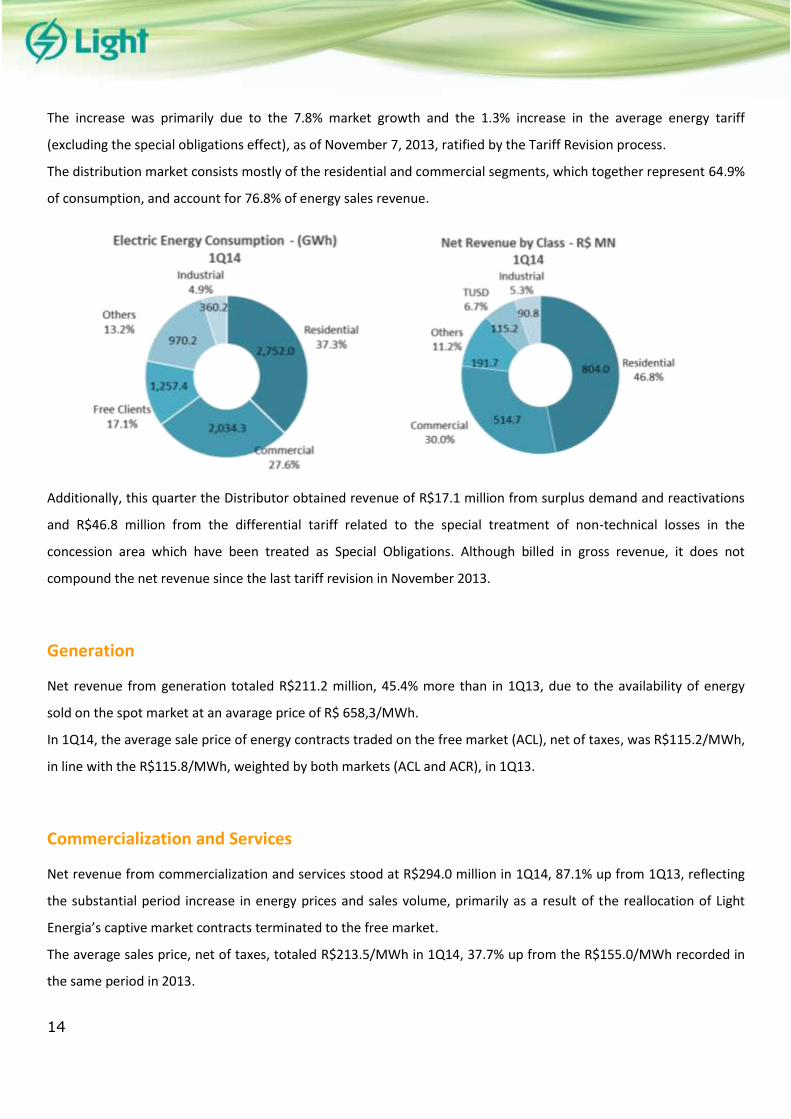
The increase was primarily due to the 7.8% market growth and the 1.3% increase in the average energy tariff
(excluding the special obligations effect), as of November 7, 2013, ratified by the Tariff Revision process.
The distribution market consists mostly of the residential and commercial segments, which together represent 64.9%
of consumption, and account for 76.8% of energy sales revenue.
Additionally, this quarter the Distributor obtained revenue of R$17.1 million from surplus demand and reactivations
and R$46.8 million from the differential tariff related to the special treatment of non-technical losses in the
concession area which have been treated as Special Obligations. Although billed in gross revenue, it does not
compound the net revenue since the last tariff revision in November 2013.
Generation
Net revenue from generation totaled R$211.2 million, 45.4% more than in 1Q13, due to the availability of energy
sold on the spot market at an avarage price of R$ 658,3/MWh.
In 1Q14, the average sale price of energy contracts traded on the free market (ACL), net of taxes, was R$115.2/MWh,
in line with the R$115.8/MWh, weighted by both markets (ACL and ACR), in 1Q13.
Commercialization and Services
Net revenue from commercialization and services stood at R$294.0 million in 1Q14, 87.1% up from 1Q13, reflecting
the substantial period increase in energy prices and sales volume, primarily as a result of the reallocation of Light
Energia’s captive market contracts terminated to the free market.
The average sales price, net of taxes, totaled R$213.5/MWh in 1Q14, 37.7% up from the R$155.0/MWh recorded in
the same period in 2013.
15
3.2 Costs and Expenses
Consolidated
In the first quarter of 2014, operating costs and expenses totaled R$1,925.6 million, 16.0% up year-on-year.
Excluding construction costs, consolidated costs and expenses climbed by 17.2% in relation to 1Q13, due to the
higher volume of energy for resale purchased both by the distribution and commercialization businesses.
Distribution
In 1Q14, distribution costs and expenses increased by 8.8% over the same period in 2013. Excluding construction
costs, total costs and expenses increased by 9.4% in relation to 1Q13.
Costs and Expenses (R$ MN) 1Q14 1Q13 Var.%
Distribution (1,740.8) (1,599.4) 8.8%Distribution w/out Construction Revenue (1,577.3) (1,442.2) 9.4%
Generation (38.4) (38.1) 0.7%
Commercialization (276.5) (147.3) 87.7%
Others and Eliminations 130.2 124.4 4.6%
Consolidated w/out Construction Revenue (1,762.1) (1,503.2) 17.2%
Consolidated (1,925.6) (1,660.5) 16.0%
Costs and Expenses (R$ MN) 1Q14 1Q13 Var.%
Non-Manageable Costs and Expenses (1,226.7) (1,125.0) 9.0%
Energy Purchase costs (1,189.1) (1,045.7) 13.7%
Costs with Charges and Transmission (129.4) (171.7) -24.6%
Others (Mandatory Costs) (3.1) (4.3) -26.5%
Credit PIS/COFINS on purchase 94.8 96.5 -1.8%
Manageable Costs and Expenses (350.6) (317.1) 10.6%
PMSO (187.8) (184.0) 2.1%
Personnel (69.0) (73.1) -5.6%
Material (5.2) (3.7) 42.3%
Outsourced Services (90.8) (88.6) 2.6%
Others (22.7) (18.6) 21.9%
Provisions - Contingencies (40.0) (16.2) 146.6%
Provisions - PCLD (25.3) (29.0) -12.8%
Depreciation and Amortization (85.4) (80.6) 6.0%
Other Operacional/Revenues Expenses (12.1) (7.3) 66.3%
Total costs w/out Construction Revenue (1,577.3) (1,442.2) 9.4%
Construction Revenue (163.5) (157.3) 4.0%
Total Costs (1,740.8) (1,599.4) 8.8%
16
Non-Manageable Costs and Expenses
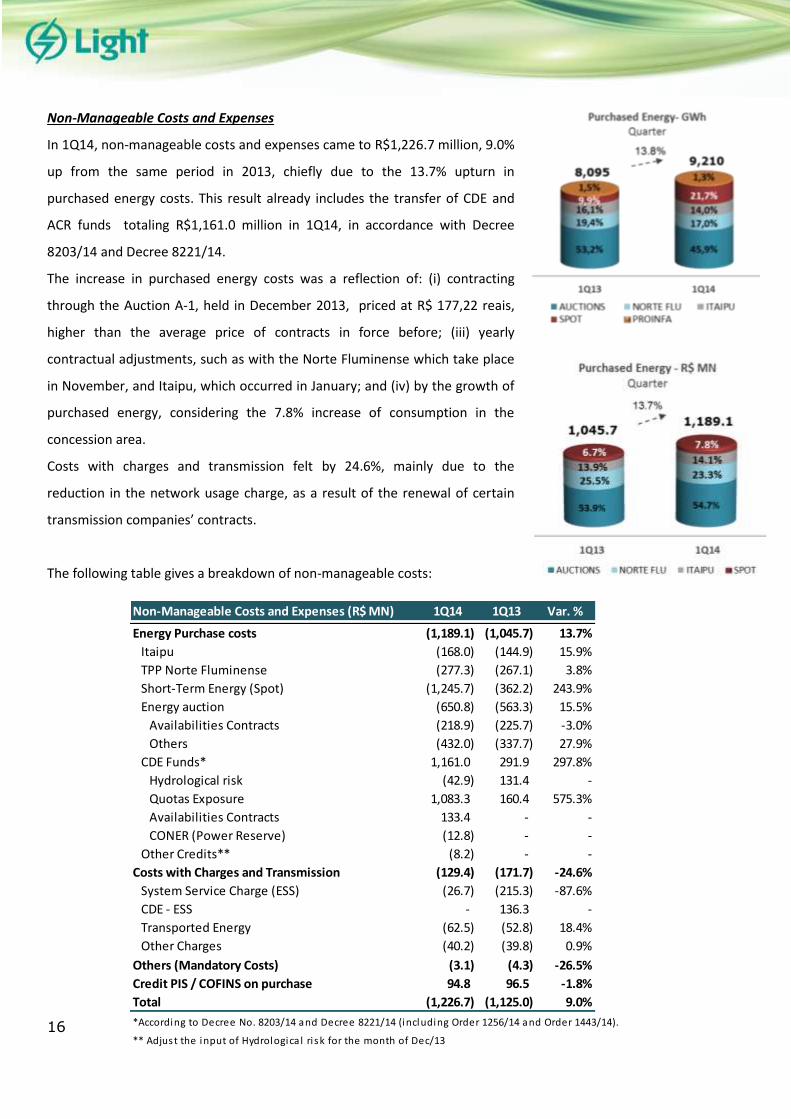
In 1Q14, non-manageable costs and expenses came to R$1,226.7 million, 9.0%
up from the same period in 2013, chiefly due to the 13.7% upturn in
purchased energy costs. This result already includes the transfer of CDE and
ACR funds totaling R$1,161.0 million in 1Q14, in accordance with Decree
8203/14 and Decree 8221/14.
The increase in purchased energy costs was a reflection of: (i) contracting
through the Auction A-1, held in December 2013, priced at R$ 177,22 reais,
higher than the average price of contracts in force before; (iii) yearly
contractual adjustments, such as with the Norte Fluminense which take place
in November, and Itaipu, which occurred in January; and (iv) by the growth of
purchased energy, considering the 7.8% increase of consumption in the
concession area.
Costs with charges and transmission felt by 24.6%, mainly due to the
reduction in the network usage charge, as a result of the renewal of certain
transmission companies’ contracts.
The following table gives a breakdown of non-manageable costs:
Non-Manageable Costs and Expenses (R$ MN) 1Q14 1Q13 Var. %
Energy Purchase costs (1,189.1) (1,045.7) 13.7%
Itaipu (168.0) (144.9) 15.9%
TPP Norte Fluminense (277.3) (267.1) 3.8%
Short-Term Energy (Spot) (1,245.7) (362.2) 243.9%
Energy auction (650.8) (563.3) 15.5%
Availabilities Contracts (218.9) (225.7) -3.0%
Others (432.0) (337.7) 27.9%
CDE Funds* 1,161.0 291.9 297.8%
Hydrological risk (42.9) 131.4 -
Quotas Exposure 1,083.3 160.4 575.3%
Availabilities Contracts 133.4 - -
CONER (Power Reserve) (12.8) - -
Other Credits** (8.2) - -
Costs with Charges and Transmission (129.4) (171.7) -24.6%
System Service Charge (ESS) (26.7) (215.3) -87.6%
CDE - ESS - 136.3 -
Transported Energy (62.5) (52.8) 18.4%
Other Charges (40.2) (39.8) 0.9%
Others (Mandatory Costs) (3.1) (4.3) -26.5%
Credit PIS / COFINS on purchase 94.8 96.5 -1.8%
Total (1,226.7) (1,125.0) 9.0%
*According to Decree No. 8203/14 and Decree 8221/14 (including Order 1256/14 and Order 1443/14).
** Adjust the input of Hydrologica l ri sk for the month of Dec/13
17
Non-manageable costs are passed on to consumer tariffs and any increase or reduction in such costs in relation to
the regulatory level constitutes a regulatory asset or liability (CVA) balance, to be taken into account in the next tariff
readjustment, but which is not recorded in the income statement in accordance with International Financial
Reporting Standards (IFRS). In 1Q14, regulatory liabilities totaled R$18.3 million, versus regulatory assets of R$101.2
million in 1Q13.
The average purchased energy cost, excluding spot market purchases, amounted to R$150.7/MWh in 1Q14, 10.9%
up from the R$136.0/MWh recorded in 1Q13.
Manageable Costs and Expenses
In the first quarter of 2014, manageable operating costs and expenses, comprising personnel, materials, outsourced
services, provisions, depreciation and others, totaled R$350.6 million, 10.6% up from 1Q13.
Costs and expenses from personnel, materials, outsourced services and others (PMSO) totaled R$187.8 million in the
first quarter, 2.1% up from the same period in 2013, chiefly due to the 42.3%, 21.9% and 2.6% increases in materials,
others and outsourced services, respectively.
The decline in the personnel line was due to higher volume invested in labor capitalization, totaling R$8.2 million,
compared 1Q13. The upturn in the materials and outsourced services lines was primarily a reflection of higher
investments in the Zero Loss Area program (APZ), in view of the progress made in the projects, totaling
approximately R$7.4 million.
In 1Q14, the others line recorded an increase in relation to the same period in 2013, as a result of: (i) the R$2.3
million referring to anticipation of software maintenance; and (ii) the R$3.1 million spent on advertising campaign
for raising awareness of the efficient use of energy.
The provisions line totaled R$65.3 million, 44.3% up from the first quarter of 2013, due to the constitution of the
following provisions in the 1Q14: (i) R$26.9 million for contingencies, mainly related to labor suits and judicial
deposits, and (ii) R$5,9 million in judicial deposits. In 1Q14, provisions for past due accounts (PCLD) came to R$25.3
million, 12.8% below the R$29.0 million recorded in 1Q13.
The depreciation and amortization line increased by 6.0% over 1Q13, due to the higher volume of investments, with
more assets incorporated to the network in 2013.
The Other Operating Revenue/Expenses line totaled R$12.1 million in the quarter, 66.3% up from the R$7.3 million
recorded in 1Q13, resulting from write-offs in view of deactivation of assets to intangible assets.
18
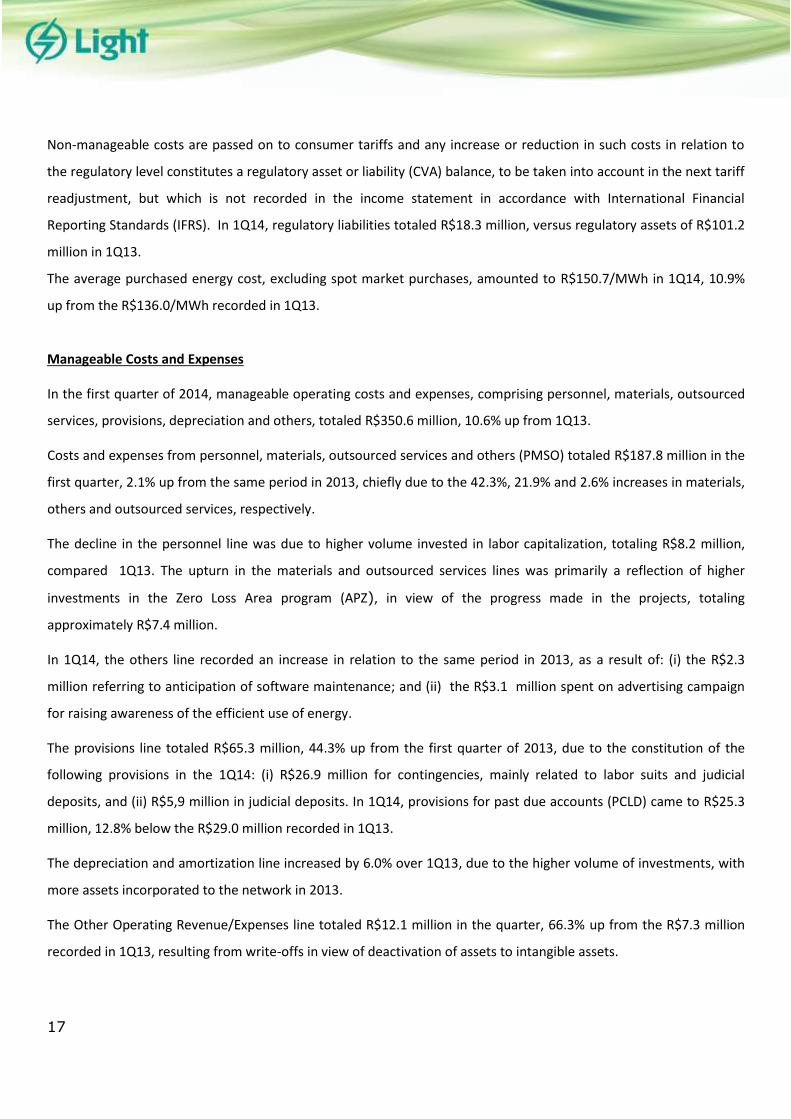
Generation
In 1Q14, Light Energia’s costs and expenses amounted to R$38.4 million, an increase of 0.7% over 1Q13.
First-quarter costs and expenses were broken down as follows: personnel (14.8%), materials and outsourced services
(9.5%), CUSD/CUST — distribution/transmission system usage/Purchased Energy (20.4%), depreciation and others
(55.2%). PMSO per MWh in the quarter came to R$14.4/MWh, versus R$14.1/MWh in 1Q13.
Commercialization and Services
Costs and expenses totaled R$276.5 million in 1Q14, 87.7% higher than in the first quarter of 2013. The increase was
mainly due to the 84.0% surge in purchased energy costs in relation to the figure reported in 1Q13, resulting from
the higher volume of energy purchased for commercialization and spot market prices. The 326.1% increase in the
materials and outsourced services line was mainly due to the partial start-up of a co-generation project for a large
beverage company.
Operating Costs and Expenses (R$ MN) 1Q14 1Q13 Var.%
Personnel (5.7) (5.3) 7.6%
Material and Outsourced Services (3.7) (3.6) 3.0%
Purchased Energy (CUSD) (7.8) (7.6) 3.6%
Depreciation (13.5) (13.8) -1.9%
Others (includes provisions) (7.7) (8.0) -3.2%
Total (38.4) (38.1) 0.7%
Operating Costs and Expenses (R$ MN) 1Q14 1Q13 Var. %
Personnel (2.6) (2.0) 32.2%
Material and Outsourced Services (11.9) (2.8) 326.1%
Purchased Energy (261.5) (142.1) 84.0%
Others (includes provisions) (0.4) (0.4) 10.1%
Total (276.5) (147.3) 87.7%
19
3.3 EBITDA3
Consolidated
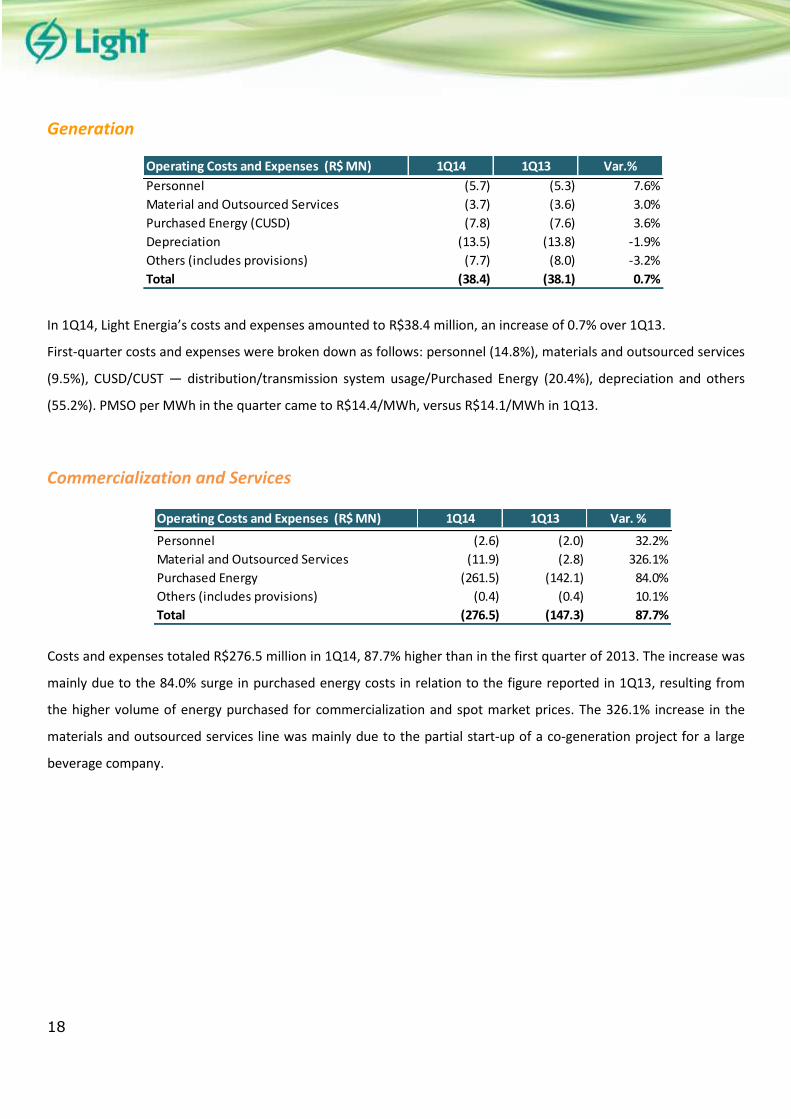
Consolidated EBITDA totaled R$452.9 million in 1Q14, 27.5% up from 1Q13, while the EBITDA margin4 incresead
from 20.1% to 21.4% in the same period. The distribution, generation and commercialization segments grew by
11.7%, 53.2% and 76.9%, respectively.
The first-quarter increase can be explained by two factors: (i) increase in generation revenue due to energy sale on
the spot market; and (ii) the 9.3% increase in net revenue from distribution, driven by the 7.8% growth of the captive
market.
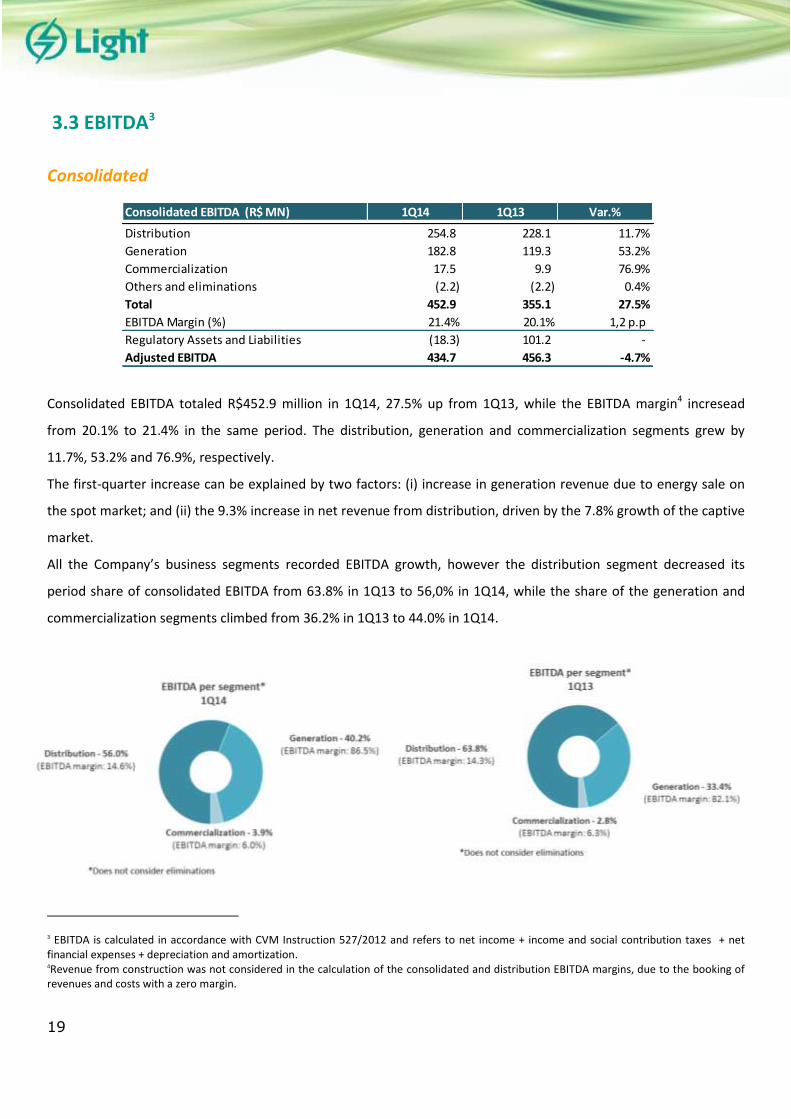
All the Company’s business segments recorded EBITDA growth, however the distribution segment decreased its
period share of consolidated EBITDA from 63.8% in 1Q13 to 56,0% in 1Q14, while the share of the generation and
commercialization segments climbed from 36.2% in 1Q13 to 44.0% in 1Q14.
3 EBITDA is calculated in accordance with CVM Instruction 527/2012 and refers to net income + income and social contribution taxes + net financial expenses + depreciation and amortization. 4Revenue from construction was not considered in the calculation of the consolidated and distribution EBITDA margins, due to the booking of revenues and costs with a zero margin.
Consolidated EBITDA (R$ MN) 1Q14 1Q14 1Q13 Var.%
Distribution 254.8 228.1 11.7%
Generation 182.8 119.3 53.2%
Commercialization 17.5 9.9 76.9%
Others and eliminations (2.2) (2.2) 0.4%
Total 452.9 355.1 27.5%
EBITDA Margin (%) 21.4% 20.1% 1,2 p.p
Regulatory Assets and Liabilities (18.3) 101.2 -
Adjusted EBITDA 434.7 456.3 -4.7%
20
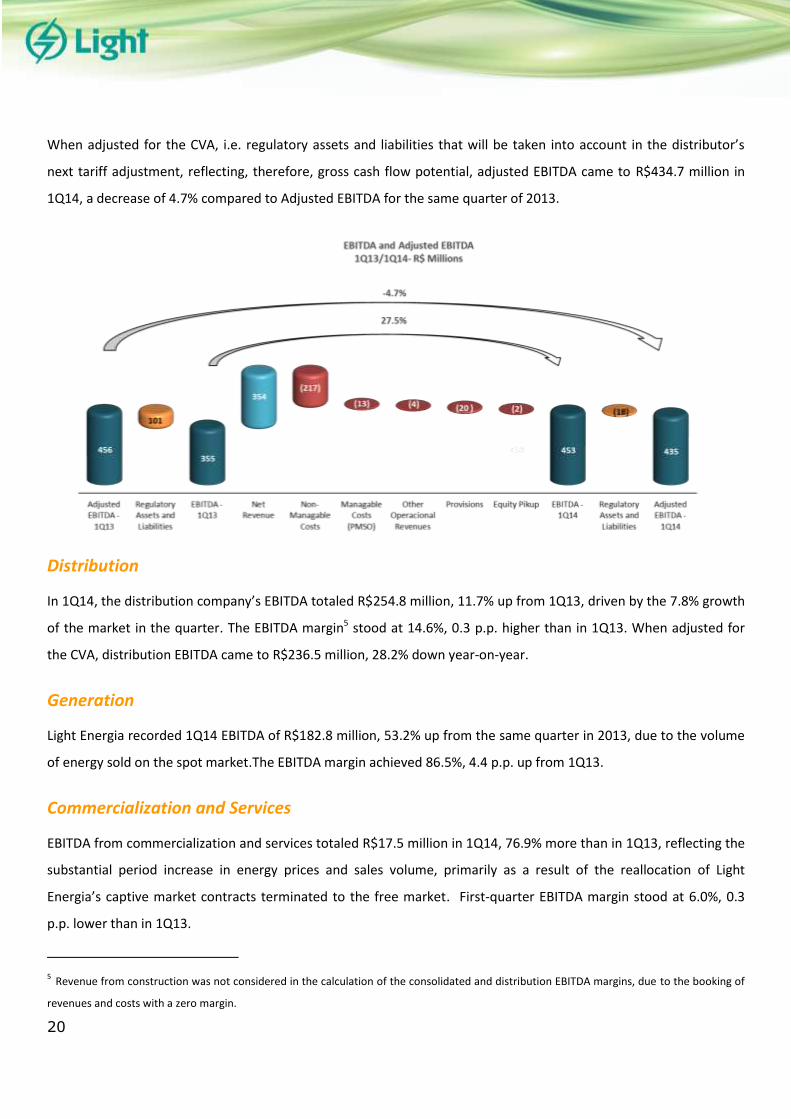
When adjusted for the CVA, i.e. regulatory assets and liabilities that will be taken into account in the distributor’s
next tariff adjustment, reflecting, therefore, gross cash flow potential, adjusted EBITDA came to R$434.7 million in
1Q14, a decrease of 4.7% compared to Adjusted EBITDA for the same quarter of 2013.
Distribution
In 1Q14, the distribution company’s EBITDA totaled R$254.8 million, 11.7% up from 1Q13, driven by the 7.8% growth
of the market in the quarter. The EBITDA margin5 stood at 14.6%, 0.3 p.p. higher than in 1Q13. When adjusted for
the CVA, distribution EBITDA came to R$236.5 million, 28.2% down year-on-year.
Generation
Light Energia recorded 1Q14 EBITDA of R$182.8 million, 53.2% up from the same quarter in 2013, due to the volume
of energy sold on the spot market.The EBITDA margin achieved 86.5%, 4.4 p.p. up from 1Q13.
Commercialization and Services
EBITDA from commercialization and services totaled R$17.5 million in 1Q14, 76.9% more than in 1Q13, reflecting the
substantial period increase in energy prices and sales volume, primarily as a result of the reallocation of Light
Energia’s captive market contracts terminated to the free market. First-quarter EBITDA margin stood at 6.0%, 0.3
p.p. lower than in 1Q13.
5 Revenue from construction was not considered in the calculation of the consolidated and distribution EBITDA margins, due to the booking of
revenues and costs with a zero margin.
21
3.4 Consolidated Financial Result
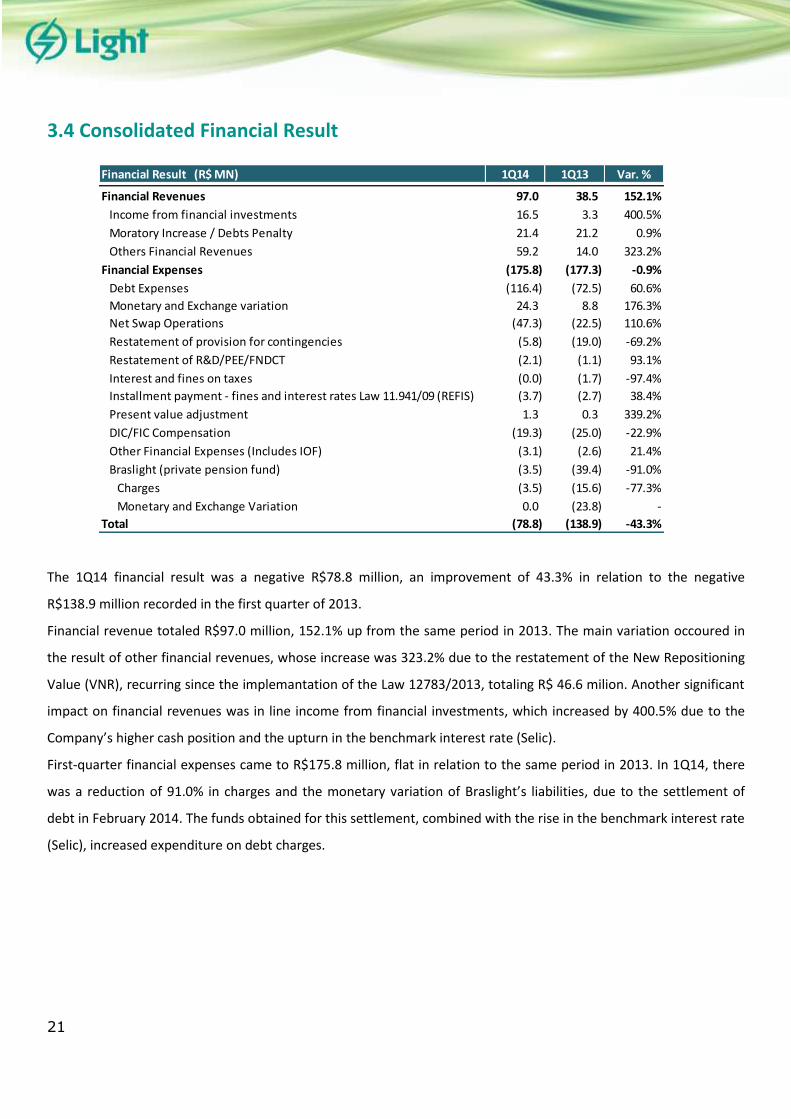
The 1Q14 financial result was a negative R$78.8 million, an improvement of 43.3% in relation to the negative
R$138.9 million recorded in the first quarter of 2013.
Financial revenue totaled R$97.0 million, 152.1% up from the same period in 2013. The main variation occoured in
the result of other financial revenues, whose increase was 323.2% due to the restatement of the New Repositioning
Value (VNR), recurring since the implemantation of the Law 12783/2013, totaling R$ 46.6 milion. Another significant
impact on financial revenues was in line income from financial investments, which increased by 400.5% due to the
Company’s higher cash position and the upturn in the benchmark interest rate (Selic).
First-quarter financial expenses came to R$175.8 million, flat in relation to the same period in 2013. In 1Q14, there
was a reduction of 91.0% in charges and the monetary variation of Braslight’s liabilities, due to the settlement of
debt in February 2014. The funds obtained for this settlement, combined with the rise in the benchmark interest rate
(Selic), increased expenditure on debt charges.
Financial Result (R$ MN) 1Q14 1Q13 Var. %
Financial Revenues 97.0 38.5 152.1%
Income from financial investments 16.5 3.3 400.5%
Moratory Increase / Debts Penalty 21.4 21.2 0.9%
Others Financial Revenues 59.2 14.0 323.2%
Financial Expenses (175.8) (177.3) -0.9%
Debt Expenses (116.4) (72.5) 60.6%
Monetary and Exchange variation 24.3 8.8 176.3%
Net Swap Operations (47.3) (22.5) 110.6%
Restatement of provision for contingencies (5.8) (19.0) -69.2%
Restatement of R&D/PEE/FNDCT (2.1) (1.1) 93.1%
Interest and fines on taxes (0.0) (1.7) -97.4%
Installment payment - fines and interest rates Law 11.941/09 (REFIS) (3.7) (2.7) 38.4%
Present value adjustment 1.3 0.3 339.2%
DIC/FIC Compensation (19.3) (25.0) -22.9%
Other Financial Expenses (Includes IOF) (3.1) (2.6) 21.4%
Braslight (private pension fund) (3.5) (39.4) -91.0%
Charges (3.5) (15.6) -77.3%
Monetary and Exchange Variation 0.0 (23.8) -
Total (78.8) (138.9) -43.3%
22
3.5 Debt
R$ MN Short Term % Long Term % Total %
Brazilian Currency 541.3 8.9% 4,464.0 73.8% 5,005.3 82.7%
Light SESA 499.1 8.3% 3,748.4 62.0% 4,247.5 70.2%
Debenture 4th Issue 0.0 0.0% 0.0 0.0% 0.0 0.0%
Debenture 7th Issue 28.7 0.5% 649.5 10.7% 678.2 11.2%
Debenture 8th Issue 16.3 0.3% 469.6 7.8% 485.9 8.0%
Debenture 9th Issue - series A 39.6 0.7% 995.5 16.5% 1,035.1 17.1%
Debenture 9th Issue - series B 12.8 0.2% 623.9 10.3% 636.7 10.5%
Eletrobras 1.0 0.0% 5.7 0.1% 6.6 0.1%
CCB Bradesco 89.5 1.5% 225.0 3.7% 314.5 5.2%
Working Capital - Santander 85.0 1.4% - - 85.0 1.4%
BNDES (CAPEX) 121.3 2.0% 477.8 7.9% 599.1 9.9%
BNDES FINEM 102.6 1.7% 151.4 2.5% 253.9 4.2%
Banco do Brasil 1.6 0.0% 150.0 2.5% 151.6 2.5%
Others 0.9 0.0% - - 0.9 0.0%
Light Energia 33.7 0.6% 675.2 11.2% 708.9 11.7%
Debenture 1st Issue 9.1 0.2% 171.4 2.8% 180.6 3.0%
Debenture 2nd Issue 4.9 0.1% 423.7 7.0% 428.6 7.1%
Debenture 3rd Issue 1.0 0.0% 29.9 0.5% 30.9 0.5%
BNDES (CAPEX) 7.0 0.1% 20.9 0.3% 27.9 0.5%
BNDES FINEM 11.5 0.2% 29.2 0.5% 40.8 0.7%
Others 0.1 0.0% - - 0.1 0.0%
Light ESCO 8.5 0.1% 40.5 0.7% 49.0 0.8%
BNDES - PROESCO 8.5 0.1% 40.5 0.7% 49.0 0.8%
Foreing Currency 149.5 2.5% 895.0 14.8% 1,044.5 17.3%
Light SESA 148.7 2.5% 713.9 11.8% 862.7 14.3%
National Treasury 6.8 0.1% 41.3 0.7% 48.1 0.8%
Merril Lynch 29.2 0.5% 84.3 1.4% 113.5 1.9%
BNP 111.8 1.8% - - 111.8 1.8%
Citibank 0.8 0.0% 452.6 7.5% 453.4 7.5%
Bank Tokyo - Mitsubishi 0.2 0.0% 135.8 2.2% 135.9 2.2%
Light Energia 0.8 0.0% 181.0 3.0% 181.9 3.0%
Citibank 0.8 0.0% 181.0 3.0% 181.9 3.0%
Gross Debt 690.9 11.4% 5,359.0 88.6% 6,049.9 100.0%
Cash 708.1
Net Debt (a) 5341.8
R$ MN Mar-13 Dec-13 Mar-14 % mar 13 % dec 13
Net Debt 4,031.4 4,024.9 5,341.8 32.5% 32.7%
Braslight 1,065.4 1,224.7 - - -
Net Debt + Braslight 5,096.8 5,249.5 5,341.8 4.8% 1.8%
23
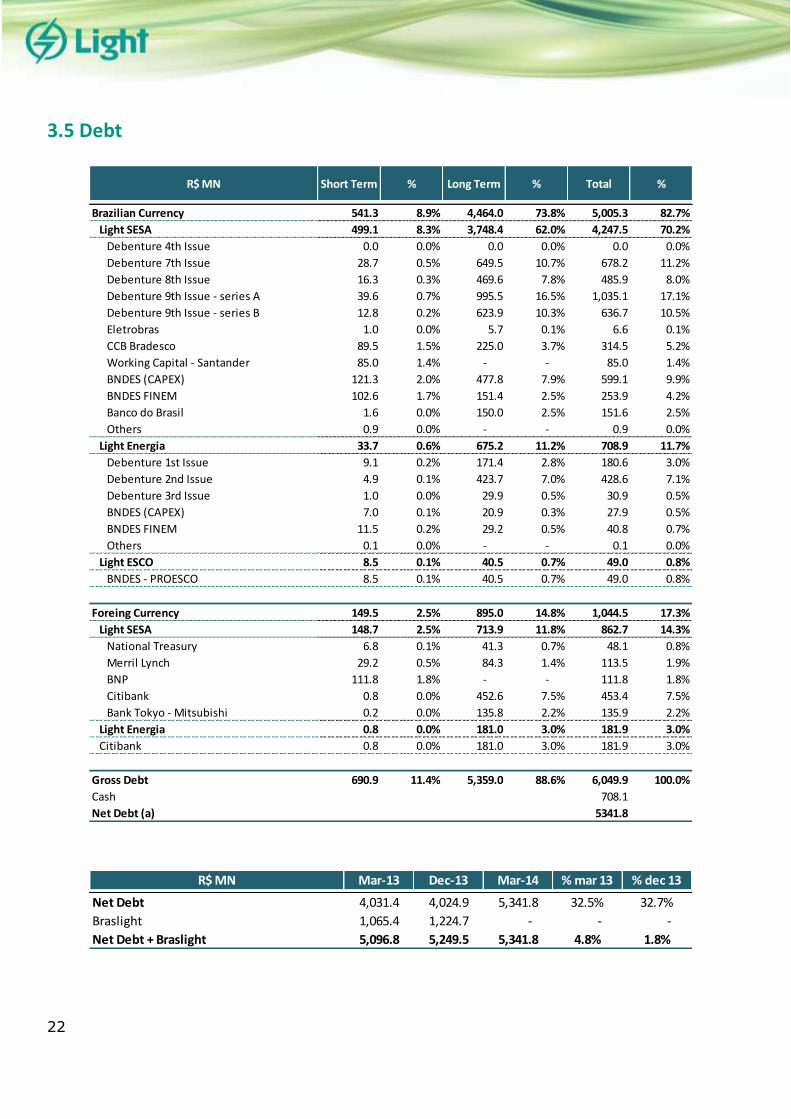
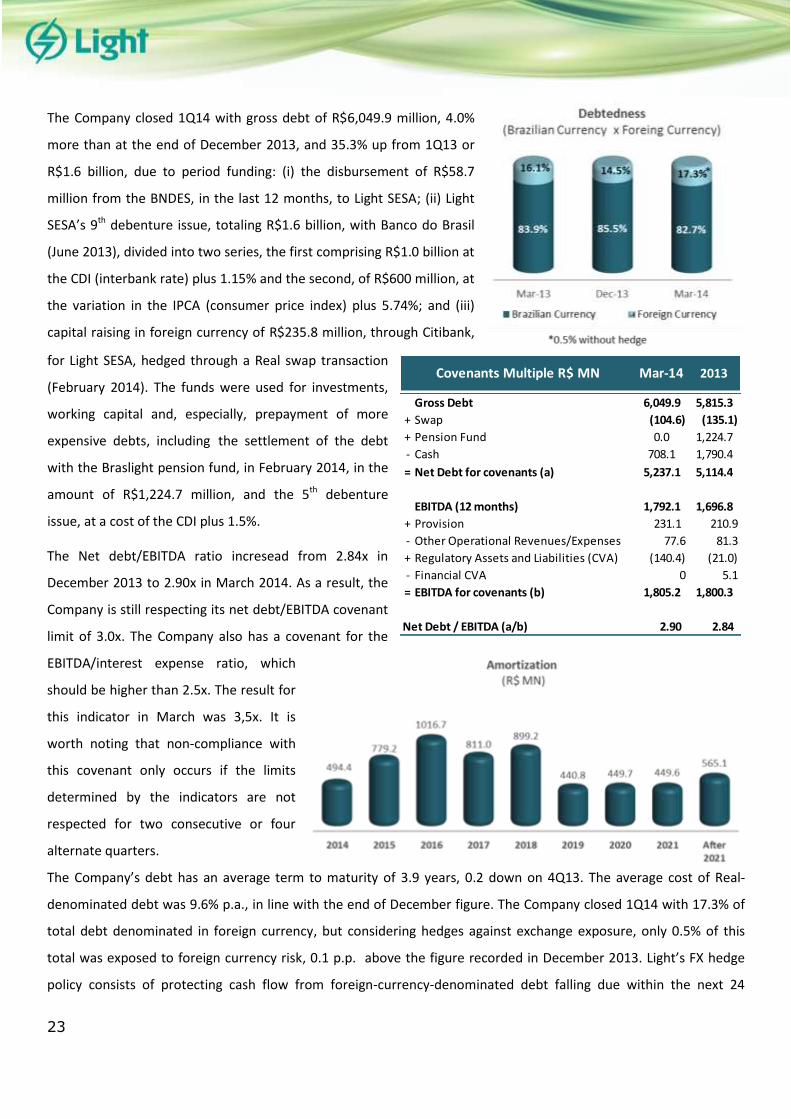
The Company closed 1Q14 with gross debt of R$6,049.9 million, 4.0%
more than at the end of December 2013, and 35.3% up from 1Q13 or
R$1.6 billion, due to period funding: (i) the disbursement of R$58.7
million from the BNDES, in the last 12 months, to Light SESA; (ii) Light
SESA’s 9th debenture issue, totaling R$1.6 billion, with Banco do Brasil
(June 2013), divided into two series, the first comprising R$1.0 billion at
the CDI (interbank rate) plus 1.15% and the second, of R$600 million, at
the variation in the IPCA (consumer price index) plus 5.74%; and (iii)
capital raising in foreign currency of R$235.8 million, through Citibank,
for Light SESA, hedged through a Real swap transaction
(February 2014). The funds were used for investments,
working capital and, especially, prepayment of more
expensive debts, including the settlement of the debt
with the Braslight pension fund, in February 2014, in the
amount of R$1,224.7 million, and the 5th debenture
issue, at a cost of the CDI plus 1.5%.
The Net debt/EBITDA ratio incresead from 2.84x in
December 2013 to 2.90x in March 2014. As a result, the
Company is still respecting its net debt/EBITDA covenant
limit of 3.0x. The Company also has a covenant for the
EBITDA/interest expense ratio, which
should be higher than 2.5x. The result for
this indicator in March was 3,5x. It is
worth noting that non-compliance with
this covenant only occurs if the limits
determined by the indicators are not
respected for two consecutive or four
alternate quarters.
The Company’s debt has an average term to maturity of 3.9 years, 0.2 down on 4Q13. The average cost of Real-
denominated debt was 9.6% p.a., in line with the end of December figure. The Company closed 1Q14 with 17.3% of
total debt denominated in foreign currency, but considering hedges against exchange exposure, only 0.5% of this
total was exposed to foreign currency risk, 0.1 p.p. above the figure recorded in December 2013. Light’s FX hedge
policy consists of protecting cash flow from foreign-currency-denominated debt falling due within the next 24
Mar-14 2013
Gross Debt 6,049.9 5,815.3
+ Swap (104.6) (135.1)
+ Pension Fund 0.0 1,224.7
- Cash 708.1 1,790.4
= Net Debt for covenants (a) 5,237.1 5,114.4
EBITDA (12 months) 1,792.1 1,696.8
+ Provision 231.1 210.9
- Other Operational Revenues/Expenses 77.6 81.3
+ Regulatory Assets and Liabilities (CVA) (140.4) (21.0)
- Financial CVA 0 5.1
= EBITDA for covenants (b) 1,805.2 1,800.3
2.90 2.84
Covenants Multiple R$ MN
Net Debt / EBITDA (a/b)
24
months (principal and interest) through the use of non-cash swap instruments with premier financial institutions.
Funding via Central Bank Resolution 4131, from Merrill Lynch, BNP, Citibank and Bank Tokyo-Mitsubishi, was
contracted with swaps for the entire term of the debt.
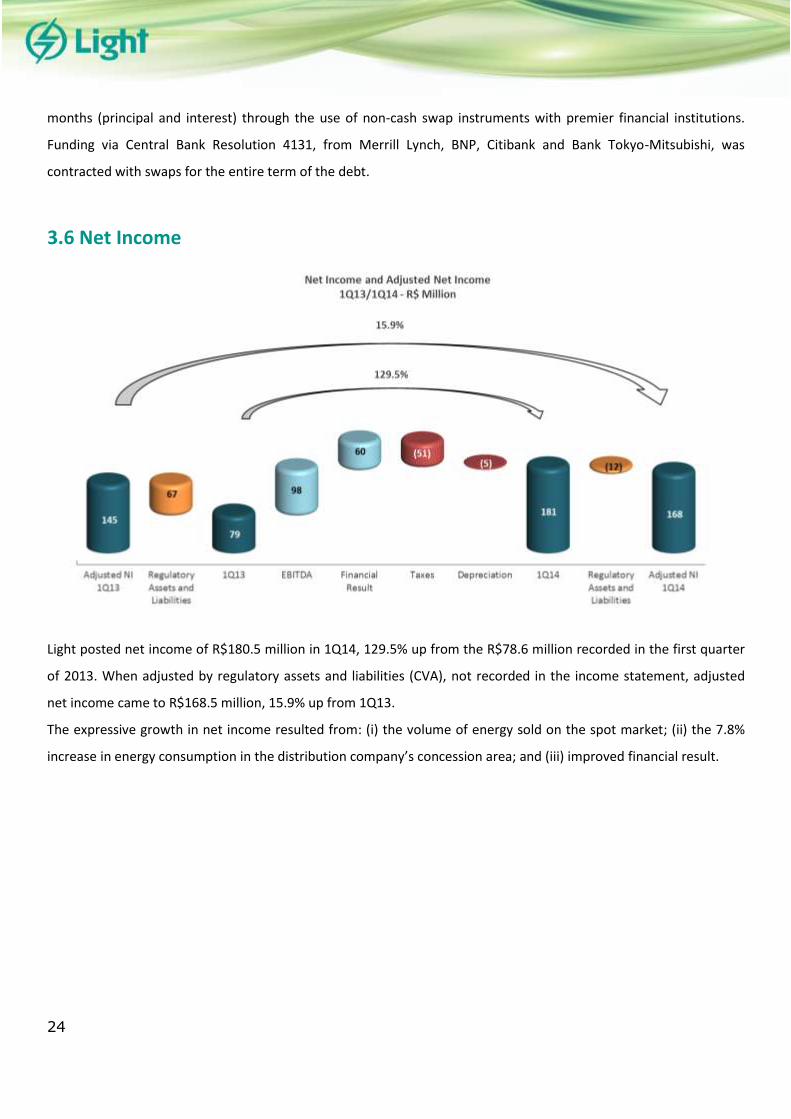
3.6 Net Income
Light posted net income of R$180.5 million in 1Q14, 129.5% up from the R$78.6 million recorded in the first quarter
of 2013. When adjusted by regulatory assets and liabilities (CVA), not recorded in the income statement, adjusted
net income came to R$168.5 million, 15.9% up from 1Q13.
The expressive growth in net income resulted from: (i) the volume of energy sold on the spot market; (ii) the 7.8%
increase in energy consumption in the distribution company’s concession area; and (iii) improved financial result.
25
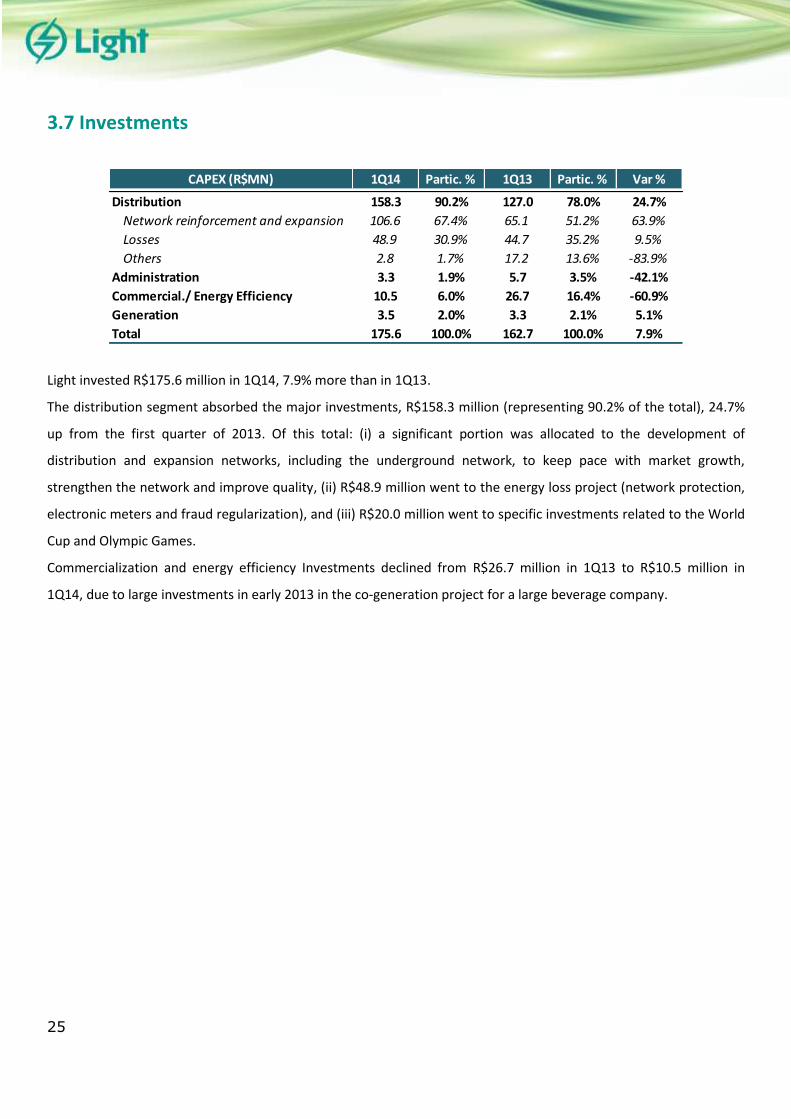
3.7 Investments
Light invested R$175.6 million in 1Q14, 7.9% more than in 1Q13.
The distribution segment absorbed the major investments, R$158.3 million (representing 90.2% of the total), 24.7%
up from the first quarter of 2013. Of this total: (i) a significant portion was allocated to the development of
distribution and expansion networks, including the underground network, to keep pace with market growth,
strengthen the network and improve quality, (ii) R$48.9 million went to the energy loss project (network protection,
electronic meters and fraud regularization), and (iii) R$20.0 million went to specific investments related to the World
Cup and Olympic Games.
Commercialization and energy efficiency Investments declined from R$26.7 million in 1Q13 to R$10.5 million in
1Q14, due to large investments in early 2013 in the co-generation project for a large beverage company.
CAPEX (R$MN) 1Q14 Partic. % 1Q13 Partic. % Var %
Distribution 158.3 90.2% 127.0 78.0% 24.7%
Network reinforcement and expansion 106.6 67.4% 65.1 51.2% 63.9%
Losses 48.9 30.9% 44.7 35.2% 9.5%
Others 2.8 1.7% 17.2 13.6% -83.9%
Administration 3.3 1.9% 5.7 3.5% -42.1%
Commercial./ Energy Efficiency 10.5 6.0% 26.7 16.4% -60.9%
Generation 3.5 2.0% 3.3 2.1% 5.1%
Total 175.6 100.0% 162.7 100.0% 7.9%
26
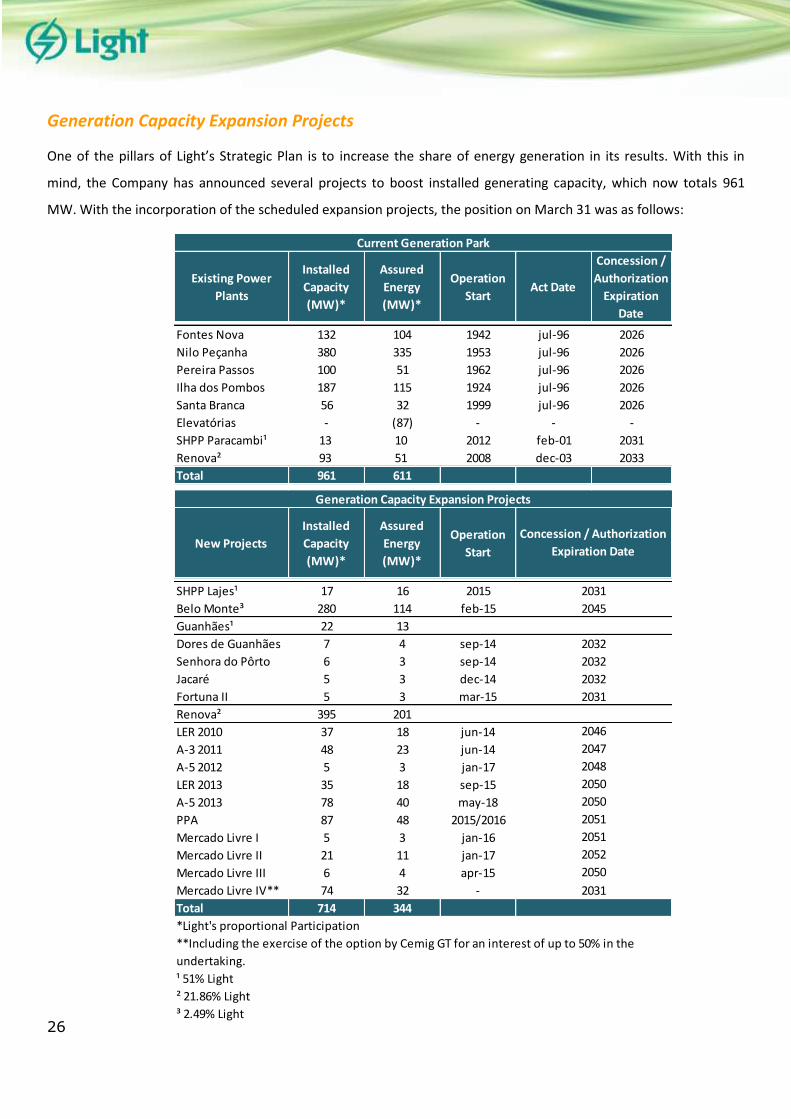
Generation Capacity Expansion Projects
One of the pillars of Light’s Strategic Plan is to increase the share of energy generation in its results. With this in
mind, the Company has announced several projects to boost installed generating capacity, which now totals 961
MW. With the incorporation of the scheduled expansion projects, the position on March 31 was as follows:
Existing Power
Plants
Installed
Capacity
(MW)*
Assured
Energy
(MW)*
Operation
Start Act Date
Concession /
Authorization
Expiration
Date
Fontes Nova 132 104 1942 jul-96 2026
Nilo Peçanha 380 335 1953 jul-96 2026
Pereira Passos 100 51 1962 jul-96 2026
Ilha dos Pombos 187 115 1924 jul-96 2026
Santa Branca 56 32 1999 jul-96 2026
Elevatórias - (87) - - -
SHPP Paracambi¹ 13 10 2012 feb-01 2031
Renova² 93 51 2008 dec-03 2033
Total 961 611
New Projects
Installed
Capacity
(MW)*
Assured
Energy
(MW)*
Operation
Start
SHPP Lajes¹ 17 16 2015
Belo Monte³ 280 114 feb-15
Guanhães¹ 22 13
Dores de Guanhães 7 4 sep-14
Senhora do Pôrto 6 3 sep-14
Jacaré 5 3 dec-14
Fortuna II 5 3 mar-15
Renova² 395 201
LER 2010 37 18 jun-14
A-3 2011 48 23 jun-14
A-5 2012 5 3 jan-17
LER 2013 35 18 sep-15
A-5 2013 78 40 may-18
PPA 87 48 2015/2016
Mercado Livre I 5 3 jan-16
Mercado Livre II 21 11 jan-17
Mercado Livre III 6 4 apr-15
Mercado Livre IV** 74 32 -
Total 714 344
*Light's proportional Participation
¹ 51% Light
² 21.86% Light
³ 2.49% Light
2045
Current Generation Park
Generation Capacity Expansion Projects
Concession / Authorization
Expiration Date
2031
2048
2051
2032
2032
2032
2031
2046
2047
**Including the exercise of the option by Cemig GT for an interest of up to 50% in the
undertaking.
2050
2051
2052
2050
2050
2031
27
The first quarter of 2014 was marked by the following events related to projects for expanding Light’s generating
capacity:
Lajes SHP
• The basic project has already been approved by ANEEL. In June 2013, ANEEL altered the public service exploration
regime to independent energy producer. As a result, the SHP obtained a 50% reduction in TUSD and TUST fees. The
hiring of the construction company is in progress. Once the construction company is defined, it will be possible to
begin the works, with start-up scheduled for the first half of 2016, given that the project has already been granted an
installation license. The 17 MW turbine will be installed in the old powerhouse of the Fontes Velha power plant. In
addition to increasing generating capacity, the project also brings certain other benefits, such as increasing
operational flexibility, upgrading the supply of the CEDAE water main, controlling the Piraí River’s water level, and
improving the quality of the water in the Lajes Reservoir.
On January 24, 2014, the Board of Directors authorized the creation of SPE Lajes Energia S.A., a wholly-owned
subsidiary of Light Energia S.A., for Lajes SHP’s implementation, construction, operation and maintenance.
Guanhães Energia
• Guanhães Energia S.A. is a special purpose entity (SPE) with the purpose of implanting four small hydroelectric
power plants (SHPs)—Dores de Guanhães, Senhora do Pôrto, Jacaré and Fortuna II, all of which in the state of Minas
Gerais, with a joint installed capacity of 44 MW. Guanhães Energia’s shareholders are Light Energia S.A. (51%) and
CEMIG Geração e Transmissão S.A. (49%).
SHPs Senhora do Pôrto and Dores de Guanhães are scheduled for start-up in the third quarter of 2014.
SHP Jacaré is scheduled for start-up in the fourth quarter of 2014, while SHP Fortuna II is scheduled for start-up in
the first quarter of 2015.
Belo Monte Hydroelectric Power Plant
• In October 2011, Amazônia Energia, owned by Light (25.5%) and Cemig (74.5%), acquired 9.77% of Norte Energia,
the consortium responsible for building and operating the Belo Monte Hydroelectric Power Plant. Located on the
Xingu River in the state of Pará, Belo Monte is the largest 100% Brazilian hydro plant and the fourth largest in the
world. It has an installed capacity of 11,233 MW and assured energy of 4,571 average MW. The first turbine is
scheduled for start-up in February 2015 and all 24 turbines are expected to be operational by January 2019.
At the Pimental site, the construction of the Left Side Dam, Spillway and Complementary Powerhouse are well under
way, which will enable the embankment of the Xingu River to form the plant’s main reservoir.
28
Renova Energia (“Renova”)
• In 2013, Renova announced the acquisition of 51% of Brasil PCH and the entry of Cemig GT into Renova’s
controlling block. Brasil PCH has 13 small hydroelectric power plants, with a joint installed capacity of 291 MW and
assured energy of 194 average MW. The acquisition is strategic for Renova, which added operational assets to its
base, thus improving the balance between operational assets and assets under construction and development.
In February 2014, Renova made the payment for the acquisition of 51% of Brasil PCH totaling R$739.9 million. The
amount remaining from the capital increase to be subscribed by Cemig GT or a specific purpose entity, in which
Cemig GT holds an interest of at least 50% and a private equity investment fund holds at most the other 50%,
totaling R$810.1 million, was transferred to Renovain March 2014 as advance for future capital increase by Cemig
GT. These amounts will be fully paid by July 29, 2014, date of expiration of the preemptive rights resulting from the
capital increase.
After the capital increase, a new shareholders’ agreement will be executed, through which Cemig GT or SPE, RR
Participações and Light Energia will become part of Renova’s controlling block.
Currently, Renova has a 60% interest in the specific purpose entity, Chipley SP Participações S.A., which owns 51%
of Brasil PCH.
29
4. Cash Flow
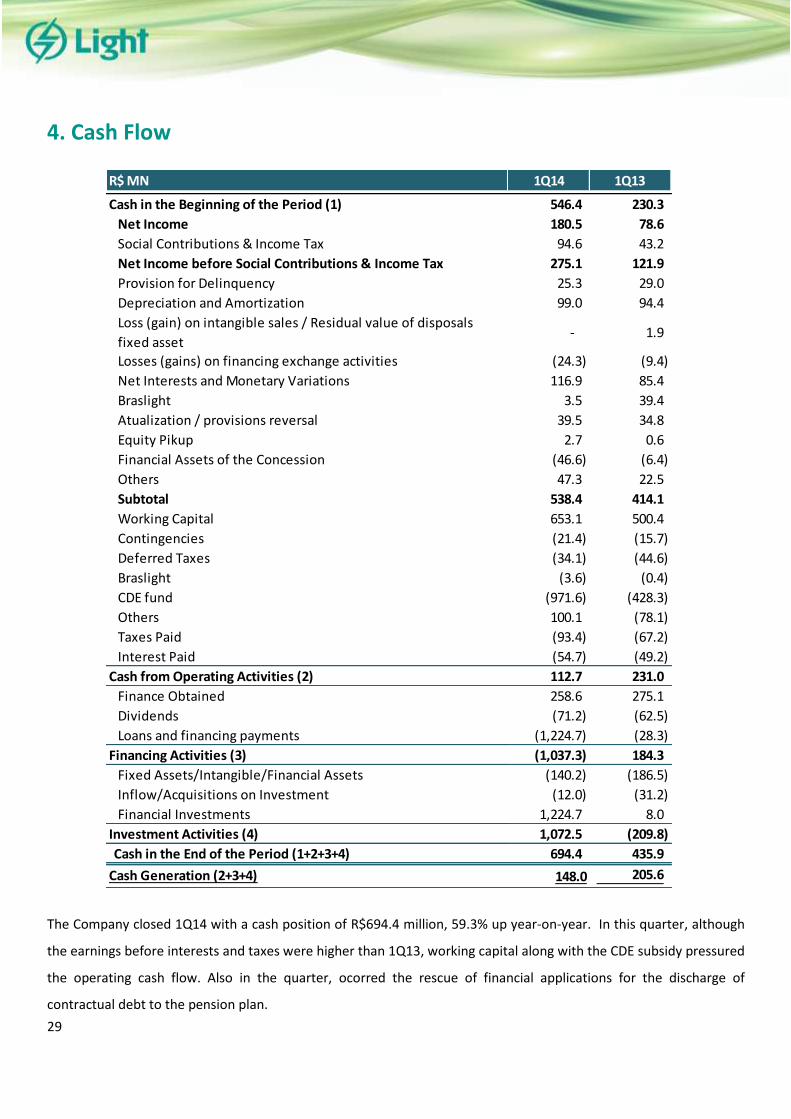
The Company closed 1Q14 with a cash position of R$694.4 million, 59.3% up year-on-year. In this quarter, although
the earnings before interests and taxes were higher than 1Q13, working capital along with the CDE subsidy pressured
the operating cash flow. Also in the quarter, ocorred the rescue of financial applications for the discharge of
contractual debt to the pension plan.
R$ MN 1Q14 1Q13
Cash in the Beginning of the Period (1) 546.4 230.3
Net Income 180.5 78.6
Social Contributions & Income Tax 94.6 43.2
Net Income before Social Contributions & Income Tax 275.1 121.9
Provision for Delinquency 25.3 29.0
Depreciation and Amortization 99.0 94.4
Loss (gain) on intangible sales / Residual value of disposals
fixed asset- 1.9
Losses (gains) on financing exchange activities (24.3) (9.4)
Net Interests and Monetary Variations 116.9 85.4
Braslight 3.5 39.4
Atualization / provisions reversal 39.5 34.8
Equity Pikup 2.7 0.6
Financial Assets of the Concession (46.6) (6.4)
Others 47.3 22.5
Subtotal 538.4 414.1
Working Capital 653.1 500.4
Contingencies (21.4) (15.7)
Deferred Taxes (34.1) (44.6)
Braslight (3.6) (0.4)
CDE fund (971.6) (428.3)
Others 100.1 (78.1)
Taxes Paid (93.4) (67.2)
Interest Paid (54.7) (49.2)
Cash from Operating Activities (2) 112.7 231.0
Finance Obtained 258.6 275.1
Dividends (71.2) (62.5)
Loans and financing payments (1,224.7) (28.3)
Financing Activities (3) (1,037.3) 184.3
Fixed Assets/Intangible/Financial Assets (140.2) (186.5)
Inflow/Acquisitions on Investment (12.0) (31.2)
Financial Investments 1,224.7 8.0
Investment Activities (4) 1,072.5 (209.8)
Cash in the End of the Period (1+2+3+4) 694.4 435.9
Cash Generation (2+3+4) 148.0 205.6
30
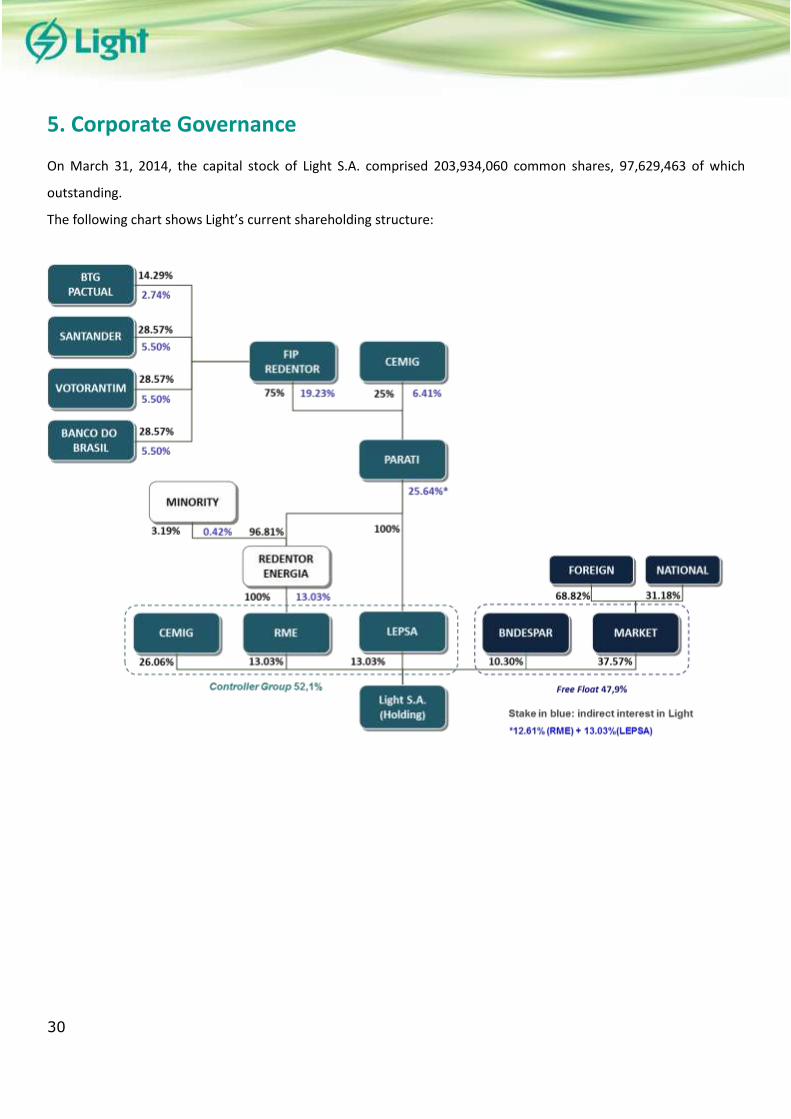
5. Corporate Governance
On March 31, 2014, the capital stock of Light S.A. comprised 203,934,060 common shares, 97,629,463 of which
outstanding.
The following chart shows Light’s current shareholding structure:
31
6. Capital Markets
Light’s shares have been listed in the BM&FBovespa’s Novo Mercado trading segment since July 2005, therefore
adhering to the best corporate governance practices and the principles of transparency and equity, in addition to
granting special rights to minority shareholders. Light S.A.’s shares are included in the following indices: Ibovespa,
IGC (Corporate Governance Index), IEE (Electric Power Index), IBrX (Brazil Index), ISE (Corporate Sustainability Index),
ITAG (Special Tag Along Stock Index) and IDIV (Dividend Index). They are also traded on the U.S. over-the-counter
(OTC) market as Level 1 ADRs under the ticker LGSXY.
At the end of March 2014, Light S.A.’s shares (LIGT3) were priced at R$18.75. ao final de março de 2014. The
Company’s market cap (no. of shares x share price) closed the quarter at approximately R$3,824 million.
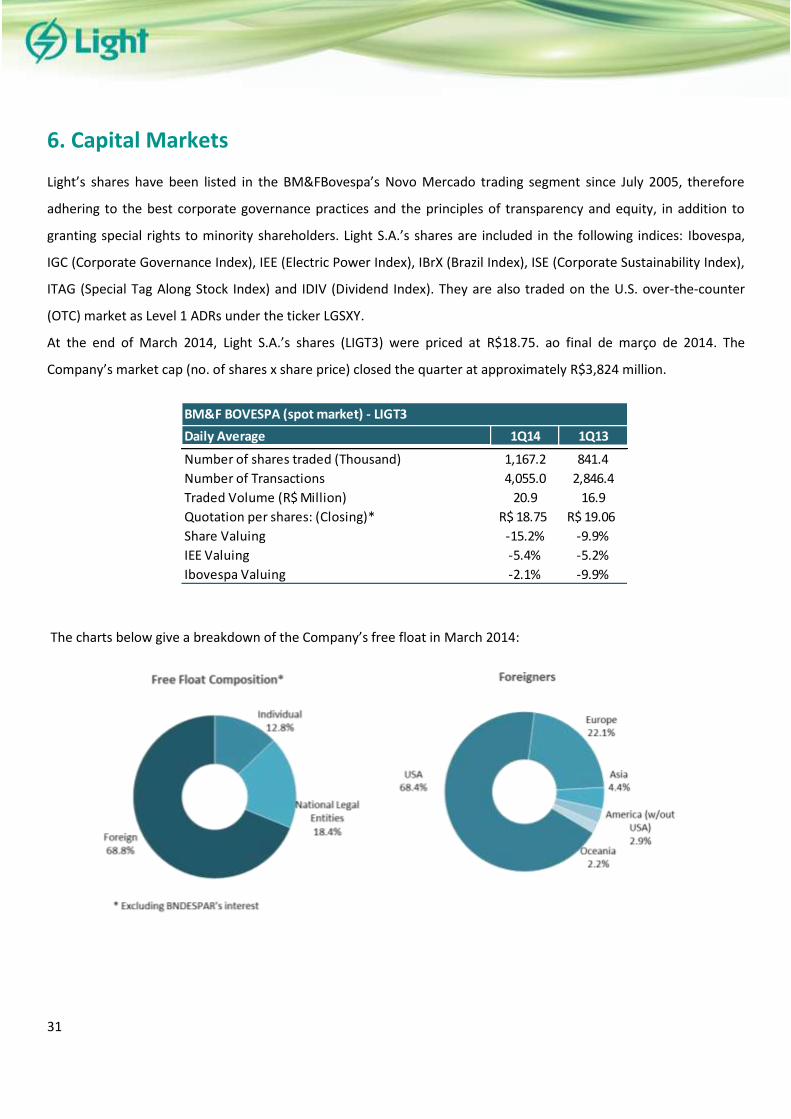
The charts below give a breakdown of the Company’s free float in March 2014:
Daily Average 1Q14 1Q13 2013 2012
Number of shares traded (Thousand) 1,167.2 841.4 908.7 691.0
Number of Transactions 4,055.0 2,846.4 3,168 2,672
Traded Volume (R$ Million) 20.9 16.9 17.1 17.3
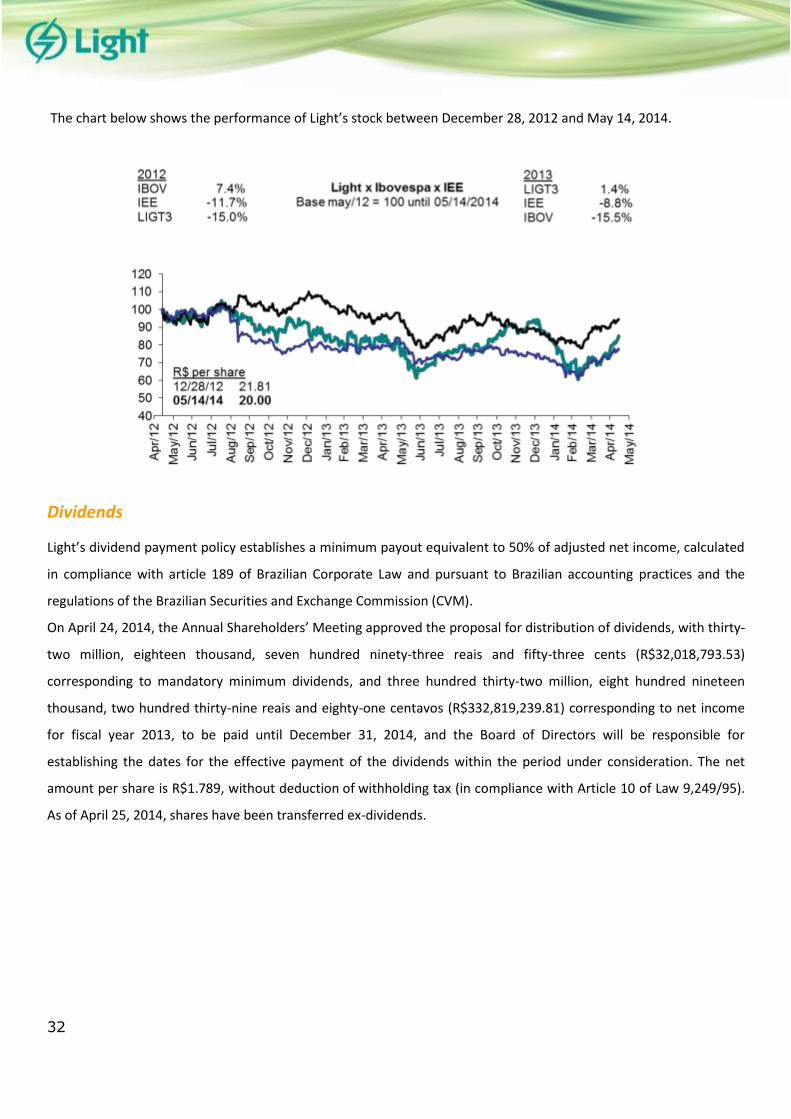
Quotation per shares: (Closing)* R$ 18.75 R$ 19.06 R$ 22.12 R$ 21.27
Share Valuing -15.2% -9.9% 4.6% -14.3%
IEE Valuing -5.4% -5.2% -10.3% -11.6%
Ibovespa Valuing -2.1% -9.9% -17.7% 5.4%
BM&F BOVESPA (spot market) - LIGT3
32
The chart below shows the performance of Light’s stock between December 28, 2012 and May 14, 2014.
Dividends
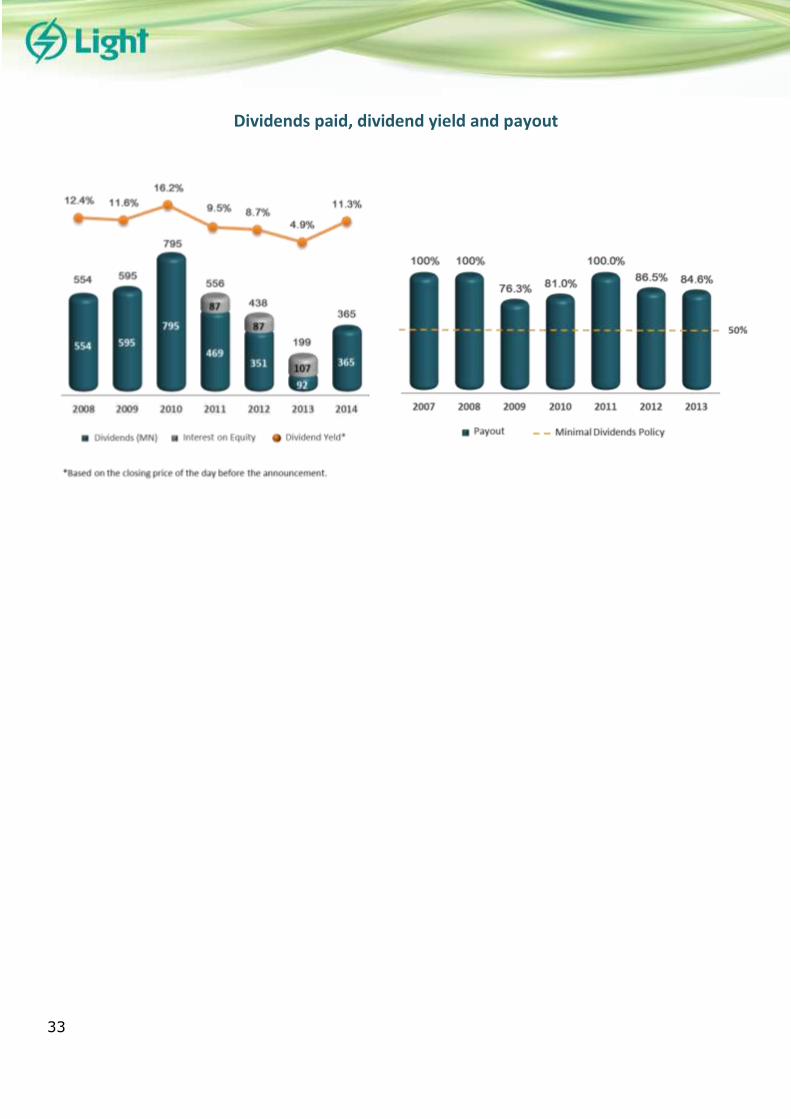
Light’s dividend payment policy establishes a minimum payout equivalent to 50% of adjusted net income, calculated
in compliance with article 189 of Brazilian Corporate Law and pursuant to Brazilian accounting practices and the
regulations of the Brazilian Securities and Exchange Commission (CVM).
On April 24, 2014, the Annual Shareholders’ Meeting approved the proposal for distribution of dividends, with thirty-
two million, eighteen thousand, seven hundred ninety-three reais and fifty-three cents (R$32,018,793.53)
corresponding to mandatory minimum dividends, and three hundred thirty-two million, eight hundred nineteen
thousand, two hundred thirty-nine reais and eighty-one centavos (R$332,819,239.81) corresponding to net income
for fiscal year 2013, to be paid until December 31, 2014, and the Board of Directors will be responsible for
establishing the dates for the effective payment of the dividends within the period under consideration. The net
amount per share is R$1.789, without deduction of withholding tax (in compliance with Article 10 of Law 9,249/95).
As of April 25, 2014, shares have been transferred ex-dividends.
33
Dividends paid, dividend yield and payout
34
7. Recent Events
At the Annual and Extraordinary Shareholders’ Meeting held on April 24, 2014, the shareholders resolved on the
following matters: (i) allocation of net income for the fiscal year ended December 31, 2013 and the distribution of
dividends totaling R$364.8 million, to be paid as dividends until December 31, 2014; (ii) election of the 11 sitting
members and same number of alternate members of the Board of Directors, including independent Board
members and employees’ representative, with unified term-of-office of two (2) years running through the Annual
Shareholders’ Meeting to be held in 2016; (iii) instauration of the Fiscal Council and election of five sitting
members and their respective alternates; (iv) rectification of the Management’s variable compensation for 2013;
and (v) Long-Term Incentive Plan (ILP) for the Management;
On May 13, 2014, was closed the public offering, according to CVM instruction No. 476, the 10th issue of simple,
non-convertible, unsecured debentures of Light SESA, with a personal guarantee, in a single series, in the amount
of R$750 million. The resources will be used to strengthen working capital and/or to refinance maturing debts.
The debentures will yield interest corresponding to the accumulated variation of 115% of the Interbank Deposits
(DI Tax) and have a period of valid of 6 years with effect from May 9, 2014, with repayments in annual
installments from the 4th year, with the first repayment on May 9, 2018, and the last on May 9, 2020.
On April 28, 2014 and May 12, 2014, were transferred by the Chamber of Electric Energy Trading Chamber - CCEE
to Light SESA the amounts of R$ 556.7 million and R$ 423.1 million, respectively, related to CDE resources for the
months of February and March 2014. The amount was used for the settlement of energy purchase commitments
with the CCEE.
35
8. Disclosure Program
Forward-looking statements
The information on the Company’s operations and its Management’s expectations regarding its future performance
was not reviewed by independent auditors.
Statements about future events are subject to risks and uncertainties. These statements are based on beliefs and
assumptions of our Management, and on information currently available to the Company. Statements about future
events include information about our intentions, beliefs or current expectations, as well as of the Company's Board
of Directors and Officers. Exceptions related to statements and information about the future also include information
about operating results, likely or presumed, as well as statements that are preceded by, followed by, or including
words such as "believes", "might", "will", "continues", "expects", "estimates", "intends", "anticipates", or similar
expressions. Statements and information about the future are not a guarantee of performance. They involve risks,
uncertainties and assumptions because they refer to future events, thus depending on circumstances that might or
might not occur. Future results and creation of value to shareholders might significantly differ from the ones
expressed or suggested by forward-looking statements. Many of the factors that will determine these results and
values are beyond LIGHT S.A.'s control or forecast capacity.
Contact e-mail Phone
Gustavo Werneck Souza [email protected] +55 21 2211-2560
Mariana da Silva Rocha [email protected] +55 21 2211-2814
Marcelle Pelajo [email protected] +55 21 2211-7392
Leonardo Dias Wanderley [email protected] +55 21 2211-2828
IR Team
Teleconference
Brazil: +55 (11) 2188 0155
USA: +1 (646) 843-6054
Other countries: +1 866 890 2584
Access code: Light
Schedule
05/16/2014, friday, at 3:00 p.m. (Brazilian Time) and at 2:00 p.m. (NY
Time), with simultaneous translation to English
Access conditions:
Webcast: link on site www.light.com.br/ri (portuguese and english)
Conference Call - Dial number:
36
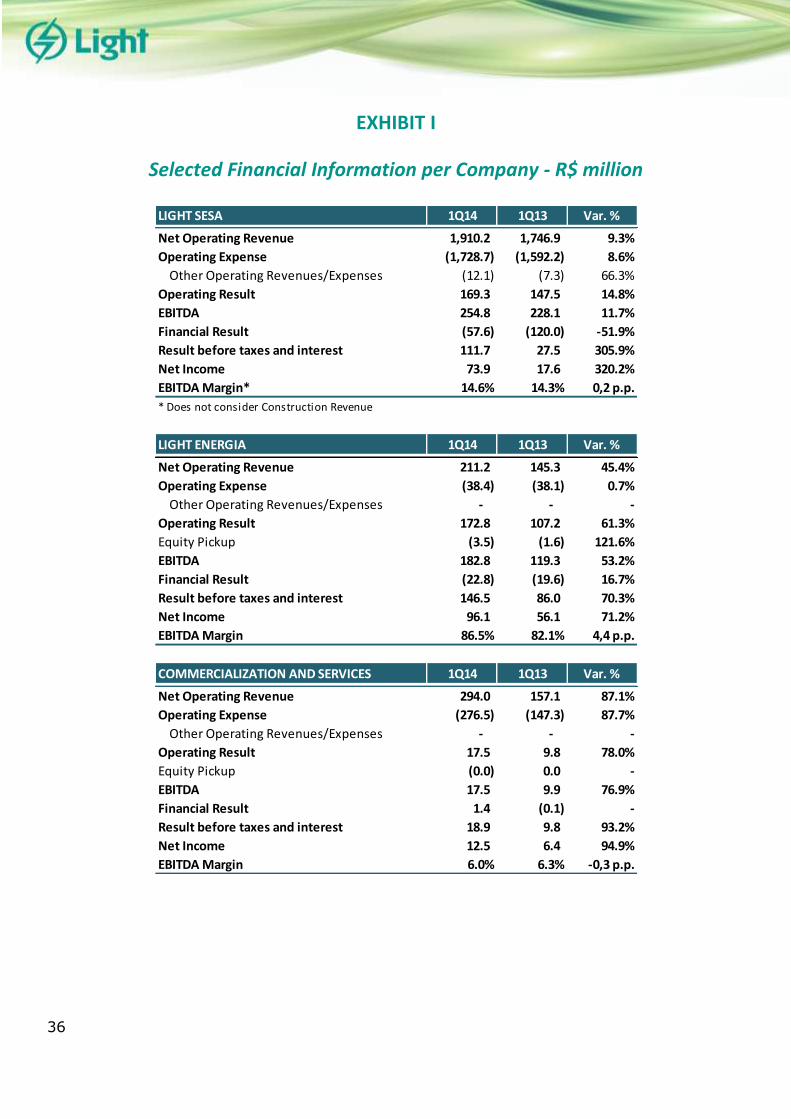
EXHIBIT I
Selected Financial Information per Company - R$ million
LIGHT SESA 1Q14 1Q13 Var. %
Net Operating Revenue 1,910.2 1,746.9 9.3%
Operating Expense (1,728.7) (1,592.2) 8.6%
Other Operating Revenues/Expenses (12.1) (7.3) 66.3%
Operating Result 169.3 147.5 14.8%
EBITDA 254.8 228.1 11.7%
Financial Result (57.6) (120.0) -51.9%
Result before taxes and interest 111.7 27.5 305.9%
Net Income 73.9 17.6 320.2%
EBITDA Margin* 14.6% 14.3% 0,2 p.p.
* Does not consider Construction Revenue
LIGHT ENERGIA 1Q14 1Q13 Var. %
Net Operating Revenue 211.2 145.3 45.4%
Operating Expense (38.4) (38.1) 0.7%
Other Operating Revenues/Expenses - - -
Operating Result 172.8 107.2 61.3%
Equity Pickup (3.5) (1.6) 121.6%
EBITDA 182.8 119.3 53.2%
Financial Result (22.8) (19.6) 16.7%
Result before taxes and interest 146.5 86.0 70.3%
Net Income 96.1 56.1 71.2%
EBITDA Margin 86.5% 82.1% 4,4 p.p.
COMMERCIALIZATION AND SERVICES 1Q14 1Q13 Var. %
Net Operating Revenue 294.0 157.1 87.1%
Operating Expense (276.5) (147.3) 87.7%
Other Operating Revenues/Expenses - - -
Operating Result 17.5 9.8 78.0%
Equity Pickup (0.0) 0.0 -
EBITDA 17.5 9.9 76.9%
Financial Result 1.4 (0.1) -
Result before taxes and interest 18.9 9.8 93.2%
Net Income 12.5 6.4 94.9%
EBITDA Margin 6.0% 6.3% -0,3 p.p.
37
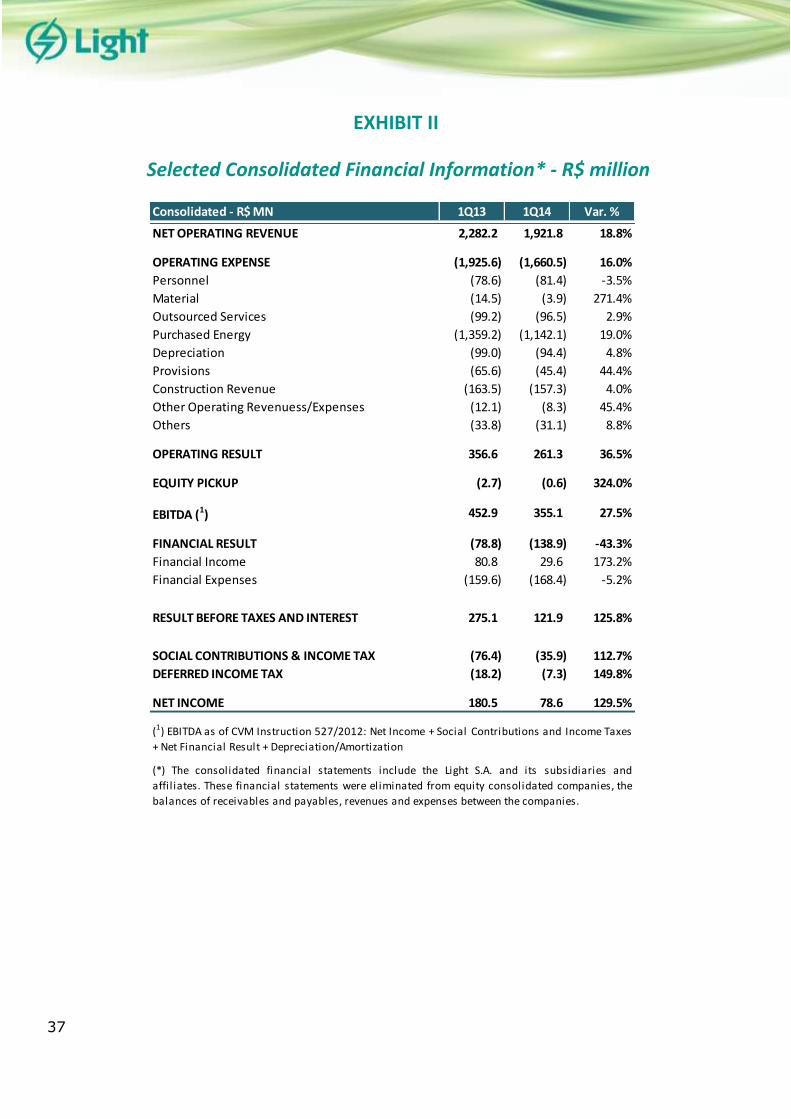
EXHIBIT II
Selected Consolidated Financial Information* - R$ million
Consolidated - R$ MN 1Q13 1Q14 Var. %
NET OPERATING REVENUE 2,282.2 1,921.8 18.8%
OPERATING EXPENSE (1,925.6) (1,660.5) 16.0%
Personnel (78.6) (81.4) -3.5%
Material (14.5) (3.9) 271.4%
Outsourced Services (99.2) (96.5) 2.9%
Purchased Energy (1,359.2) (1,142.1) 19.0%
Depreciation (99.0) (94.4) 4.8%
Provisions (65.6) (45.4) 44.4%
Construction Revenue (163.5) (157.3) 4.0%
Other Operating Revenuess/Expenses (12.1) (8.3) 45.4%
Others (33.8) (31.1) 8.8%
OPERATING RESULT 356.6 261.3 36.5%
EQUITY PICKUP (2.7) (0.6) 324.0%
EBITDA (1) 452.9 355.1 27.5%
FINANCIAL RESULT (78.8) (138.9) -43.3%
Financial Income 80.8 29.6 173.2%
Financial Expenses (159.6) (168.4) -5.2%
RESULT BEFORE TAXES AND INTEREST 275.1 121.9 125.8%
SOCIAL CONTRIBUTIONS & INCOME TAX (76.4) (35.9) 112.7%
DEFERRED INCOME TAX (18.2) (7.3) 149.8%
NET INCOME 180.5 78.6 129.5%
(1) EBITDA as of CVM Instruction 527/2012: Net Income + Social Contributions and Income Taxes
+ Net Financial Result + Depreciation/Amortization
(*) The consolidated financial statements include the Light S.A. and its subsidiaries and
affil iates. These financial statements were eliminated from equity consolidated companies, the
balances of receivables and payables, revenues and expenses between the companies.
38
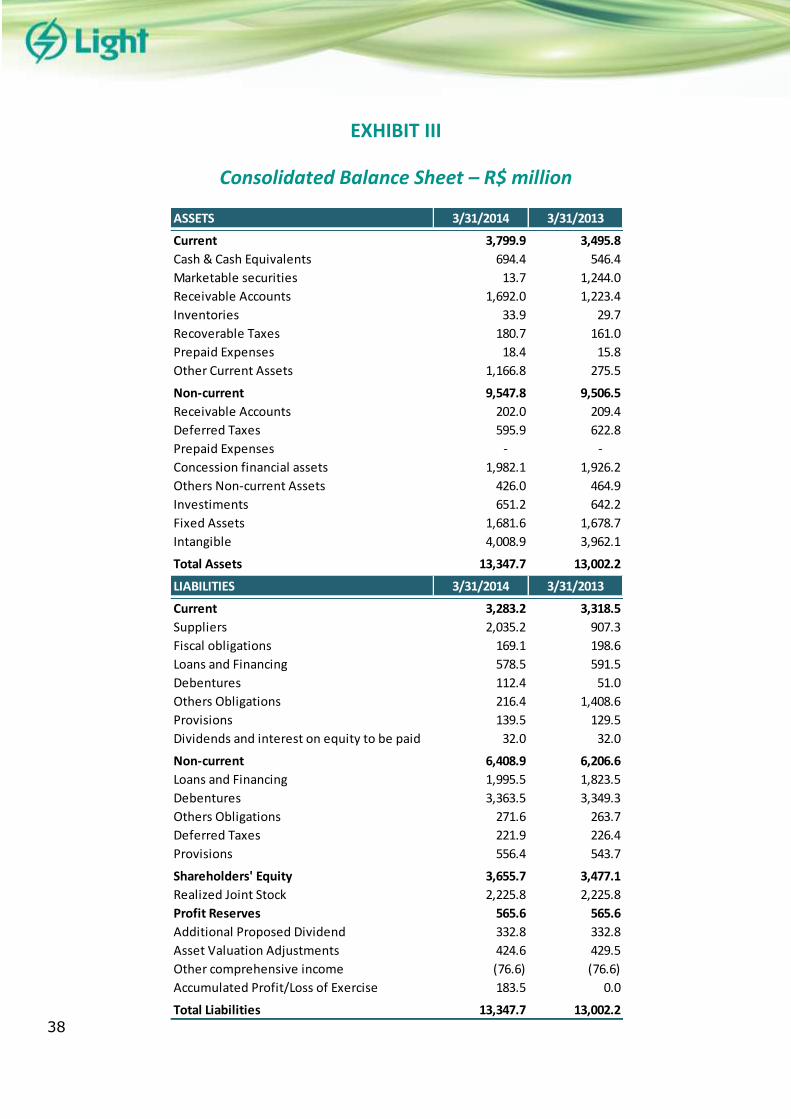
EXHIBIT III
Consolidated Balance Sheet – R$ million
ASSETS 3/31/2014 3/31/2013
Current 3,799.9 3,495.8
Cash & Cash Equivalents 694.4 546.4
Marketable securities 13.7 1,244.0
Receivable Accounts 1,692.0 1,223.4
Inventories 33.9 29.7
Recoverable Taxes 180.7 161.0
Prepaid Expenses 18.4 15.8
Other Current Assets 1,166.8 275.5
Non-current 9,547.8 9,506.5
Receivable Accounts 202.0 209.4
Deferred Taxes 595.9 622.8
Prepaid Expenses - -
Concession financial assets 1,982.1 1,926.2
Others Non-current Assets 426.0 464.9
Investiments 651.2 642.2
Fixed Assets 1,681.6 1,678.7
Intangible 4,008.9 3,962.1
Total Assets 13,347.7 13,002.2
LIABILITIES 3/31/2014 3/31/2013
Current 3,283.2 3,318.5
Suppliers 2,035.2 907.3
Fiscal obligations 169.1 198.6
Loans and Financing 578.5 591.5
Debentures 112.4 51.0
Others Obligations 216.4 1,408.6
Provisions 139.5 129.5
Dividends and interest on equity to be paid 32.0 32.0
Non-current 6,408.9 6,206.6
Loans and Financing 1,995.5 1,823.5
Debentures 3,363.5 3,349.3
Others Obligations 271.6 263.7
Deferred Taxes 221.9 226.4
Provisions 556.4 543.7
Shareholders' Equity 3,655.7 3,477.1
Realized Joint Stock 2,225.8 2,225.8
Profit Reserves 565.6 565.6
Additional Proposed Dividend 332.8 332.8
Asset Valuation Adjustments 424.6 429.5
Other comprehensive income (76.6) (76.6)
Accumulated Profit/Loss of Exercise 183.5 0.0
Total Liabilities 13,347.7 13,002.2
39
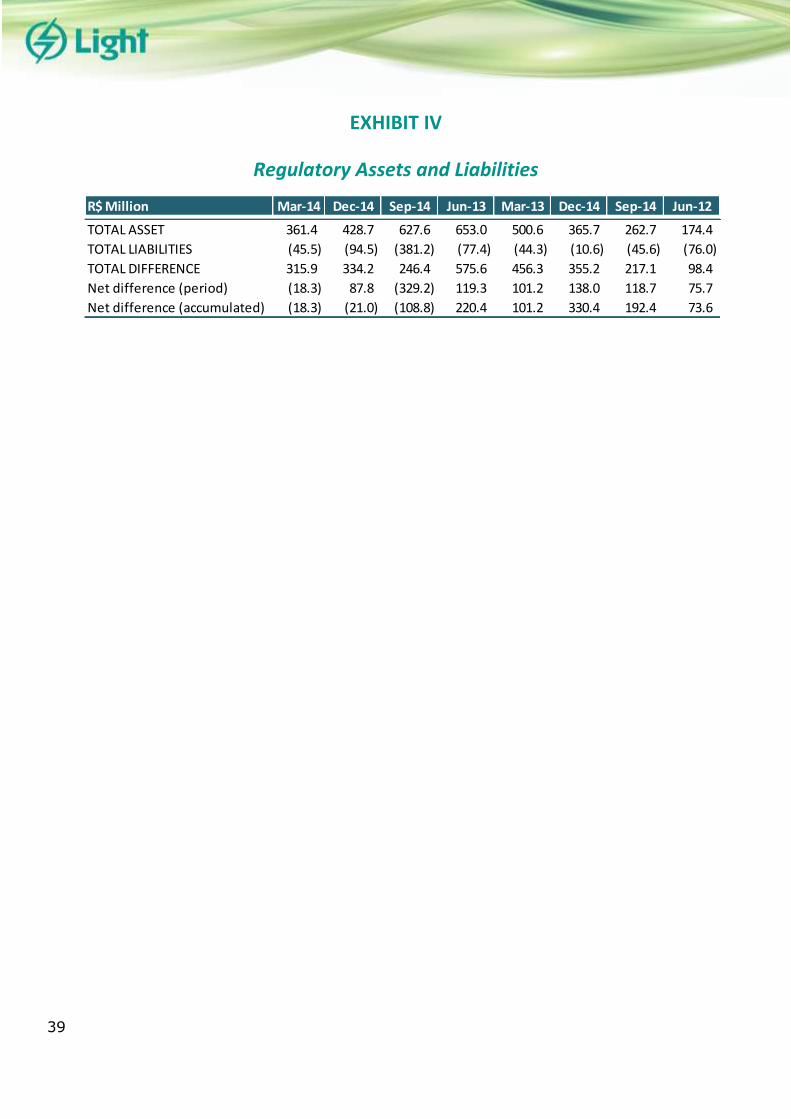
EXHIBIT IV
Regulatory Assets and Liabilities
R$ Million Mar-14 Dec-14 Sep-14 Jun-13 Mar-13 Dec-14 Sep-14 Jun-12
TOTAL ASSET 361.4 428.7 627.6 653.0 500.6 365.7 262.7 174.4
TOTAL LIABILITIES (45.5) (94.5) (381.2) (77.4) (44.3) (10.6) (45.6) (76.0)
TOTAL DIFFERENCE 315.9 334.2 246.4 575.6 456.3 355.2 217.1 98.4
Net difference (period) (18.3) 87.8 (329.2) 119.3 101.2 138.0 118.7 75.7
Net difference (accumulated) (18.3) (21.0) (108.8) 220.4 101.2 330.4 192.4 73.6
40
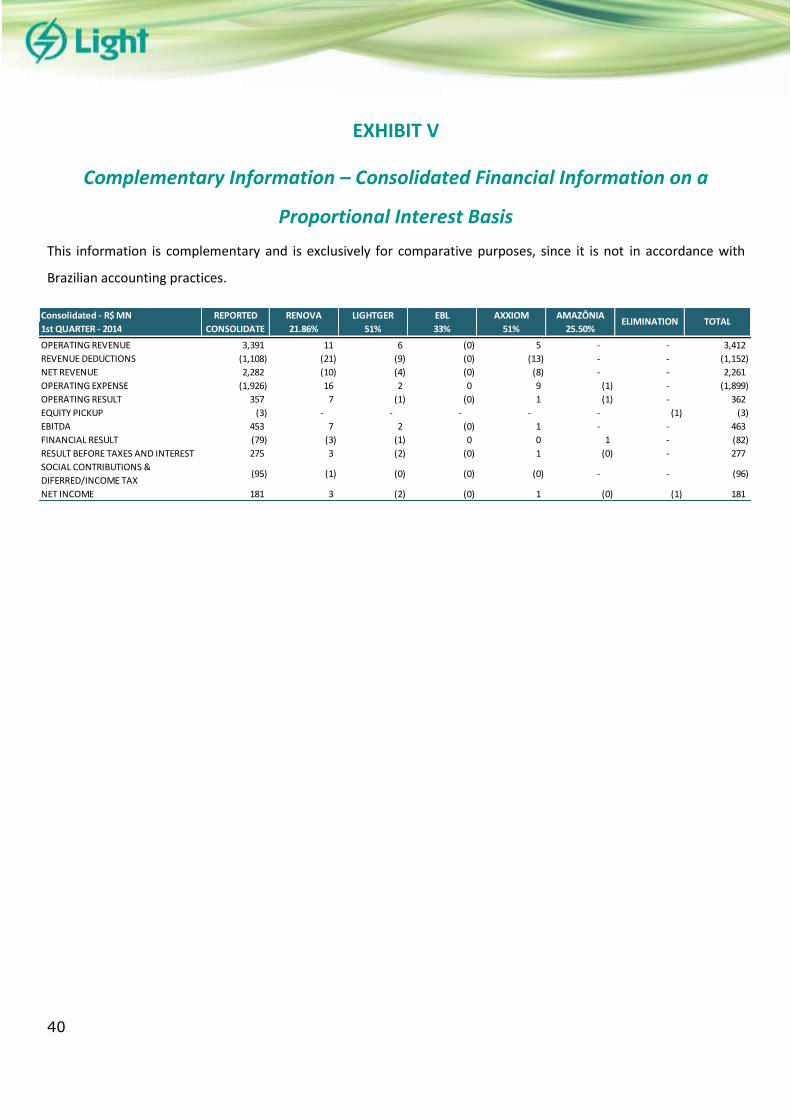
EXHIBIT V
Complementary Information – Consolidated Financial Information on a
Proportional Interest Basis
This information is complementary and is exclusively for comparative purposes, since it is not in accordance with
Brazilian accounting practices.
Consolidated - R$ MN RENOVA LIGHTGER EBL AXXIOM AMAZÔNIA
1st QUARTER - 2014 21.86% 51% 33% 51% 25.50%
OPERATING REVENUE 3,391 11 6 (0) 5 - - 3,412
REVENUE DEDUCTIONS (1,108) (21) (9) (0) (13) - - (1,152)
NET REVENUE 2,282 (10) (4) (0) (8) - - 2,261
OPERATING EXPENSE (1,926) 16 2 0 9 (1) - (1,899)
OPERATING RESULT 357 7 (1) (0) 1 (1) - 362
EQUITY PICKUP (3) - - - - - (1) (3)
EBITDA 453 7 2 (0) 1 - - 463
FINANCIAL RESULT (79) (3) (1) 0 0 1 - (82)
RESULT BEFORE TAXES AND INTEREST 275 3 (2) (0) 1 (0) - 277
SOCIAL CONTRIBUTIONS &
DIFERRED/INCOME TAX(95) (1) (0) (0) (0) - - (96)
NET INCOME 181 3 (2) (0) 1 (0) (1) 181
REPORTED
CONSOLIDATEELIMINATION TOTAL
41
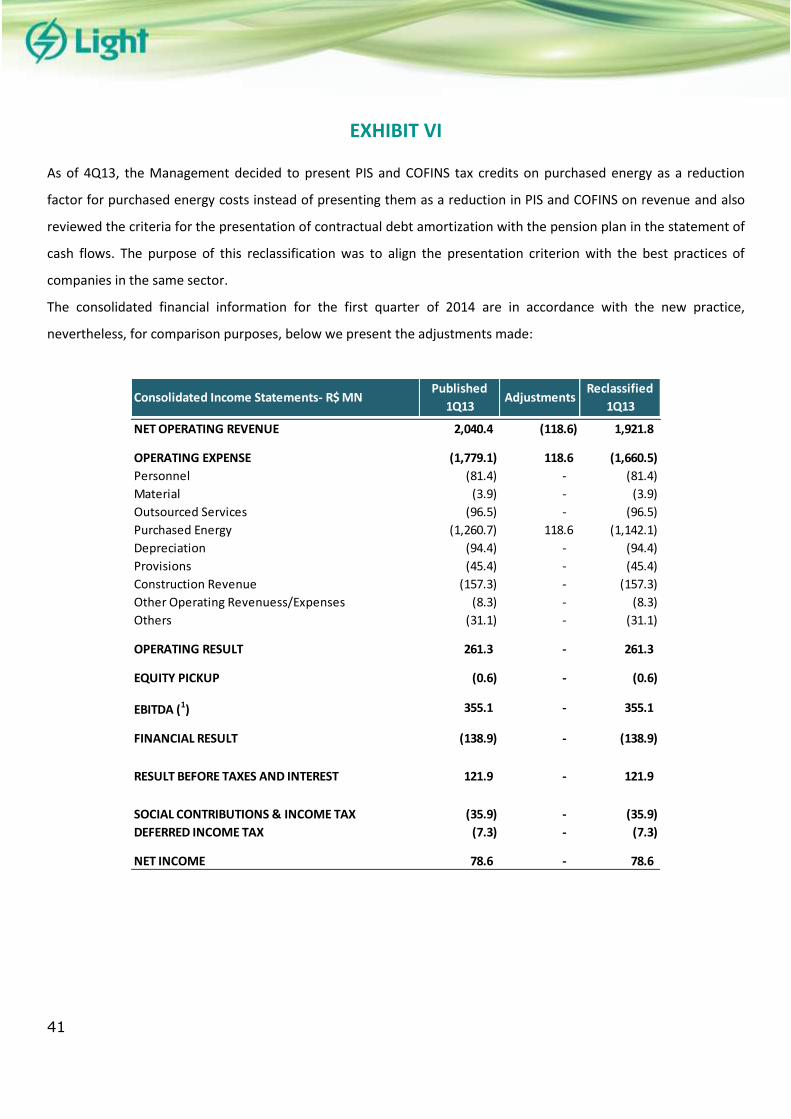
EXHIBIT VI
As of 4Q13, the Management decided to present PIS and COFINS tax credits on purchased energy as a reduction
factor for purchased energy costs instead of presenting them as a reduction in PIS and COFINS on revenue and also
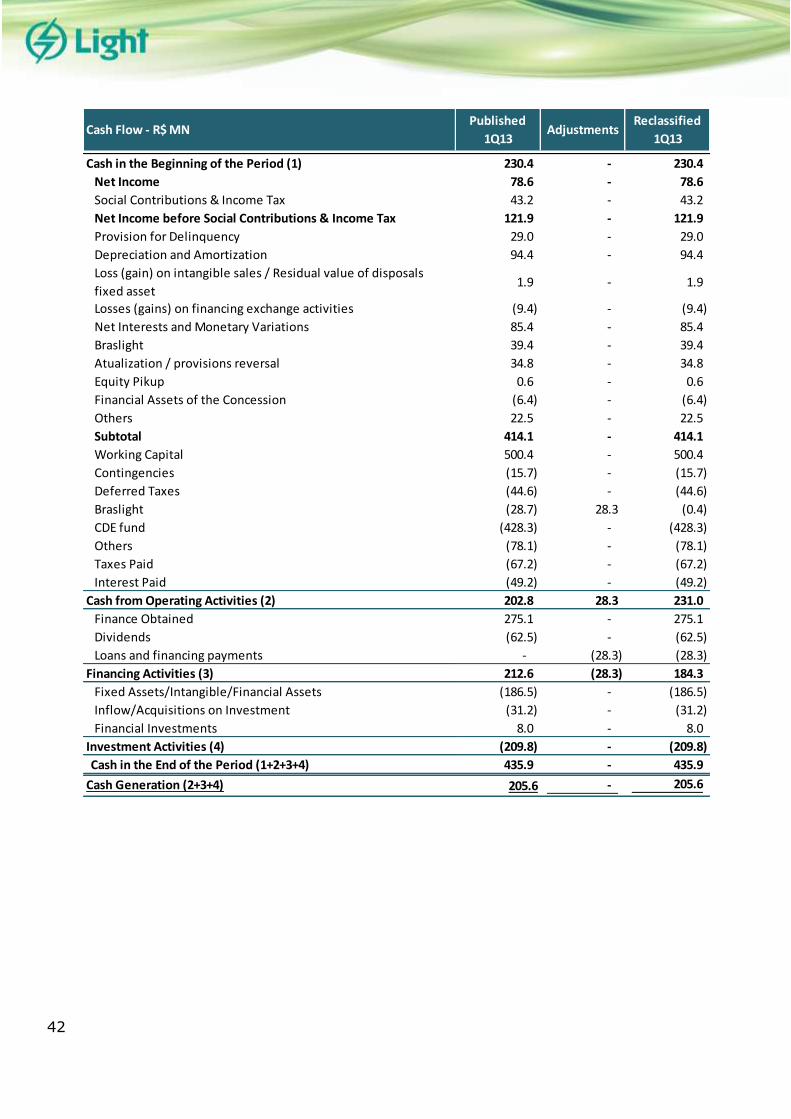
reviewed the criteria for the presentation of contractual debt amortization with the pension plan in the statement of
cash flows. The purpose of this reclassification was to align the presentation criterion with the best practices of
companies in the same sector.
The consolidated financial information for the first quarter of 2014 are in accordance with the new practice,
nevertheless, for comparison purposes, below we present the adjustments made:
Consolidated Income Statements- R$ MNPublished
1Q13Adjustments
Reclassified
1Q13
NET OPERATING REVENUE 2,040.4 (118.6) 1,921.8
OPERATING EXPENSE (1,779.1) 118.6 (1,660.5)
Personnel (81.4) - (81.4)
Material (3.9) - (3.9)
Outsourced Services (96.5) - (96.5)
Purchased Energy (1,260.7) 118.6 (1,142.1)
Depreciation (94.4) - (94.4)
Provisions (45.4) - (45.4)
Construction Revenue (157.3) - (157.3)
Other Operating Revenuess/Expenses (8.3) - (8.3)
Others (31.1) - (31.1)
OPERATING RESULT 261.3 - 261.3
EQUITY PICKUP (0.6) - (0.6)
EBITDA (1) 355.1 - 355.1
FINANCIAL RESULT (138.9) - (138.9)
RESULT BEFORE TAXES AND INTEREST 121.9 - 121.9
SOCIAL CONTRIBUTIONS & INCOME TAX (35.9) - (35.9)
DEFERRED INCOME TAX (7.3) - (7.3)
NET INCOME 78.6 - 78.6
42
Cash Flow - R$ MNPublished
1Q13Adjustments
Reclassified
1Q13
Cash in the Beginning of the Period (1) 230.4 - 230.4
Net Income 78.6 - 78.6
Social Contributions & Income Tax 43.2 - 43.2
Net Income before Social Contributions & Income Tax 121.9 - 121.9
Provision for Delinquency 29.0 - 29.0
Depreciation and Amortization 94.4 - 94.4
Loss (gain) on intangible sales / Residual value of disposals
fixed asset1.9 - 1.9
Losses (gains) on financing exchange activities (9.4) - (9.4)
Net Interests and Monetary Variations 85.4 - 85.4
Braslight 39.4 - 39.4
Atualization / provisions reversal 34.8 - 34.8
Equity Pikup 0.6 - 0.6
Financial Assets of the Concession (6.4) - (6.4)
Others 22.5 - 22.5
Subtotal 414.1 - 414.1
Working Capital 500.4 - 500.4
Contingencies (15.7) - (15.7)
Deferred Taxes (44.6) - (44.6)
Braslight (28.7) 28.3 (0.4)
CDE fund (428.3) - (428.3)
Others (78.1) - (78.1)
Taxes Paid (67.2) - (67.2)
Interest Paid (49.2) - (49.2)
Cash from Operating Activities (2) 202.8 28.3 231.0
Finance Obtained 275.1 - 275.1
Dividends (62.5) - (62.5)
Loans and financing payments - (28.3) (28.3)
Financing Activities (3) 212.6 (28.3) 184.3
Fixed Assets/Intangible/Financial Assets (186.5) - (186.5)
Inflow/Acquisitions on Investment (31.2) - (31.2)
Financial Investments 8.0 - 8.0
Investment Activities (4) (209.8) - (209.8)
Cash in the End of the Period (1+2+3+4) 435.9 - 435.9
Cash Generation (2+3+4) 205.6 - 205.6
Related Documents