First Quarter 2016 Earnings Conference Call April 26, 2016

Welcome message from author
This document is posted to help you gain knowledge. Please leave a comment to let me know what you think about it! Share it to your friends and learn new things together.
Transcript

First Quarter 2016 Earnings
Conference Call
April 26, 2016

Proprietary and Confidential 2
Safe Harbor and Non-GAAP Financial Measures
Certain statements and information included in this presentation are "forward-looking statements" under the Federal Private Securities Litigation
Reform Act of 1995, including our expectations regarding market conditions, earnings performance, revenue in our business segments, fleet size,
growth in our contractual product lines, demand and pricing trends in commercial rental and used vehicle sales, free cash flow, capital expenditures,
debt and the anticipated resumption of our share repurchase program. Accordingly, these forward-looking statements should be evaluated with
consideration given to the many risks and uncertainties inherent in our business that could cause actual results and events to differ materially from
those in the forward-looking statements. Important factors that could cause such differences include, among others, lower than expected lease sales,
further decreases in commercial rental demand or poor acceptance of rental pricing, our ability to right-size our commercial rental fleet in line with
demand, availability of labor to maintain our fleet at normalized levels, worsening of market demand for used vehicles impacting current pricing,
residual values and our anticipated proportion of retail versus wholesale sales, lack of customer demand for on-demand maintenance, higher than
expected maintenance costs from new engine technology or due to lower than expected benefits from maintenance initiatives, decreases in freight
demand or volumes, poor operational execution particularly with start-ups and new product launches, our ability to obtain adequate profit margins for
our services, our inability to maintain current pricing levels due to soft economic conditions, slower than expected global economic recovery,
business interruptions or expenditures due to severe weather or natural occurrences, competition from other service providers and new entrants,
customer retention levels, loss of key customers, driver and technician shortages resulting in higher procurement costs and turnover rates,
unexpected bad debt reserves or write-offs, changes in customers’ business environments that will limit their ability to commit to long-term vehicle
leases, a decrease in credit ratings, increased debt costs, adequacy of accounting estimates, reserves and accruals particularly with respect to
pension, taxes, depreciation, insurance and revenue, sudden or unusual changes in fuel prices, unanticipated currency exchange rate fluctuations,
our ability to manage our cost structure, and the risks described in our filings with the Securities and Exchange Commission. The risks included here
are not exhaustive. New risks emerge from time to time and it is not possible for management to predict all such risk factors or to assess the impact
of such risks on our business. Accordingly, we undertake no obligation to publicly update or revise any forward-looking statements, whether as a
result of new information, future events, or otherwise.
This presentation includes certain non-GAAP financial measures as defined under SEC rules, including operating revenue, operating revenue growth
excluding foreign exchange, comparable earnings and earnings per share, comparable earnings per share forecast, comparable earnings before
income tax, comparable tax rate, adjusted return on capital (and return on capital spread), total cash generated, free cash flow and the ratios based
on these financial measures. Refer to Appendix – Non-GAAP Financial Measures for more information about the non-GAAP financial measures
contained in this presentation. Additional information as required by Regulation G regarding non-GAAP financial measures can be found in our most
recent Form 10-K, Form 10-Q and our Form 8-K filed as of the date of this presentation with the SEC, which are available at
http://investors.ryder.com.

Proprietary and Confidential
Contents
3
► First Quarter 2016 Results Overview
► Asset Management Update
► Earnings Forecast
► Q & A

Proprietary and Confidential
1st Quarter Results Overview
4
► Comparable earnings per share from continuing operations were $1.12
vs. $1.08 in 1Q15
► Earnings per diluted share from continuing operations were $1.05 in 1Q16
vs. $1.00 in 1Q15
– Included non-operating pension costs of $0.07 in 1Q16 and $0.06 in 1Q15
– 1Q15 included $0.02 of professional fees
► Operating revenue increased 8% (up 9% excluding foreign exchange) and
total revenue increased 4% vs. prior year
– Total revenue was impacted by lower fuel costs passed through to customers

Proprietary and Confidential
Key Financial Statistics
5
First Quarter ($ Millions, Except Per Share Amounts)
Note: Amounts throughout presentation may not be additive due to rounding.
2016 2015 % B/(W)
Operating Revenue 1,406.0$ 1,300.3$ 8%
Fuel and Subcontracted Transportation 223.7 266.9 (16)%
Total Revenue 1,629.7$ 1,567.2$ 4%
Comparable Earnings Per Share from Continuing Operations 1.12$ 1.08$ 4%
Earnings Per Share from Continuing Operations 1.05$ 1.00$ 5%
Memo:
Average Shares (Millions) - Diluted 53.4 53.1
Comparable Tax Rate from Continuing Operations 37.1% 37.0%
Tax Rate from Continuing Operations 36.7% 36.7%
Adjusted Return on Capital vs. Cost of Capital (Trailing 12 months) 1.3% 1.2%

Proprietary and Confidential
1st Quarter Results Overview – FMS
6
► Fleet Management Solutions (FMS) operating revenue up 7% (up 8% excluding foreign exchange) and total revenue up 1%
– Full service lease revenue up 8%
– Contract maintenance revenue up 9%
– Commercial rental revenue was unchanged
– Contract-related maintenance revenue up 21%
– Total revenue increased due to higher operating revenue, partially offset by lower fuel costs passed through to customers
► FMS earnings declined due to lower used vehicle results, increased insurance costs and lower fuel benefit, partially offset by higher full service lease results
– Lease results benefited from fleet growth and vehicle residual value benefits
► FMS earnings before tax (EBT) down 8%
– FMS EBT percent of operating revenue down 140 basis points to 8.6%

Proprietary and Confidential
1st Quarter Results Overview – DTS
7
► Dedicated Transportation Solutions (DTS) operating and total revenue up 15% vs. prior year due to new business and higher volumes and pricing
► DTS earnings increased due to higher operating revenue and lower insurance costs
► DTS earnings before tax (EBT) up 59%
– DTS EBT percent of operating revenue up 210 basis points to 7.5%

Proprietary and Confidential
1st Quarter Results Overview – SCS
8
► Supply Chain Solutions (SCS) operating revenue up 9% (up 11% excluding foreign exchange) and total revenue up 5% vs. prior year
– Operating revenue increased due to new business, increased volumes and higher pricing
– Total revenue increased as higher operating revenue was more than offset by lower subcontracted transportation costs and lower fuel costs passed through to customers
► SCS earnings increased primarily due to higher operating revenue
► SCS earnings before tax (EBT) up 26%
– SCS EBT percent of operating revenue up 80 basis points to 6.1%

Proprietary and Confidential
Business Segments
9
2016 2015 % B/(W) 2016 2015 % B/(W)
Operating Revenue:
Fleet Management Solutions 962.3$ 899.2$ 7% 1,097.9$ 1,087.2$ 1%
Dedicated Transportation Solutions 190.3 165.8 15% 244.8 212.7 15%
Supply Chain Solutions 322.4 295.4 9% 388.7 371.1 5%
Eliminations (69.0) (60.2) (15)% (101.8) (103.7) 2%
Total 1,406.0$ 1,300.3$ 8% 1,629.7$ 1,567.2$ 4%
Segment Earnings Before Tax: (1)
Fleet Management Solutions 82.9$ 89.7$ (8)%
Dedicated Transportation Solutions 14.3 9.0 59%
Supply Chain Solutions 19.8 15.7 26%
Eliminations (11.7) (11.5) (2)%
105.2 102.8 2%
Central Support Services (Unallocated Share) (9.7) (11.9) 19%
Non-operating Pension Costs (6.9) (4.9) (41)%
Restructuring and Other Charges, Net and Other Items - (1.8) NM
Earnings Before Income Taxes 88.7 84.2 5%
Provision for Income Taxes (32.5) (30.9) (5)%
Earnings from Continuing Operations 56.2$ 53.3$ 5%
Comparable Earnings from Continuing Operations 60.1$ 57.3$ 5%
Memo: Total Revenue
(1) Our primary measure of segment financial performance excludes unallocated CSS, non-operating pension costs, restructuring and other charges, net and other items.
($ Millions)
First Quarter
Proprietary and Confidential
Capital Expenditures
10
2016 $
2016 2015 O/(U) 2015
Full Service Lease 441$ 436$ 5$
Commercial Rental 33 190 (157)
Operating Property and Equipment 23 27 (4)
Gross Capital Expenditures 498 653 (155)
Less: Proceeds from Sales (Primarily Revenue Earning Equipment) 121 97 24
Net Capital Expenditures 377$ 556$ (179)$
First Quarter ($ Millions)

Proprietary and Confidential
Cash Flow from Continuing Operations
11
First Quarter ($ Millions)
(1) Reflects revised reporting of vehicle gains on sale, net of vehicle valuation adjustments. Quarterly history may be found in the Appendix (page 19).
(2) Capital expenditures presented net of changes in accounts payable related to purchases of revenue earning equipment.
(3) Free Cash Flow excludes acquisitions and changes in restricted cash.
2016 2015
Earnings from Continuing Operations 56$ 53$
Depreciation 287 266
Gains on Used Vehicles, Net (1)
(19) (27)
Amortization and Other Non-Cash Charges, Net 18 19
Pension Contributions (20) (4)
Changes in Working Capital and Deferred Taxes 43 (23)
Cash Provided by Operating Activities 365 284
Proceeds from Sales (Primarily Revenue Earning Equipment) 121 97
Collections of Direct Finance Leases & Other 26 16
Total Cash Generated 511 397
Capital Expenditures (2)
(575) (553)
Free Cash Flow (3)
(64)$ (156)$

Proprietary and Confidential
227%260%
277% 274%250%
0%
50%
100%
150%
200%
250%
300%
12/31/13 12/31/14 12/31/15 3/31/16 Target Midpoint
Pension Impact
Debt to Equity
Debt to Equity Ratio
12
(1)
(2)
(1) Illustrates impact of accumulated net pension related equity charge on leverage.
(2) Represents debt to equity target of 225 - 275% while maintaining a solid investment grade rating.
(3) Total Equity includes impact of accumulated net pension related equity charge of $572 million as of 3/31/2016, $577 million as of 12/31/2015 and $580 million as of 3/31/2015.
($ Millions)
3/31/2016 12/31/2015 3/31/2015
Total Debt 5,599$ 5,503$ 4,901$
Total Equity (3)
2,045$ 1,987$ 1,811$
Debt to Equity 274% 277% 271%

Proprietary and Confidential
Contents
13
► First Quarter 2016 Results Overview
► Asset Management Update
► Earnings Forecast
► Q & A

Proprietary and Confidential
► Units held for sale were 8,600 at quarter end, up from 5,800 units held for sale in the prior year
─ Units held for sale increased by 600 units sequentially
► The number of used vehicles sold in the first quarter was 4,700, up 9% from the prior year
─ Units sold were up 4% sequentially
► Proceeds per unit were down 8% for tractors and up 6% for trucks in the first quarter compared with prior year (excluding the impact of exchange rates)
─ Proceeds per unit were unchanged for tractors and up 8% for trucks, sequentially
─ Proceeds per unit were down 12% for tractors and were up 2% for trucks, compared to the second quarter 2015 peak
► Average first quarter total commercial rental fleet was up 2% from the prior year
─ Average commercial rental fleet was down 5% sequentially
Global Asset Management Update
14

Proprietary and Confidential
Contents
15
► First Quarter 2016 Results Overview
► Asset Management Update
► Earnings Forecast
► Q & A

Proprietary and Confidential
EPS Forecast – Continuing Operations
16
2016 Comparable EPS Forecast(1)
$ 1.50 - 1.55 $ 6.10 - 6.30
2015 Comparable EPS(2)
$ 1.65 $ 6.13
Second Quarter Full Year
($ Earnings Per Share)
(1) Comparable EPS Forecast, a non-GAAP financial measure, excludes $0.08 of non-operating pension costs for the second quarter of 2016. Comparable EPS Forecast
excludes $0.31 of non-operating pension costs for the full year 2016 period.
(2) Comparable EPS for the second quarter of 2015 excluded $0.05 of non-operating pension costs and $0.02 of professional fees, which were partially offset by tax law
change benefits of $0.03. Comparable EPS for the full year 2016 excludes $0.21 of non-operating pension costs, $0.19 of restructuring costs, $0.04 of consulting fees,
$0.04 of tax law change benefits and $0.01 of pension settlement benefits.
► Maintaining full year Comparable EPS forecast at $6.10 - $6.30
► Current forecast is as follows:
Proprietary and Confidential
Q&A
17

Proprietary and Confidential
Appendix
18
Gains on Used Vehicles, Net – Quarterly History
Full Service Lease Vehicle Count
Business Segment Detail
Central Support Services
Balance Sheet
Adjusted Return on Capital History
Financial Indicators Forecast
Asset Management
Non-GAAP Financial Measures & Reconciliations

Proprietary and Confidential
1Q15 2Q15 3Q15 4Q15 FY15 1Q14 2Q14 3Q14 4Q14 FY14
Gains on vehicle sales (1) 29,579$ 33,237 29,294 25,699 117,809 28,818$ 34,365 33,691 29,950 126,824
Less: Valuation adjustments (2,371) (3,252) (4,329) (8,004) (17,956) (3,675) (2,515) (2,377) (2,197) (10,764)
Gains on used vehicles, net 27,208$ 29,985$ 24,965$ 17,695$ 99,853$ 25,143$ 31,850$ 31,314$ 27,753$ 116,060$
Gains on Used Vehicles, Net
19
(1) As previously reported
1Q13 2Q13 3Q13 4Q13 FY13 1Q12 2Q12 3Q12 4Q12 FY12
Gains on vehicle sales (1)
23,006$ 23,197 22,488 27,484 96,175 21,991$ 22,546 23,147 21,424 89,108
Less: Valuation adjustments (4,721) (4,230) (3,994) (3,483) (16,428) (3,359) (4,455) (5,161) (5,425) (18,400)
Gains on used vehicles, net 18,285$ 18,967$ 18,494$ 24,001$ 79,747$ 18,632$ 18,091$ 17,986$ 15,999$ 70,708$
1Q11 2Q11 3Q11 4Q11 FY11
Gains on vehicle sales (1) 12,349$ 15,658 18,270 16,602 62,879
Less: Valuation adjustments (3,039) (1,963) (2,005) (1,884) (8,891)
Gains on used vehicles, net 9,310$ 13,695$ 16,265$ 14,718$ 53,988$
Beginning in 2016, gains on used vehicles are reported net of valuation adjustments taken for vehicles held
for sale. Previously, valuation adjustments for vehicles held for sale were reflected in depreciation expense.

Proprietary and Confidential
End of Period 1Q15 2Q15 3Q15 4Q15 1Q16
FSL Fleet (as reported) 127,500 128,700 130,600 131,800 133,300 5,800
UK FSL Trailers 4,400 4,300 4,300 3,900 3,700 (700)
FSL Fleet - excluding UK 123,100 124,400 126,300 127,900 129,600 6,500
Sequential Change
2Q15 O/(U)
1Q15
3Q15 O/(U)
2Q15
4Q15 O/(U)
3Q15
1Q16 O/(U)
4Q15
FSL Fleet (as reported) 1,200 1,900 1,200 1,500
UK FSL Trailers (100) - (400) (200)
FSL Fleet - excluding UK 1,300 1,900 1,600 1,700
1Q16 O/(U)
1Q15
Full Service Lease (FSL) Fleet Count
20
Note: Represents end of period vehicle count.

Proprietary and Confidential
Fleet Management Solutions (FMS)
21
Revenue 2016 2015 % B/(W)
Full Service Lease 622.9$ 577.1$ 8%
Contract Maintenance 50.1 46.0 9%
Contractual Revenue 673.0 623.1 8%
Commercial Rental 204.8 205.1 -
Contract-related Maintenance 64.3 53.1 21%
Other 20.2 17.9 13%
Operating Revenue 962.3 899.2 7%
Fuel Services Revenue 135.6 188.0 (28)%
Total Revenue 1,097.9$ 1,087.2$ 1%
Earnings Before Tax
Segment Earnings Before Tax (EBT) 82.9$ 89.7$ (8)%
Segment EBT as % of Total Revenue 7.6% 8.3%
Segment EBT as % of Operating Revenue 8.6% 10.0%
First Quarter ($ Millions)
Proprietary and Confidential
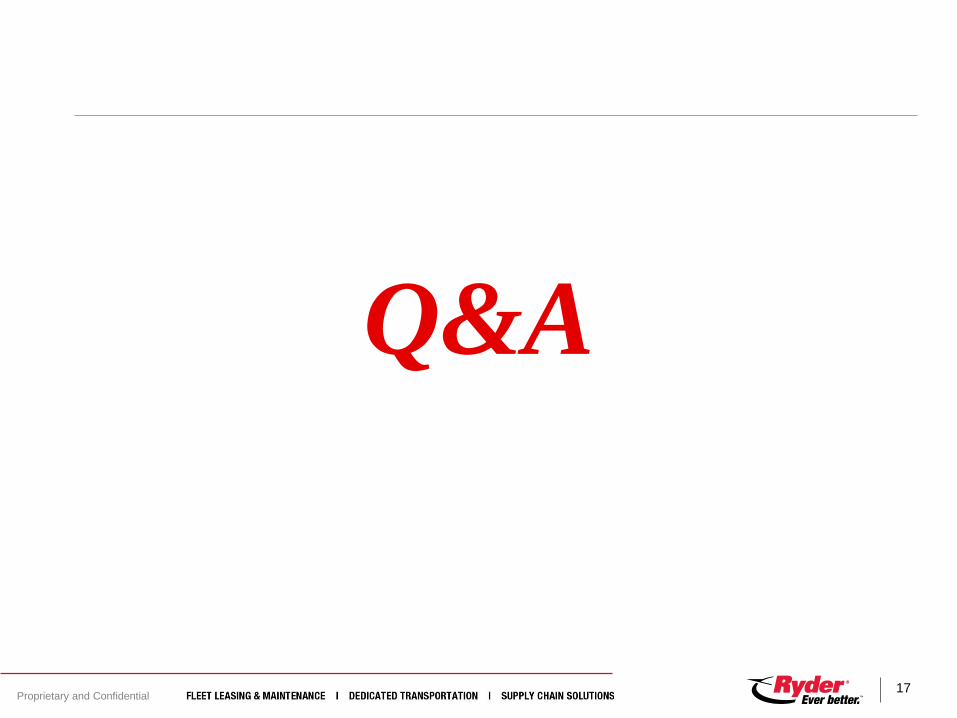
Dedicated Transportation Solutions (DTS)
22
($ Millions)
Revenue 2016 2015 % B/(W)
Operating Revenue 190.3$ 165.8$ 15%
Subcontracted Transportation 31.2 14.6 114%
Fuel 23.3 32.2 (28)%
Total Revenue 244.8$ 212.7$ 15%
Earnings Before Tax
Segment Earnings Before Tax (EBT) 14.3$ 9.0$ 59%
Segment EBT as % of Total Revenue 5.8% 4.2%
Segment EBT as % of Operating Revenue 7.5% 5.4%
First Quarter

Proprietary and Confidential
Supply Chain Solutions (SCS)
23
($ Millions)
Revenue 2016 2015 % B/(W)
Automotive 129.1$ 109.2$ 18%
Technology & Healthcare 57.4 59.3 (3)%
CPG & Retail 108.6 102.7 6%
Industrial & Other 27.3 24.3 12%
Operating Revenue 322.4 295.4 9%
Subcontracted Transportation 52.0 58.2 (11)%
Fuel 14.3 17.5 (18)%
Total Revenue 388.7$ 371.1$ 5%
Earnings Before Tax
Segment Earnings Before Tax (EBT) 19.8$ 15.7$ 26%
Segment EBT as % of Total Revenue 5.1% 4.2%
Segment EBT as % of Operating Revenue 6.1% 5.3%
First Quarter

Proprietary and Confidential
Central Support Services (CSS)
24
First Quarter ($ Millions)
2016 2015 % B/(W)
Allocated CSS Costs 48.7$ 50.3$ 3%
Unallocated CSS Costs 9.7 11.9 19%
Total CSS Costs 58.4$ 62.2$ 6%

Proprietary and Confidential
Balance Sheet
25
March 31, December 31,
2016 2015
Current Assets 1,095$ 1,098$
Revenue Earning Equipment, Net 8,275 8,185
Operating Property and Equipment, Net 717 715
Other Assets 967 955
Total Assets 11,055$ 10,953$
Current Liabilities 981$ 1,046$
Total Debt 5,599 5,503
Other Non-Current Liabilities (including Deferred Income Taxes) 2,429 2,417
Shareholders' Equity 2,045 1,987
Total Liabilities and Shareholders' Equity 11,055$ 10,953$
($ Millions)

Proprietary and Confidential
Adjusted Return on Capital History
Adjusted
Return on
Capital
(ROC)
6.7% 6.6% 6.5%
6.3% 6.1%
5.5%4.8% 4.8% 4.7% 4.4% 4.4%
7.9%7.4% 7.3%
4.1%4.8%
5.7% 5.7% 5.8% 5.8% 5.8% 5.5%
2006 2007 2008 2009 2010 2011 2012 2013 2014 2015 2016Forecast
Cost of
Capital
(COC)
Return on
Equity 15.5% 14.2% 11.2% 4.4% 8.4% 11.9% 14.9% 14.9% 11.3% 16.1% 15.3%
Adjusted
Total
Capital (2)
$4.2 $4.8 $4.8 $4.2 $4.0 $4.6 $5.2 $5.6 $6.6 $7.1 $7.7
ROC O/(U)
COC 1.2% 0.8% 0.8% (2.2)% (1.3)% 0.2% 0.9% 1.0% 1.1% 1.4% 1.1%
(1)
2016
Forecast
(1) Includes pension settlement charges of $69M, primarily buyouts, which impacted Return on Equity by 360 basis points.
(2) Adjusted Total Capital represents Adjusted Average Total Capital in billions.
26

Proprietary and Confidential
Financial Indicators Forecast (1)
27
161% 139% 140% 135% 118% 143% 164% 147% 213% 175% 196% 257% 272% 227% 260%
2008 2009 2010 2011 2012 2013 2014 2015 2016 Forecast
Midpoint
Long Term
Target Midpoint
Gross Capital Expenditures ($ Millions)
Free Cash Flow (2)
2008
$1,265
2010 2009
$611
341 614
$1,088
(488)
2016
Forecast
258
$1,760 Full Service Lease
PP&E/Other
Commercial Rental
$2,161
2011
(257)
2012
Total Obligations to Equity
Pension Impact (3)
2008 2009 2010
225%
183% 203%
272%
Target
Midpoint (4) 2011
261%
2012 2015
Total Obligations to Equity / Debt to Equity (2)
227%
$2,184
213% 175% 196% 257% 272% 227% 260% 277% 245%
(340)
$2,298
2013
(728)
2013
250%
Debt to Equity
$2,030
2015
(315)
2014
260%
2014
100
$2,696
277%
2016
Forecast
245%
(1) Total Obligations to Equity includes acquisitions. Free Cash Flow and Gross Capital Expenditures exclude acquisitions. (2) The debt to equity metric was not revised in years prior to 2012 to reflect the change in accounting treatment of certain sale-leaseback
transactions as debt. (3) Illustrates impact of accumulated net pension related equity charge on leverage. (4) Represents debt to equity target of 225-275% while maintaining solid investment grade credit rating.

Proprietary and Confidential
Asset Management Update (US Only)
(a) Current year statistics may exclude some units due to a lag in reporting
(b) Excludes early terminations where customer purchases vehicle
(a)(b)
Redeployments – Vehicles coming off-lease or in Rental with
useful life remaining are redeployed in the Ryder fleet (SCS, or
with another Lease customer). Redeployments exclude units
transferred into the Rental product line.
Extensions – Ryder re-prices lease contract and extends
maturity date.
Early terminations – Customer elects to terminate lease prior to
maturity. Depending on the remaining useful life, the vehicle may
be redeployed in the Ryder fleet (Commercial Rental, SCS, other
Lease customer) or sold by Ryder.
28

Proprietary and Confidential
Non-GAAP Financial Measures
29
► This presentation includes “non-GAAP financial measures” as defined by SEC rules. As required by SEC
rules, we provide a reconciliation of each non-GAAP financial measure to the most comparable GAAP
measure. Non-GAAP financial measures should be considered in addition to, but not as a substitute for or
superior to, other measures of financial performance prepared in accordance with GAAP.
► Specifically, the following non-GAAP financial measures are included in this presentation:
Non-GAAP Financial Measure Comparable GAAP Measure
Reconciliation & Additional Information
Presented on Slide Titled Page
Operating Revenue Growth ex-Foreign Exchange
Operating Revenue
Total Revenue
Total Revenue
Foreign Exchange Impact on Operating
Revenue Growth
Key Financial Statistics
30
5
Comparable Earnings / Comparable EPS Earnings / EPS from Continuing Operations Earnings and EPS from Continuing Operations
Reconciliation
31
Comparable Earnings Before Income Tax /
Comparable Tax Rate
Earnings Before Income Tax / Tax Rate Earnings and Tax Rate from Continuing
Operations Reconciliation
32
Comparable EPS Forecast EPS Forecast EPS Forecast – Continuing Operations 16
Adjusted Return on Capital Net Earnings / Total Capital Adjusted Return on Capital Reconciliation 33-34
Total Cash Generated / Free Cash Flow Cash Provided by Operating Activities Cash Flow from Continuing Operations 35-36
Total Obligations / Total Obligations to Equity Balance Sheet Debt / Debt to Equity Debt to Equity Reconciliation 37
FMS Operating Revenue / DTS Operating Revenue /
SCS Operating Revenue
FMS Total Revenue / DTS Total Revenue / SCS
Total Revenue
Fleet Management Solutions (FMS) / Dedicated
Transportation Solutions (DTS) / Supply Chain
Solutions (SCS)
21-23

Proprietary and Confidential 30
Foreign Exchange Impact on Operating Revenue Growth
First Quarter
YOY
Growth Fx Impact (1)
YOY
Growth
excl Fx
Operating Revenue 8% (1)% 9%
FMS Operating Revenue 7% (1)% 8%
Full Service Lease Revenue 8% (1)% 9%
Commercial Rental Revenue - (1)% 1%
SCS Operating Revenue 9% (2)% 11%
(1) Foreign exchange impact was calculated by dividing the results for the current and prior year periods by the exchange rates in effect on March 31, 2015, which was
the last day of the prior year period, rather than the actual exchange rates in effect as of March 31, 2016.

Proprietary and Confidential
Earnings and EPS from Continuing Operations Reconciliation
31
($ Millions or $ Earnings Per Share)
1Q16 1Q16 1Q15 1Q15
Earnings EPS Earnings EPS
Reported $ 56.2 $ 1.05 $ 53.3 $ 1.00
Non-operating pension costs 4.0 0.07 2.8 0.06
Professional fees - - 1.2 0.02
Comparable $ 60.1 $ 1.12 $ 57.3 $ 1.08

Proprietary and Confidential
1Q16 - 1Q16 - 1Q16 -
EBT Tax Tax Rate
Reported 88.7$ 32.5$ 36.7%
Non-operating pension costs 6.9 2.9
Comparable 95.6$ 35.4$ 37.1%
1Q15 - 1Q15 - 1Q15 -
EBT Tax Tax Rate
Reported 84.2$ 30.9$ 36.7%
Non-operating pension costs 4.9 2.1
Professional fees 1.8 0.7
Comparable 90.9$ 33.6$ 37.0%
EBT and Tax Rate from Continuing Operations Reconciliation
32
($ Millions or $ Earnings Per Share)

Proprietary and Confidential 33
Adjusted Return on Capital Reconciliation
($ Millions)
(1) Earnings calculated based on a 12-month rolling period.
(2) Interest expense includes interest on off-balance sheet vehicle obligations.
(3) Income taxes were calculated by excluding taxes related to comparable earnings items and interest expense.
(4) The average is calculated based on the average GAAP balances.
(5) Represents comparable earnings items for those periods.
2006 2007 2008 2009 2010 2011
Net earnings (1) $ 249 $ 254 $ 200 $ 62 $ 118 $ 170
Restructuring and other charges, net
and other items - 1 70 30 6 6
Income taxes 144 152 150 54 61 108
Adjusted earnings before income
taxes 393 407 420 146 185 284
Adjusted interest expense (2) 149 169 165 150 133 135
Adjusted income taxes (3) (207) (220) (230) (122) (124) (157)
Adjusted net earnings $ 332 $ 356 $ 355 $ 174 $ 194 $ 262
Average total debt(4) $ 2,480 $ 2,848 $ 2,882 $ 2,692 $ 2,512 $ 3,079
Average off-balance sheet debt(4) 99 150 171 142 114 78
Average total shareholders' equity(4) 1,610 1,791 1,778 1,396 1,402 1,428
Average adjustments to
shareholders' equity (5) (5) 1 10 16 2 4
Adjusted average total capital $ 4,184 $ 4,789 $ 4,841 $ 4,245 $ 4,030 $ 4,588
Adjusted return on capital 7.9% 7.4% 7.3% 4.1% 4.8% 5.7%

Proprietary and Confidential 34
Adjusted Return on Capital Reconciliation
($ Millions)
(1) Earnings calculated based on a 12-month rolling period.
(2) Interest expense includes interest on off-balance sheet vehicle obligations.
(3) Income taxes were calculated by excluding taxes related to comparable earnings items and interest expense.
(4) The average is calculated based on the average GAAP balances.
(5) Represents comparable earnings items for those periods.
2012 2013 2014 2015 1Q15 1Q16
Net earnings (1) $ 210 $ 238 $ 218 $ 305 $ 223 $ 308
Restructuring and other charges,
net and other items 17 - 115 18 117 16
Income taxes 91 126 118 164 123 165
Adjusted earnings before income
taxes 317 363 451 486 463 489
Adjusted interest expense (2) 144 141 145 151 147 152
Adjusted income taxes (3)
(167)
(177)
(214) (224) (218)
(226)
Adjusted net earnings $ 294 $ 327 $ 383 $ 413 $ 392 $ 416
Average total debt(4) $ 3,778 $ 4,015 $ 4,653 $ 5,177 $ 4,753 $ 5,358
Average off-balance sheet debt(4) 2 1 2 1 2 2
Average total shareholders' equity(4) 1,406 1,594 1,926 1,895 1,905 1,945
Average adjustments to
shareholders' equity (5) (3) (2) 8 11 17 3
Adjusted average total capital $ 5,182 $ 5,608 $ 6,589 $ 7,084 $ 6,678 $ 7,308
Adjusted return on capital 5.7% 5.8% 5.8% 5.8% 5.9% 5.7%

Proprietary and Confidential
Appendix: Non-GAAP Financial Measures
35
(1) Capital expenditures presented net of changes in accounts payable related to purchases of revenue earning equipment.
(2) Free Cash Flow excludes acquisitions and changes in restricted cash.
(3) Includes adjustment to reclassify losses from fair value adjustments on our used vehicles to “Gains on Used Vehicles, Net”.
Cash Flow Reconciliation ($ Millions)
12/31/2008 12/31/2009 12/31/2010 12/31/2011 12/31/2012
1,248$ 985$ 1,028$ 1,042$ 1,160$
Proceeds from Sales (Primarily Revenue Earning Equipment) 262 216 235 337 413
Collections of Direct Finance Leases 61 65 62 62 72
Other, net - - 3 - -
Total Cash Generated 1,571 1,266 1,328 1,442 1,645
Cash Provided by Operating Activities from Continuing Operations
Capital Expenditures (1) (1,230) (652) (1,070) (1,699) (2,133)
Free Cash Flow (2) 341$ 614$ 258$ (257)$ (488)$
Memo:
Depreciation Expense (3) 807$ 829$ 808$ 863$ 944$

Proprietary and Confidential
Appendix: Non-GAAP Financial Measures
36
Cash Flow Reconciliation ($ Millions)
12/31/2013 12/31/2014 12/31/2015 3/31/2016 3/31/2015
1,252$ 1,383$ 1,383$ 365$ 284$
Proceeds from Sales (Primarily Revenue Earning Equipment) 452 497 497 121 97
Collections of Direct Finance Leases and Other 71 66 66 26 16
Other, net 8 (1) (1) - -
Total Cash Generated 1,783 1,944 1,944 511 397
Cash Provided by Operating Activities from Continuing Operations
Capital Expenditures (1) (2,123) (2,259) (2,259) (575) (553)
Free Cash Flow (2) (340)$ (315)$ (315)$ (64)$ (156)$
Memo:
Depreciation Expense (3) 967$ 1,047$ 1,040$ 287$ 266$
(1) Capital expenditures presented net of changes in accounts payable related to purchases of revenue earning equipment.
(2) Free Cash Flow excludes acquisitions and changes in restricted cash.
(3) Includes adjustment to reclassify losses from fair value adjustments on our used vehicles to “Gains on Used Vehicles, Net”.

Proprietary and Confidential
Appendix: Non-GAAP Financial Measures
37
Note: Amounts may not recalculate due to rounding.
Debt to Equity Reconciliation (1) ($ Millions)
(1) The debt to equity metric was not revised in years prior to 2012 to reflect the change in accounting treatment of certain sale-leaseback transactions as debt.
(2) Total obligations, a non-GAAP financial measure, represents balance sheet debt plus off-balance sheet debt representing the present value of minimum lease
payments and guaranteed residual values under operating leases for vehicles, discounted based on our incremental borrowing rate at lease inception. We believe that
total obligations and total obligations to equity are useful as they provide a more complete analysis of our existing financial obligations and help better assess our
overall leverage position for years prior to 2012. For years 2012 - on, sale-leaseback transactions that were previously accounted for off-balance sheet are now
included in our GAAP balance sheet debt, and we do not reconcile total obligations to equity for these years as this metric is the same as the debt to equity metric.
% to % to % to % to
12/31/08 Equity 12/31/09 Equity 12/31/10 Equity 12/31/11 Equity
Debt $2,863 213% $2,498 175% $2,747 196% $3,382 257%
PV of minimum lease
payments and
guaranteed residual
values under operating
leases for vehicles 163 119 100 64
Total Obligations (2)$3,026 225% $2,617 183% $2,847 203% $3,446 261%

Proprietary and Confidential
Related Documents