CATIA BASTIOLI CHAIRWOMAN MATTEO DEL FANTE CHIEF EXECUTIVE OFFICER PIERPAOLO CRISTOFORI CHIEF FINANCIAL OFFICER Cash Flows to drive Shareholder Returns

1Q 2015 Consolidated Results (6 Maggio 2015)
Jul 17, 2015
Welcome message from author
This document is posted to help you gain knowledge. Please leave a comment to let me know what you think about it! Share it to your friends and learn new things together.
Transcript
Investor Relations 1
CATIA BASTIOLI
CHAIRWOMAN
MATTEO DEL FANTE
CHIEF EXECUTIVE OFFICER
PIERPAOLO CRISTOFORI
CHIEF FINANCIAL OFFICER
Cash Flows to drive Shareholder Returns
Investor Relations 2
Agenda
FY2014 Results
2015-2019 Strategic Plan
Introduction: Terna Today
Investor Relations 3
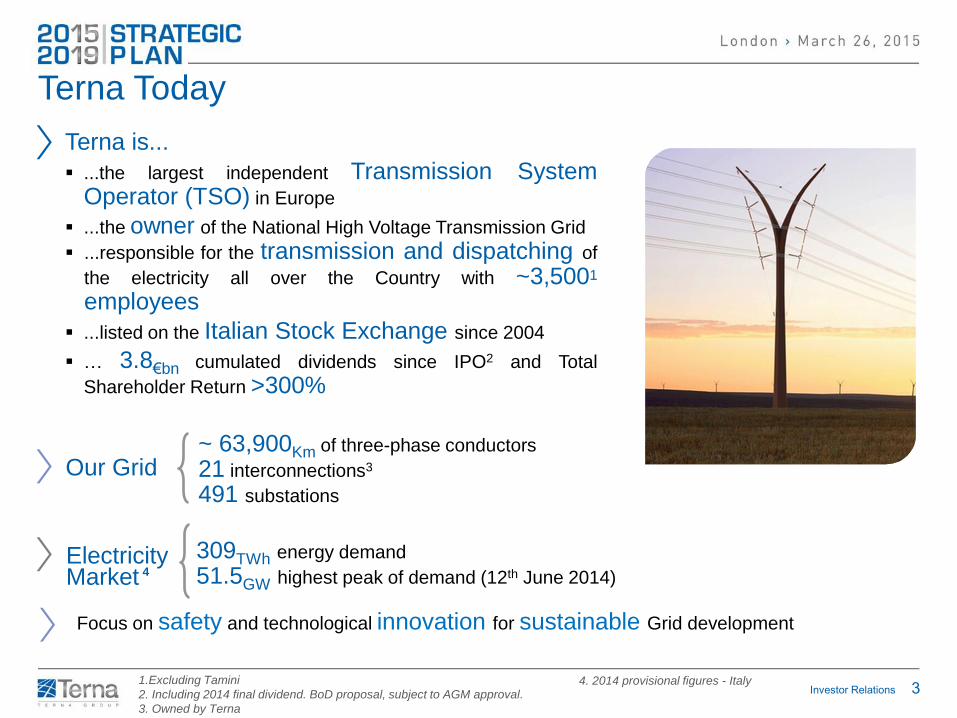
Terna Today
309TWh energy demand
51.5GW highest peak of demand (12th June 2014)
Terna is...
...the largest independent Transmission System Operator (TSO) in Europe
...the owner of the National High Voltage Transmission Grid
...responsible for the transmission and dispatching of
the electricity all over the Country with ~3,5001 employees
...listed on the Italian Stock Exchange since 2004
… 3.8€bn cumulated dividends since IPO2 and Total
Shareholder Return >300%
~ 63,900Km of three-phase conductors
21 interconnections3
491 substations
Our Grid
Electricity Market 4
1.Excluding Tamini
2. Including 2014 final dividend. BoD proposal, subject to AGM approval.
3. Owned by Terna
Focus on safety and technological innovation for sustainable Grid development
4. 2014 provisional figures - Italy
Investor Relations 4
Agenda
FY2014 Results
2015-2019 Strategic Plan
Introduction: Terna Today
Investor Relations 5
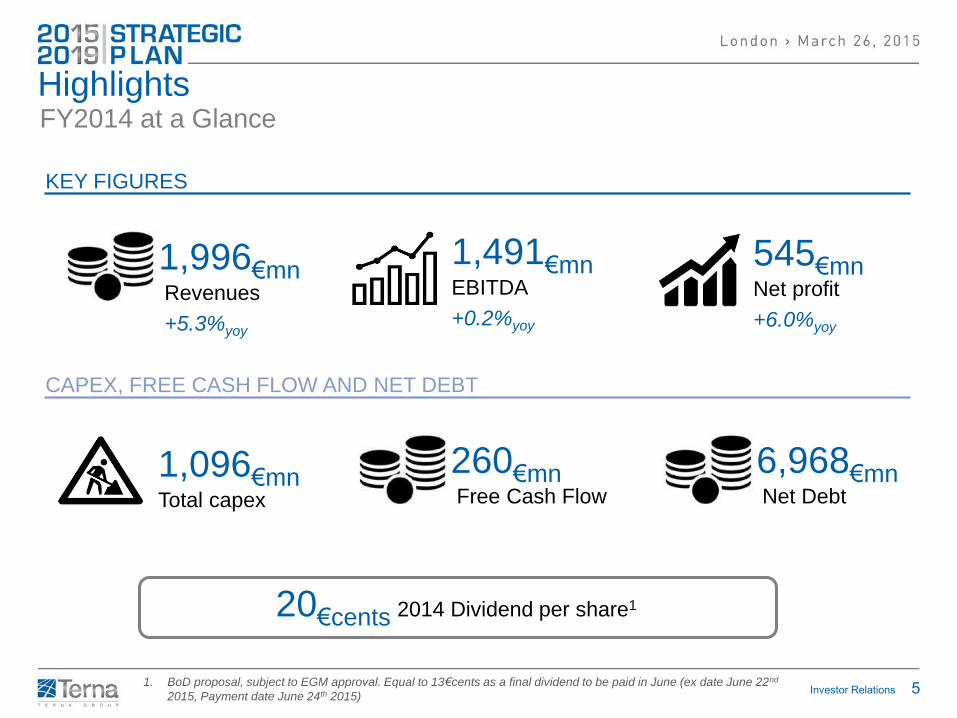
Highlights FY2014 at a Glance
KEY FIGURES
CAPEX, FREE CASH FLOW AND NET DEBT
1,096€mn Total capex
6,968€mn Net Debt
1,996€mn Revenues
+5.3%yoy
545€mn Net profit
+6.0%yoy
1,491€mn EBITDA
+0.2%yoy
260€mn Free Cash Flow
20€cents 2014 Dividend per share1
1. BoD proposal, subject to EGM approval. Equal to 13€cents as a final dividend to be paid in June (ex date June 22nd
2015, Payment date June 24th 2015)

Investor Relations 6
Agenda
FY2014 Results
2015-2019 Strategic Plan
Introduction: Terna Today
Investor Relations 7
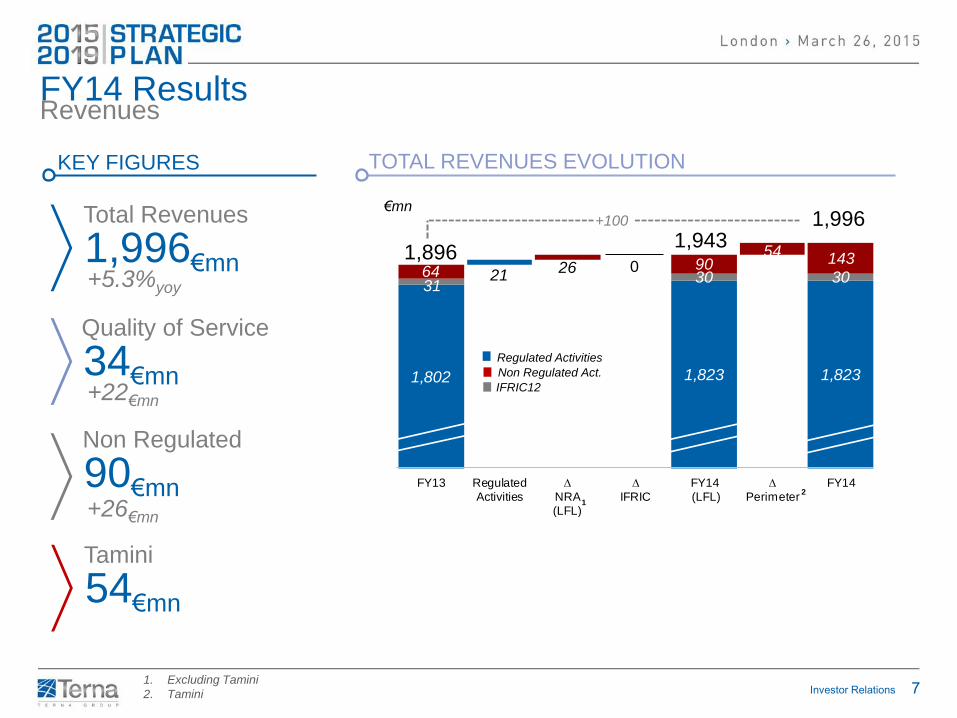
1,802 1,823 1,823
3121
2630
54
3064 90 143
FY13 RegulatedActivities
∆ NRA(LFL)
∆IFRIC
FY14 (LFL)
∆ Perimeter
FY14
Traditional Activities
IFRIC12
Non Traditional Activities
1. Excluding Tamini
2. Tamini
FY14 Results Revenues
1,896
1,996 +100
1,943
KEY FIGURES TOTAL REVENUES EVOLUTION
Total Revenues
1,996€mn
+5.3%yoy Quality of Service
34€mn
+22€mn
€mn
2
1
Regulated Activities
Non Regulated Act.
IFRIC12
0
Non Regulated
90€mn +26€mn
Tamini
54€mn
Investor Relations 8
360400 400
31
39 430
53
3017
2175
FY13 ∆ Regulated Activities
∆ NRA (LFL)
∆ IFRIC 12
FY14(LFL)
∆ Perimeter
FY14
Traditional Activities
IFRIC 12
NTA
FY14 Results Costs
408
505 +97
452
KEY FIGURES TOTAL COSTS EVOLUTION
Total Costs
505€mn +23.7%yoy
€mn
2
1
1. Excluding Tamini
2. Tamini
Regulated Activities
Non Regulated Act.
IFRIC12
0
Provision for Voluntary
Turnover Programme
37€mn
€ mn FY13FY14 Ex
TaminiΔmn Δ% Tamini
Labour Costs 199 247 48 24% 12
External Services & Materials 132 137 5 4% 39
Other 46 38 -9 -19% 1
IFRIC12 31 30 0 -1%
Total Costs 408 452 44 11% 53
FY14
LFL
Investor Relations 9
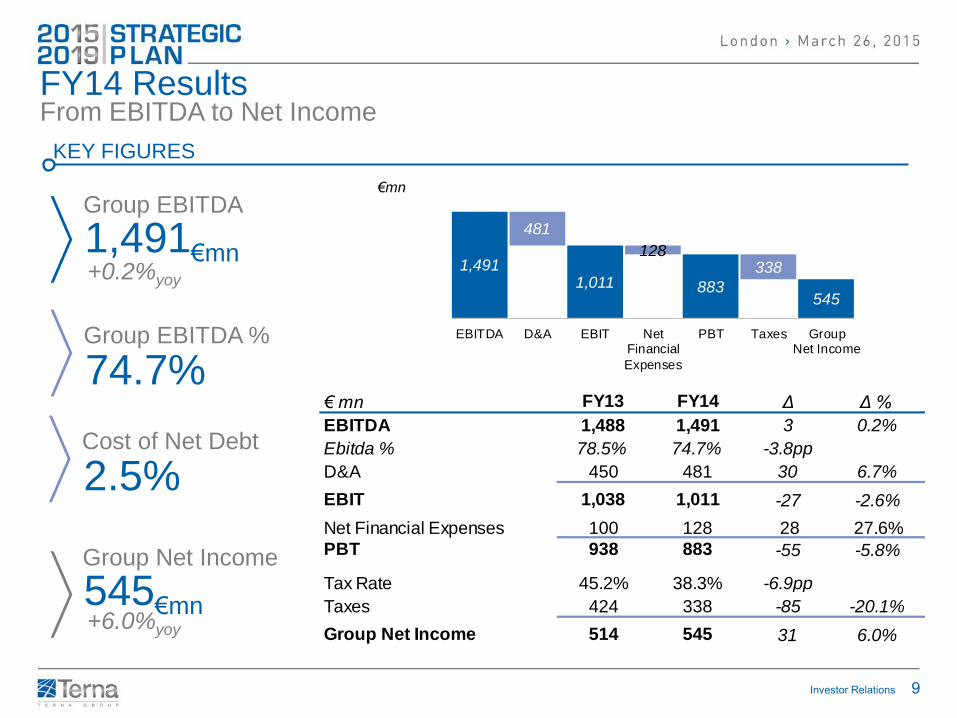
FY14 Results From EBITDA to Net Income
KEY FIGURES
Group EBITDA
1,491€mn
Group EBITDA %
74.7%
Group Net Income
545€mn
+0.2%yoy
+6.0%yoy
€mn
1,4911,011 883
545
481
128338
EBITDA D&A EBIT NetFinancial
Expenses
PBT Taxes GroupNet Income
€ mn FY13 FY14 Δ Δ %
EBITDA 1,488 1,491 3 0.2%
Ebitda % 78.5% 74.7% -3.8pp
D&A 450 481 30 6.7%
EBIT 1,038 1,011 -27 -2.6%
Net Financial Expenses 100 128 28 27.6%
PBT 938 883 -55 -5.8%
Tax Rate 45.2% 38.3% -6.9pp
Taxes 424 338 -85 -20.1%
Group Net Income 514 545 31 6.0%
Cost of Net Debt
2.5%
Investor Relations 10
21%
34%
45%
Base Return+1.5%+2%
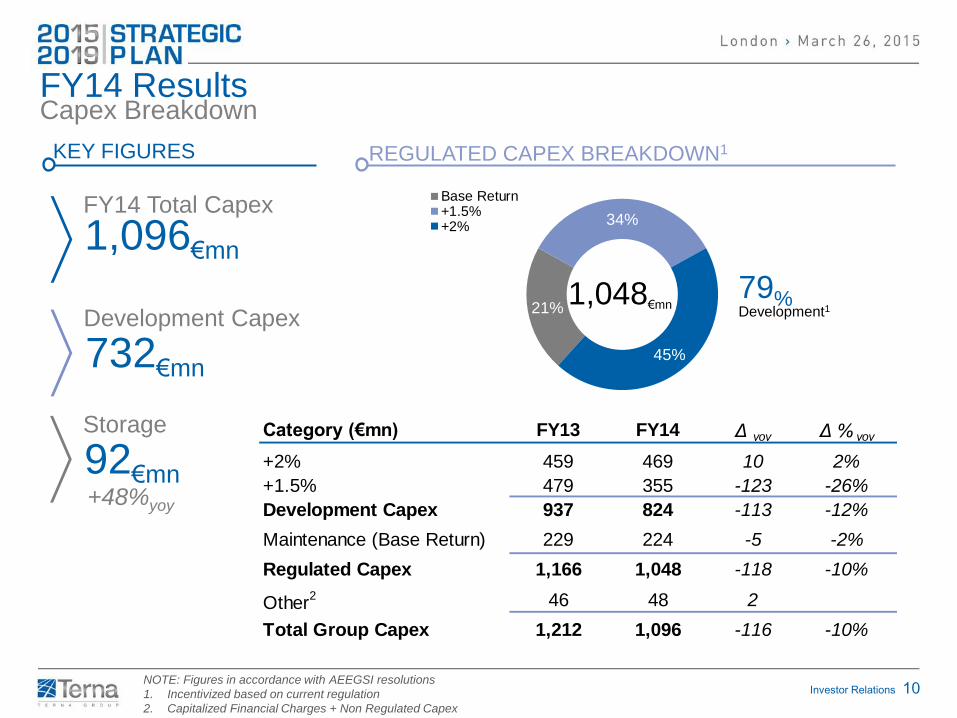
FY14 Results Capex Breakdown
KEY FIGURES REGULATED CAPEX BREAKDOWN1
FY14 Total Capex
1,096€mn
Development Capex
732€mn
1,048€mn 79% Development1
NOTE: Figures in accordance with AEEGSI resolutions
1. Incentivized based on current regulation
2. Capitalized Financial Charges + Non Regulated Capex
Category (€mn) FY13 FY14 Δ yoy Δ % yoy
+2% 459 469 10 2%
+1.5% 479 355 -123 -26%
Development Capex 937 824 -113 -12%
Maintenance (Base Return) 229 224 -5 -2%
Regulated Capex 1,166 1,048 -118 -10%
Other2 46 48 2
Total Group Capex 1,212 1,096 -116 -10%
Storage
92€mn +48%yoy
Investor Relations 11
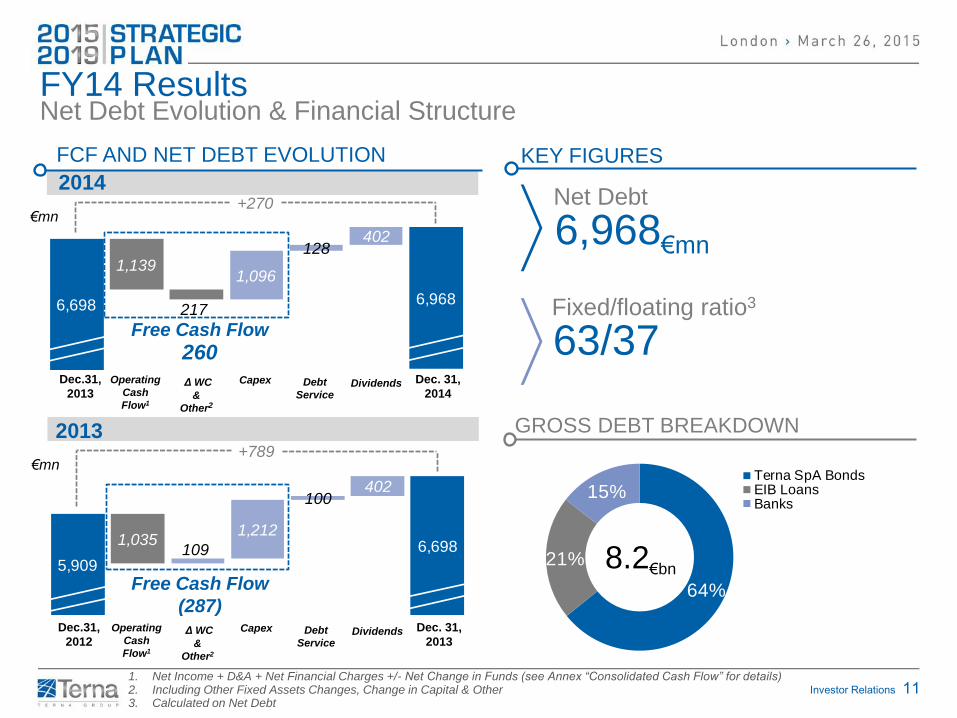
2014
5,909
6,6981,035109
1,212
100402
Net Debt Evolution & Financial Structure
1. Net Income + D&A + Net Financial Charges +/- Net Change in Funds (see Annex “Consolidated Cash Flow” for details) 2. Including Other Fixed Assets Changes, Change in Capital & Other 3. Calculated on Net Debt
FY14 Results
KEY FIGURES
Net Debt
6,968€mn
Fixed/floating ratio3
63/37
GROSS DEBT BREAKDOWN
64%
21%
15%Terna SpA BondsEIB LoansBanks
6,9686,698
1,139
217
1,096
128402
Dec.31,
2013
Operating
Cash
Flow1
Δ WC
&
Other2
Dec. 31,
2014
+270
Capex Dividends
Debt
Service
FCF AND NET DEBT EVOLUTION
€mn
Free Cash Flow
260
2013
Dec.31,
2012
Operating
Cash
Flow1
Δ WC
&
Other2
Dec. 31,
2013
+789
Capex Dividends
Debt
Service
€mn
Free Cash Flow
(287)
8.2€bn
Investor Relations 12
Agenda
FY2014 Results
2015-2019 Strategic Plan
Introduction: Terna Today
Investor Relations 13
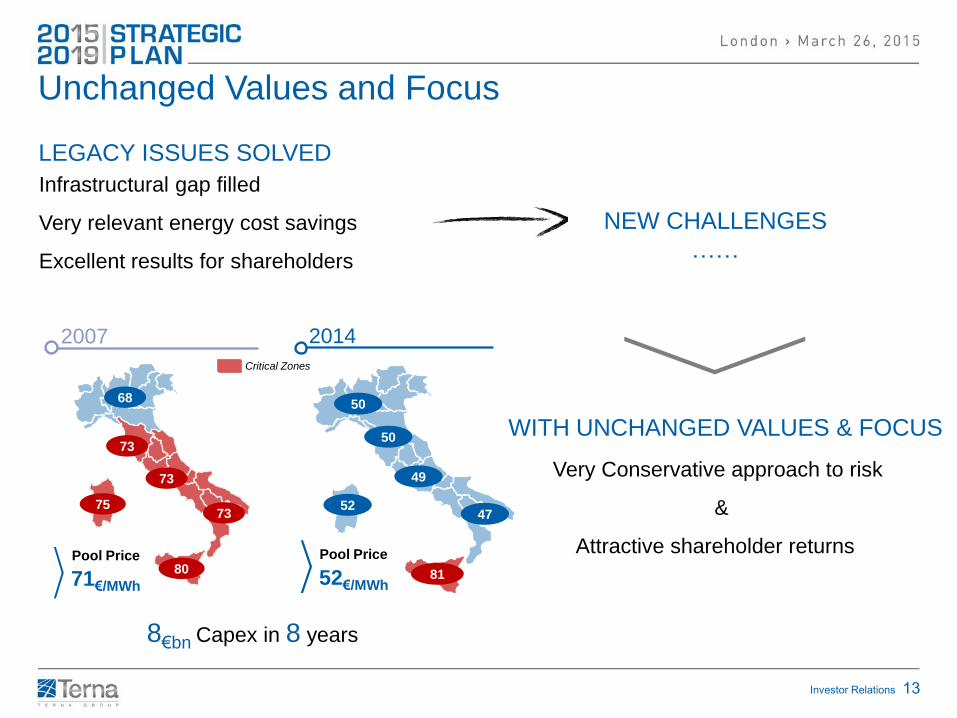
Unchanged Values and Focus
Very Conservative approach to risk
&
Attractive shareholder returns
Infrastructural gap filled
Very relevant energy cost savings
Excellent results for shareholders
WITH UNCHANGED VALUES & FOCUS
LEGACY ISSUES SOLVED
NEW CHALLENGES
……
73
73
73
80
75
Pool Price
71€/MWh
2007
68
8€bn Capex in 8 years
Critical Zones
Pool Price
52€/MWh
50
50
49
81
52
2014
47
Investor Relations 14
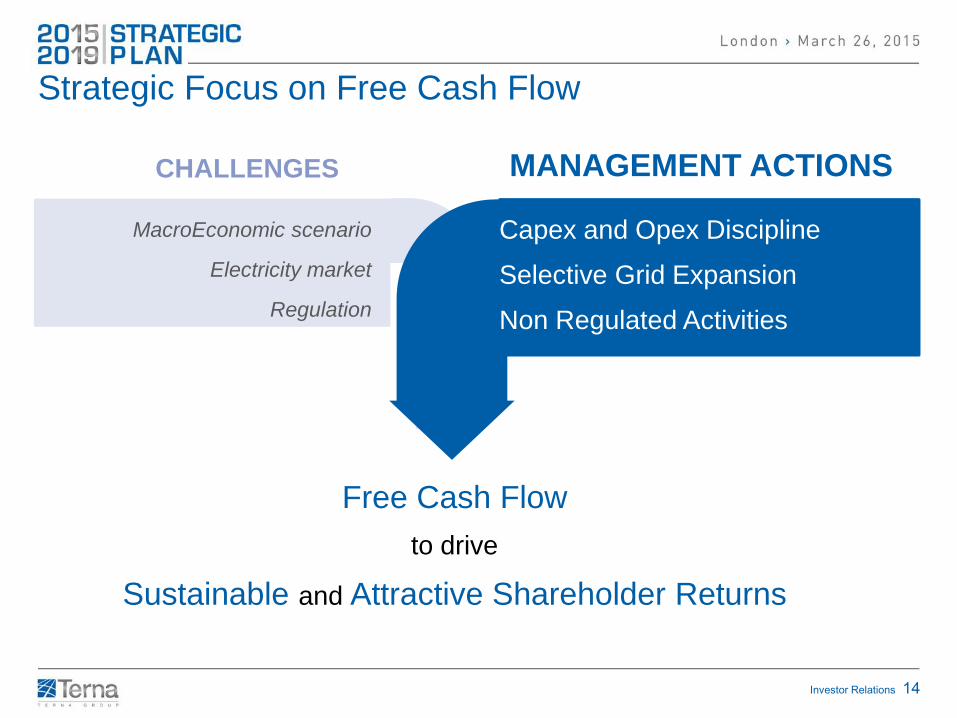
Free Cash Flow
to drive
Sustainable and Attractive Shareholder Returns
Strategic Focus on Free Cash Flow
MANAGEMENT ACTIONS CHALLENGES
MacroEconomic scenario
Electricity market
Regulation
Capex and Opex Discipline
Selective Grid Expansion
Non Regulated Activities
Investor Relations 15
2.9%
'15 2014 2013
CPI LTM rolling
Slowing inflation
Decreasing yields
'15 2014 2013 2012 2011 2010 2009 2008
5%
7%
5%
Euribor 6m
BTP 10 yrs
Yield (%)
1.3%
Feb. 2015
0.1%
0.1%
Jan. 2015
CPI
BTP/Euribor
Unprecedented Macro Scenario
Exceptional liquidity reducing yields in low growth environment
'15 2014 2013 2012 2011 2010 2009 2008
TWh
Weak but
stabilizing demand
339 Energy Demand
309 Feb 2015
+0.7%
Investor Relations 16
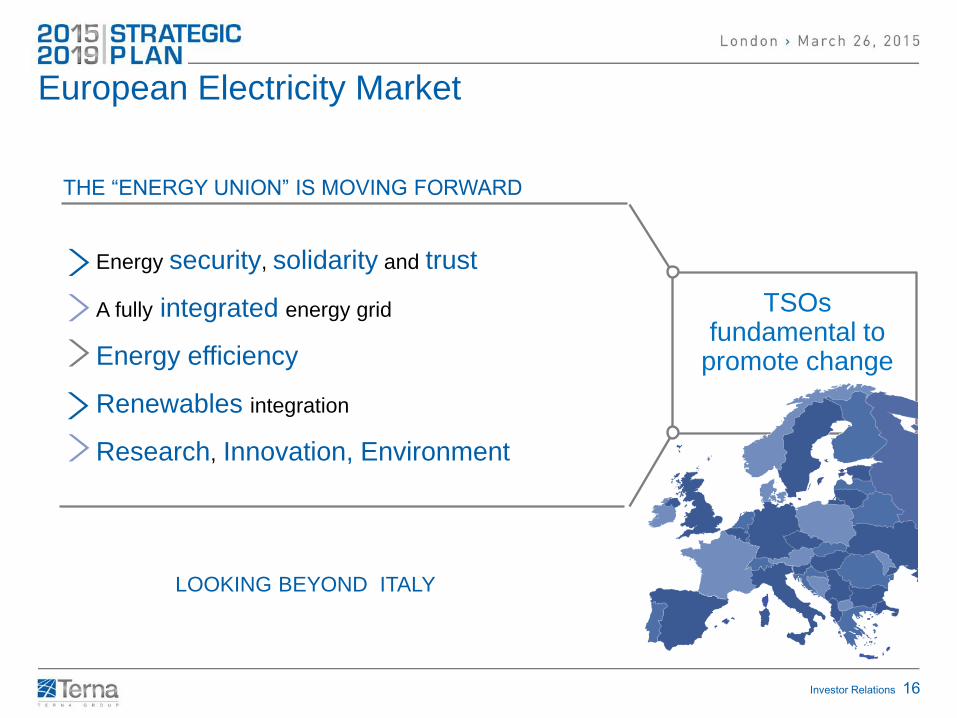
Energy security, solidarity and trust
A fully integrated energy grid
Energy efficiency
Renewables integration
Research, Innovation, Environment
European Electricity Market
THE “ENERGY UNION” IS MOVING FORWARD
TSOs fundamental to
promote change
LOOKING BEYOND ITALY
Investor Relations 17
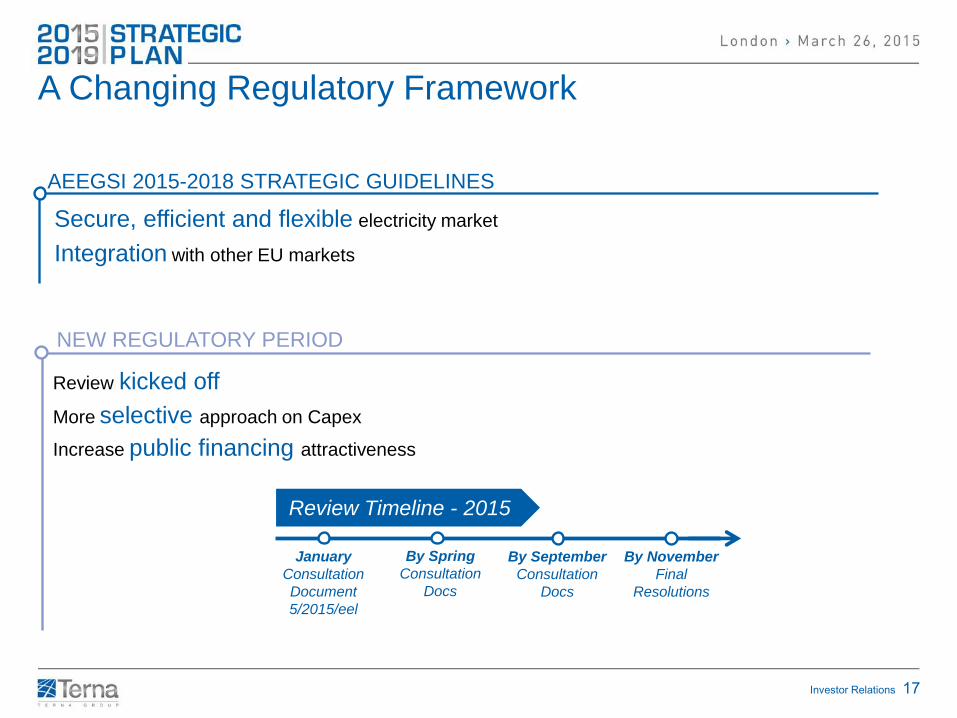
AEEGSI 2015-2018 STRATEGIC GUIDELINES
Secure, efficient and flexible electricity market
Integration with other EU markets
Review kicked off
More selective approach on Capex
Increase public financing attractiveness
NEW REGULATORY PERIOD
A Changing Regulatory Framework
Review Timeline - 2015
January
Consultation
Document
5/2015/eel
By Spring
Consultation
Docs
By September
Consultation
Docs
By November
Final
Resolutions
Investor Relations 18
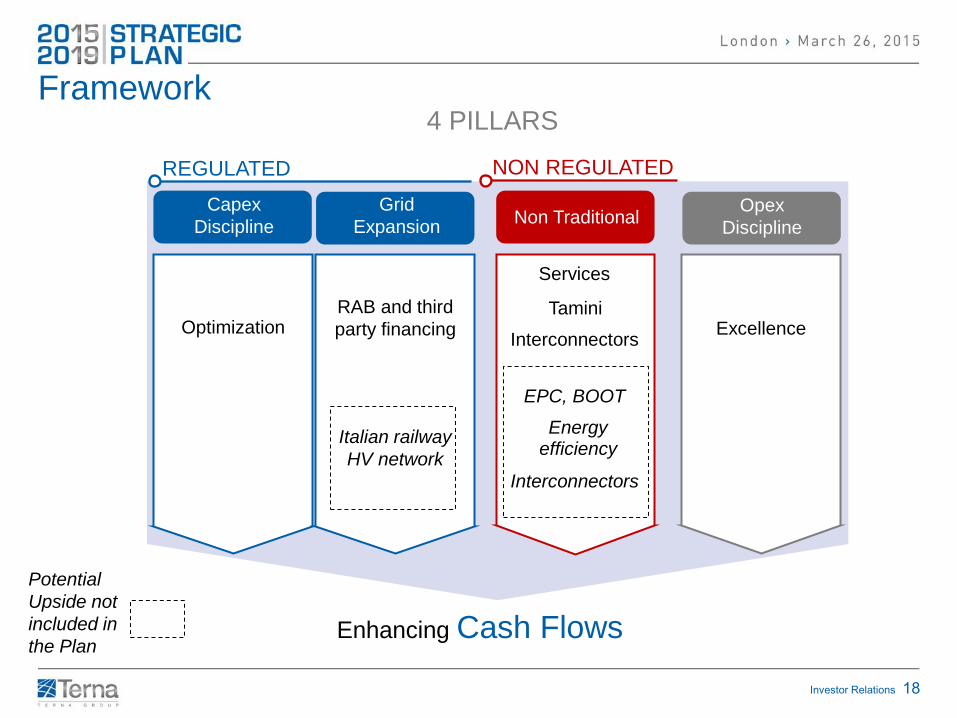
Framework
Enhancing Cash Flows
Capex
Discipline
Optimization
Non Traditional
REGULATED NON REGULATED
Grid
Expansion
RAB and third
party financing
Interconnectors
Services
Tamini
Italian railway
HV network
Energy efficiency
Interconnectors
Potential
Upside not
included in
the Plan
4 PILLARS
Opex
Discipline
Excellence
EPC, BOOT
Investor Relations 19
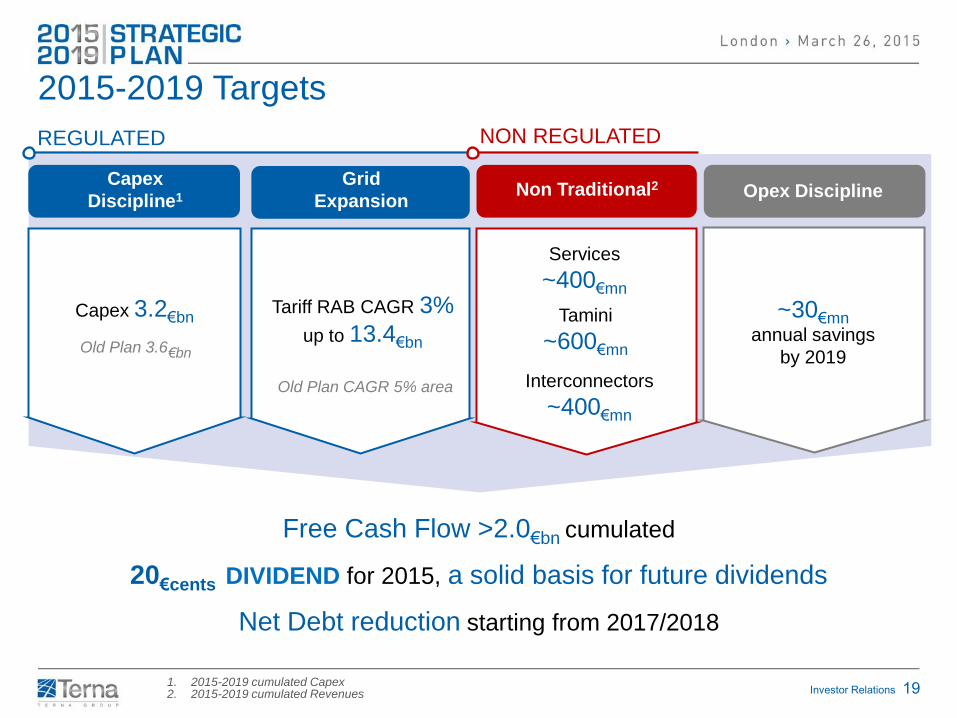
2015-2019 Targets
1. 2015-2019 cumulated Capex 2. 2015-2019 cumulated Revenues
Capex
Discipline1
Capex 3.2€bn
Non Traditional2 Opex Discipline
REGULATED NON REGULATED
Grid
Expansion
Tariff RAB CAGR 3%
up to 13.4€bn
~30€mn
annual savings
by 2019
Interconnectors
~400€mn
Services
~400€mn
Tamini
~600€mn
Free Cash Flow >2.0€bn cumulated
20€cents DIVIDEND for 2015, a solid basis for future dividends
Net Debt reduction starting from 2017/2018
Old Plan 3.6€bn
Old Plan CAGR 5% area
Investor Relations 20
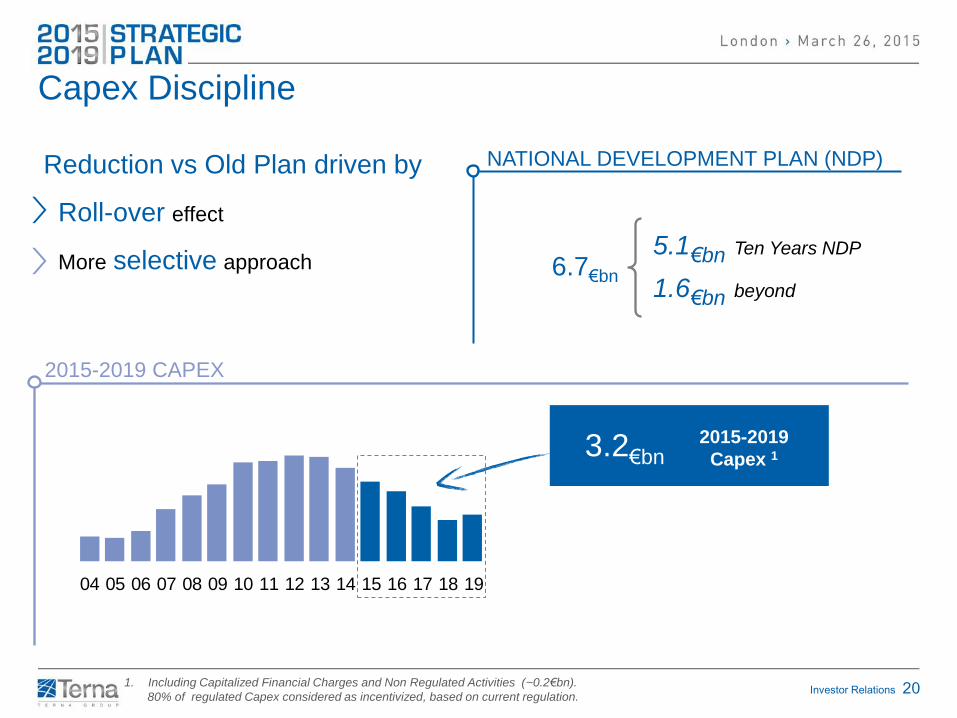
Reduction vs Old Plan driven by
Roll-over effect
More selective approach
00
00
01
01
01
02
04 05 06 07 08 09 10 11 12 13 14 15 16 17 18 19
Capex Discipline
1. Including Capitalized Financial Charges and Non Regulated Activities (~0.2€bn).
80% of regulated Capex considered as incentivized, based on current regulation.
5.1€bn Ten Years NDP
1.6€bn beyond 6.7€bn
NATIONAL DEVELOPMENT PLAN (NDP)
3.2€bn 2015-2019
Capex 1
2015-2019 CAPEX
Investor Relations 21
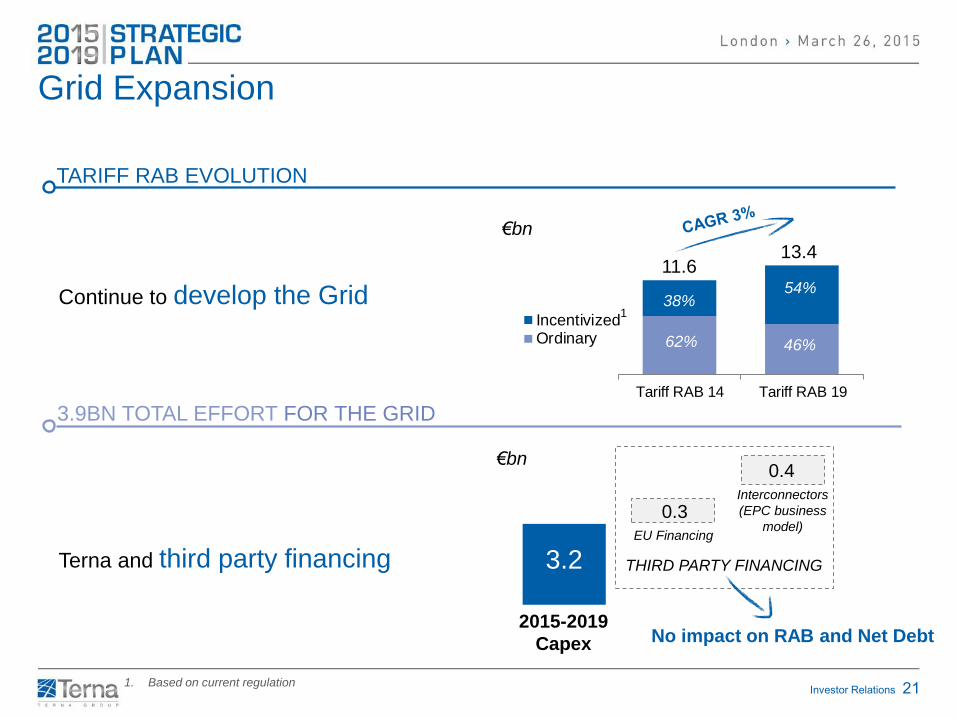
Continue to develop the Grid
Terna and third party financing
Tariff RAB 14 Tariff RAB 19
IncentivizedOrdinary
Grid Expansion
TARIFF RAB EVOLUTION
€bn
11.6 13.4
38% 54%
62% 46%
3.9BN TOTAL EFFORT FOR THE GRID
3.2
0.4
0.3
Interconnectors
(EPC business
model) EU Financing
THIRD PARTY FINANCING
No impact on RAB and Net Debt 2015-2019
Capex
€bn
1
1. Based on current regulation
Investor Relations 22 1. The possibility to switch part of the capacity on interconnector regime (law 99/09) is under evaluation
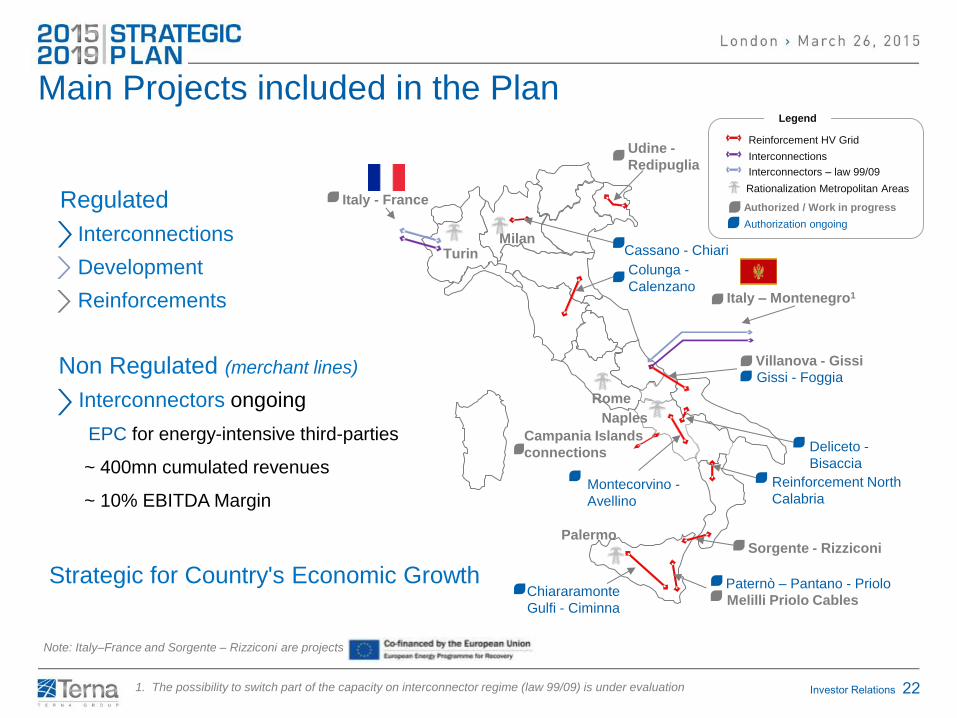
Regulated
Interconnections
Development
Reinforcements
Non Regulated (merchant lines)
Interconnectors ongoing
EPC for energy-intensive third-parties
~ 400mn cumulated revenues
~ 10% EBITDA Margin
Main Projects included in the Plan
Rationalization Metropolitan Areas
Authorized / Work in progress
Authorization ongoing
Legend
-
- Avellino Rinforzi Nord Calabria
Italy - France
Udine -
Redipuglia
Cassano - Chiari
Colunga -
Calenzano Italy – Montenegro1
Montecorvino -
Avellino
Villanova - Gissi
Gissi - Foggia
Deliceto -
Bisaccia
Reinforcement North
Calabria
Sorgente - Rizziconi
Paternò – Pantano - Priolo
Melilli Priolo Cables Chiararamonte
Gulfi - Ciminna
Reinforcement HV Grid
Interconnections
Note: Italy–France and Sorgente – Rizziconi are projects
Milan Turin
Rome
Naples
Palermo
Campania Islands
connections
Interconnectors – law 99/09
Strategic for Country's Economic Growth
Investor Relations 23
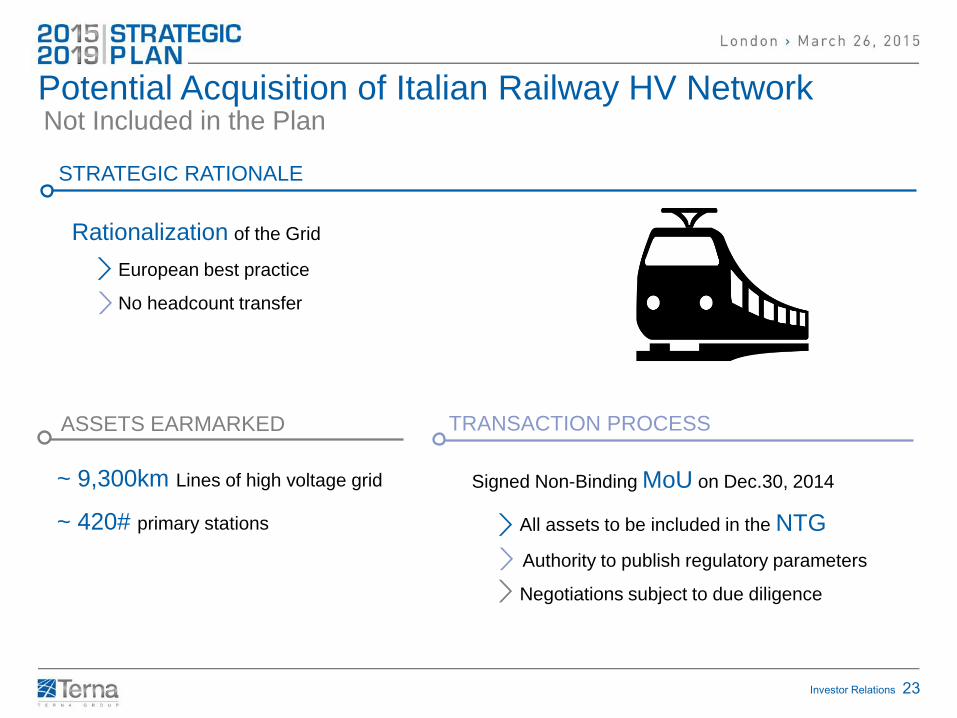
Potential Acquisition of Italian Railway HV Network
Signed Non-Binding MoU on Dec.30, 2014
All assets to be included in the NTG
Authority to publish regulatory parameters
Negotiations subject to due diligence
Rationalization of the Grid
European best practice
No headcount transfer
STRATEGIC RATIONALE
ASSETS EARMARKED
~ 9,300km Lines of high voltage grid
~ 420# primary stations
TRANSACTION PROCESS
Not Included in the Plan
Investor Relations 24
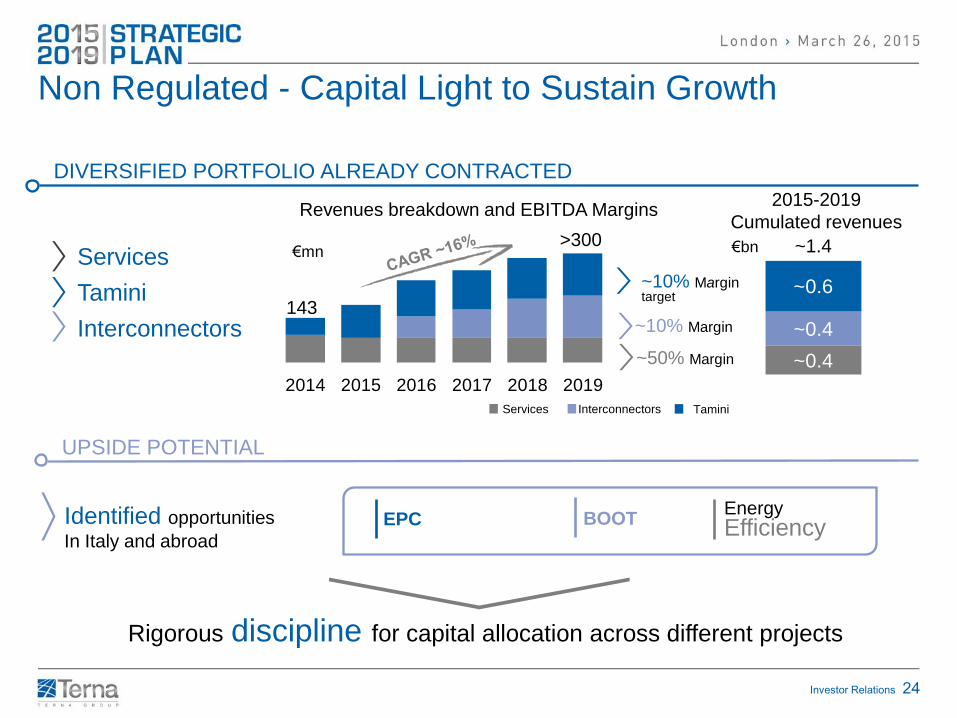
2014 2015 2016 2017 2018 2019
Services
Tamini
Interconnectors
~0.4
~0.4
~0.6
1
Non Regulated - Capital Light to Sustain Growth
EPC Energy Efficiency
Revenues breakdown and EBITDA Margins
DIVERSIFIED PORTFOLIO ALREADY CONTRACTED
~50% Margin
~10% Margin
~10% Margin target
UPSIDE POTENTIAL
Rigorous discipline for capital allocation across different projects
143
>300 ~1.4
2015-2019
Cumulated revenues
Identified opportunities
In Italy and abroad
Tamini Interconnectors Services
€mn €bn
BOOT
Investor Relations 25
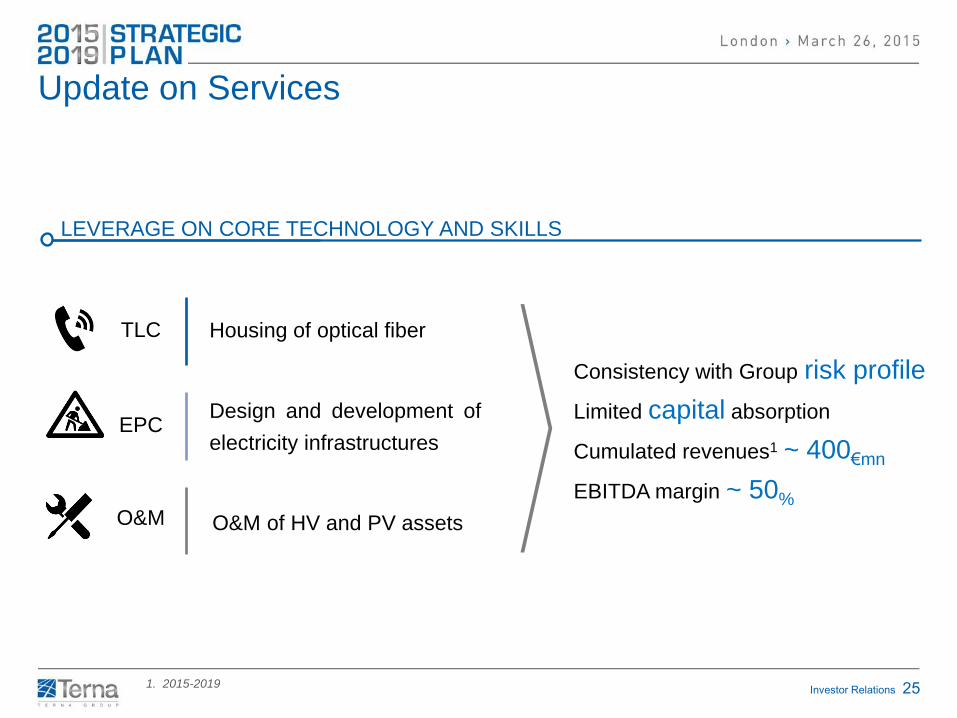
Housing of optical fiber
Design and development of
electricity infrastructures
O&M of HV and PV assets
TLC
EPC
O&M
Update on Services
Consistency with Group risk profile
Limited capital absorption
Cumulated revenues1 ~ 400€mn
EBITDA margin ~ 50%
LEVERAGE ON CORE TECHNOLOGY AND SKILLS
1. 2015-2019
Investor Relations 26
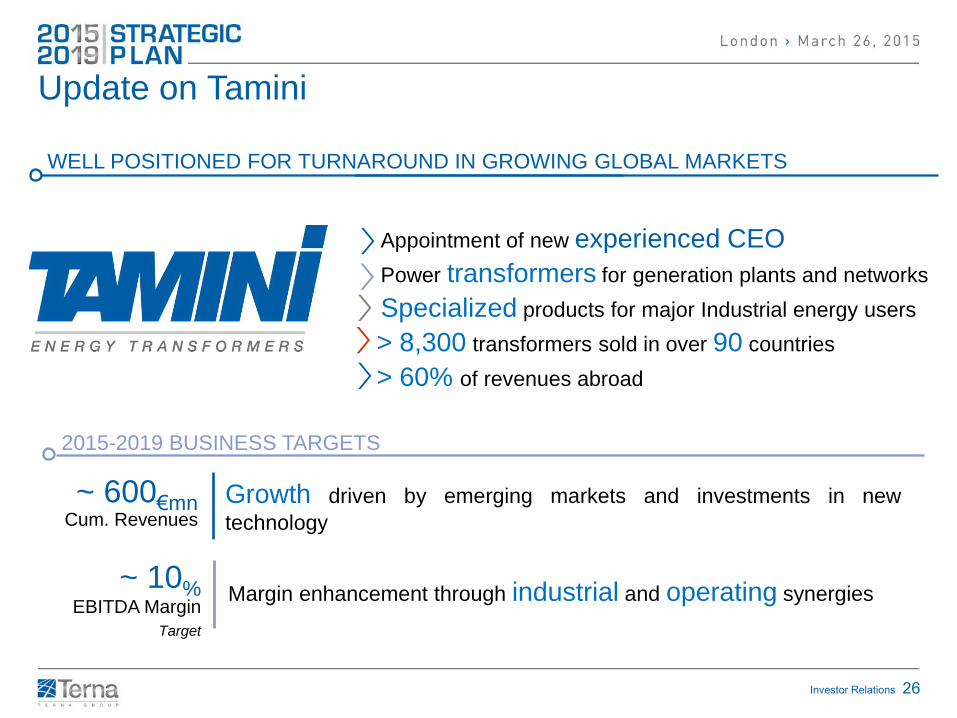
Appointment of new experienced CEO
Power transformers for generation plants and networks
Specialized products for major Industrial energy users
> 8,300 transformers sold in over 90 countries
> 60% of revenues abroad
WELL POSITIONED FOR TURNAROUND IN GROWING GLOBAL MARKETS
2015-2019 BUSINESS TARGETS
Update on Tamini
Growth driven by emerging markets and investments in new
technology
Margin enhancement through industrial and operating synergies
~ 600€mn Cum. Revenues
~ 10% EBITDA Margin
Target
Investor Relations 27
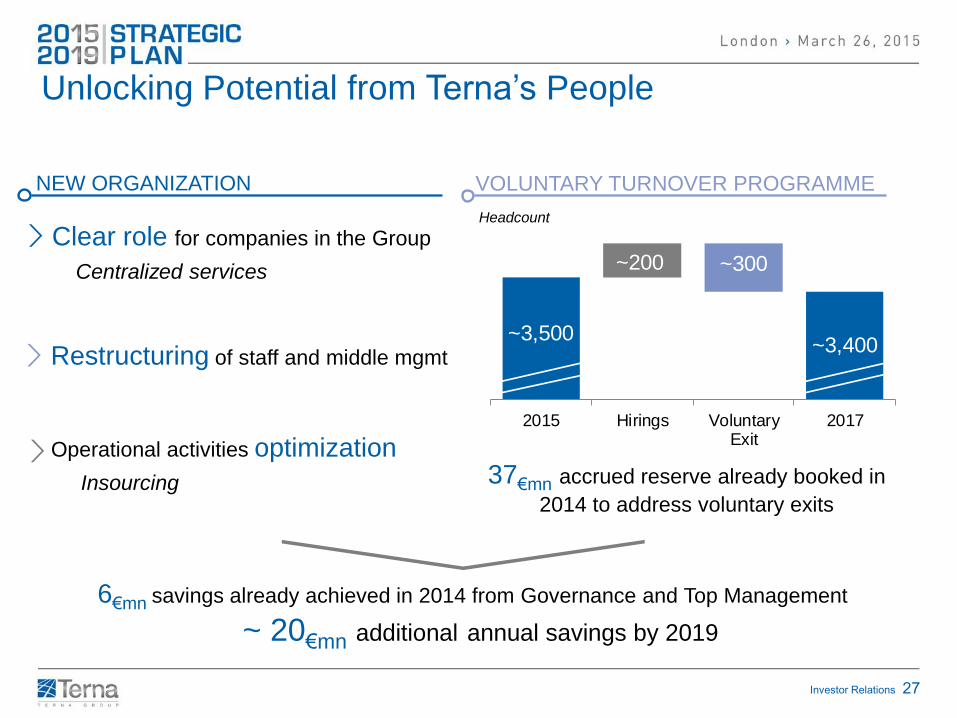
Restructuring of staff and middle mgmt
Clear role for companies in the Group
Centralized services
Unlocking Potential from Terna’s People
~ 20€mn additional annual savings by 2019
~3,500
~200 ~300
~3,400
2015 Hirings VoluntaryExit
2017
37€mn accrued reserve already booked in
2014 to address voluntary exits
VOLUNTARY TURNOVER PROGRAMME
NEW ORGANIZATION
Headcount
Operational activities optimization
Insourcing
6€mn savings already achieved in 2014 from Governance and Top Management
Investor Relations 28
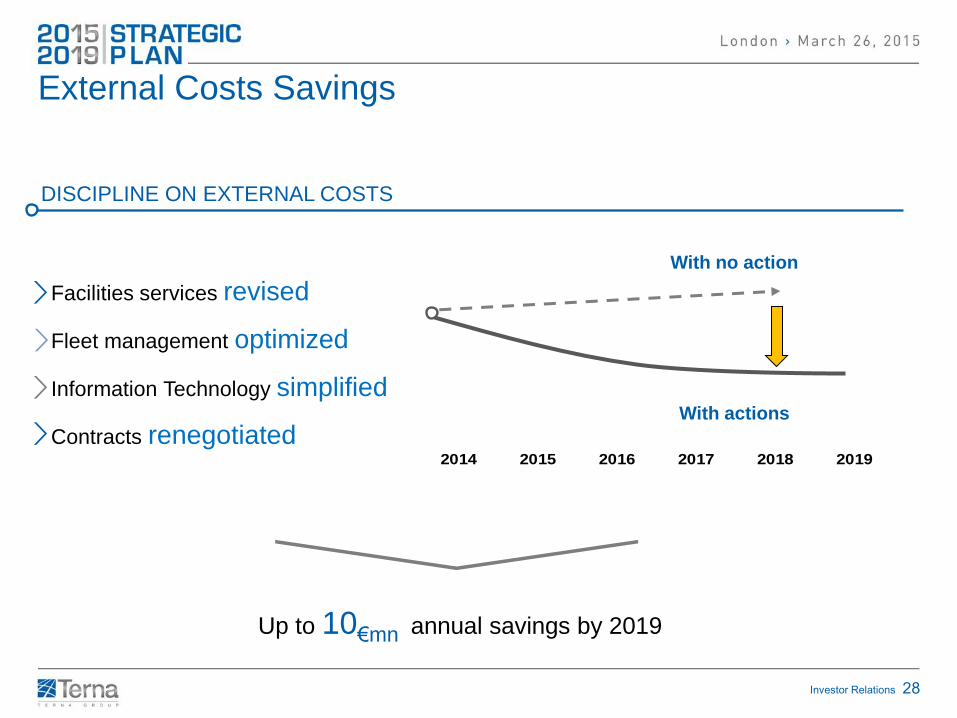
External Costs Savings
DISCIPLINE ON EXTERNAL COSTS
Facilities services revised
Fleet management optimized
Information Technology simplified
Contracts renegotiated 2014 2015 2016 2017 2018 2019
With actions
With no action
Up to 10€mn annual savings by 2019
Investor Relations 29
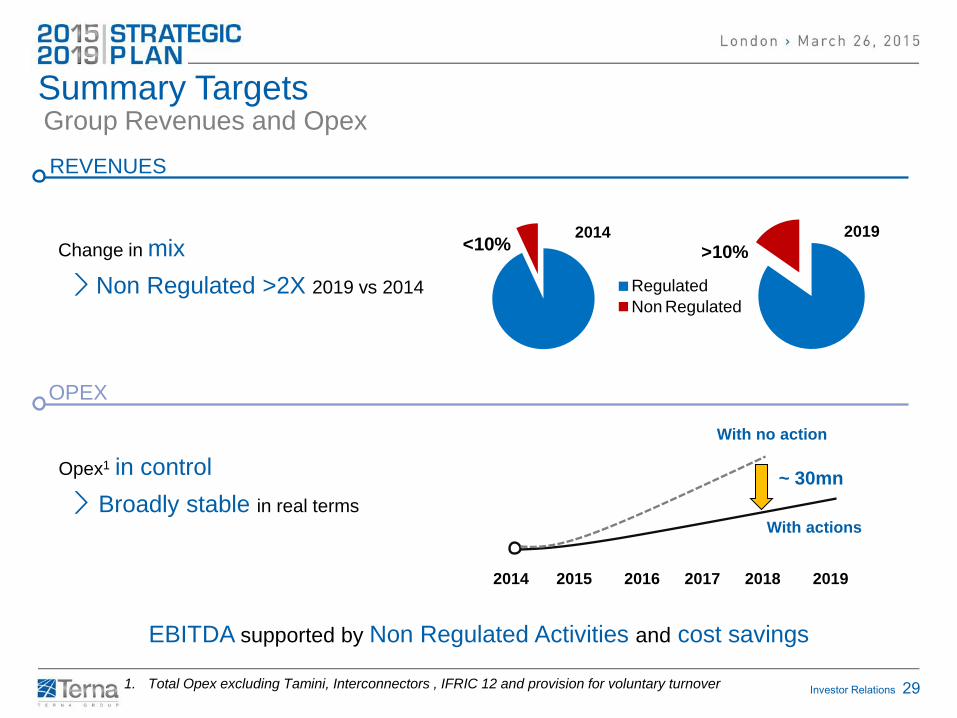
Summary Targets Group Revenues and Opex
REVENUES
OPEX
1. Total Opex excluding Tamini, Interconnectors , IFRIC 12 and provision for voluntary turnover
Change in mix
Non Regulated >2X 2019 vs 2014
Opex1 in control
Broadly stable in real terms With actions
With no action
<10%
Regulated
Non Regulated
2014
>10%2019
EBITDA supported by Non Regulated Activities and cost savings
2014 2015 2016 2017 2018 2019
~ 30mn
Investor Relations 30
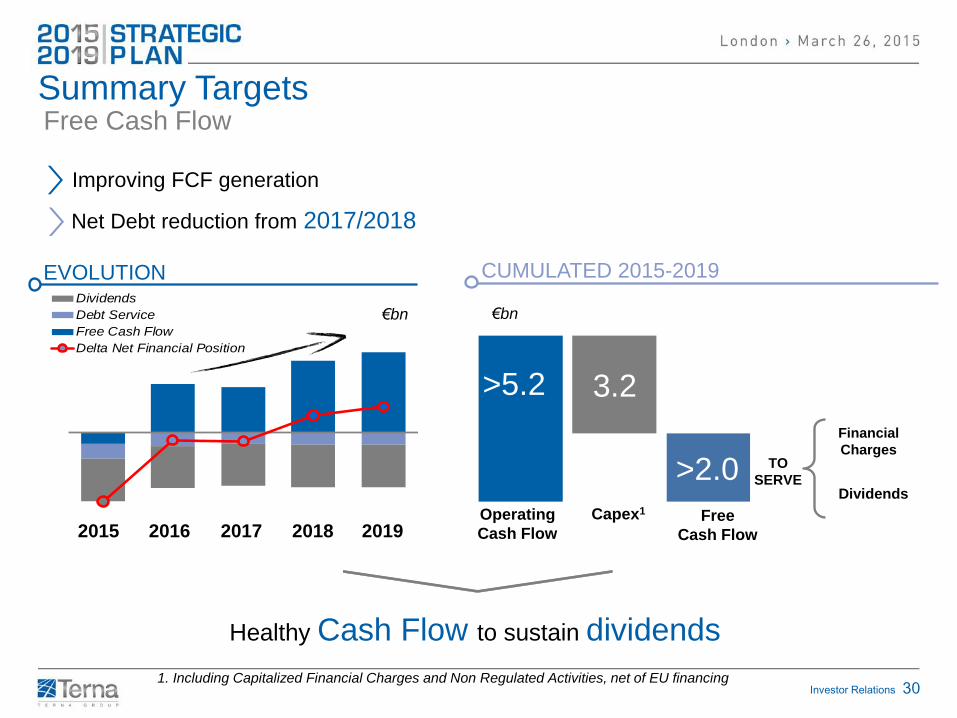
Summary Targets Free Cash Flow
Dividends
Debt Service
Free Cash Flow
Delta Net Financial Position
CUMULATED 2015-2019 EVOLUTION
2015 2016 2017 2018 2019
Improving FCF generation
Healthy Cash Flow to sustain dividends
€bn €bn
3.2
Operating
Cash Flow
Capex1 Free
Cash Flow
1. Including Capitalized Financial Charges and Non Regulated Activities, net of EU financing
Financial
Charges
Dividends
TO
SERVE >2.0
>5.2
Net Debt reduction from 2017/2018
Investor Relations 31
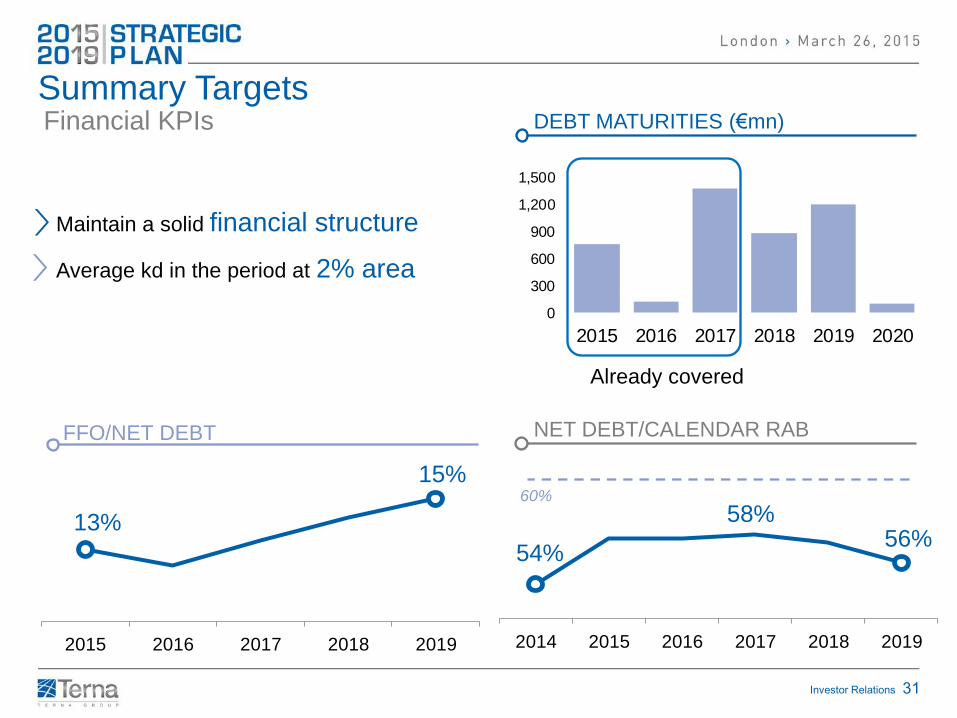
2014 2015 2016 2017 2018 2019
NET DEBT/CALENDAR RAB
Maintain a solid financial structure
Average kd in the period at 2% area
54% 56%
60%
0
300
600
900
1,200
1,500
2015 2016 2017 2018 2019 2020
FFO/NET DEBT
DEBT MATURITIES (€mn)
Already covered
Summary Targets Financial KPIs
58%
2015 2016 2017 2018 2019
13%
15%
Investor Relations 32
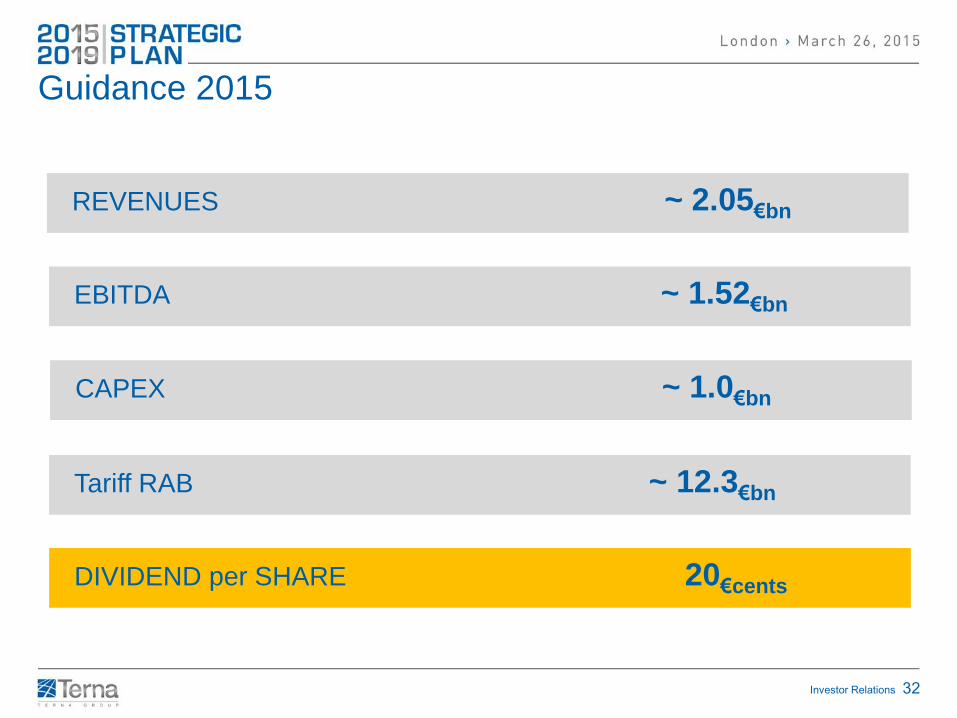
Guidance 2015
REVENUES ~ 2.05€bn
EBITDA ~ 1.52€bn
DIVIDEND per SHARE 20€cents
CAPEX ~ 1.0€bn
Tariff RAB ~ 12.3€bn
Investor Relations 33
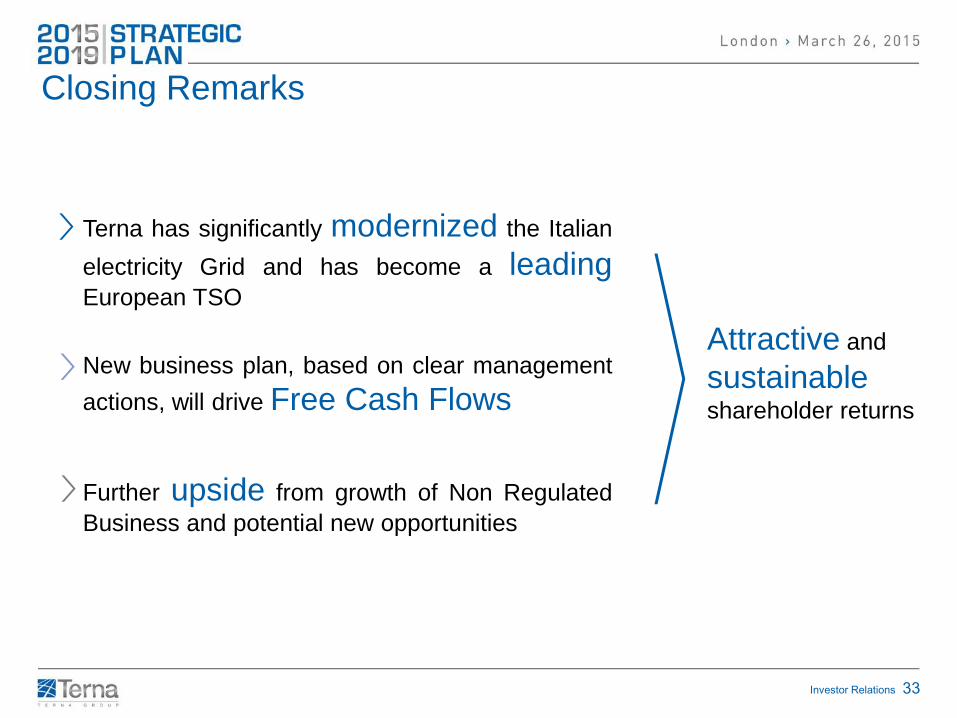
Closing Remarks
Attractive and
sustainable
shareholder returns
Further upside from growth of Non Regulated
Business and potential new opportunities
New business plan, based on clear management
actions, will drive Free Cash Flows
Terna has significantly modernized the Italian
electricity Grid and has become a leading European TSO
Investor Relations 34
THANK YOU. QUESTIONS?
Matteo Del Fante Chief Executive Officer
Pierpaolo Cristofori Chief Financial Officer
Investor Relations 35
Annexes
Investor Relations 36
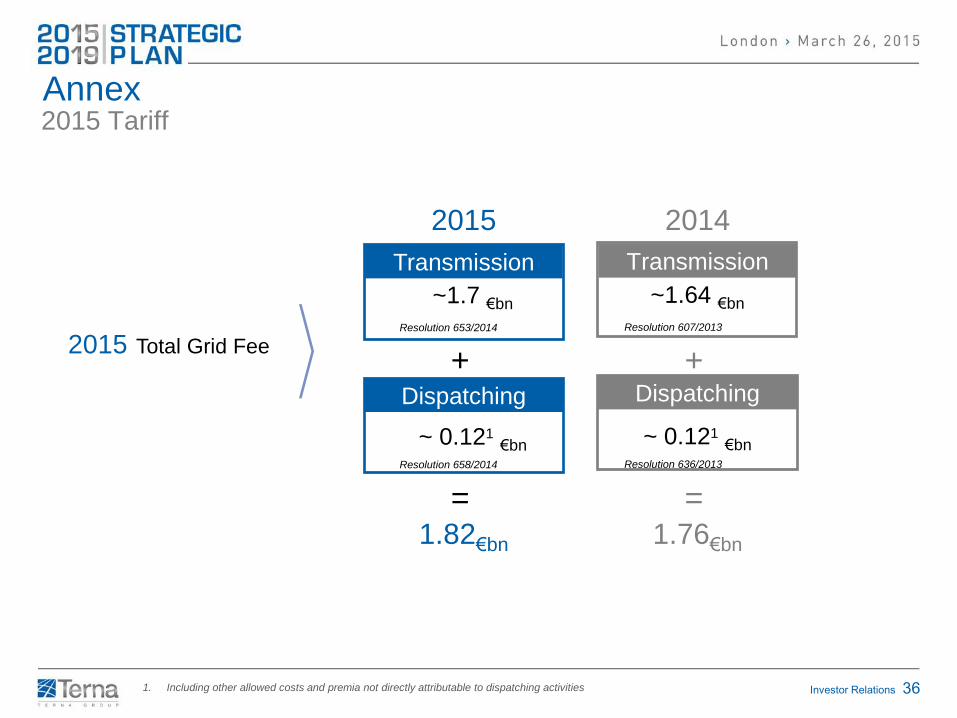
Transmission
Dispatching
+
~ 0.121 €bn
~1.64 €bn
1.82€bn
Resolution 636/2013
Resolution 607/2013
2015 Total Grid Fee
1. Including other allowed costs and premia not directly attributable to dispatching activities
2015 Tariff
Transmission
Dispatching
+
1.76€bn
2015 2014
= =
~ 0.121 €bn
~1.7 €bn
Resolution 658/2014
Resolution 653/2014
Annex
Investor Relations 37
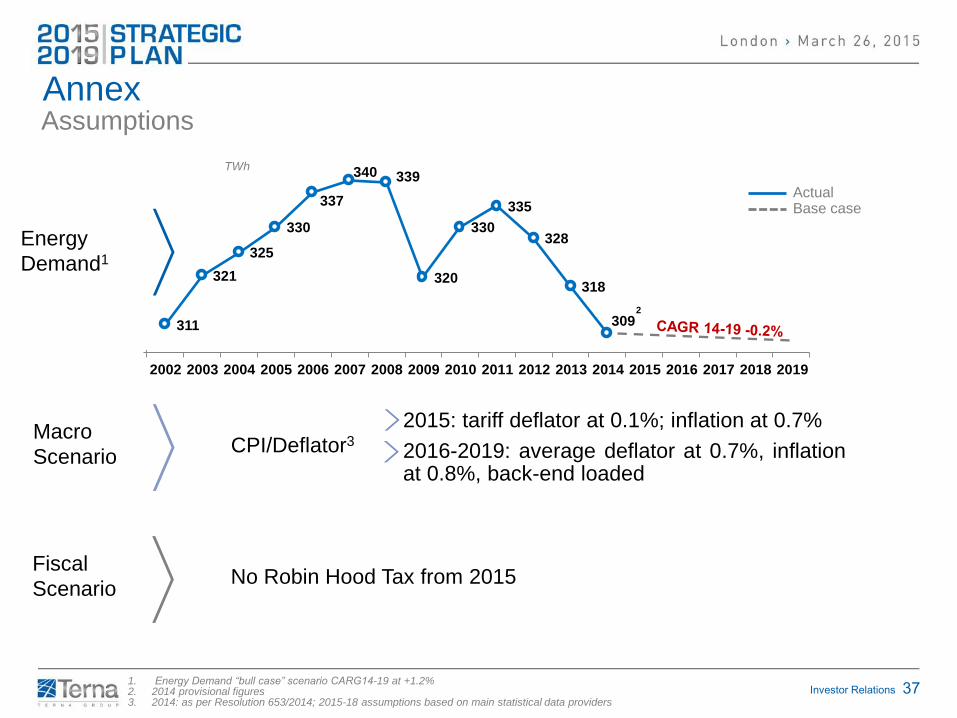
311
321
325
330
337
340 339
320
330
335
328
318
309
2002 2003 2004 2005 2006 2007 2008 2009 2010 2011 2012 2013 2014 2015 2016 2017 2018 2019
Assumptions
1. Energy Demand “bull case” scenario CARG14-19 at +1.2% 2. 2014 provisional figures 3. 2014: as per Resolution 653/2014; 2015-18 assumptions based on main statistical data providers
Energy
Demand1
Macro
Scenario CPI/Deflator3
Actual Base case
2
TWh
2015: tariff deflator at 0.1%; inflation at 0.7%
2016-2019: average deflator at 0.7%, inflation at 0.8%, back-end loaded
Annex
Fiscal
Scenario No Robin Hood Tax from 2015
Investor Relations 38
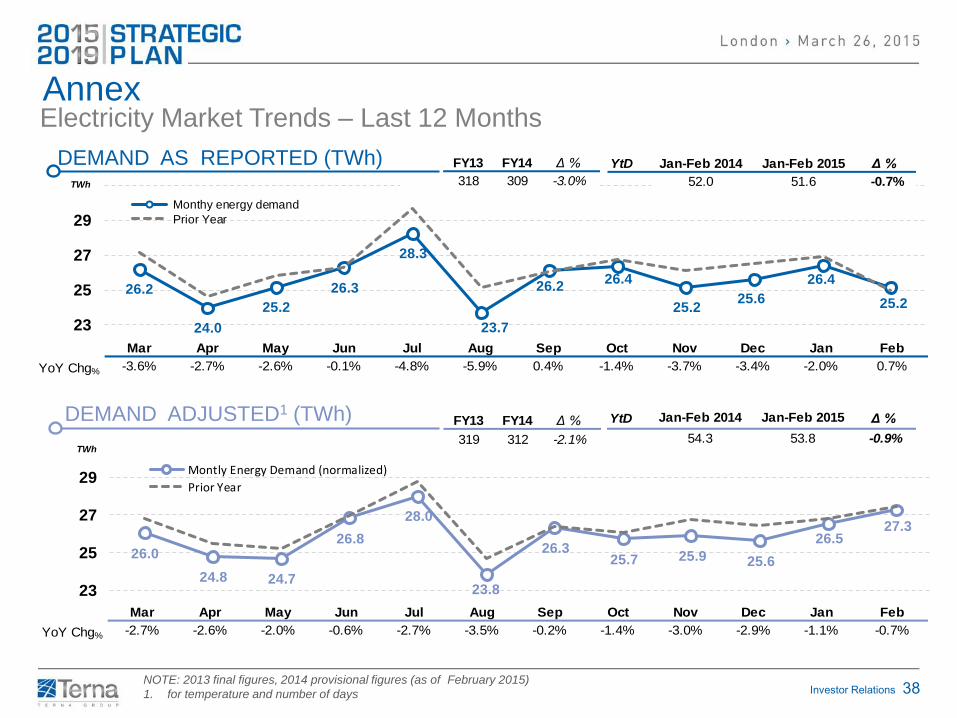
Annex Electricity Market Trends – Last 12 Months
DEMAND ADJUSTED1 (TWh)
26.2
24.0
25.2
26.3
28.3
23.7
26.226.4
25.225.6
26.4
25.2
23
25
27
29
31
Mar Apr May Jun Jul Aug Sep Oct Nov Dec Jan Feb
Monthy energy demand
Prior Year
26.0
24.8 24.7
26.8
28.0
23.8
26.325.7 25.9 25.6
26.527.3
23
25
27
29
Mar Apr May Jun Jul Aug Sep Oct Nov Dec Jan Feb
Montly Energy Demand (normalized)
Prior Year
TWh
Mar Apr May Jun Jul Aug Sep Oct Nov Dec Jan Feb
YoY Chg% -2.7% -2.6% -2.0% -0.6% -2.7% -3.5% -0.2% -1.4% -3.0% -2.9% -1.1% -0.7%
Mar Apr May Jun Jul Aug Sep Oct Nov Dec Jan Feb
YoY Chg% -3.6% -2.7% -2.6% -0.1% -4.8% -5.9% 0.4% -1.4% -3.7% -3.4% -2.0% 0.7%
TWh
FY13 FY14 Δ %
318 309 -3.0%
FY13 FY14 Δ %
319 312 -2.1%
YtD Δ %
-0.7%
Jan-Feb 2014 Jan-Feb 2015
52.0 51.6
YtD Δ %
-0.9%
Jan-Feb 2014 Jan-Feb 2015
54.3 53.8
DEMAND AS REPORTED (TWh)
NOTE: 2013 final figures, 2014 provisional figures (as of February 2015)
1. for temperature and number of days
Investor Relations 39
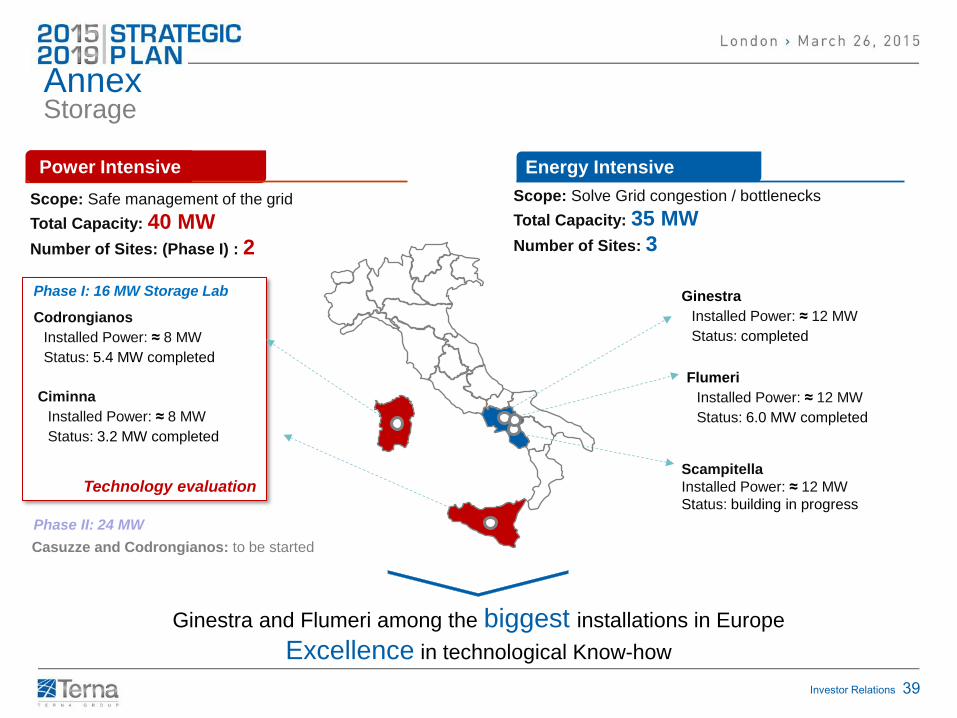
Technology evaluation
Storage
Ginestra and Flumeri among the biggest installations in Europe
Excellence in technological Know-how
Ciminna
Installed Power: ≈ 8 MW
Status: 3.2 MW completed
Codrongianos
Installed Power: ≈ 8 MW
Status: 5.4 MW completed
Power Intensive Energy Intensive
Scope: Safe management of the grid
Total Capacity: 40 MW
Number of Sites: (Phase I) : 2
Scope: Solve Grid congestion / bottlenecks
Total Capacity: 35 MW
Number of Sites: 3
Scampitella
Installed Power: ≈ 12 MW
Status: building in progress
Ginestra
Installed Power: ≈ 12 MW
Status: completed
Flumeri
Installed Power: ≈ 12 MW 12 MW
Status: 6.0 MW completed
Casuzze and Codrongianos: to be started
Phase II: 24 MW
Phase I: 16 MW Storage Lab
Annex
Investor Relations 40
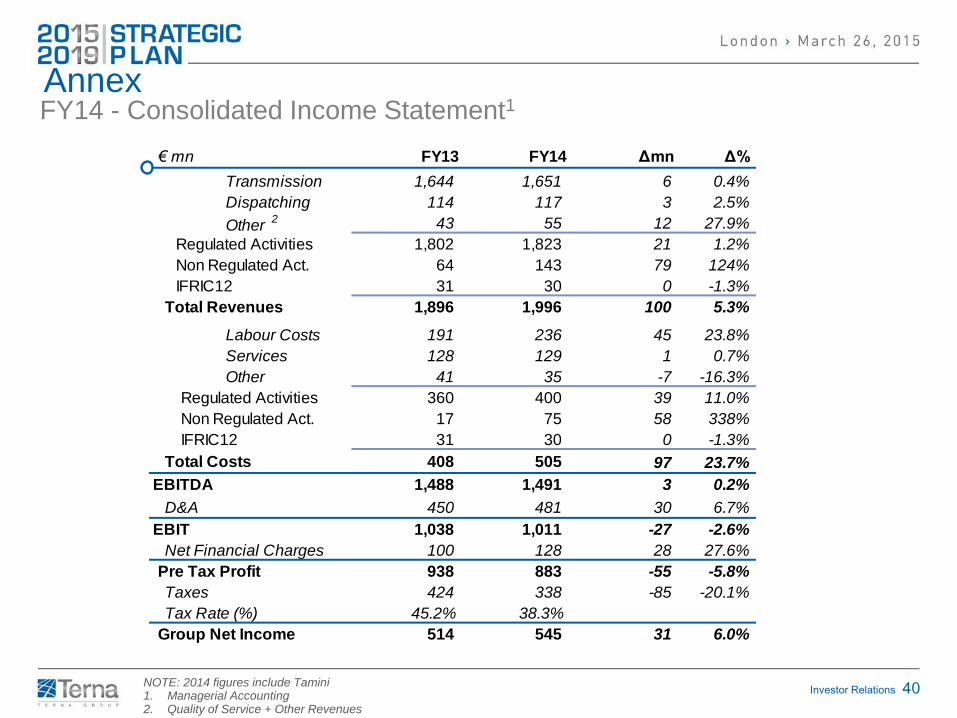
FY14 - Consolidated Income Statement1 Annex
NOTE: 2014 figures include Tamini 1. Managerial Accounting 2. Quality of Service + Other Revenues
€ mn FY13 FY14 Δmn Δ%
Transmission 1,644 1,651 6 0.4%
Dispatching 114 117 3 2.5%
Other 2 43 55 12 27.9%
Regulated Activities 1,802 1,823 21 1.2%
Non Regulated Act. 64 143 79 124%
IFRIC12 31 30 0 -1.3%
Total Revenues 1,896 1,996 100 5.3%
Labour Costs 191 236 45 23.8%
Services 128 129 1 0.7%
Other 41 35 -7 -16.3%
Regulated Activities 360 400 39 11.0%
Non Regulated Act. 17 75 58 338%
IFRIC12 31 30 0 -1.3%
Total Costs 408 505 97 23.7%
EBITDA 1,488 1,491 3 0.2%
D&A 450 481 30 6.7%
EBIT 1,038 1,011 -27 -2.6%
Net Financial Charges 100 128 28 27.6%
Pre Tax Profit 938 883 -55 -5.8%
Taxes 424 338 -85 -20.1%
Tax Rate (%) 45.2% 38.3%
Group Net Income 514 545 31 6.0%
Investor Relations 41
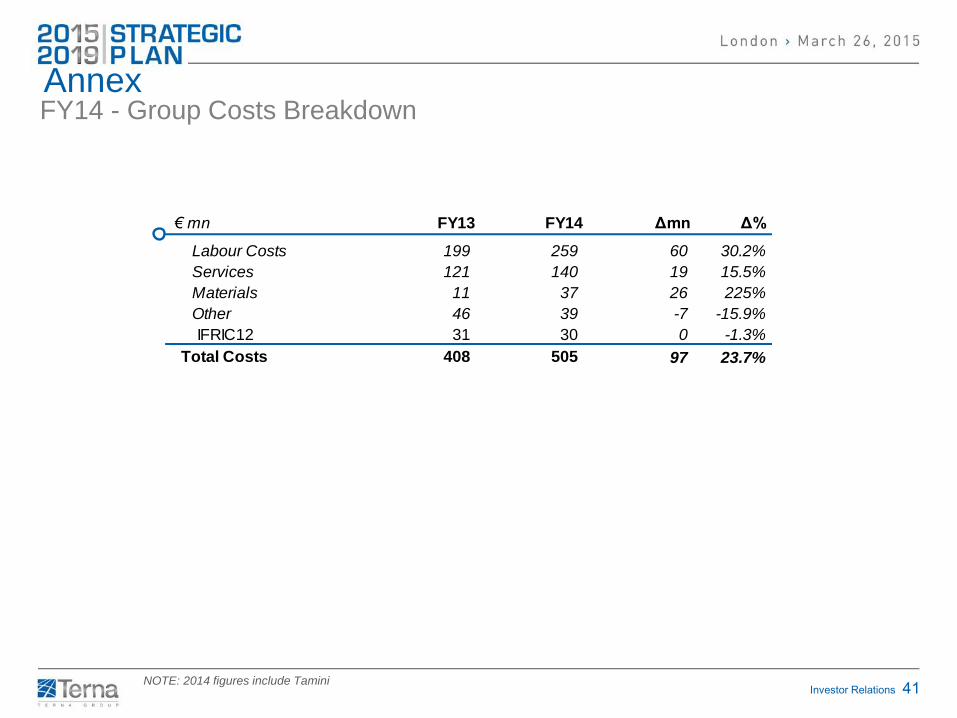
FY14 - Group Costs Breakdown Annex
NOTE: 2014 figures include Tamini
€ mn FY13 FY14 Δmn Δ%
Labour Costs 199 259 60 30.2%
Services 121 140 19 15.5%
Materials 11 37 26 225%
Other 46 39 -7 -15.9%
IFRIC12 31 30 0 -1.3%
Total Costs 408 505 97 23.7%
Investor Relations 42
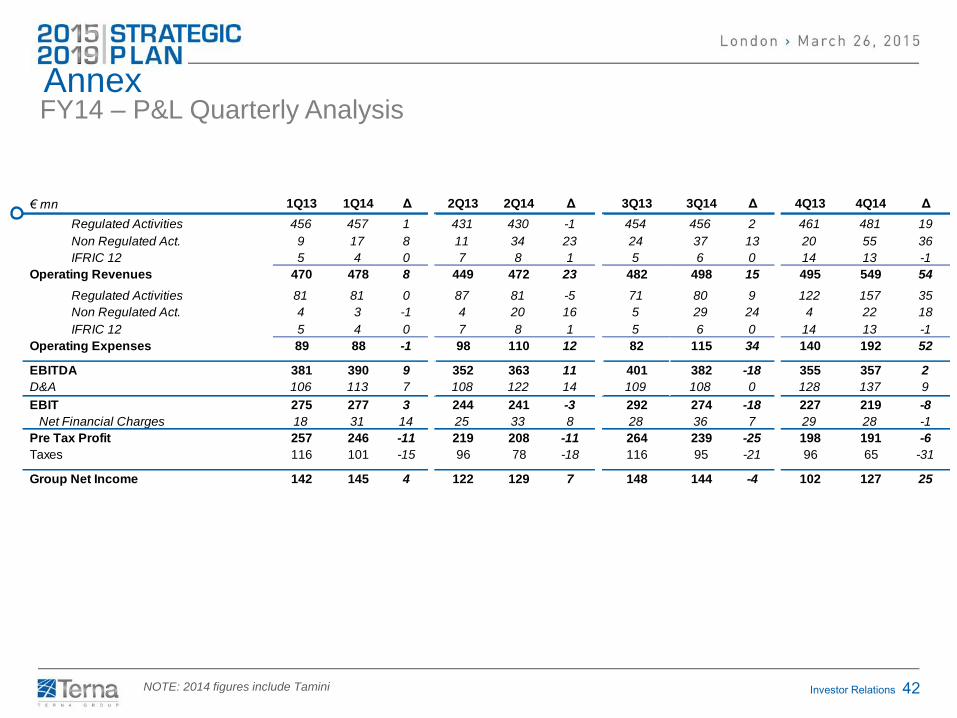
FY14 – P&L Quarterly Analysis Annex
NOTE: 2014 figures include Tamini
€ mn 1Q13 1Q14 Δ 2Q13 2Q14 Δ 3Q13 3Q14 Δ 4Q13 4Q14 Δ
Regulated Activities 456 457 1 431 430 -1 454 456 2 461 481 19
Non Regulated Act. 9 17 8 11 34 23 24 37 13 20 55 36
IFRIC 12 5 4 0 7 8 1 5 6 0 14 13 -1
Operating Revenues 470 478 8 449 472 23 482 498 15 495 549 54
Regulated Activities 81 81 0 87 81 -5 71 80 9 122 157 35
Non Regulated Act. 4 3 -1 4 20 16 5 29 24 4 22 18
IFRIC 12 5 4 0 7 8 1 5 6 0 14 13 -1
Operating Expenses 89 88 -1 98 110 12 82 115 34 140 192 52
EBITDA 381 390 9 352 363 11 401 382 -18 355 357 2
D&A 106 113 7 108 122 14 109 108 0 128 137 9
EBIT 275 277 3 244 241 -3 292 274 -18 227 219 -8
Net Financial Charges 18 31 14 25 33 8 28 36 7 29 28 -1
Pre Tax Profit 257 246 -11 219 208 -11 264 239 -25 198 191 -6
Taxes 116 101 -15 96 78 -18 116 95 -21 96 65 -31
Group Net Income 142 145 4 122 129 7 148 144 -4 102 127 25
Investor Relations 43
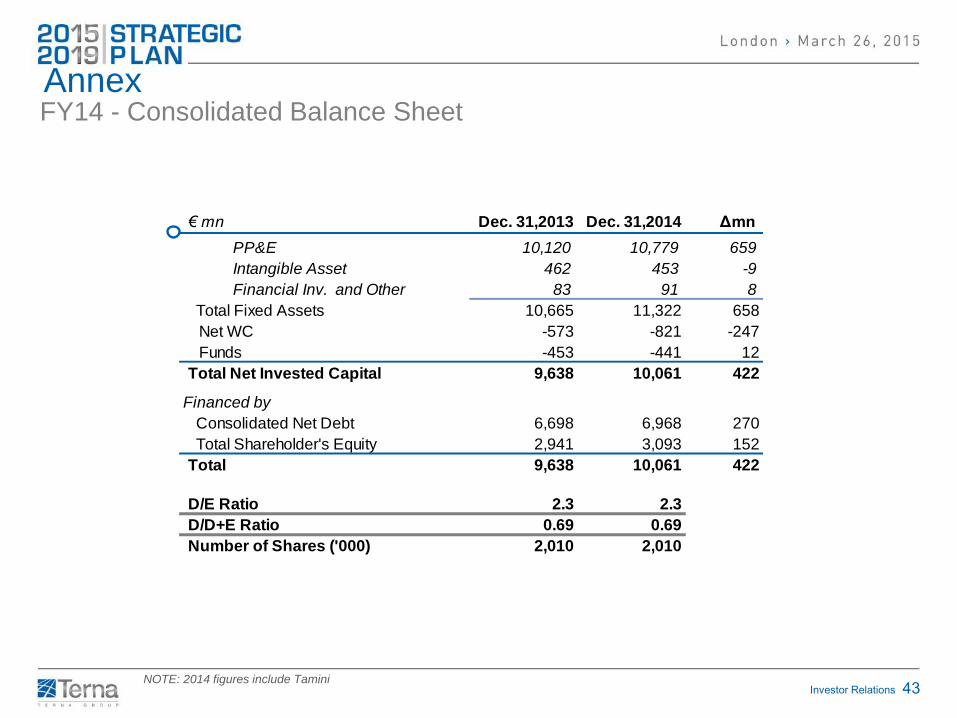
FY14 - Consolidated Balance Sheet Annex
NOTE: 2014 figures include Tamini
€ mn Dec. 31,2013 Dec. 31,2014 Δmn
PP&E 10,120 10,779 659
Intangible Asset 462 453 -9
Financial Inv. and Other 83 91 8
Total Fixed Assets 10,665 11,322 658
Net WC -573 -821 -247
Funds -453 -441 12
Total Net Invested Capital 9,638 10,061 422
Financed by
Consolidated Net Debt 6,698 6,968 270
Total Shareholder's Equity 2,941 3,093 152
Total 9,638 10,061 422
D/E Ratio 2.3 2.3
D/D+E Ratio 0.69 0.69
Number of Shares ('000) 2,010 2,010
Investor Relations 44
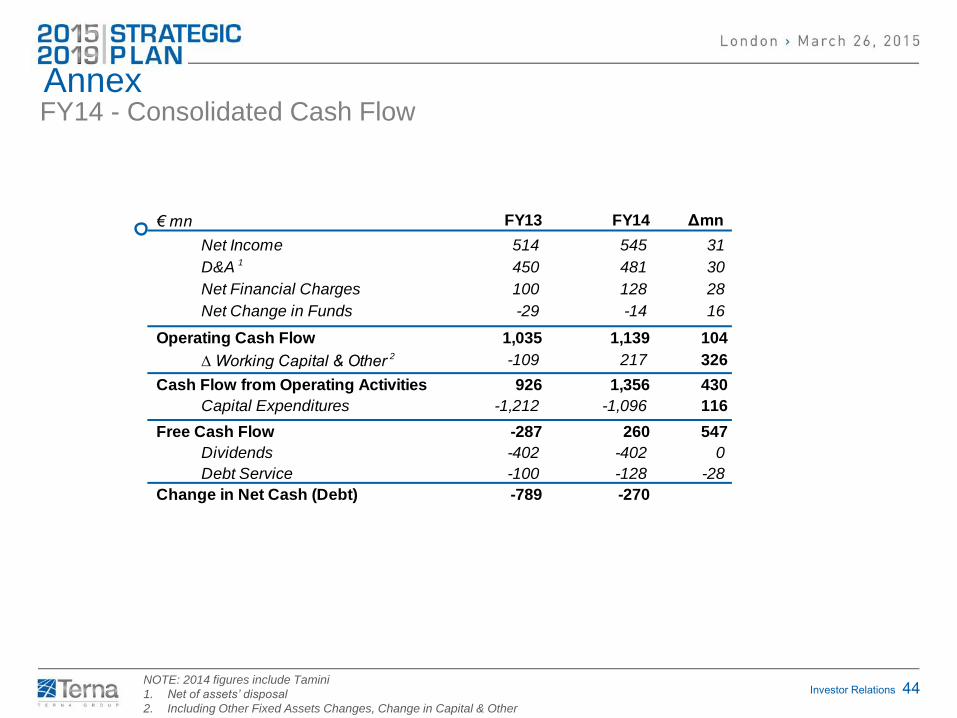
€ mn FY13 FY14 Δmn
Net Income 514 545 31
D&A 1 450 481 30
Net Financial Charges 100 128 28
Net Change in Funds -29 -14 16
Operating Cash Flow 1,035 1,139 104
∆ Working Capital & Other 2 -109 217 326
Cash Flow from Operating Activities 926 1,356 430
Capital Expenditures -1,212 -1,096 116
Free Cash Flow -287 260 547
Dividends -402 -402 0
Debt Service -100 -128 -28
Change in Net Cash (Debt) -789 -270
FY14 - Consolidated Cash Flow Annex
NOTE: 2014 figures include Tamini
1. Net of assets’ disposal
2. Including Other Fixed Assets Changes, Change in Capital & Other

Investor Relations 45
THIS DOCUMENT HAS BEEN PREPARED BY TERNA S.P.A. (THE “COMPANY”) FOR THE SOLE PURPOSE DESCRIBED HEREIN. IN NO CASE
MAY IT BE INTERPRETED AS AN OFFER OR INVITATION TO SELL OR PURCHASE ANY SECURITY ISSUED BY THE COMPANY OR ITS
SUBSIDIARIES.
THE CONTENT OF THIS DOCUMENT HAS A MERELY INFORMATIVE AND PROVISIONAL NATURE AND THE STATEMENTS CONTAINED HEREIN
HAVE NOT BEEN INDEPENDENTLY VERIFIED. NEITHER THE COMPANY NOR ANY OF ITS REPRESENTATIVES SHALL ACCEPT ANY LIABILITY
WHATSOEVER (WHETHER IN NEGLIGENCE OR OTHERWISE) ARISING IN ANY WAY FROM THE USE OF THIS DOCUMENT OR ITS CONTENTS
OR OTHERWISE ARISING IN CONNECTION WITH THIS DOCUMENT OR ANY MATERIAL DISCUSSED DURING THE PRESENTATION.
THIS DOCUMENT MAY NOT BE REPRODUCED OR REDISTRIBUTED, IN WHOLE OR IN PART, TO ANY OTHER PERSON. THE INFORMATION
CONTAINED HEREIN AND OTHER MATERIAL DISCUSSED AT THE CONFERENCE CALL MAY INCLUDE FORWARD-LOOKING STATEMENTS THAT
ARE NOT HISTORICAL FACTS, INCLUDING STATEMENTS ABOUT THE COMPANY’S BELIEFS AND EXPECTATIONS. THESE STATEMENTS ARE
BASED ON CURRENT PLANS, ESTIMATES, PROJECTIONS AND PROJECTS, AND CANNOT BE INTERPRETED AS A PROMISE OR GUARANTEE
OF WHATSOEVER NATURE.
HOWEVER, FORWARD-LOOKING STATEMENTS INVOLVE INHERENT RISKS AND UNCERTAINTIES AND ARE CURRENT ONLY AT THE DATE
THEY ARE MADE. WE CAUTION YOU THAT A NUMBER OF FACTORS COULD CAUSE THE COMPANY’S ACTUAL RESULTS AND PROVISIONS TO
DIFFER MATERIALLY FROM THOSE CONTAINED IN ANY FORWARD-LOOKING STATEMENT. SUCH FACTORS INCLUDE, BUT ARE NOT LIMITED
TO: TRENDS IN COMPANY’S BUSINESS, ITS ABILITY TO IMPLEMENT COST-CUTTING PLANS, CHANGES IN THE REGULATORY ENVIRONMENT,
DIFFERENT INTERPRETATION OF THE LAW AND REGULATION, ITS ABILITY TO SUCCESSFULLY DIVERSIFY AND THE EXPECTED LEVEL OF
FUTURE CAPITAL EXPENDITURES. THEREFORE, YOU SHOULD NOT PLACE UNDUE RELIANCE ON SUCH FORWARD-LOOKING STATEMENTS.
TERNA DOES NOT UNDERTAKE ANY OBLIGATION TO UPDATE FORWARD-LOOKING STATEMENTS TO REFLECT ANY CHANGES IN TERNA’S
EXPECTATIONS WITH REGARD THERETO OR ANY CHANGES IN EVENTS.
EXECUTIVE IN CHARGE OF THE PREPARATION OF ACCOUNTING DOCUMENTS “PIERPAOLO CRISTOFORI” DECLARES, PURSUANT TO
PARAGRAPH 2 OF ARTICLE 154-BIS OF THE CONSOLIDATED LAW ON FINANCE, THAT THE ACCOUNTING INFORMATION CONTAINED IN THIS
PRESENTATION, FOR WHAT CONCERNS THE ACTUAL FIGURES, CORRESPONDS TO THE DOCUMENT RESULTS, BOOKS AND ACCOUNTING
RECORDS.
THE SORGENTE-RIZZICONI PROJECT AND THE ITALY-FRANCE INTERCONNECTION ARE CO-FINANCED BY THE EUROPEAN UNION’S
EUROPEAN ENERGY PROGRAMME FOR RECOVERY PROGRAMME. THE SOLE RESPONSIBILITY OF THIS PUBLICATION LIES WITH THE
AUTHOR. THE EUROPEAN UNION IS NO RESPONSIBLE FOR ANY USE THAT MAY BE MADE OF THE INFORMATION CONTAINED THEREIN.
Disclaimer Notes
Related Documents


