1 Preferred supplier of quality statistics UNSD working group Emerging trends and best practices in data dissemination Nireen Naidoo Statistics South Africa

Welcome message from author
This document is posted to help you gain knowledge. Please leave a comment to let me know what you think about it! Share it to your friends and learn new things together.
Transcript

1Preferred supplier of quality statistics UNSD working group
Emerging trends and best practices in data dissemination
Nireen Naidoo
Statistics South Africa

2Preferred supplier of quality statistics UNSD working group
Comments on ABS paper
•Well written document with some good insights
•Statistician’s role extends to ensuring effective communication of messages that will guide users to make informed decisions
•Electronic dissemination of publications are free
•Easy access to confidentialised unit records
•The internet is seen as the main channel for information dissemination
•Writing specifically for web dissemination
•Linking metadata to data in a more user-friendly way
•Email notifications of releases
•Self-help guides

3Preferred supplier of quality statistics UNSD working group
Migrating from paper to the web
•SA research shows that a third of stakeholders still want paper-based publications
•Electronic products on CD are the most popular, followed by information received via email and the website*
•Main users of the Stats SA website are academics, students and the private sector
•About 10% are international users
•All libraries receive electronic copies, but still want printed copies
•All government departments, research and educational institutions, parastatals and parliament – free aggregated data in Super Table
•10% sample of Census data
•GHS, LFS etc datasets on CD* 4 main target groups surveyed during stakeholder workshops in all 9 provinces

4Preferred supplier of quality statistics UNSD working group
•Market divided into 11 external market segments
•Stats SA’s policy is:
• To promote the widest possible dissemination of information
•To provide access to all stakeholders
•To provide information at no charge*
•Special data runs are charged at R 300 per hour
•Charged in 1996 – generated R 11 million. Census cost R 450 million
•Value is in the use of the statistics
•Generous with granting permission for 3rd party publications* Some products attract a cost for printing and packaging, but can be downloaded free
from the web. This is to minimise abuse and wastage
Stats SA’s pricing policy

5Preferred supplier of quality statistics UNSD working group

6Preferred supplier of quality statistics UNSD working group

7Preferred supplier of quality statistics UNSD working group
8Preferred supplier of quality statistics UNSD working group

9Preferred supplier of quality statistics UNSD working group
Rules applied to Stats SA’s website
•Ease of navigation
•Quick access
•Ability to find information
•Animations kept to minimum
•Corporate branding
•Two-way communication tool!!
•Feedback is encouraged through various channels
•No log on except for time series
•Regular and immediate updates
•Standardisation of format across website

10Preferred supplier of quality statistics UNSD working group
0%
10%
20%
30%
40%
50%
60%
70%
80%
2003 2004 2005 2006
Finding info (Easy)
Navigation (Easy)
Finding info (Difficult)
Navigation (Difficult)
StatsOnline user feedback for the period November 2003 to January 2006

11Preferred supplier of quality statistics UNSD working group
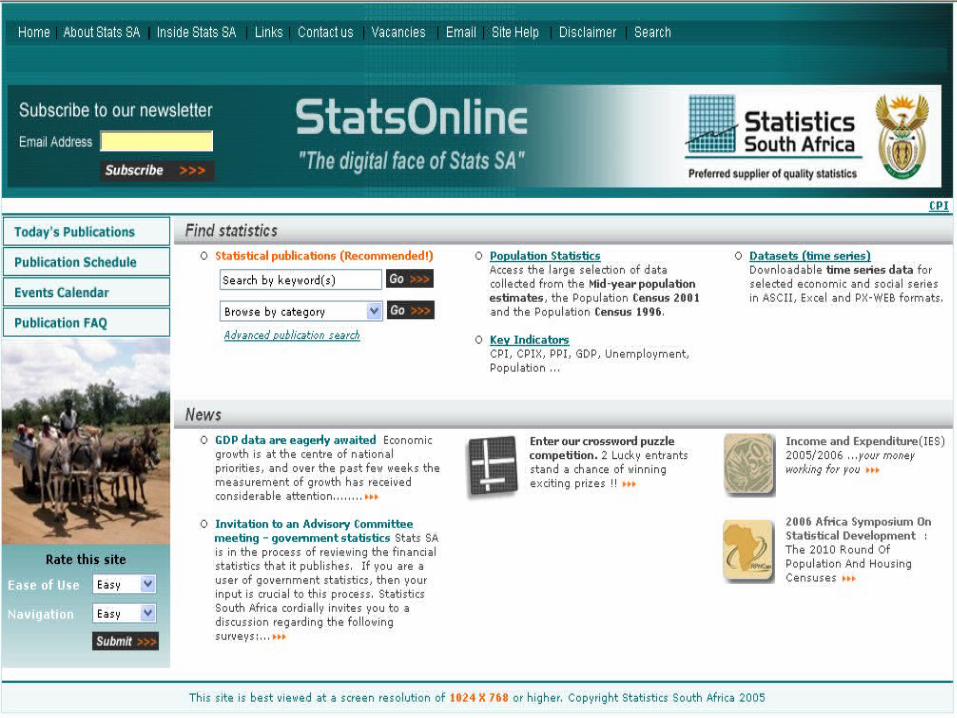
Features on the website
•Interactive tools – PX Web, Digital Census Atlas, Ward Profiles
•Publication search- keyword, group, favourites
•Events calendar & publications schedule
•Frequently asked questions
•News
•Key indicator scroll
•Key findings
•Time series – Excel, PC Axis, Ascii
•Weekly newsletter
•Competitions
•Promote communication through invitations to participate in advisory group meetings, workshops etc
12Preferred supplier of quality statistics UNSD working group
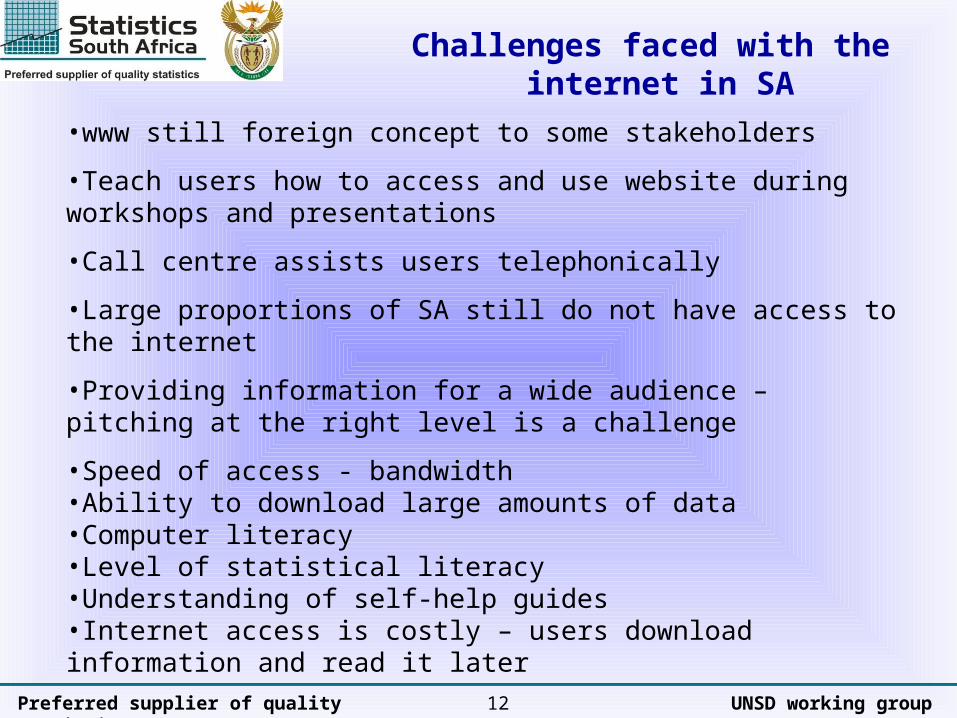
Challenges faced with the internet in SA
•www still foreign concept to some stakeholders
•Teach users how to access and use website during workshops and presentations
•Call centre assists users telephonically
•Large proportions of SA still do not have access to the internet
•Providing information for a wide audience – pitching at the right level is a challenge
•Speed of access - bandwidth•Ability to download large amounts of data•Computer literacy•Level of statistical literacy•Understanding of self-help guides•Internet access is costly – users download information and read it later

13Preferred supplier of quality statistics UNSD working group
Initiatives that will impact on web dissemination
•Writing course – for print and web publications
•Revamp of current releases
•Data warehouse
•Literacy programmes for users and students
•Promotion of the web as first port of call for statistics
•Mind-set of seeing web as a communication tool rather than just a dissemination tool
14Preferred supplier of quality statistics UNSD working group
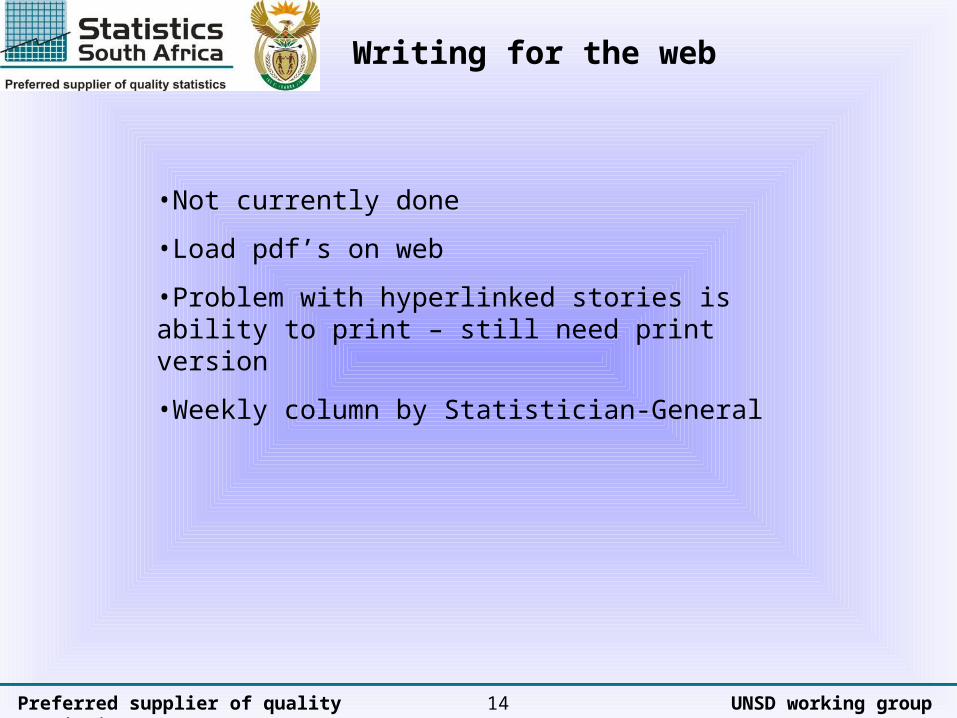
Writing for the web
•Not currently done
•Load pdf’s on web
•Problem with hyperlinked stories is ability to print – still need print version
•Weekly column by Statistician-General

15Preferred supplier of quality statistics UNSD working group
Conclusion
•Statistical agencies responsibility to public to communicate statistics in everyday language
•Web is critical two-way communication tool
•Need to consider audience and their ability to access the web
•Consider country’s adoption of technology
•Linking metadata with data improves understanding of data
•Interactive products give users greater flexibility
•Active dissemination through emails and newsletters needed to promote web usage
•Print publications still have a place in the product mix

16Preferred supplier of quality statistics UNSD working group
Thank you
17Preferred supplier of quality statistics UNSD working group
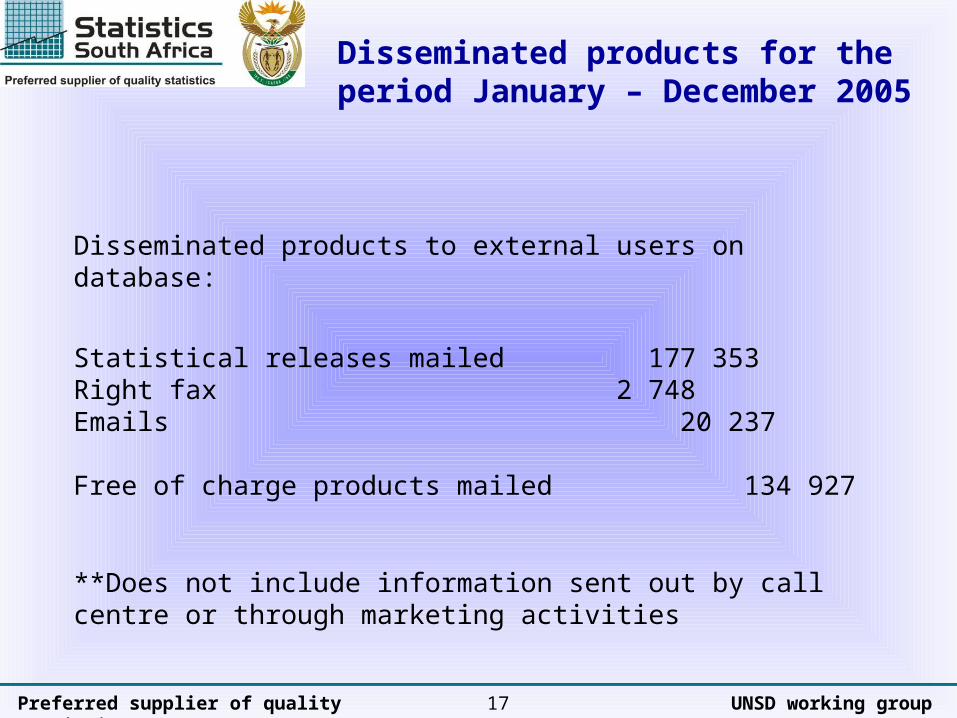
Disseminated products to external users on database:
Statistical releases mailed 177 353 Right fax 2 748 Emails 20 237
Free of charge products mailed 134 927
**Does not include information sent out by call centre or through marketing activities
Disseminated products for the period January – December 2005

18Preferred supplier of quality statistics UNSD working group
Key findings: P0210 - Labour Force Survey (LFS) September 2005
Press statement:658 000 jobs were created between September 2004 and September 2005 according to Stats SA’s Labour Force Survey. There was also an increase in the number of people actively seeking employment, accompanied by a fall in the numbers of discouraged work-seekers who did not actively seek employment in the month prior to September 2005. The growth in the numbers of both employed and unemployed leaves the unemployment rate virtually unchanged at 26,7% in September 2005, as against 26,2% in September 2004.Through the conducting of face-to-face interviews with members of over 30 000 households countrywide, Stats SA estimates that the number of employed in September 2005 exceeded 12 million (12 301 000). This brings the percentage of working-age South Africans (15–65) in employment to over 40%. The number of discouraged work-seekers (those not actively seeking employment opportunities) declined from 3,9 million in September 2004 to 3,3 million in September 2005. Over 600 000 people shifted from being discouraged to actively seeking work or being employed.In the year to September 2005, agricultural employment continued a downward trend but this was more than offset by employment gains in trade (which increased by 482 000 jobs), finance (up 148 000) and construction (up 111 000). Over a longer period, from September 2001 to September 2005, job gains in the labour market were over 1 million (1 120 000), of which 960 000 were in the non-agricultural formal sector.Enquiries: Dr Liz Gavin – (012) 310 8028
Key findings:The unemployment rate remained virtually unchanged at 26,7% in September 2005, as against 26,2% in September 2004, due to the growth in the numbers of both employed and the unemployed. According to Stats SA’s Labour Force Survey, 658 000 jobs were created between September 2004 and September 2005. There was also an increase in the number of people actively seeking employment, accompanied by a fall in the numbers of discouraged work-seekers who did not actively seek employment in the month prior to September 2005. The number of discouraged work-seekers declined from 3,9 million in September 2004 to 3,3 million in September 2005. Over 600 000 people shifted from being discouraged to actively seeking work or being employed. In the year to September 2005, agricultural employment continued a downward trend but this was more than offset by employment gains in trade (which increased by 482 000 jobs), finance (up 148 000) and construction (up 111 000). Over a longer period, from September 2001 to September 2005, job gains in the labour market were over 1 million (1 120 000), of which 960 000 were in the non-agricultural formal sector.

19Preferred supplier of quality statistics UNSD working group
Related Documents