1 H NMR Serum Metabonomics for Understanding Metabolic Dysregulation in Women with Idiopathic Recurrent Spontaneous Miscarriage during Implantation Window Priyanka Banerjee, † Mainak Dutta, † Sudha Srivastava, ‡ Mamata Joshi, ‡ Baidyanath Chakravarty, § and Koel Chaudhury* ,† † School of Medical Science and Technology, Indian Institute of Technology Kharagpur, Kharagpur Pin-721302, India ‡ National Facility for High-field NMR, Tata Institute of Fundamental Research, Mumbai Pin-400005, India § Institute of Reproductive Medicine, Kolkata Pin-700020, India ABSTRACT: In an attempt to find out the association of metabolic dysregulation with poor endometrial receptivity and pregnancy loss, serum metabonomic profiling of women with idiopathic recurrent spontaneous miscarriage (IRSM) is carried out and compared with fertile controls. 1 H nuclear magnetic resonance (NMR)-based metabonomics was used to obtain serum metabolic profiles of 36 women with IRSM and 28 proven fertile women during the window of implantation. The acquired data were analyzed using multivariate principal component analysis, partial least-squares-discriminant analysis, and orthogonal projection to latent structure with discriminant analysis. A clear metabolic differentiation was evident between IRSM and control samples. The distinguishing metabolites, L- lysine, L-arginine, L-glutamine, L-histidine, L-threonine, L-phenylalanine, and L-tyrosine are significantly up-regulated in IRSM as compared to controls. These altered metabolites may be involved in the molecular mechanism of exaggerated inflammatory response and vascular dysfunction associated with poor endometrial receptivity in women with IRSM. The present work proposes a vital association of metabolic dysfunction with the disease pathogenesis. KEYWORDS: NMR, metabonomics, multivariate analysis, idiopathic recurrent spontaneous miscarriage, implantation window ■ INTRODUCTION Recurrent spontaneous miscarriage (RSM) refers to three or more consecutive losses of pregnancy within 24 weeks of gestation. It affects approximately 1−3% of couples attempting to conceive. 1 Various metabolic and endocrinologic abnormal- ities such as diabetes mellitus, polycystic ovary syndrome (PCOS), thyroid disorder, luteal phase defect, and hyper- prolactinemia are considered to be major contributory factors to RSM and associated with approximately 17−20% of the cases. 2 Consequently, there exists a high probability that serum metabolites in women with history of RSM will be differently expressed as compared to proven fertile women. Metabolic profiling has become a valuable platform for the identification of low-molecular weight metabolites and their intermediates present in the biological system at a specific time point. It provides unanticipated insights into the regulation of the cell metabolism, 3 presents clinically useful information related to disease pathogenesis, 4 and identification of diagnostic markers. 5 The analytical techniques that are generally used to identify and quantify metabolites include nuclear magnetic resonance (NMR), 6 liquid chromatography (LC) coupled with mass spectrometry (MS), 7,8 and gas chromatography MS (GC/ MS). 9,10 NMR spectroscopy is an extensively used technique for metabolic fingerprinting and metabolite profiling of biofluids and tissues. 11 The increasing popularity of this technique is its ability to identify and quantify a broad range of metabolites with nominal or no sample preparation. 12 Moreover, the analysis is nondestructive in nature and only a small quantity of the sample is required. 13 The technological advantages of NMR is its rapidity (only 1−15 min is required for profiling of metabolites in a biological sample) and sensitivity to discriminate fine biological differences. 14 Complex matrices, comprising several hundreds of proton signals originating from various metabolites, 15 represent high- resolution 1 H NMR spectroscopy data sets. 15 This complexity can be simplified by the application of two distinct approaches, chemometrics and targeted profiling. In chemometrics, the NMR spectra are separated into different groups with no assumptions about the identity and quantity of metabolites in the spectra. 4,16,17 On the contrary, in targeted profiling, each metabolite in every single NMR spectrum is identified and quantified, so that metabolite concentrations are the variables. 17 Various multivariate statistical methods such as principal Received: April 15, 2014 Published: April 17, 2014 Article pubs.acs.org/jpr © 2014 American Chemical Society 3100 dx.doi.org/10.1021/pr500379n | J. Proteome Res. 2014, 13, 3100−3106

Welcome message from author
This document is posted to help you gain knowledge. Please leave a comment to let me know what you think about it! Share it to your friends and learn new things together.
Transcript
1H NMR Serum Metabonomics for Understanding MetabolicDysregulation in Women with Idiopathic Recurrent SpontaneousMiscarriage during Implantation WindowPriyanka Banerjee,† Mainak Dutta,† Sudha Srivastava,‡ Mamata Joshi,‡ Baidyanath Chakravarty,§
and Koel Chaudhury*,†
†School of Medical Science and Technology, Indian Institute of Technology Kharagpur, Kharagpur Pin-721302, India‡National Facility for High-field NMR, Tata Institute of Fundamental Research, Mumbai Pin-400005, India§Institute of Reproductive Medicine, Kolkata Pin-700020, India
ABSTRACT: In an attempt to find out the association ofmetabolic dysregulation with poor endometrial receptivity andpregnancy loss, serum metabonomic profiling of women withidiopathic recurrent spontaneous miscarriage (IRSM) iscarried out and compared with fertile controls. 1H nuclearmagnetic resonance (NMR)-based metabonomics was used toobtain serum metabolic profiles of 36 women with IRSM and28 proven fertile women during the window of implantation.The acquired data were analyzed using multivariate principalcomponent analysis, partial least-squares-discriminant analysis,and orthogonal projection to latent structure with discriminantanalysis. A clear metabolic differentiation was evident between IRSM and control samples. The distinguishing metabolites, L-lysine, L-arginine, L-glutamine, L-histidine, L-threonine, L-phenylalanine, and L-tyrosine are significantly up-regulated in IRSM ascompared to controls. These altered metabolites may be involved in the molecular mechanism of exaggerated inflammatoryresponse and vascular dysfunction associated with poor endometrial receptivity in women with IRSM. The present workproposes a vital association of metabolic dysfunction with the disease pathogenesis.
KEYWORDS: NMR, metabonomics, multivariate analysis, idiopathic recurrent spontaneous miscarriage, implantation window
■ INTRODUCTION
Recurrent spontaneous miscarriage (RSM) refers to three ormore consecutive losses of pregnancy within 24 weeks ofgestation. It affects approximately 1−3% of couples attemptingto conceive.1 Various metabolic and endocrinologic abnormal-ities such as diabetes mellitus, polycystic ovary syndrome(PCOS), thyroid disorder, luteal phase defect, and hyper-prolactinemia are considered to be major contributory factorsto RSM and associated with approximately 17−20% of thecases.2 Consequently, there exists a high probability that serummetabolites in women with history of RSM will be differentlyexpressed as compared to proven fertile women. Metabolicprofiling has become a valuable platform for the identificationof low-molecular weight metabolites and their intermediatespresent in the biological system at a specific time point. Itprovides unanticipated insights into the regulation of the cellmetabolism,3 presents clinically useful information related todisease pathogenesis,4 and identification of diagnostic markers.5
The analytical techniques that are generally used to identifyand quantify metabolites include nuclear magnetic resonance(NMR),6 liquid chromatography (LC) coupled with massspectrometry (MS),7,8 and gas chromatography MS (GC/MS).9,10
NMR spectroscopy is an extensively used technique formetabolic fingerprinting and metabolite profiling of biofluidsand tissues.11 The increasing popularity of this technique is itsability to identify and quantify a broad range of metaboliteswith nominal or no sample preparation.12 Moreover, theanalysis is nondestructive in nature and only a small quantity ofthe sample is required.13 The technological advantages of NMRis its rapidity (only 1−15 min is required for profiling ofmetabolites in a biological sample) and sensitivity todiscriminate fine biological differences.14
Complex matrices, comprising several hundreds of protonsignals originating from various metabolites,15 represent high-resolution 1H NMR spectroscopy data sets.15 This complexitycan be simplified by the application of two distinct approaches,chemometrics and targeted profiling. In chemometrics, theNMR spectra are separated into different groups with noassumptions about the identity and quantity of metabolites inthe spectra.4,16,17 On the contrary, in targeted profiling, eachmetabolite in every single NMR spectrum is identified andquantified, so that metabolite concentrations are the variables.17
Various multivariate statistical methods such as principal
Received: April 15, 2014Published: April 17, 2014
Article
pubs.acs.org/jpr
© 2014 American Chemical Society 3100 dx.doi.org/10.1021/pr500379n | J. Proteome Res. 2014, 13, 3100−3106
component analysis (PCA), partial least-squares-discriminantanalysis (PLS-DA), and orthogonal projection to latentstructure with discriminant analysis (OPLS-DA) are frequentlyapplied to both these approaches for the analysis of complexdata structures.4,14
When the pathophysiology of recurrent miscarriage remainsunknown, the condition is referred to as unexplained oridiopathic RSM (IRSM). Approximately 50% of the RSM casesare reported to be idiopathic.18 For understanding the alteredcellular metabolism associated with poor endometrial receptiv-ity in women with IRSM, serum metabolic profiles of womenwith IRSM are compared with those of fertile controls duringthe implantation window in the present study. 1H NMRspectroscopy (700 MHz) followed by multivariate statisticalanalysis was used for this purpose.
■ MATERIALS AND METHODS
Subject Selection
Women with IRSM reporting at the Institute of ReproductiveMedicine, Kolkata, India for infertility treatment were enrolledin this study. The study was approved by the Institute EthicsCommittee, and written informed consent was obtained fromall couples.The women were randomly selected from the cohort of
subjects described in our earlier studies.19,20 Briefly, twodifferent groups of subjects were included: (i) women with ahistory of IRSM and (ii) proven fertile women undergoingsterilization (controls) for comparison purposes. The IRSMgroup was composed of 31 women (age < 35 years; BMI ≤ 28)with a history of three or more consecutive miscarriages ofunknown etiology occurring within the first trimester (up to 12weeks of gestation). It was ensured that these women did nothave any other gynecological disorder, had not received anymedication over the past three months, and did not have anyapparent cause of recurrent miscarriage. The control groupconsisted of 28 age and BMI-matched women having normalregular menstrual cycle and parity between 2 to 5. It wasensured that these women have had no failed pregnancies andno other clinical abnormalities.
Sample Collection and Preparation
Following confirmation of ovulation, venous blood sampleswere collected from women of both the groups during day 18−22 of their menstrual cycle. Samples were incubated at roomtemperature for 45 min to allow clotting followed bycentrifugation at 1500 × g for 10 min. Two hundred microliteraliquots of the supernatant (serum) were transferred into sterilecryovials, frozen, and stored at −80 °C.The samples were prepared for NMR analysis, as described
previously.4,5 Briefly, serum samples were thawed andhomogenized before performing the NMR experiments. Twohundred microliters of thawed serum sample was mixed with400 μL of deuterium oxide (D2O) containing 1 mM sodiumsalt of 3-(trimethylsilyl) propionic-2,2,3,3,d4 acid (TSP) andcentrifuged at 8000 rpm for 5 min. From each sample, 600 μLof supernantant was transferred to 5 mm NMR tubes andsubjected to analysis.
NMR Measurements
NMR experiments were performed as discussed earlier.4,5
Briefly, Carr−Purcell−Meiboom−Gill (CPMG)21 spin−echospectra were recorded on a 700 MHz Bruker Avance AV IIIspectrometer at 298 K with 16 K data points each and a total
echo time of 38 ms. The strong signal from the solvent wassuppressed using solvent presaturation pulse sequence. Thespectra were recorded over 512 transients, 16 384 data points(TD), spectral width of 14 000 Hz, and an acquisition time of0.58 s.Prior to Fourier transformation, line broadening of 0.3 Hz
was applied to the FIDs. Phase and baseline correction wasapplied to the resulting spectra using MestReNova version 7.1.0(Mestrelab Research, Santiago de Compostela, Spain).22,23 TSPserved as the chemical shift reference point (δ = 0.00 ppm) anda concentration standard. Metabolites present in the sampleswere identified using earlier published articles and litera-ture.24−28
Data Preprocessing
The spectral region of 0.5 to 4.5 ppm was bucketed/binnedinto 2000 integrated segments of equal frequency window(0.002 ppm) using MestReNova. The region corresponding towater (4.5 to 5.15 ppm) was excluded during binning to avoidpossible artifacts due to presaturation of water. Furthermore,the aromatic region (after 5.15 ppm), which had poor signal-to-noise ratio, was analyzed separately. The binned data matrix of2000 variables were normalized and scaled to the workingregion of 0.5 to 4.5 ppm. The need to analyze metabonomicsdata sets by normalization and Pareto scaling is described byCraig et al.29 and van den Berg et al.30 Normalization (by sum)was performed on the integrated data sets to compensate forthe variation in concentration between the samples and torepresent each data point as a fraction of the total integral valueof the spectra. Following normalization, Pareto scaling wasperformed. This scaling technique divides the mean-centereddata by the square root of the standard deviation to provideequal weight to all variables, irrespective of their absolutevalue.31 The preprocessed data was subjected to multivariatedata analysis using SIMCA 13.0.2 (Umetrics, Sweden).32
Univariate analysis was used to integrate and process thepeaks beyond 5.15 ppm (aromatic region).
Multivariate Statistical Analysis
Following data preprocessing, unsupervised PCA and super-vised classifications including PLS-DA and OPLS-DA wereperformed using SIMCA 13.0.2 (Umetrics, Sweden). PCA,which reduces complexity of multidimensional data sets in anunbiased manner, was initially applied to separate the IRSMcases from controls. General trends, patterns, and outliers wereidentified from the principal component (PC) score plots ofthe reduced dimension data. Following PCA, supervisedclassifications such as PLS-DA and OPLS-DA were used tofurther maximize separation between the two groups.Concentration differences in the metabolites between the twogroups are shown as coefficient of variation plots. A correlationcoefficient of ±0.65 was considered as the threshold to selectthe variables that best correlated with the discriminative scoresof OPLS-DA. R2 and Q2 values are important indicators usedto assess the validity of the model. The OPLS-DA model wascross-validated by permutation analysis using 100 differentmodel permutations.
Quantitative Analysis of Variations in Selected Metabolites
The relaxation property of a particular chemical group mayinfluence the signal intensity of a CPMG spectra. It is, however,presumed that any such influence in signal intensity would beconsistent across samples and thus not affect the relativechanges in metabolite concentration.33 NMR peaks of
Journal of Proteome Research Article
dx.doi.org/10.1021/pr500379n | J. Proteome Res. 2014, 13, 3100−31063101
significantly altered metabolites, identified by multivariatestatistical analysis, were integrated for quantitative measure-ments. MestReNova version 7.1.0 (Mestrelab Research) wasused to integrate individual peaks. Normalization to totalintensity of the spectra was performed by dividing the identifiedpeak integrals within a spectrum by the total integral of thatspectrum. Signal integrals representing significantly alteredmetabolites were then compared between women with IRSMand controls. All integrals were compared using Student’s t test(Ky Plot version 2.0 beta 13 software, Koichi Yoshioka).Statistical significance was considered to be p < 0.05.The aromatic peaks were separately quantified and analyzed
using nonparametric Mann−Whitney U test (Ky Plot version2.0 beta 13 software). A p value < 0.05 was considered to besignificant.
■ RESULTS
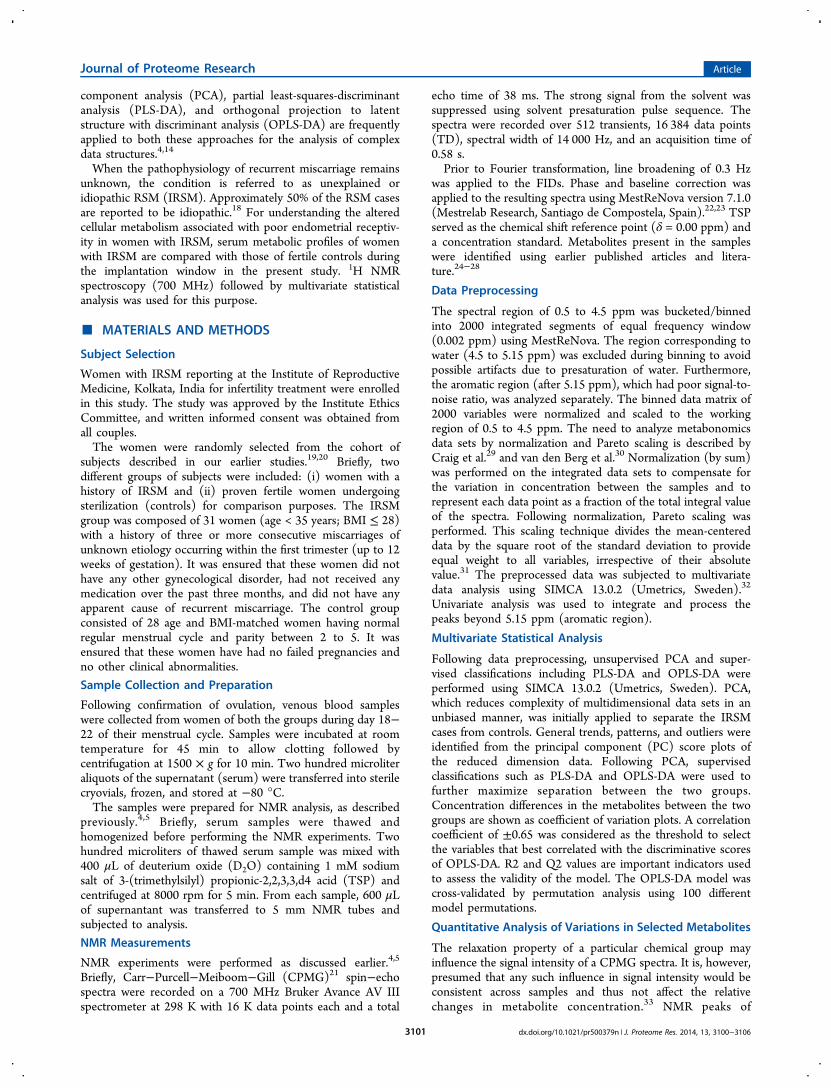
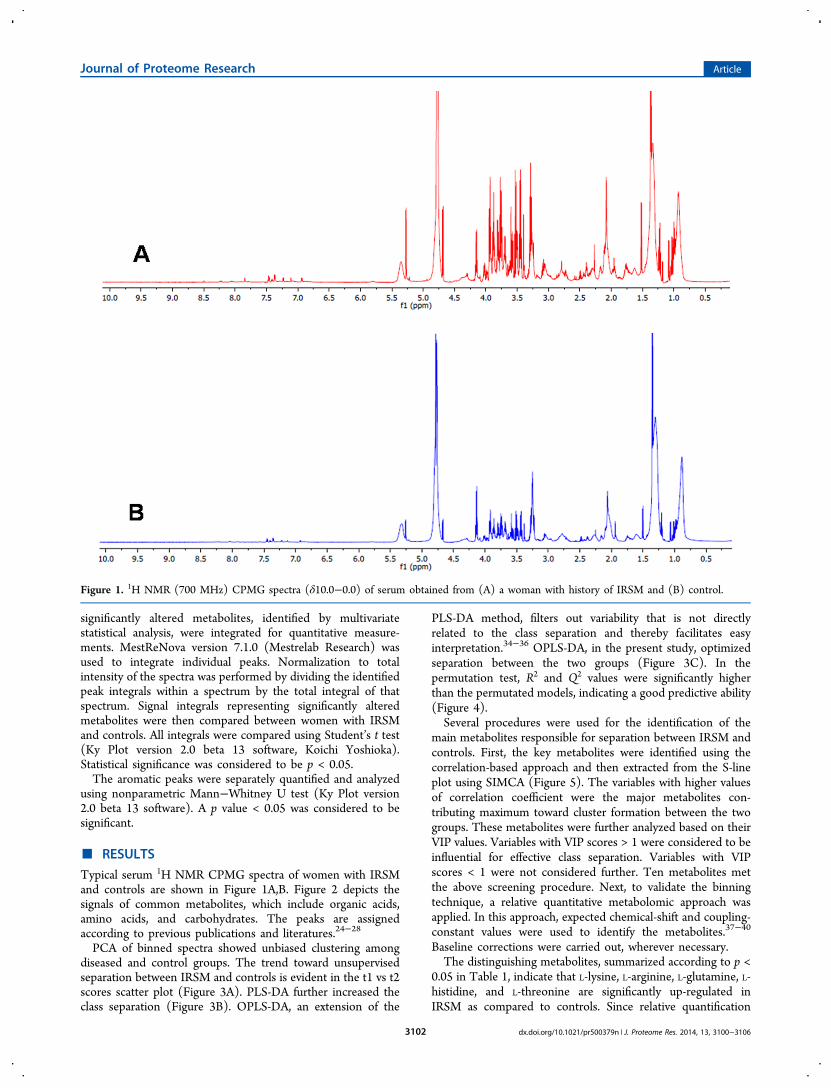
Typical serum 1H NMR CPMG spectra of women with IRSMand controls are shown in Figure 1A,B. Figure 2 depicts thesignals of common metabolites, which include organic acids,amino acids, and carbohydrates. The peaks are assignedaccording to previous publications and literatures.24−28
PCA of binned spectra showed unbiased clustering amongdiseased and control groups. The trend toward unsupervisedseparation between IRSM and controls is evident in the t1 vs t2scores scatter plot (Figure 3A). PLS-DA further increased theclass separation (Figure 3B). OPLS-DA, an extension of the
PLS-DA method, filters out variability that is not directlyrelated to the class separation and thereby facilitates easyinterpretation.34−36 OPLS-DA, in the present study, optimizedseparation between the two groups (Figure 3C). In thepermutation test, R2 and Q2 values were significantly higherthan the permutated models, indicating a good predictive ability(Figure 4).Several procedures were used for the identification of the
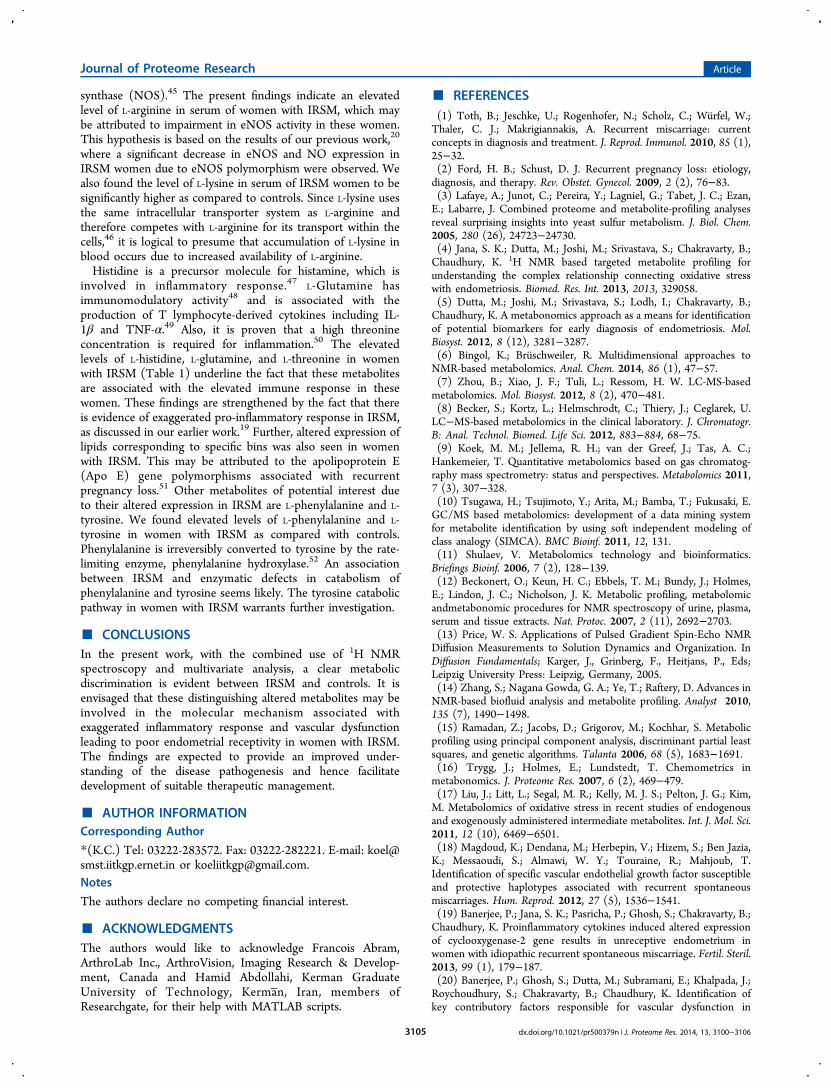
main metabolites responsible for separation between IRSM andcontrols. First, the key metabolites were identified using thecorrelation-based approach and then extracted from the S-lineplot using SIMCA (Figure 5). The variables with higher valuesof correlation coefficient were the major metabolites con-tributing maximum toward cluster formation between the twogroups. These metabolites were further analyzed based on theirVIP values. Variables with VIP scores > 1 were considered to beinfluential for effective class separation. Variables with VIPscores < 1 were not considered further. Ten metabolites metthe above screening procedure. Next, to validate the binningtechnique, a relative quantitative metabolomic approach wasapplied. In this approach, expected chemical-shift and coupling-constant values were used to identify the metabolites.37−40
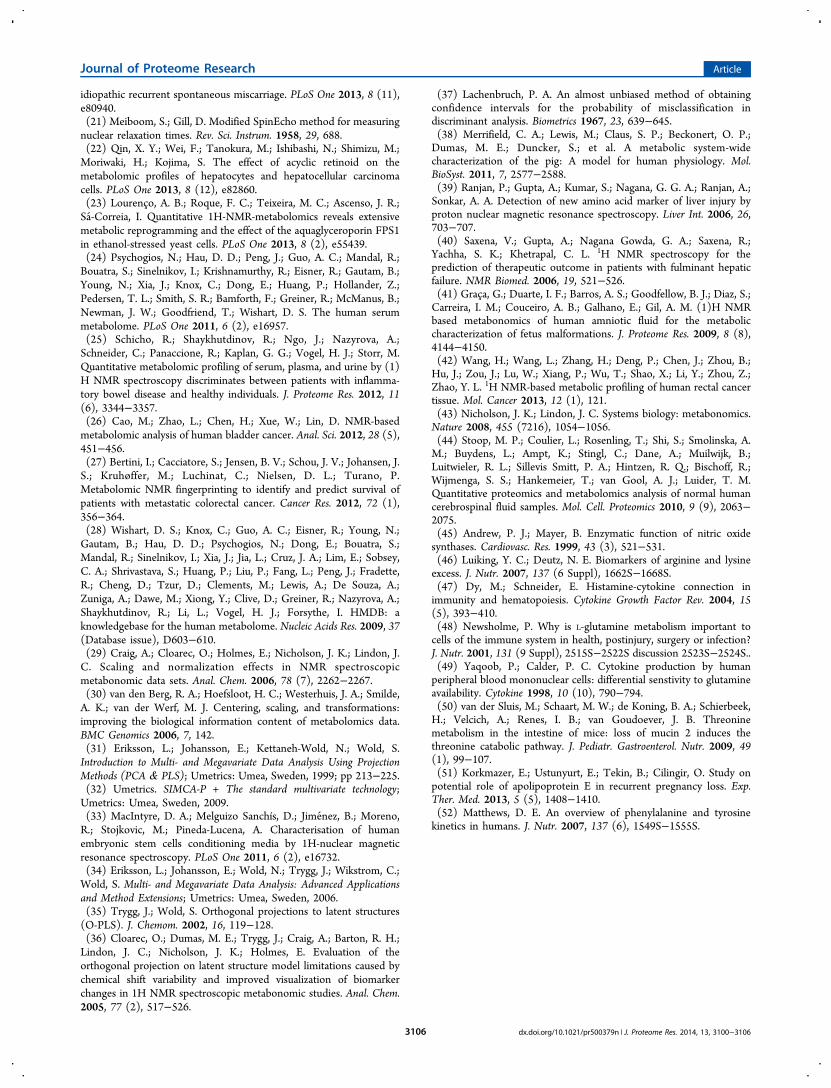
Baseline corrections were carried out, wherever necessary.The distinguishing metabolites, summarized according to p <
0.05 in Table 1, indicate that L-lysine, L-arginine, L-glutamine, L-histidine, and L-threonine are significantly up-regulated inIRSM as compared to controls. Since relative quantification
Figure 1. 1H NMR (700 MHz) CPMG spectra (δ10.0−0.0) of serum obtained from (A) a woman with history of IRSM and (B) control.
Journal of Proteome Research Article
dx.doi.org/10.1021/pr500379n | J. Proteome Res. 2014, 13, 3100−31063102
could not be carried out for the lipoprotein regions due tospectral overlapping, only the first two validation approacheswere relied on to assess its significance. Further, on applyingMann−Whitney U test to the aromatic region, L-phenylalanineand L-tyrosine were found to be significantly increased in IRSMcompared with controls.
■ DISCUSSION
Metabonomics is the study of individual metabolic profilesunder normal and altered or disease-related conditions.41,14 It isan effective tool for understanding potential biologicalalterations,42,11 monitoring disease progression,43 and distin-guishing between diseased and nondiseased states.44 This study,for the first time, attempts to identify differently expressed
metabolites in serum of women with IRSM for an improvedunderstanding of the disease mechanism.Multivariate analysis of the global metabolite profiling clearly
distinguishes women with IRSM from controls. A total of sevenmetabolites were found to be up-regulated in women withIRSM (Table 1). The PCA scores plot shows a clear separationbetween IRSM and controls on the first two components(Figure 3A). An improved class separation was observed inPLS-DA (Figure 3B), whereas OPLS-DA showed an optimizedclass separation (Figure 3C). The robustness of the OPLS-DAmodel is assessed by two parameters: R2 (goodness of fit) andQ2 (predictive ability). The values of R2 (0.882) and Q2 (0.751)in the present OPLS-DA model indicate that the model hasgood fit and can satisfactorily predict IRSM.
Figure 2. 1H NMR (700 MHz) CPMG serum spectrum of a patient with history of IRSM. Numbers indicate the following metabolites: 1, TSP; 2,lipoproteins (LDL and VLDL); 3, unsaturated lipid; 4, creatinine; 5, L-arginine; 6, glycerophosphatidylcholine; 7, D-glucose; 8, ornithine; 9, citrate;10, L-lysine; 11, L-tyrosine; 12, L-histidine; 13, L-phenylalanine; 14, formate; 15, choline; 16, L-threonine; 17, acetate; 18, L-glutamine; 19, succinate;20, acetone; 21, adipic acid; 22, L-isoleucine; 23, alanine; 24, L-aspartate; 25, 3-hydroxybutyric acid; 26, propylene glycol; 27, valine; 28, leucine; 29,creatine; 30, pyruvate; 31, lactate; 32, proline.
Figure 3. Scores scatter plot of (A) PCA showing discrimination between IRSM and controls, (B) PLS-DA showing improved discrimination withR2 = 0.843 and Q2 = 0.709, and (C) OPLS-DA showing optimized discrimination with R2 = 0.882 and Q2 = 0.751.
Journal of Proteome Research Article
dx.doi.org/10.1021/pr500379n | J. Proteome Res. 2014, 13, 3100−31063103
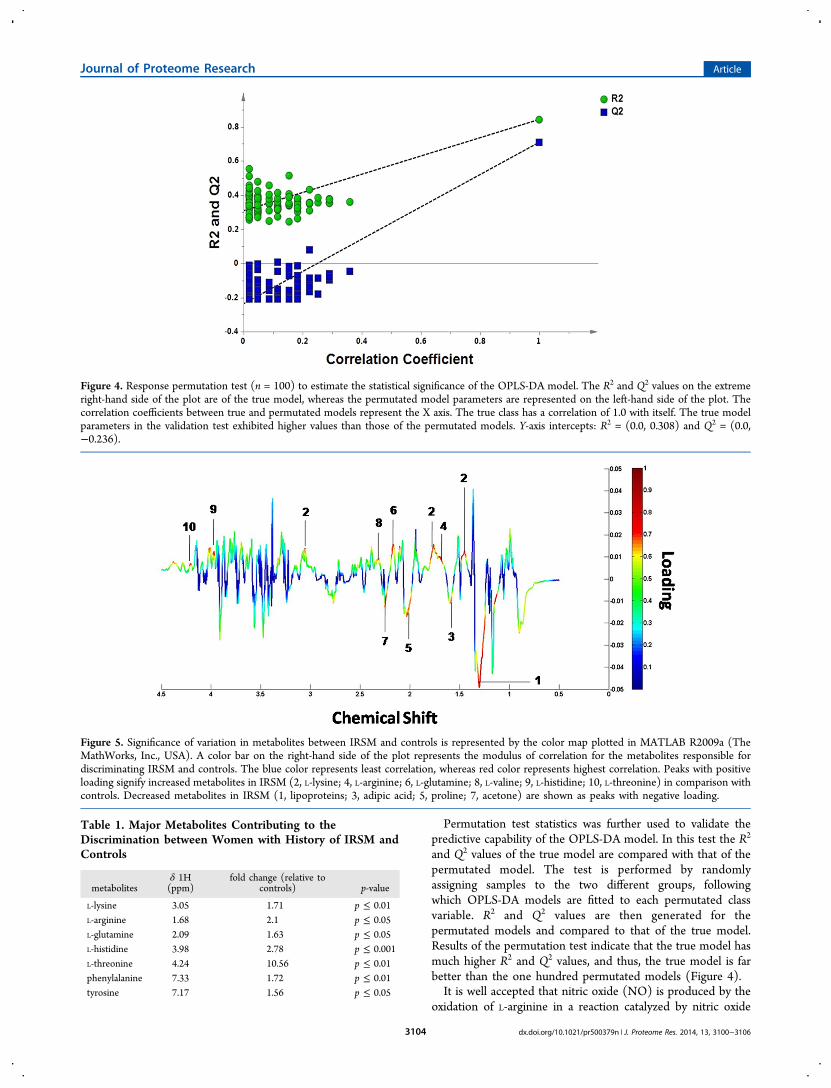
Permutation test statistics was further used to validate thepredictive capability of the OPLS-DA model. In this test the R2
and Q2 values of the true model are compared with that of thepermutated model. The test is performed by randomlyassigning samples to the two different groups, followingwhich OPLS-DA models are fitted to each permutated classvariable. R2 and Q2 values are then generated for thepermutated models and compared to that of the true model.Results of the permutation test indicate that the true model hasmuch higher R2 and Q2 values, and thus, the true model is farbetter than the one hundred permutated models (Figure 4).It is well accepted that nitric oxide (NO) is produced by the
oxidation of L-arginine in a reaction catalyzed by nitric oxide
Figure 4. Response permutation test (n = 100) to estimate the statistical significance of the OPLS-DA model. The R2 and Q2 values on the extremeright-hand side of the plot are of the true model, whereas the permutated model parameters are represented on the left-hand side of the plot. Thecorrelation coefficients between true and permutated models represent the X axis. The true class has a correlation of 1.0 with itself. The true modelparameters in the validation test exhibited higher values than those of the permutated models. Y-axis intercepts: R2 = (0.0, 0.308) and Q2 = (0.0,−0.236).
Figure 5. Significance of variation in metabolites between IRSM and controls is represented by the color map plotted in MATLAB R2009a (TheMathWorks, Inc., USA). A color bar on the right-hand side of the plot represents the modulus of correlation for the metabolites responsible fordiscriminating IRSM and controls. The blue color represents least correlation, whereas red color represents highest correlation. Peaks with positiveloading signify increased metabolites in IRSM (2, L-lysine; 4, L-arginine; 6, L-glutamine; 8, L-valine; 9, L-histidine; 10, L-threonine) in comparison withcontrols. Decreased metabolites in IRSM (1, lipoproteins; 3, adipic acid; 5, proline; 7, acetone) are shown as peaks with negative loading.
Table 1. Major Metabolites Contributing to theDiscrimination between Women with History of IRSM andControls
metabolitesδ 1H(ppm)
fold change (relative tocontrols) p-value
L-lysine 3.05 1.71 p ≤ 0.01L-arginine 1.68 2.1 p ≤ 0.05L-glutamine 2.09 1.63 p ≤ 0.05L-histidine 3.98 2.78 p ≤ 0.001L-threonine 4.24 10.56 p ≤ 0.01phenylalanine 7.33 1.72 p ≤ 0.01tyrosine 7.17 1.56 p ≤ 0.05
Journal of Proteome Research Article
dx.doi.org/10.1021/pr500379n | J. Proteome Res. 2014, 13, 3100−31063104
synthase (NOS).45 The present findings indicate an elevatedlevel of L-arginine in serum of women with IRSM, which maybe attributed to impairment in eNOS activity in these women.This hypothesis is based on the results of our previous work,20
where a significant decrease in eNOS and NO expression inIRSM women due to eNOS polymorphism were observed. Wealso found the level of L-lysine in serum of IRSM women to besignificantly higher as compared to controls. Since L-lysine usesthe same intracellular transporter system as L-arginine andtherefore competes with L-arginine for its transport within thecells,46 it is logical to presume that accumulation of L-lysine inblood occurs due to increased availability of L-arginine.Histidine is a precursor molecule for histamine, which is
involved in inflammatory response.47 L-Glutamine hasimmunomodulatory activity48 and is associated with theproduction of T lymphocyte-derived cytokines including IL-1β and TNF-α.49 Also, it is proven that a high threonineconcentration is required for inflammation.50 The elevatedlevels of L-histidine, L-glutamine, and L-threonine in womenwith IRSM (Table 1) underline the fact that these metabolitesare associated with the elevated immune response in thesewomen. These findings are strengthened by the fact that thereis evidence of exaggerated pro-inflammatory response in IRSM,as discussed in our earlier work.19 Further, altered expression oflipids corresponding to specific bins was also seen in womenwith IRSM. This may be attributed to the apolipoprotein E(Apo E) gene polymorphisms associated with recurrentpregnancy loss.51 Other metabolites of potential interest dueto their altered expression in IRSM are L-phenylalanine and L-tyrosine. We found elevated levels of L-phenylalanine and L-tyrosine in women with IRSM as compared with controls.Phenylalanine is irreversibly converted to tyrosine by the rate-limiting enzyme, phenylalanine hydroxylase.52 An associationbetween IRSM and enzymatic defects in catabolism ofphenylalanine and tyrosine seems likely. The tyrosine catabolicpathway in women with IRSM warrants further investigation.
■ CONCLUSIONSIn the present work, with the combined use of 1H NMRspectroscopy and multivariate analysis, a clear metabolicdiscrimination is evident between IRSM and controls. It isenvisaged that these distinguishing altered metabolites may beinvolved in the molecular mechanism associated withexaggerated inflammatory response and vascular dysfunctionleading to poor endometrial receptivity in women with IRSM.The findings are expected to provide an improved under-standing of the disease pathogenesis and hence facilitatedevelopment of suitable therapeutic management.
■ AUTHOR INFORMATIONCorresponding Author
*(K.C.) Tel: 03222-283572. Fax: 03222-282221. E-mail: [email protected] or [email protected]
The authors declare no competing financial interest.
■ ACKNOWLEDGMENTSThe authors would like to acknowledge Francois Abram,ArthroLab Inc., ArthroVision, Imaging Research & Develop-ment, Canada and Hamid Abdollahi, Kerman GraduateUniversity of Technology, Kerma n, Iran, members ofResearchgate, for their help with MATLAB scripts.
■ REFERENCES(1) Toth, B.; Jeschke, U.; Rogenhofer, N.; Scholz, C.; Wurfel, W.;Thaler, C. J.; Makrigiannakis, A. Recurrent miscarriage: currentconcepts in diagnosis and treatment. J. Reprod. Immunol. 2010, 85 (1),25−32.(2) Ford, H. B.; Schust, D. J. Recurrent pregnancy loss: etiology,diagnosis, and therapy. Rev. Obstet. Gynecol. 2009, 2 (2), 76−83.(3) Lafaye, A.; Junot, C.; Pereira, Y.; Lagniel, G.; Tabet, J. C.; Ezan,E.; Labarre, J. Combined proteome and metabolite-profiling analysesreveal surprising insights into yeast sulfur metabolism. J. Biol. Chem.2005, 280 (26), 24723−24730.(4) Jana, S. K.; Dutta, M.; Joshi, M.; Srivastava, S.; Chakravarty, B.;Chaudhury, K. 1H NMR based targeted metabolite profiling forunderstanding the complex relationship connecting oxidative stresswith endometriosis. Biomed. Res. Int. 2013, 2013, 329058.(5) Dutta, M.; Joshi, M.; Srivastava, S.; Lodh, I.; Chakravarty, B.;Chaudhury, K. A metabonomics approach as a means for identificationof potential biomarkers for early diagnosis of endometriosis. Mol.Biosyst. 2012, 8 (12), 3281−3287.(6) Bingol, K.; Bruschweiler, R. Multidimensional approaches toNMR-based metabolomics. Anal. Chem. 2014, 86 (1), 47−57.(7) Zhou, B.; Xiao, J. F.; Tuli, L.; Ressom, H. W. LC-MS-basedmetabolomics. Mol. Biosyst. 2012, 8 (2), 470−481.(8) Becker, S.; Kortz, L.; Helmschrodt, C.; Thiery, J.; Ceglarek, U.LC−MS-based metabolomics in the clinical laboratory. J. Chromatogr.B: Anal. Technol. Biomed. Life Sci. 2012, 883−884, 68−75.(9) Koek, M. M.; Jellema, R. H.; van der Greef, J.; Tas, A. C.;Hankemeier, T. Quantitative metabolomics based on gas chromatog-raphy mass spectrometry: status and perspectives. Metabolomics 2011,7 (3), 307−328.(10) Tsugawa, H.; Tsujimoto, Y.; Arita, M.; Bamba, T.; Fukusaki, E.GC/MS based metabolomics: development of a data mining systemfor metabolite identification by using soft independent modeling ofclass analogy (SIMCA). BMC Bioinf. 2011, 12, 131.(11) Shulaev, V. Metabolomics technology and bioinformatics.Briefings Bioinf. 2006, 7 (2), 128−139.(12) Beckonert, O.; Keun, H. C.; Ebbels, T. M.; Bundy, J.; Holmes,E.; Lindon, J. C.; Nicholson, J. K. Metabolic profiling, metabolomicandmetabonomic procedures for NMR spectroscopy of urine, plasma,serum and tissue extracts. Nat. Protoc. 2007, 2 (11), 2692−2703.(13) Price, W. S. Applications of Pulsed Gradient Spin-Echo NMRDiffusion Measurements to Solution Dynamics and Organization. InDiffusion Fundamentals; Karger, J., Grinberg, F., Heitjans, P., Eds;Leipzig University Press: Leipzig, Germany, 2005.(14) Zhang, S.; Nagana Gowda, G. A.; Ye, T.; Raftery, D. Advances inNMR-based biofluid analysis and metabolite profiling. Analyst 2010,135 (7), 1490−1498.(15) Ramadan, Z.; Jacobs, D.; Grigorov, M.; Kochhar, S. Metabolicprofiling using principal component analysis, discriminant partial leastsquares, and genetic algorithms. Talanta 2006, 68 (5), 1683−1691.(16) Trygg, J.; Holmes, E.; Lundstedt, T. Chemometrics inmetabonomics. J. Proteome Res. 2007, 6 (2), 469−479.(17) Liu, J.; Litt, L.; Segal, M. R.; Kelly, M. J. S.; Pelton, J. G.; Kim,M. Metabolomics of oxidative stress in recent studies of endogenousand exogenously administered intermediate metabolites. Int. J. Mol. Sci.2011, 12 (10), 6469−6501.(18) Magdoud, K.; Dendana, M.; Herbepin, V.; Hizem, S.; Ben Jazia,K.; Messaoudi, S.; Almawi, W. Y.; Touraine, R.; Mahjoub, T.Identification of specific vascular endothelial growth factor susceptibleand protective haplotypes associated with recurrent spontaneousmiscarriages. Hum. Reprod. 2012, 27 (5), 1536−1541.(19) Banerjee, P.; Jana, S. K.; Pasricha, P.; Ghosh, S.; Chakravarty, B.;Chaudhury, K. Proinflammatory cytokines induced altered expressionof cyclooxygenase-2 gene results in unreceptive endometrium inwomen with idiopathic recurrent spontaneous miscarriage. Fertil. Steril.2013, 99 (1), 179−187.(20) Banerjee, P.; Ghosh, S.; Dutta, M.; Subramani, E.; Khalpada, J.;Roychoudhury, S.; Chakravarty, B.; Chaudhury, K. Identification ofkey contributory factors responsible for vascular dysfunction in
Journal of Proteome Research Article
dx.doi.org/10.1021/pr500379n | J. Proteome Res. 2014, 13, 3100−31063105
idiopathic recurrent spontaneous miscarriage. PLoS One 2013, 8 (11),e80940.(21) Meiboom, S.; Gill, D. Modified SpinEcho method for measuringnuclear relaxation times. Rev. Sci. Instrum. 1958, 29, 688.(22) Qin, X. Y.; Wei, F.; Tanokura, M.; Ishibashi, N.; Shimizu, M.;Moriwaki, H.; Kojima, S. The effect of acyclic retinoid on themetabolomic profiles of hepatocytes and hepatocellular carcinomacells. PLoS One 2013, 8 (12), e82860.(23) Lourenco, A. B.; Roque, F. C.; Teixeira, M. C.; Ascenso, J. R.;Sa-Correia, I. Quantitative 1H-NMR-metabolomics reveals extensivemetabolic reprogramming and the effect of the aquaglyceroporin FPS1in ethanol-stressed yeast cells. PLoS One 2013, 8 (2), e55439.(24) Psychogios, N.; Hau, D. D.; Peng, J.; Guo, A. C.; Mandal, R.;Bouatra, S.; Sinelnikov, I.; Krishnamurthy, R.; Eisner, R.; Gautam, B.;Young, N.; Xia, J.; Knox, C.; Dong, E.; Huang, P.; Hollander, Z.;Pedersen, T. L.; Smith, S. R.; Bamforth, F.; Greiner, R.; McManus, B.;Newman, J. W.; Goodfriend, T.; Wishart, D. S. The human serummetabolome. PLoS One 2011, 6 (2), e16957.(25) Schicho, R.; Shaykhutdinov, R.; Ngo, J.; Nazyrova, A.;Schneider, C.; Panaccione, R.; Kaplan, G. G.; Vogel, H. J.; Storr, M.Quantitative metabolomic profiling of serum, plasma, and urine by (1)H NMR spectroscopy discriminates between patients with inflamma-tory bowel disease and healthy individuals. J. Proteome Res. 2012, 11(6), 3344−3357.(26) Cao, M.; Zhao, L.; Chen, H.; Xue, W.; Lin, D. NMR-basedmetabolomic analysis of human bladder cancer. Anal. Sci. 2012, 28 (5),451−456.(27) Bertini, I.; Cacciatore, S.; Jensen, B. V.; Schou, J. V.; Johansen, J.S.; Kruhøffer, M.; Luchinat, C.; Nielsen, D. L.; Turano, P.Metabolomic NMR fingerprinting to identify and predict survival ofpatients with metastatic colorectal cancer. Cancer Res. 2012, 72 (1),356−364.(28) Wishart, D. S.; Knox, C.; Guo, A. C.; Eisner, R.; Young, N.;Gautam, B.; Hau, D. D.; Psychogios, N.; Dong, E.; Bouatra, S.;Mandal, R.; Sinelnikov, I.; Xia, J.; Jia, L.; Cruz, J. A.; Lim, E.; Sobsey,C. A.; Shrivastava, S.; Huang, P.; Liu, P.; Fang, L.; Peng, J.; Fradette,R.; Cheng, D.; Tzur, D.; Clements, M.; Lewis, A.; De Souza, A.;Zuniga, A.; Dawe, M.; Xiong, Y.; Clive, D.; Greiner, R.; Nazyrova, A.;Shaykhutdinov, R.; Li, L.; Vogel, H. J.; Forsythe, I. HMDB: aknowledgebase for the human metabolome. Nucleic Acids Res. 2009, 37(Database issue), D603−610.(29) Craig, A.; Cloarec, O.; Holmes, E.; Nicholson, J. K.; Lindon, J.C. Scaling and normalization effects in NMR spectroscopicmetabonomic data sets. Anal. Chem. 2006, 78 (7), 2262−2267.(30) van den Berg, R. A.; Hoefsloot, H. C.; Westerhuis, J. A.; Smilde,A. K.; van der Werf, M. J. Centering, scaling, and transformations:improving the biological information content of metabolomics data.BMC Genomics 2006, 7, 142.(31) Eriksson, L.; Johansson, E.; Kettaneh-Wold, N.; Wold, S.Introduction to Multi- and Megavariate Data Analysis Using ProjectionMethods (PCA & PLS); Umetrics: Umea, Sweden, 1999; pp 213−225.(32) Umetrics. SIMCA-P + The standard multivariate technology;Umetrics: Umea, Sweden, 2009.(33) MacIntyre, D. A.; Melguizo Sanchís, D.; Jimenez, B.; Moreno,R.; Stojkovic, M.; Pineda-Lucena, A. Characterisation of humanembryonic stem cells conditioning media by 1H-nuclear magneticresonance spectroscopy. PLoS One 2011, 6 (2), e16732.(34) Eriksson, L.; Johansson, E.; Wold, N.; Trygg, J.; Wikstrom, C.;Wold, S. Multi- and Megavariate Data Analysis: Advanced Applicationsand Method Extensions; Umetrics: Umea, Sweden, 2006.(35) Trygg, J.; Wold, S. Orthogonal projections to latent structures(O-PLS). J. Chemom. 2002, 16, 119−128.(36) Cloarec, O.; Dumas, M. E.; Trygg, J.; Craig, A.; Barton, R. H.;Lindon, J. C.; Nicholson, J. K.; Holmes, E. Evaluation of theorthogonal projection on latent structure model limitations caused bychemical shift variability and improved visualization of biomarkerchanges in 1H NMR spectroscopic metabonomic studies. Anal. Chem.2005, 77 (2), 517−526.
(37) Lachenbruch, P. A. An almost unbiased method of obtainingconfidence intervals for the probability of misclassification indiscriminant analysis. Biometrics 1967, 23, 639−645.(38) Merrifield, C. A.; Lewis, M.; Claus, S. P.; Beckonert, O. P.;Dumas, M. E.; Duncker, S.; et al. A metabolic system-widecharacterization of the pig: A model for human physiology. Mol.BioSyst. 2011, 7, 2577−2588.(39) Ranjan, P.; Gupta, A.; Kumar, S.; Nagana, G. G. A.; Ranjan, A.;Sonkar, A. A. Detection of new amino acid marker of liver injury byproton nuclear magnetic resonance spectroscopy. Liver Int. 2006, 26,703−707.(40) Saxena, V.; Gupta, A.; Nagana Gowda, G. A.; Saxena, R.;Yachha, S. K.; Khetrapal, C. L. 1H NMR spectroscopy for theprediction of therapeutic outcome in patients with fulminant hepaticfailure. NMR Biomed. 2006, 19, 521−526.(41) Graca, G.; Duarte, I. F.; Barros, A. S.; Goodfellow, B. J.; Diaz, S.;Carreira, I. M.; Couceiro, A. B.; Galhano, E.; Gil, A. M. (1)H NMRbased metabonomics of human amniotic fluid for the metaboliccharacterization of fetus malformations. J. Proteome Res. 2009, 8 (8),4144−4150.(42) Wang, H.; Wang, L.; Zhang, H.; Deng, P.; Chen, J.; Zhou, B.;Hu, J.; Zou, J.; Lu, W.; Xiang, P.; Wu, T.; Shao, X.; Li, Y.; Zhou, Z.;Zhao, Y. L. 1H NMR-based metabolic profiling of human rectal cancertissue. Mol. Cancer 2013, 12 (1), 121.(43) Nicholson, J. K.; Lindon, J. C. Systems biology: metabonomics.Nature 2008, 455 (7216), 1054−1056.(44) Stoop, M. P.; Coulier, L.; Rosenling, T.; Shi, S.; Smolinska, A.M.; Buydens, L.; Ampt, K.; Stingl, C.; Dane, A.; Muilwijk, B.;Luitwieler, R. L.; Sillevis Smitt, P. A.; Hintzen, R. Q.; Bischoff, R.;Wijmenga, S. S.; Hankemeier, T.; van Gool, A. J.; Luider, T. M.Quantitative proteomics and metabolomics analysis of normal humancerebrospinal fluid samples. Mol. Cell. Proteomics 2010, 9 (9), 2063−2075.(45) Andrew, P. J.; Mayer, B. Enzymatic function of nitric oxidesynthases. Cardiovasc. Res. 1999, 43 (3), 521−531.(46) Luiking, Y. C.; Deutz, N. E. Biomarkers of arginine and lysineexcess. J. Nutr. 2007, 137 (6 Suppl), 1662S−1668S.(47) Dy, M.; Schneider, E. Histamine-cytokine connection inimmunity and hematopoiesis. Cytokine Growth Factor Rev. 2004, 15(5), 393−410.(48) Newsholme, P. Why is L-glutamine metabolism important tocells of the immune system in health, postinjury, surgery or infection?J. Nutr. 2001, 131 (9 Suppl), 2515S−2522S discussion 2523S−2524S..(49) Yaqoob, P.; Calder, P. C. Cytokine production by humanperipheral blood mononuclear cells: differential senstivity to glutamineavailability. Cytokine 1998, 10 (10), 790−794.(50) van der Sluis, M.; Schaart, M. W.; de Koning, B. A.; Schierbeek,H.; Velcich, A.; Renes, I. B.; van Goudoever, J. B. Threoninemetabolism in the intestine of mice: loss of mucin 2 induces thethreonine catabolic pathway. J. Pediatr. Gastroenterol. Nutr. 2009, 49(1), 99−107.(51) Korkmazer, E.; Ustunyurt, E.; Tekin, B.; Cilingir, O. Study onpotential role of apolipoprotein E in recurrent pregnancy loss. Exp.Ther. Med. 2013, 5 (5), 1408−1410.(52) Matthews, D. E. An overview of phenylalanine and tyrosinekinetics in humans. J. Nutr. 2007, 137 (6), 1549S−1555S.
Journal of Proteome Research Article
dx.doi.org/10.1021/pr500379n | J. Proteome Res. 2014, 13, 3100−31063106
Related Documents