Proceedings of ESDA06 8th Biennial Conference on Engineering Systems Design and Analysis July 4-7, 2006, Torino, Italy Copyright © 2006 by ASME 1 ESDA2006-95556 1D MODELLING AND SIMULATION OF A PIEZO INJECTOR FOR SPRAY GUIDED GASOLINE DIRECT INJECTION SYSTEMS Marco Antonelli, Luigi Martorano, Luca Nuti, Michele Provenzale Università degli Studi di Pisa, Dipartimento di Energetica Via Diotisalvi 2 – 56123 Pisa Tel. +39 050 2217132-126, Fax +39 050 2217150 E-mail: [email protected] Luca Matteucci Siemens VDO Automotive E-mail: [email protected] ABSTRACT The aim of this work was the modelling and the simulation of the Piezo injector, developed by Siemens VDO Automotive for “spray guided” Gasoline Direct Injection (GDI) systems. The development of the model was based on a 1D lumped parameter approach, which was performed in the AMESim environment. The injector was accurately modelled in its three subsystems, namely the piezo actuator, the thermal compensator and the valve body, in order to have a complete control on its behaviour. The reliability and the accuracy of the models of each subsystem were evaluated through comparisons with experiments for various operating points. The last part of this work describes some applications where the model was used and it demonstrates how accurate modelling and simulation may allow a real contribution in the understanding and optimization of the injector behaviour, reducing time and costs that are involved in an only experimental analysis. INTRODUCTION The traffic of internal combustion engine propelled vehicles is a sensible factor of pollutants generation. In urban areas, or anyway with an high grade of population density, particularly in the most industrialized countries, represents by far the major source of air pollution that, locally, sometimes also in connection with unfavourable atmospheric conditions, can reach harmful levels for human health. The emitted pollutants are evaluated following standard test procedures, as for instance the one for Europe (EURO3, EURO4) or FTPLA4 (Federal Test Procedure Los Angeles 4) for USA. The complying with the standards is generally obtained with the application of catalytic converters that broadly consists in 3- way catalysts. Anyway at present a new problem is facing, namely the production of carbon dioxide (CO 2 ), the major cause of the “greenhouse” effect. Following Kyoto Agreement, the countries which accepted the proposals, are committed to not increase the CO 2 emissions; in such context the European Union decided a limit of 140 g/km for passenger cars commencing from 2008 [1][2][3][4]. Practically a CO 2 reduction means a fuel consumption reduction, in fact all the fuel presently in use contain carbon. At present gasoline direct injection systems (fuel injected directly into the combustion chamber) were introduced in order to get that target. There are several advantages using this technique: • At low load, where the improvement is more effective, the load is directly controlled by the quantity of fuel injected without any further obstacle to the air inlet • The capability to reduce dramatically the heat exchange, in fact, following the charge stratification technique, the rich mixture cloud is located nearly in the center of the combustion chamber, very close to spark-plug electrodes, while the extremely lean charge, mainly air, very close to the cylinder walls is much colder • The capability to use an higher compression ratio (up to 12.5:1) in fact the fuel vaporization reduces the temperature avoiding the detonation [5]. Regarding pollutants formation GDI produces very low emissions of carbon monoxide (CO) and unburned hydrocarbons (HC). On the other side it presents higher emissions of nitrogen oxides (NO x ) and of particulate matter (PM). In this sense GDI has a behaviour very similar to diesel engines with which has in common operations with a large air excess. However GDI appears a promising technique in view of a fuel consumption, and so of CO 2 , reduction: globally for what concerns the fuel consumption, in terms of “lean burn”, the advantage is 20%, while during high load operations with 1 Copyright © 2006 by ASME Proceedings of ESDA2006 8th Biennial ASME Conference on Engineering Systems Design and Analysis July 4-7, 2006, Torino, Italy ESDA2006-95556 Downloaded From: https://proceedings.asmedigitalcollection.asme.org on 06/19/2019 Terms of Use: http://www.asme.org/about-asme/terms-of-use

Welcome message from author
This document is posted to help you gain knowledge. Please leave a comment to let me know what you think about it! Share it to your friends and learn new things together.
Transcript

Proceedings of ESDA06 8th Biennial Conference on Engineering Systems Design and Analysis
July 4-7, 2006, Torino, Italy
ESDA2006-95556
1D MODELLING AND SIMULATION OF A PIEZO INJECTOR FOR SPRAY GUIDED GASOLINE DIRECT INJECTION SYSTEMS
Marco Antonelli, Luigi Martorano, Luca Nuti, Michele Provenzale Università degli Studi di Pisa, Dipartimento di Energetica
Via Diotisalvi 2 – 56123 Pisa Tel. +39 050 2217132-126, Fax +39 050 2217150
E-mail: [email protected]
Luca Matteucci Siemens VDO Automotive
E-mail: [email protected]
Proceedings of ESDA2006 8th Biennial ASME Conference on Engineering Systems Design and Analysis
July 4-7, 2006, Torino, Italy
ESDA2006-95556
Do
ABSTRACT The aim of this work was the modelling and the simulation
of the Piezo injector, developed by Siemens VDO Automotive for “spray guided” Gasoline Direct Injection (GDI) systems.
The development of the model was based on a 1D lumped parameter approach, which was performed in the AMESim environment. The injector was accurately modelled in its three subsystems, namely the piezo actuator, the thermal compensator and the valve body, in order to have a complete control on its behaviour.
The reliability and the accuracy of the models of each subsystem were evaluated through comparisons with experiments for various operating points.
The last part of this work describes some applications where the model was used and it demonstrates how accurate modelling and simulation may allow a real contribution in the understanding and optimization of the injector behaviour, reducing time and costs that are involved in an only experimental analysis.
INTRODUCTION
The traffic of internal combustion engine propelled vehicles is a sensible factor of pollutants generation. In urban areas, or anyway with an high grade of population density, particularly in the most industrialized countries, represents by far the major source of air pollution that, locally, sometimes also in connection with unfavourable atmospheric conditions, can reach harmful levels for human health. The emitted pollutants are evaluated following standard test procedures, as for instance the one for Europe (EURO3, EURO4) or FTPLA4 (Federal Test Procedure Los Angeles 4) for USA.
The complying with the standards is generally obtained with the application of catalytic converters that broadly consists in 3-way catalysts. Anyway at present a new problem is facing,
wnloaded From: https://proceedings.asmedigitalcollection.asme.org on 06/19/2019 Terms of U
namely the production of carbon dioxide (CO2), the major cause of the “greenhouse” effect. Following Kyoto Agreement, the countries which accepted the proposals, are committed to not increase the CO2 emissions; in such context the European Union decided a limit of 140 g/km for passenger cars commencing from 2008 [1][2][3][4]. Practically a CO2 reduction means a fuel consumption reduction, in fact all the fuel presently in use contain carbon. At present gasoline direct injection systems (fuel injected directly into the combustion chamber) were introduced in order to get that target. There are several advantages using this technique: • At low load, where the improvement is more effective, the load is directly controlled by the quantity of fuel injected without any further obstacle to the air inlet • The capability to reduce dramatically the heat exchange, in fact, following the charge stratification technique, the rich mixture cloud is located nearly in the center of the combustion chamber, very close to spark-plug electrodes, while the extremely lean charge, mainly air, very close to the cylinder walls is much colder • The capability to use an higher compression ratio (up to 12.5:1) in fact the fuel vaporization reduces the temperature avoiding the detonation [5].
Regarding pollutants formation GDI produces very low emissions of carbon monoxide (CO) and unburned hydrocarbons (HC). On the other side it presents higher emissions of nitrogen oxides (NOx) and of particulate matter (PM). In this sense GDI has a behaviour very similar to diesel engines with which has in common operations with a large air excess. However GDI appears a promising technique in view of a fuel consumption, and so of CO2, reduction: globally for what concerns the fuel consumption, in terms of “lean burn”, the advantage is 20%, while during high load operations with
Copyright © 2006 by ASME 11 Copyright © 2006 by ASME
se: http://www.asme.org/about-asme/terms-of-use
Dow
homogeneous charge (air-to-fuel ratio A/F nearly 14:1) the saving is roughly 8%.
After a first generation of GDI systems (wall guided and air guided), a second generation systems (spray guided) was developed to overcome such problems still maintaining the sound potentially available advantages. In this last case the proper mixture formation, especially near the spark plug, is demanded exclusively to the fuel injector that so must get and maintain, during a large scale production, high reliability and repeatability characteristics. Moreover an appropriate actuation systems needs to adapt the fuel injection strategy to the entire utilization range [6].
Several works were presented and they are focused essentially on the advantage of GDI, but those are not dealing with the modelling of such systems [10],[11].
The piezoelectric multiple layers actuators (universally known as “piezo-stack”) present very short actuation times and very high forces. In this sense they really offer sound advantages in comparison with conventional solenoid actuated injectors and make possible their effective use in very severe operating conditions such as: • High fuel pressures (200 bar) • A direct proportionality between the generated force and the displacement (axial stroke for an assembled stack) • Extended operating range with very low delivery per stroke capability • Operations in very short time events • Multiple injections capability.
Such peculiarity requires a complete analysis of the injector behaviour and the response to geometrical and operating parameters in order that the design of the components and their implementation in the global system are robust. On the other hand the short time required to the product industrialization suggest to define a valid model that really consent an effective simulation of the system behaviour, so reducing the necessary development time.
In this work the development of a numerical model, characterized by a very tough tuning is presented. In the model different sections are integrated, namely: piezoelectric, mechanical and hydraulic, in order that the “internal” behaviour of the injector is correctly simulated both by the mechanical and fluidodynamic point of view.
The work was carried out in the frame of cooperation activities existing between University of Pisa and Siemens VDO Automotive, a well known company, manufacturer, besides many other automotive components, of fuel injection systems as OEM, who is developing such solution for mass production.
NOMENCLATURE
GDI Gasoline Direct Injection A/F Air / Fuel mass ratio [ ]null S strain tensor sE elastic compliance matrix when subjected to a
constant electrical field T stress tensor d matrix of piezoelectric material convector E electrical field vector
22
nloaded From: https://proceedings.asmedigitalcollection.asme.org on 06/19/2019 Terms of Us
D electric displacement vector εT matrix of permittivity measured at a constant
stress i, k, l, p, q (1..3) index referring to the line or column order
Q volumetric delivery 3m
s⎡ ⎤⎢ ⎥⎢ ⎥⎣ ⎦
Cq flow coefficient [ ]null
Cqmax maximum flow coefficient [ ]null
A transversal area 2m⎡ ⎤⎣ ⎦
∆P pressure drop [ ]Pa
ρ fluid density 3kgm
⎡ ⎤⎢ ⎥⎣ ⎦
Re Reynolds number [ ]null Rec critical Reynolds number for laminar/turbulent
transition [ ]null
P pressure [ ]Pa
t time [ ]s
β fluid bulk modulus [ ]Pa
x location along the hydraulic pipe [ ]m
θ pipe slope [ ]rad
g gravity 2ms
⎡ ⎤⎢ ⎥⎣ ⎦
ν mean flow velocity ms
⎡ ⎤⎢ ⎥⎣ ⎦
ff friction coefficient [ ]null
Φ pipe diameter [ ]m
1 PRESENTATION OF THE SYSTEM The piezoelectric injector, presented in this work, can be
ideally considered as a system constituted by three fundamental elements (Figure 1):
The piezoelectric actuator The thermal compensator The valve body All of them have peculiar characteristics and present specific
problems that need a separate analysis and a specific approach. The piezoelectric actuator is the most characterising element
of the injector because it represents the real innovation in comparison with the other injection systems presently available in the automotive market, in large part characterized by solenoid actuation.
Taking into account the whole injector, the piezo actuator is located in a central position between the thermal compensator and the valve body, it is linked to them with its ends. The actuator function is to activate the injection when a control signal starts the process. Practically speaking, a voltage signal, properly modulated, is applied to the electrodes of the piezo stack that changes its length (this is a particular phenomenon called piezoelectric effect). The change of the length of the
Copyright © 2006 by ASME Copyright © 2006 by ASME
e: http://www.asme.org/about-asme/terms-of-use
Do
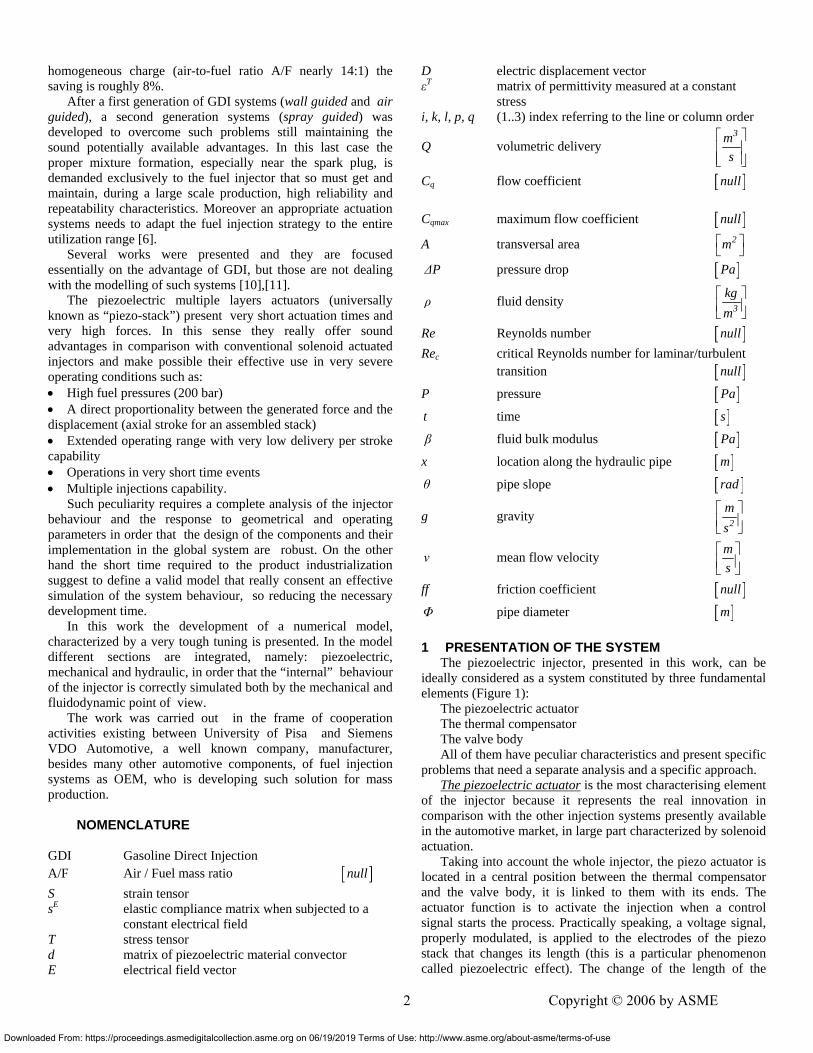
actuator causes the injector needle displacement and so the injection of the gasoline takes place directly in the combustion chamber.
The thermal compensator is probably the most complex and complicated element from the point of view of modelling and calibrating. Its task is to ensure the contact between the actuator and the needle independently from whatever working condition. In fact during the working activity possible contraction or expansion can occur in some elements, caused by thermal gradient; this effect can bring a lack of contact between the actuator and the needle generating so a loss of lift or in some cases a missing injection.
The difficulties in the modelling and calibrating process are connected to the complexity of the mechanism that recovers the contact clearances and to the asymmetric behaviour due to the fact that the thermal compensator have to guarentee a different behaviour in the opening and closing phases.
The valve body is substantially constituted by the needle and its seat. The element is in direct contact with gasoline and the piezo stack. If the actuator gets in contact with gasoline it loses its piezoelectric properties rapidly, so it necessary to insert a dynamic seal, for example a metallic bellows. This particular component is very important and it must be appropriately designed to withstand the pressure oscillations generated by the ram effect in the gasoline manifold during the opening and closing actions of the injector.
Fig. 1 – Schematic structure of the injector
wnloaded From: https://proceedings.asmedigitalcollection.asme.org on 06/19/2019 Terms of U
2 MODELLING APPROACH AND VALIDATION
The three main subassembly of the injector (actuator, thermal compensator and valve body) were modelled separately and subsequently joined and integrated. Such strategy was chosen in order to make possible the separate development of each model, its calibration and its validation through experimental test rig, of the three elements, so avoiding the eventual superimposition of errors and making easier to find possible reasons of discrepancy between simulated and real behaviour.
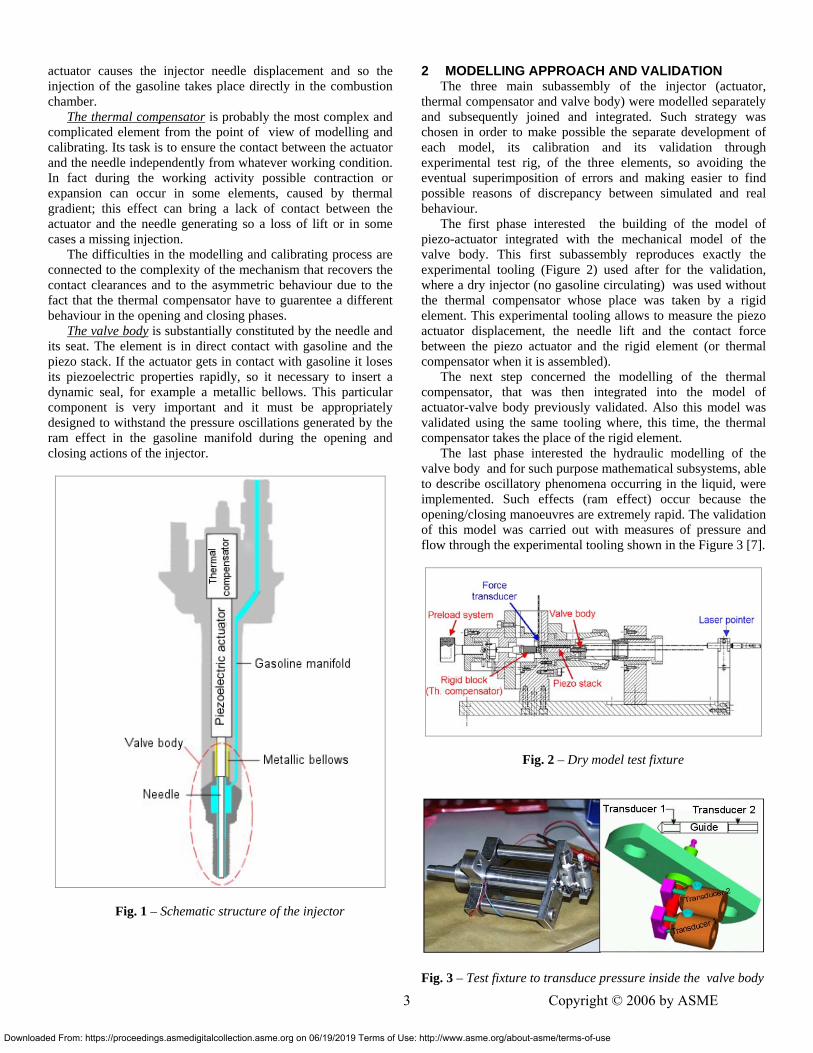
The first phase interested the building of the model of piezo-actuator integrated with the mechanical model of the valve body. This first subassembly reproduces exactly the experimental tooling (Figure 2) used after for the validation, where a dry injector (no gasoline circulating) was used without the thermal compensator whose place was taken by a rigid element. This experimental tooling allows to measure the piezo actuator displacement, the needle lift and the contact force between the piezo actuator and the rigid element (or thermal compensator when it is assembled).
The next step concerned the modelling of the thermal compensator, that was then integrated into the model of actuator-valve body previously validated. Also this model was validated using the same tooling where, this time, the thermal compensator takes the place of the rigid element.
The last phase interested the hydraulic modelling of the valve body and for such purpose mathematical subsystems, able to describe oscillatory phenomena occurring in the liquid, were implemented. Such effects (ram effect) occur because the opening/closing manoeuvres are extremely rapid. The validation of this model was carried out with measures of pressure and flow through the experimental tooling shown in the Figure 3 [7].
Fig. 2 – Dry model test fixture
Fig. 3 – Test fixture to transduce pressure inside the valve body
Copyright © 2006 by ASME 33 Copyright © 2006 by ASMEse: http://www.asme.org/about-asme/terms-of-use
Down
Below the details of modelling of each subassembly, their calibration and validation through comparison between simulated and experimental results are described.
The validation of the model was carried out on research prototypes so owing to the proprietary information involved all the experimental data as well as the parameters adopted are presented in a not dimensional form. In any case such presentation does not affect the comparison and so the validation of the models.
2.1 The piezoelectric actuator The piezo stack (PZT ceramic) is the central part of the
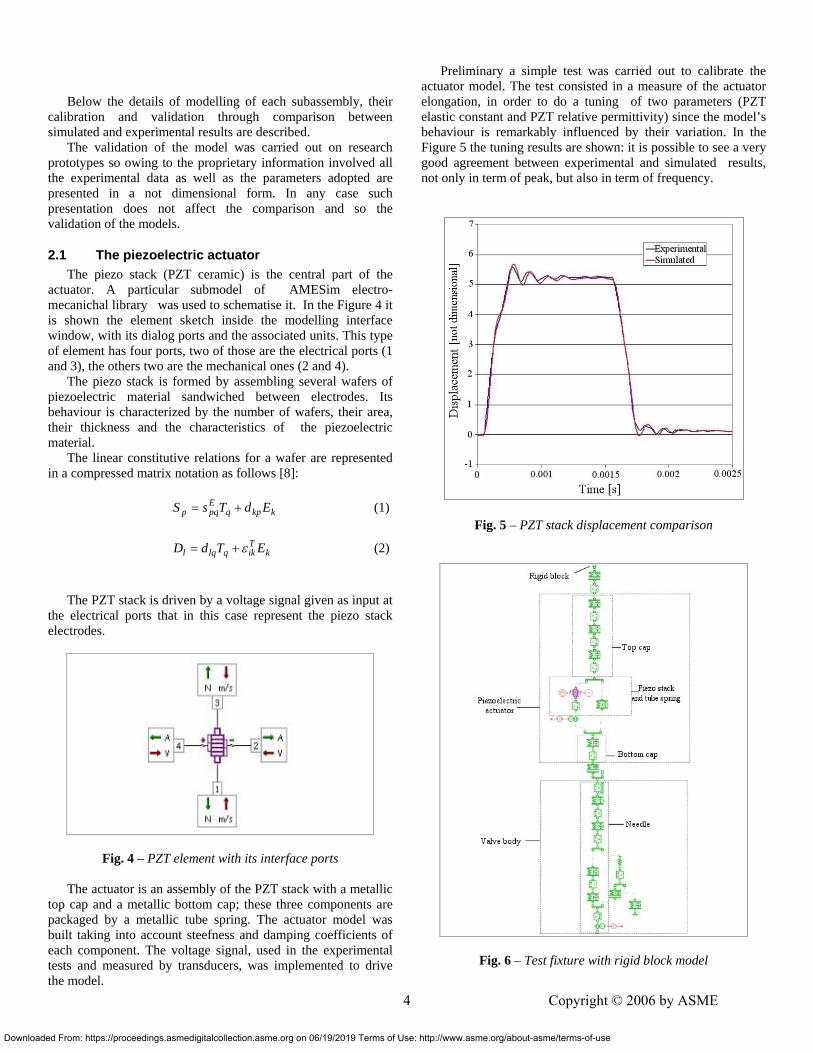
actuator. A particular submodel of AMESim electro-mecanichal library was used to schematise it. In the Figure 4 it is shown the element sketch inside the modelling interface window, with its dialog ports and the associated units. This type of element has four ports, two of those are the electrical ports (1 and 3), the others two are the mechanical ones (2 and 4).
The piezo stack is formed by assembling several wafers of piezoelectric material sandwiched between electrodes. Its behaviour is characterized by the number of wafers, their area, their thickness and the characteristics of the piezoelectric material.
The linear constitutive relations for a wafer are represented in a compressed matrix notation as follows [8]:
(1) kkpq
Epqp EdTsS +=
(2) k
Tikqlql ETdD ε+=
The PZT stack is driven by a voltage signal given as input at the electrical ports that in this case represent the piezo stack electrodes.
Fig. 4 – PZT element with its interface ports
The actuator is an assembly of the PZT stack with a metallic top cap and a metallic bottom cap; these three components are packaged by a metallic tube spring. The actuator model was built taking into account steefness and damping coefficients of each component. The voltage signal, used in the experimental tests and measured by transducers, was implemented to drive the model.
44
loaded From: https://proceedings.asmedigitalcollection.asme.org on 06/19/2019 Terms of Use: h
Preliminary a simple test was carried out to calibrate the
actuator model. The test consisted in a measure of the actuator elongation, in order to do a tuning of two parameters (PZT elastic constant and PZT relative permittivity) since the model’s behaviour is remarkably influenced by their variation. In the Figure 5 the tuning results are shown: it is possible to see a very good agreement between experimental and simulated results, not only in term of peak, but also in term of frequency.
Fig. 5 – PZT stack displacement comparison
Fig. 6 – Test fixture with rigid block model
Copyright © 2006 by ASME Copyright © 2006 by ASME
ttp://www.asme.org/about-asme/terms-of-use
Down
Once verified the good response, the piezo actuator model
was integrated with the mechanical model of the valve body, creating so the test fixture model in dry condition (Figure 6).
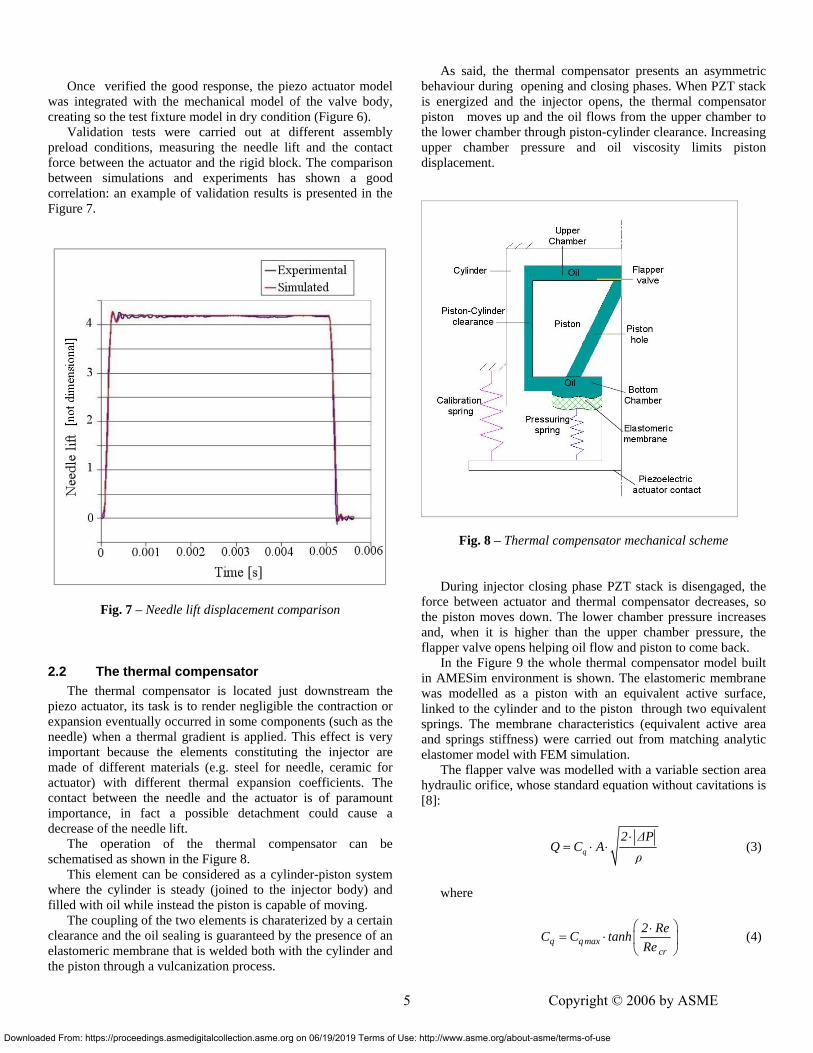
Validation tests were carried out at different assembly preload conditions, measuring the needle lift and the contact force between the actuator and the rigid block. The comparison between simulations and experiments has shown a good correlation: an example of validation results is presented in the Figure 7.
Fig. 7 – Needle lift displacement comparison
2.2 The thermal compensator The thermal compensator is located just downstream the
piezo actuator, its task is to render negligible the contraction or expansion eventually occurred in some components (such as the needle) when a thermal gradient is applied. This effect is very important because the elements constituting the injector are made of different materials (e.g. steel for needle, ceramic for actuator) with different thermal expansion coefficients. The contact between the needle and the actuator is of paramount importance, in fact a possible detachment could cause a decrease of the needle lift.
The operation of the thermal compensator can be schematised as shown in the Figure 8.
This element can be considered as a cylinder-piston system where the cylinder is steady (joined to the injector body) and filled with oil while instead the piston is capable of moving.
The coupling of the two elements is charaterized by a certain clearance and the oil sealing is guaranteed by the presence of an elastomeric membrane that is welded both with the cylinder and the piston through a vulcanization process.
loaded From: https://proceedings.asmedigitalcollection.asme.org on 06/19/2019 Terms of U
As said, the thermal compensator presents an asymmetric
behaviour during opening and closing phases. When PZT stack is energized and the injector opens, the thermal compensator piston moves up and the oil flows from the upper chamber to the lower chamber through piston-cylinder clearance. Increasing upper chamber pressure and oil viscosity limits piston displacement.
Fig. 8 – Thermal compensator mechanical scheme During injector closing phase PZT stack is disengaged, the
force between actuator and thermal compensator decreases, so the piston moves down. The lower chamber pressure increases and, when it is higher than the upper chamber pressure, the flapper valve opens helping oil flow and piston to come back.
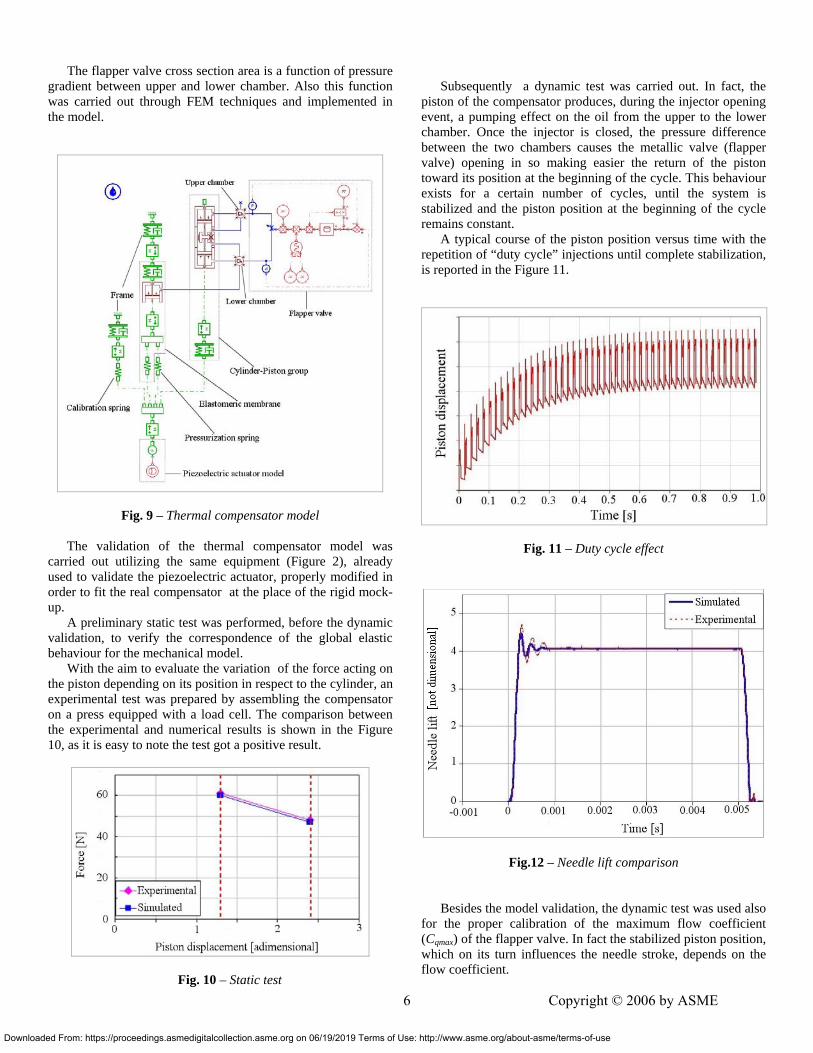
In the Figure 9 the whole thermal compensator model built in AMESim environment is shown. The elastomeric membrane was modelled as a piston with an equivalent active surface, linked to the cylinder and to the piston through two equivalent springs. The membrane characteristics (equivalent active area and springs stiffness) were carried out from matching analytic elastomer model with FEM simulation.
The flapper valve was modelled with a variable section area hydraulic orifice, whose standard equation without cavitations is [8]:
q
2 ∆PQ C A
ρ⋅
= ⋅ ⋅ (3)
where
q q maxcr
2 ReC C tanhRe
⎛ ⎞⋅= ⋅ ⎜
⎝ ⎠⎟ (4)
Copyright © 2006 by ASME 55 Copyright © 2006 by ASME
se: http://www.asme.org/about-asme/terms-of-use
Downlo
The flapper valve cross section area is a function of pressure gradient between upper and lower chamber. Also this function was carried out through FEM techniques and implemented in the model.
Fig. 9 – Thermal compensator model
The validation of the thermal compensator model was carried out utilizing the same equipment (Figure 2), already used to validate the piezoelectric actuator, properly modified in order to fit the real compensator at the place of the rigid mock-up.
A preliminary static test was performed, before the dynamic validation, to verify the correspondence of the global elastic behaviour for the mechanical model.
With the aim to evaluate the variation of the force acting on the piston depending on its position in respect to the cylinder, an experimental test was prepared by assembling the compensator on a press equipped with a load cell. The comparison between the experimental and numerical results is shown in the Figure 10, as it is easy to note the test got a positive result.
Fig. 10 – Static test
aded From: https://proceedings.asmedigitalcollection.asme.org on 06/19/2019 Terms of U
Subsequently a dynamic test was carried out. In fact, the
piston of the compensator produces, during the injector opening event, a pumping effect on the oil from the upper to the lower chamber. Once the injector is closed, the pressure difference between the two chambers causes the metallic valve (flapper valve) opening in so making easier the return of the piston toward its position at the beginning of the cycle. This behaviour exists for a certain number of cycles, until the system is stabilized and the piston position at the beginning of the cycle remains constant.
A typical course of the piston position versus time with the repetition of “duty cycle” injections until complete stabilization, is reported in the Figure 11.
Fig. 11 – Duty cycle effect
Fig.12 – Needle lift comparison
Besides the model validation, the dynamic test was used also for the proper calibration of the maximum flow coefficient (Cqmax) of the flapper valve. In fact the stabilized piston position, which on its turn influences the needle stroke, depends on the flow coefficient.
Copyright © 2006 by ASME 66 Copyright © 2006 by ASME
se: http://www.asme.org/about-asme/terms-of-use
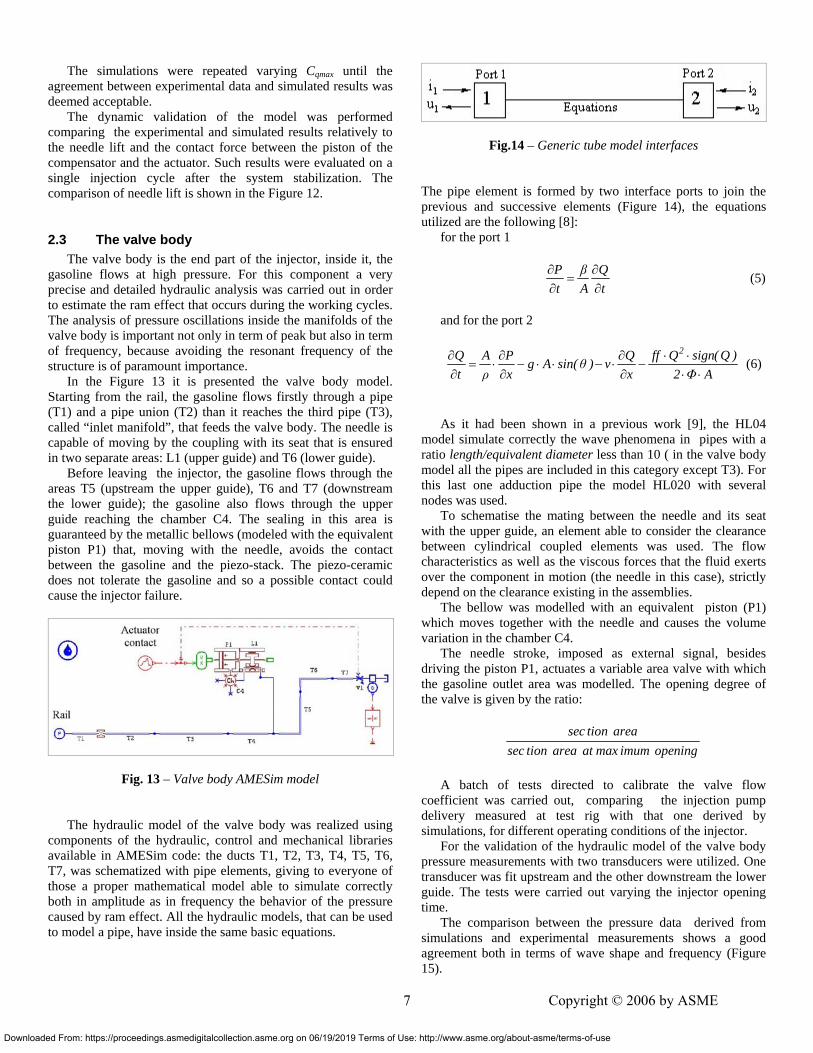
The simulations were repeated varying Cqmax until the agreement between experimental data and simulated results was deemed acceptable.
The dynamic validation of the model was performed comparing the experimental and simulated results relatively to the needle lift and the contact force between the piston of the compensator and the actuator. Such results were evaluated on a single injection cycle after the system stabilization. The comparison of needle lift is shown in the Figure 12.
2.3 The valve body The valve body is the end part of the injector, inside it, the
gasoline flows at high pressure. For this component a very precise and detailed hydraulic analysis was carried out in order to estimate the ram effect that occurs during the working cycles. The analysis of pressure oscillations inside the manifolds of the valve body is important not only in term of peak but also in term of frequency, because avoiding the resonant frequency of the structure is of paramount importance.
In the Figure 13 it is presented the valve body model. Starting from the rail, the gasoline flows firstly through a pipe (T1) and a pipe union (T2) than it reaches the third pipe (T3), called “inlet manifold”, that feeds the valve body. The needle is capable of moving by the coupling with its seat that is ensured in two separate areas: L1 (upper guide) and T6 (lower guide).
Before leaving the injector, the gasoline flows through the areas T5 (upstream the upper guide), T6 and T7 (downstream the lower guide); the gasoline also flows through the upper guide reaching the chamber C4. The sealing in this area is guaranteed by the metallic bellows (modeled with the equivalent piston P1) that, moving with the needle, avoids the contact between the gasoline and the piezo-stack. The piezo-ceramic does not tolerate the gasoline and so a possible contact could cause the injector failure.
Fig. 13 – Valve body AMESim model The hydraulic model of the valve body was realized using
components of the hydraulic, control and mechanical libraries available in AMESim code: the ducts T1, T2, T3, T4, T5, T6, T7, was schematized with pipe elements, giving to everyone of those a proper mathematical model able to simulate correctly both in amplitude as in frequency the behavior of the pressure caused by ram effect. All the hydraulic models, that can be used to model a pipe, have inside the same basic equations.
Downloaded From: https://proceedings.asmedigitalcollection.asme.org on 06/19/2019 Terms of U
Fig.14 – Generic tube model interfaces The pipe element is formed by two interface ports to join the previous and successive elements (Figure 14), the equations utilized are the following [8]:
for the port 1
P β Qt A t
∂ ∂=
∂ ∂ (5)
and for the port 2
2Q A P Q ff Q sign( Q )g A sin(θ ) v
t ρ x x 2 Φ A∂ ∂ ∂ ⋅ ⋅
= ⋅ − ⋅ ⋅ − ⋅ −∂ ∂ ∂ ⋅ ⋅
(6)
As it had been shown in a previous work [9], the HL04
model simulate correctly the wave phenomena in pipes with a ratio length/equivalent diameter less than 10 ( in the valve body model all the pipes are included in this category except T3). For this last one adduction pipe the model HL020 with several nodes was used.
To schematise the mating between the needle and its seat with the upper guide, an element able to consider the clearance between cylindrical coupled elements was used. The flow characteristics as well as the viscous forces that the fluid exerts over the component in motion (the needle in this case), strictly depend on the clearance existing in the assemblies.
The bellow was modelled with an equivalent piston (P1) which moves together with the needle and causes the volume variation in the chamber C4.
The needle stroke, imposed as external signal, besides driving the piston P1, actuates a variable area valve with which the gasoline outlet area was modelled. The opening degree of the valve is given by the ratio:
sec tion area
sec tion area at max imum opening
A batch of tests directed to calibrate the valve flow
coefficient was carried out, comparing the injection pump delivery measured at test rig with that one derived by simulations, for different operating conditions of the injector.
For the validation of the hydraulic model of the valve body pressure measurements with two transducers were utilized. One transducer was fit upstream and the other downstream the lower guide. The tests were carried out varying the injector opening time.
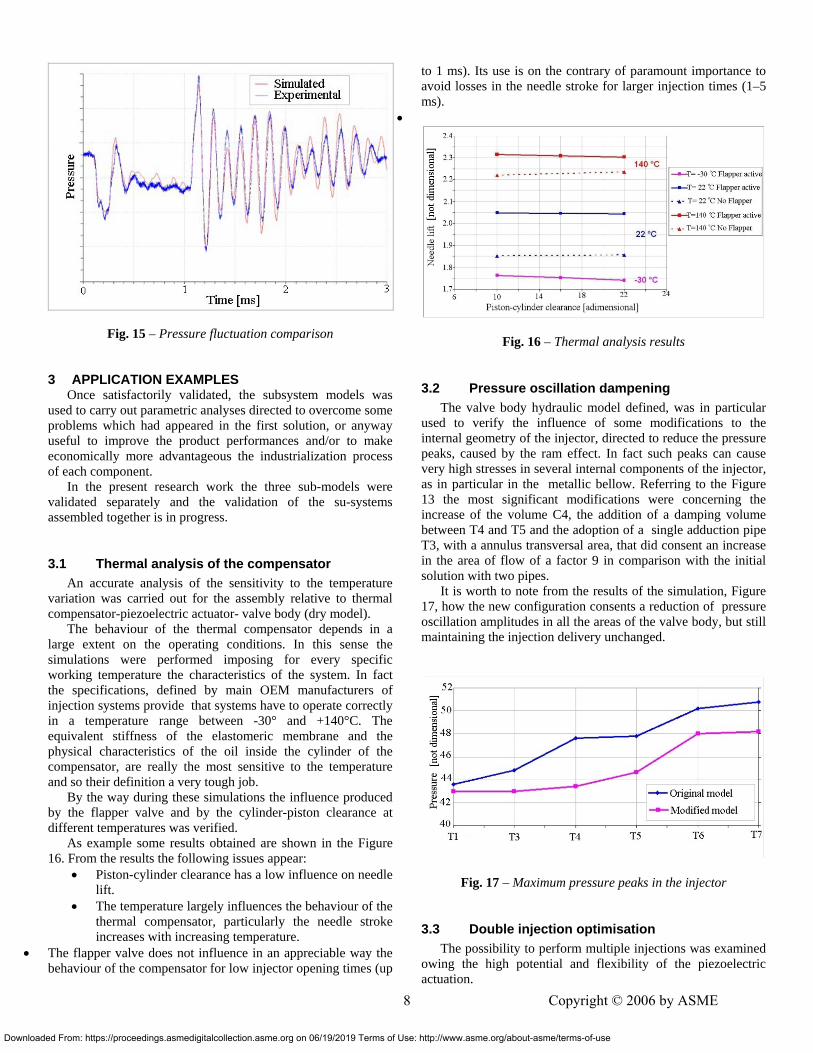
The comparison between the pressure data derived from simulations and experimental measurements shows a good agreement both in terms of wave shape and frequency (Figure 15).
Copyright © 2006 by ASME 77 Copyright © 2006 by ASME
se: http://www.asme.org/about-asme/terms-of-use
Dow
Fig. 15 – Pressure fluctuation comparison
3 APPLICATION EXAMPLES Once satisfactorily validated, the subsystem models was
used to carry out parametric analyses directed to overcome some problems which had appeared in the first solution, or anyway useful to improve the product performances and/or to make economically more advantageous the industrialization process of each component.
In the present research work the three sub-models were validated separately and the validation of the su-systems assembled together is in progress.
3.1 Thermal analysis of the compensator An accurate analysis of the sensitivity to the temperature
variation was carried out for the assembly relative to thermal compensator-piezoelectric actuator- valve body (dry model).
The behaviour of the thermal compensator depends in a large extent on the operating conditions. In this sense the simulations were performed imposing for every specific working temperature the characteristics of the system. In fact the specifications, defined by main OEM manufacturers of injection systems provide that systems have to operate correctly in a temperature range between -30° and +140°C. The equivalent stiffness of the elastomeric membrane and the physical characteristics of the oil inside the cylinder of the compensator, are really the most sensitive to the temperature and so their definition a very tough job.
By the way during these simulations the influence produced by the flapper valve and by the cylinder-piston clearance at different temperatures was verified.
As example some results obtained are shown in the Figure 16. From the results the following issues appear:
• Piston-cylinder clearance has a low influence on needle lift.
• The temperature largely influences the behaviour of the thermal compensator, particularly the needle stroke increases with increasing temperature.
• The flapper valve does not influence in an appreciable way the behaviour of the compensator for low injector opening times (up
•
nloaded From: https://proceedings.asmedigitalcollection.asme.org on 06/19/2019 Terms of U
to 1 ms). Its use is on the contrary of paramount importance to avoid losses in the needle stroke for larger injection times (1–5 ms).
Fig. 16 – Thermal analysis results
3.2 Pressure oscillation dampening The valve body hydraulic model defined, was in particular
used to verify the influence of some modifications to the internal geometry of the injector, directed to reduce the pressure peaks, caused by the ram effect. In fact such peaks can cause very high stresses in several internal components of the injector, as in particular in the metallic bellow. Referring to the Figure 13 the most significant modifications were concerning the increase of the volume C4, the addition of a damping volume between T4 and T5 and the adoption of a single adduction pipe T3, with a annulus transversal area, that did consent an increase in the area of flow of a factor 9 in comparison with the initial solution with two pipes.
It is worth to note from the results of the simulation, Figure 17, how the new configuration consents a reduction of pressure oscillation amplitudes in all the areas of the valve body, but still maintaining the injection delivery unchanged.
Fig. 17 – Maximum pressure peaks in the injector
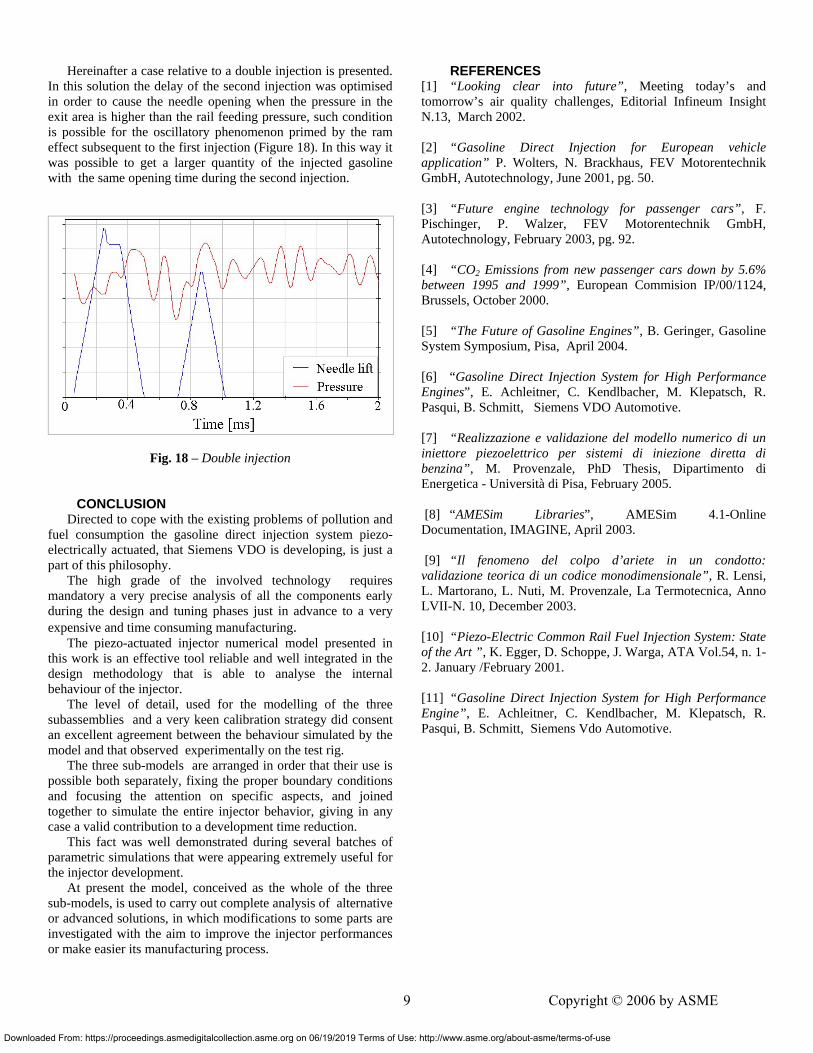
3.3 Double injection optimisation The possibility to perform multiple injections was examined
owing the high potential and flexibility of the piezoelectric actuation.
Copyright © 2006 by ASME 88 Copyright © 2006 by ASME
se: http://www.asme.org/about-asme/terms-of-use
D
Hereinafter a case relative to a double injection is presented. In this solution the delay of the second injection was optimised in order to cause the needle opening when the pressure in the exit area is higher than the rail feeding pressure, such condition is possible for the oscillatory phenomenon primed by the ram effect subsequent to the first injection (Figure 18). In this way it was possible to get a larger quantity of the injected gasoline with the same opening time during the second injection.
Fig. 18 – Double injection
CONCLUSION Directed to cope with the existing problems of pollution and
fuel consumption the gasoline direct injection system piezo-electrically actuated, that Siemens VDO is developing, is just a part of this philosophy.
The high grade of the involved technology requires mandatory a very precise analysis of all the components early during the design and tuning phases just in advance to a very expensive and time consuming manufacturing.
The piezo-actuated injector numerical model presented in this work is an effective tool reliable and well integrated in the design methodology that is able to analyse the internal behaviour of the injector.
The level of detail, used for the modelling of the three subassemblies and a very keen calibration strategy did consent an excellent agreement between the behaviour simulated by the model and that observed experimentally on the test rig.
The three sub-models are arranged in order that their use is possible both separately, fixing the proper boundary conditions and focusing the attention on specific aspects, and joined together to simulate the entire injector behavior, giving in any case a valid contribution to a development time reduction.
This fact was well demonstrated during several batches of parametric simulations that were appearing extremely useful for the injector development.
At present the model, conceived as the whole of the three sub-models, is used to carry out complete analysis of alternative or advanced solutions, in which modifications to some parts are investigated with the aim to improve the injector performances or make easier its manufacturing process.
ownloaded From: https://proceedings.asmedigitalcollection.asme.org on 06/19/2019 Terms of
REFERENCES [1] “Looking clear into future”, Meeting today’s and tomorrow’s air quality challenges, Editorial Infineum Insight N.13, March 2002. [2] “Gasoline Direct Injection for European vehicle application” P. Wolters, N. Brackhaus, FEV Motorentechnik GmbH, Autotechnology, June 2001, pg. 50. [3] “Future engine technology for passenger cars”, F. Pischinger, P. Walzer, FEV Motorentechnik GmbH, Autotechnology, February 2003, pg. 92. [4] “CO2 Emissions from new passenger cars down by 5.6% between 1995 and 1999”, European Commision IP/00/1124, Brussels, October 2000. [5] “The Future of Gasoline Engines”, B. Geringer, Gasoline System Symposium, Pisa, April 2004. [6] “Gasoline Direct Injection System for High Performance Engines”, E. Achleitner, C. Kendlbacher, M. Klepatsch, R. Pasqui, B. Schmitt, Siemens VDO Automotive. [7] “Realizzazione e validazione del modello numerico di un iniettore piezoelettrico per sistemi di iniezione diretta di benzina”, M. Provenzale, PhD Thesis, Dipartimento di Energetica - Università di Pisa, February 2005. [8] “AMESim Libraries”, AMESim 4.1-Online Documentation, IMAGINE, April 2003. [9] “Il fenomeno del colpo d’ariete in un condotto: validazione teorica di un codice monodimensionale”, R. Lensi, L. Martorano, L. Nuti, M. Provenzale, La Termotecnica, Anno LVII-N. 10, December 2003. [10] “Piezo-Electric Common Rail Fuel Injection System: State of the Art ”, K. Egger, D. Schoppe, J. Warga, ATA Vol.54, n. 1-2. January /February 2001. [11] “Gasoline Direct Injection System for High Performance Engine”, E. Achleitner, C. Kendlbacher, M. Klepatsch, R. Pasqui, B. Schmitt, Siemens Vdo Automotive.
Copyright © 2006 by ASME 99 Copyright © 2006 by ASME
Use: http://www.asme.org/about-asme/terms-of-use
Related Documents


![[DESIGN] Piezo-Piezo to Pie](https://static.cupdf.com/doc/110x72/5571f8bb49795991698df909/design-piezo-piezo-to-pie.jpg)