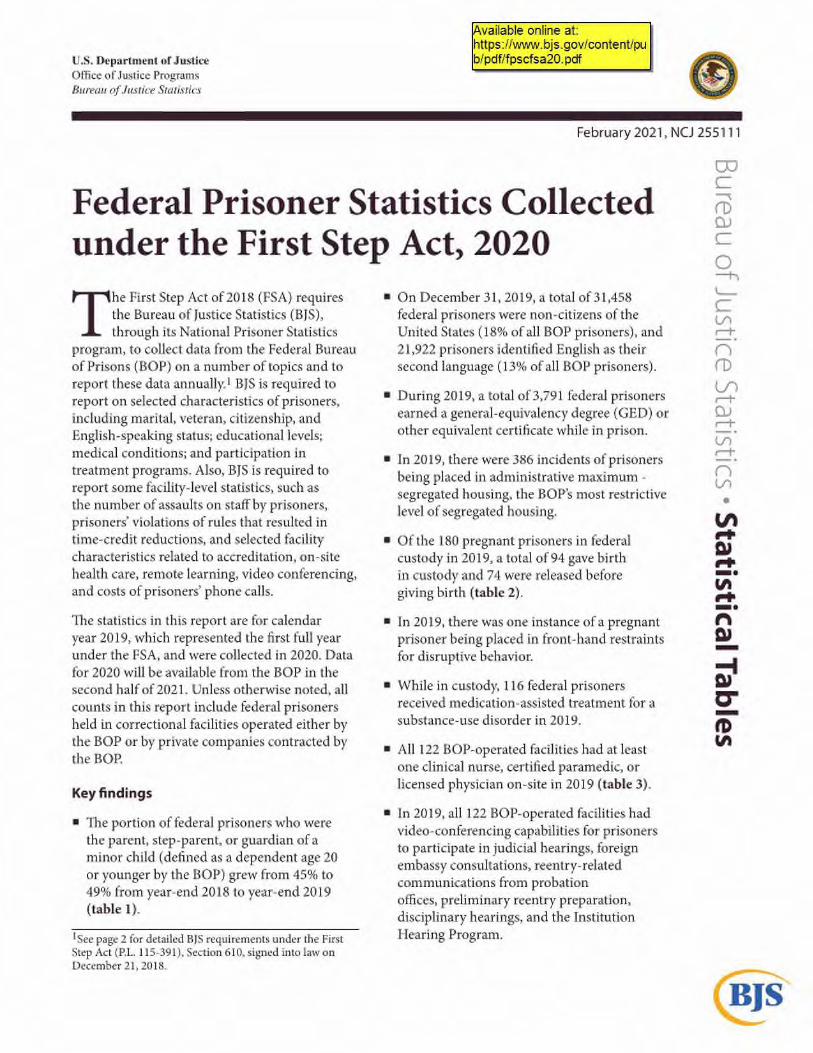
e3! 19 1 e1S • SD4 S4 e1S 09p. S nr J O nealnE 1CiJS U.S. Department of Justice Office of Justice Programs Bureau of Justice Statistics Available online at: https://www.bjs.gov/content/pu b/pdf/fpscfsa20.pdf February 2021, NCJ 255111 Federal Prisoner Statistics Collected under the First Step Act, 2020 T he First Step Act of 2018 (FSA) requires the Bureau of Justice Statistics (BJS), through its National Prisoner Statistics program, to collect data from the Federal Bureau of Prisons (BOP) on a number of topics and to report these data annually.' BJS is required to report on selected characteristics of prisoners, including marital, veteran, citizenship, and English-speaking status; educational levels; medical conditions; and participation in treatment programs. Also, BJS is required to report some facility-level statistics, such as the number of assaults on staff by prisoners, prisoners' violations of rules that resulted in time-credit reductions, and selected facility characteristics related to accreditation, on-site health care, remote learning, video conferencing, and costs of prisoners' phone calls. The statistics in this report are for calendar year 2019, which represented the first full year under the FSA, and were collected in 2020. Data for 2020 will be available from the BOP in the second half of 2021. Unless otherwise noted, all counts in this report include federal prisoners held in correctional facilities operated either by the BOP or by private companies contracted by the BOP. Key findings • The portion of federal prisoners who were the parent, step-parent, or guardian of a minor child (defined as a dependent age 20 or younger by the BOP) grew from 45% to 49% from year-end 2018 to year-end 2019 (table 1). 1See page 2 for detailed BJS requirements under the First Step Act (P.L. 115-391), Section 610, signed into law on December 21,2018. • On December 31, 2019, a total of 31,458 federal prisoners were non-citizens of the United States (18% of all BOP prisoners), and 21,922 prisoners identified English as their second language (13% of all BOP prisoners). • During 2019, a total of 3,791 federal prisoners earned a general-equivalency degree (GED) or other equivalent certificate while in prison. • In 2019, there were 386 incidents of prisoners being placed in administrative maximum - segregated housing, the BOP's most restrictive level of segregated housing. • Of the 180 pregnant prisoners in federal custody in 2019, a total of 94 gave birth in custody and 74 were released before giving birth (table 2). • In 2019, there was one instance of a pregnant prisoner being placed in front-hand restraints for disruptive behavior. • While in custody, 116 federal prisoners received medication-assisted treatment for a substance-use disorder in 2019. • All 122 BOP-operated facilities had at least one clinical nurse, certified paramedic, or licensed physician on-site in 2019 (table 3). • In 2019, all 122 BOP-operated facilities had video-conferencing capabilities for prisoners to participate in judicial hearings, foreign embassy consultations, reentry-related communications from probation offices, preliminary reentry preparation, disciplinary hearings, and the Institution Hearing Program.

Welcome message from author
This document is posted to help you gain knowledge. Please leave a comment to let me know what you think about it! Share it to your friends and learn new things together.
Transcript
e3! 1
91e
1S •
SD4 S
4e1S
09p
.Snr
JO
neal
nE
1CiJS
U.S. Department of Justice Office of Justice Programs Bureau of Justice Statistics
Available online at: https://www.bjs.gov/content/pu b/pdf/fpscfsa20.pdf
February 2021, NCJ 255111
Federal Prisoner Statistics Collected under the First Step Act, 2020
The First Step Act of 2018 (FSA) requires the Bureau of Justice Statistics (BJS), through its National Prisoner Statistics
program, to collect data from the Federal Bureau of Prisons (BOP) on a number of topics and to report these data annually.' BJS is required to report on selected characteristics of prisoners, including marital, veteran, citizenship, and English-speaking status; educational levels; medical conditions; and participation in treatment programs. Also, BJS is required to report some facility-level statistics, such as the number of assaults on staff by prisoners, prisoners' violations of rules that resulted in time-credit reductions, and selected facility characteristics related to accreditation, on-site health care, remote learning, video conferencing, and costs of prisoners' phone calls.
The statistics in this report are for calendar year 2019, which represented the first full year under the FSA, and were collected in 2020. Data for 2020 will be available from the BOP in the second half of 2021. Unless otherwise noted, all counts in this report include federal prisoners held in correctional facilities operated either by the BOP or by private companies contracted by the BOP.
Key findings
• The portion of federal prisoners who were the parent, step-parent, or guardian of a minor child (defined as a dependent age 20 or younger by the BOP) grew from 45% to 49% from year-end 2018 to year-end 2019 (table 1).
1See page 2 for detailed BJS requirements under the First Step Act (P.L. 115-391), Section 610, signed into law on December 21,2018.
• On December 31, 2019, a total of 31,458 federal prisoners were non-citizens of the United States (18% of all BOP prisoners), and 21,922 prisoners identified English as their second language (13% of all BOP prisoners).
• During 2019, a total of 3,791 federal prisoners earned a general-equivalency degree (GED) or other equivalent certificate while in prison.
• In 2019, there were 386 incidents of prisoners being placed in administrative maximum - segregated housing, the BOP's most restrictive level of segregated housing.
• Of the 180 pregnant prisoners in federal custody in 2019, a total of 94 gave birth in custody and 74 were released before giving birth (table 2).
• In 2019, there was one instance of a pregnant prisoner being placed in front-hand restraints for disruptive behavior.
• While in custody, 116 federal prisoners received medication-assisted treatment for a substance-use disorder in 2019.
• All 122 BOP-operated facilities had at least one clinical nurse, certified paramedic, or licensed physician on-site in 2019 (table 3).
• In 2019, all 122 BOP-operated facilities had video-conferencing capabilities for prisoners to participate in judicial hearings, foreign embassy consultations, reentry-related communications from probation offices, preliminary reentry preparation, disciplinary hearings, and the Institution Hearing Program.

• A total of 89,369 prohibited acts occurred in
BOP-operated facilities during 2019, of which
63,025 were committed in medium- or high-security
facilities (71%) (table 4).
• A total of 54,848 individual federal prisoners
committed the 89,369 prohibited acts (table 5).
• More than half of the individuals who committed
prohibited acts in 2019 were age 35 or older (29,175
prisoners or 53%).
• During 2019, there were 1,252 physical assaults on
BOP staff by federal prisoners, with 18 of the assaults
resulting in serious injury to the staff member
(table 7).
• In 2019, a total of 11,491 persons volunteered at
BOP-operated facilities (table 8).
• Faith-based programs made up 56% of all BOP
recidivism-reduction partnerships in 2019 (table 9).
First Step Act of 2018 (P.L. 115-391) Title VI, Section 610. Data Collection (a) National Prisoner Statistics Program. Beginning not later than 1 year after the date of enactment of this Act, and annually thereafter, pursuant to the authority under section 302 of the Omnibus Crime Control and Safe Streets Act of 1968 (42 U.S.C. § 3732),2 the Director of the Bureau of Justice Statistics, with information that shall be provided by the Director of the Bureau of Prisons, shall include in the National Prisoner Statistics Program the following:
1. The number of prisoners (as such term is defined in section 3635 of title 18, United States Code, as added by section 101(a) of this Act) who are veterans of the Armed Forces of the United States.
2. The number of prisoners who have been placed in solitary confinement at any time during the previous year.
3. The number of female prisoners known by the Bureau of Prisons to be pregnant, as well as the outcomes of such pregnancies, including information on pregnancies that result in live birth, stillbirth, miscarriage, abortion, ectopic pregnancy, maternal death, neonatal death, and preterm birth.
4. The number of prisoners who volunteered to participate in a substance abuse treatment program, and the number of prisoners who have participated in such a program.
5. The number of prisoners provided medication-assisted treatment with medication approved by the Food and Drug Administration while in custody in order to treat substance use disorder.
6. The number of prisoners who were receiving medication-assisted treatment with medication approved by the Food and Drug Administration prior to the commencement of their term of imprisonment.
2See 32 U.S.C. 4 10132.
7. The number of prisoners who are the parent or guardian of a minor child.
8. The number of prisoners who are single, married, or otherwise in a committed relationship.
9. The number of prisoners who have not achieved a GED, high school diploma, or equivalent prior to entering prison.
10. The number of prisoners who, during the previous year, received their GED or other equivalent certificate while incarcerated.
11. The numbers of prisoners for whom English is a second language.
12. The number of incidents, during the previous year, in which restraints were used on a female prisoner during pregnancy, labor, or postpartum recovery, as well as information relating to the type of restraints used, and the circumstances under which each incident occurred.
13. The vacancy rate for medical and healthcare staff positions, and average length of such a vacancy.
14. The number of facilities that operated, at any time during the previous year, without at least 1 clinical nurse, certified paramedic, or licensed physician on site.
15. The number of facilities that during the previous year were accredited by the American Correctional Association.
16. The number and type of recidivism reduction partnerships described in section 3621(h)(5) of title 18, United States Code, as added by section 102(a) of this Act, entered into by each facility.
17. The number of facilities with remote learning capabilities.
18. The number of facilities that offer prisoners video conferencing.
Continued on next page
Federal Prisoner Statistics Collected under the First Step Act, 2020 I February 2021 2•
First Step Act of 2018 (P.L. 115-391) Title VI, Section 610. Data Collection (continued)
19. Any changes in costs related to legal phone calls and visits following implementation of section 3632(d)(1) of title 18, United States Code, as added by section 101(a) of this Act.
20. The number of aliens in prison during the previous year.
21. For each Bureau of Prisons facility, the total number of violations that resulted in reductions in rewards, incentives, or time credits, the number of such violations for each category of violation, and the demographic breakdown of the prisoners who have received such reductions.
22. The number of assaults on Bureau of Prisons staff by prisoners and the number of criminal prosecutions of prisoners for assaulting Bureau of Prisons staff.
23. The capacity of each recidivism reduction program and productive activity to accommodate eligible inmates at each Bureau of Prisons facility.
24. The number of volunteers who were certified to volunteer in a Bureau of Prisons facility, broken down by level (level I and level II), and by each Bureau of Prisons facility.
25. The number of prisoners enrolled in recidivism reduction programs and productive activities at each Bureau of Prisons facility, broken down by risk level and by program, and the number of those enrolled prisoners who successfully completed each program.
26. The breakdown of prisoners classified at each risk level by demographic characteristics, including age, sex, race, and the length of the sentence imposed.
(b) Report to Judiciary Committees. Beginning not later than 1 year after the date of enactment of this Act, and annually thereafter for a period of 7 years, the Director of the Bureau of Justice Statistics shall submit a report containing the information described in paragraphs (1) through (26) of subsection (a) to the Committee on the Judiciary of the Senate and the Committee on the Judiciary of the House of Representatives.
Federal Prisoner Statistics Collected under the First Step Act, 2020 I February 2021 3•
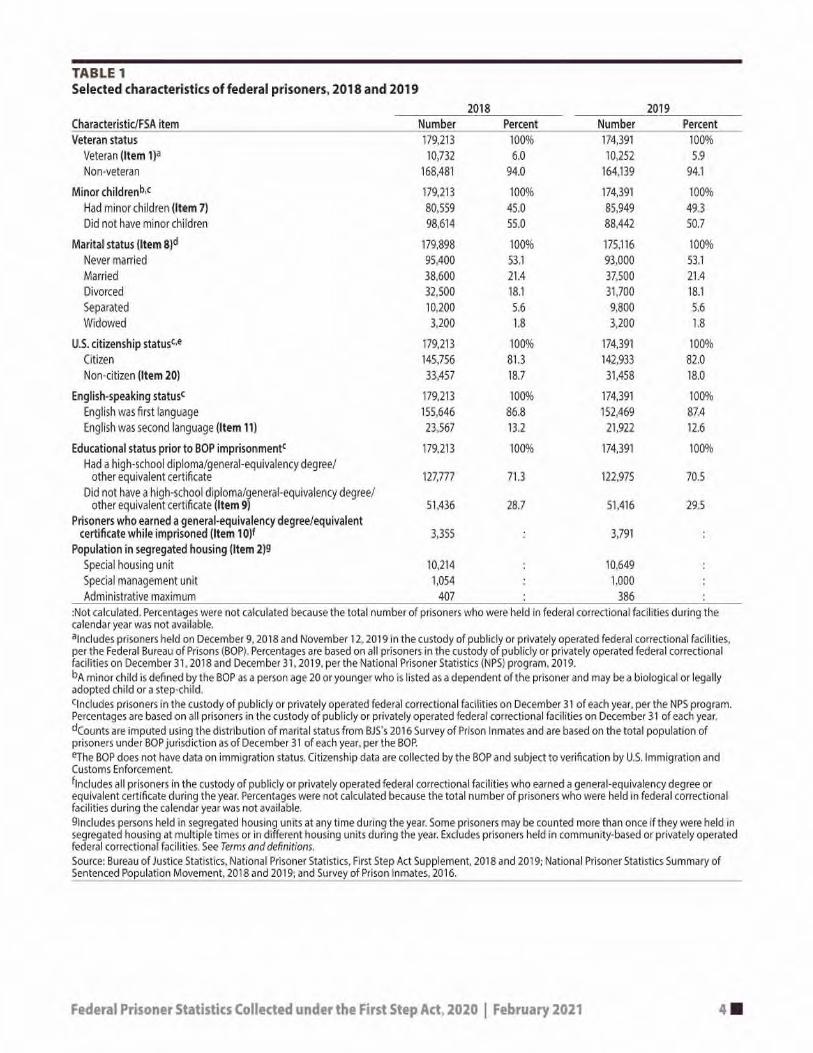
TABLE 1 Selected characteristics of federal prisoners, 2018 and 2019
2018
2019
Characteristic/FSA item Number Percent Number Percent
Veteran status 179,213 100% 174,391 100%
Veteran (Item 1)a 10,732 6.0 10,252 5.9
Non-veteran 168,481 94.0 164,139 94.1
Minor childrenbx 179,213 100% 174,391 100%
Had minor children (Item 7) 80,559 45.0 85,949 49.3
Did not have minor children 98,614 55.0 88,442 50.7
Marital status (Item 8)d 179,898 100% 175,116 100%
Never married 95,400 53.1 93,000 53.1
Married 38,600 21.4 37,500 21.4
Divorced 32,500 18.1 31,700 18.1
Separated 10,200 5.6 9,800 5.6
Widowed 3,200 1.8 3,200 1.8
U.S. citizenship statusc,e 179,213 100% 174,391 100%
Citizen 145,756 81.3 142,933 82.0
Non-citizen (Item 20) 33,457 18.7 31,458 18.0
English-speaking statusc 179,213 100% 174,391 100%
English was first language 155,646 86.8 152,469 87.4
English was second language (Item 11) 23,567 13.2 21,922 12.6
Educational status prior to BOP imprisonmentc 179,213 100% 174,391 100%
Had a high-school diploma/general-equivalency degree/ other equivalent certificate 127,777 71.3 122,975 70.5
Did not have a high-school diploma/general-equivalency degree/ other equivalent certificate (Item 9) 51,436 28.7 51,416 29.5
Prisoners who earned a general-equivalency degree/equivalent certificate while imprisoned (Item 10)f 3,355
3,791
Population in segregated housing (Item 2)9
Special housing unit 10,214
10,649
Special management unit 1,054
1,000
Administrative maximum 407
386
:Not calculated. Percentages were not calculated because the total number of prisoners who were held in federal correctional facilities during the calendar year was not available.
alncludes prisoners held on December 9,2018 and November 12,2019 in the custody of publicly or privately operated federal correctional facilities, per the Federal Bureau of Prisons (BOP). Percentages are based on all prisoners in the custody of publicly or privately operated federal correctional facilities on December 31,2018 and December 31,2019, per the National Prisoner Statistics (NPS) program, 2019.
bA minor child is defined by the BOP as a person age 20 or younger who is listed as a dependent of the prisoner and may be a biological or legally adopted child or a step-child.
cIncludes prisoners in the custody of publicly or privately operated federal correctional facilities on December 31 of each year, per the NPS program. Percentages are based on all prisoners in the custody of publicly or privately operated federal correctional facilities on December 31 of each year.
dCounts are imputed using the distribution of marital status from BJS's 2016 Survey of Prison Inmates and are based on the total population of prisoners under BOP jurisdiction as of December 31 of each year, per the BOP.
eThe BOP does not have data on immigration status. Citizenship data are collected by the BOP and subject to verification by U.S. Immigration and Customs Enforcement.
flncludes all prisoners in the custody of publicly or privately operated federal correctional facilities who earned a general-equivalency degree or equivalent certificate during the year. Percentages were not calculated because the total number of prisoners who were held in federal correctional facilities during the calendar year was not available.
9Includes persons held in segregated housing units at any time during the year. Some prisoners may be counted more than once if they were held in segregated housing at multiple times or in different housing units during the year. Excludes prisoners held in community-based or privately operated federal correctional facilities. See Terms and definitions. Source: Bureau of Justice Statistics, National Prisoner Statistics, First Step Act Supplement, 2018 and 2019; National Prisoner Statistics Summary of Sentenced Population Movement, 2018 and 2019; and Survey of Prison Inmates, 2016.
Federal Prisoner Statistics Collected under the First Step Act, 2020 I February 2021 4•
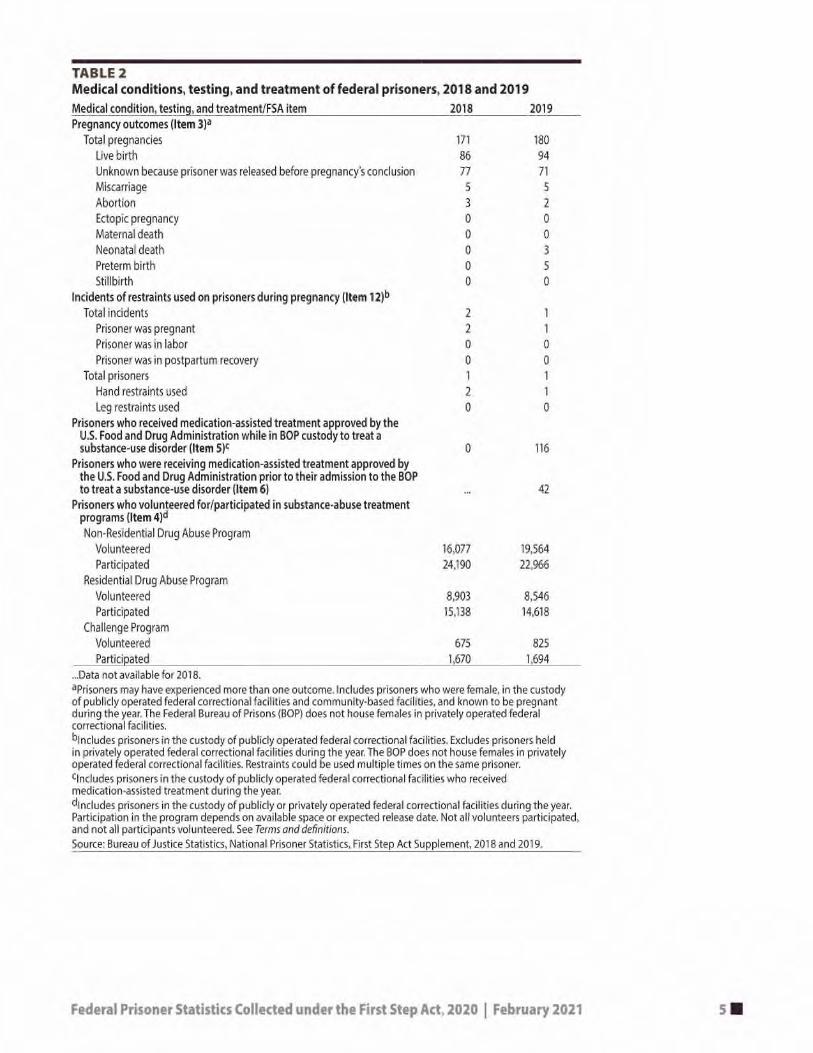
TABLE 2 Medical conditions, testing, and treatment of federal prisoners, 2018 and 2019
Medical condition, testing, and treatment/FSA item 2018 2019 Pregnancy outcomes (Item 3)a
Total pregnancies 171 180
Live birth 86 94
Unknown because prisoner was released before pregnancy's conclusion 77 71
Miscarriage 5 5
Abortion 3 2
Ectopic pregnancy 0 0
Maternal death 0 0
Neonatal death 0 3
Preterm birth 0 5
Stillbirth 0 0
Incidents of restraints used on prisoners during pregnancy (Item 12)1
Total incidents 2 1
Prisoner was pregnant 2 1
Prisoner was in labor 0 0
Prisoner was in postpartum recovery 0 0
Total prisoners 1 1
Hand restraints used 2 1
Leg restraints used 0 0
Prisoners who received medication-assisted treatment approved by the U.S. Food and Drug Administration while in BOP custody to treat a substance-use disorder (Item 5)c 0 116
Prisoners who were receiving medication-assisted treatment approved by the U.S. Food and Drug Administration prior to their admission to the BOP to treat a substance-use disorder (Item 6) 42
Prisoners who volunteered for/participated in substance-abuse treatment programs (Item 4)d
Non-Residential Drug Abuse Program
Volunteered 16,077 19,564
Participated 24,190 22,966
Residential Drug Abuse Program
Volunteered 8,903 8,546
Participated 15,138 14,618
Challenge Program
Volunteered 675 825
Participated 1,670 1,694
...Data not available for 2018. aPrisoners may have experienced more than one outcome. Includes prisoners who were female, in the custody of publicly operated federal correctional facilities and community-based facilities, and known to be pregnant during the year. The Federal Bureau of Prisons (BOP) does not house females in privately operated federal correctional facilities. blncludes prisoners in the custody of publicly operated federal correctional facilities. Excludes prisoners held in privately operated federal correctional facilities during the year. The BOP does not house females in privately operated federal correctional facilities. Restraints could be used multiple times on the same prisoner. cIncludes prisoners in the custody of publicly operated federal correctional facilities who received medication-assisted treatment during the year. dlncludes prisoners in the custody of publicly or privately operated federal correctional facilities during the year. Participation in the program depends on available space or expected release date. Not all volunteers participated, and not all participants volunteered. See Terms and definitions.
Source: Bureau of Justice Statistics, National Prisoner Statistics, First Step Act Supplement, 2018 and 2019.
Federal Prisoner Statistics Collected under the First Step Act, 2020 I February 2021 5•

TABLE 3 Selected characteristics of federal facilities, 2018 and 2019
Characteristic/FSA item 2018 2019 Total number of federal facilities 122 122
Facilities operating without a health-care professional (Item 14) 0 0 Facilities accredited by the American Correctional Association (Item 15) 122 121
Facilities with remote-learning capabilities (Item 17)a 198 198 Facilities with video conferencing available to prisoners as part of the
criminal-justice process (Item 18) 122 122 Facilities with video conferencing available to prisoners to communicate with
individuals outside of the criminal-justice process (Item 18) 15 16
Change in cost of phone calls that pertained to legal matters (Item 19)b $0 $0 Change in cost of prison visits that pertained to legal matters (Item 19)c $0 $0 Average vacancy rate for medical and health-care positions (Item 13) 15.3% 16.1%
Note: Includes publicly operated federal correctional facilities during the year. Excludes privately operated federal correctional facilities. aCount is of certified testing centers connected remotely to the National GED Testing Service, not of Federal Bureau of Prisons facilities. bPhone calls to federal prisoners pertaining to legal matters are initiated by their attorneys, and therefore do not impose a cost on the prisoners. cVisits to federal prisoners by their attorneys to discuss legal matters have no cost associated. Source: Bureau of Justice Statistics, National Prisoner Statistics, First Step Act Supplement, 2018 and 2019.
TABLE 4 Prohibited acts by federal prisoners that resulted in reductions in rewards, incentives, or time credits, by security level of facility, 2019
Severity of act
Security level of facility Total Low Moderate High Greatest Total prohibited acts 89,369 244 42,835 22,456 23,834
Administrative 9,801 51 5,030 2,869 1,851 Minimum 1,663 14 1,084 195 370 Low 14,880 64 7,664 2,501 4,651 Medium 40,779 90 20,532 8,905 11,252 High 22,246 25 8,525 7,986 5,710 Note: This table responds to P.L. 115-391 Section 610, Item 21. Includes prohibited acts by prisoners in the custody of publicly operated federal correctional facilities in 2019. Excludes acts by prisoners held in privately operated federal correctional facilities. See Terms and definitions. For 2018 counts, see Data Collected Under the First Step Act, 2019 (NO 254268, BJS, March 2020). Source: Bureau of Justice Statistics, National Prisoner Statistics, First Step Act Supplement, 2019.
Federal Prisoner Statistics Collected under the First Step Act, 2020 I February 2021 6•
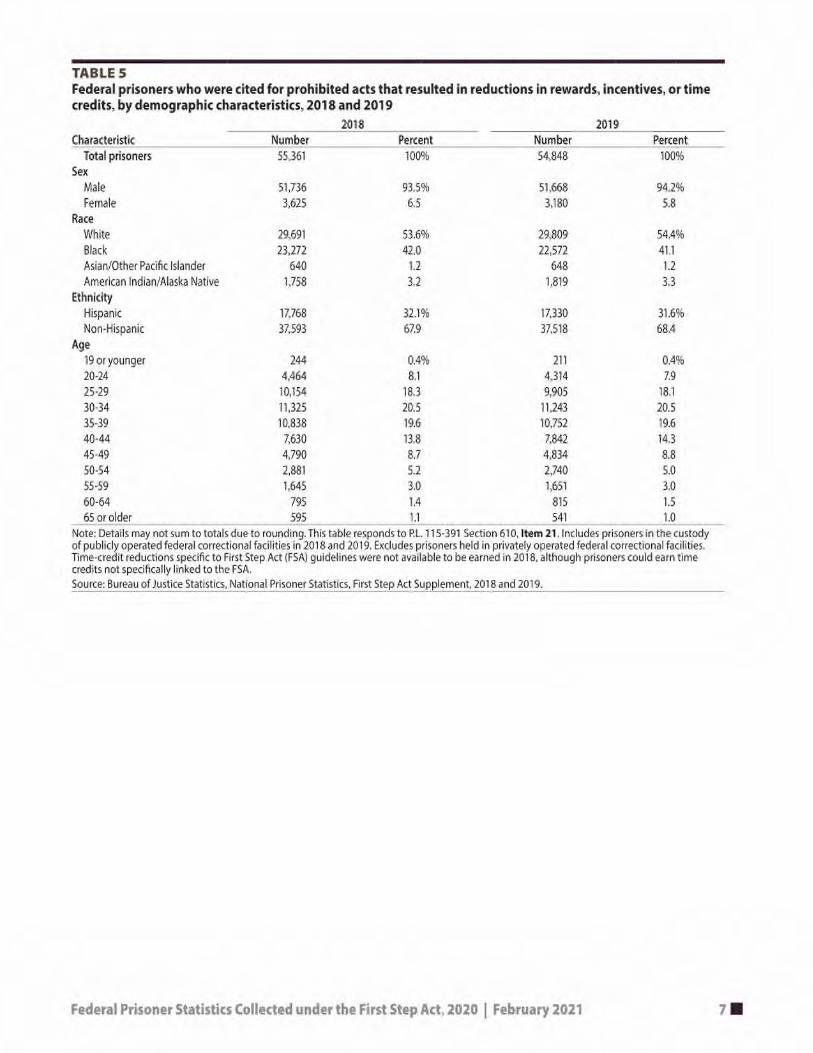
TABLE 5 Federal prisoners who were cited for prohibited acts that resulted in reductions in rewards, incentives, or time credits, by demographic characteristics, 2018 and 2019
2018 2019
Characteristic Number Percent Number Percent Total prisoners 55,361 100% 54,848 100%
Sex
Male 51,736 93.5% 51,668 94.2%
Female 3,625 6.5 3,180 5.8
Race
White 29,691 53.6% 29,809 54.4%
Black 23,272 42.0 22,572 41.1
Asian/Other Pacific Islander 640 1.2 648 1.2
American Indian/Alaska Native 1,758 3.2 1,819 3.3
Ethnicity
Hispanic 17,768 32.1% 17,330 31.6%
Non-Hispanic 37,593 67.9 37,518 68.4
Age
19 or younger 244 0.4% 211 0.4%
20-24 4,464 8.1 4,314 7.9
25-29 10,154 18.3 9,905 18.1
30-34 11,325 20.5 11,243 20.5
35-39 10,838 19.6 10,752 19.6
40-44 7,630 13.8 7,842 14.3
45-49 4,790 8.7 4,834 8.8
50-54 2,881 5.2 2,740 5.0
55-59 1,645 3.0 1,651 3.0
60-64 795 1.4 815 1.5
65 or older 595 1.1 541 1.0
Note: Details may not sum to totals due to rounding. This table responds to P.L. 115-391 Section 610, Item 21. Includes prisoners in the custody of publicly operated federal correctional facilities in 2018 and 2019. Excludes prisoners held in privately operated federal correctional facilities. Time-credit reductions specific to First Step Act (FSA) guidelines were not available to be earned in 2018, although prisoners could earn time credits not specifically linked to the FSA. Source: Bureau of Justice Statistics, National Prisoner Statistics, First Step Act Supplement, 2018 and 2019.
Federal Prisoner Statistics Collected under the First Step Act, 2020 I February 2021 7
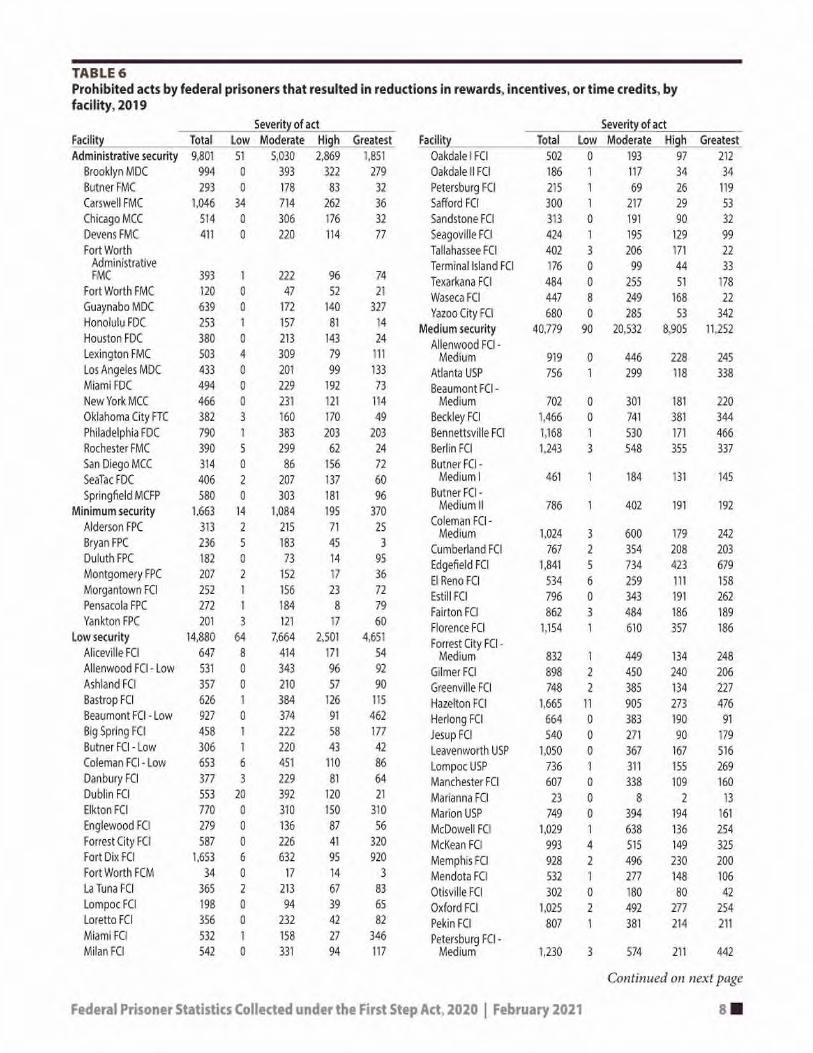
TABLE 6 Prohibited acts by federal prisoners that resulted in reductions in rewards, incentives, or time credits, by facility, 2019
Severity of act
Facility
Severity of act
Facility Total Low Moderate High Greatest Total Low Moderate High Greatest Administrative security 9,801 51 5,030 2,869 1,851 Oakdale' FCI 502 0 193 97 212
Brooklyn MDC 994 0 393 322 279 OakdalelIFC1 186 1 117 34 34
Butner FMC 293 0 178 83 32 Petersburg FCI 215 1 69 26 119
Carswell FMC 1,046 34 714 262 36 Safford FCI 300 1 217 29 53
Chicago MCC 514 0 306 176 32 Sandstone FCI 313 0 191 90 32
Devens FMC 411 0 220 114 77 Seagoville FCI 424 1 195 129 99
Fort Worth
Tallahassee FCI 402 3 206 171 22 Administrative
Terminal Island FCI 176 0 99 44 33 FMC 393 1 222 96 74
Texarkana FCI 484 0 255 51 178 Fort Worth FMC 120 0 47 52 21
Waseca FCI 447 8 249 168 22 Guaynabo MDC 639 0 172 140 327
Yazoo City FCI 680 0 285 53 342 Honolulu FDC 253 1 157 81 14 Medium security 40,779 90 20,532 8,905 11,252 Houston FDC 380 0 213 143 24
Allenwood FCI -
Lexington FMC 503 4 309 79 111 Medium 919 0 446 228 245 Los Angeles MDC 433 0 201 99 133 Atlanta USP 756 1 299 118 338 Miami FDC 494 0 229 192 73 Beaumont FC1-
New York MCC 466 0 231 121 114 Medium 702 0 301 181 220
Oklahoma City FTC 382 3 160 170 49 Beckley FCI 1,466 0 741 381 344
Philadelphia FDC 790 1 383 203 203 Bennettsville FCI 1,168 1 530 171 466
Rochester FMC 390 5 299 62 24 Berlin FC1 1,243 3 548 355 337
San Diego MCC 314 0 86 156 72 Butner FCI -
SeaTac FDC 406 2 207 137 60 Medium I 461 1 184 131 145
Springfield MCFP 580 0 303 181 96 Butner FCI -
Minimum security 1,663 14 1,084 195 370 Medium 11 786 1 402 191 192
Alderson FPC 313 2 215 71 25 Coleman FCI -
Medium 1,024 3 600 179 242 Bryan FPC 236 5 183 45 3
Cumberland FCI 767 2 354 208 203 Duluth FPC 182 0 73 14 95
Edgefield FCI 1,841 5 734 423 679 Montgomery FPC 207 2 152 17 36
El Reno FCI 534 6 259 111 158 Morgantown FCI 252 1 156 23 72
Estill FCI 796 0 343 191 262 Pensacola FPC 272 1 184 8 79
Fairton FCI 862 3 484 186 189 Yankton FPC 201 3 121 17 60
Florence FCI 1,154 1 610 357 186 Low security 14,880 64 7,664 2,501 4,651
Forrest City FCI -
Aliceville FCI 647 8 414 171 54 Medium 832 1 449 134 248 Allenwood FCI - Low 531 0 343 96 92 Gilmer FCI 898 2 450 240 206 Ashland FCI 357 0 210 57 90 Greenville FCI 748 2 385 134 227 Bastrop FCI 626 1 384 126 115 Hazelton FCI 1,665 11 905 273 476 Beaumont FCI - Low 927 0 374 91 462 Herlong FCI 664 0 383 190 91 Big Spring FCI 458 1 222 58 177 Jesup FCI 540 0 271 90 179 Butner FCI - Low 306 1 220 43 42 Leavenworth USP 1,050 0 367 167 516 Coleman FCI - Low 653 6 451 110 86 Lompoc USP 736 1 311 155 269 Danbury FCI 377 3 229 81 64 Manchester FCI 607 0 338 109 160 Dublin FCI 553 20 392 120 21 Marianna FCI 23 0 8 2 13 Elkton FCI 770 0 310 150 310 Marion USP 749 0 394 194 161 Englewood FCI 279 0 136 87 56 McDowell FCI 1,029 1 638 136 254 Forrest City FCI 587 0 226 41 320 McKean FCI 993 4 515 149 325 Fort Dix FCI 1,653 6 632 95 920 Memphis FCI 928 2 496 230 200 Fort Worth FCM 34 0 17 14 3 Mendota FCI 532 1 277 148 106 La Tuna FCI 365 2 213 67 83 Otisville FCI 302 0 180 80 42 Lompoc FCI 198 0 94 39 65 Oxford FC1 1,025 2 492 277 254 Loretto FCI 356 0 232 42 82 Pekin FCI 807 1 381 214 211 Miami FCI 532 1 158 27 346 Petersburg FCI -
Milan FCI 542 0 331 94 117 Medium 1,230 3 574 211 442
Continued on next page
Federal Prisoner Statistics Collected under the First Step Act, 2020 I February 2021 8 •

TABLE 6 (continued) Prohibited acts by federal prisoners that resulted in reductions in rewards, incentives, or time credits, by facility, 2019
Facility
Severity of act
Severity of act
Total Low Moderate High Greatest Facility Total Low Moderate High Greatest Phoenix FCI 532 10 278 166 78 Beaumont USP 1,229 0 365 537 327
Pollock FCI - Medium 1,167 4 627 246 290 Big Sandy USP 1,339 1 369 421 548
Ray Brook FCI 484 1 248 120 115 Canaan USP 1,316 1 373 516 426
Schuylkill FCI 960 1 473 148 338 Coleman I USP 1,032 0 399 375 258
Sheridan FCI 1,229 2 525 312 390 Coleman ll USP 1,333 0 620 328 385
Talladega FCI 730 2 379 91 258 Florence USP - ADX 279 0 82 54 143
Terre Haute FCI 588 0 289 175 124 Florence USP - High 1,122 1 473 460 188
Three Rivers FCI 972 3 549 255 165 Hazelton USP 1,306 0 565 273 468
Tucson FCI 118 0 58 41 19 Lee USP 1,766 1 901 402 462
Victorville FCI -
Lewisburg USP 1,050 0 351 532 167 Medium I 886 5 588 199 94 McCreary USP 1,482 2 573 442 465
Victorville FCI-
Pollock USP 1,272 8 564 387 313 Medium II 730 1 483 189 57
Terre Haute USP 985 0 417 315 253 Williamsburg FCI 1,220 2 688 221 309
Thomson
Yazoo City FCI -
Administrative USP 743 0 149 537 57 Medium 1,326 1 698 198 429
Tucson USP 1,297 3 508 597 189 High security 22,246 25 8,525 7,986 5,710
Victorville USP 1,402 0 503 600 299 Allenwood USP 1,228 6 419 458 345
Yazoo City USP 537 2 261 183 91 Atwater USP 1,528 0 633 569 326
Note: This table responds to P.L. 115-391 Section 610, Item 21. Includes prohibited acts by prisoners in the custody of publicly operated federal correctional facilities in 2019. Excludes acts by prisoners held in privately operated federal correctional facilities. See Terms and definitions. The facility abbreviations are: ADX—administrative maximum. FCC—federal correctional complex. FCI—federal correctional institution. FDC—federal detention center. FMC—federal medical center. FPC—federal prison camp. FTC—federal transfer center. MCC—metropolitan correctional center. MCFP—medical center for federal prisoners. MDC—metropolitan detention center. USP—United States penitentiary. Source: Bureau of Justice Statistics, National Prisoner Statistics, First Step Act Supplement, 2019.
TABLE 7 Prisoner assaults on Federal Bureau of Prisons staff, by type of assault and prosecution status, 2019
Assault on BOP staff Number Prosecuted Not prosecuted Physical 1,252 6 1,246
With serious injury 18 3 15
Without serious injury 1,234 3 1,231
Sexual 16 0 16
With threat/force 4 0 4
Without threat/force 12 0 12
Note: This table responds to P.L. 115-391 Section 610, Item 22. Includes assaults by prisoners in the custody of publicly operated federal correctional facilities in 2019. Excludes assaults by prisoners held in privately operated federal correctional facilities. Includes assaults for which there were guilty findings in the Federal Bureau of Prisons (BOP) administrative process. Excludes assaults pending the process. Source: Bureau of Justice Statistics, National Prisoner Statistics, First Step Act Supplement, 2019.
Federal Prisoner Statistics Collected under the First Step Act, 2020 I February 2021 9•

TABLES Volunteer levels in Federal Bureau of Prisons facilities, by facility, December 23, 2019
Facility Any level Level-la Level-U1' Facility Any level Level-la Level-Ilb Total volunteers 11,491 2,860 8,631 Guaynabo MDC 40 0 40
Alderson FCI 27 0 27 Hazelton FCI 142 42 100
Aliceville FCI 109 57 52 Hazelton USP 95 14 81
Allenwood FCI - Low 144 13 131 Herlong FCI 38 4 34
Allenwood FCI - Medium 78 32 46 Honolulu FDC 76 2 74
Allenwood USP - High 73 39 34 Houston FDC 11 0 11
Ashland FCI 88 0 88 Jesup FCI 106 17 89
Atlanta USP 83 6 77 La Tuna FCI 83 4 79
Atwater USP 114 46 68 Leavenworth FPC 22 7 15
Bastrop FCI 84 12 72 Lee USP 59 33 26
Beaumont FCC -
Lewisburg USP 91 22 69 Administrative 101 53 48 Lexington FCI 95 8 87
Beaumont FCI - Low 6 0 6 Lompoc FCI - Low 110 23 87 Beaumont FCI - Medium 84 38 46 Lompoc USP 90 1 89 Beaumont USP - High 18 3 15 Loretto FCI 87 8 79 Beckley FCI 1 0 1 Los Angeles MDC 75 10 65 Bennettsville FCI 99 22 77 Manchester FCI 108 15 93 Berlin FCI 82 3 79 Marianna FCI 72 24 48 Big Sandy USP 169 5 164 Marion USP 10 0 10 Big Spring FPC 229 131 98 McCreary USP 47 24 23 Brooklyn MDC 121 59 62 McDowell FCI 52 25 27 Bryan FPC 58 6 52 McKean FCI 36 0 36 Butner FCI - Low 137 5 132 Memphis FCI 74 28 46 Butner FCI - Medium I 140 5 135 Mendota FCI 118 60 58 Butner FCI - Medium II 143 5 138 Miami FDC 116 52 64 Butner FMC 178 3 175 Miami MCC 55 10 45 California City Correctional
Milan FCI 27 16 11 Center 50 6 44 Montgomery FPC 23 5 18
Canaan USP 102 35 67 Morgantown FCI 75 32 43 Carswell FMC 74 1 73
New York MCC 55 6 49 Coleman FCI - Low 94 10 84 Oakdale FCI 145 55 90 Coleman FCI - Medium 173 5 168
Oakdale FDC 93 49 44 Coleman II USP 72 2 70
Oklahoma City FTC 19 6 13 Coleman USP - High 196 48 148
Otisville FCI 308 107 201 Cumberland FCI 147 55 92 Oxford FCI 19 5 14 Danbury FCI 245 30 215 Pekin FCI 169 32 137 Devens FMC 87 10 77 Pensacola FPC 63 0 63 Dublin FCI 40 15 25 Petersburg FCI - Low 32 2 30 Duluth FPC 397 191 206
Petersburg FCI - Medium 65 0 65 Edgefield FCI 14 0 14 Philadelphia FDC 78 35 43 El Reno FCI 59 0 59 Phoenix FCI 141 24 117 Elkton FCI 79 2 77
Pollock FCI - Medium 68 9 59 Englewood FCI 55 14 41
Pollock USP 35 1 34 Estill FCI 40 13 27
Ray Brook FCI 52 15 37 Fairton FCI 125 84 41 Rochester FMC 204 45 159 Florence FCI - Medium 74 19 55
Safford FCI 73 48 25 Florence USP - ADX 19 1 18
San Diego MCC 23 7 16 Florence USP - High 27 5 22
Sandstone FCI 56 2 54 Forrest City FCI - Low 27 0 27 Schuylkill FCI 126 42 84 Forrest City FCI - Medium 53 0 53 Seagoville FCI 95 1 94 Fort Dix FCI 193 68 125 SeaTac FDC 122 32 90 Fort Worth FCM 129 22 107
Sheridan FCI 59 24 35 Gilmer FCI 52 19 33 Springfield MCFP 134 42 92 Greenville FCI 83 6 77 Talladega FCI 88 16 72
Federal Prisoner Statistics Collected under the First Step Act, 2020 I February 2021
Continued on next page
1 0 •

TABLE 8 (continued) Volunteer levels in Federal Bureau of Prisons facilities, by facility, December 23, 2019
Facility Ally level Level-la Level-U1' Facility Any level Level-la Level-Ilb Tallahassee Island FCI 153 51 102 Victorville FCI- Medical 164 52 112
Terminal Island FCI 266 100 166 Victorville FCI - Medium II 151 39 112
Terre Haute FCI 54 4 50 Victorville USP 348 131 217
Terre Haute FPC 90 22 68 Waseca FCI 60 3 57
Texarkana FCI 115 21 94 Williamsburg FCI 35 0 35
Thomson Administrative USP 83 14 69 Yankton FPC 100 25 75
Three Rivers FCI 43 7 36 Yazoo City FCI - Low 29 1 28
Tucson MCC 66 0 66 Yazoo City FCI - Medium 93 25 68
Tucson USP 44 20 24 Yazoo City USP 170 50 120 Note: This table responds to P.L. 115-391 Section 610, Item 24. Includes volunteers in publicly operated federal correctional facilities on December 23, 2019. Excludes volunteers in privately operated federal correctional facilities. The facility abbreviations are: ADX—administrative maximum. FCC—federal correctional complex. FCI—federal correctional institution. FDC—federal detention center. FMC—federal medical center. FPC—federal prison camp. FTC—federal transfer center. MCC—metropolitan correctional center. MCFP—medical center for federal prisoners. MDC—metropolitan detention center. USP—United States penitentiary. aVolunteers who are authorized to perform a service for 4 days or less per year in a Federal Bureau of Prisons (BOP) institution or administrative office. Level-I volunteers receive general training but not a badge for the facility where they volunteer. bVolunteers who are authorized to perform a service for 5 days or more per year in a BOP institution or administrative office. Level-II volunteers must attend volunteer or mentor training and receive a badge for the facility where they volunteer. Source: Bureau of Justice Statistics, National Prisoner Statistics, First Step Act Supplement, 2019.
Federal Prisoner Statistics Collected under the First Step Act, 2020 I February 2021 11 •

TABLE 9 Recidivism-reduction partnerships in Federal Bureau of Prisons facilities, by facility, 2019
Facility Community- Faith- Higher
Art based based education Visitation Vocational
Nonprofit Private volunteer training Workforce Total
development partnerships_
Total partnershipsa 8 187 1,019 96 150 144 98 27 103 1,832 Alderson FCI 0 0 7 0 0 0 0 1 0 8 Aliceville FCI 0 2 11 0 3 2 2 0 0 20 Allenwood FCI - Low 0 0 0 1 0 0 1 1 2 5 Allenwood Fa - Medium 0 0 0 0 1 0 1 0 0 2 Allenwood USP - High 0 0 0 1 1 1 1 0 1 5 Ashland FCI 0 1 6 0 0 0 1 1 0 9 Atlanta USP 0 0 9 2 0 0 0 0 0 11 Atwater USP 0 2 5 1 0 2 0 0 0 10 Bastrop FCI 0 1 10 0 1 0 0 0 1 13 Beaumont FCI - Low 0 1 6 1 6 5 0 0 0 19 Beaumont FCI - Medium 0 1 2 1 1 0 0 0 0 5 Beaumont USP - High 0 1 1 0 0 0 1 0 0 3 Beckley FCI 0 9 9 1 1 0 0 1 2 23 Bennettsville FCI 0 0 2 0 6 2 1 1 4 16 Berlin FCI 0 5 7 0 0 0 1 0 0 13 Big Sandy USP 0 0 6 1 0 0 1 0 0 8 Big Spring FPC 0 0 6 0 0 0 0 0 2 8 Brooklyn MDC 0 2 13 2 4 2 2 0 0 25 Bryan FPC 0 1 21 1 2 2 2 0 0 29 Butner FCI - Low 0 0 9 0 0 0 0 0 0 9 Butner FCI - Medium I 0 2 6 1 2 1 0 0 0 12 Butner FCI - Medium II 0 0 9 1 2 0 0 0 0 12 Butner FMC 0 0 8 0 2 1 1 0 0 12 California City Correctional Center 1 5 4 3 4 0 2 0 7 26 Canaan USP 0 0 3 0 0 0 1 0 3 7 Carswell FMC 0 1 17 0 2 3 2 0 0 25 Coleman FCI - Low 0 2 3 0 0 0 3 0 1 9 Coleman FCI - Medium 0 1 19 0 1 0 0 0 0 21 Coleman II USP 0 2 1 0 0 2 1 0 0 6 Coleman USP - High 0 2 1 0 0 1 1 0 0 5 Cumberland FCI 0 0 10 0 3 2 1 0 0 16 Danbury FCI 0 5 21 2 1 5 3 0 3 40 Devens FMS 0 0 11 0 2 1 1 0 0 15 Dublin FCI 2 1 23 1 0 0 2 0 5 34 Duluth FPC 0 1 6 1 0 1 0 1 0 10 Edgefield FCI 0 0 3 2 8 2 1 0 1 17 El Reno FCI 0 1 13 0 5 1 0 0 0 20 Elkton FCI 0 1 9 0 0 0 1 0 0 11 Englewood FCI 0 2 12 0 0 0 1 0 0 15 Estill FCI 0 0 5 0 0 0 1 0 0 6 Fairton FCI 0 1 11 2 1 0 1 0 1 17 Florence FCI-Medium 1 11 4 0 1 0 0 1 0 18 Florence USP - ADX 1 1 1 0 1 0 1 0 0 5 Florence USP - High 1 2 4 0 1 0 1 0 0 9 Forrest City FCI - Low 0 0 3 0 2 1 0 0 2 8 Forrest City FCI - Medium 0 0 3 0 0 0 0 0 5 8 Fort Dix FCI 0 2 8 2 0 0 1 0 0 13 Fort Worth FCI 0 2 22 0 1 0 0 0 1 26 Gilmer FCI 0 0 5 1 0 0 2 0 7 15 Greenville FCI 0 0 9 2 0 0 1 0 0 12 Guaynabo MDC 0 0 3 0 0 0 0 0 0 3
Continued on next page
Federal Prisoner Statistics Collected under the First Step Act, 2020 I February 2021 12•

TABLE 9 (continued) Recidivism-reduction partnerships in Federal Bureau of Prisons facilities, by facility, 2019
Facility Community- Faith- Higher Visitation Vocational Workforce Total
Art based based education Nonprofit Private volunteer training development partnersh
HazeIton FCI 0 2 11 4 6 1 2 0 0 26 HazeIton USP 0 0 5 6 4 3 1 0 0 19 Herlong FCI 0 3 3 1 0 0 0 0 2 9 Honolulu FDC 0 2 10 0 0 3 0 0 0 15 Houston FDC 0 0 2 0 0 0 0 0 1 3 Jesup FCI 0 0 8 2 1 3 0 0 1 15 La Tuna FCI 0 3 10 0 0 1 1 0 0 15
Leavenworth FPC 0 1 16 0 2 0 1 0 0 20 Lee USP 0 2 9 0 0 0 1 0 0 12 Lewisburg USP 0 0 4 0 2 4 1 0 1 12
Lexington FCI 0 1 17 0 6 7 2 2 0 35 Lompoc FC1- Low 0 8 7 1 1 2 2 0 1 22 Lompoc USP 0 6 9 1 1 3 2 10 2 34
Loretto FCI 0 0 17 2 0 4 0 1 4 28 Los Angeles MDC 0 1 11 0 1 0 1 0 0 14
Manchester FCI 0 0 8 0 0 0 0 0 2 10 Marianna FCI 0 1 0 0 0 0 0 0 1 2 Marion USP 0 3 19 2 0 0 1 0 2 27
McCreary USP 0 5 7 1 0 0 1 0 0 14
McDowell FCI 0 0 2 0 0 0 0 0 0 2 McKean FC1 0 1 7 1 3 1 0 0 0 13 Memphis FCI 0 0 13 0 0 0 1 0 0 14 Mendota FCI 0 1 10 2 3 1 0 2 5 24
Miami FDC 0 0 8 0 0 0 1 0 0 9 Miami MCC 0 5 9 0 0 1 2 0 0 17 Milan FCI 0 0 10 1 3 0 0 0 1 15 Montgomery FPC 0 2 8 1 0 1 0 0 1 13 Morgantown FCI 0 0 18 0 0 4 2 0 4 28 New York MCC 0 11 3 2 2 0 1 0 2 21
Oakdale FCI 0 0 9 1 4 4 2 0 0 20 Oakdale FDC 0 0 6 1 3 4 0 0 0 14
Oklahoma City FTC 0 0 8 1 0 1 0 0 0 10 Otisville FCI 0 11 23 2 0 4 2 0 0 42 Oxford FCI 0 0 2 0 1 0 2 0 0 5 Pekin FCI 0 0 15 1 3 0 1 1 0 21 Pensacola FPC 0 0 9 0 0 1 0 0 2 12 Petersburg FCI-Low 0 1 14 0 0 0 0 0 0 15
Petersburg FCI - Medium 0 3 7 0 0 0 0 0 0 10 Philadelphia FDC 0 0 9 3 3 3 2 0 2 22
Phoenix FCI 0 3 6 3 1 0 0 0 0 13 Pollock FCI - Medium 0 0 8 7 1 3 0 0 1 20 Pollock USP 0 0 10 2 1 2 0 0 1 16 Ray Brook FCI 1 0 2 1 0 1 1 1 0 7 Rochester FMC 0 0 15 0 5 2 2 0 0 24 Safford FCI 0 1 8 0 1 1 1 0 3 15
San Diego MCC 0 1 2 0 2 0 0 0 0 5 Sandstone FCI 0 3 11 0 3 3 1 0 1 22
Schuylkill FCI 0 0 4 0 1 2 1 0 1 9 Seagoville FCI 0 0 19 2 0 0 1 0 0 22 SeaTac FDC 0 0 2 0 0 3 1 0 0 6 Sheridan FCI 0 0 7 0 0 19 0 0 2 28 Springfield MCFP 0 3 8 0 0 0 1 1 0 13
Continued on next page
Federal Prisoner Statistics Collected under the First Step Act, 2020 I February 2021 13•
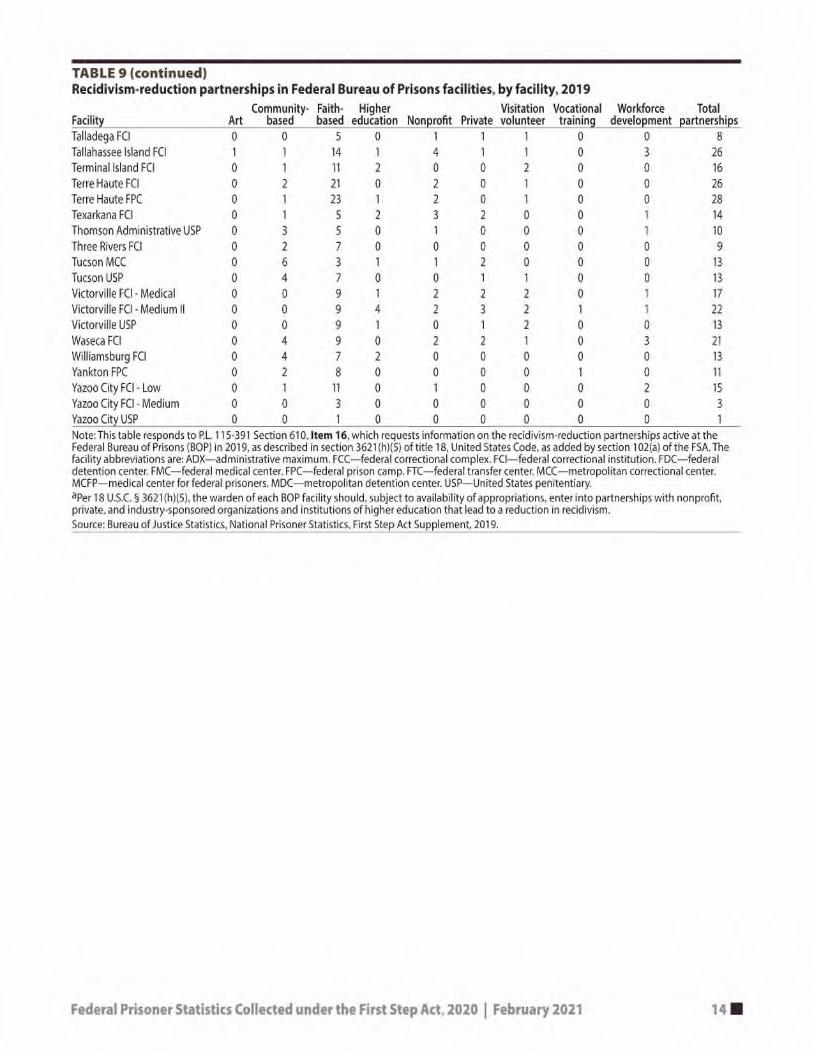
TABLE 9 (continued) Recidivism-reduction partnerships in Federal Bureau of Prisons facilities, by facility, 2019
Facility Community- Faith- Higher Visitation Vocational Workforce Total
Art based based education Nonprofit Private volunteer training development partnerships Talladega FCI 0 0 5 0 1 1 1 0 0 8 Tallahassee Island FCI 1 1 14 1 4 1 1 0 3 26 Terminal Island FCI 0 1 11 2 0 0 2 0 0 16 Terre Haute FCI 0 2 21 0 2 0 1 0 0 26 Terre Haute FPC 0 1 23 1 2 0 1 0 0 28
Texarkana FCI 0 1 5 2 3 2 0 0 1 14 Thomson Administrative USP 0 3 5 0 1 0 0 0 1 10
Three Rivers FCI 0 2 7 0 0 0 0 0 0 9 Tucson MCC 0 6 3 1 1 2 0 0 0 13 Tucson USP 0 4 7 0 0 1 1 0 0 13 Victorville FCI - Medical 0 0 9 1 2 2 2 0 1 17
Victorville FCI - Medium II 0 0 9 4 2 3 2 1 1 22 Victorville USP 0 0 9 1 0 1 2 0 0 13
Waseca FCI 0 4 9 0 2 2 1 0 3 21 Williamsburg FCI 0 4 7 2 0 0 0 0 0 13 Yankton FPC 0 2 8 0 0 0 0 1 0 11 Yazoo City FCI - Low 0 1 11 0 1 0 0 0 2 15
Yazoo City FCI - Medium 0 0 3 0 0 0 0 0 0 3
Yazoo City USP 0 0 1 0 0 0 0 0 0 1 Note: This table responds to P.L. 115-391 Section 610, Item 16, which requests information on the recidivism-reduction partnerships active at the Federal Bureau of Prisons (BOP) in 2019, as described in section 3621(h)(5) of title 18, United States Code, as added by section 102(a) of the FSA. The facility abbreviations are: ADX—administrative maximum. FCC—federal correctional complex. FCI—federal correctional institution. FDC—federal detention center. FMC—federal medical center. FPC—federal prison camp. FTC—federal transfer center. MCC—metropolitan correctional center. MCFP—medical center for federal prisoners. MDC—metropolitan detention center. USP—United States penitentiary.
aPer 18 U.S.C. § 3621(h)(5), the warden of each BOP facility should, subject to availability of appropriations, enter into partnerships with nonprofit, private, and industry-sponsored organizations and institutions of higher education that lead to a reduction in recidivism.
Source: Bureau of Justice Statistics, National Prisoner Statistics, First Step Act Supplement, 2019.
Federal Prisoner Statistics Collected under the First Step Act, 2020 I February 2021 14•

Methodology
Data collection and reporting
The Office of Research and Evaluation in the Federal Bureau of Prisons (BOP) compiled data for calendar year (CY) 2019 and provided them to the Bureau of Justice Statistics (BJS) in 2020. Under the First Step Act of 2018 (FSA; PL 115-391), the BOP was required to develop, test, and implement a risk and needs assessment tool specific to the federal prison population. The BOP also worked to approve evidence-based recidivism reduction programs (EBRRs) and productive activities (PAs) that would meet prisoners' needs as identified by the new federal risk and needs assessment tool. This work was undertaken during CY 2019 to meet the January 2020 statutory deadline. Since the approved list of EBRRs and PAs was not announced until January 2020, data for items 23, 25, and 26 in the FSA under Title VI, Section 610 were not collected by the BOP during CY 2019 and were not reported to BJS. Data on these items will be available for CY 2020.
BJS supplemented BOP data with data collected in BJS's 2016 Survey of Prison Inmates and BJS's National Prisoner Statistics program's Summary of Sentenced Population Movement (NPS-1B). Unless otherwise noted, all counts in this report include federal prisoners held in correctional facilities that were operated by the BOP or were held in privately operated facilities under a BOP contract.
Terms and definitions
Administrative maximum (ADX)—a type of segregated housing unit designed for occupancy by a single person. The BOP operates one facility with ADX units: the United States Penitentiary-Administrative Maximum in Florence, Colorado, which houses the most disruptive and escape-prone prisoners in BOP custody.
Challenge Program (CH)—a BOP drug-treatment program that is designed for high-security prisoners. It includes violence-prevention components and a protocol to allow prisoners with severe mental illness to develop everyday life-skills, such as medication management. CH does not include an early release incentive; however, a prisoner who successfully completes the program could earn a decrease in his or her security level and a transfer to a medium-security facility, where the prisoner can be admitted to the BOP's Residential Drug Abuse Program.
Level-I volunteers—volunteers authorized to perform a service for 4 days or less per year in a BOP institution or administrative office. Level-I volunteers receive general training but not a badge for the facility where they volunteer.
Level-II volunteers—volunteers authorized to perform a service for 5 days or more per year in a BOP institution or administrative office. Level-II volunteers must attend volunteer or mentor training and receive a badge for the facility where they volunteer.
Medication-assisted treatment (MAT)—treatment of substance-use disorders by a licensed physician who administers or prescribes medication that is approved by the U.S. Food and Drug Administration (FDA), in combination with counseling and behavioral therapies. The three medications approved by the FDA and recognized by the BOP are methadone, buprenorphine, and naltrexone.
Non-Residential Drug Abuse Program (DAP)—a BOP drug-treatment program available to all federal prisoners at every public and private correctional institution. While DAP does not include an early release incentive, facility wardens are encouraged to allow prisoners who satisfactorily complete the program to be placed in residential reentry centers for the maximum time allowable. In 2019, more than half of the prisoners who participated in DAP were within 2 years of their release date (58%).
Prohibited acts—Actions taken by prisoners held in a BOP-operated or privately operated correctional facility that were against facility rules.
• Low severity-level—acts by prisoners in custody that will result in low-level sanctions. Such acts include-
0 malingering
0 feigning illness
0 abusive or obscene language
0 conduct with a visitor in violation of BOP regulations
0 unauthorized physical contact
0 interference with a staff member's performance of duties or engaging in conduct that disrupts the security and orderly running of the facility, if these actions are most like one of the other prohibited acts at the low severity-level.
Federal Prisoner Statistics Collected under the First Step Act, 2020 I February 2021 15

• Moderate severity-level—acts by prisoners in custody that will result in moderately serious sanctions. Such acts include-
0 indecent exposure
0 misuse of authorized medication
0 possession of money in excess of an authorized amount
0 loan of property for profit
0 possession of anything not authorized for prisoners
0 refusal to work or accept a program assignment
0 refusal to obey an order from a staff member
0 violation of conditions of furlough or a community program
0 unexcused absence from work or a program
0 failure to perform work as directed
0 insolence toward, lying to, or making a false statement to a staff member
0 counterfeit, forgery, or reproduction of any document, article of identification, money, or official paper
0 participation in an unauthorized meeting or gathering
0 presence in an unauthorized area
0 failure to follow safety or sanitation regulations
0 use of equipment or machinery without staff authorization or contrary to instructions and safety standards
0 failure to stand count
0 interference with the taking of count
0 gambling
0 preparing or conducting a gambling pool
0 possession of gambling paraphernalia
0 unauthorized contact with the public
0 exchange of money or anything of value with another prisoner or other person without staff authorization
0 destruction, damage, or alteration of governmental or other property valued at $100 or less
0 failure to keep one's person or quarters in accordance with sanitary standards
0 possession, manufacture, or loss of a non-hazardous tool, equipment, or contraband
0 smoking where prohibited
0 fraudulent or deceptive completion of a skills test
0 conducting a business
0 communication of gang affiliation, participation in gang activities, or possession of gang paraphernalia
0 circulation of a petition
0 use of mail or a telephone for abuses that do not circumvent monitoring of these communications by staff
0 interference with a staff member's performance of duties or engaging in conduct that disrupts the security and orderly running of the facility, if these actions are most like one of the other prohibited acts at the moderate severity-level.
• High severity-level—acts by prisoners in custody that will result in serious sanctions. Such acts include-
0 escape from non-secure confinement with subsequent voluntary return to BOP custody within 4 hours
0 fighting
0 threat of bodily harm
0 extortion, blackmail, protection, or demand or receipt of money in return for protection
0 engaging in sexual acts
0 making sexual proposals or threats
0 wearing a disguise or mask
0 possession of an unauthorized locking device or lock pick
0 destruction, damage, or alteration of a locking mechanism
Federal Prisoner Statistics Collected under the First Step Act, 2020 I February 2021 16
0 adulteration of food or drink
0 possession of staff clothing
0 engaging in or encouraging a group demonstration or work stoppage
0 offer or provision of a bribe to staff
0 exchange of money for contraband or some illegal purpose
0 destruction, damage, or alteration of governmental property
0 theft
0 practice or demonstration of martial arts, boxing, wrestling, or drilling, unless authorized by staff
0 presence in an unauthorized area with a person of the opposite sex without staff permission
0 assault or attempted assault of anyone resulting in less-serious injury
0 stalking
0 possession of stolen property
0 refusal to participate in a required physical examination not related to drug-abuse testing
0 tattooing or self-mutilation
0 sexual assault involving non-consensual touching without force or threat of force
0 use of mail or a telephone for abuses that circumvent monitoring of these communications by staff
0 interference with a staff member's performance of duties or engaging in conduct that disrupts the security and orderly running of the facility, if these actions are most like one of the other prohibited acts at the high severity-level.
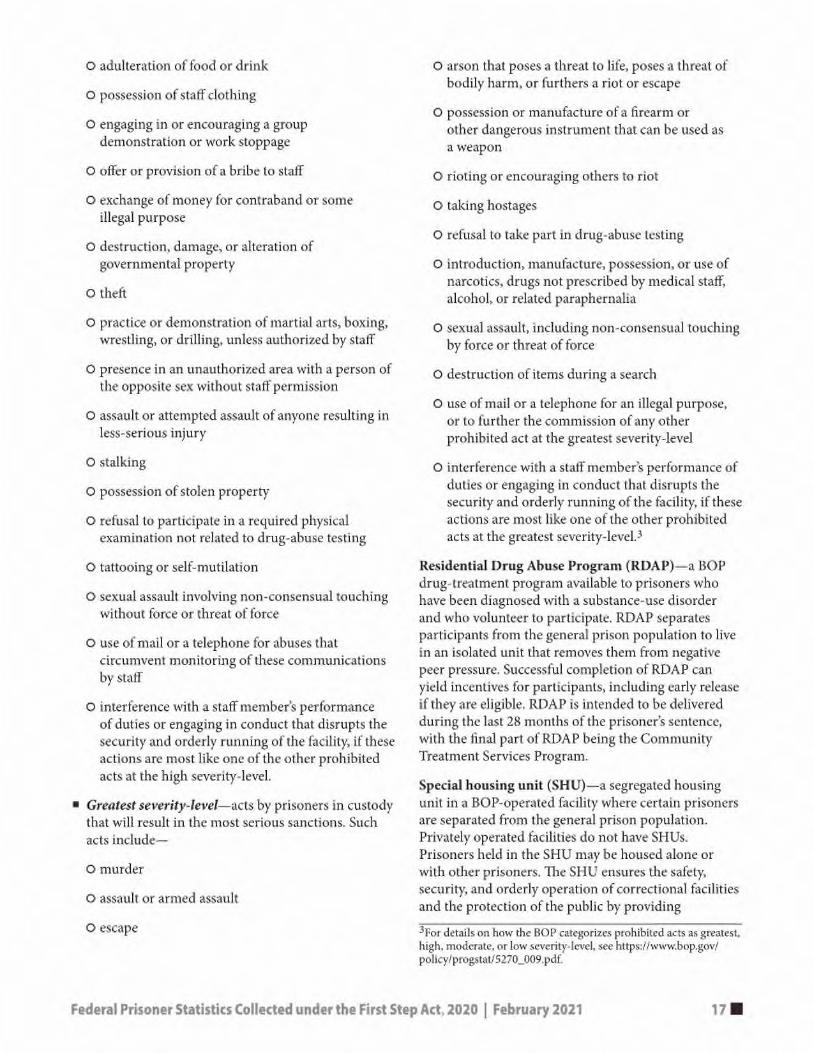
• Greatest severity-level—acts by prisoners in custody that will result in the most serious sanctions. Such acts include-
0 murder
0 assault or armed assault
0 escape
0 arson that poses a threat to life, poses a threat of bodily harm, or furthers a riot or escape
0 possession or manufacture of a firearm or other dangerous instrument that can be used as a weapon
O rioting or encouraging others to riot
O taking hostages
O refusal to take part in drug-abuse testing
O introduction, manufacture, possession, or use of narcotics, drugs not prescribed by medical staff, alcohol, or related paraphernalia
O sexual assault, including non-consensual touching by force or threat of force
0 destruction of items during a search
0 use of mail or a telephone for an illegal purpose, or to further the commission of any other prohibited act at the greatest severity-level
0 interference with a staff member's performance of duties or engaging in conduct that disrupts the security and orderly running of the facility, if these actions are most like one of the other prohibited acts at the greatest severity-leve1.3
Residential Drug Abuse Program (RDAP)—a BOP drug-treatment program available to prisoners who have been diagnosed with a substance-use disorder and who volunteer to participate. RDAP separates participants from the general prison population to live in an isolated unit that removes them from negative peer pressure. Successful completion of RDAP can yield incentives for participants, including early release if they are eligible. RDAP is intended to be delivered during the last 28 months of the prisoner's sentence, with the final part of RDAP being the Community Treatment Services Program.
Special housing unit (SHU)—a segregated housing unit in a BOP-operated facility where certain prisoners are separated from the general prison population. Privately operated facilities do not have SHUs. Prisoners held in the SHU may be housed alone or with other prisoners. The SHU ensures the safety, security, and orderly operation of correctional facilities and the protection of the public by providing
3For details on how the BOP categorizes prohibited acts as greatest, high, moderate, or low severity-level, see https://www.bop.gov/ policy/progstat/5270_009.pdf.
Federal Prisoner Statistics Collected under the First Step Act, 2020 I February 2021 17•

alternative housing assignments for prisoners removed from the general prison population.4
Special management unit (SMU)—a segregated housing unit in a BOP-operated facility that holds any sentenced prisoner whose interaction requires greater management to ensure the safety, security, or orderly operation of BOP facilities or the protection of the public. Each SMU has three program levels that differ by the conditions of confinement and the expected time-frame to complete the program. Typically,
4For more information on SHUs, see Program Statement 5720.11, Special Housing Units at https://www.bop.gov/policy/ progstat/5270.11.pdf.
prisoners complete the entire SMU program in about 12 months, after which they are placed in the general prison population at another facility.
• SMU level 1—prisoners have limited interaction and are normally restricted to their assigned cells.
• SMU level 2—prisoners have greater interaction than in level 1. Prisoners are normally restricted to their assigned cells but participate in more out-of-cell activities and programming on a case-by-case basis.
• SMU level 3—prisoners interact in a supervised, open setting.
Federal Prisoner Statistics Collected under the First Step Act, 2020 I February 2021 18•
The Bureau of Justice Statistics of the U.S. Department of Justice is the principal federal agency responsible for measuring crime, criminal victimization, criminal offenders, victims of crime, correlates of crime, and the operation of criminal and civil justice systems at the federal, state, tribal, and local levels. BJS collects, analyzes, and disseminates reliable statistics on crime and justice systems in the United States, supports improvements to state and local criminal justice information systems, and participates with national and international organizations to develop and recommend national standards for justice statistics. Doris J. James is the acting director.
This report was written by E. Ann Carson. Stephanie Mueller and Tracy Snell verified the report.
Eric Hendrixson and Edrienne Su edited the report. Carrie Epps-Carey produced the report.
February 2021, NCJ 255111
BIS
11
11
Office of Justice Programs
Building Solutions • Supporting Communities • Advancing Justice
www.ojp.gov
Related Documents